Biomass Thermochemical Conversion via Pyrolysis with Integrated CO2 Capture
by
 , ,
, ,
Małgorzata Sieradzka
1,* ,
,
Ningbo Gao
2,*,
Cui Quan
2,
Agata Mlonka-Mędrala
1 and
Aneta Magdziarz
1 1
AGH University of Science and Technology, Mickiewicza 30 Av., 30-059 Krakow, Poland
2
School of Energy and Power Engineering, Xi’an Jiaotong University, Xi’an 710049, China
*
Authors to whom correspondence should be addressed.
Energies 2020, 13(5), 1050; https://0-doi-org.brum.beds.ac.uk/10.3390/en13051050
Submission received: 30 January 2020
/
Revised: 18 February 2020
/
Accepted: 25 February 2020
/
Published: 26 February 2020
(This article belongs to the Special Issue Selected Papers from ISCP 2019—XXIV International Symposium on Combustion Processes)
Abstract
:The presented work is focused on biomass thermochemical conversion with integrated CO2 capture. The main aim of this study was the in-depth investigation of the impact of pyrolysis temperature (500, 600 and 700 °C) and CaO sorbent addition on the chemical and physical properties of obtained char and syngas. Under the effect of the pyrolysis temperature, the properties of biomass chars were gradually changed, and this was confirmed by examination using thermal analysis, scanning electron microscopy, X-ray diffraction, and porosimetry methods. The chars were characterised by a noticeable carbon content (two times at 700 °C) resulting in a lower O/C ratio. The calculated combustion indexes indicated the better combustible properties of chars. In addition, structural morphology changes were observed. However, the increasing pyrolysis temperature resulted in changes of solid products; the differences of char properties were not significant in the range of 500 to 700 °C. Syngas was analysed using a gas chromatograph. The following main components were identified: CO, CO2, CH4, H2 and C2H4, C2H6, C3H6, C3H8. A significant impact of CaO on CO2 adsorption was found. The concentration of CO2 in syngas decreased with increased temperature, and the highest decrease occurred in the presence of CaO from above 60% to below 30% at 600 °C.
Keywords:
pyrolysis; biomass; pine wood; CO2 capture; CaO solid sorbent; chars; syngas; hydrogen; physicochemical structure1. Introduction
Rapid climate change is leading to an increase of average temperature by 2 °C above pre-industrialized levels. Because of this, significant steps should be taken to reverse this trend [1]. Developed countries within the European Union are committed to reducing the emission of greenhouse gas (GHG) by 80%–95% compared to levels from 1990. This goal needs to be achieved by 2050 [2]. In 2018, greenhouse gas emissions increased globally by 1.8% compared to 2017, in which GHG emissions amounted to 60%. The main factors of this change are the increasing gross domestic product (GDP) in G20 countries, CO2 emissions related to energy and the total primary energy supply [3]. This brings us to the Paris Agreement, which states that the main aim of all G20 countries is to limit the average temperature increase to 1.5 °C. These obligations require firm steps to provide necessary changes in energy management [4].
Currently, global energy consumption is focused on a fast and cheap energy supply, which is mainly covered by fossil fuels [5]. Therefore, the development of Renewable Energy Sources (RES) needs to be focused on finding an energy carrier which will be a substitute for the most desirable properties of fossil fuels. The answer to cover this requirement is the thermochemical conversion of biomass. Here, six technologies which are possibly suitable can be determined depending on their expected final products: pyrolysis, gasification, co-firing, liquefaction, carbonization and combustion [6,7].
In analysing the thermal conversion of biomass, the biomass itself should be defined. According to Dyton and Foust, the definition depends on the final usage of biomass [8]. This can be limited to not only the organic material formed during the photosynthesis process but also by other sources, such as solid municipal wastes [9,10,11,12]. The following are categories of biomass: wood and wood wastes, energy crop plants, organic parts contained in municipal solid waste and industrial waste, sewage sludge, plant by-products of food production and manure [13]. It is important to emphasize that all types of biomass in a raw material form are characterized by high moisture content, hygroscopicity and heterogeneity and a low carbon/oxygen (C/O) ratio, bulk density and calorific value [14,15,16]. Another definition of biomass states that it is an energy source which originates from organic material such as wood, plants, agricultural products and organic wastes as well as their products, by-products and residues [17].
According to data published by the Publications Office of the European Union in 2019, biomass is the main renewable energy source in the EU. The share of biomass in all renewable energy sources is almost 60%, and cooling and heating sectors consume 75% of all bioenergy. The main bioenergy consumers within the EU are Germany, France, Italy, Sweden and the UK [18]. This energy source allows zero or even negative CO2 emissions to be achieved, as well as increasing the share of renewable energy source consumption. However, it needs to be remembered that the energy density of biomass is low, while its moisture content is high in comparison to fossil fuels. Because of this, biomass requires additional treatment to improve its energy properties [17].
To achieve the goal of decreasing or even obtaining negative CO2 emissions and producing clean energy, a proper model of biomass conversion needs to be developed. Because of the ultimate properties of biomass (low energy density and high moisture content), it is better to provide the thermochemical conversion of this material using processes such as pyrolysis or gasification than combustion. Pyrolysis occurs under a temperature range from 300 to 700 °C in the presence of a proper agent which does not contain oxygen, such as nitrogen [19]. Useful products such as syngas, bio-oil and biochar are obtained during biomass decomposition. This process is very complex and includes many simultaneous reactions (e.g., dehydration or carbonization) [20,21]. Additionally, researchers are working on novel pyrolysis processes such as solar pyrolysis, which uses solar energy to heat the reactor [22,23,24].
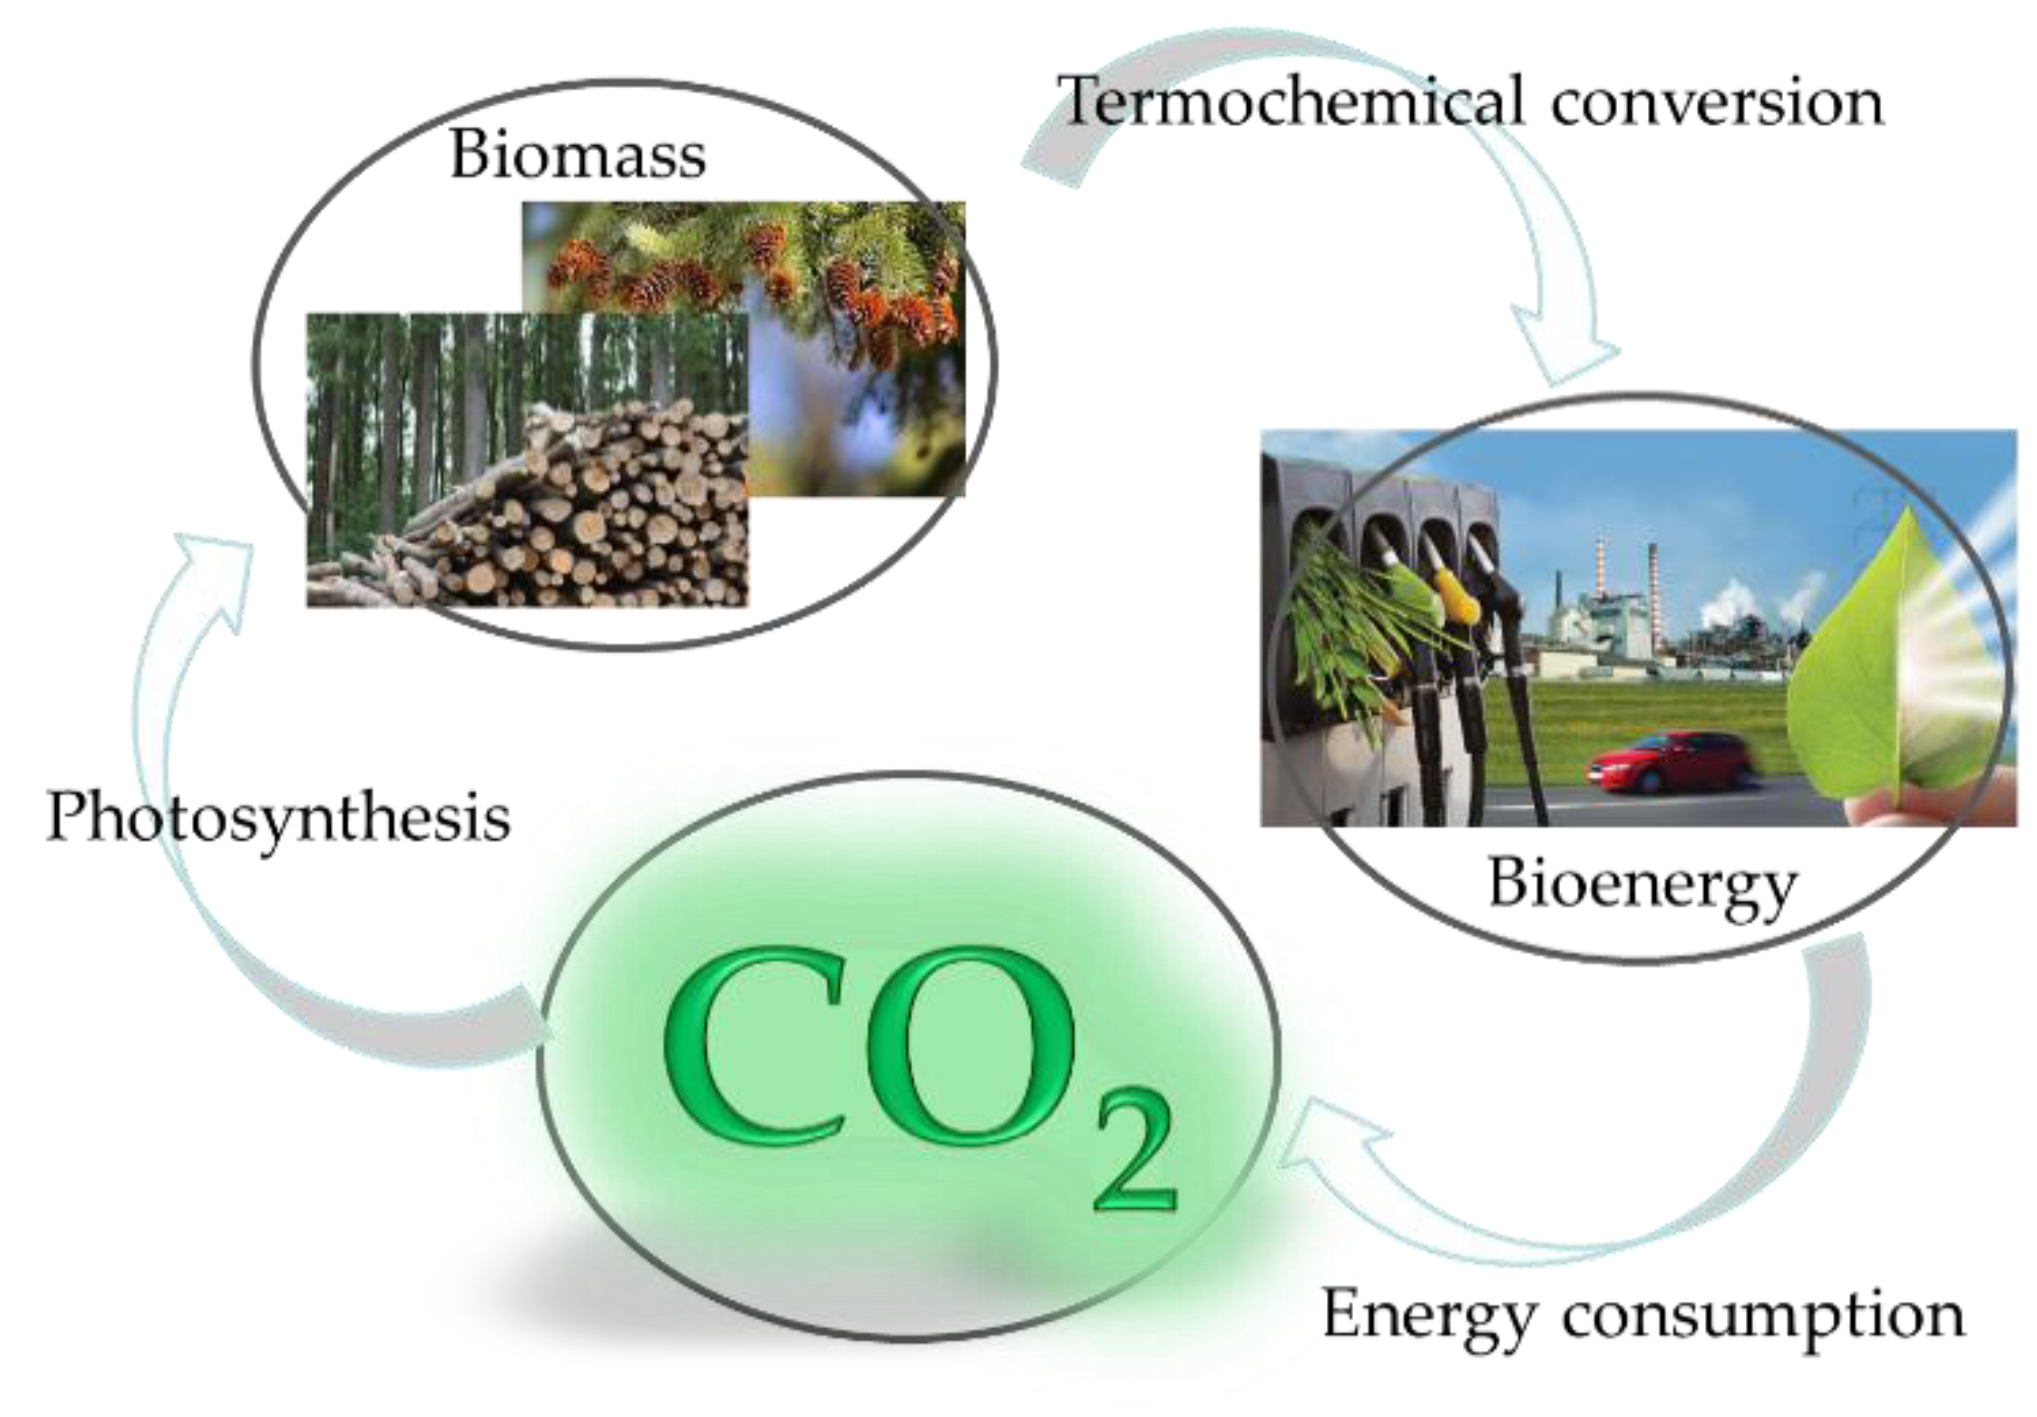
The biomass life cycle can be presented as a closed cycle (Figure 1). Once it is converted into bioenergy by thermochemical conversion technologies, it becomes a useful and easy-to-manage energy source. During energy consumption, carbon dioxide is released, which is one of the components of the photosynthesis process; the growth of new biomass closes the cycle.
During the pyrolysis process, three valuable products are produced: gas (syngas), liquid (tar) and solid (char, also called biochar). All of these products contain chemical energy. Moreover, pyrolysis is a safe and suitable process for the conversion of contaminated and toxic biomass due to its high process temperature as well as its isolated reaction process zone [25].
The main aim of this study was to investigate a novel approach of syngas production promoting negative carbon emission with simultaneous high-quality biochar production. A wood biomass, represented by a pine sawdust sample (PSD), was processed via the pyrolysis process. The influences of the process temperature and addition of CaO on the chemical and physical properties of solid (char) and gaseous (syngas) phases were studied with a special focus on CO2 capture in order to obtain negative carbon emission. A detailed analysis of the biochars was conducted. Next, the gaseous products were examined taking into account the influence of CaO.
2. Materials and Methods
2.1. Material Characteristic
In this study, a wood biomass sample—pine wood in the form of sawdust—was investigated. The biomass originated from Xianyang, Shaanxi, China. The raw material was milled and next processed with 60–100 mesh filters. The proximate and ultimate analyses of raw material are presented in Table 1. Ultimate analysis was provided according to the following European Standards: moisture content (M): PN-EN ISO 18134-1:2015-11, ash content (A): PN-EN ISO 18122:2016-01, and volatile matter (VM): PN-EN ISO 18123:2016-01. The studied material was characterized by a high volatile matter content (82%) and low ash content (1.3%), which are characteristic for biomass [26]. The moisture content was in line with typical biomass levels, which varied between 1.25% and around 12% [27,28]. The ultimate analysis was conducted using LECO (CHN628). The analysed sample was combusted in pure oxygen at 950 °C in the furnace. The carbon, hydrogen and nitrogen content tests were carried out in accordance with the standards described in the PN-EN 15407:2011. The obtained results showed that, in comparison to other studies, the chosen sample consisted of a typical share of chemical elements for wood biomass. The average concentration of chemical elements based on the literature review was as follows: C (48.9%), H (5.9%), O (44.1%) and N (0.14%) [29]. The chemical constituents of biomass directly influence its thermochemical qualities and accordingly the efficiency of energy conversion [30].
2.2. Experimental Procedure and Methods
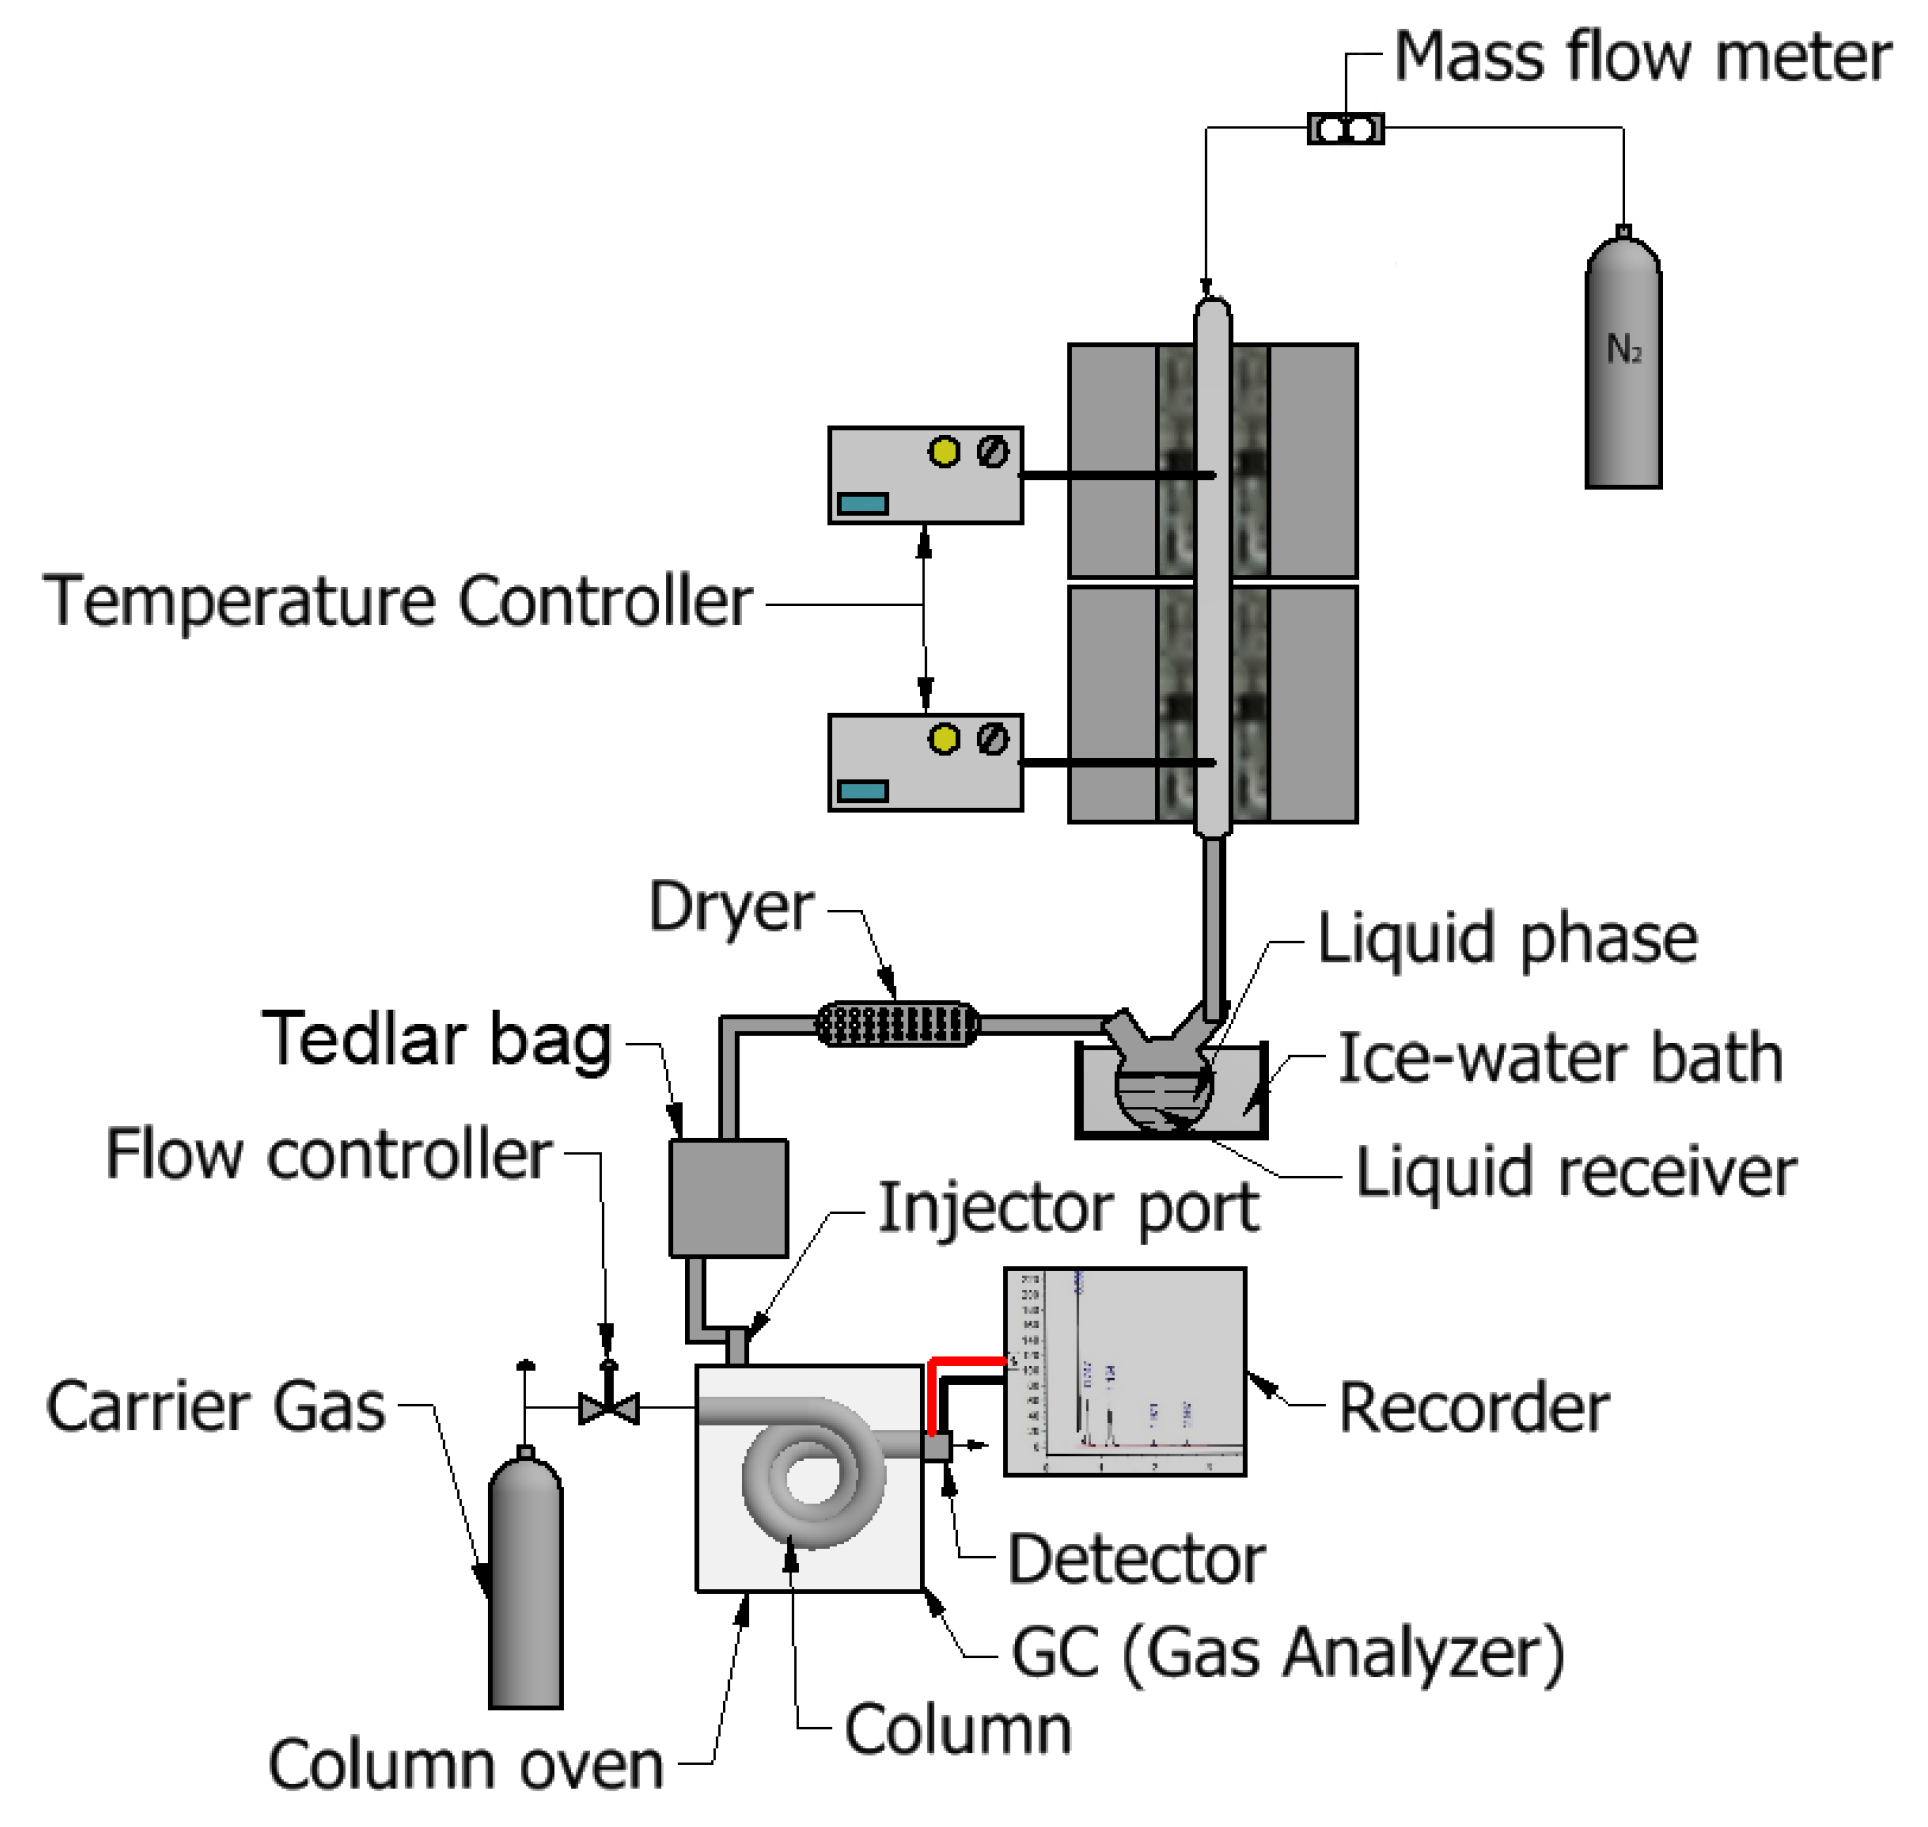
The pyrolysis experiment was conducted in a fixed bed vertical reactor. Figure 2 presents a scheme of the test rig used in this study. The experimental reactor consisted of a quartz tube reactor which was electrically and isothermally heated by a tubular electric furnace. The reactor was externally heated by a 1 kW electric furnace, and the furnace dimensions were as follows: 30 mm inner diameter and 250 mm height. The apparatus was equipped a temperature and gas control systems. The reactor was connected to a nitrogen gas bottle and oil collector via pipelines. A flow meter in the pyrolysis processes was used to control the nitrogen flow. Pyrolysis gas was condensed in an ice bath and dried using a drying tube; next, it was collected in a Tedlar gas bag. The obtained pyrolysis gas (syngas) was analysed using a gas analyzer (GC 7900, Techcomp).
The pyrolysis process of pine sawdust was carried out under an inert atmosphere and temperatures of 500, 600 and 700 °C. The nitrogen flow rate was set to 60 mL/min, and the sample mass was 3 g. The weighted sample was placed inside a quartz reaction tube and secured against movement along the tube with quartz wool. Next, nitrogen was injected to ensure that a proper environment was provided before the pyrolysis experiment was started. First, a batch of syngas was collected for 20 min until the process achieved the set temperature; second, the batch was collected at the set temperature for the next 20 min. The produced gas was collected in Tedlar bags and then analysed. Additionally, the impact of calcium oxide (CaO) as a solid sorbent for carbon dioxide capture was investigated. Thus, the pyrolysis process was also carried out in the presence of a CaO solid sorbent layer (in the amount of 3 g) to compare the chemical composition of syngas without and with CaO in the reaction zone. Calcium oxide was pre-treated in the oven to remove the moisture content and to confirm CaO purity. For experiments with sorbent presence, the raw material was placed in the upper part of the quartz reaction tube and secured against movement along the tube with quartz wool; the sorbent was put inside the quartz reaction tube in the bottom part and also secured against movement along the tube with quartz wool. Both layers—the biomass and solid sorbent—were placed in the same heating zone and subjected to the same process temperature during the whole process.
The chemical analysis of obtained chars was provided. The analysis—including carbon, hydrogen and nitrogen concentrations—was carried out using an Elemental Analyser Truespec CHN Leco (CHN628).
Thermal analysis (TA) was applied to study the thermal behaviour of the raw material and chars obtained after the pyrolysis process of pine sawdust. First, the combustion and pyrolysis of raw biomass was carried out using TA. Next, the combustion process of chars obtained during the pyrolysis process was analysed. For the thermogravimetric analysis ((TG) and differential scanning calorimetry (DSC)), the sample was placed in an alumina crucible. A fuel sample of 5 mg was heated from an ambient temperature up to 700 °C at a constant heating rate of 10 °C/min in 60 mL/min flow of air (combustion) and nitrogen (pyrolysis), respectively. TG and DSC curves for each fuel sample were determined. Based on the TG results, the mass changes were determined, whereas DSC allowed us to examine thermal effects (endothermic and exothermic). Additionally, the DTG (differential thermogravimetric ) curves were calculated; DTG is the first derivative of TG.
The morphology and texture of studied samples were investigated using a scanning electron microscope (SEM) ZEISS MultiSEM 505/506. This high-resolution microscope allowed us to investigate the surface topography of fresh and used sorbent as well as raw biomass and after-process chars. The samples were placed on double-sided tape which was coated with a thin gold (Au) film. The specific surface area and porous structure (porosity) were investigated using the Brunauer–Emmett–Teller (BET) method. For this purpose, JW-BK200B (JINGWEIGAOBO Ltd., Beijing, China) was used.
Phase composition analyses, such as the identification of CaCO3 content in the fresh sorbent material (CaO) and after the processes, were performed using X-ray diffraction (XRD, Bruker d8 advance). The device was equipped with a Cu Kα (40 kV, 40 mA, λ =0.154 nm) X-ray source, which allowed us to detect the crystalline phase composition of adsorbents. Tests were conducted in the angular range of 2θ = 6 ÷ 90°, with a step size of 2θ = 0.02° and dwell time of 0.1 s. The phase composition of the analysed samples was determined using the data base PDF-4+ICDD and confirmed with the available literature.
Syngas samples were analysed using a gas chromatograph (GC 7900, Techcomp) equipped with two detectors: a flame ionization detector (FID) and thermal conductivity detector (TCD). The CH4, C2H4, C2H6, C3H6, and C3H8 compounds were analysed using a FID detector, while CO, CO2, H2 and N2 species were determined using TCD.
3. Results and Discussion
3.1. Analysis of Solid Pyrolysis Products
3.1.1. Pyrolysis Char Analysis
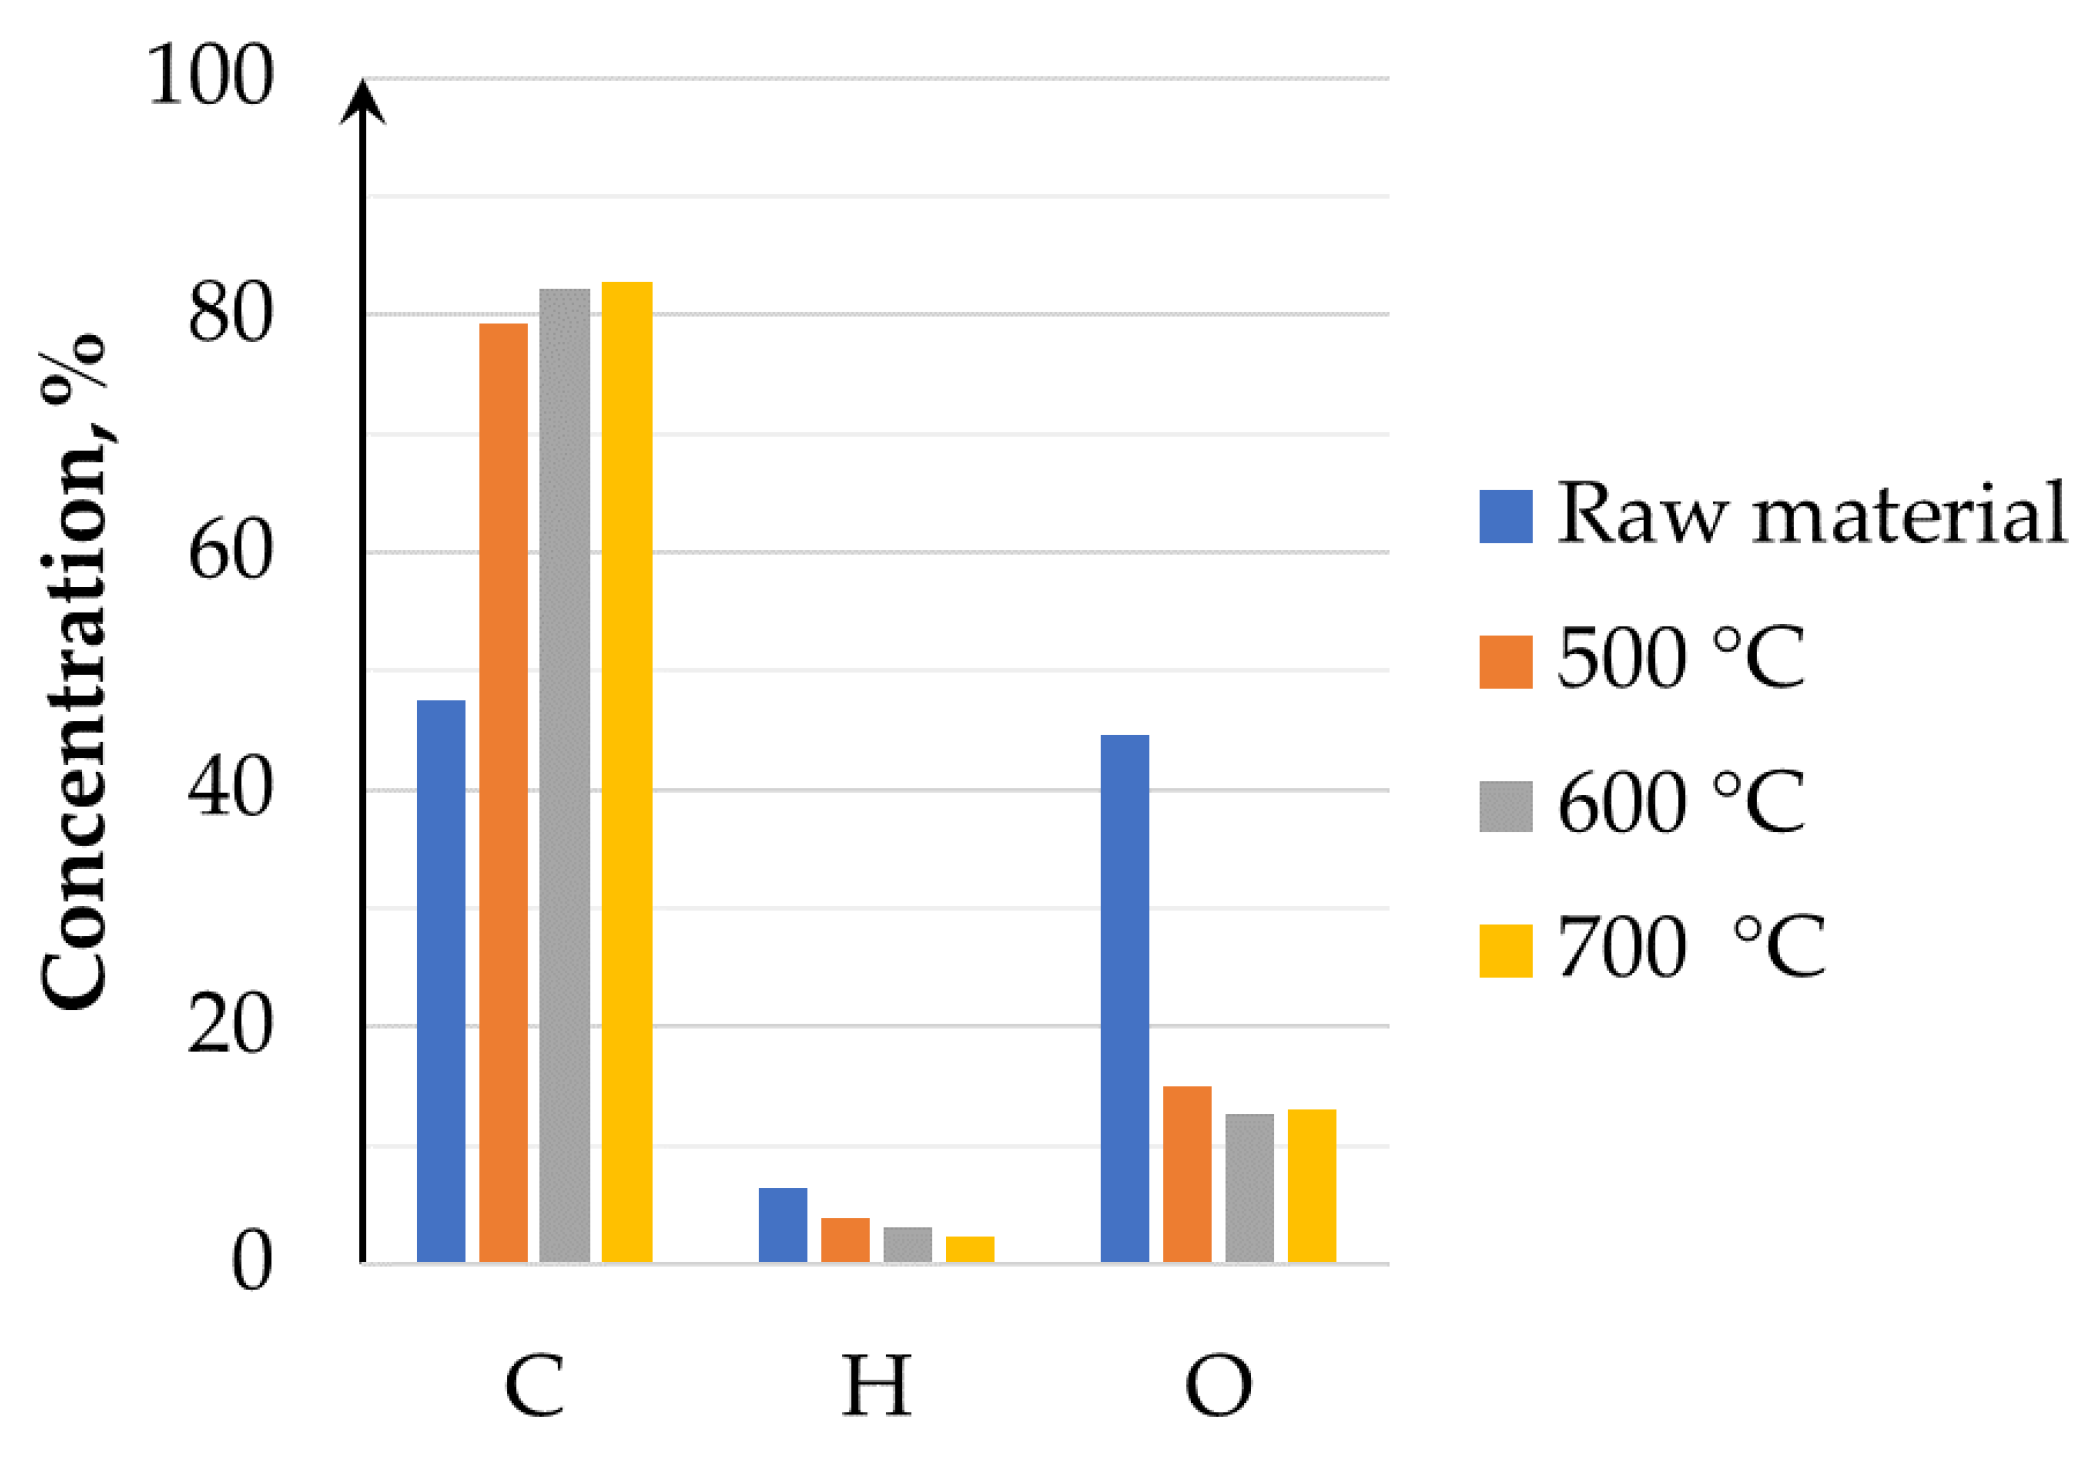
Figure 3 presents the changes in C, H, and O concentrations in the studied raw biomass and obtained chars after the pyrolysis process. The nitrogen concentration is excluded from the presented graph as its concentration was below 0.5% for each studied material. The oxygen concentration was calculated based on the difference of carbon, hydrogen, nitrogen and ash content. The standard deviations for the used method for the determination C, H, and N concentrations are ±0.5% for carbon and nitrogen and ±1% for hydrogen. Solid products of this process (named char or biochar) were obtained under temperatures of 500, 600 and 700 °C. A significant increase of carbon content was observed (from 47.4% in raw material to 82.8% for char obtained at 700 °C), whereas the hydrogen and nitrogen contents were drastically decreased. The chemical composition of the studied chars reflected the chemical composition of coal, the average concentration of which is as follows: C (82.3%), H (2.9%) and O (6.9%). This phenomenon is caused by the vaporisation of water and noncondensable gases, such as CO, CO2, and H2 from raw material during pyrolysis, which leads to an increase of carbon content [31]. The carbon concentration increases with the process temperature increase, which was also observed in similar experimental studies [31,32].
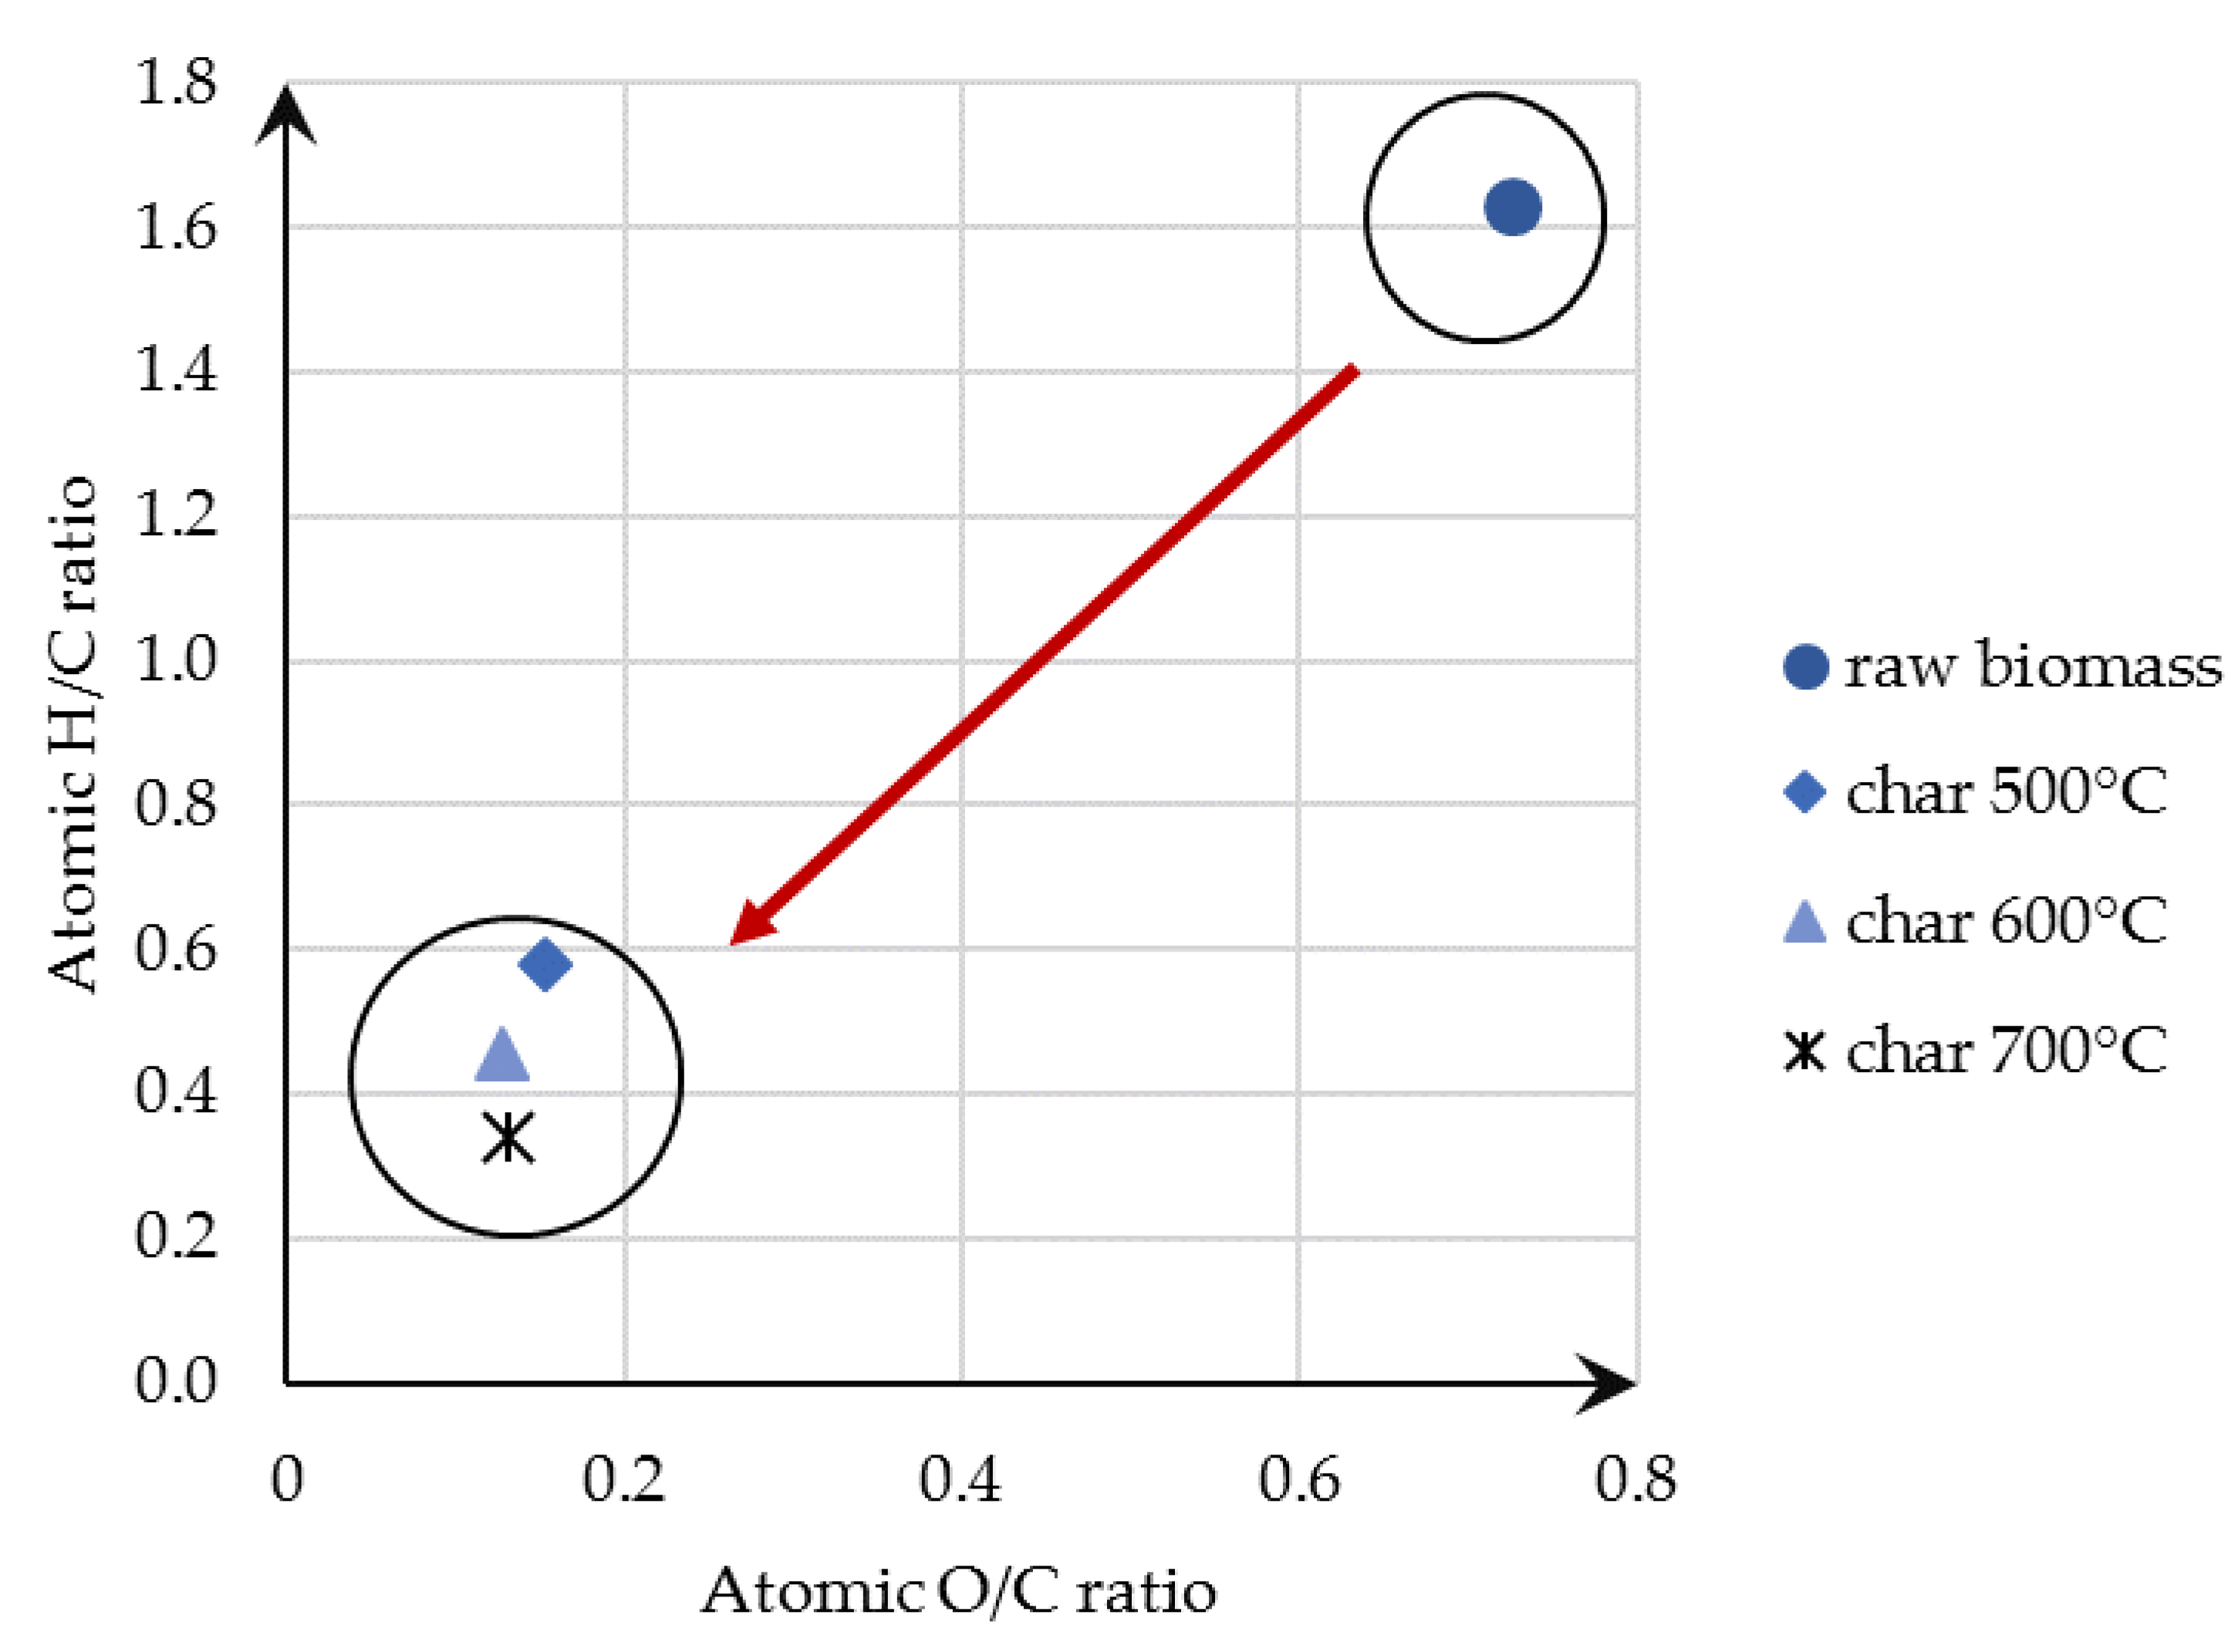
The chemical properties of chars are depicted on the van Krevelen diagram (Figure 4). The atomic ratios of H/C and O/C confirmed that the biochar was moving closer to the high-energy properties of fossil fuels, such as coal. The upper right corner shows the results for the output of the biomass in raw form. After the pyrolysis process, the points moved to the lower left corner of the coordinate system; therefore, in this chart, the impact of the pyrolysis process on the solid product can be observed: the obtained chars have similar values to coal composition.
3.1.2. Thermogravimetric Analysis of Combustion Properties of Pine Sawdust and Chars
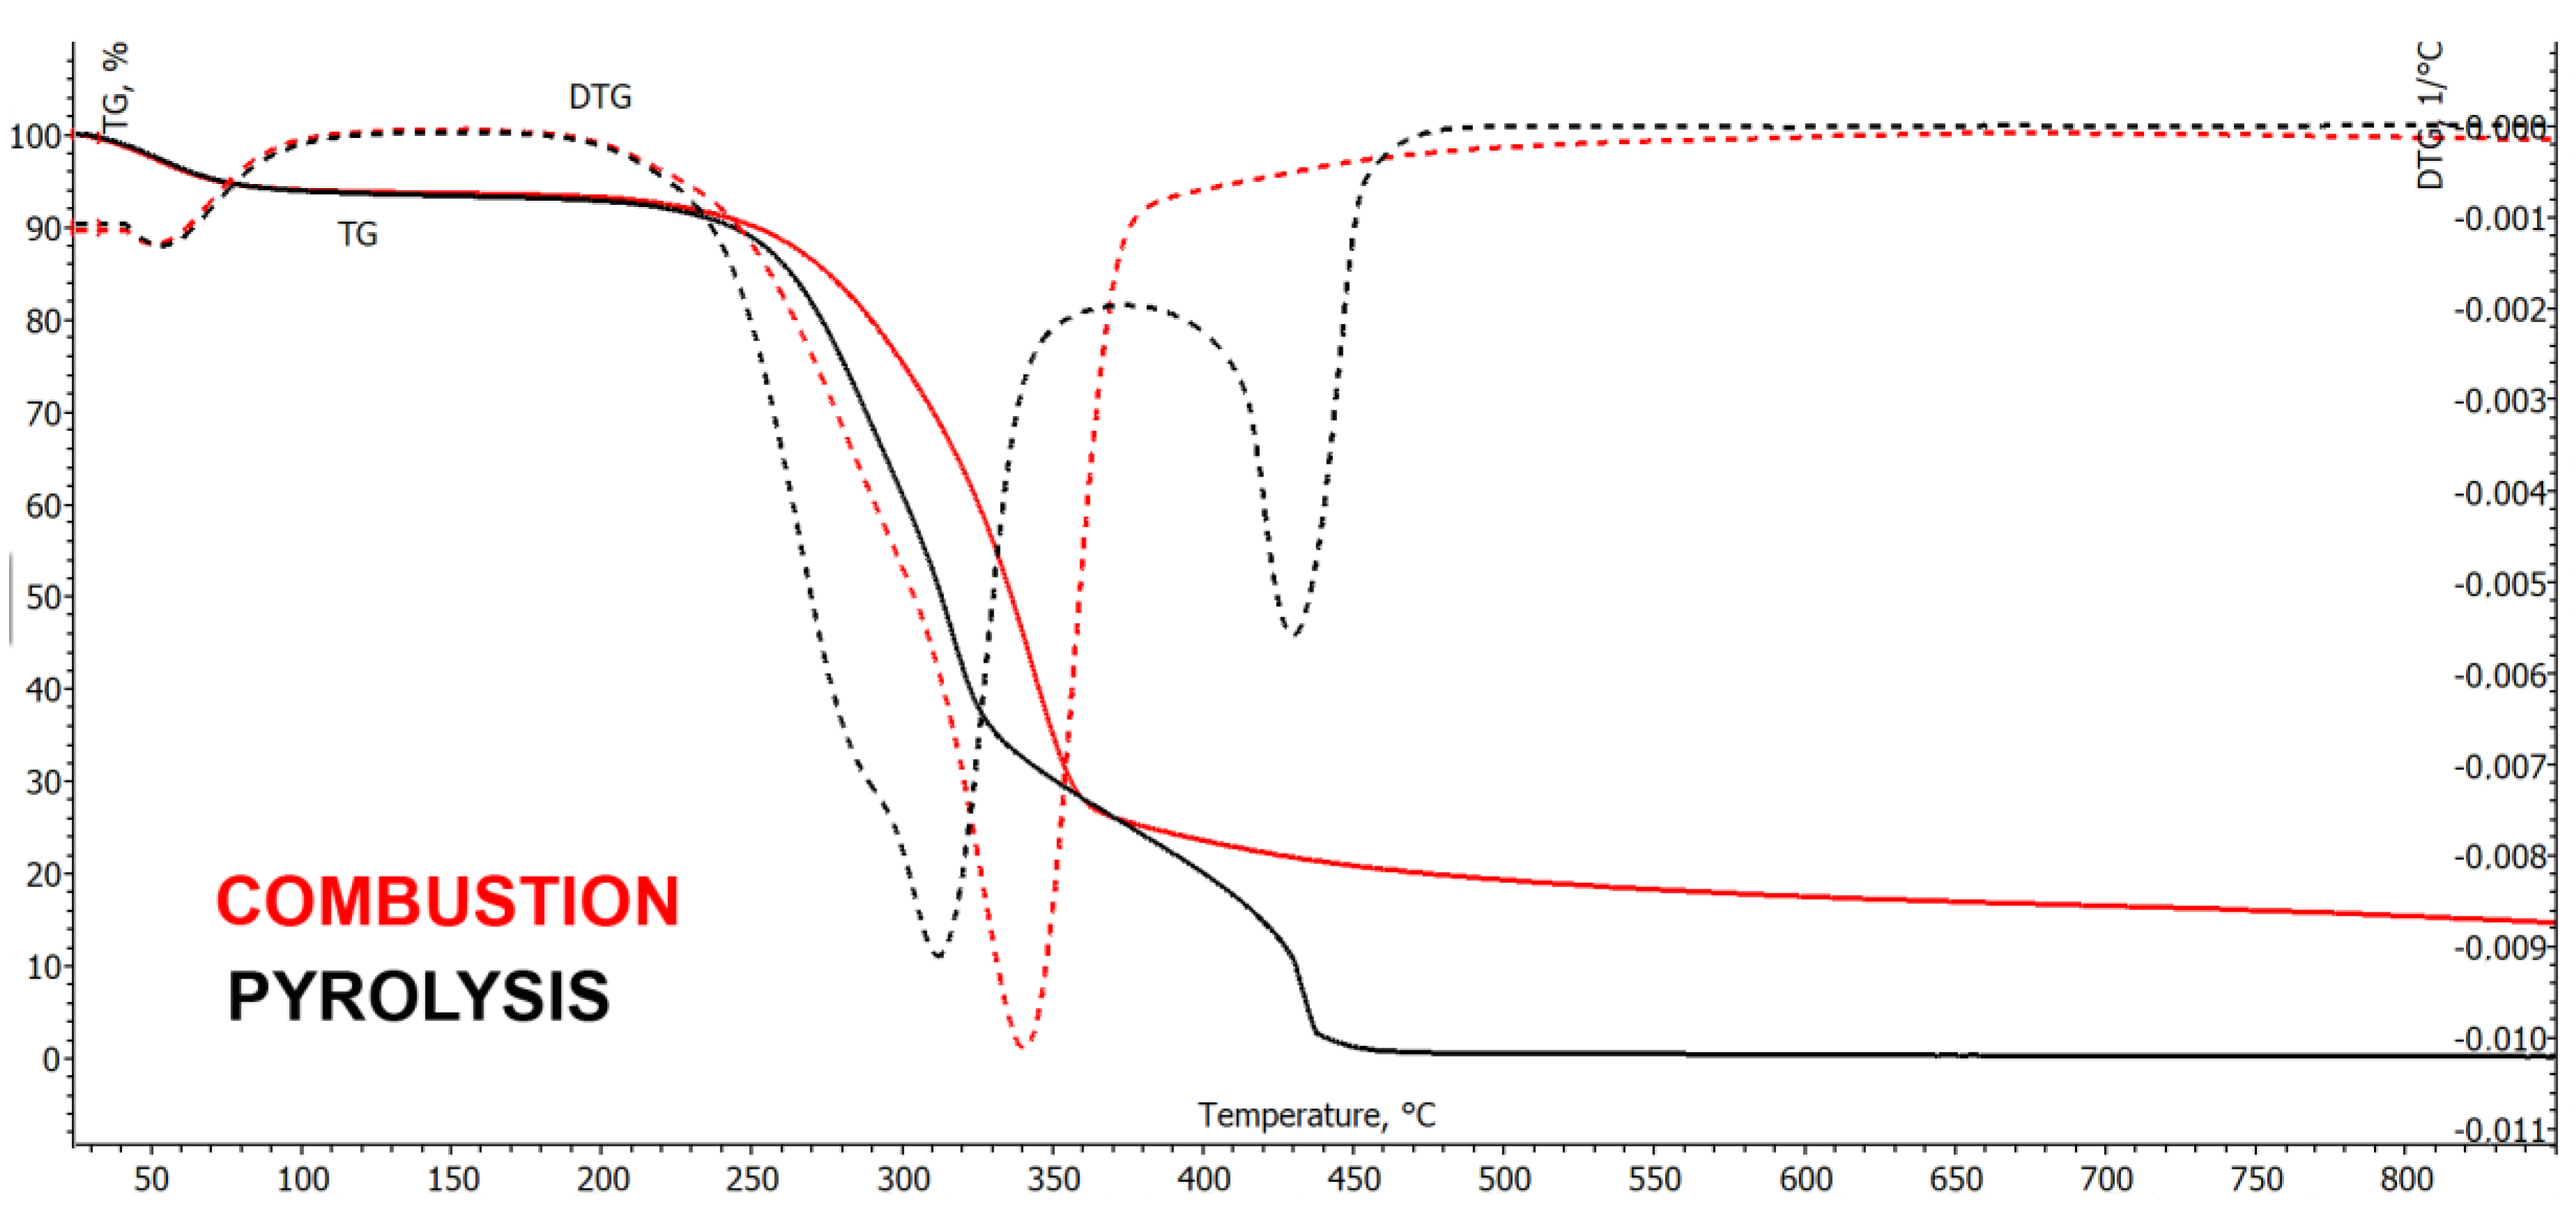
The comparison of the combustion and pyrolysis processes of raw pine sawdust is presented in Figure 5. This graph consists of TG (thermogravimetric analysis) and DTG (differential thermogravimetric) curves. In the DTG curve for both processes, the main peak represents the thermal decomposition of the biomass, which occurred at a temperature of 300 °C for combustion and 350 °C for pyrolysis. The DTG curve for the pyrolysis process is missing the second peak which appeared during the combustion process (at a temperature of 430 °C) and refers to the afterburning of char. Because of the mass loss, the TG curve for the combustion process is higher than for pyrolysis. Pyrolysis char still consists of a high amount of carbon, and it can be used as an energy carrier; furthermore, a part of the combustible fraction remained in the solid phase during the pyrolysis process. The highest mass loss appeared from a temperature of 250 °C for both processes.
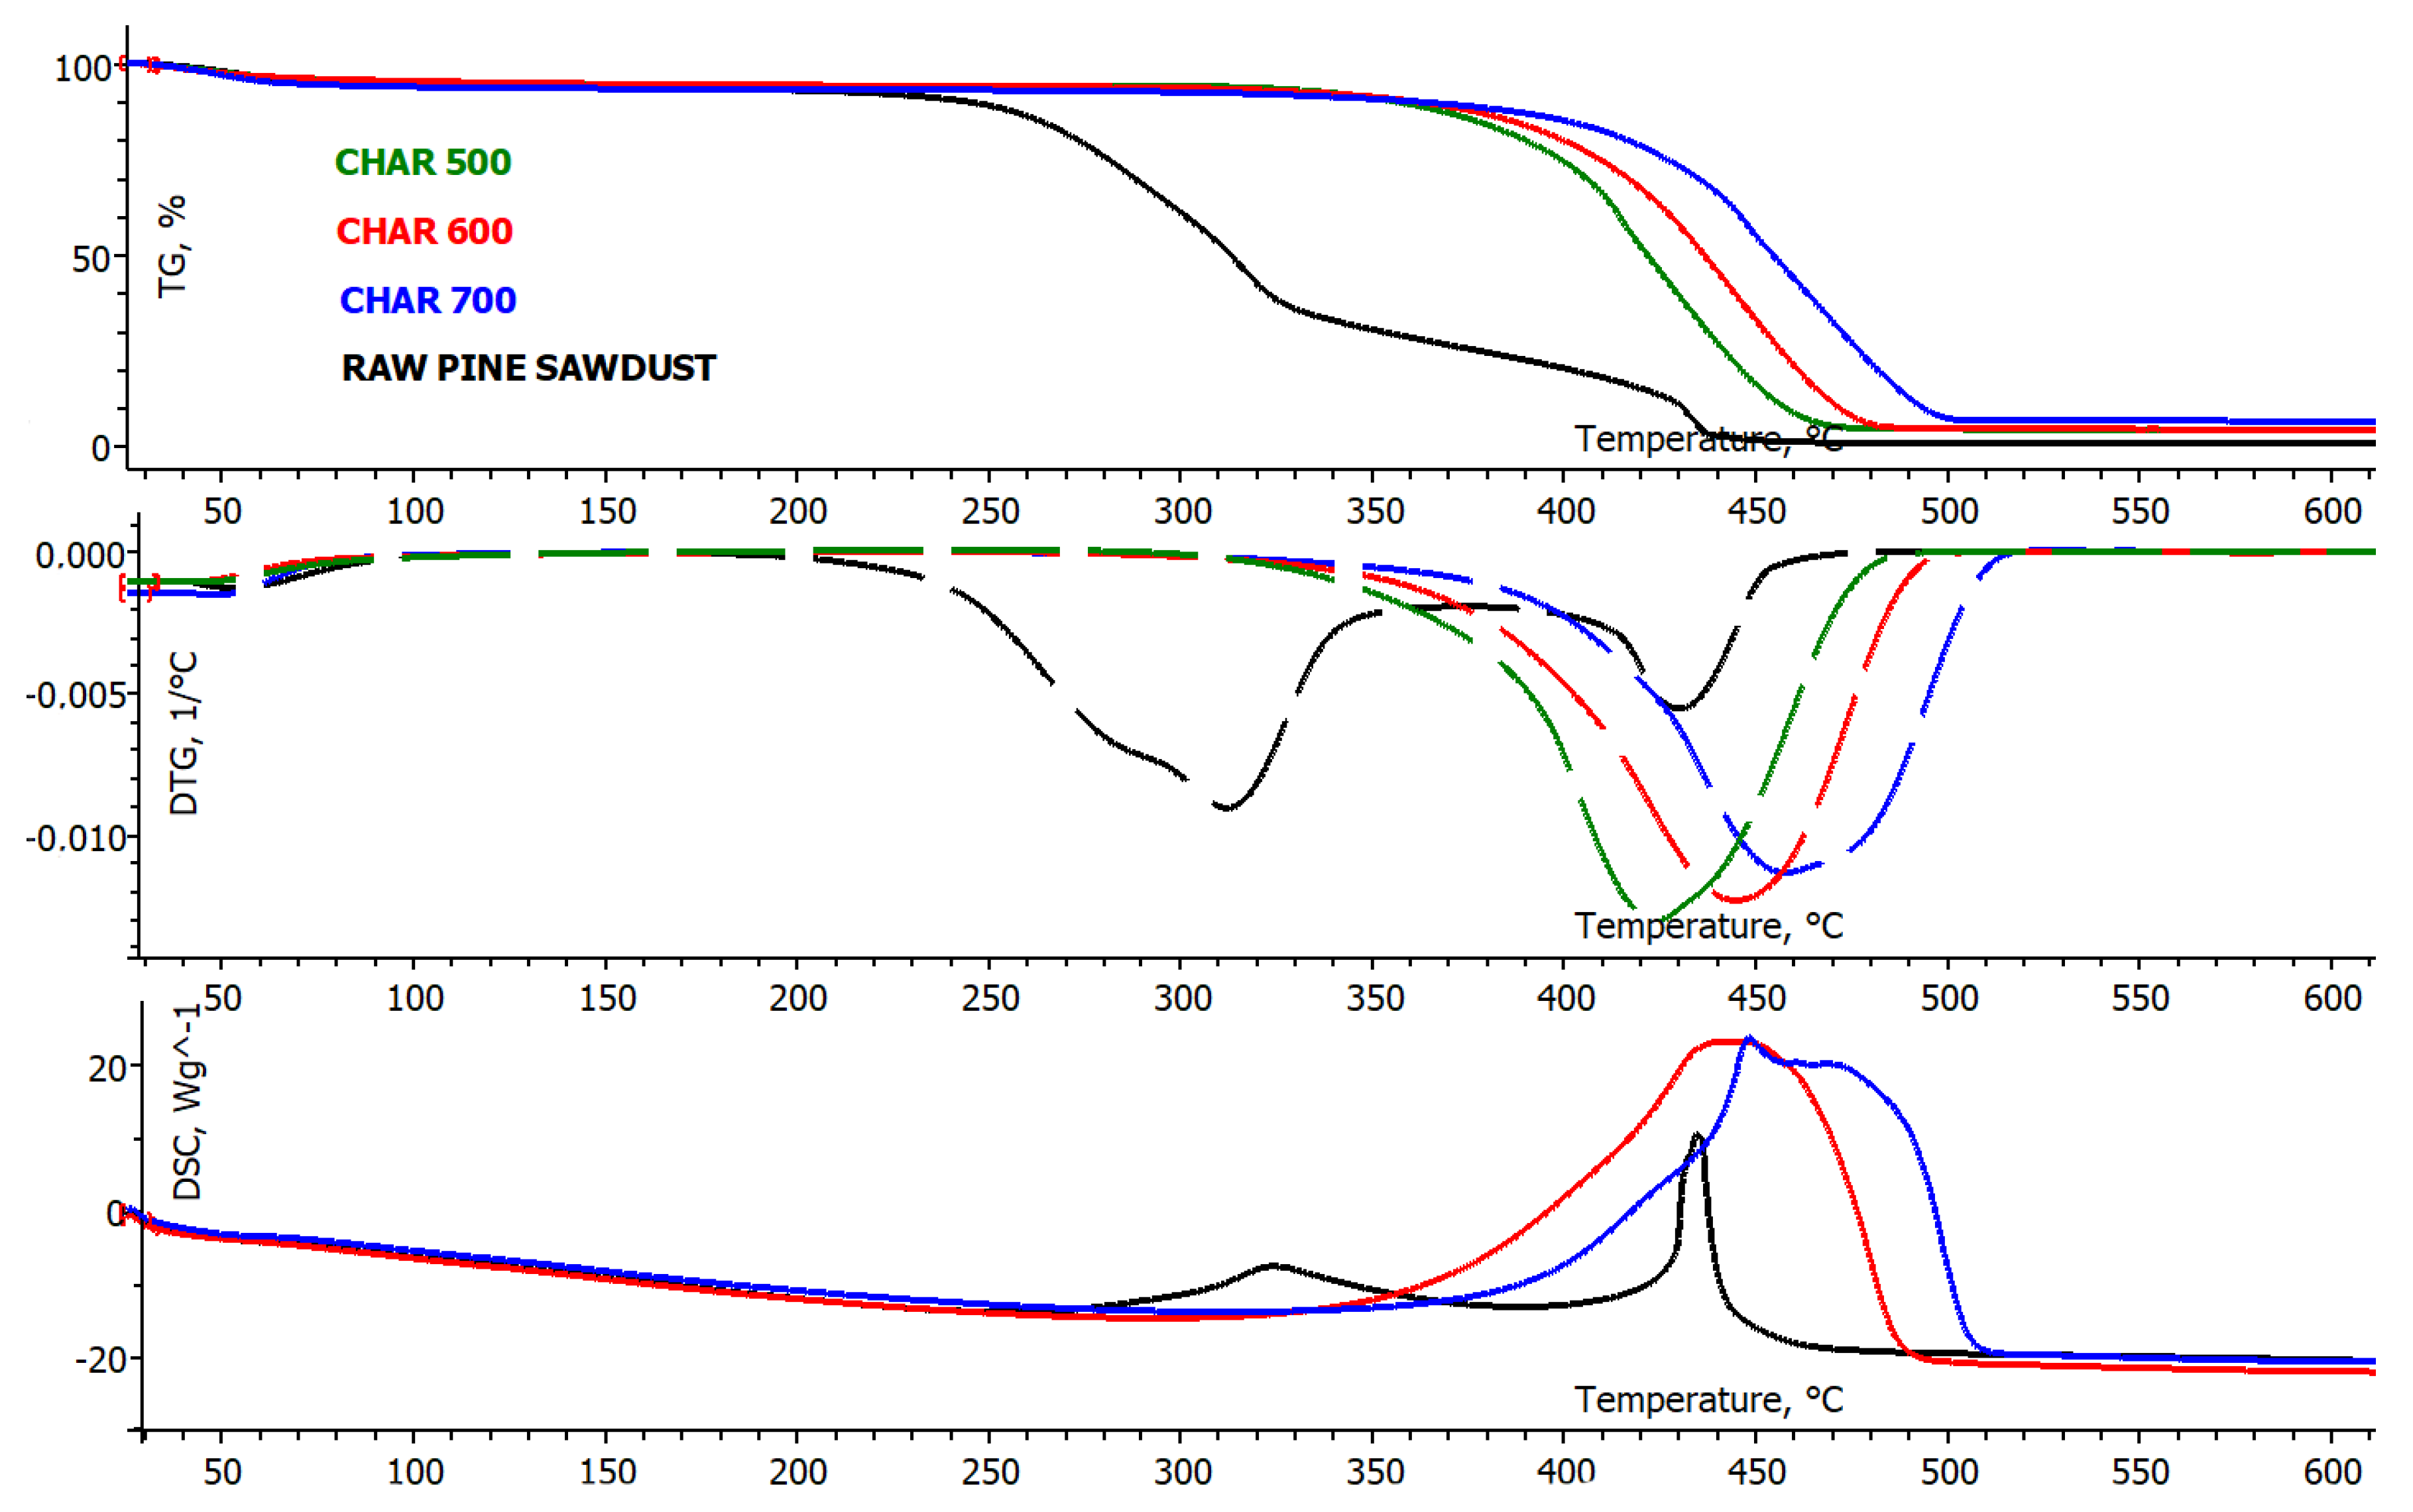
However, analysing the combustion process of char obtained from previously conducted pyrolysis processes in the test rig, it can be observed that decomposition starts at a higher temperature for chars obtained from processes provided at a higher temperature. Figure 6 presents the difference between the combustion processes of obtained chars and raw biomass. In case of the combustion of chars, a DTG peak related to the release of volatile matter was not observed, because of its removal during the pyrolysis process.
Based on the obtained thermogravimetric results, an analysis of the key combustion parameters of all studied samples (raw biomass and biochars) was provided. Based on data from TG and DTG analysis, the following parameters were defined: ignition temperature (Tig), burnout temperature (Tb), temperature corresponding to the highest DTG peak (TDTG), maximum mass loss rate ((dW/dt)max), average mass loss rate ((dW/dt)av), maximum peak time (tp), ignition time (ti), burnout time (tf) and time range of DTG/DTGmax = 0.5 (Δt1/2) [33]. Based on these parameters, the ignition index (Di), burnout index (Df) and combustion indexes (S) and (Hf) were calculated. To establish Tig and Tb, the method described in [34] was used, which states that the ignition temperature is detected based on the temperature corresponding to the point of intersection of the highest peak value of DTG and the corresponding slope to the ion with respect to the TG profile, while the Tb temperature was established based on the mass stabilization. The ignition index is defined as follows [33]:
This factor determines the easiness of the separation of volatile compounds from fuel. The higher the Di values, the easier the volatile compounds are separated. The burnout index is defined as [33]
The combustion index (S) was calculated according to the following equation [35]:
where the maximum mass loss rate (dW/dt)max, %/min, and the average mass loss rate (dW/dt)av, %/min were included.
The last factor—the rate and intensity of the combustion processes—is calculated based on Equation (4) [33]:
The final results of the calculations are presented in Table 2.
The calculated combustion index S reflects the ignition, combustion and burnout properties of the fuel. It can be seen that the raw biomass has the highest index value, and the index decreases with increasing pyrolysis process temperature. The lowest value was obtained for biochar at 700 °C: 2.11 × 10⁻⁷ ∙min−2 ∙°C−3. The presented results and literature review lead us to the conclusion that biomass contains a higher amount of VM in comparison to chars, as the combustion index S was the highest [36,37]. Additionally, the Di index confirmed this tendency. Raw pine sawdust had Di at the highest level of 0.0165 wt.%/min3; however, char at 700 °C reached the level of 0.009 wt.%/min3. The highest value of Di proves the fact that more volatile matter was separated from the fuel, and combustion occurs easily in the early stage; this can be also noticed in the TG and DTG curves in Figure 6. However, the S index for chars at 500, 600 and 700 °C suggests good combustion performance. A lower VM content allowed us to obtain a more stable flame and combustion, which led to the avoidance of undesirable heating loss.
The Hf index corresponds to the rate and the intensity of the combustion processes. The lowest value (949) was calculated for raw biomass, which increasde with pyrolysis temperature. In the case of the index Hf, a smaller value corresponds to better combustion properties, which proves the good combustion properties of biomass and the comparable properties of biochars; for comparison, the Hf index value for coal is around 2000 [33].
3.1.3. Scanning Electron Microscope Analysis of Raw Material and Obtained Chars
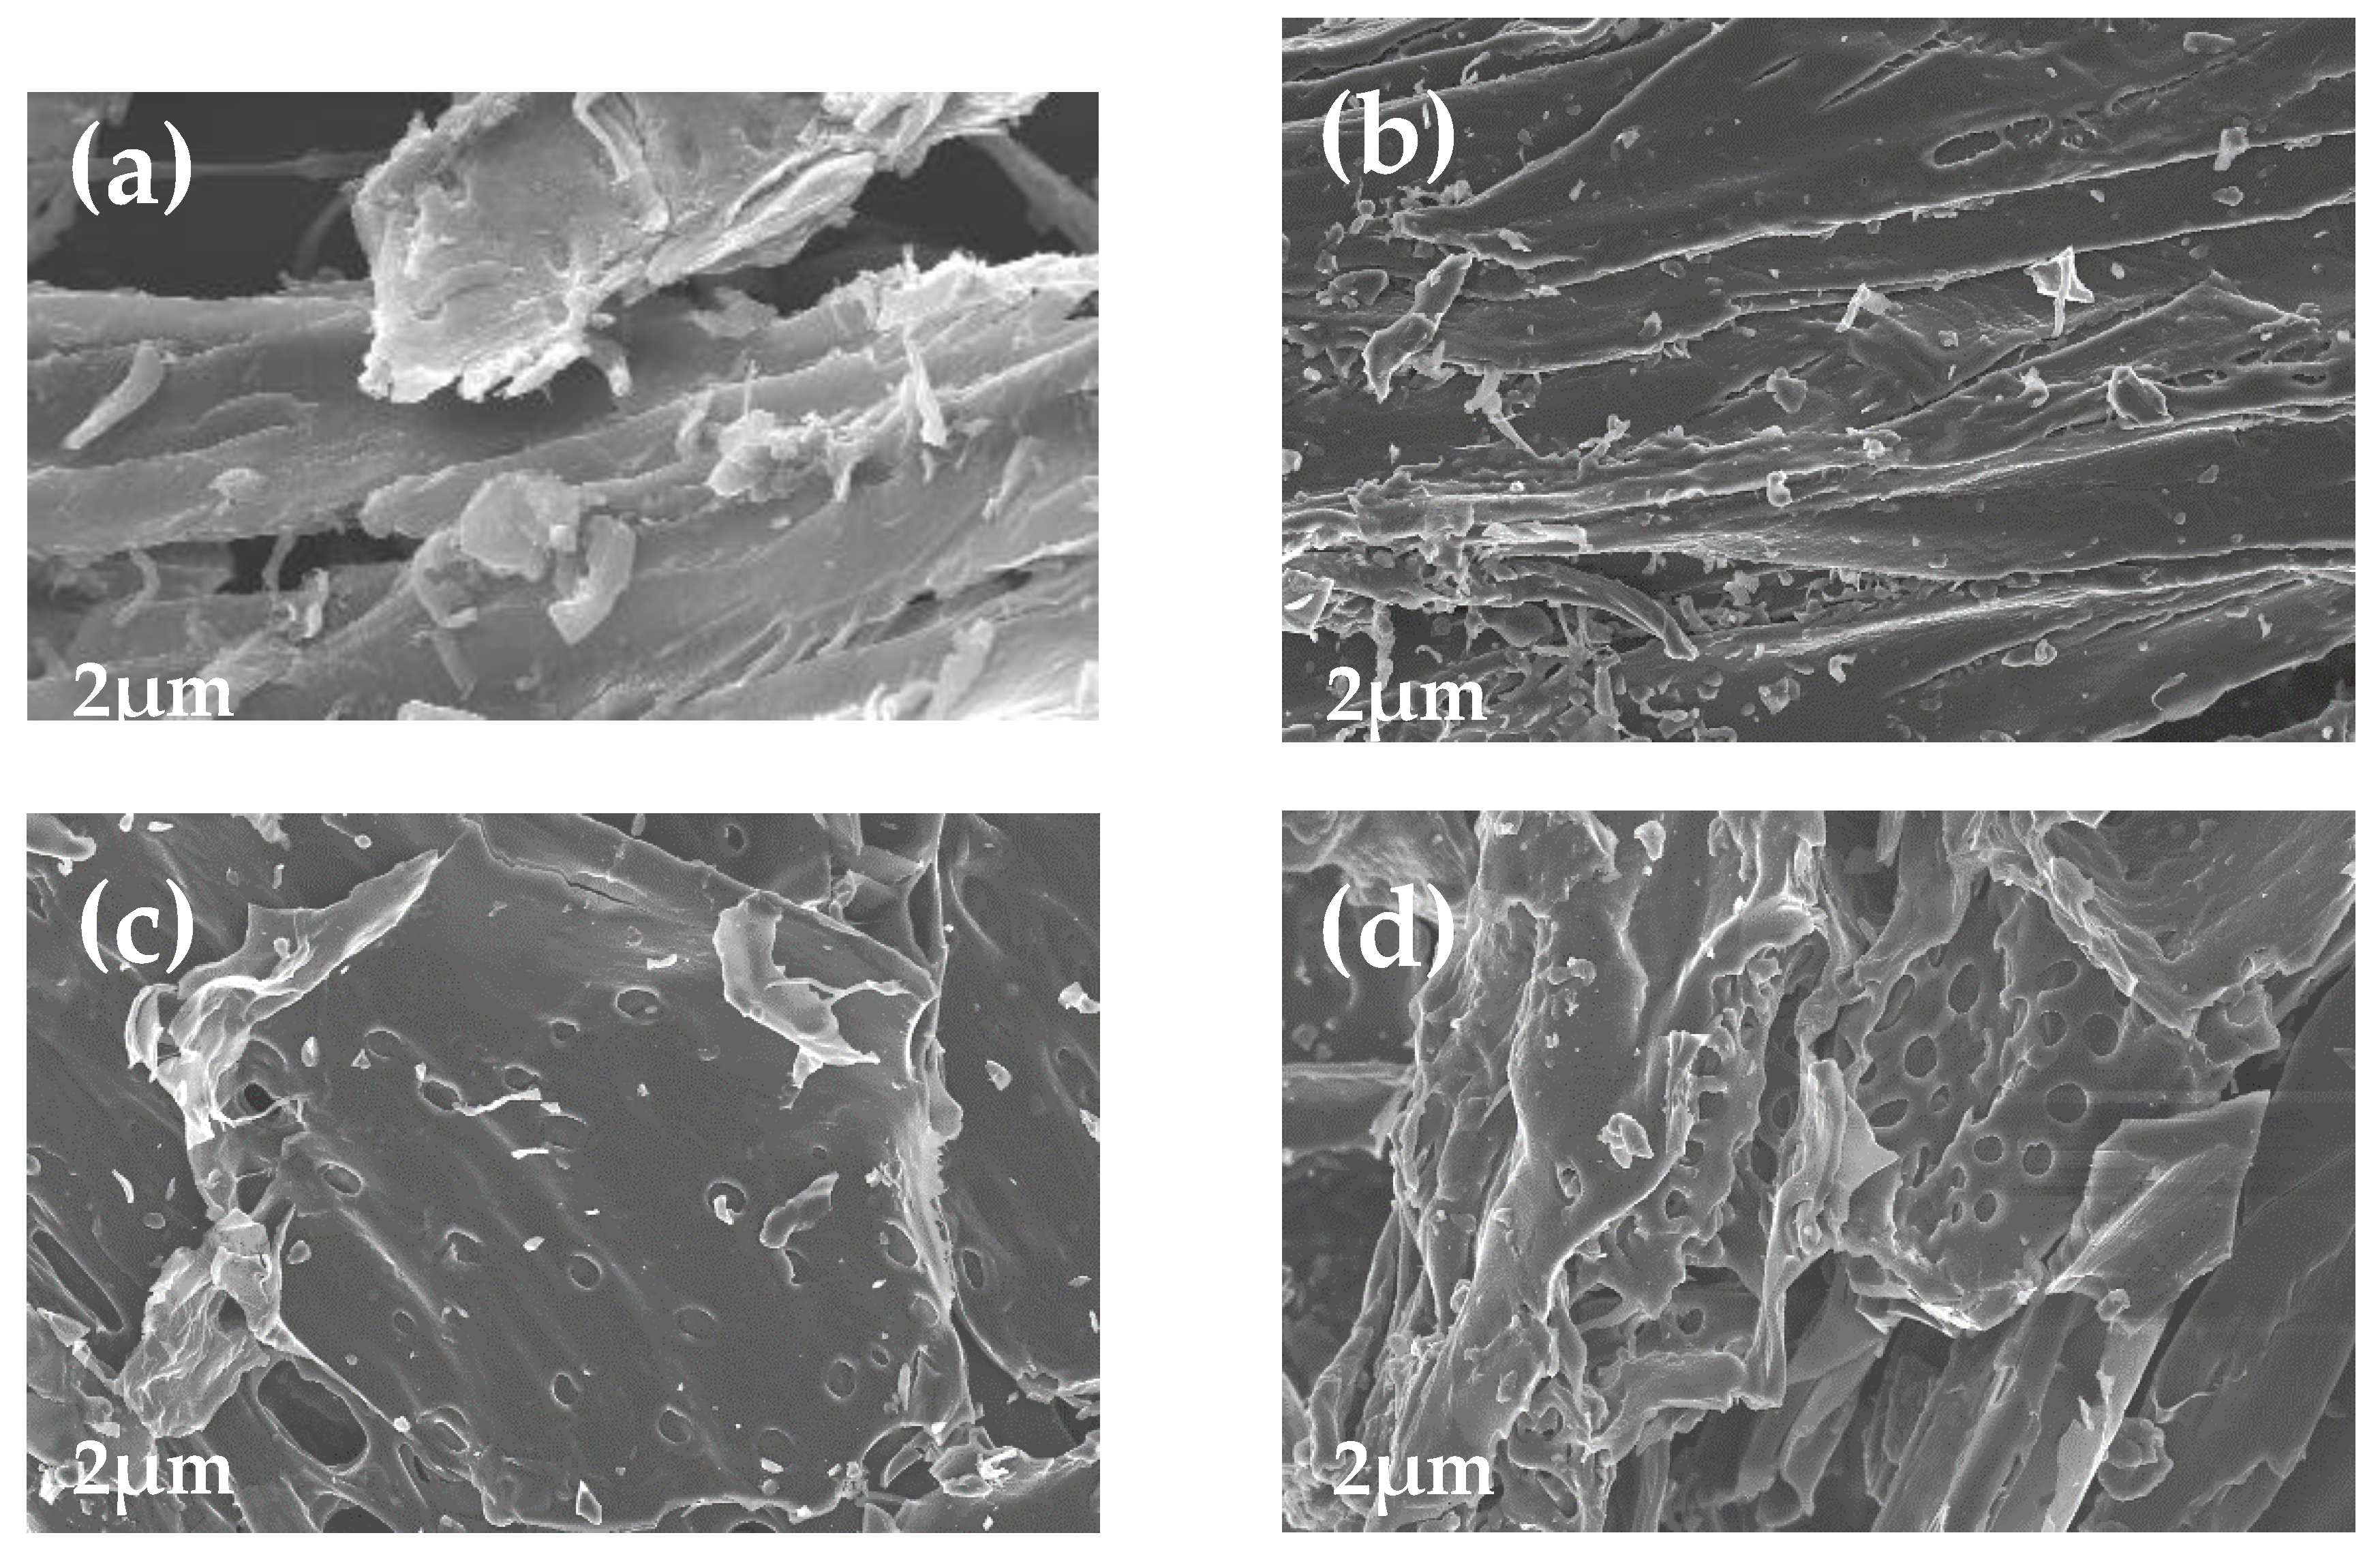
The investigation of the surface topography of the raw biomass and chars was provided by means of SEM, using a high-resolution scanning electron microscope. SEM micrographs are presented in Figure 7. Image (a) in Figure 7 shows the raw pine sawdust before the pyrolysis process. This material was ground before conducting the analysis, and its structure was fibrous due to the fibrous structure of the pine sawdust, without noticeable pores. This structure was observed after the pyrolysis process and can be seen in Figure 7b–d. With the increase in the process temperature, the char obtained a more developed porous structure, and more dense openings appeared in comparison to the raw material. This indicates that the micro-morphology structure of the biomass is affected by the process temperature.
3.1.4. Adsorption Properties of Chars
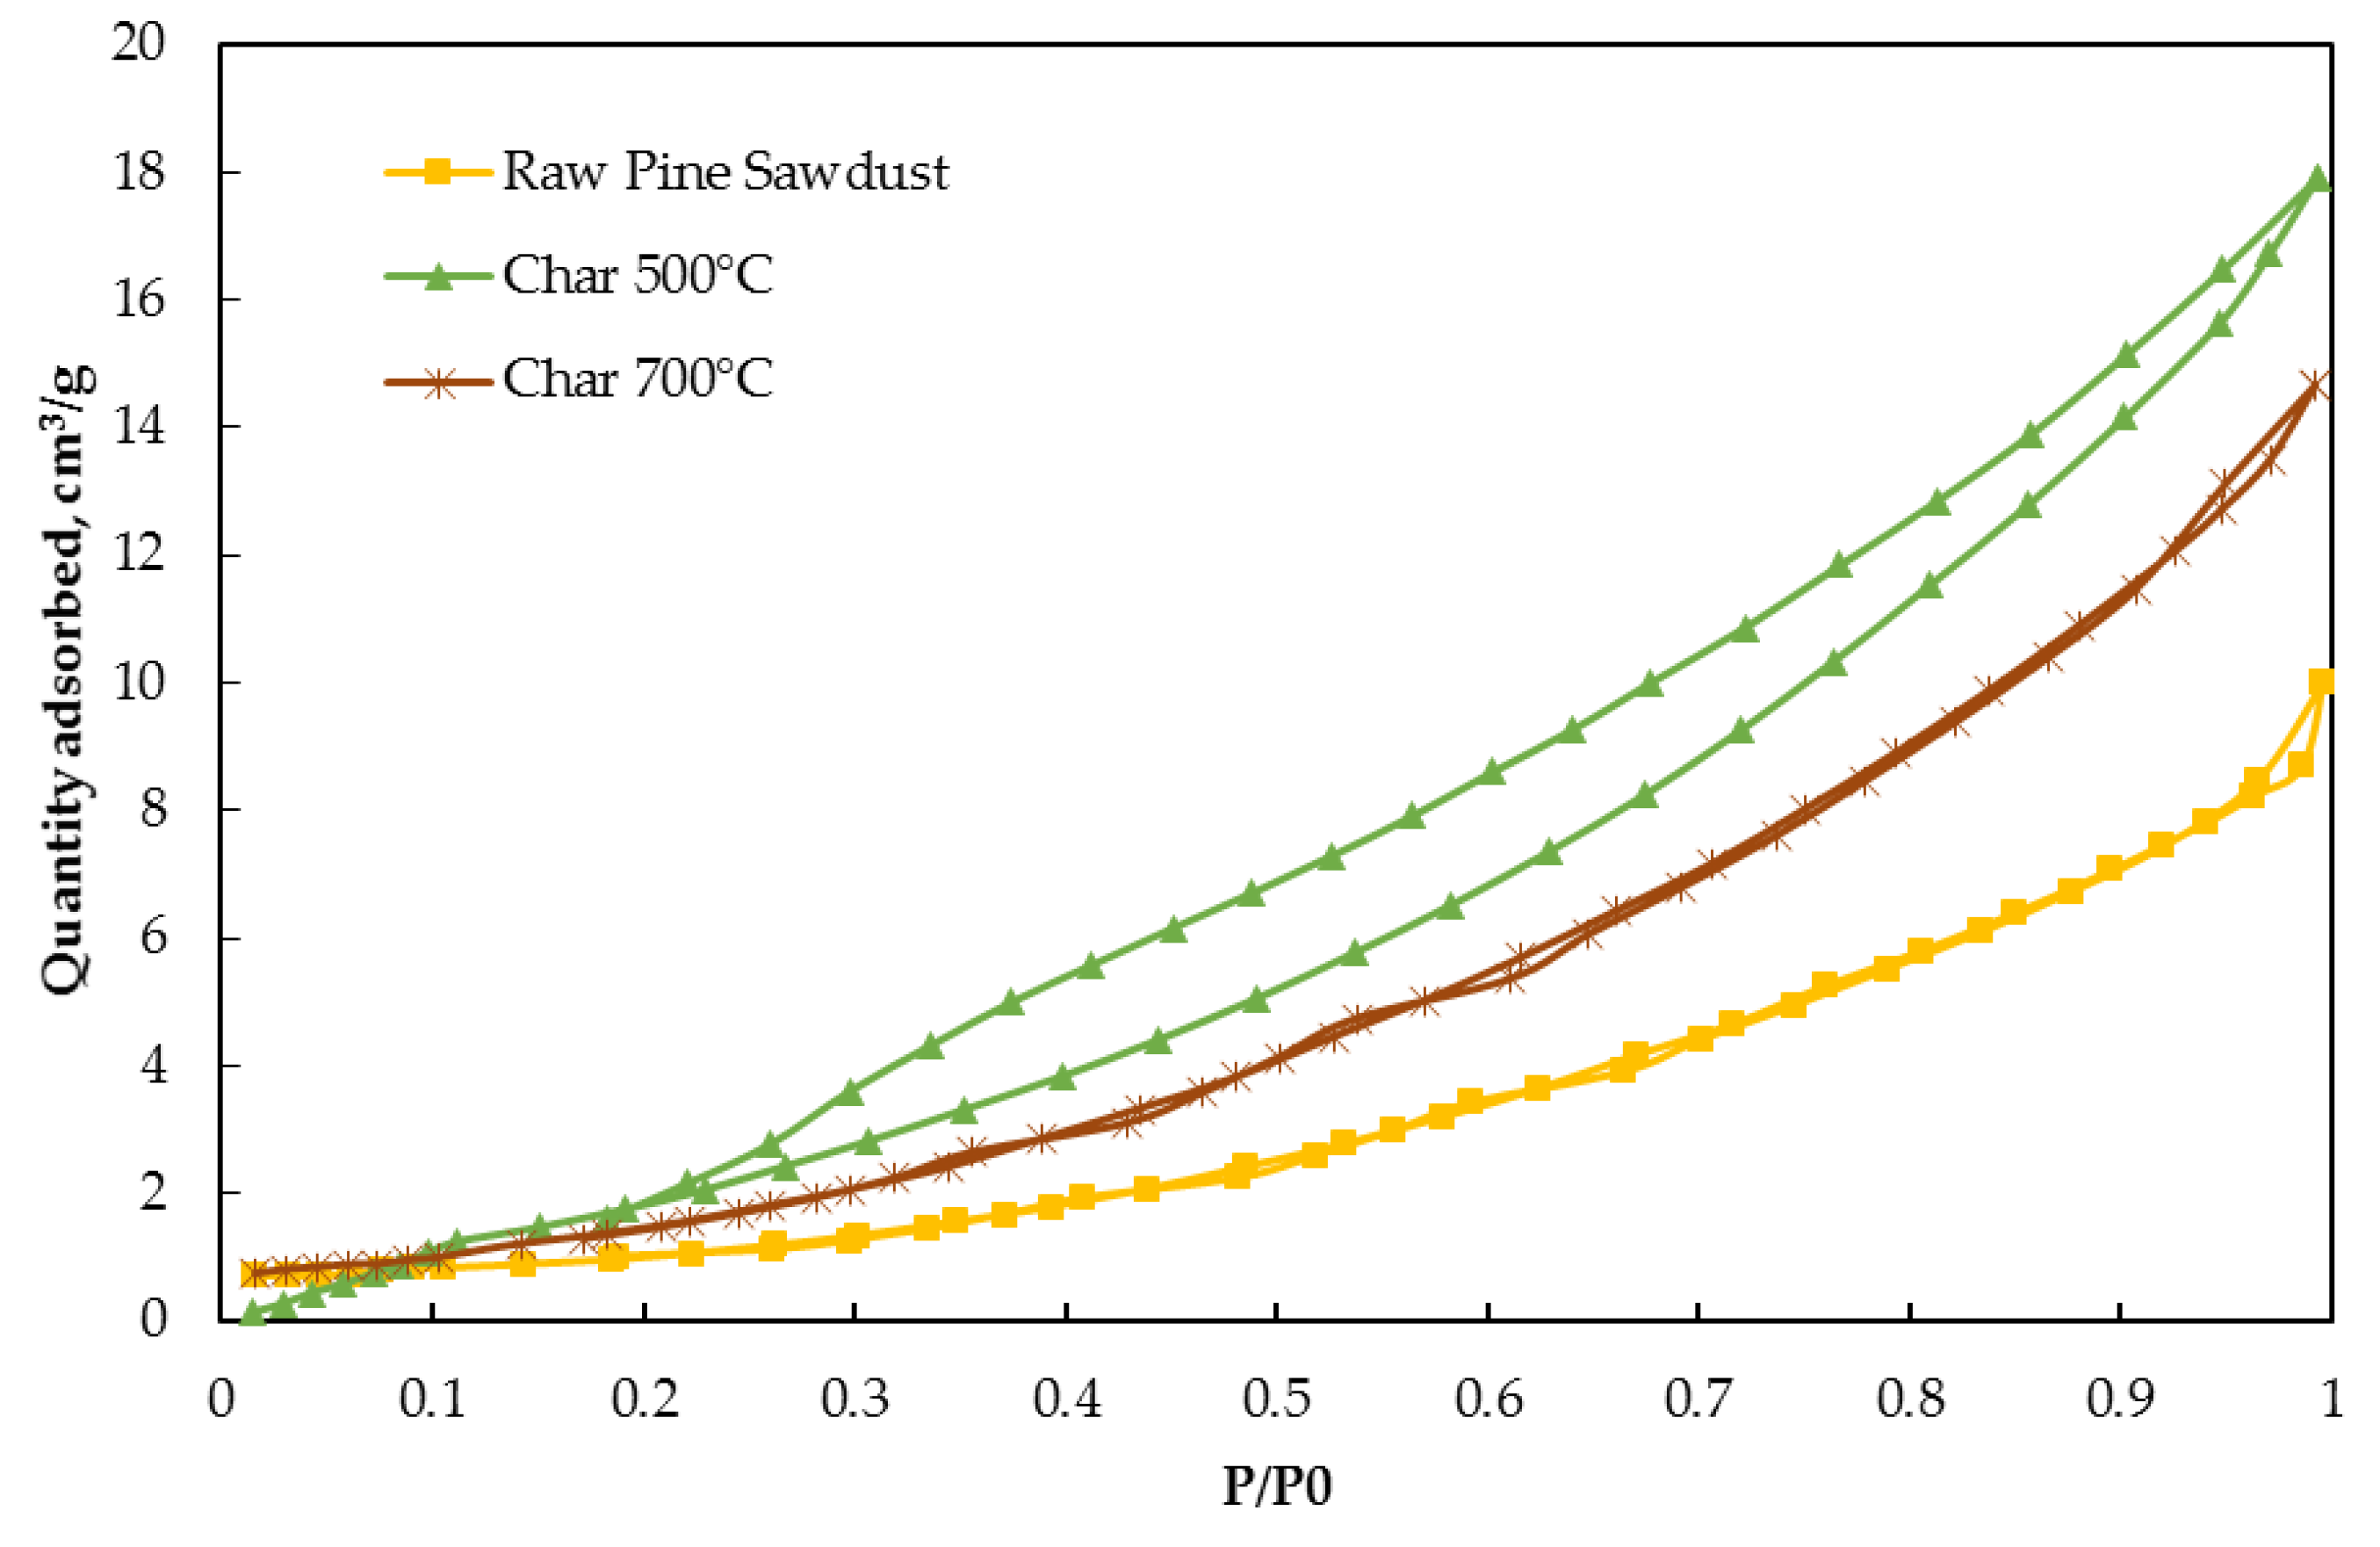
The apparent surface area of the studied solid material, related to the adsorption capacity, is described by the BET procedure. The surface area of the solid material can be either created or destroyed by specific material treatment. Particle size reduction—e.g., milling and grinding—contributes to making the material porous, while melting destroys this structure [38]. During the pyrolysis process, with a higher heating rate and higher process temperature, the rapid escape of volatiles could increase the size of the micropores in chars formed during the pyrolysis process, and as a result, an increased pore size and decreased BET values are observed (Figure 8 and Figure 9) [39]. The pore size distribution is a key parameter defining the potential use of produced biochar as an activated carbon source used as a sorbent for heavy metals, dioxin and furans capture during waste combustion in the power sector.
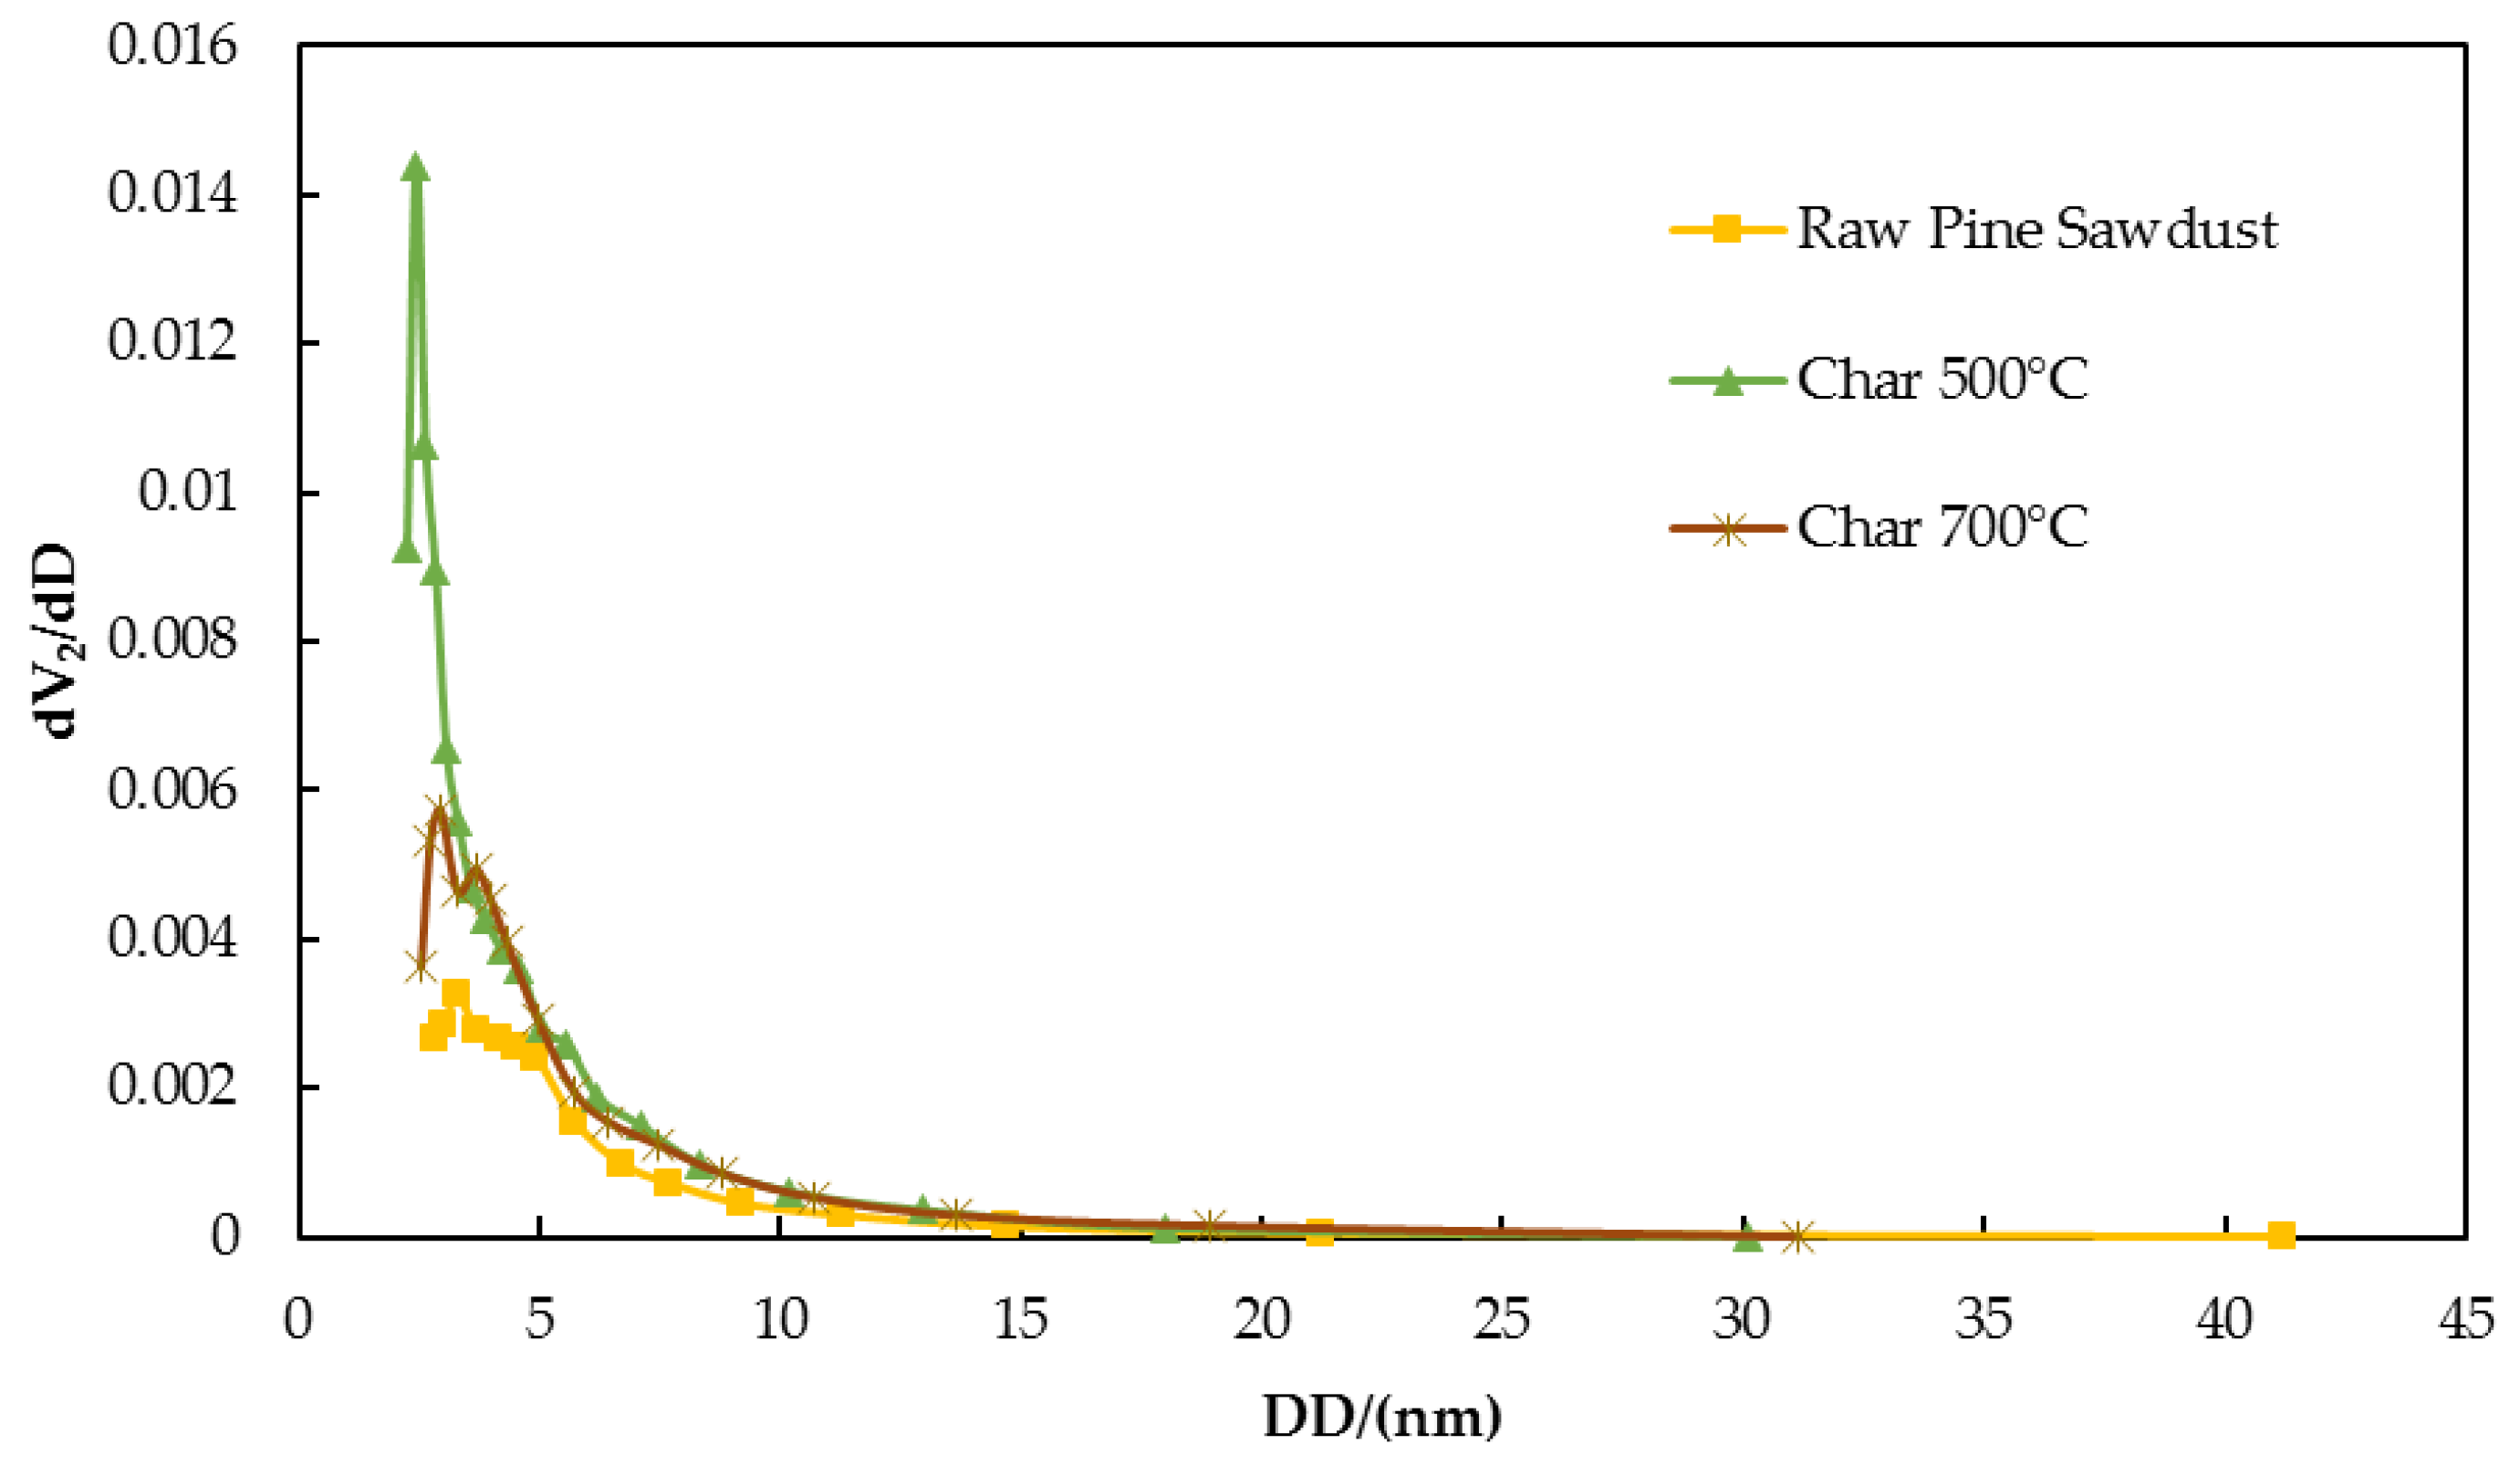
According to the classification of IUPAC (International Union of Pure and Applied Chemistry), N2 isotherms of raw pine sawdust and char at 700 °C are of type III, which is characterized by convexity towards the partial pressure axis (Figure 8). Char at 500 °C is a type IV BET isotherm, which has an inflection at the origin and reflects the adsorption on a mesoporous solid. The isotherm of char at 500 °C occurs with an H4 type hysteresis loop, which can be associated to the porous adsorbents which are related to capillary condensation. Type III can be described by the BET adsorption model; type III BET is related to the clustering of the adsorbate onto the material surface. The Barret, Joyner, and Halend (BJH) pore size distribution of the studied materials in Figure 9 shows that the pore size distribution was similar for the studied chars, in a range of 2.3–31.1 nm, while that of raw pine sawdust was 2.8–41.2 nm. Based on the BJH pore size distribution data, it can be also concluded that the most probable pore sizes were 5.4 nm, 2.6 nm and 3.9 nm for raw pine sawdust, char 500 °C and char 700 °C, respectively.
3.2. Analysis of Sorbent (CaO)
3.2.1. Thermogravimetric Analysis of Sorbent (CaO)
Equation (5) presents the process of CO2 capture using CaO. During this process, CaCO3 is formed. After the experiment, CaO samples were collected and then analysed using thermogravimetric analysis; the results are presented in Figure 10.
CaO + CO2 → CaCO3
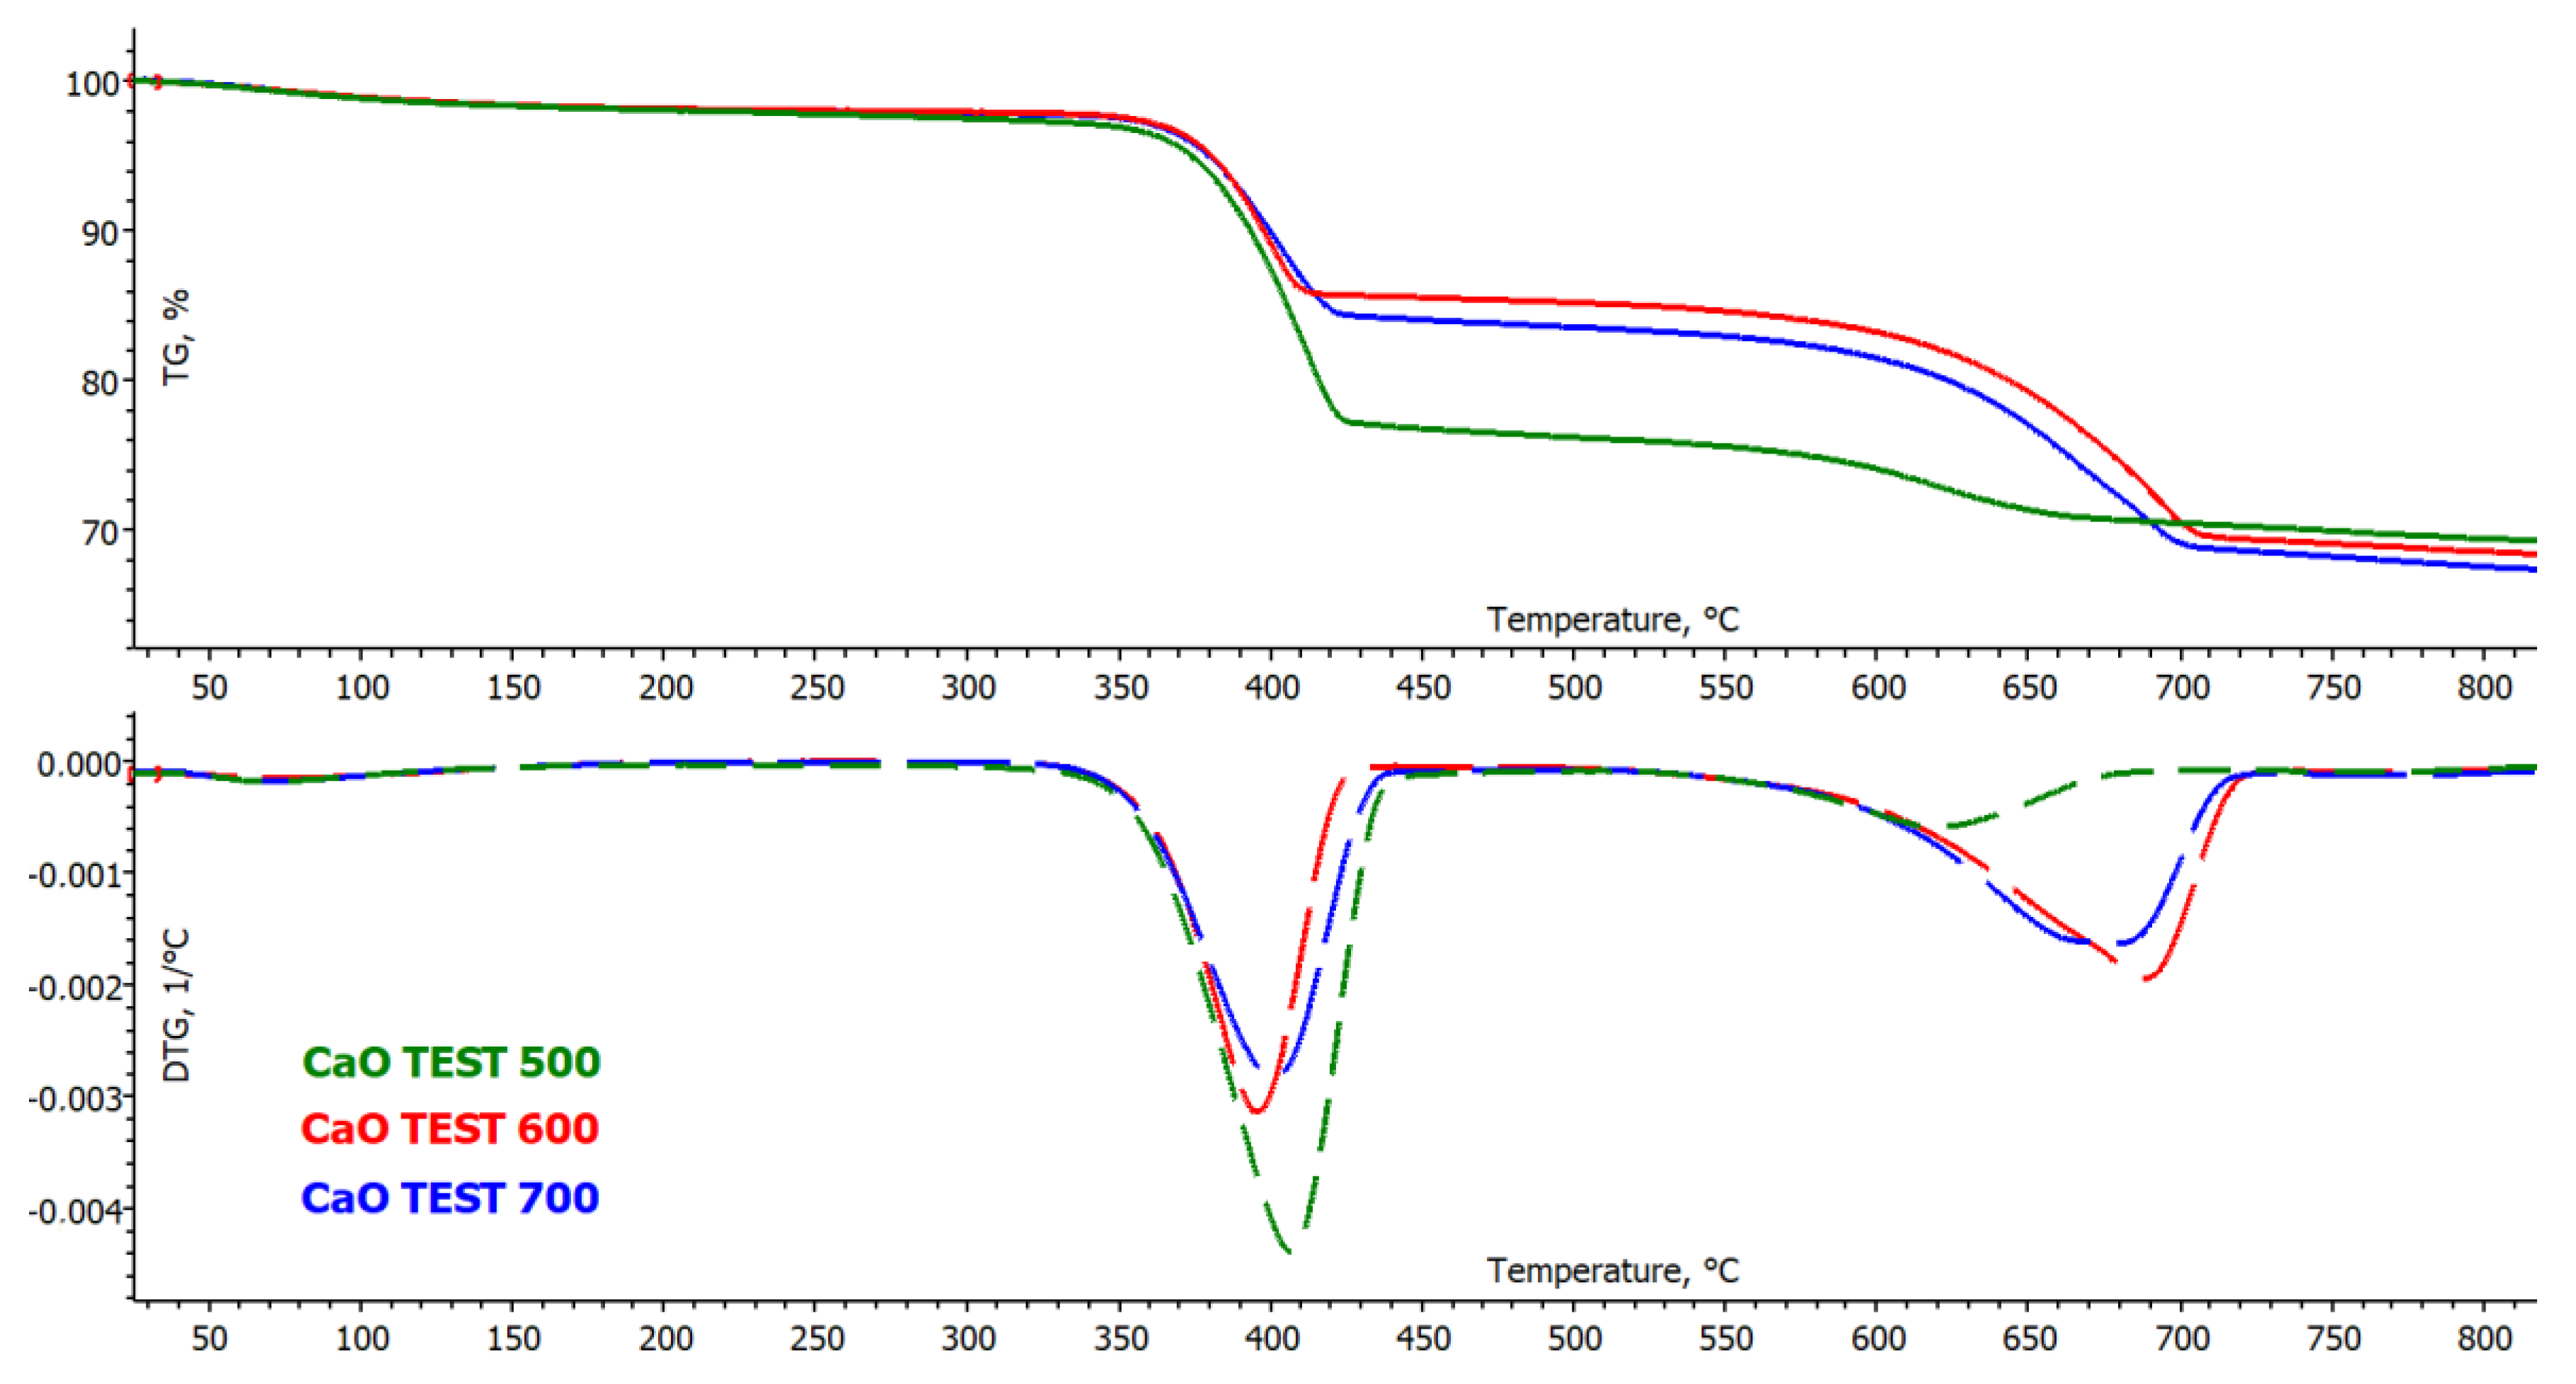
Based on the TG and DTG curves, the changes in the thermal decomposition temperature after the processes of calcium carbonate synthesis during the capture of CO2 from syngas for each studied temperature (500, 600 and 700 °C) can be determined. For the TG and DTG curves, two peaks corresponding to the same temperature can be noticed; these results show that the decomposition temperature of calcium carbonate was around 700 °C, and according to the literature data, the CaCO3 decomposition temperature is 825 °C [40]. However, the first peak corresponds to the decomposition of Ca(OH)2, which could be formed from moisture contained in the biomass [41]. For sorbent obtained after the pyrolysis process at a temperature 500 °C, the second peak is the lowest compared to the two others. This is related to the fact that, during this process the lowest amount of CO2 was captured in sorbent, which is also reflected in the gaseous products analysis (see Section 3.3).
At the first peak of the DTG and TG curves, the temperature range of 350–550 °C corresponds to Ca(OH)2 decomposition; however, the second peak from 550–950 °C is related to the decomposition of CaCO3. The dehydration (Equation (6)) and calcination (Equation (7)) reactions occur as follows [42]:
Ca(OH)2 → CaO + H2O
CaCO3 → CaO + CO2
3.2.2. Scanning Electron Microscope Analysis of Sorbent (CaO)
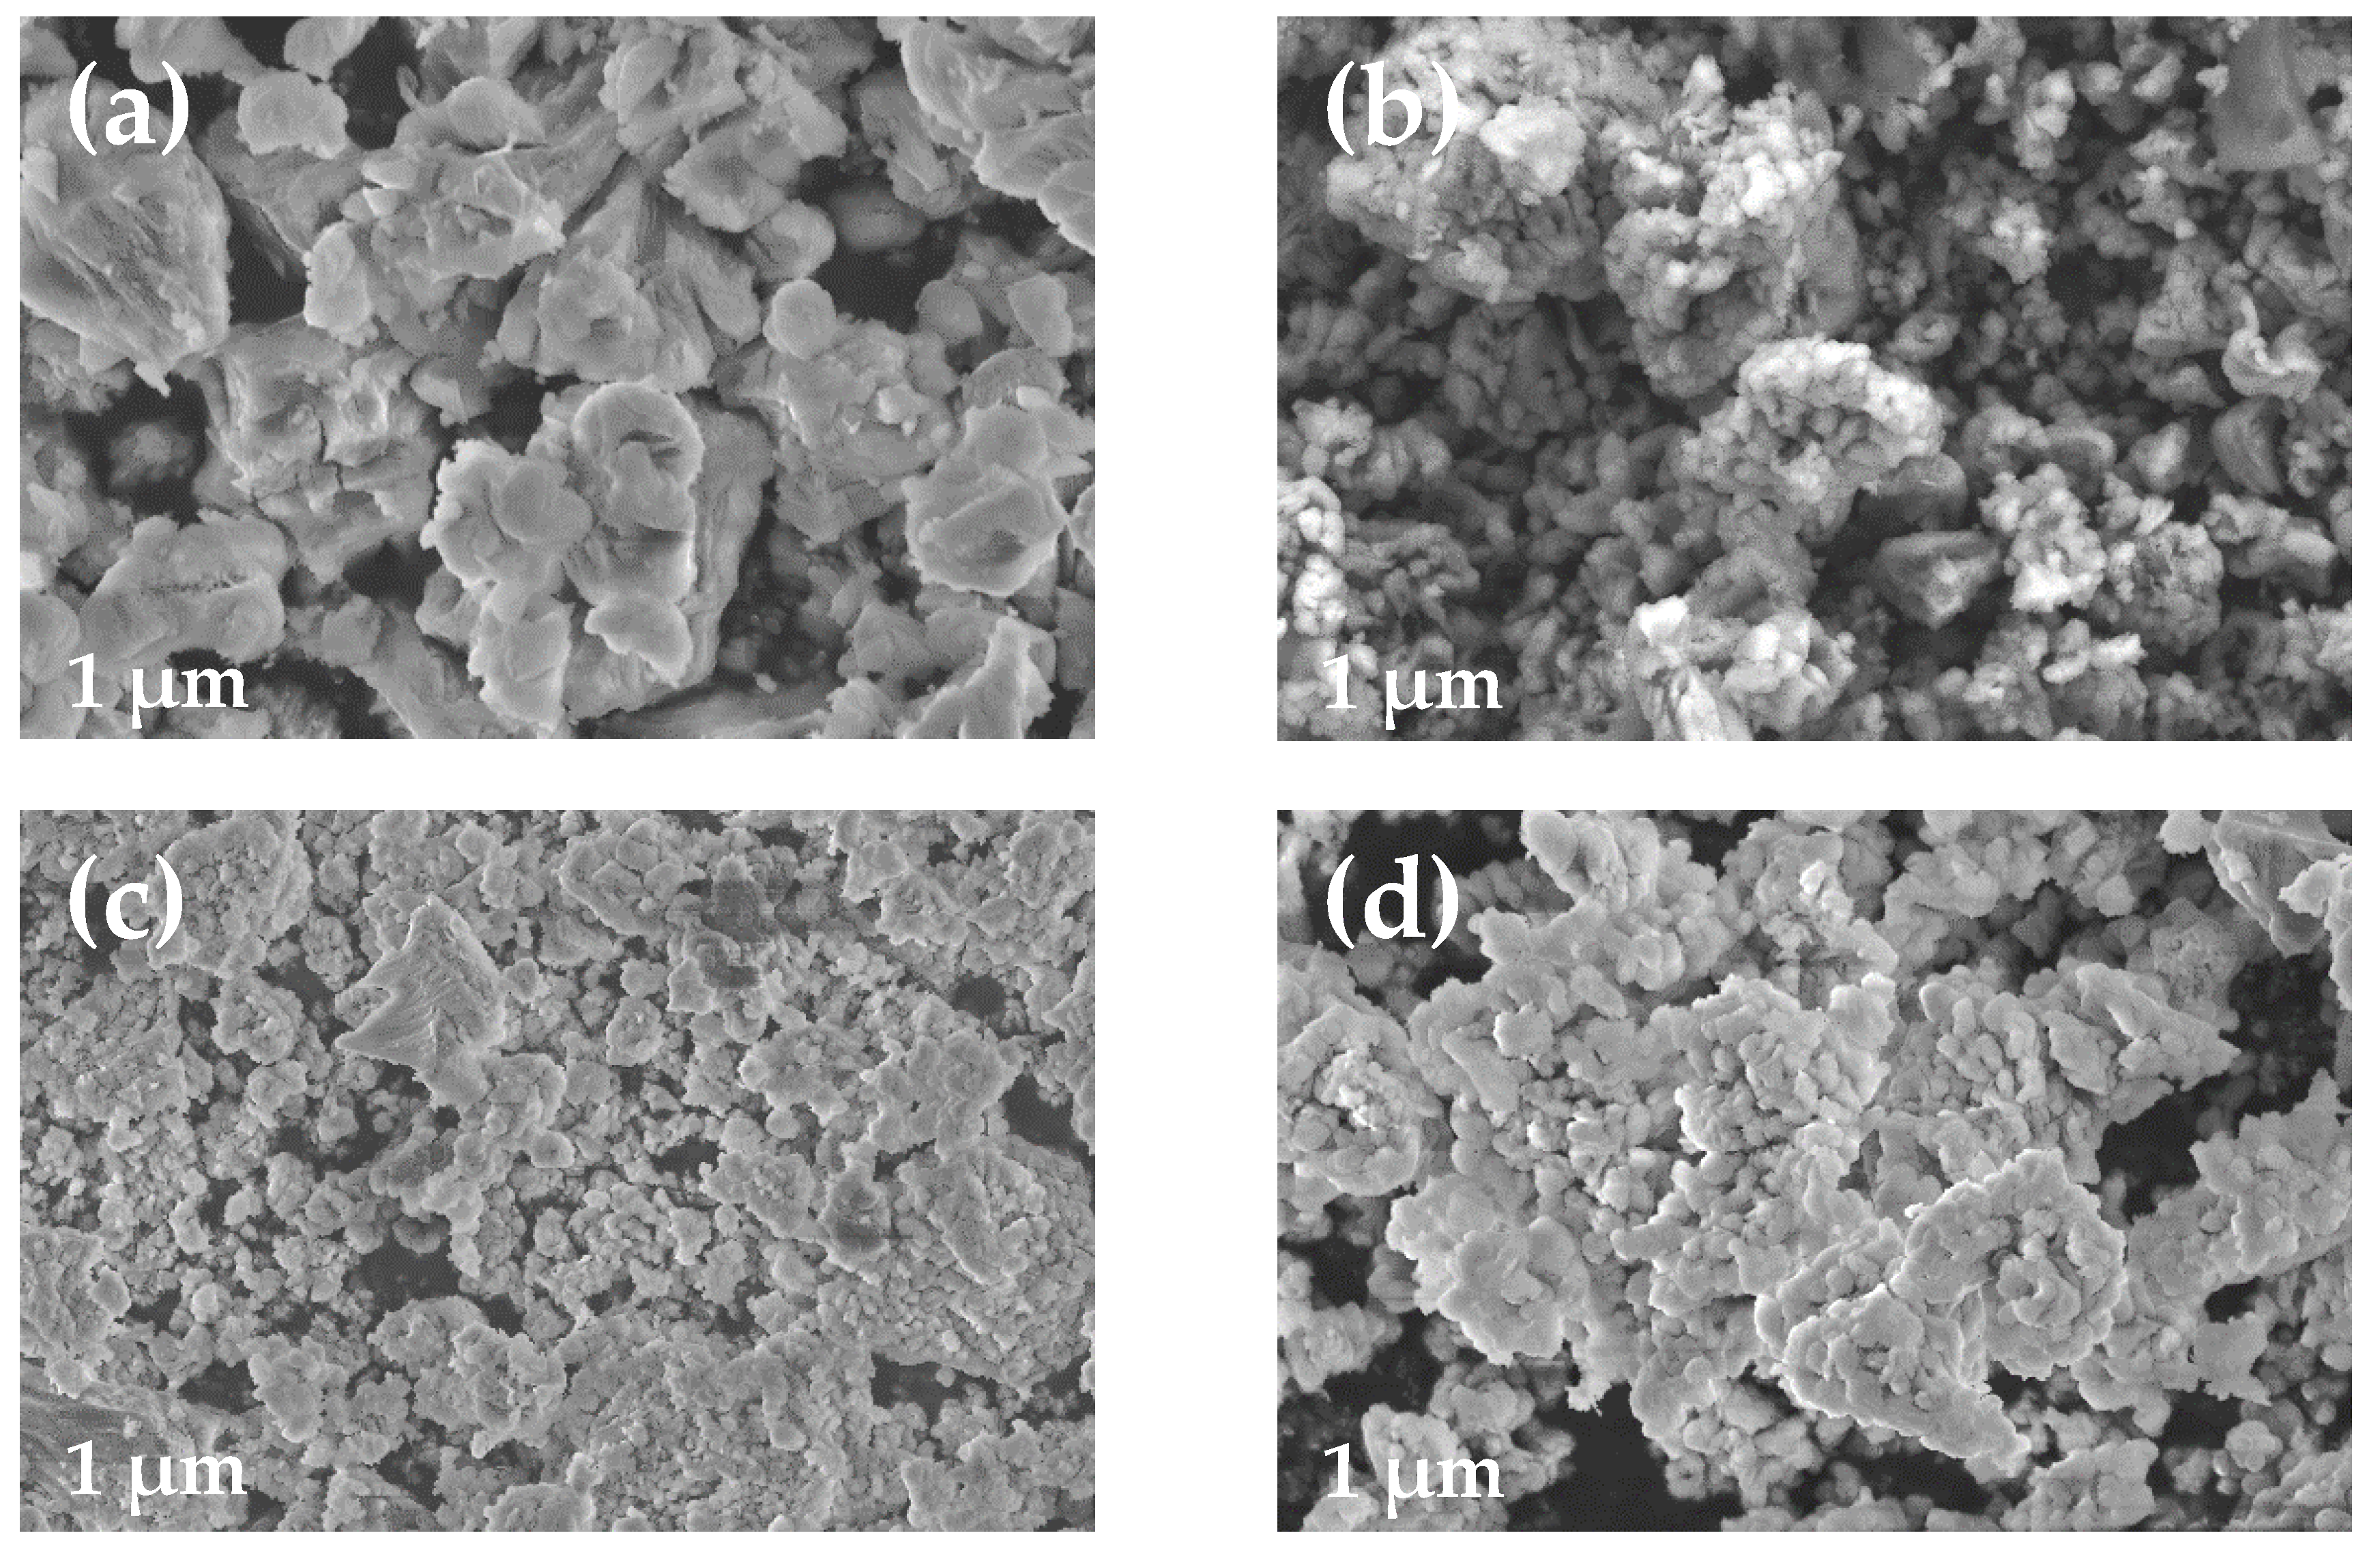
SEM analysis was provided to identify the morphology of the sorbent—calcium oxide (CaO)—used in the pyrolysis process, conducted under temperatures of 500, 600 and 700 °C, and compare it to fresh material CaO. The results of the analysis are presented in Figure 11. During the pyrolysis process, the sorbent captured carbon dioxide (CO2) from produced gas as well as the moisture from biomass. This phenomenon led to the formation of the chemical compounds of CaCO3 from capturing CO2 and Ca(OH)2 from capturing H2O, which were additionally detected in the sorbent after the process. It can be seen in Figure 11 that the pore structure was affected by the pyrolysis process. The sorbent has a granular appearance after the capture of CO2, and it becomes spongier and presents more slit-like pores. Moreover, it can be observed that the surface area of the sorbent becomes finer with increased process temperature.
3.2.3. X-ray Diffraction Analysis of Sorbent (CaO)
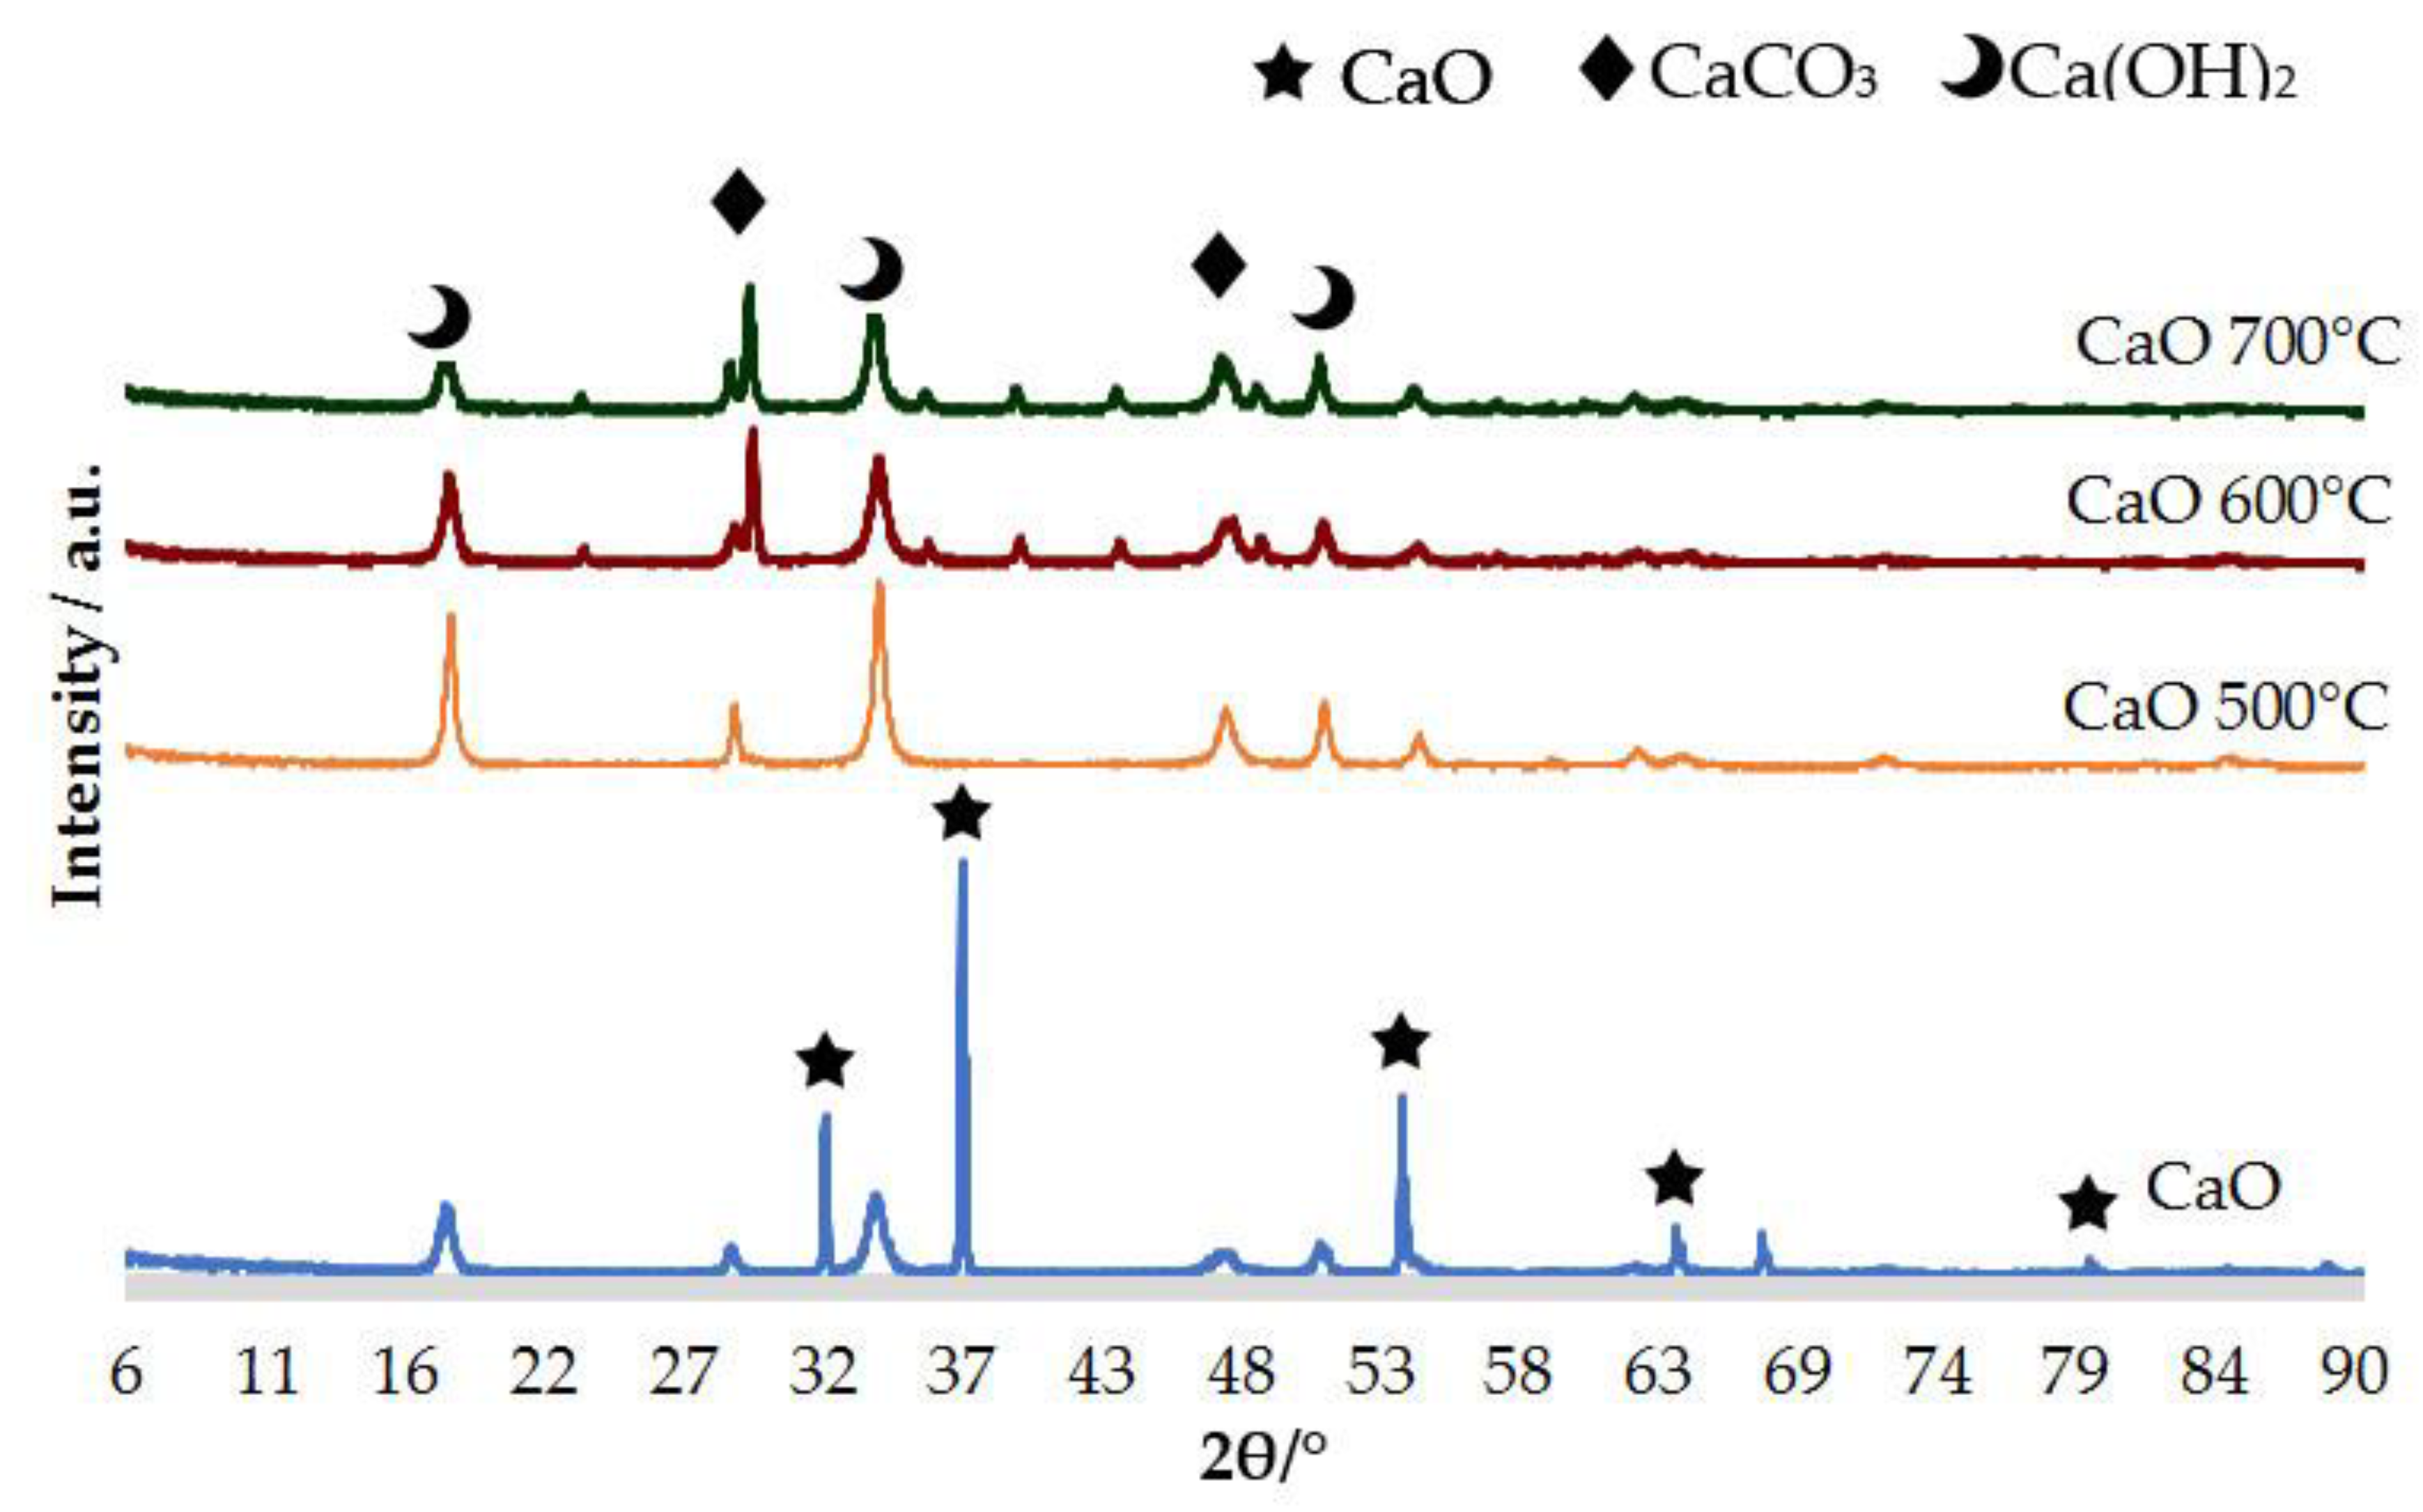
XRD patterns are shown in Figure 12 and present the results of the analysis pf fresh sorbent (CaO) and sorbent after the pyrolysis process (CaO 500 °C, CaO 600 °C, CaO 700 °C). Based on the obtained results, it can be concluded that the major components formed in the sorbent after the pyrolysis process are, as expected, CaCO3 and Ca(OH)2. The diffraction peaks presented in the CaO plot, in Figure 10, correspond to a CaO chemical compound. CaO characteristic peaks correspond to the following 2θ values: 32.23°, 37.37°, 53.89°, 64.18° and 79.92°. CaCO3 is detected at 2θ: 28.91° and 47.19°. Ca(OH)2 is observed at 2θ values: 18.15°, 34.26° and 50.90°. XRD results and characteristic peaks were compared to the database of Raman spectra, X-ray diffraction and chemistry data for minerals available in [43]. Ca(OH)2 peaks were detected because of the reaction of the sorbent with the moisture contained in biomass during the pyrolysis process. This reaction occurs as follows:
CaO + H2O → Ca(OH)2
3.3. Gaseous Pyrolysis Products
The analysis of obtained gaseous products from the pyrolysis process for two options—without CO2 capture and with CO2 capture—was conducted using CaO as a sorbent. The analysis was conducted using gas chromatography (GC) to detect the concentrations of CO, CO2, CH4, H2 and higher hydrocarbons such as C2H4, C2H6, C3H6 and C3H8. The yield of syngas was calculated based on the results determined by the external standard method with comparison to standard gas.
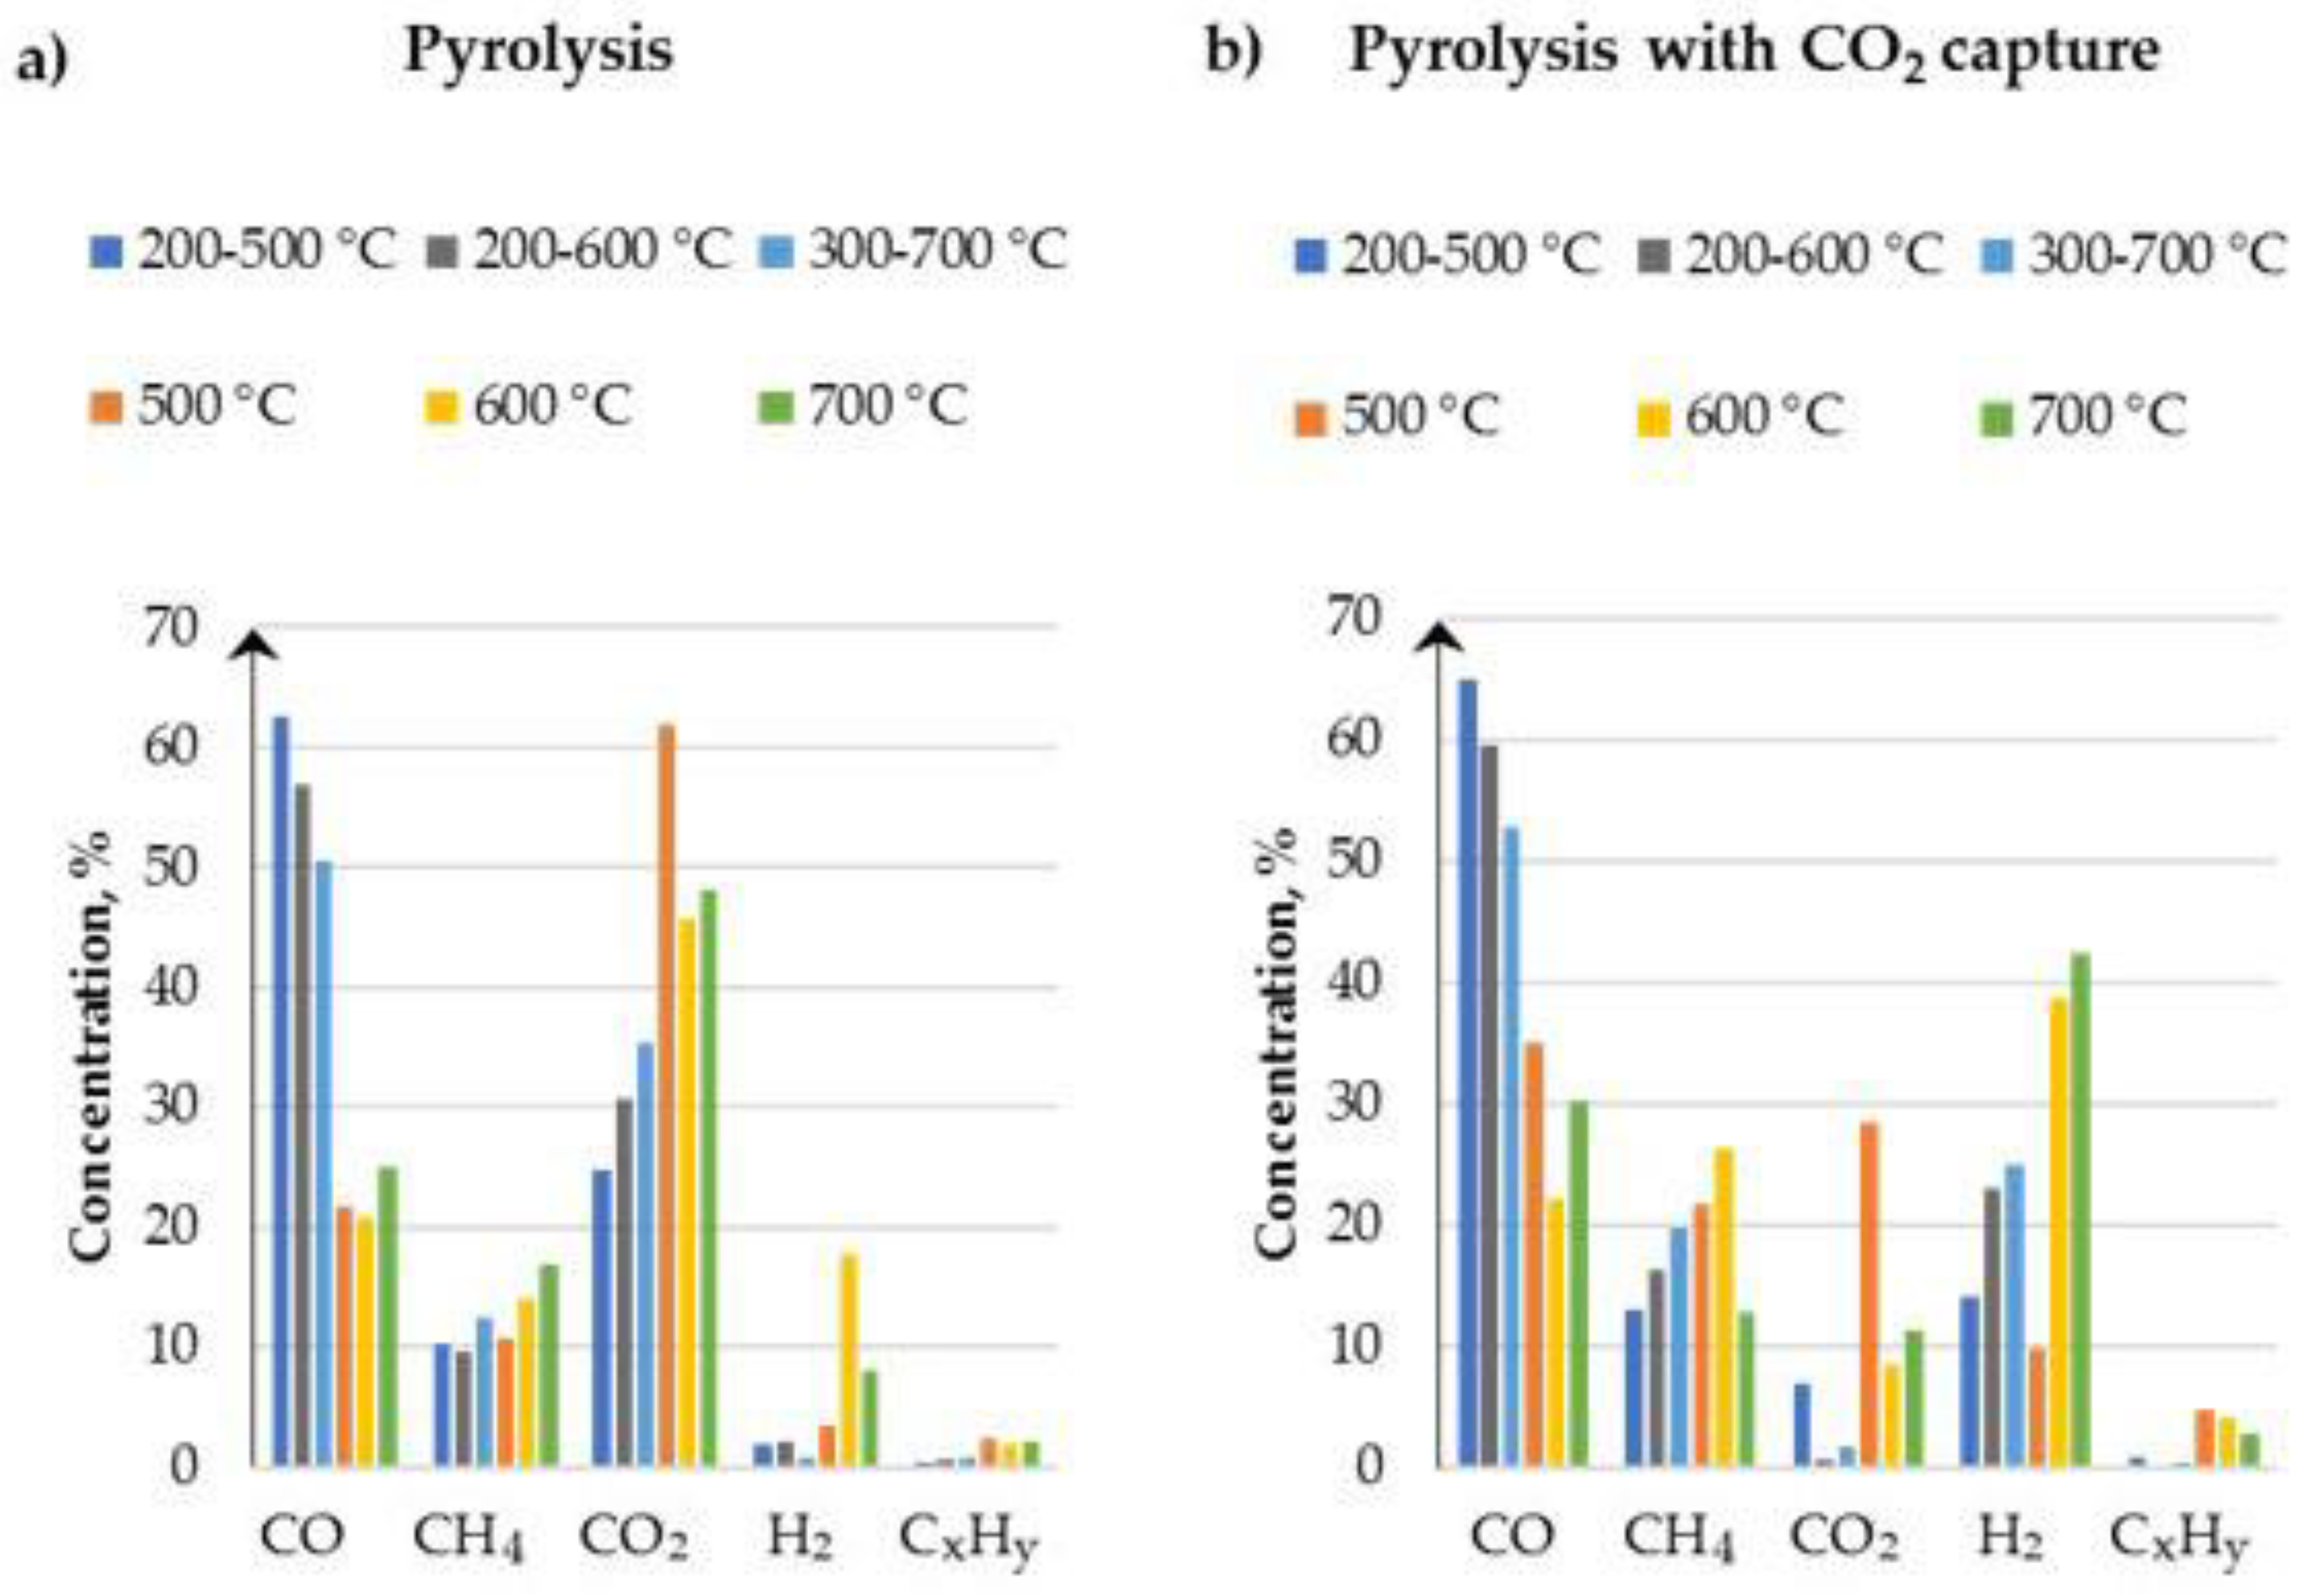
The correlation of chemical gas composition with the process temperature is presented in Figure 13. In the case of pyrolysis in the presence of sorbent, a rapid decrease of the CO2 amount was observed. This figure clearly reveals a significant modification of gas composition in correlation to temperature and sorbent presence. The highest hydrogen content was achieved with sorbent addition and an increase with temperature at a level of 42%; in comparison, for the same temperature but without sorbent, it was around 8%. This observation proves the additional catalytic properties of CaO sorbent [44]. The most significant change occurred in the case of CO2 concentration with and without CaO addition. At a temperature of 700 °C, its concentration decreased from almost 50% to 11%. This is related to the process of CO2 capture (Equation (5)). It would be expected that the concentration of CO2 in the gaseous phase would decrease with the temperature increase; however, a temperature above 600 °C is specific for the decomposition of the mineral phase contained in the biomass ash [45]. Because of that, it can be seen in Figure 13 that the CO2 concentration decreases at a temperature of 600 °C and increases once again at a temperature of 700 °C because of the decomposition of carbonates contained in the mineral phase.
In Figure 13a, a peak of H2 concentration at a temperature of 600 °C appeared. This phenomenon is related to the reactions of dehydrogenation, polymerization and aromatization, among others, which occur at a temperature of 600 °C. This process temperature also promotes other reactions [46]:
CO2 + 4H2 → CH4 + 2H2O
CO + 3H2 → CH4 + H2O
The influence of a pyrolysis process temperature of 600 °C is presented in Figure 13b, where the methane concentration rapidly increases with decreasing amounts of CO and CO2, compared to other process temperature results. This proves that CO2 and CO were used as reaction substrates for generating CH4 [46].
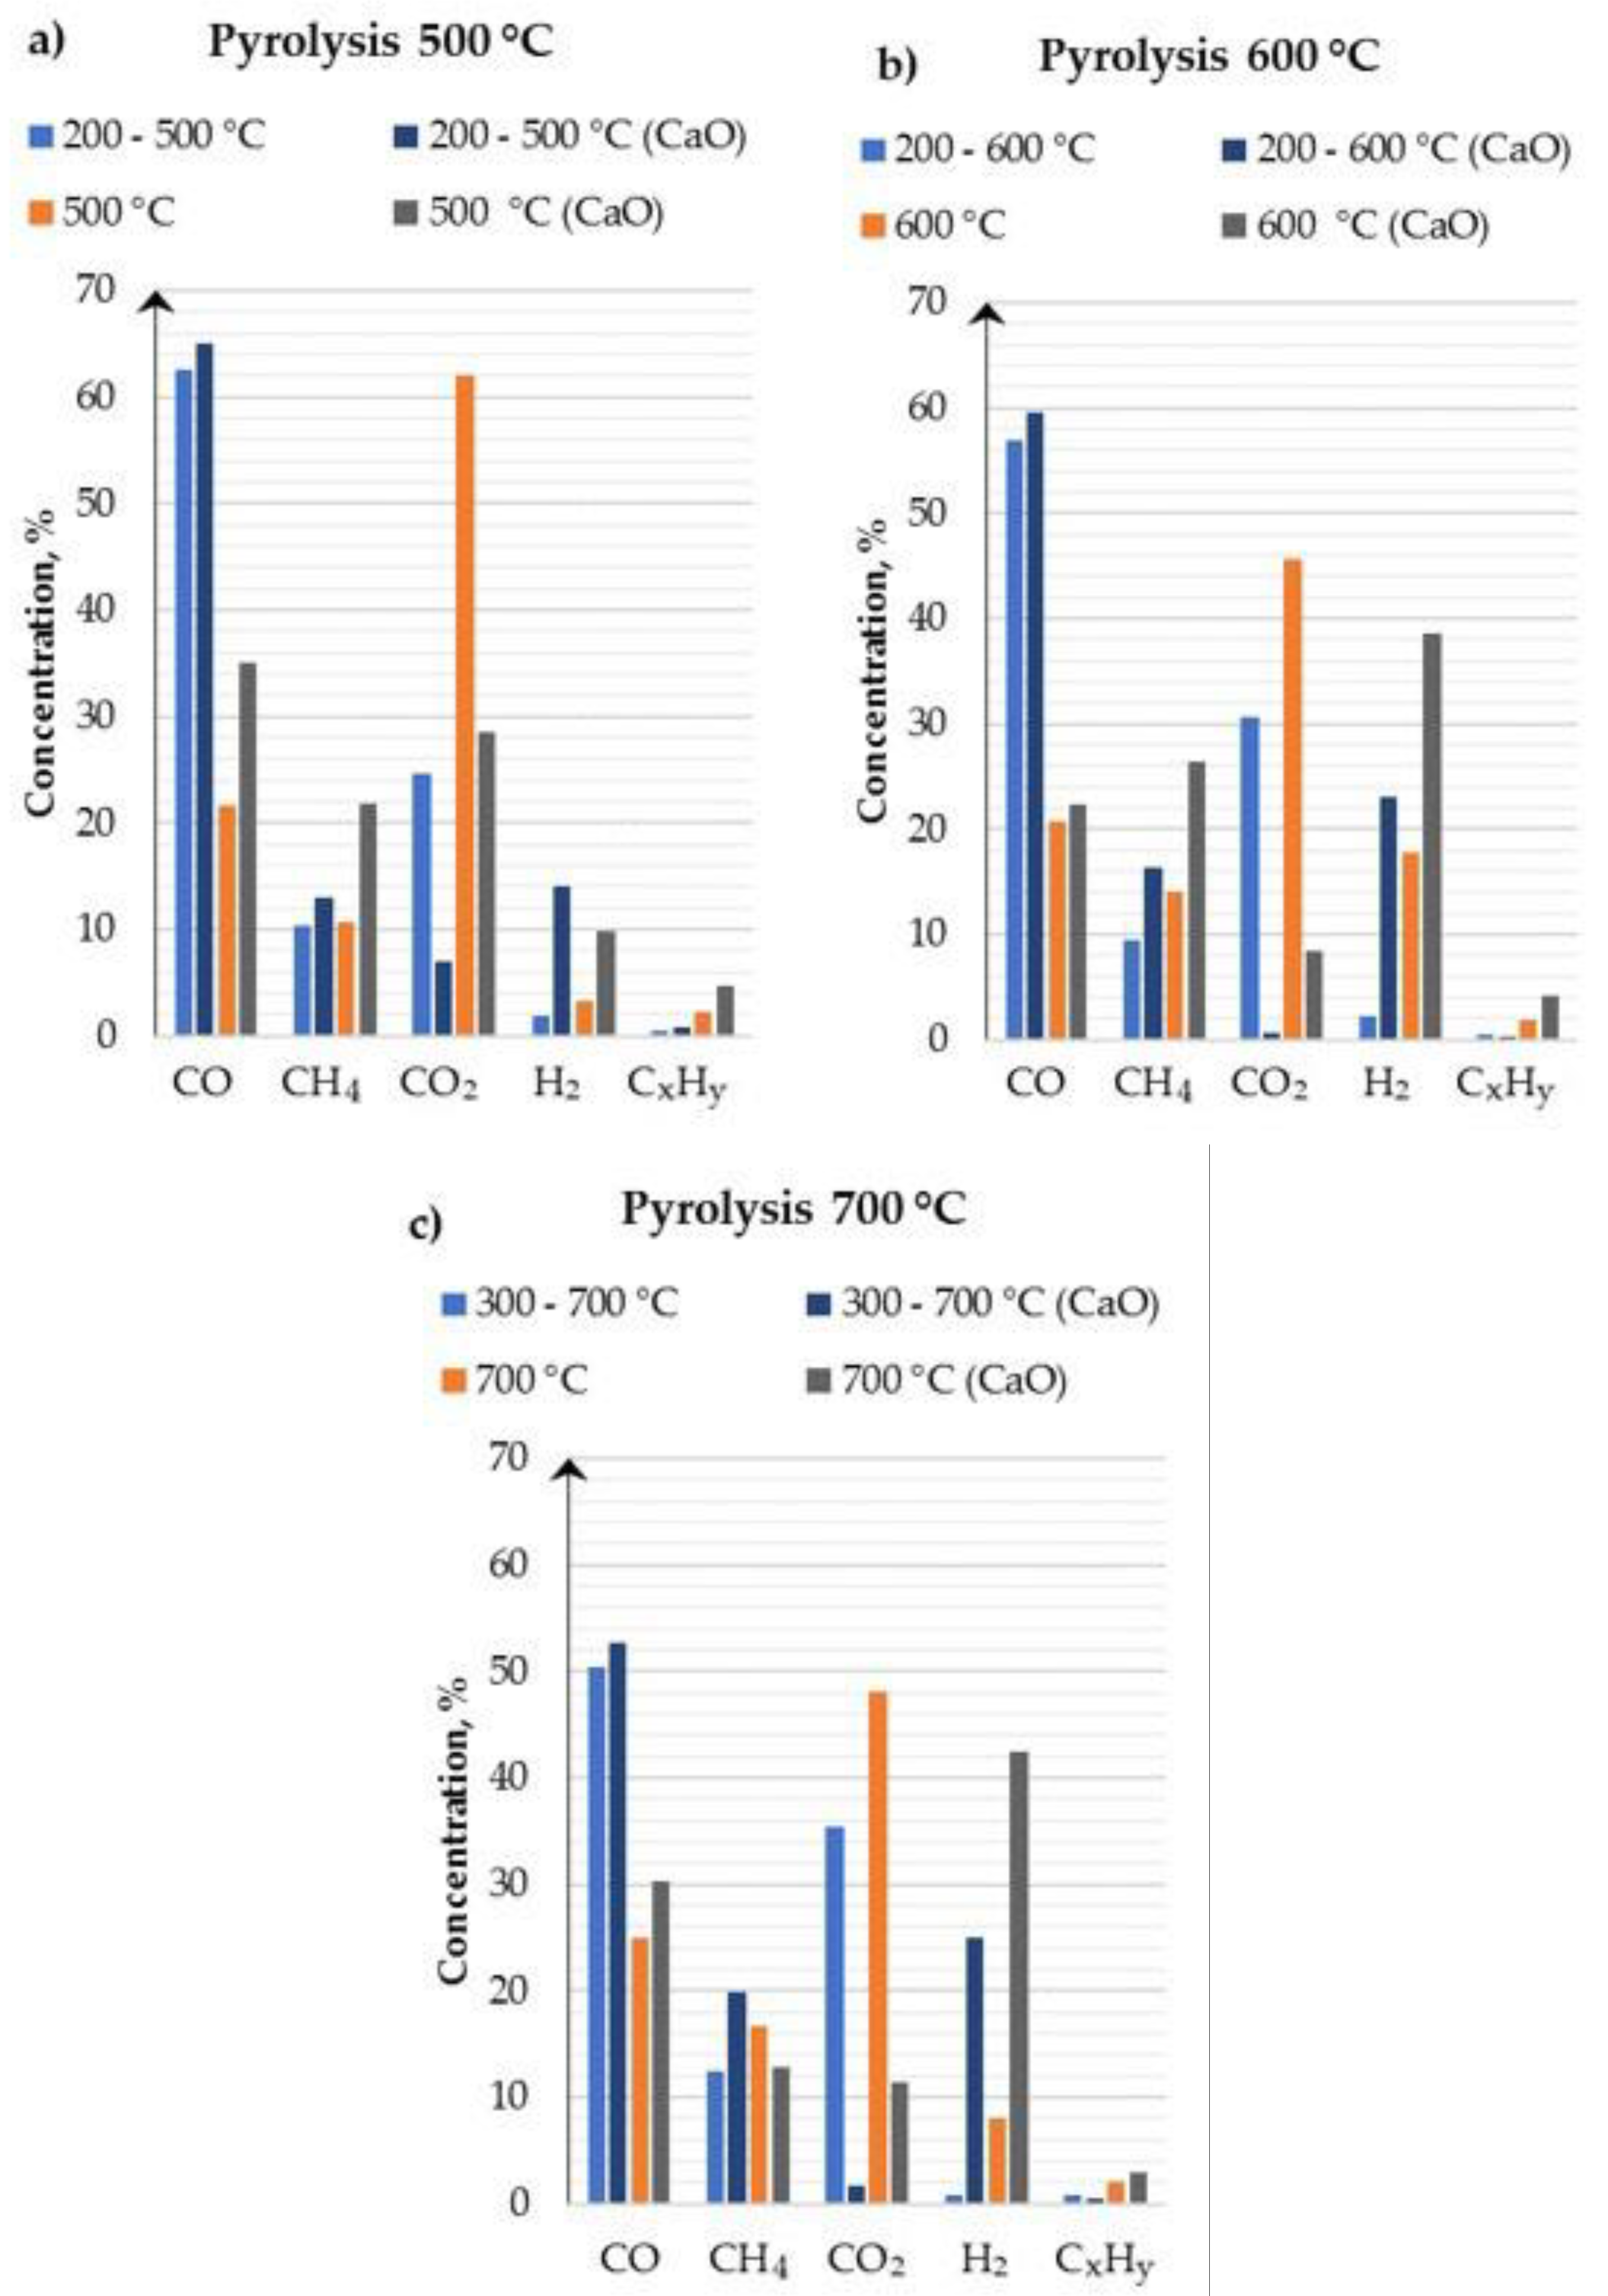
Figure 14 presents the changes of the chemical composition of syngas during the pyrolysis process. At 600 °C, the syngas mainly consists of CO, CH4, CO2, H2 and CxHy. Additionally, the comparison of gas composition at different temperatures with and without CaO layer is presented. The amount of CO2 decreased once the sorbent was used for the pyrolysis process. Additionally, CH4 and H2 contents significantly increased in all studied cases, which was caused by the specifics of the pyrolysis process itself, which promotes hydrogen formation as well as the capture of CO2 by the sorbent (CaO).
4. Conclusions
In this study, a novel approach for syngas production from biomass with parallel biochar production and negative carbon emission was proposed. The conducted research allowed us to predict the most effective pyrolysis process conditions to obtain the highest yield of syngas and biochar. The following conclusions can be drawn:
- The solid phase (biochar) obtained during the pyrolysis process is a valuable energy carrier with good combustion properties of a high carbon content and lower VM in comparison to the raw biomass. The analysis of studied temperature range allowed us to conclude that a temperature increase leads to the production of biochar with a higher carbon content and lower VM, as the gaseous phase of biomass was processed and converted into syngas. Biochar mimics the properties of coal. Its high carbon content enables an effective combustion process, which is also reflected in the calculated main combustion parameters.
- The pyrolysis process temperature directly influences the syngas as well as biochar composition. With the increase of process temperature, higher hydrogen and methane concentrations are obtained. However, concentrations of higher hydrocarbons, such as C2H4, C2H6, C3H6 and C3H8, decrease. These concentration changes are caused by the promotion of carbon and hydrogen contained in the biomass which are processed into pure hydrogen and methane forms.
- The addition of a sorbent such as CaO for CO2 capture improves the final gas composition. The presence of sorbent allows the capture of carbon dioxide from produced syngas. As the process temperature increases, the concentration of CO2 in syngas decreases. The conducted tests and analysis prove the ability of capturing the CO2 released during the pyrolysis process and transforming it into a carbonate phase by CaO. The processes of tar cracking are promoted by the presence of CaO with parallel removal of CO2 and lead to an increase in H2 production.
Author Contributions
Formal analysis, M.S., C.Q., A.M.-M. and A.M.; Investigation, M.S., C.Q. and A.M.-M.; Methodology, N.G.; Project administration, N.G. and A.M.; Supervision, N.G. and A.M.; Writing—original draft, M.S. and A.M.-M.; Writing—review & editing, N.G. and A.M. All authors have read and agreed to the published version of the manuscript.
Funding
This project has received funding from the European Union’s Horizon 2020 research and innovation programme under the Marie Skłodowska-Curie grant agreement No 823745, the Key Program for China–EU International Cooperation in Science and Technology Innovation (No. 2018YFE0117300), Shaanxi Provincial Natural Science Foundation Research Program-Shaanxi Coal Joint Funding (2019JLZ-12).
Acknowledgments
Many thanks to the technicians in the Analytical and Testing Center of Xi’an Jiaotong University.
Conflicts of Interest
The authors declare no conflict of interest. The funders had no role in the design of the study; in the collection, analyses, or interpretation of data; in the writing of the manuscript, or in the decision to publish the results.
References
- Zheng, X.; Streimikiene, D.; Balezentis, T.; Mardani, A.; Cavallaro, F.; Liao, H. A review of greenhouse gas emission profiles, dynamics, and climate change mitigation efforts across the key climate change players. J. Clean. Prod. 2019, 234, 1113–1133. [Google Scholar] [CrossRef]
- European Commission, Communication from the commission to the European Parliament, the Council, the European Economic and Social Committee and the Committee of the Regions Energy Roadmap 2050. Available online: https://eur-lex.europa.eu/legal-content/EN/ALL/?uri=CELEX%3A52011DC0885 (accessed on 26 February 2020).
- Climate Transparency. Brown to Green: The G20 Transition towards a Net-zero Emissions Economy 2019. Available online: https://www.odi.org/publications/11501-brown-green-g20-transition-towards-net-zero-emissions-economy-2019 (accessed on 26 February 2020).
- Bel, G.; Joseph, S. Climate change mitigation and the role of technological change: Impact on selected headline targets of Europe’s 2020 climate and energy package. Renew. Sustain. Energy Rev. 2018, 82, 3798–3807. [Google Scholar] [CrossRef] [Green Version]
- Connolly, D.; Lund, H.; Mathiesen, B.V. Smart Energy Europe: The technical and economic impact of one potential 100% renewable energy scenario for the European Union. Renew. Sustain. Energy Rev. 2016, 60, 1634–1653. [Google Scholar] [CrossRef]
- Patel, M.; Zhang, X.; Kumar, A. Techno-economic and life cycle assessment on lignocellulosic biomass thermochemical conversion technologies: A review. Renew. Sustain. Energy Rev. 2016, 53, 1486–1499. [Google Scholar] [CrossRef]
- Magdziarz, A.; Wilk, M.; Wądrzyk, M. Pyrolysis of hydrochar derived from biomass—Experimental investigation. Fuel 2020, 267, 117246. [Google Scholar] [CrossRef]
- Dayton, D.C.; Foust, T.D. Chapter Two—Biomass Characterization. Analytical Methods for Biomass Characterization and Conversion. Emerging Issues in Analytical Chemistry 2020. pp. 19–35. Available online: https://0-www-sciencedirect-com.brum.beds.ac.uk/book/9780128156056/analytical-methods-for-biomass-characterization-and-conversion (accessed on 26 February 2020).
- Kumar, A.; Jones, D.D.; Hanna, M.A. Thermochemical biomass gasification: A review of the current status of the technology. Energies 2009, 2, 556. [Google Scholar] [CrossRef] [Green Version]
- World Biomass Association, Global Biomass Potential Towards 2035. Available online: https://worldbioenergy.org/uploads/Factsheet_Biomass potential.pdf (accessed on 26 February 2020).
- Osman, A.I.; Abdelkader, A.; Farrell, C.; Rooney, D.; Morgan, K. Reusing, recycling and up-cycling of biomass: A review of practical and kinetic modelling approaches. Fuel Process. Technol. 2019, 192, 179–202. [Google Scholar] [CrossRef]
- Ren, J.; Liu, Y.L.; Zhao, X.Y.; Cao, J.P. Biomass thermochemical conversion: A review on tar elimination from biomass catalytic gasification. J. Energy Inst. 2019. [Google Scholar] [CrossRef]
- Mlonka-Mędrala, A.; Magdziarz, A.; Dziok, T.; Sieradzka, M.; Nowak, W. Laboratory studies on the influence of biomass particle size on pyrolysis and combustion using TG GC/MS. Fuel 2019, 252, 635–645. [Google Scholar] [CrossRef]
- Da Silva, C.M.S.; Carneiro, A.D.C.O.; Vital, B.R.; Figueiró, C.G.; de Fialho, L.F.; de Magalhães, M.A.; Carvalho, A.G.; Cândido, W.L. Biomass torrefaction for energy purposes—Definitions and an overview of challenges and opportunities in Brazil. Renew. Sustain. Energy Rev. 2018, 82, 2426–2432. [Google Scholar] [CrossRef]
- Shah, S.A.A.; Zhou, P.; Walasai, G.D.; Mohsin, M. Energy security and environmental sustainability index of South Asian countries: A composite index approach. Ecol. Indic. 2019, 106, 105507. [Google Scholar] [CrossRef]
- Wang, Z. Does biomass energy consumption help to control environmental pollution? Evidence from BRICS countries. Sci. Total Environ. 2019, 670, 1075–1083. [Google Scholar]
- Basu, P. Biomass Gasification, Pyrolysis and Torrefaction. 2018. Available online: https://0-www-sciencedirect-com.brum.beds.ac.uk/book/9780128129920/biomass-gasification-pyrolysis-and-torrefaction (accessed on 26 February 2020).
- JCR for the European Commission’s Knowledge Centre for Bioeconomy. Brief on Biomass for Energy in the European Union. 2019. Available online: https://ec.europa.eu/jrc/en/publication/brief-biomass-energy-european-union (accessed on 26 February 2020).
- Zhang, P.; Zhang, X.; Li, Y.; Han, L. Influence of pyrolysis temperature on chemical speciation, leaching ability, and environmental risk of heavy metals in biochar derived from cow manure. Bioresour. Technol. 2020, 302, 122850. [Google Scholar] [CrossRef] [PubMed]
- Quan, C.; Gao, N.; Song, Q. Pyrolysis of biomass components in a TGA and a fixed-bed reactor: Thermochemical behaviors, kinetics, and product characterization. J. Anal. Appl. Pyrolysis 2016, 121, 84–92. [Google Scholar] [CrossRef]
- Sobek, S.; Werle, S. Kinetic modelling of waste wood devolatilization during pyrolysis based on thermogravimetric data and solar pyrolysis reactor performance. Fuel 2020, 261, 116459. [Google Scholar] [CrossRef]
- Joardder, M.U.H.; Halder, P.K.; Rahim, M.A.; Masud, M.H. Solar Pyrolysis: Converting Waste into Asset Using Solar Energy. Clean Energy for Sustainable Development: Comparisons and Contrasts of New Approaches. 2017, pp. 213–235. Available online: https://eprints.qut.edu.au/174157/ (accessed on 26 February 2020).
- Rony, A.H.; Kong, L.; Lu, W.; Dejam, M.; Adidharma, H.; Gasem, K.A.M.; Zheng, Y.; Norton, U.; Fan, M. Kinetics, thermodynamics, and physical characterization of corn stover (Zea mays) for solar biomass pyrolysis potential analysis. Bioresour. Technol. 2019, 284, 466–473. [Google Scholar] [CrossRef]
- Sobek, S.; Werle, S. Solar pyrolysis of waste biomass: Part 1 reactor design. Renew. Energy 2019, 143, 1939–1948. [Google Scholar] [CrossRef]
- Tran, K.-Q.; Werle, S.; Trinh, T.T.; Magdziarz, A.; Sobek, S.; Pogrzeba, M. Fuel characterization and thermal degradation kinetics of biomass from phytoremediation plants. Biomass Bioenergy 2020, 134, 105469. [Google Scholar] [CrossRef]
- Uzun, H.; Yıldız, Z.; Goldfarb, J.L.; Ceylan, S. Improved prediction of higher heating value of biomass using an artificial neural network model based on proximate analysis. Bioresour. Technol. 2017, 234, 122–130. [Google Scholar] [CrossRef]
- García, R.; Pizarro, C.; Lavín, A.G.; Bueno, J.L. Biomass proximate analysis using thermogravimetry. Bioresour. Technol. 2013, 139, 1–4. [Google Scholar] [CrossRef]
- Erol, M.; Haykiri-Acma, H.; Küçükbayrak, S. Calorific value estimation of biomass from their proximate analyses data. Renew. Energy 2010, 35, 170–173. [Google Scholar] [CrossRef]
- Parikh, J.; Channiwala, S.A.; Ghosal, G.K. A correlation for calculating HHV from proximate analysis of solid fuels. Fuel 2005, 84, 487–494. [Google Scholar] [CrossRef]
- Toscan, A.; Morais, A.R.C.; Paixão, S.M.; Alves, L.; Andreaus, J.; Camassola, M.; Dillon, A.J.P.; Lukasik, R.M. High-pressure carbon dioxide/water pre-treatment of sugarcane bagasse and elephant grass: Assessment of the effect of biomass composition on process efficiency. Bioresour. Technol. 2017, 224, 639–647. [Google Scholar] [CrossRef] [PubMed]
- Ronsse, F.; Nachenius, R.W.; Wolter, P. Carbonization of Biomass. Recent Advances in Thermo-Chemical Conversion of Biomass. 2015, pp. 293–324. Available online: https://0-www-sciencedirect-com.brum.beds.ac.uk/book/9780444632890/recent-advances-in-thermochemical-conversion-of-biomass (accessed on 26 February 2020).
- Chen, W.H.; Peng, J.; Bi, X.T. A state-of-the-art review of biomass torrefaction, densification and applications. Renew. Sustain. Energy Rev. 2015, 44, 847–866. [Google Scholar] [CrossRef]
- Mureddu, M.; Dessì, F.; Orsini, A.; Ferrara, F.; Pettinau, A. Air- and oxygen-blown characterization of coal and biomass by thermogravimetric analysis. Fuel 2018, 212, 626–637. [Google Scholar] [CrossRef]
- Parshetti, G.K.; Kent Hoekman, S.; Balasubramanian, R. Chemical, structural and combustion characteristics of carbonaceous products obtained by hydrothermal carbonization of palm empty fruit bunches. Bioresour. Technol. 2013, 135, 683–689. [Google Scholar] [CrossRef]
- Lin, Y.; Ma, X.; Ning, X.; Yu, Z. TGA-FTIR analysis of co-combustion characteristics of paper sludge and oil-palm solid wastes. Energy Convers. Manag. 2015, 89, 727–734. [Google Scholar] [CrossRef]
- Lin, Y.; Ma, X.; Peng, X.; Hu, S.; Yu, Z.; Fang, S. Effect of hydrothermal carbonization temperature on combustion behavior of hydrochar fuel from paper sludge. Appl. Therm. Eng. 2015, 91, 574–582. [Google Scholar] [CrossRef]
- He, C.; Giannis, A.; Wang, J.Y. Conversion of sewage sludge to clean solid fuel using hydrothermal carbonization: Hydrochar fuel characteristics and combustion behavior. Appl. Energy 2013, 111, 257–266. [Google Scholar] [CrossRef]
- Naderi, M. Surface Area: Brunauer-Emmett-Teller (BET). Progress in Filtration and Separation. 2015, pp. 585–608. Available online: https://0-www-sciencedirect-com.brum.beds.ac.uk/science/article/pii/B9780123847461000148 (accessed on 26 February 2020).
- Zhang, S.; Su, Y.; Xiong, Y.; Zhang, H. Physicochemical structure and reactivity of char from torrefied rice husk: Effects of inorganic species and torrefaction temperature. Fuel 2020, 262, 116667. [Google Scholar] [CrossRef]
- Zbiorowa, P. Poradnik Fizykochemiczny (Physicochemical Guide, in Polish); Wydawnictwa Naukowo-Techniczne: Warszawa, Poland, 1974. [Google Scholar]
- Lee, S.W.; Kim, Y.J.; Lee, Y.H.; Guim, H.; Han, S.M. Behavior and characteristics of amorphous calcium carbonate and calcite using CaCO3 film synthesis. Mater. Des. 2016, 112, 367–373. [Google Scholar] [CrossRef]
- Jerzak, W.; Murzyn, P.; Kuźnia, M.; Magiera, A. Trace elements retention in bottom ashes during coal combustion with hydrated lime additions. Energy Sources Part A Recover. Util. Environ. Eff. 2019. [Google Scholar] [CrossRef]
- RRUFF. Available online: http://rruff.info/ (accessed on 26 February 2020).
- Zheng, Y.; Tao, L.; Huang, Y.; Liu, C.; Wang, Z.; Zheng, Z. Improving aromatic hydrocarbon content from catalytic pyrolysis upgrading of biomass on a CaO/HZSM-5 dual-catalyst. J. Anal. Appl. Pyrolysis 2019, 140, 355–366. [Google Scholar] [CrossRef]
- Mlonka-Mędrala, A.; Magdziarz, A.; Gajek, M.; Nowińska, K.; Nowak, W. Alkali metals association in biomass and their impact on ash melting behaviour. Fuel 2020, 261, 116421. [Google Scholar] [CrossRef]
- Lin, J.; Ma, R.; Luo, J.; Sun, S.; Cui, C.; Fang, L.; Huang, H. Microwave pyrolysis of food waste for high-quality syngas production: Positive effects of a CO2 reaction atmosphere and insights into the intrinsic reaction mechanisms. Energy Convers. Manag. 2020, 206, 112490. [Google Scholar] [CrossRef]
Figure 1.
Biomass life cycle.

Figure 2.
The scheme of the fixed-bed vertical reactor and gas analyser.

Figure 3.
Ultimate analysis of chars in comparison to the raw material.

Figure 4.
Van Krevelen chart for raw material and chars obtained at different temperatures.

Figure 5.
Comparison of the combustion and pyrolysis processes of pine sawdust using the thermogravimetric method, with a heating rate of 10 °C/min.
Figure 5.
Comparison of the combustion and pyrolysis processes of pine sawdust using the thermogravimetric method, with a heating rate of 10 °C/min.

Figure 6.
Thermogravimetric (TG), differential thermogravimetric (DTG) and differential scanning calorimetry (DSC) curves presenting combustion process of all obtained chars and raw material.
Figure 6.
Thermogravimetric (TG), differential thermogravimetric (DTG) and differential scanning calorimetry (DSC) curves presenting combustion process of all obtained chars and raw material.

Figure 7.
SEM images for (a) the raw material, (b) char 500 °C, (c) char 600 °C, (d) char 700 °C.

Figure 8.
N2 adsorption isotherms of raw biomass and obtained biochars.

Figure 9.
Pore size distribution calculated from the BJH (Barret, Joyner, and Halend) adsorption branch of raw biomass and obtained biochars.
Figure 9.
Pore size distribution calculated from the BJH (Barret, Joyner, and Halend) adsorption branch of raw biomass and obtained biochars.

Figure 10.
TG and DTG curves presenting the decomposition of CaO after CO2 capture during the pyrolysis process.
Figure 10.
TG and DTG curves presenting the decomposition of CaO after CO2 capture during the pyrolysis process.

Figure 11.
SEM images of (a) CaO before pyrolysis, (b) CaO 500 °C, (c) CaO 600 °C, (d) CaO 700 °C.

Figure 12.
X-ray diffraction (XRD) patterns of fresh and after processes CaO sorbent.

Figure 13.
Syngas composition from the pyrolysis process: (a) without CO2 capture and (b) with CO2 capture.
Figure 13.
Syngas composition from the pyrolysis process: (a) without CO2 capture and (b) with CO2 capture.

Figure 14.
Syngas composition from the pyrolysis process at temperatures of (a) 500 °C, (b) 600 °C and (c) 700 °C.
Figure 14.
Syngas composition from the pyrolysis process at temperatures of (a) 500 °C, (b) 600 °C and (c) 700 °C.


Table 1.
The proximate and ultimate analysis of pine sawdust.
| Proximate analysis ad (wt%) | |||
| Volatile matter | Fixed carbon | Ash | Moisture |
| 82.03 | 13.91 | 1.29 | 2.77 |
| Ultimate analysis (wt%) | |||
| C | H | O a | N |
| 45.84 | 6.44 | 45.84 | 0.17 |
ad Air dried; a by difference (100 − (C + H + M + Ash) = O).
Table 2.
Main combustion parameters of pine sawdust (PSD) and biochars.
| Sample | PSD | Char 500 °C | Char 600 °C | Char 700 °C |
|---|---|---|---|---|
| Tig, °C | 239.8 | 346.6 | 362.4 | 381.8 |
| Tb, °C | 456.5 | 481.3 | 493.9 | 512.6 |
| TDTG, °C | 318.8 | 437.8 | 459.1 | 471.6 |
| (dW/dt)max, wt. %/min | 9.98 | 15.68 | 12.85 | 13.58 |
| (dW/dt)av, wt. %/min | 1.23 | 1.19 | 1.19 | 1.16 |
| tp, min | 28.7 | 39.9 | 42.0 | 43.3 |
| ti, min | 21.1 | 31.4 | 33.0 | 34.9 |
| tf, min | 42.3 | 44.7 | 45.9 | 47.8 |
| Δt1/2, min | 24.1 | 37.3 | 38.4 | 40.2 |
| Di, wt. %/min3 | 0.0165 | 0.0125 | 0.0093 | 0.0090 |
| Df, 10−4 wt. %/min4 | 3.42 | 2.36 | 1.74 | 1.63 |
| S, 10−7 ∙min−2 ∙ °C−3 | 4.67 | 3.24 | 2.35 | 2.11 |
| Hf, °C | 949 | 1506 | 1596 | 1670 |
© 2020 by the authors. Licensee MDPI, Basel, Switzerland. This article is an open access article distributed under the terms and conditions of the Creative Commons Attribution (CC BY) license (http://creativecommons.org/licenses/by/4.0/).
Share and Cite
MDPI and ACS Style
Sieradzka, M.; Gao, N.; Quan, C.; Mlonka-Mędrala, A.; Magdziarz, A. Biomass Thermochemical Conversion via Pyrolysis with Integrated CO2 Capture. Energies 2020, 13, 1050. https://0-doi-org.brum.beds.ac.uk/10.3390/en13051050
AMA Style
Sieradzka M, Gao N, Quan C, Mlonka-Mędrala A, Magdziarz A. Biomass Thermochemical Conversion via Pyrolysis with Integrated CO2 Capture. Energies. 2020; 13(5):1050. https://0-doi-org.brum.beds.ac.uk/10.3390/en13051050
Chicago/Turabian StyleSieradzka, Małgorzata, Ningbo Gao, Cui Quan, Agata Mlonka-Mędrala, and Aneta Magdziarz. 2020. "Biomass Thermochemical Conversion via Pyrolysis with Integrated CO2 Capture" Energies 13, no. 5: 1050. https://0-doi-org.brum.beds.ac.uk/10.3390/en13051050
Note that from the first issue of 2016, this journal uses article numbers instead of page numbers. See further details here.