Experimental Performance of a Solar Air Collector with a Perforated Back Plate in New Zealand


1
School of Built Environment, Massey University, Auckland 0632, New Zealand
2
BRANZ, Porirua 5381, New Zealand
3
Research Centre for Maori Health and Development, Massey University, Wellington 6021, New Zealand
*
Author to whom correspondence should be addressed.
Energies 2020, 13(6), 1415; https://0-doi-org.brum.beds.ac.uk/10.3390/en13061415
Submission received: 2 January 2020
/
Revised: 11 March 2020
/
Accepted: 12 March 2020
/
Published: 18 March 2020
(This article belongs to the Special Issue Solar Thermal Collection and Storage Systems)
Abstract
:This study investigates the thermal efficiency of a solar air heater (SAH), when it was mounted on a custom-made support frame, and was operated under different air mass flow rate. This SAH is composed of a transparent polycarbonate cover plate, a felt absorber layer, a perforated aluminium back plate and an aluminium frame. The ambient inlet air of this SAH is heated as it passes through the perforated back plate and over the felt absorber layer. The heated air is blown out through the outlet. Studies of SAHs with a similar design to this SAH were not found in the literature. The experiment was carried out at Massey University, Auckland campus, NZ (36.7° S, 174.7° E). The global horizontal solar irradiance, the ambient temperature and the wind speed were recorded using an on-site weather station. Temperature and velocity of the air at the outlet were measured using a hot wire anemometer. During the experiment, the air mass flow rate was between 0.022 ± 0.001 kg/s and 0.056 ± 0.005 kg/s. Results showed that when the SAH was operated at the airflow between 0.0054 kg/s and 0.0058 kg/s, the inlet air temperature and the wind speed (between 0 and 6.0 m/s) did not impact the temperature difference between the outlet air and the inlet air. The thermal efficiency of the SAH increased from 34 ± 5% at the airflow between 0.021 kg/s and 0.023 kg/s, to 47 ± 6% at the airflow ranging from 0.032 kg/s to 0.038 kg/s, to 71 ± 4% at the airflow of 0.056 ± 0.005 kg/s. The maximum thermal efficiency of 75% was obtained at the airflow of 0.057 kg/s. The effective efficiency of the SAH was 32 ± 5% at the airflow between 0.021 kg/s and 0.023 kg/s, 42 ± 6% at the airflow ranging from 0.032 kg/s to 0.038 kg/s, and 46 ± 11% at the airflow of 0.056 ± 0.005 kg/s.
1. Introduction
The thermal efficiency of a solar air heater (SAH) is defined as the ratio of the energy converted to the solar energy incident on the SAH collector panel [1]. The design and the operation conditions are the main factors that influence the efficiency of a SAH. The main components for the design include the cover, flow types and absorber layer. Operation conditions include the air mass flow rate and the weather conditions (solar radiation, ambient temperature and wind speed).
Several research projects have focused on modifying the configurations of the SAH to increase the heat transfer performances. These modifications include changing shapes and materials of the absorber layer [2,3,4,5,6,7], increasing the air channel turbulence [8,9,10,11], modifying the flow type [12,13,14] and the cover plate [15]. Table 1 shows the efficiencies of several types of SAH, when they were operated at different air mass flow rate.
Among all the reported SAH in Table 1, efficiencies ranged from 35% to 86% when they were operated at the mass flow rate from 0.010 kg/s to 0.060 kg/s. Study 6 Type 3 SAH showed the maximum efficiency of 86% at the air mass flow rate of 0.042 kg/s.
Study 1 (Table 1) to Study 4 (Table 1) showed artificially roughening the absorber layer can increase the efficiency of the SAH [9,15,16,17,18]. Study 1 [15,16] showed that the double pass SAH with V corrugated shape absorber layer was from 11% to 14% and from 9% to 12% more efficient than the double pass SAH with flat and finned absorber layer respectively. Karim and Hawlader [17] (Table 1, Study 2) found a single pass SAH with finned absorber layer was 4% more efficient than the flat plate SAH. The single pass SAH with V corrugated shape absorber layer was 10% more efficient than the flat plate SAH. Chabane, Moummi and Benramache [9] (Table 1, Study 3) reported that the maximum efficiency of a single pass SAH with fins below the absorber layer was 5% and 8% more efficient than the one without fins, at the air mass flow rates of 0.012 kg/s and 0.016 kg/s respectively. Ozgen, Esen and Esen [18] (Table 1, Study 4) compared a parallel double flow SAH with zigzag arranged aluminium cans on the absorber layer, orderly arranged aluminium cans on the absorber layer, and the smooth absorber layer at the air mass flow rate of 0.030 kg/s and 0.050 kg/s. The maximum efficiency of 73% was found for the SAH with zigzag-arranged cans on absorber layer at the air mass flow rate of 0.050 kg/s. In short, artificially roughening the SAH absorber layer can increase the efficiency of the SAH.
Modifying the airflow type is another way to increase the heat transfer of the SAH [12,13,14]. Airflow types can be categorized as: (i) single flow (with only one flow channel over or under the absorber layer); (ii) double flows (double pass parallel flow or double pass counter flow); and (iii) air flow through a matrix absorber layer [13]. There are two ways to create the double flow. One is using the top glass cover and the bottom glass cover (double glazed SAH) forming the upper channel, with the lower glass cover and the absorber layer forming the lower channel. Another double flow SAH is designed by placing the absorber layer inside the air duct to form the double air passage around absorber layer. The maximum thermal efficiency was achieved by placing the absorber layer in the middle of the air channel, with the upper and lower channels of equal size [21]. Omojaro and Aldabbagh [19] (Table 1, Study 5) showed a 4% increase of the thermal efficiency when the SAH was modified from single flow to double flow. Karim and Hawlader [17] (Table 1, Study 2) reported a 13%, 10% and 7% thermal efficiency increase for V corrugated shape, finned and flat plate absorber layer when changing the airflow type from single flow to double flow. Dhiman, Thakur and Chauhan [12] found that the thermal efficiency of a counter flow SAH was from 11% to 17% higher than the same SAH with parallel flow, when they were operated at the air mass flow rate from 0.012 kg/s to 0.038 kg/s. In conclusion, modifying the airflow type can increase the thermal efficiency of a SAH.
The thermal performance of six types of SAH was investigated [19,20,22,23,24]. The first SAH had a steel wire mesh absorber layer [22], the second SAH had a steel wire mesh absorber layer and longitude fins attached [19]. The third one had a steel wire mesh absorber layer with transverse fins attached and ‘S-shape’ airflow (Table 1, Study 6) [20]. The forth one had a steel wire mesh absorber layer with transverse fins attached and ‘8-Shape’ airflow [23]. The fifth one had a steel wire mesh absorber layer and a partially perforated cover [24]. The performance of these five SAHs was compared with a similar SAH without any modifications (the sixth type SAH).
The authors concluded that the SAH with the wire mesh absorber layer (matrix layer) was efficient, as air passing through the wire mesh absorber layer can maximize heat extraction [5]. The SAH with modified rough air channels performed better than the SAH with smooth air channel. The double-pass SAH was more efficient than the single pass SAH. For the double-pass SAH, the height of the upper channel negatively impacted on the thermal efficiency. The narrower the upper channel, the more efficient the SAH was. When the SAH was operated at air mass flow rate of 0.036 kg/s, thermal efficiencies were respectively 62%, 59% and 57% at the height of the upper channel of 30 mm, 50mm and 70 mm [19]. The maximum thermal efficiency (86%) was obtained from the third type SAH (the double-pass counter flow SAH with six transverse fins and ‘S-shape’ airflow channel) at the air mass flow rate of 0.042 kg/s [20].
Our study aims to investigate the thermal efficiency of a SAH when it was operated at different air mass flow rate. The experiment was conducted under Auckland, NZ weather conditions. The thermal efficiency of this studied SAH is compared to some other SAHs reported in the introduction. This studied SAH has the inlet air coming from a perforated back plate and then passing through and over the absorber layer before it is ducted. Results for investigating thermal efficiency of such type SAH have not been reported in the literature yet.
The paper is organized as following: materials and methods for investigating thermal efficiency of the SAH are presented in Section 2, including the structure of this studied SAH; experiment setup, test procedure and the thermal efficiency calculation. Section 3 presents the experimental results. Section 4 concludes the finding along with the future research.
2. Materials and Methods
2.1. Structure of the Studied Solar Air Heater
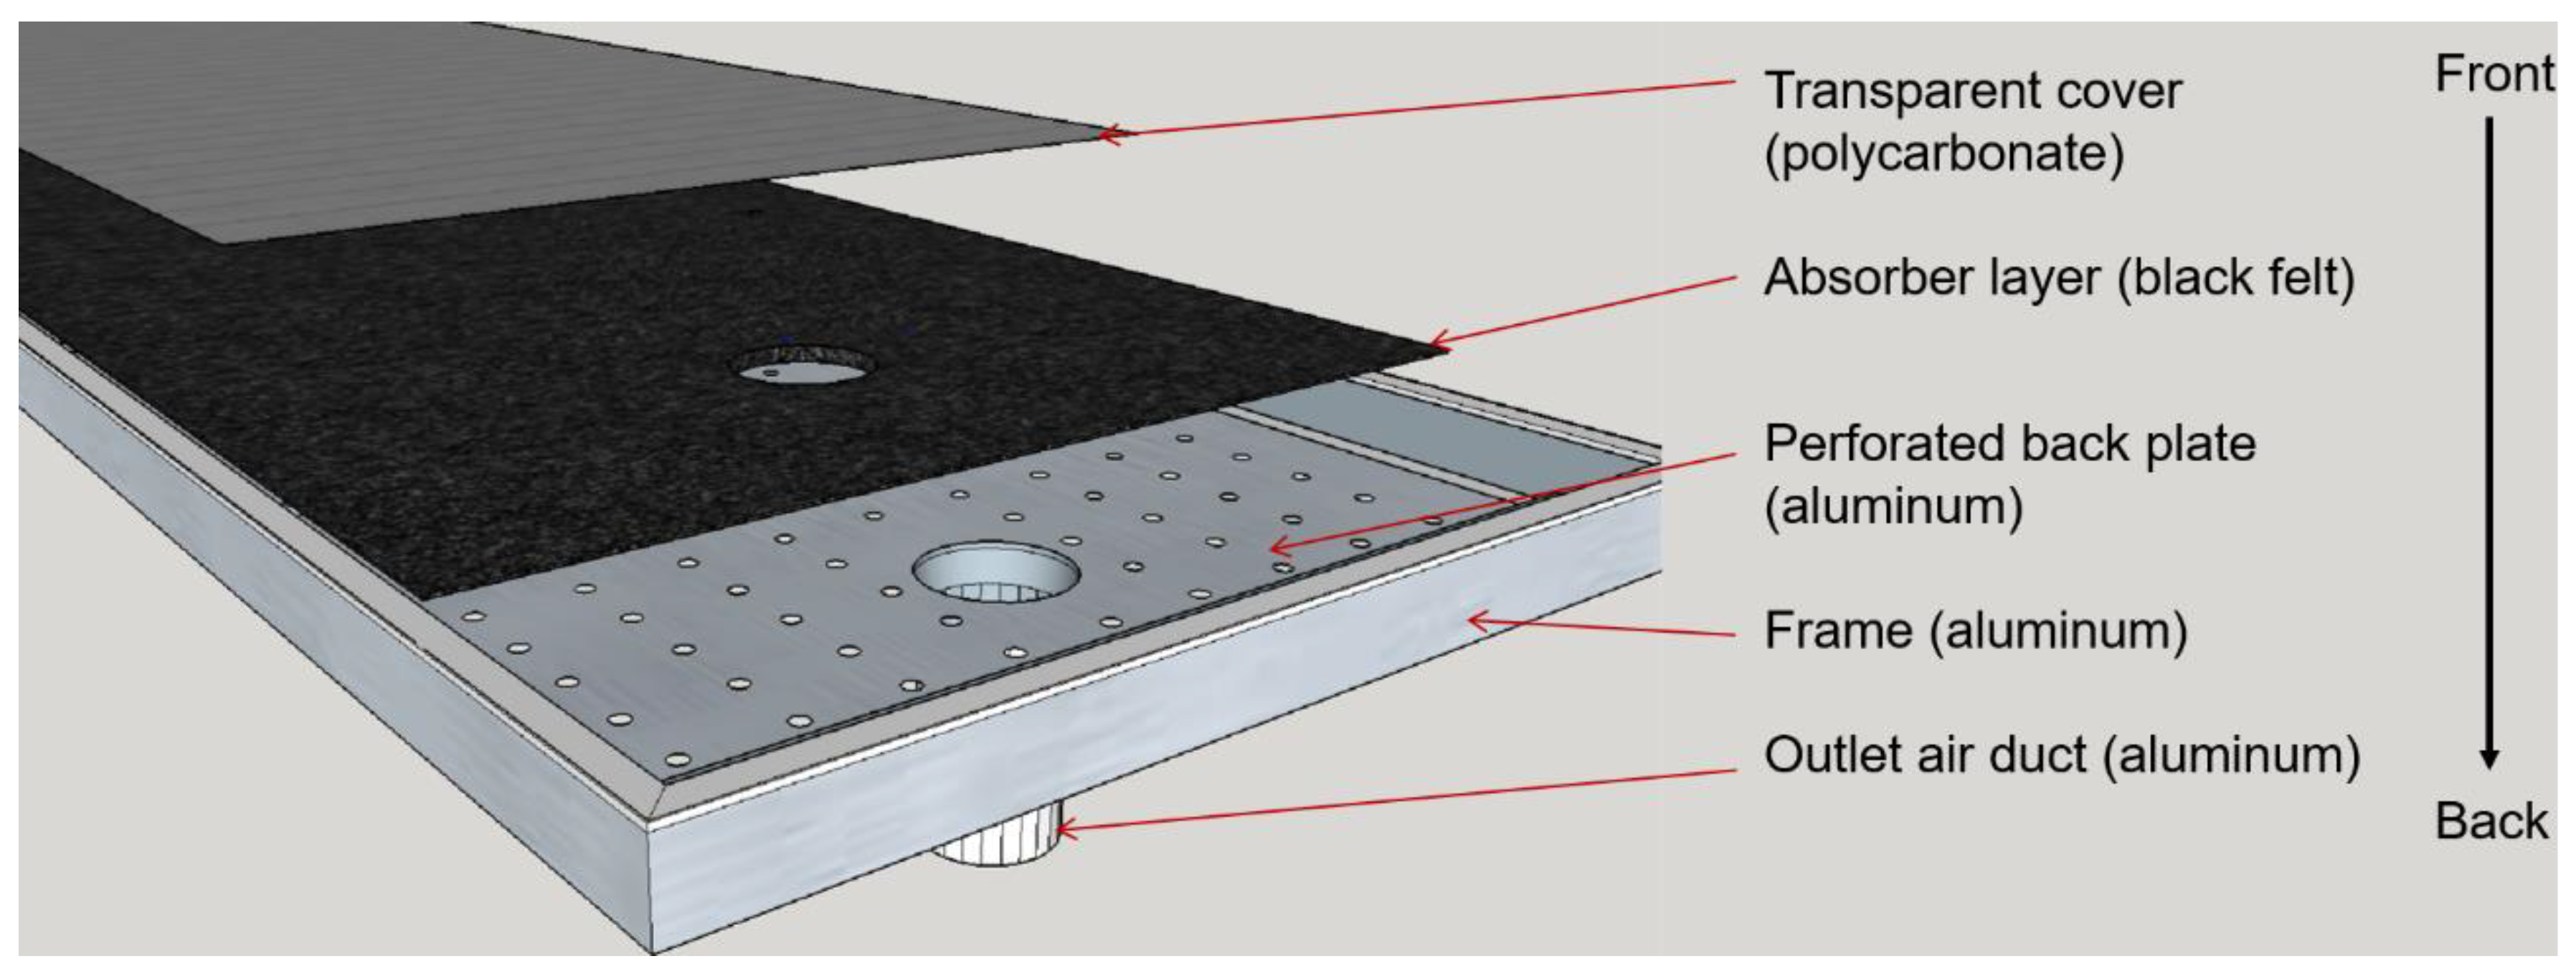
Figure 1 shows the exploded view of the studied SAH.
Figure 1 shows that this SAH, from the front to the back, is composed of a transparent cover (polycarbonate), an absorber layer (black felt), a perforated back plate (aluminium) and an aluminium frame. The diameter of the outlet air duct is 125 mm. The diameter of the air inlet holes on the perforated back plate is 1.5 mm. These holes are evenly distributed in a grid, spaced at 15 mm apart (approximately 4300 holes/m2).
Figure 2 shows the schematic view of the studied SAH.
The length, width, and air channel depth of this SAH are 3000 mm, 1020 mm and 75 mm respectively. The collector gross area and the absorber layer effective area are both 3 m2. The SAH has a fan (power consumption: 5.1 Watt), a fan speed on/off controller (regulator) and an outlet duct. The fan is powered by an 18 Watt photovoltaic panel. The ambient air enters into the SAH through the perforated back plate. The heated air is pushed in the outlet duct by the fan. The velocity of the outlet air was controlled by the fan speed controller (regulator).
2.2. Experiment Setup and Test Procedure
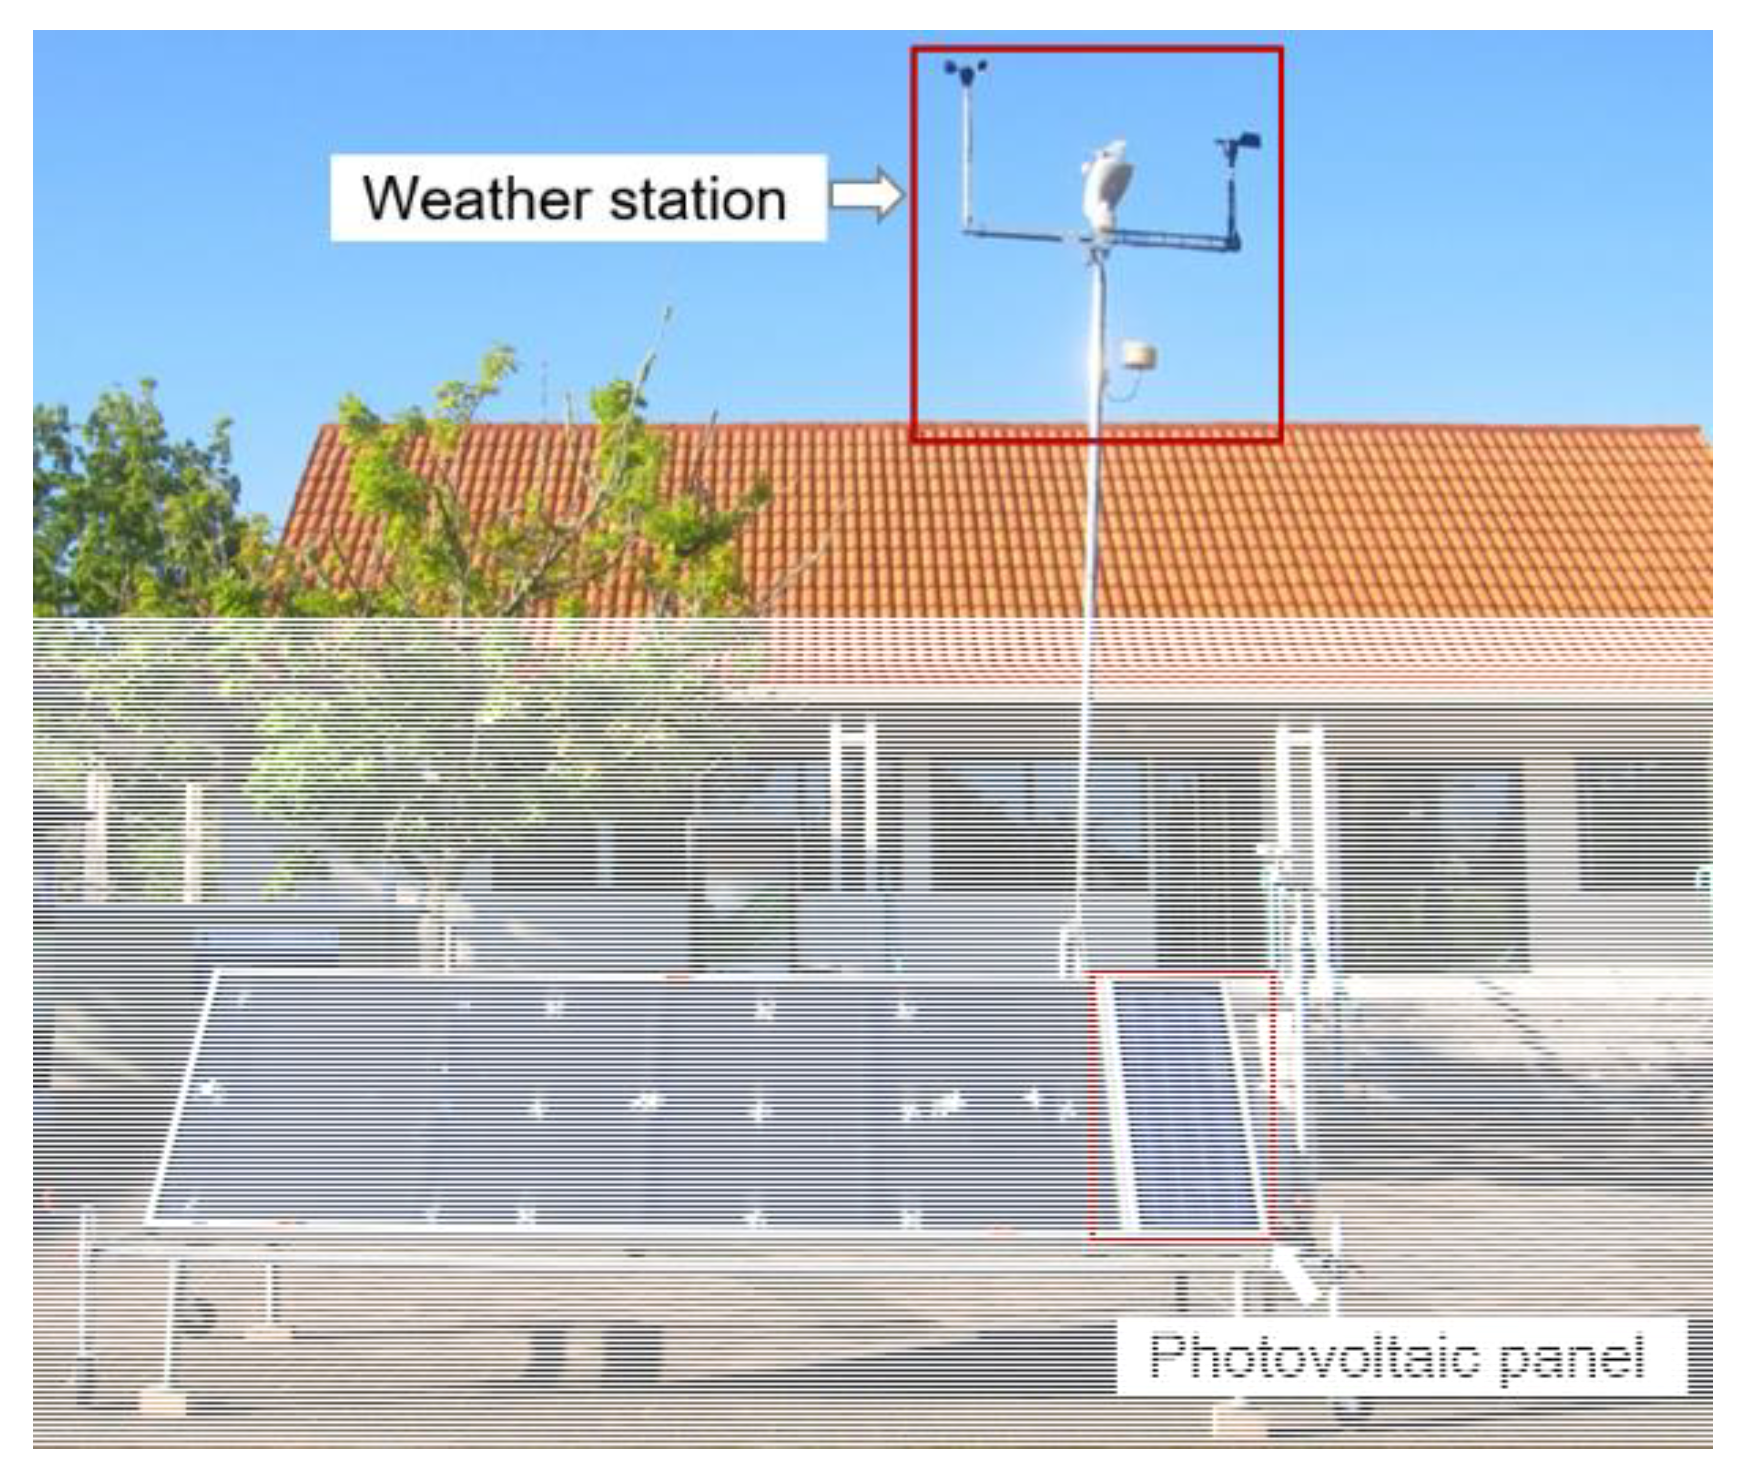
During the experiment, the SAH was mounted on a custom-made galvanized metal frame. Figure 3 shows the setup of the experiment.
The SAH panel was 52° off the horizontal surface (local latitude 37° plus 15°). The panel faced due north (at the azimuth angle of 0°). The global horizontal solar irradiance, the ambient temperature and the wind speed were recorded by an onsite weather station (HP2000 Wi-Fi Weather Station, Fine Offset Electronics Co., Ltd., Shenzhen, China), as shown in Figure 3. The velocity and the temperature of the outlet air were monitored by a hot wire anemometer (AM4214SD, Lutron Electronic Enterprise Co. Ltd., Taipei City, Taiwan).
Table 2 shows the characteristics of the monitoring devices.
The experiment was carried out for 9 days at Massey University’s Auckland campus, NZ (36.7° S, 174.7° E). The test began at 9 am and ended at 4 pm (New Zealand Daylight Time). On each day, the air was circulated through the panel for at least 10 min prior to commencing the measurement. During the test, the fan regulator was set at 50% maximum speed of the ventilator from Day 1 to Day 4; at 75% maximum speed of the ventilator from Day 5 to Day 8, and 100% maximum speed of the ventilator on Day 9. The 50% and 75% maximum speed of the ventilator were set to investigate the efficiency and the outlet air temperature rise (between the outlet air and inlet air) of this SAH, when it was operated at different air mass flow rate.
2.3. Thermal Efficiency Calculation
The thermal efficiency of the SAH was estimated based on Equation (1).
where,
| Solar air heater effective area (m2) | |
| Outlet duct cross section area (m2) | |
| Specific heat capacity of air [J/(kg*K)] | |
| Solar radiation on the tilted solar air heater surface (W/m2) | |
| Inlet air temperature (K) | |
| Outlet air temperature (K) | |
| Air mass flow rate (kg/s) | |
| Efficiency (%) | |
| Density of air (kg/m3) | |
| Air velocity (m/s) |
During the calculation, it was assumed that the monitored air velocity was the mean air velocity. The ambient air temperature was the inlet air temperature. Equation (1) shows that efficiency of the SAH depends on air mass flow rate and the parameter that temperature difference between outlet air and inlet air divide the solar radiation on the tilted solar collector surface, as air specific heat capacity and solar collector effective area were constant. The air density and the air specific heat capacity were set according to the air temperature, as shown in Table 3 [25].
The solar radiation incident on the absorber layer was calculated using the computer program solaR [26]. The Spencer model [27] was chose to calculate the declination angle and the extra-terrestrial radiation incident on the plane. The Boland-Ridley-Lauret model was used to calculate the horizontal diffuse solar radiation based on the measured global horizontal solar radiation [28,29]. The Boland-Ridley-Lauret model performed well in both North and South Hemispheres [28]. The Hay and McKay model was used to estimate the diffuse radiation on the inclined absorber plate [30]. All equations for calculating the solar radiation incident are attached in Appendix A.
2.4. Effective Efficiency Calculation
To evaluate the economic performance, the effective efficiency of the solar air heater is estimated according to the Equation (2) [31].
where,
| Effective efficiency of the solar air heater (%) | |
| Useful thermal energy gained by the solar air heater (W) | |
| Mechanical power that required to force the air through the solar air collector (W) | |
| the conversion factor | |
| Solar radiation on the tilted solar air heater surface (W/m2) | |
| Solar air heater effective area (m2) |
The conversion factor () is the energy conversion efficiency from the primary energy to the mechanical energy, and a typical value of 0.18 is suggested to be considered [31,32].
The required mechanical power () can be estimated according to the Equation (3).
where,
| Mechanical power that required to force the air through the solar air collector (W) | |
| Volume flow rate (m3/s) | |
| Pressure drop inside the air channel (N/m2) |
In this study, the pressure drops due to others have been discarded, while the pressure drops due to the air moves through the absorber layer and inside the air channel are estimated according to the Equation (4) [33].
where,
| Pressure drop inside the air channel (N/m2) | |
| Density of air (kg/m3) | |
| Friction factor | |
| Air velocity (m/s) | |
| Length of the solar air heater (m) | |
| Hydraulic diameter (m) |
The hydraulic diameter of the air channel can be estimated according to the Equation (7).
where,
| Hydraulic diameter (m) | |
| Width of the air channel (m) | |
| Depth of the air channel (m) |
The hydraulic diameter of the absorber layer needs to multiply the porosity of the absorber layer. The porosity can be estimated according to the Equation (8).
where,
| Porosity | |
| Diameter of the holes (1.5 mm) | |
| Spaces between the evenly distributed holes (15 mm) |
Reynolds number can be estimated according to Equation (9).
where,
| Reynolds number | |
| Dynamic viscosity (kg/(m*s)) |
The dynamic viscosity of the air was set according to the air temperature, as shown in Table 3.
2.5. The Uncertainty Calculation
In this study, the errors from both the monitoring devices and the measurements have been analyzed [19]. The independent measurements include the inlet air temperature, the outlet air temperature, the outlet air velocity and the solar air radiation. The equipment used and the uncertainty of these equipment has shown in Equation (10). Considering the density of the air, the specific heat of the air as constant. The fractional uncertainty of the solar air heater thermal efficiency is estimated according to Equation (10).
where,
| Uncertainty of the variable x |
The uncertainty of the variable x can be estimated according to Equation (11).
where,
| Uncertainty of the variable x | |
| Standard deviation of the variable x | |
| Uncertainty of the instrument |
Results show that the mean values for all the days together for ΔT, , , , , and the thermal efficiency are 17.6 °C, 19.1 °C, 36.7 °C, 0.032 kg/s, 428 W/m2, and 44% respectively. The fractional uncertainty of the efficiency is found to be 0.0061. The theoretical prediction of this SAH was analyzed by McGowan [34]. This study focuses on the experimental results. All calculations were conducted using the statistical computing and graphics platform programming language R version 3.4.3 [35].
3. Results and Discussion
3.1. Ambient Weather Conditions during Experiment
During the test, the weather data was monitored at 1-min interval. It found that the solar radiation ranged from 104 W/m2 (minimum) to 1298 W/m2 (maximum), with the mean (± standard deviation, SD) level of 544 (± 270) W/m2. The ambient temperature ranged from 15.7 °C (minimum) to 22.8 °C (maximum), with the mean (± SD) of 19.1 ± 1.7 °C. The wind speed ranged from 0 m/s to 9.6 m/s, with the mean (± SD) level of 2.0 ± 1.3 m/s. For 99.3% of the time, the wind speed was between 0 m/s and 6.0 m/s, 0.7% of the monitored wind speed was above 6.0 m/s.
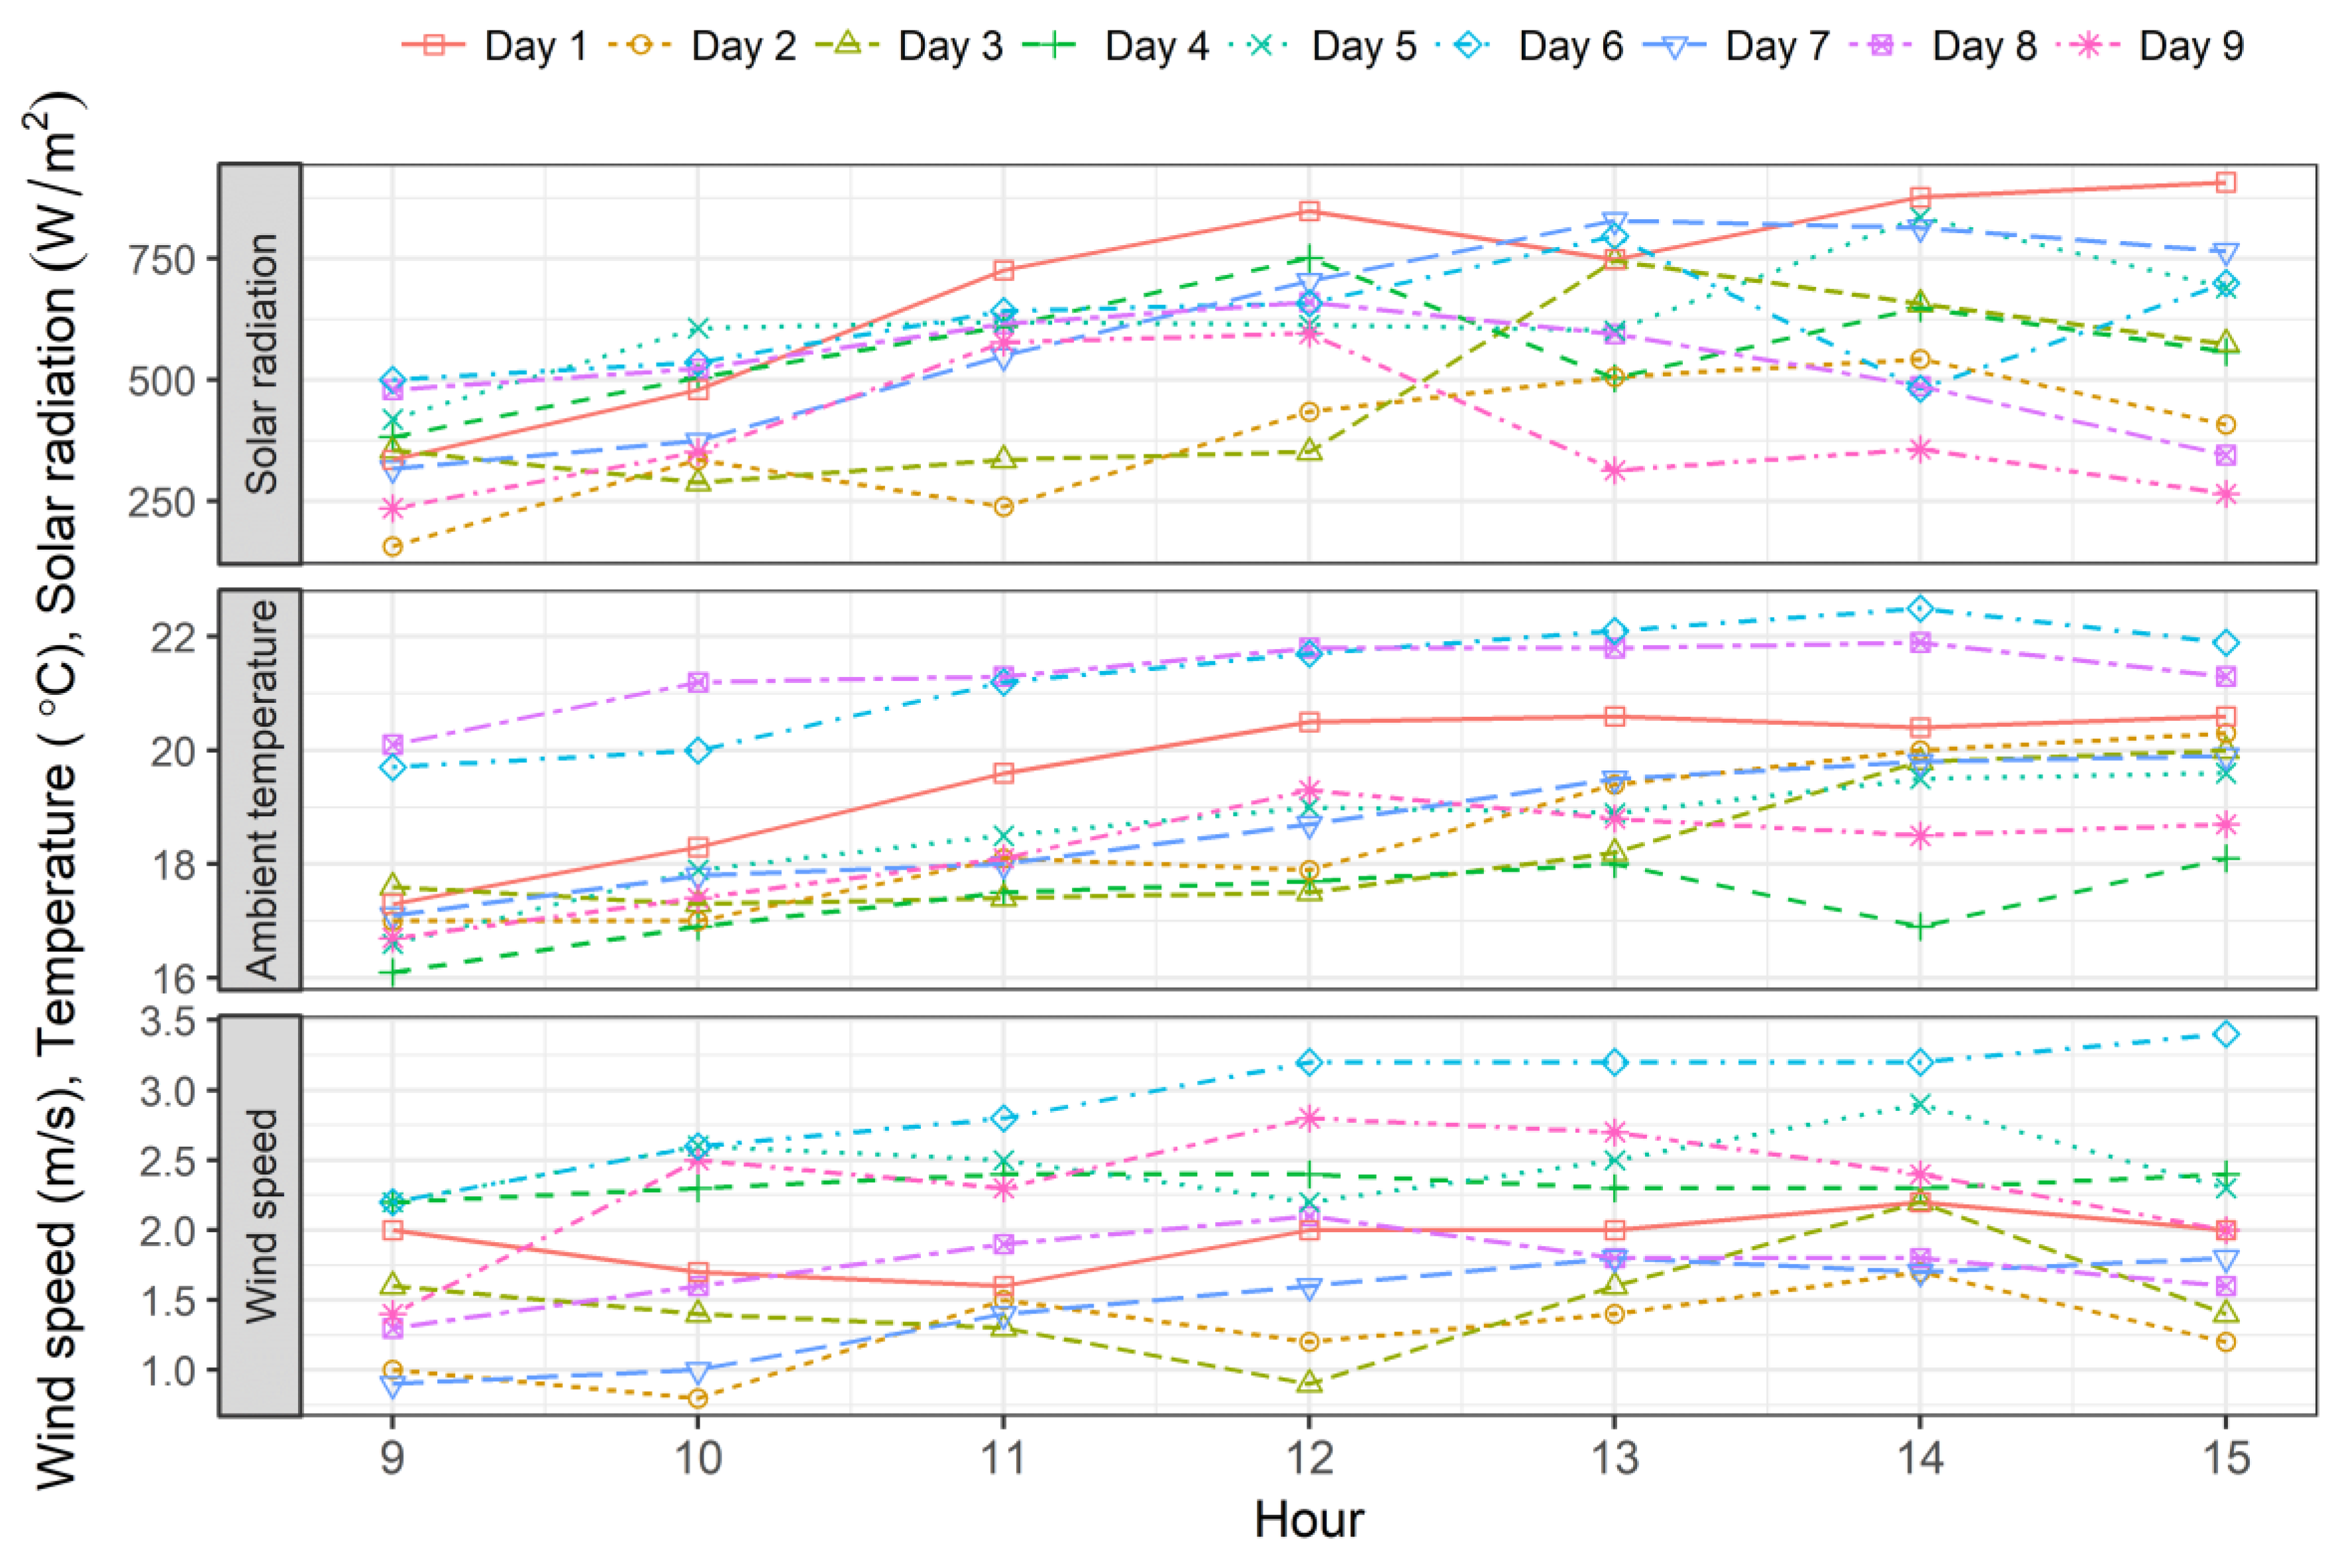
Figure 4 shows the hourly global horizontal solar radiation (top), ambient temperature (middle) and wind speed (bottom) on each test day.
The hourly solar radiation ranged from 157 W/m2 (minimum) to 908 W/m2 (maximum). The hourly ambient temperature was from 16.1 °C to 22.5 °C. The hourly wind speed was between 0.8 m/s to 3.4 m/s. The mean (± SD) values of the global horizontal solar radiation, ambient temperature and wind speed on each test day are shown in Table 4.
The highest and the lowest mean global horizontal solar radiation during the test days was 703.3 ± 286.6 W/m2 (Day 1) and 374.8 ± 161.6 W/m2 (Day 2) respectively. The mean ambient temperature ranged from 17.3 ± 0.8 °C (Day 4) to 21.3 ± 1.0 °C (Day 6). The highest and lowest mean wind speed was 3.0 ± 1.5 m/s (Day 6), and 1.3 ± 1.0 m/s (Day 2) respectively.
3.2. Outlet Air Temperature of the Studied SAH
The air mass flow rate affects the outlet air temperature. A higher air mass flow rate makes the less time for air circulating inside the air channel and absorbing the heat. Consequently, it results in a lower outlet air temperature [36]. During the test, the air mass flow rate was between 0.022 ± 0.001 kg/s and 0.056 ± 0.005 kg/s. Table 5 shows mean (± SD) values of the outlet air velocity (m/s), air mass flow rate (kg/s), solar radiation on the SAH collector surface (W/m2), the outlet air temperature (°C), and the temperature difference between the outlet air and the inlet air (ΔT, Toutlet-Tinlet) on each test day.
The outlet air temperature ranged from 19.9 °C to 59.8 °C, with the mean level of 36.7 °C (SD: 8.5 °C). Table 5 shows the mean (± SD) values of the outlet air temperature ranged from 29.7 ± 6.3 °C (Day 9) to 45.2 ± 9.3 °C (Day 1). The mean level of the solar radiation on Day 1 was higher than on the other days that had the same setting of the fan speed controller (Day 2 to Day 4, 50% maximum speed of the ventilator). This resulted in the mean outlet air temperature on Day 1 higher than on Day 2 to Day 4. Consequently, the air density and the mass flow rate on Day 1 were lower than on Day 2, Day 3 and Day 4 regardless of the similar air velocity. The mean air mass flow rate on Day 5 to Day 8 was between 0.032 kg/s and 0.038 kg/s, at 75% maximum speed of the ventilator. The mean (± SD) value of mass flow rate on Day 9 was 0.056 ± 0.005 kg/s. The fieldwork performance of this SAH when it was roof-mounted on the NZ primary schools in winter has been reported [37,38].
Levels of ΔT (Toutlet-Tinlet) obtained during the experiment was from 3.2 °C (minimum) to 41.0 °C (maximum). The mean (±SD) values of ΔT (Toutlet-Tinlet) ranged from 11.5 ± 5.9 °C (Day 9) to 25.5 ± 8.3 °C (Day 1). The maximum ΔT (Toutlet-Tinlet) was 41.0 °C. This was obtained on Day 4 noon when the wind speed was 2.2 m/s, the inlet air temperature was 17.5 °C, and the solar radiation was 901 W/m2. Multiple linear regressions were built to investigate the attribute of the ΔT (Toutlet-Tinlet), when it was operated at different air mass flow rate. The model input variables include the solar radiation, air mass flow rate, inlet air temperature and the wind speed.
As expected, a positive relationship between ΔT (Toutlet-Tinlet) and the solar radiation, a negative relationship between ΔT (Toutlet-Tinlet) and the air mass flow rate were observed in this study. When the SAH was operated at air mass flow rate between 0.021 and 0.023 kg/s, ΔT (Toutlet-Tinlet) was impacted by the solar radiation and mass flow rate. When the SAH was operated at flow rate between 0.032 and 0.038 kg/s, the solar radiation, the mass flow rate, the wind speed and the inlet air temperature all affected the ΔT (Toutlet-Tinlet). When this SAH was operated at flow rate between 0.054 and 0.058 kg/s, only the solar radiation levels affected the ΔT (Toutlet-Tinlet) levels. This result was supported by Omojaro and Aldabbagh [19] and Aldabbagh, Egelioglu and Ilkan [22], where there were a negative relationship between ΔT (Toutlet-Tinlet) and the air mass flow rate, and a positive relationship between ΔT (Toutlet-Tinlet) and the solar radiation.
3.3. Thermal Efficiency and Effective Efficiency of the Studied Solar Air Heater
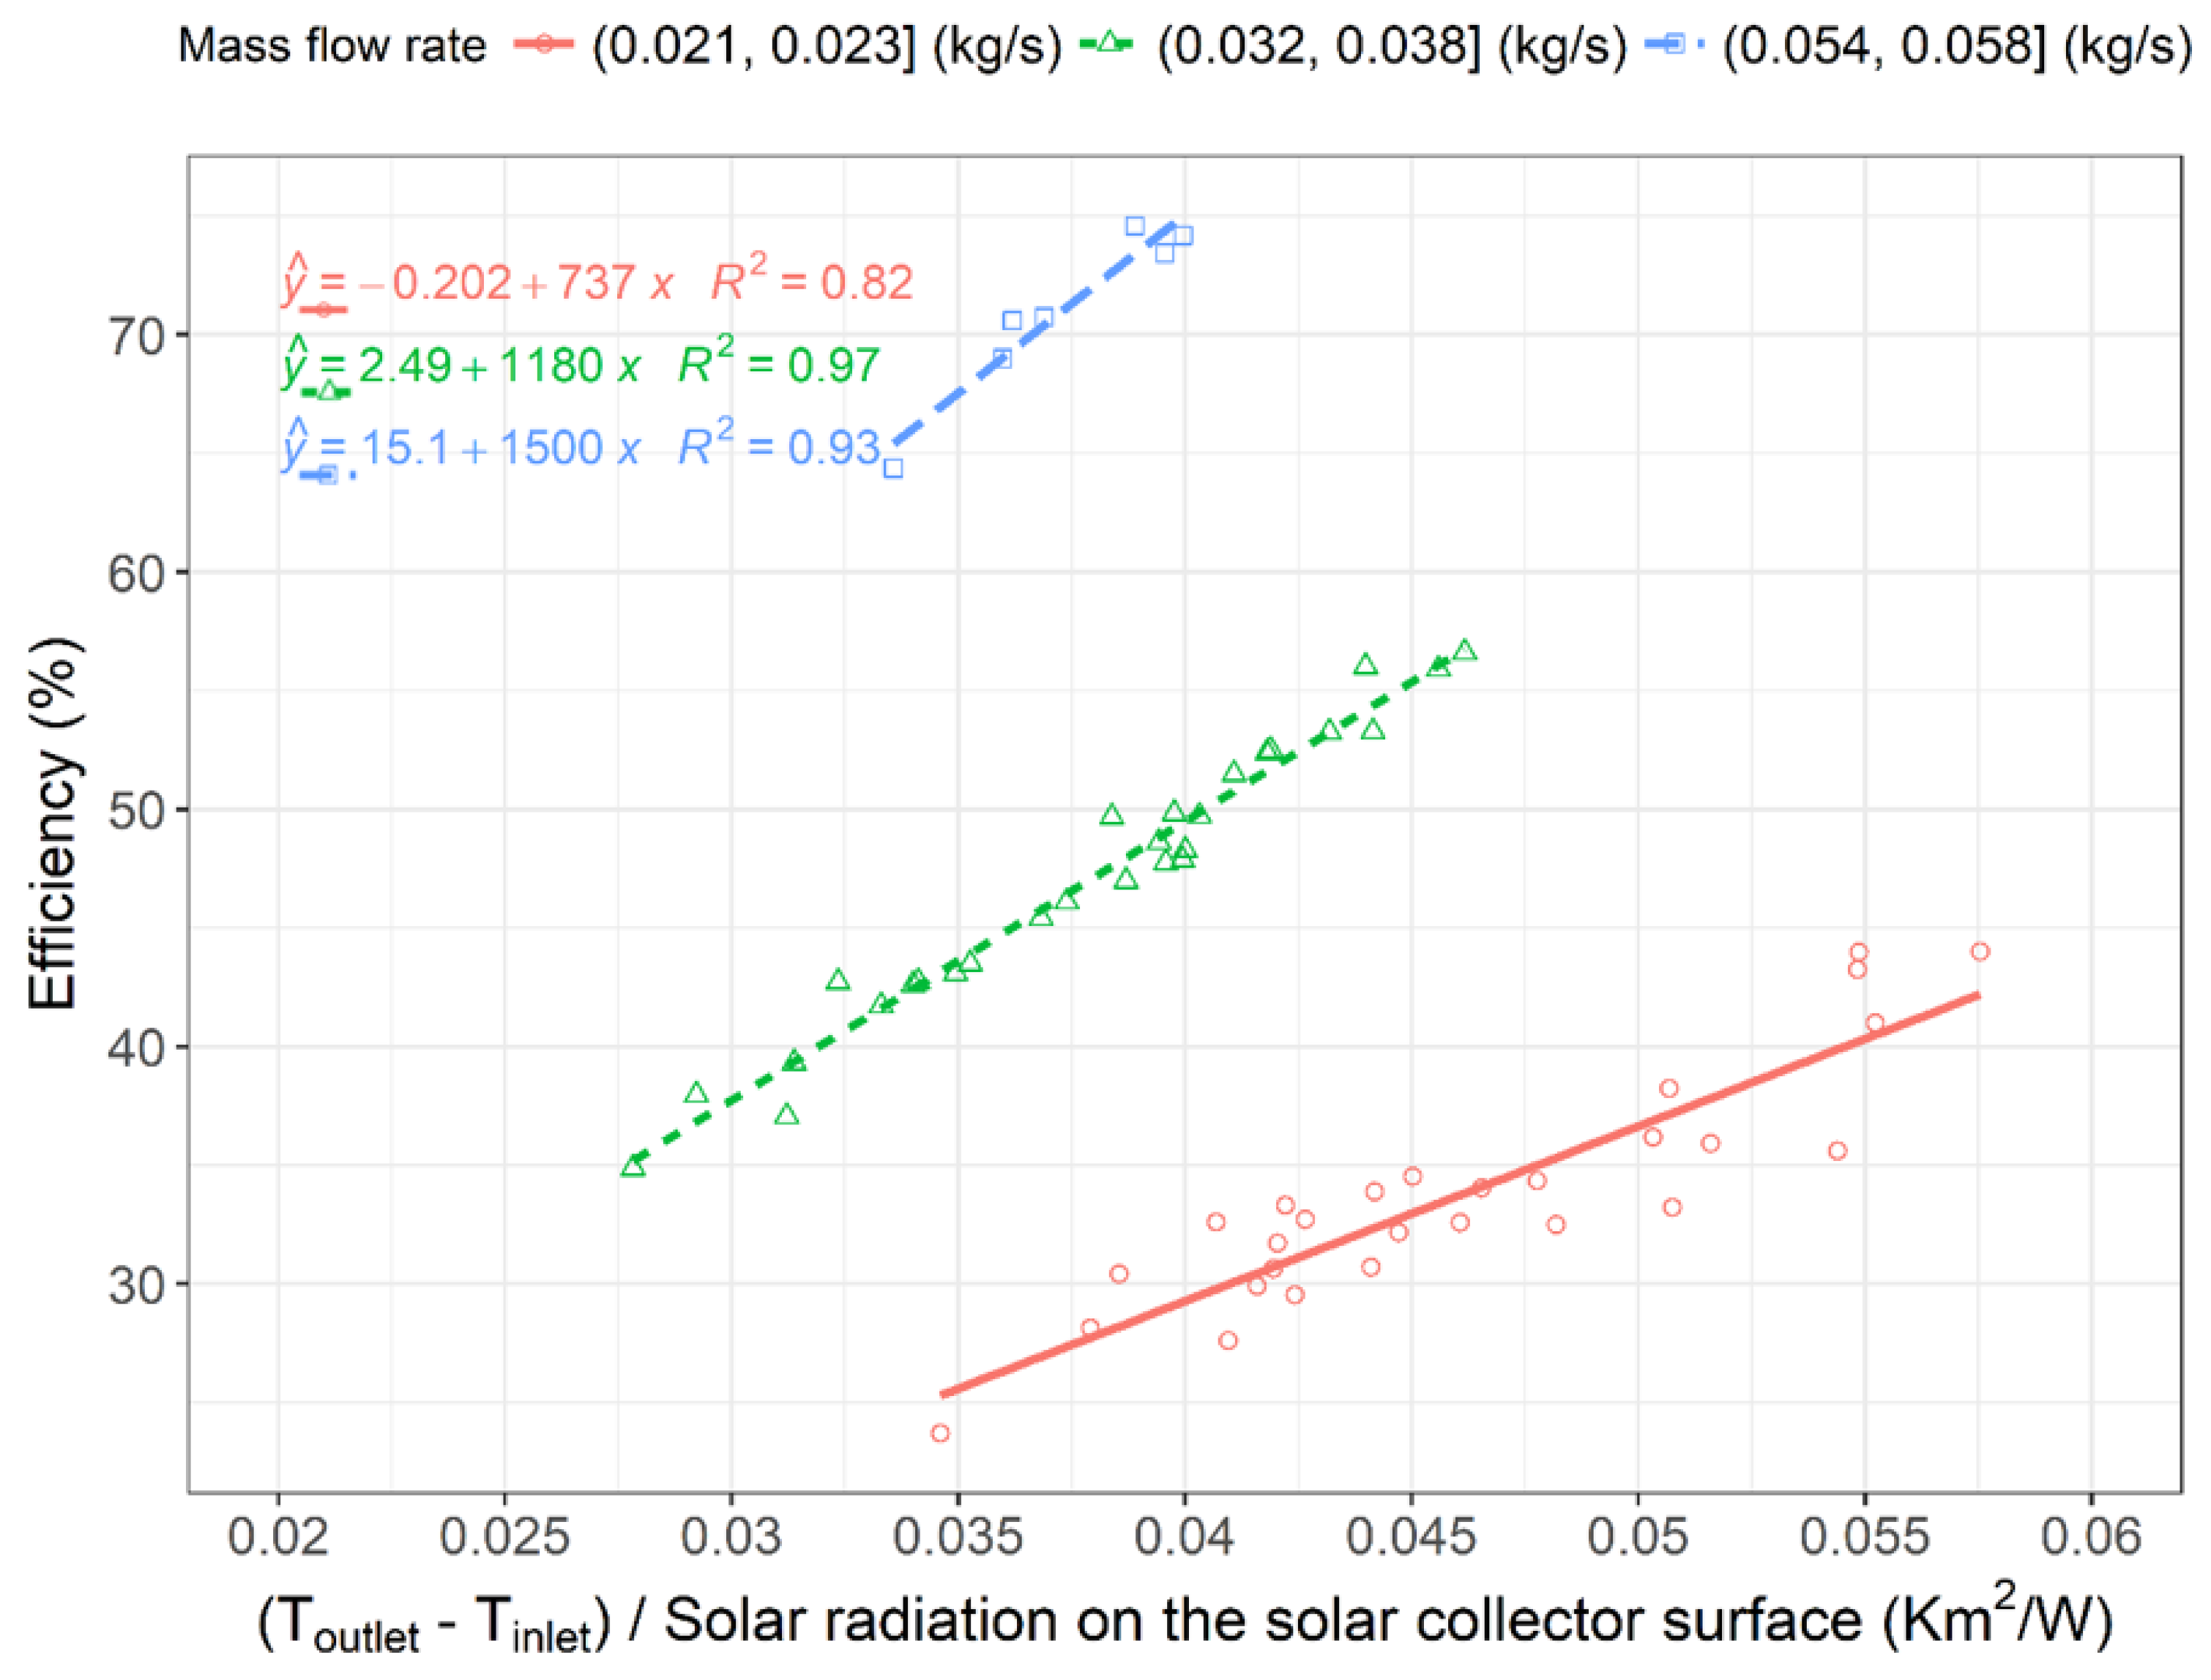
Figure 5 shows the efficiency versus values of the efficiency function parameter (ΔT (Toutlet-Tinlet)/IT) at different air mass flow rate. The regression models for efficiencies of the SAH under different mass flow rate have been added.
Figure 5 shows that during the experiment, the ΔT (Toutlet-Tinlet)/IT was between 0.027 and 0.058 Km2/W. From the regression model, it can be estimated that, when the value of (Toutlet-Tinlet)/IT is ca. 0.04 Km2/W, the efficiency of the SAH was ca. 29%, 50% and 75% at an air mass flow rate of ca. 0.022 kg/s, 0.037 kg/s and 0.056 kg/s respectively. This difference of the efficiency is getting bigger when the value of ΔT (Toutlet-Tinlet)/IT is increasing. This means the higher the air mass flow rate is, the more heat was transferred into the air.
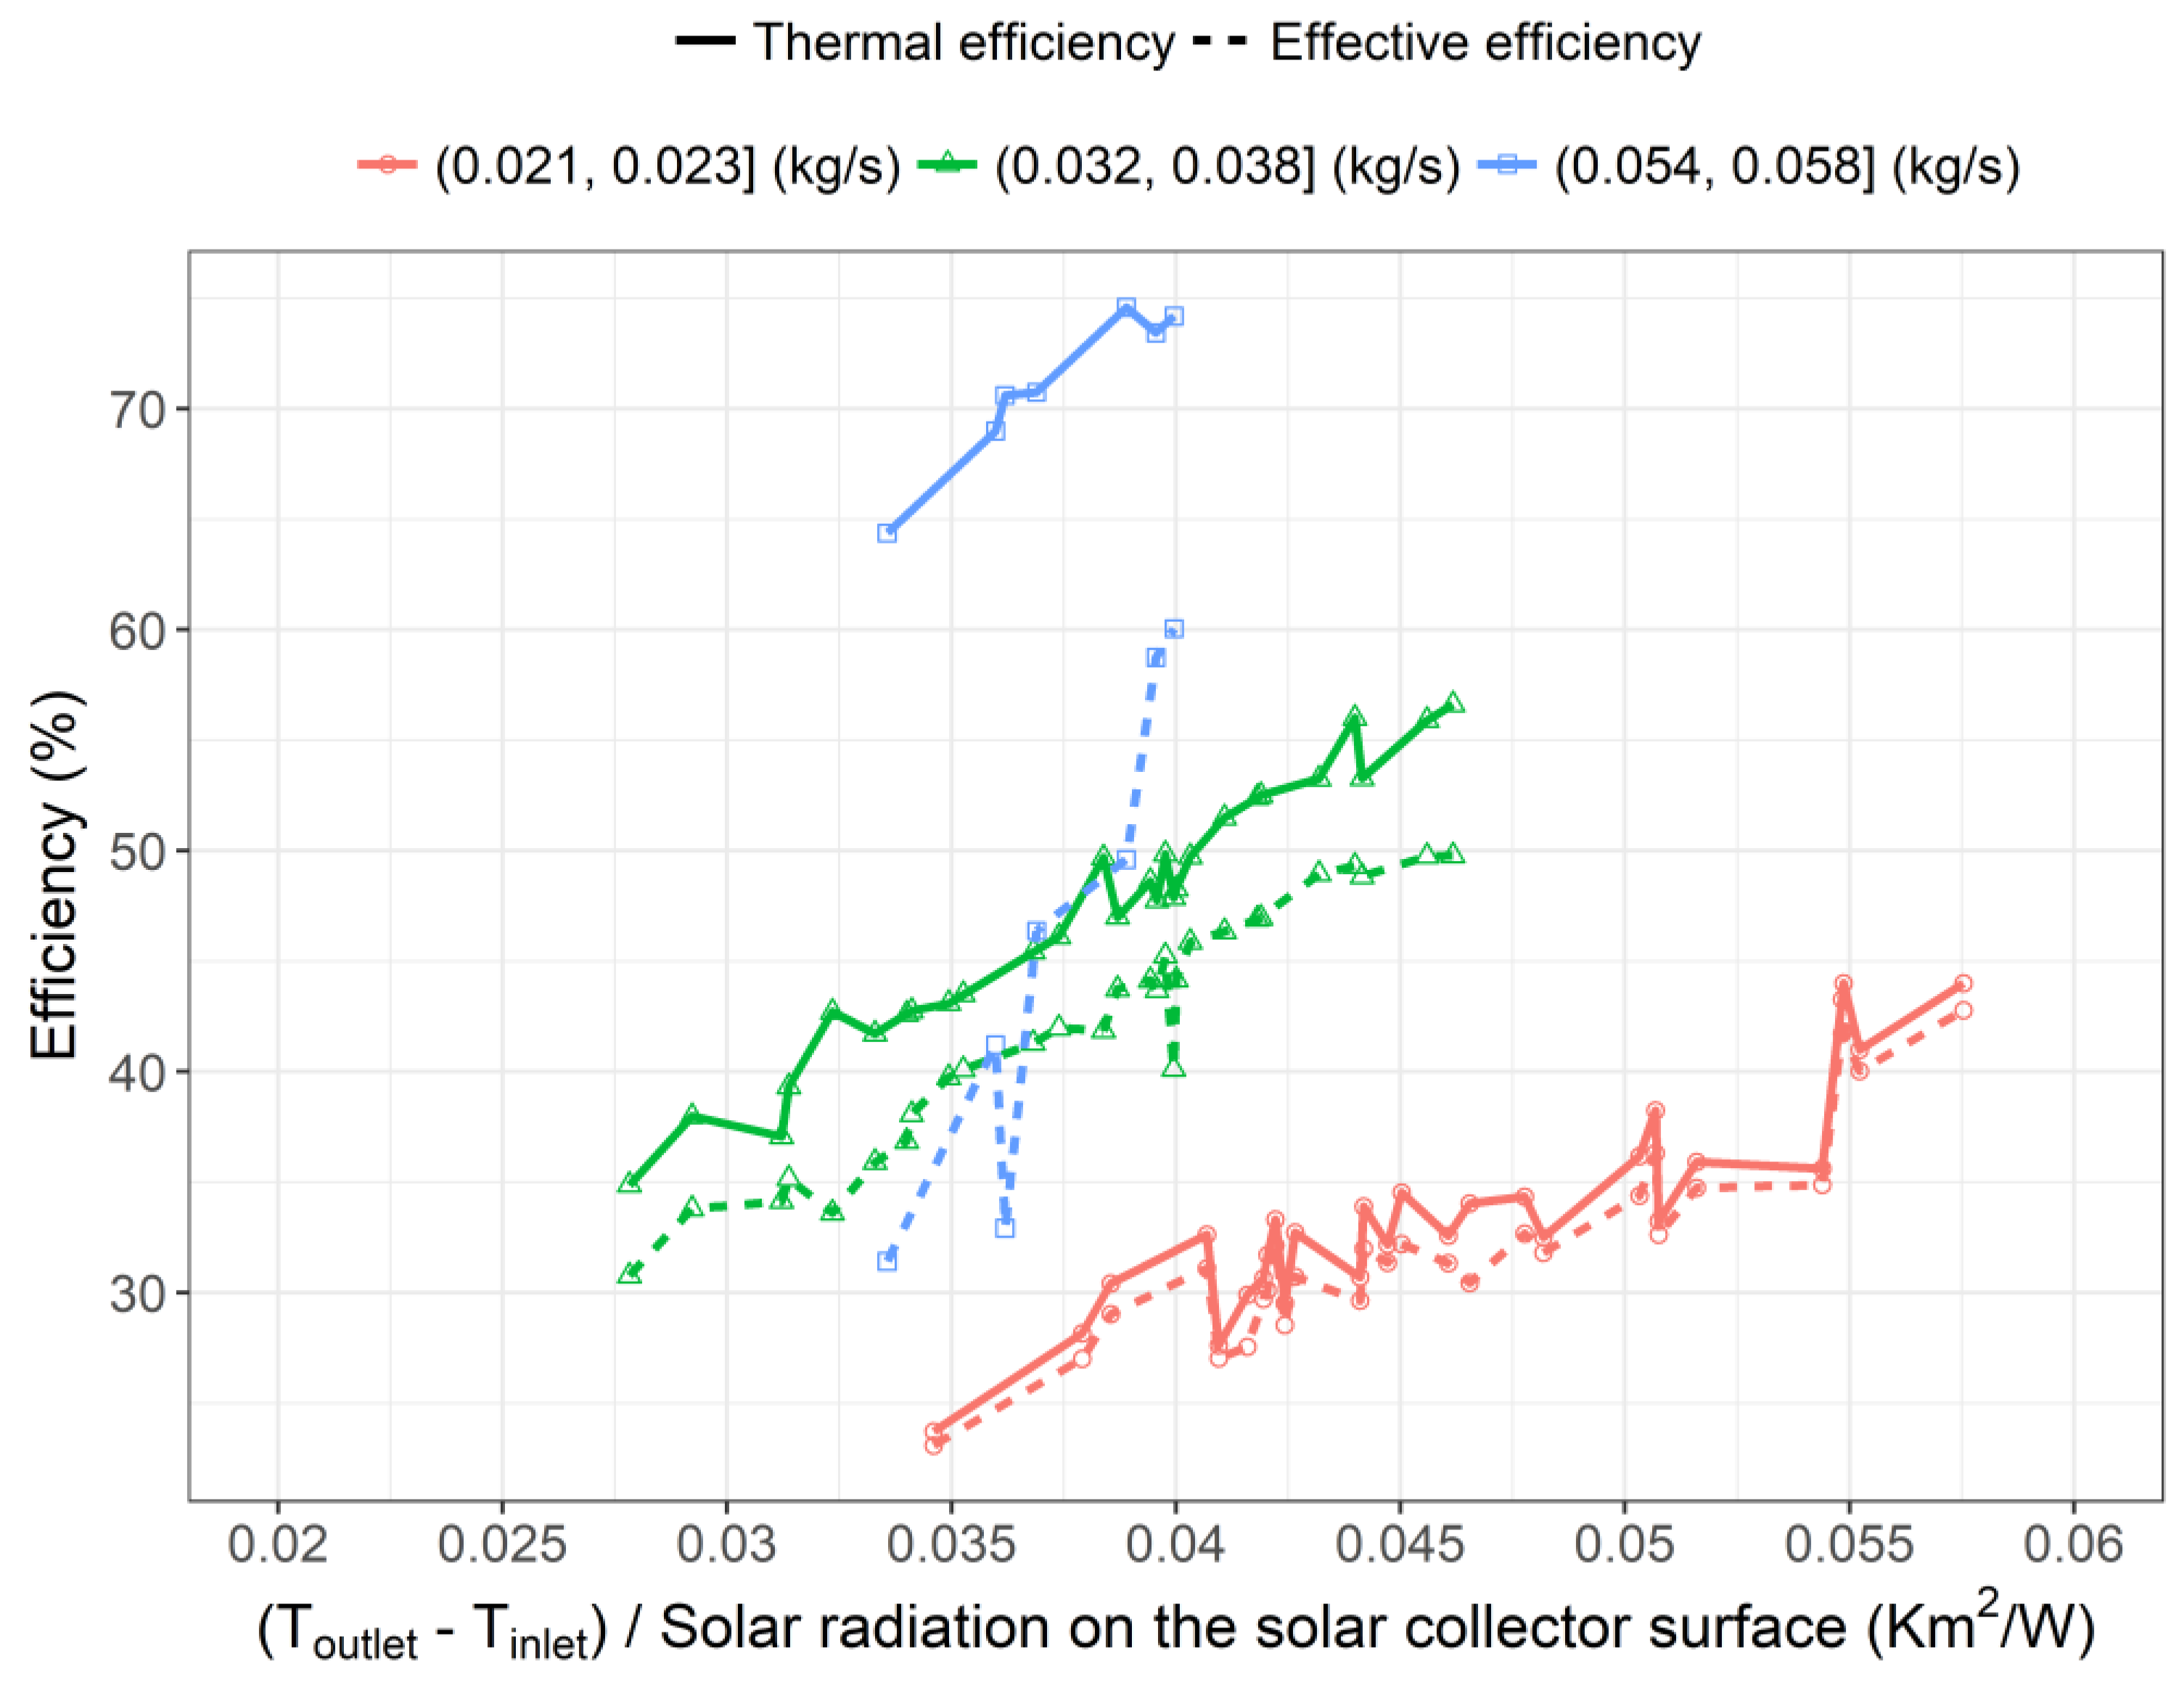
Figure 6 shows the efficiency versus values of the efficiency function parameter (ΔT (Toutlet-Tinlet)/IT) at different air mass flow rate. The solid line is the thermal efficiency, and the dashed line is the effective efficiency.
Figure 6 shows that although the thermal efficiency increased with the increasing of the air mass flow rate, when considering the mechanic power consumed by the fan, the mean effective efficiency only had a 4% increase when the operated air mass flow rate increased from the range between 0.032 kg/s and 0.038 kg/s to 0.057 kg/s. The effective efficiency of the SAH was 32 ± 5% at the airflow between 0.021 kg/s and 0.023 kg/s, to 42 ± 6% at the airflow ranging from 0.032 kg/s to 0.038 kg/s, and 46 ± 11% at the airflow of 0.056 ± 0.005 kg/s.
3.4. Discussions
The efficiency of the studied SAH was 71 ± 4% [min: 64%, max: 75%], at an air mass flow rate of 0.056 ± 0.004 kg/s. The maximum thermal efficiency of 75% was found at the mass flow rate of 0.057 kg/s. Karim and Hawlader [17] reported a double pass V-corrugated SAH with maximum efficiency of 82% at an air mass flow rate of 0.056 kg/s. The maximum efficiency of 80% was found from a SAH with porous material between the absorber layer and bottom plate, when it was operated at air mass flow rate of 0.070 kg/s [2]. Ozgen, Esen and Esen [18] found the maximum thermal efficiency of a double parallel flow SAH with aluminium absorber plate with zag-zig arranged aluminium cans on both side was 73% at an air mass flow rate of 0.055 kg/s. El-Sebaii, Aboul-Enein, Ramadan, Shalaby and Moharram [16] found the thermal efficiency of a double parallel pass V-corrugated SAH was 67% at an air mass flow rate of 0.060 kg/s; the thermal efficiency of a double parallel flat SAH was 59% at an air mass flow rate of 0.060 kg/s.
At an air mass flow rate between 0.032 kg/s and 0.038 kg/s, the efficiency of the SAH found in this study was 47 ± 6% [min: 35%, max: 57%]. Prasad, et al. [39] found a single pass SAH with packed bed formed by wire mesh had the maximum efficiency of 59% at the mass flow rate of 0.035 kg/s. Omojaro and Aldabbagh [19] found the efficiency of a SAH with steel wire mesh was 60% (single pass SAH) and 64% (double pass SAH) when it was operated at mass flow rate of 0.038 kg/s. El-Sebaii, Aboul-Enein, Ramadan, Shalaby and Moharram [15] found a double parallel SAH had the thermal efficiency of 56% (flat absorber plate) and 65% (V-corrugated absorber plate) when they were operated at mass flow rate of 0.040 kg/s.
At an air mass flow rate between 0.021 and 0.023 kg/s, the thermal efficiency of this studied SAH was 34 ± 5% [min: 24%, max: 44%]. Chabane, Moummi and Benramache [9] reported the thermal efficiency of a SAH both with the longitudinal fins installed under the absorber layer and without the fins installed. It reported that the thermal efficiency of this SAH without fins was 35% and 44% at the air mass flow rate of 0.012 kg/s and 0.016 kg/s respectively. This thermal efficiency was increased to 40% and 52% for the SAH with the fins [9].
Overall, the efficiency of this studied SAH was higher than the efficiency of some SAHs reported in literature, when it was operated at air mass flow rate of 0.057 kg/s (100% maximum ventilator). However, when this studied SAH was operated at 50% and 75% of maximum ventilators, its efficiency was lower than efficiency of some SAHs reported in literature.
4. Conclusions
This paper has investigated the experimental performance of a SAH under Auckland (NZ) weather conditions. This SAH has the inlet air passing through a perforated back plate and the felt absorber layer. This study found when the SAH was operated at 100% maximum fan speed (mass flow rate range from 0.054 kg/s to 0.058 kg/s), the wind speed and the inlet air temperature did not impact the ΔT (Toutlet-Tinlet) and thermal efficiency. The maximum ΔT (Toutlet-Tinlet) of 41 °C was obtained at the wind speed 2.2 m/s, the inlet air temperature was 17.5 °C and the solar radiation was 901 W/m2, when the SAH was operated at the mass flow rate of 0.022 kg/s. The maximum thermal efficiency of 75% was achieved when it was operated at air mass flow rate 0.057 kg/s.
Compared with the thermal efficiency of other solar air heaters that have been reported in the literature, this studied solar air heater has a higher thermal efficiency when it was operated at the air mass flow rate of 0.057 kg/s, but has a lower thermal efficiency when it was operated at the air mass flow rate between 0.032 kg/s and 0.038 kg/s. However, when considering the economic performance, the mean effective efficiency had a 4% increase when the operated air mass flow rate increased from the range between 0.032 kg/s and 0.038 kg/s to 0.057 kg/s. Future studies could confirm the optimum operational conditions by combining the theoretical analysis and experimental data. With the results of the theoretical analysis, future modifications of this SAH, i.e., moving the outlet air duct to a central location, increasing the diameter of the holes on the perforated back plate, and change the current downward type outlet air duct to an upward type, could be needed to enhance the heat transfer of the solar air heater.
Author Contributions
Y.W., M.B. and R.P. conceived and designed the experiments; M.B., R.P., M.P. and Chris Cunningham substantively revised the paper; Y.W. performed the experiment, analyzed the data and wrote the paper. All authors have read and agreed to the published version of the manuscript.
Funding
This research was funded by Health Research Council of New Zealand, grant number 12/664″ and “The APC was funded by Building Performance Research Group, School of Built Environment, Massey University”.
Acknowledgments
This work was supported by Health Research Council of New Zealand and Lottery Health Research Grant. The authors would like to thank Building Research Association of New Zealand for their technical and equipment support. Authors are grateful for the technical support from Eamon Corless (Solair Pty Ltd.) and Hans Joergen Christensen (SolarVenti). Authors would like to thank Chris Chitty for helping designing, fabricating and installing the test rig. Special thanks to staff from Massey University Facilities Management and Simply Security Ltd. for moving the testing rig between the test site and the overnight storage room.
Conflicts of Interest
The authors declare no conflict of interest.
Appendix A
Spencer model to estimate the declination angle:
where
| the declination angle | |
| the nth day of the year |
Spencer model to calculate the extra-terrestrial radiation incident on the plane:
where
| the extra-terrestrial radiation incident on the plane | |
| the solar constant |
Boland-Ridley-Lauret (BRL) model to estimate the horizontal diffuse solar radiation from the global horizontal solar radiation.
where
| Diffuse fraction | |
| Hourly horizontal diffuse solar radiation | |
| Hourly horizontal global solar radiation | |
| Hourly clearness index | |
| Apparent solar time | |
| Solar angle in degrees | |
| Daily clearness index | |
| Error or residual values | |
| Hourly extraterrestrial radiation |
Hay and McKay model to estimate the solar irradiance on the tilted panel.
where
| Diffuse solar irradiance for an inclined surface | |
| Diffuse sky irradiance | |
| Radiant intensity at normal incidence | |
| Solar constant | |
| Angle of incidence between Sun and normal to the surface | |
| Solar zenith angle | |
| Panel tilted angle (slope angle) |
References
- Esen, H.; Ozgen, F.; Esen, M.; Sengur, A. Modelling of a new solar air heater through least-squares support vector machines. Expert Syst. Appl. 2009, 36, 10673–10682. [Google Scholar] [CrossRef]
- Sopian, K.; Supranto; Daud, W.R.W.; Othman, M.Y.; Yatim, B. Thermal performance of the double-pass solar collector with and without porous media. Renew. Energy 1999, 18, 557–564. [Google Scholar] [CrossRef]
- Akpinar, E.K.; Koçyiğit, F. Energy and exergy analysis of a new flat-plate solar air heater having different obstacles on absorber plates. Appl. Energy 2010, 87, 3438–3450. [Google Scholar] [CrossRef]
- Promvonge, P.; Khanoknaiyakarn, C.; Kwankaomeng, S.; Thianpong, C. Thermal behavior in solar air heater channel fitted with combined rib and delta-winglet. Int. Commun. Heat Mass Transf. 2011, 38, 749–756. [Google Scholar] [CrossRef]
- El-Sebaii, A.A.; Aboul-Enein, S.; Ramadan, M.R.I.; El-Bialy, E. Year round performance of double pass solar air heater with packed bed. Energy Convers. Manag. 2007, 48, 990–1003. [Google Scholar] [CrossRef]
- Jaurker, A.R.; Saini, J.S.; Gandhi, B.K. Heat transfer and friction characteristics of rectangular solar air heater duct using rib-grooved artificial roughness. Solar Energy 2006, 80, 895–907. [Google Scholar] [CrossRef]
- Skullong, S.; Kwankaomeng, S.; Thianpong, C.; Promvonge, P. Thermal performance of turbulent flow in a solar air heater channel with rib-groove turbulators. Int. Commun. Heat Mass Transf. 2014, 50, 34–43. [Google Scholar] [CrossRef]
- Naphon, P. On the performance and entropy generation of the double-pass solar air heater with longitudinal fins. Renew. Energy 2005, 30, 1345–1357. [Google Scholar] [CrossRef]
- Chabane, F.; Moummi, N.; Benramache, S. Experimental study of heat transfer and thermal performance with longitudinal fins of solar air heater. J. Adv. Res. 2014, 5, 183–192. [Google Scholar] [CrossRef] [PubMed] [Green Version]
- Bahrehmand, D.; Ameri, M.; Gholampour, M. Energy and exergy analysis of different solar air collector systems with forced convection. Renew. Energy 2015, 83, 1119–1130. [Google Scholar] [CrossRef]
- Yang, M.; Yang, X.; Li, X.; Wang, Z.; Wang, P. Design and optimization of a solar air heater with offset strip fin absorber plate. Appl. Energy 2014, 113, 1349–1362. [Google Scholar] [CrossRef]
- Dhiman, P.; Thakur, N.S.; Chauhan, S.R. Thermal and thermohydraulic performance of counter and parallel flow packed bed solar air heaters. Renew. Energy 2012, 46, 259–268. [Google Scholar] [CrossRef]
- Hernández, A.L.; Quiñonez, J.E. Analytical models of thermal performance of solar air heaters of double-parallel flow and double-pass counter flow. Renew. Energy 2013, 55, 380–391. [Google Scholar] [CrossRef]
- Yeh, H.M.; Lin, T.T. Efficiency improvement of flat-plate solar air heaters. Energy 1996, 21, 435–443. [Google Scholar] [CrossRef]
- El-Sebaii, A.A.; Aboul-Enein, S.; Ramadan, M.R.I.; Shalaby, S.M.; Moharram, B.M. Thermal performance investigation of double pass-finned plate solar air heater. Appl. Energy 2011, 88, 1727–1739. [Google Scholar] [CrossRef]
- El-Sebaii, A.A.; Aboul-Enein, S.; Ramadan, M.R.I.; Shalaby, S.M.; Moharram, B.M. Investigation of thermal performance of-double pass-flat and v-corrugated plate solar air heaters. Energy 2011, 36, 1076–1086. [Google Scholar] [CrossRef]
- Karim, M.; Hawlader, M. Performance investigation of flat plate, v-corrugated and finned air collectors. Energy 2006, 31, 452–470. [Google Scholar] [CrossRef]
- Ozgen, F.; Esen, M.; Esen, H. Experimental investigation of thermal performance of a double-flow solar air heater having aluminium cans. Renew. Energy 2009, 34, 2391–2398. [Google Scholar] [CrossRef]
- Omojaro, A.P.; Aldabbagh, L.B.Y. Experimental performance of single and double pass solar air heater with fins and steel wire mesh as absorber. Appl. Energy 2010, 87, 3759–3765. [Google Scholar] [CrossRef]
- El-khawajah, M.F.; Aldabbagh, L.B.Y.; Egelioglu, F. The effect of using transverse fins on a double pass flow solar air heater using wire mesh as an absorber. Solar Energy 2011, 85, 1479–1487. [Google Scholar] [CrossRef]
- Esen, H. Experimental energy and exergy analysis of a double-flow solar air heater having different obstacles on absorber plates. Build. Environ. 2008, 43, 1046–1054. [Google Scholar] [CrossRef]
- Aldabbagh, L.B.Y.; Egelioglu, F.; Ilkan, M. Single and double pass solar air heaters with wire mesh as packing bed. Energy 2010, 35, 3783–3787. [Google Scholar] [CrossRef]
- Mahmood, A.J.; Aldabbagh, L.B.Y.; Egelioglu, F. Investigation of single and double pass solar air heater with transverse fins and a package wire mesh layer. Energy Convers. Manag. 2015, 89, 599–607. [Google Scholar] [CrossRef]
- Nowzari, R.; Aldabbagh, L.B.Y.; Egelioglu, F. Single and double pass solar air heaters with partially perforated cover and packed mesh. Energy 2014, 73, 694–702. [Google Scholar] [CrossRef]
- Cengel, Y.A. Thermodynamics: An Engineering Approach, 8th ed.; McGraw-Hill Education: New York, NY, USA, 2015; p. 996. [Google Scholar]
- Lamigueiro, P.O. solaR: Solar Radiation and Photovoltaic Systems with R. J. Stat. Softw. 2012, 50, 1–32. [Google Scholar]
- Spencer, J.W. Fourier Series Representation of the Position of the Sun. Search 1971, 2, 172. [Google Scholar]
- Ridley, B.; Boland, J.; Lauret, P. Modelling of diffuse solar fraction with multiple predictors. Renew. Energy 2010, 35, 478–483. [Google Scholar] [CrossRef]
- Boland, J. Tools for Estimating Solar Radiation on Inclined Surfaces. Available online: http://www.lowcarbonlivingcrc.com.au/sites/all/files/event_file_attachments/session_2_-_estimating_solar_radiation_prof_j_boland.pdf (accessed on 13 March 2016).
- Hay, J.E.; McKay, D.C. Estimating Solar Irradiance on Inclined Surfaces: A Review and Assessment of Methodologies. Int. J. Solar Energy 1985, 3, 203. [Google Scholar] [CrossRef]
- Cortés, A.; Piacentini, R. Improvement of the efficiency of a bare solar collector by means of turbulence promoters. Appl. Energy 1990, 36, 253–261. [Google Scholar] [CrossRef]
- Mittal, M.K.; Varshney, L. Optimal thermohydraulic performance of a wire mesh packed solar air heater. Solar Energy 2006, 80, 1112–1120. [Google Scholar] [CrossRef]
- Sopian, K.; Alghoul, M.A.; Alfegi, E.M.; Sulaiman, M.Y.; Musa, E.A. Evaluation of thermal efficiency of double-pass solar collector with porous–nonporous media. Renew. Energy 2009, 34, 640–645. [Google Scholar] [CrossRef]
- McGowan, P. A Thermal Model for a Solar Ventilation System Used in NZ Schools. Master’s Dissertation, Massey University, Auckland, New Zealand, 2016. [Google Scholar]
- R Core Team. R: A Language and Environment for Statistical Computing. R Foundation for Statistical Computing; R Core Team: Vienna, Austria, 2016. [Google Scholar]
- Tyagi, V.V.; Panwar, N.L.; Rahim, N.A.; Kothari, R. Review on solar air heating system with and without thermal energy storage system. Renew. Sustain. Energy Rev. 2012, 16, 2289–2303. [Google Scholar] [CrossRef]
- Wang, Y.; Boulic, M.; Phipps, R.; Plagmann, M.; Cunningham, C.; Theobald, C.; Howden-Chapman, P.; Baker, M. Impacts of a solar ventilation unit on temperature and ventilation rate in New Zealand schools: An intervention study. In Proceedings of the 14th International Conference of Indoor Air Quality and Climate, Ghent, Belgium, 3–7 July 2016. [Google Scholar]
- Boulic, M.; Wang, Y.; Phipps, R.; Plagmann, M.; Cunningham, C.; Theobald, C.; Howden-Chapman, P.; Baker, M. Increasing the ventilation rate and temperature in New Zealand classrooms using a solar roof collector. In Proceedings of the Central European towards Sustainable Building, Prague, Czech Repubic, 2–4 July 2019. [Google Scholar]
- Prasad, S.B.; Saini, J.S.; Singh, K.M. Investigation of heat transfer and friction characteristics of packed bed solar air heater using wire mesh as packing material. Solar Energy 2009, 83, 773–783. [Google Scholar] [CrossRef]
Figure 1.
Exploded view of the studied solar air heater.

Figure 2.
Schematic view of the studied solar air heater.

Figure 3.
Setup of the experiment.

Figure 4.
Hourly levels of the global horizontal solar radiation, ambient temperature and wind speed on each test day.
Figure 4.
Hourly levels of the global horizontal solar radiation, ambient temperature and wind speed on each test day.

Figure 5.
Efficiency of the solar air heater versus the value of the efficiency function at different air mass flow rate. The efficiency function is the temperature difference between outlet air (Toutlet), and inlet air (Tinlet) divide the solar radiation on the collector panel (IT).
Figure 5.
Efficiency of the solar air heater versus the value of the efficiency function at different air mass flow rate. The efficiency function is the temperature difference between outlet air (Toutlet), and inlet air (Tinlet) divide the solar radiation on the collector panel (IT).

Figure 6.
Thermal efficiency and effective efficiency of the solar air heater versus the value of the efficiency function at different air mass flow rate. The efficiency function is the temperature difference between outlet air (Toutlet), and inlet air (Tinlet) divide the solar radiation on the collector panel (IT).


Table 1.
Efficiencies of several types of solar air heater operated at different air mass flow rate.
Table 1.
Efficiencies of several types of solar air heater operated at different air mass flow rate.
| Study | Air Mass Flow Rate (kg/s) | Cover | Flow Type | Absorber Layer | Efficiency (%) | Reference |
|---|---|---|---|---|---|---|
| 1 | 0.010 kg/s; 0.020 kg/s; 0.030 kg/s; 0.040 kg/s; 0.050 kg/s; 0.060 kg/s. | Double glazed | Double parallel pass; Placing the absorber plate in the middle of the air channel forming the equal upper and lower flow channel. | Type 1: flat plate; Type 2: longitudinal fins below and above the absorber layer; Type 3: V-corrugated shaped absorber layer. | Type 3 was 11% to 14% more efficiency than Type 1; Type 3 was 9% to 12% more efficient than Type 2; Maximum efficiencies at air mass flow rate of 0.060 kg/s: Type 1: 58%; Type 2: 56%; Type 3: 65%. | [15,16] |
| 2 | 0.010 kg/s; 0.020 kg/s; 0.030 kg/s; 0.040 kg/s; 0.050 kg/s; 0.060 kg/s. | Single glazed | Type 1, 2, 3 single pass under the absorber layer; Type 4, 5, 6 double counter pass. First channel was formed by the glass cover and the absorber layer. Second channel was formed by the absorber layer and the insulation layer. | Type 1 and Type 4: flat plate; Type 2 and Type 5: longitudinal fins below the absorber layer; Type 3 and Type 6: V-corrugated shape absorber layer. | Maximum efficiencies at air mass flow rate of 0.060 kg/s: Type 1: 65%; Type 2: 69%; Type 3: 75%; Type 4: 78%; Type 5: 79%; Type 6: 82%. | [17] |
| 3 | 0.012 kg/s; 0.016 kg/s. | Single glazed | Single pass | Type 1: galvanized iron sheet with 0.5 mm thick black chrome selective coating, without fins; Type 2: five longitudinal and hollow semi-cylindrical fins located below the absorber layer | Maximum efficiencies at air mass flow rate of 0.012 kg/s and 0.016 kg/s: Type 1: 35% and 44% respectively; Type 2: 40% and 52% respectively. | [9] |
| 4 | 0.030 kg/s; 0.050 kg/s. | Single glazed | Double parallel pass; Placing the absorber layer in the middle of the air channel forming the upper and lower flow channel. | Absorber layer was formed by aluminum cans. Type 1: flat aluminum plate with zag-zig staggered arranged aluminum cans on both sides; Type 2: flat aluminum plate with orderly arranged aluminum cans on both side; Type 3: flat aluminum plate with no cans on both sides. | The maximum efficiency (73%) was found in Type 1 SAH at air mass flow rate of 0.050 kg/s. Mean efficiencies at air mass flow rate 0.030 kg/s and 0.050 kg/s respectively: Type 1: 41% and 55%; Type 2: 36% and 47%; Type 3: 31% and 43%. | [18] |
| 5 | 0.012 kg/s to 0.038 kg/s | Double glazed; | Type 1: Single pass through wire mesh; Type 2: Double counter pass through wire mesh. | A steel wire mesh with fins. | Maximum efficiencies at air mass flow rate of 0.038 kg/s: Type 1: 60%; Type 2: 64%. | [19] |
| 6 | 0.012 kg/s to 0.042 kg/s | Double glazed; | Double pass; First flow channel was formed by the two glass layers; Second flow channel was formed by the lower glass cover and the absorber layer. | Wire mesh layers between the fins; Type 1: With 2 fins attached; Type 2: With 4 fins attached; Type 3: With 6 fins attached. | Maximum efficiencies at air mass flow rate of 0.042 kg/s: Type 1: 75%; Type 2: 82%; Type 3: 86%. | [20] |
Table 2.
The characteristics of the monitoring devices.
| Device | Monitored Parameters | Range | Accuracy |
|---|---|---|---|
| HP2000 weather station | Solar irradiance (W/m2) | 0–3000 W/m2 | ±15% |
| Ambient air temperature (°C) | −30–65 °C | ±1 °C | |
| Wind speed (m/s) | 0–50 m/s | ± 1 m/s (wind speed <5 m/s); ± 10% (wind speed >5 m/s) | |
| AM4214SD hot wire anemometer | Outlet air velocity (m/s) | 0.2–25 m/s | ±5% of reading |
| Outlet air temperature (°C) | 0–50 °C | ±0.8 °C |
Table 3.
Air density and air specific heat capacity under different temperature; Source: [25].
Table 3.
Air density and air specific heat capacity under different temperature; Source: [25].
| Air Temperature (K) | Air Density (kg/m3) | Air specific Heat Capacity (J/(kg*K)) | Air Dynamic Viscosity × 10−5 (kg/(m*s)) |
|---|---|---|---|
| [273.15, 283.15] | 1.269 | 1006 | 1.748 |
| [283.15, 293.15] | 1.225 | 1007 | 1.797 |
| [293.15, 303.15] | 1.184 | 1007 | 1.844 |
| [303.15, 313.15] | 1.145 | 1007 | 1.892 |
| [313.15, 323.15] | 1.109 | 1007 | 1.938 |
| [323.15, 333.15] | 1.076 | 1007 | 1.984 |
| [333.15, 343.15] | 1.044 | 1007 | 2.029 |
Table 4.
Mean (± standard deviation) values of the global horizontal solar radiation, ambient temperature and wind speed on each test day.
Table 4.
Mean (± standard deviation) values of the global horizontal solar radiation, ambient temperature and wind speed on each test day.
| Test Day | Solar Radiation (W/m2) | Ambient Temperature (°C) | Wind Speed (m/s) |
|---|---|---|---|
| Day 1 | 703.3 ± 286.6 | 19.6 ± 1.3 | 1.9 ± 1.1 |
| Day 2 | 374.8 ± 161.6 | 18.5 ± 1.3 | 1.3 ± 1.0 |
| Day 3 | 473.6 ± 255.8 | 18.3 ± 1.1 | 1.5 ± 1.1 |
| Day 4 | 566.7 ± 277.9 | 17.3 ± 0.8 | 2.3 ± 1.3 |
| Day 5 | 626.5 ± 299.2 | 18.6 ± 1.0 | 2.5 ± 1.4 |
| Day 6 | 616.5 ± 252.2 | 21.3 ± 1.0 | 3.0 ± 1.5 |
| Day 7 | 622.0 ± 314.3 | 18.7 ± 1.0 | 1.5 ± 1.0 |
| Day 8 | 529.6 ± 152.8 | 21.3 ± 0.6 | 1.7 ± 1.0 |
| Day 9 | 385.3 ± 180.3 | 18.2 ± 0.9 | 2.3 ± 1.3 |
Table 5.
The mean and standard deviation (SD) of the velocity, air mass flow rate, solar radiation on the collector surface, outlet air temperature, and the temperature difference between the outlet air and the inlet air of the SAH on each test day.
Table 5.
The mean and standard deviation (SD) of the velocity, air mass flow rate, solar radiation on the collector surface, outlet air temperature, and the temperature difference between the outlet air and the inlet air of the SAH on each test day.
| Percent of Maximum Speed of the Ventilator (%) | Test Day | Velocity (m/s) | Air Mass Flow Rate (kg*s−1) | IT1 (W/m2) | T 2 Outlet Air (°C) | T Difference 3 (°C) |
|---|---|---|---|---|---|---|
| 50% | Day 1 | 1.5 ± 0.1 | 0.014 ± 0.006 | 552 ± 178 | 45.2 ± 9.3 | 25.5 ± 8.3 |
| Day 2 | 1.5 ± 0.1 | 0.021 ± 0.001 | 297 ± 113 | 31.6 ± 6.4 | 13.1 ± 5.6 | |
| Day 3 | 1.6 ± 0.1 | 0.021 ± 0.004 | 376 ± 153 | 34.6 ± 8.3 | 16.3 ± 7.8 | |
| Day 4 | 1.7 ± 0.1 | 0.019 ± 0.006 | 451 ± 106 | 39.5 ± 8.9 | 22.2 ± 8.7 | |
| 75% | Day 5 | 2.6 ± 0.1 | 0.034 ± 0.005 | 490 ± 112 | 37.1 ± 6.1 | 18.6 ± 5.7 |
| Day 6 | 2.7 ± 0.1 | 0.035 ± 0.004 | 478 ± 111 | 39.1 ± 5.5 | 17.8 ± 5.3 | |
| Day 7 | 2.7 ± 0.1 | 0.036 ± 0.005 | 494 ± 175 | 36.9 ± 8.9 | 18.3 ± 8.3 | |
| Day 8 | 2.7 ± 0.1 | 0.036 ± 0.002 | 414 ± 92 | 36.9 ± 5.0 | 15.5 ± 4.9 | |
| 100% | Day 9 | 4.0 ± 0.1 | 0.056 ± 0.005 | 304 ± 117 | 29.7 ± 6.3 | 11.5 ± 5.9 |
1 Solar radiation on the collector surface (W/m2). 2 Temperature of the outlet air. 3 Temperature difference between the outlet air and the inlet air, ΔT (Toutlet-Tinlet).
© 2020 by the authors. Licensee MDPI, Basel, Switzerland. This article is an open access article distributed under the terms and conditions of the Creative Commons Attribution (CC BY) license (http://creativecommons.org/licenses/by/4.0/).
Share and Cite
MDPI and ACS Style
Wang, Y.; Boulic, M.; Phipps, R.; Plagmann, M.; Cunningham, C. Experimental Performance of a Solar Air Collector with a Perforated Back Plate in New Zealand. Energies 2020, 13, 1415. https://0-doi-org.brum.beds.ac.uk/10.3390/en13061415
AMA Style
Wang Y, Boulic M, Phipps R, Plagmann M, Cunningham C. Experimental Performance of a Solar Air Collector with a Perforated Back Plate in New Zealand. Energies. 2020; 13(6):1415. https://0-doi-org.brum.beds.ac.uk/10.3390/en13061415
Chicago/Turabian StyleWang, Yu, Mikael Boulic, Robyn Phipps, Manfred Plagmann, and Chris Cunningham. 2020. "Experimental Performance of a Solar Air Collector with a Perforated Back Plate in New Zealand" Energies 13, no. 6: 1415. https://0-doi-org.brum.beds.ac.uk/10.3390/en13061415
Note that from the first issue of 2016, this journal uses article numbers instead of page numbers. See further details here.