Article

Co-Combustion of Municipal Sewage Sludge and Biomass in a Grate Fired Boiler for Phosphorus Recovery in Bottom Ash

1
Swedish Centre for Resource Recovery, University of Borås, SE-501 90 Borås, Sweden
2
Department of Applied Physics and Electronics, Umeå University, SE-901 87 Umeå, Sweden
*
Author to whom correspondence should be addressed.
Submission received: 15 February 2020 / Revised: 19 March 2020 / Accepted: 26 March 2020 / Published: 3 April 2020
(This article belongs to the Special Issue Materials Recycling and Energy Use of Waste)

Abstract

:
Phosphorus has been identified as a critical element by the European Union and recycling efforts are increasingly common. An important phosphorus-containing waste stream for recycling is municipal sewage sludge (MSS), which is used directly as fertilizer to farmland. However, it contains pollutants such as heavy metals, pharmaceutical residues, polychlorinated bi-phenyls (PCBs) and nano-plastics. The interest in combustion of MSS is continuously growing, as it both reduces the volume as well as destroys the organic materials and could separate certain heavy metals from the produced ashes. This results in ashes with a potential for either direct use as fertilizer or as a suitable feedstock for upgrading processes. The aim of this study was to investigate co-combustion of MSS and biomass to create a phosphorus-rich bottom ash with a low heavy metal content. A laboratory-scale fixed-bed reactor in addition to an 8 MWth grate-boiler was used for the experimental work. The concentration of phosphorus and selected heavy metals in the bottom ashes were compared to European Union regulation on fertilizers, ash application to Swedish forests and Swedish regulations on sewage sludge application to farmland. Element concentrations were determined by ICP-AES complemented by analysis of spatial distribution with SEM-EDS and XRD analysis to determine crystalline compounds. The results show that most of the phosphorus was retained in the bottom ash, corresponding to 9–16 wt.% P2O5, while the concentration of cadmium, mercury, lead and zinc was below the limits of the regulations. However, copper, chromium and nickel concentrations exceeded these standards.

1. Introduction

Phosphorus (P) is one of the elements that is listed as a critical raw material by the European Union (EU) [1] for its high economic importance and high supply risk. In addition, phosphorus has been identified as the most critical nutrient when it comes to the ability to provide the World’s population with food. Today, only a small amount of the phosphates used in food production and other industries are recycled, and most of them instead end up in the oceans, causing algae bloom and eutrophication. In modern society, municipal sewage sludge (MSS) is a waste stream that contains high amounts of phosphate derived from human feces and urine. Within EU countries, just under 50% of the annual MSS production is used on farmland as fertilizer (Eurostat, 2018); however, that is not a preferred way to recycle phosphorus from untreated MSS because of the multitude of unwanted substances and elements the sludge contains, i.e., heavy metals, pharmaceutical residues [2,3], persistent organic pollutants (POPs) like polychlorinated bi-phenyls (PCBs) [4,5,6,7] and Nano-plastics [8,9].
During combustion, organic compounds in MSS are destroyed, and only inorganic elements remain in the ash [10]. Several European countries, like Belgium, Germany, the Netherlands, and Switzerland, have chosen combustion as the primary method of disposal of this complex material [11]. Unfortunately, the phosphorus is typically not recycled today as, e.g., Germany disposes most of the ash either in landfill or in mines [12]. However, a recent change in the German legislation for wastewater treatment plants (WWTP) [13] has imposed a demand for phosphorus recovery effective from 2029. Until then, these WWTPs have to present an action plan by 2023 on how to achieve this. A facility in Ulm, Germany, which has both wastewater treatment and sewage sludge combustion at the same site, has since 2014 been bringing their ash to market for direct use as phosphate fertilizer [14]. In Sweden there are currently no demands for phosphorus recovery from MSS. However, just recently a new phosphorus report was published [15] as a response to an inquiry into proposing a ban on spreading sewage sludge on farmland and a phosphorus recycling requirement, on behalf of the Swedish government. Today, about 33% of MSS in Sweden is applied to farmland and about 2% is burned (Eurostat, 2018), mainly as a co-fuel together with municipal solid waste followed by ash-disposal or as construction material on landfill.
Plant availability is paramount for fertilizers. This can be measured either directly in pot experiments [16] or indirectly by P-solubility testing in water, neutral ammonium citrate solution [10], or by a fractionation procedure [17]. Sewage sludge ash (SSA) is generally considered to be poorly bioavailable; thus, additional treatment is required to improve this important property. However, Nanzer et al. [17] conducted a comparison between the fractionation procedure and pot experiments to assess the bioavailability for SSA, thermally treated SSA (t-SSA), phosphate rock (PR) and triple superphosphate (TSP). They found the aqueous solubility for SSA and t-SSA to be very low, but these materials still showed bioavailable properties in the pot experiments. They also concluded that the crystalline degree (assessed by XRD-measurement) of the material was in better agreement with the bioavailability, in that the lower the fraction of crystalline P-phases was, the higher the bioavailability of the material. SSA had less crystalline phases and higher plant availability than the corresponding t-SSA. Wilken et al. [18] and Egle et al. [19] showed that soil pH was an important factor for the P-uptake ability of the plants, especially for t-SSA. These investigations were all conducted with fly ash from fluidized bed mono-combustion of sewage sludge. To the best of our knowledge, no bioavailability data has been reported on bottom ash from co-combustion of sewage sludge in grate boilers.
The high water content (70–85%) in dewatered sludge [20] is not ideal for mono-combustion. Consequently, further drying is required, which is an energy-intensive process step. This could be avoided by blending the dewatered sludge with another energy carrier, such as biomass or coal, which has a lower moisture content, higher heating value, or both. Co-combustion of MSS and biomass or coal has attracted attention from several researchers [21,22,23,24,25,26], and the concept offers the possibility of mixing two or more fuels so that the combined heating value leads to an efficient operation of already existing boilers with proper combustion temperatures. Most of the focus has been on co-combustion using fluidized bed boilers and there are only a few examples in which grate type boilers [24] have been used. The common denominator is the focus on heavy metal mobility during combustion of MSS and several aspects are discussed that affect species volatility among which the combustion temperature is the most important. Varying process parameters, such as temperature, could redistribute trace elements into different ash fractions, such as bottom ash or fly ash, and thereby partly separate those from P [27,28]. However, fluidized bed combustion is limited by the bed agglomeration temperature which must not be exceeded for the process to continue while grate type boilers can accept higher temperatures as sand agglomeration is not an issue. Grate type boilers also offer a more straightforward ash handling procedure, as there is no bed sand from which to separate the ashes.
The aim of the present work is to study co-combustion of sewage sludge and biomass in a grate-fired boiler to determine whether the bottom ash fraction is suitable for phosphorus recovery based on its elemental concentrations of phosphorus and heavy metals. Laboratory-scale investigations were carried out to evaluate co-combustion of pre-dried MSS with bark or horse dung in ratios 20, 40, 50 and 100 weight% (wt.%) MSS. Industrial scale co-combustion was carried out with 30 wt.% pre-dried MSS and 70 wt.% raw soft wood (SW) in an 8 MWth grate-fired reciprocating refractory lined furnace. Due to practical and financial limitations, it was impossible to test bark and dung at an industrial scale. Bottom ashes from both processes were evaluated with respect to their suitability as fertilizer without any post-treatment. This specifically targeted retention of P and decreased concentration of the regulated elements arsenic (As), cadmium (Cd), chromium (Cr), copper (Cu), mercury (Hg), nickel (Ni), lead (Pb) and zinc (Zn) in the bottom ash. The results are put into perspective by comparison with four different regulations: the Swedish limits for agricultural application of sewage sludge in ordinance SFS 1998:994 [29], regulation by Swedish forest protection agency on forest application of ashes [30], regulation SNFS 1994:2 by the Swedish Environmental Protection Agency [31] of farmland application of sewage sludge in relation to P content and the newly published EU-regulation 2019/1009 on fertilizer products [32].

2. Materials and Methods

2.1. Fuels

The sewage sludge, MSS, used in this investigation came from Solviken municipal wastewater treatment plant (MWWTP) (19,000 population equivalent) in Mora, Sweden. This MSS, as is the case with all Swedish MSS, is analyzed continuously, and to make sure that the concentrations reported here are valid, six analyses made between June 2012 and June 2014 were compared with the current analysis. The largest difference in concentrations was found for Cd with values from 1.9 to 4.7 mg (kg ash)−1; however, most analyses had a variation in the range of 2% to 20%. In addition, no trends in change of concentrations over the year were found. Solviken produces belt-dried non-digested sewage sludge with chemical precipitation of phosphate from the wastewater by addition of an aluminum polymer (Kemiras PAX 215). Bark was also collected in Mora, Sweden, and originated from a saw-mill. Horse dung (dung), i.e., horse manure without bedding material, was collected at a local horse stable near Borås, Sweden. The bark and dung were dried in an oven at 105 °C for 48 h before they were used in the experiments. The soft wood (SW) originated from the forests in Dalsland and Värmland, Sweden, and were not dried before combustion. Some measured and calculated fuel properties are presented in Table 1 and Table 2.

2.2. Laboratory-Scale Experiments

2.2.1. Laboratory-Scale Reactor

The laboratory-scale reactor used, as depicted in Figure 1, was an electrically heated fixed-bed ENTECH vertical steel tube (253 MA Inconel) with an inner diameter of 70 mm and a height of 1300 mm. It was fitted with four thermocouples (three at the left side and one in the fixed bed), primary (bottom) and secondary (right side, upper) air inlets. A cyclone is fitted on top of the reactor and the bottom part is used for both fuel input and ash output. The fixed bed (ceramic Gooch crucible, Figure 1c,d) is mounted on the tube (no. 2 in Figure 1b) lifting the fixed bed 350 mm into the reactor. The Gooch crucible has a perforated bottom, allowing primary air to continuously pass close to the heated sample. The heating zone is 500 mm in height and starts 150 mm below and ends 350 mm above the fixed bed. The airflow through the reactor was controlled using mass flow regulators (BROOKS Instruments) and corresponding software.

2.2.2. Laboratory-Scale Combustion Experiments

For each experiment, a total of 10 g of fuel, with particle size 1 to 50 mm, was put in a Gooch crucible. The crucible was inserted into the hot reactor and held there for 15 min with primary and secondary air flow of 20 L per minute, respectively, until the sample was completely combusted. It was then removed and allowed to reach room temperature in ambient air. The time inside the reactor was selected to mimic the retention time in a large-scale grate fired boiler (approx. 20 MW). Three replicates were made for each fuel combination in which 20, 40, 50 and 100 wt.% MSS were mixed with bark or horse dung (dung) as co-fuel before the sample was burned in the reactor. The temperature inside the reactor just below the fuel sample was determined to be 775 ± 25 °C using a thermocouple. During fuel conversion, this temperature increases, predominately during combustion of volatiles. Temperatures were also measured in the reactor tube at three locations, outside the sample (Gooch crucible), 200 mm and 400 mm above the sample, and the mean temperatures at these locations were 910 ± 15, 900 ± 18 and 700 ± 25 °C, respectively. The resulting ash was collected from the Gooch crucible after each experiment and is expected to resemble grate bottom ash. No measurements were performed on flue gas or fly ashes due to the small sample volumes.

2.3. Industrial-Scale Experiments

2.3.1. Grate Fired Boiler

The boiler combustion tests were performed in an 8 MWth reciprocating grate fired boiler located in Uddevalla, Sweden and built by HOTAB/Saxlund. The boiler was designed for combustion of wet biomass such as soft wood with a moisture content of up to 55 wt.% and contains a refractory lined furnace in which the combustion takes place on the sloping moving grate as can be seen in Figure 1. The fuel is fed onto the grate by a mechanical stoker. The conversion of the fuel on the moving grate is assumed to follow the combustion pattern suggested by Razmjoo et al. [33] and is divided into different zones for drying, pyrolysis/volatilization and char combustion. Bottom ash is removed by a mechanical feeder located in the ditch after the grate. As depicted in Figure 2, the after-burning section is located at the top of the furnace. This section is also equipped with refractory lining. In this section, additional air is supplied to the tertiary air ports, thereby securing a proper burnout of hydrocarbons and CO in the gas phase of the combustion gas leaving the middle section of the furnace. The temperature at the exit of the after burning chamber is 870 °C–910 °C. Heat is extracted from the flue gases in the boiler section, built as a vertical fire tube boiler located adjacent to the furnace.

2.3.2. Operation Conditions and Sampling

Two tests were performed in the grate-fired boiler. One reference test with fresh SW and one co-combustion test using a mixture of dried MSS and fresh SW. The boiler was designed for a fuel with a moisture content up to 55 wt.%, and with the addition of dried MSS the moisture content of the fuel mixture would decrease with an increasing amount of MSS, see Table 1. As a lower moisture content results in higher bed temperatures, there was an increased risk of slag formation and fouling. Therefore, the MSS ratio was increased stepwise in order to carefully monitor the slag formation and fouling tendency in the boiler. With 30 wt.% MSS and 70 wt.% SW in the fuel mixture with a moisture content of 34 wt.%, the decision was taken not to increase the MSS ratio any further in order to avoid the risk of slagging and ultimately boiler shutdown. The fuel properties are presented in Table 1.
Long-term combustion tests were carried out since it takes time to achieve steady state in the boiler and representative ash properties of the bottom bed ash. The reference combustion of SW was therefore performed for 48 h and at the end of that period the bottom ash sample was taken. Thereafter, the co-combustion of the mixture MSS-SW 30–70 was performed for 120 h. Bottom ash slag samples were taken at hour 56, 60, 64, 80, 84, 88, 112, 116 and 120. Each slag sample was crushed before it was split using a sample divider, and then all nine sub ashes were combined into a single sample, mixed and split again into one final master sample of bottom ash which was used in the analysis. Apart from the bottom ash samples, filter ash and multi-cyclone ash were also collected. The filter ash was collected for 11 hours at a time, once a day, during the 5-day test period. Filter ash samples from days 3, 4 and 5 were split separately by sample divider. The divided samples were then combined, mixed and divided again into one master filter ash sample which was used in the analysis. One ash sample from a multi-cyclone was also taken and analyzed. A single fuel feeding system was used at the boiler, which caused no problems for the reference case with SW but required careful premixing of MSS with SW to achieve an even mixture of the fuel to ensure stable operating conditions during the co-combustion case.

2.4. Analysis

The fuels MSS and SW, together with ash samples from the large-scale experiments, were analyzed by the accredited lab Eurofins according to the methods SS187117:1997, EN14774-1,2,3:2011 (mod.)/SS187, SS187187:1995, EN13656 (mod.)/ICP-AES or ICP-MS, EN14385 / ICP-AES, EN ISO 11885:2009 / SS028150 ver. 2 and SS028150 (mod.) / SS-EN ISO 17852 (mod.). Ash samples from the lab-scale tests (100 mg/sample) were dissolved using microwave digestion (Milestone ETHOS UP microwave oven) and concentrated acids (6 mL HNO3, 2 mL HCl, 1 mL HF and 0.5 mL H2O2), diluted to 50 mL with Milli-Q water (MERCK Millipore IQ 7000 fitted with a 12 FO Vent filter) and filtered (0.20 µm). All samples were analyzed using an Agilent Technologies Microwave Plasma-Atomic Emission Spectrometer (MP-AES) 4200 with 1% Nitric Acid aqueous carrier.
Some ash samples from the lab-scale tests were sent to an accredited laboratory, ALS Scandinavia, for control of the results. Those samples were analyzed using ICP-SFMS according to the methods SS EN ISO 17294-1, 2 (mod) and EPA-method 200.8 (mod). The authors are aware that these methods are not sufficient to dissolve silicate minerals completely and hence concentrations of silicon in fuels and ashes are underestimated for data generated using these methods. Mean values and sample standard deviations were calculated for all analytical data with sample size (n) ≥ 2.
The chemical composition and morphology of the ash samples were characterized using variable-pressure scanning electron microscopy (VP-SEM; Carl Zeiss Evo LS-15), with a backscattered electron detector at an accelerating voltage of 20 kV and probe current of 500-700 pA. Elemental analysis was performed using an energy-dispersive X-ray spectrometer (EDX; Oxford Instruments X-Max 80 mm2). Ash samples were prepared using two methods, where ashes from lab-scale experiments were transferred to carbon tape, while molten ash particles (large-scale) were cast in epoxy resin and dry-polished with silicon carbide paper to prepare cross sections for analysis.
Powder X-ray diffraction (XRD) analysis for identification and semi-quantitative distribution of crystalline compounds was performed with a Bruker-AXS D8Advance X-ray diffractometer in θ-θ mode, using Cu-Kα radiation and a Våntec-1 detector with continuous rotating scans in a range from 10° to 70°. Diffractograms were evaluated with Diffrac.EVA 4.2 with PDF-4+ database [34] for identification of crystalline phases and semi-quantitative information on the present crystalline phases was obtained using full width half maximum peak width, FWHM. The quantification of amorphous and crystalline content was estimated based on the diffractogram area not assigned to crystalline peaks. This estimation of amorphous material is for internal comparison purposes between sample types, since there are analytical challenges in accurately estimating the actual share of crystalline sample in a heterogeneous mixture.

3. Results

3.1. Laboratory-Scale Experiments

Co-combustion strategies were evaluated at laboratory scale based on elemental concentration of phosphorus and heavy metals. This allows us to determine whether the produced bottom ash fractions meet legislated requirements for application on arable land. Sweden currently has a ban on the application of sewage sludge ash in farmland, and hence there is no regulation in place with respect to the heavy metal concentrations in such ashes. However, there are limits for ash application on forest land that are set by the Swedish Forest Agency (Forest limits). For agricultural applications, legislation on heavy metal concentrations only exists for sewage sludge, and therefore these are used here as a reference, regulation 1998:994 (farmland limits). These limits are presented in Table 3. There is also an additional regulation, SNFS 1994:2, which is set by the Swedish Environmental Protection Agency and regulates the maximum amount of selected elements that is allowed to be applied to farmland (g per hectare and year). The maximum amount of phosphorus that can be added is 22 kg per hectare and year, when sewage sludge is applied to Swedish farmland. These limits, together with the resulting concentrations in the analyzed samples, are presented in Table 4. Just recently, the European Union agreed on a regulation for marketing fertilizer products of different origins, where ashes from sewage sludge combustion is one of the sources mentioned. This regulation also applies to Sweden and is provided for comparison in Table 3.
The concentrations of some selected heavy metals and phosphorus are given for the bottom ash samples from the lab experiments in Table 3. Phosphorus was the desired element in the ashes, and therefore it was important to evaluate its retention in the bottom ash under current combustion conditions. From Table 3 it is evident that MSS bottom ash had about 10% less phosphorus than the fuel, 70 ± 4 g vs. 77 ±2 g, respectively. The fuel mixtures of MSS bark resulted in ashes with slightly higher P concentration than the corresponding fuel while ashes from the mixtures containing dung had P levels in line with the respective fuel mixtures, Table 2 and Table 3.
As expected, Hg and Cd, the most volatile of the heavy metals, were almost completely volatilized during the combustion resulting in very low concentrations in the bottom ashes, well below the limits defined by all the regulations in Table 3 and Table 4. The EU limits for Cd concentration in fertilizer has two different limits based on the amount of P2O5 in wt.% present in the solid material. In Table 3, this limit is expressed for P2O5 levels below 5 wt.% at 3 mg Cd per kg dry matter. For P2O5 concentrations above 5 wt.%, the limit is 60 mg per kg P2O5. To compare the Cd levels in the ashes with this limit requires an assumption that all P in the ashes is in the form of P2O5, which might be true to different extents. With that assumption, the concentrations of P and Cd are recalculated in Table 5, which indicates all ashes had Cd concentrations well below the regulated level. The general trend for Pb was a reduction in the concentration in the bottom ashes compared to the unburned material, Table 2 and Table 3, and well below the limits for all the regulations, Table 3, Table 4 and Table 5.
Both bark and MSS had very high concentrations of Zn as fuels, while dung contained much lower amounts, Table 1 and Table 2. However, the concentration in the corresponding ashes, Table 3, clearly indicated Zn was readily evaporated at current combustion conditions. The exception was the sample MSS dung 40–60, where no reduction in the concentration was observed compared to the unburnt fuel. The analysis also indicated that most fuel-combinations resulted in ashes with acceptable concentrations compared to the Swedish limits with respect to Zn, with an exception for the cases MSS and MSS dung 50–50, where the concentrations in both ashes were on par with regulation SFS 1998:994 but well below the limit for forest application. Compared with regulation SNFS 1994:2 the Zn concentrations were below the given limits for all samples but MSS dung 40–60, Table 4, whereas no ash was above the limits for EU fertilizers, Table 5.
The amounts of Cr and Ni in the bottom ashes were higher than the total amount introduced to the boiler with the fuels, as can be seen in Table 3 compared with Table 1 and Table 2. The variation in the data was also large, especially for the samples containing bark. The result was that only the samples dung, MSS dung 20–80 and MSS dung 40–60 were at or below the limit for farmland application, SFS 1998:994, for both Cr and Ni. When the P supply is maximized to 22 kg per hectare and year, the samples MSS, MSS dung 20–80 and MSS dung 40–60 were below the limits with respect to Ni concentration and none of the samples were below the limit with respect to Cr concentration, Table 4. The EU fertilizer limit for Cr is set for Cr (VI) specifically, which was not measured, and hence is not evaluated here, while Ni levels were too high in all the bark ashes.
Similar to Cr and Ni, the concentration of Cu was higher in all ashes, Table 3, compared to the fuels, Table 1 and Table 2. Compared to limits for farmland application and EU fertilizer, all dung samples complied with the regulation as well as ash from mono bark combustion. In relation to P content, Table 4, all ash samples would be ok for farmland application with respect to Cu concentration.

3.2. Industrial-Scale Experiments

Figure 3 presents trend curves of the stability of the operating conditions during the combustion of the fuel mixture MSS-SW 30–70. The combustion process was characterized as good with proper excess oxygen concentration (O2) and low levels of carbon monoxide (CO). This resulted in an absence of so-called CO spikes, which is important for low emissions of polychlorinated dibenzo- dioxins, (PCDD:s) and furanes, (PCDF:s). The cyclic variation of oxygen concentration was caused by the reciprocating grate, the stokers pushing the fuel forward down along the grate. This oscillation of the O2 level in the furnace does not cause any problems in the combustion of the hydrocarbons if the lower end O2 level is always above 2%.
Due to the high temperatures during the char burnout on the grate, significant slag formation was observed, Figure 4, for the mixed fuel sample MSS-SW 30–70 but not for the reference case with only SW. The bottom ash samples for the mixed fuel therefore had to be crushed before they could be collected and divided into one representative bottom ash sample. This bottom ash sample of the fuel mixture had a P concentration of 49 g per kg ash, Table 6. The calculated concentration of P in the fuel mixture (Table 1) was 74.5 g per kg ash, which was considerably higher than the levels found in the bottom ash. The filter ash and multi-cyclone ash contained 81 g and 32 g P per kg ash respectively. Calculated P2O5 concentrations in Table 4 and Table 6 were in the range 9–16 wt.% for the mixtures at laboratory scale and 11 wt.% for the industrial-scale MSS-SW ash.
The concentrations of the trace elements in the bottom ash of the mixed fuel sample MSS-SW 30–70, Table 6, are lower than or level with the ash in the reference sample SW for all elements but Cu. The Cu concentration is, however, similar to the calculated concentration in the fuel mixture, Table 1. The multi-cyclone and filter ash samples had higher concentrations of As, Cd, Hg, Pb and Zn than the bottom ash samples for both fuels indicating evaporation of these elements under current combustion conditions. Cr, Cu and Ni showed somewhat inconclusive results. Cr was more concentrated in the bottom ash than in the filter and multi-cyclone ashes for the SW while the reverse was true for the MSS-SW case. Cu was slightly less concentrated in the bottom ash compared to the filter and cyclone ashes for SW, which would indicate evaporation; however, with MSS-SW the relation was the inverse. Ni concentrations were similar throughout the ash fractions for both cases. Compared to farmland limits presented in Table 3, the mixed sample ashes have higher concentrations of Cr, Cu and Ni than the permitted levels, while As, Cd, Hg, Pb and Zn are well below the limits. The bottom ash from MSS-SW 30–70 had a higher concentration of Cr and Cu and a lower concentration of As, Cd, Hg, Ni, Pb and Zn than the forest and EU fertilizer limit values. The SW bottom ash had higher concentrations of As, Cr and Cu than the limits for forest application.

3.3. SEM Analysis

In Figure 5, the map sum spectra representation from the SEM-EDX analysis is given. The ashes MSS and MSS-SW 30–70 clearly had higher Al and lower Ca content than the three other ashes. P level is highest in MSS ash and lowest in SW ash with mixtures in between.
Crushed and ground ashes from laboratory-scale experiments were attached to carbon tape and analyzed in the SEM-EDX instrument, Figure 6. Ash samples from the large-scale experiments were crushed into smaller pieces, cast in epoxy and analyzed with SEM-EDX, Figure 7.
The electron images of MSS, MSS bark 20–80 and MSS dung 20–80, Figure 6, indicated slightly smoother surfaces on particles from fuel mixtures compared to MSS. From the elemental mapping it could be seen that Al, Si, Ca and P were mostly present at the same positions in most particles but with different intensity areas. Si had distinct hotspots with respect to intensity, and this was more pronounced for the mixed fuel ashes than the MSS ash. The intensity of Ca was quite evenly distributed over the MSS sample while the mixed fuel ashes had more clear concentrated areas, which was most distinct for MSS dung 20–80. Fe was mostly concentrated to a few discrete particles in all ashes. K and Mg were evenly distributed in the MSS ash while more high intensity areas were found in the mixed fuel ashes. Na could not be mapped in the MSS ash, it was mapped with low intensity in MSS bark 20–80 ashes and clearly mapped for MSS dung 20–80, where it was present in most particles with varying intensity.
Some specific area analyses were performed on layered SEM-EDX images, which are marked in Figure 6 and Figure 7 and the content of the elements in each marked area are described in Table 7 and Table 8 in wt.% with carbon and oxygen excluded. The typical distribution of elements in the MSS ash was Al>P>Ca>Si>Fe>K, as shown in areas 1, 5, 6, 7 and 8. Areas 4 and 10 were rich in Si with P twice as high in 4 compared with 10. The mapping of the MSS ash shows that Al and P follow each other very well and stand out compared to all other samples. This was also seen in the area analyses, Table 7 and Table 8. MSS bark 20–80 typically had less Al than MSS and higher Ca with Al and Ca at about the same ratio. Area 19 was the only one with Cr levels high enough to be visible in the elemental mapping. This area was also rich in Fe. Area 11 was high in Si and low in Ca and P whereas 16 and 18 had similar ratios of Si, Ca and P. Al was twice as high in 18 as in 16. Areas 12, 13, 14, 15 and 20 had the highest P ratio in the MSS bark 20–80 ashes; however, compared to MSS ash these levels were almost halved. MSS dung 20–80 generally had much more Na and K than the other two ashes, which can be seen in all areas 21–30. Si was also towards the higher end for all MSS dung areas while Al generally was lower and Ca and P ratios were intermediate except for area 29, which had the highest Ca ratio of the dung areas.
Areas of the SW ashes were mostly dominated by Ca and Si except area 34. The majority of the particle of which area 34 is a member was dominated by Al. Area 35 and the dark edge of the particle had high Ca ratio and comparatively low ratio of Si and no P. Area 40 had the highest P ratio of the SW ash and where P was detected, so was Mg, as exemplified in areas 31, 33, 36, 39 and 40. MSS-SW 30–70 contained more P than SW, as it was detected in all areas but 43. This area was very rich in Si and low in Al compared to most MSS-SW areas. Area 50 was similar to area 43 with high Si and low Al; however, 50 contained some P. Na was not detected in the majority of the SW and MSS-SW ashes and Ca and Mg ratios were much lower in the mixed fuel ash compared to the SW ash.
SEM-EDX electron images and elemental mappings of the bottom ashes from the large-scale tests are presented in Figure 7. The electron images of the cross sections of these epoxy castings indicate that these bottom ashes had melted and formed hollow structured particles. The molten slag was much more pronounced in the MSS-SW casting where there was an almost uniform distribution of the major ash forming elements within different ash particles. In the SW casting, there were particles mainly constituted of one major element, e.g., Fe or Al, that could not be seen in the MSS-SW casting where these two elements were present in all major particles with varying intensities which was shown in the corresponding elemental mapping images. Apart from some aggregated particles caused by molten ash there were few similarities between the SW and MSS-SW ashes. For all the elements mapped in Figure 7, most of the ash particle boundaries can be seen in each element map for MSS-SW 30–70, which indicates distribution of the elements into all ash particles. For the SW casting Ca and Si are represented in most of the particles however with varying intensity. P was present in most particles of the MSS-SW ash with varying intensity mapping while for the SW ash there were only a few particles with low P intensity, difficult to distinguish from the background noise.

3.4. XRD Analysis

Samples from industrial-scale combustion consisted of almost equal shares of crystalline and amorphous content for the reference case, with indications of increased share of amorphous content with MSS addition, see Table 9. This semi-quantitative analysis considers the crystalline part of the sample. The phosphates identified consist of a mixed calcium phosphate silicate in the soft wood case, but for the fuel blend with MSS, there is a pure whitlockite phosphate previously identified in cases with sewage sludge combustion. The other phases are mainly comprised of various silicates for the reference case, whereas the aluminum in MSS has reacted to form primarily anorthite with MSS addition. The influence of excess aluminum available in the MSS is also seen in the oxides and hydroxides where corundum is a dominating phase with MSS addition, whereas the calcium and magnesium oxides/hydroxides are present in the reference case.
Resulting diffractograms from laboratory-scale experiments had background artifacts caused by the low sample amounts. The sample material was first mounted on carbon tape for SEM-EDX and subsequently subjected to XRD analysis. As a consequence, the qualitative analysis was impacted negatively. Furthermore, the difficulties with accurate background determination did not permit semi-quantitative analysis to a satisfactory degree. Still, the qualitative data provides some information concerning reactions in the samples (Table 9), where the identified compounds may provide some insights.

4. Discussion and Conclusions

4.1. Phosphorus Concentrations in Bottom Ash Fractions

In this study, we determined the P concentration in bottom ash from both laboratory and industrial-scale combustion of sewage sludge and different co-fuels. The results show that mono-combustion of MSS, as well as co-combustion with bark and horse dung in the lab-scale setting, all had similar P concentration in the bottom ashes as in the fuel. However, in the large-scale boiler there was a reduction from 75 to 49 g P per kg ash from the fuel to the bottom ash, which clearly indicated transport of P from the bottom ash. Han et al. [35] showed that phosphorus was more easily evaporated under reducing combustion conditions than oxidizing which could explain the difference between the lab and the boiler settings. In the lab-scale experiments oxygen supply was in excess for the majority of the time the samples were inside the furnace; however, with a moving grate, Razmjoo et al. [33] suggested a model where the oxygen supplied through the primary air is completely consumed in the combustion layer of the fuel bed, resulting in reducing conditions in the fuel layers above. Furthermore, a higher temperature in the char burning layer at the grate compared to the lab furnace could be a possible explanation for the difference in P concentration of the ashes. However, when compared on a P2O5 basis, the calculated results in Table 4 and Table 6 are comparable with the findings of Havukainen et al. [36].
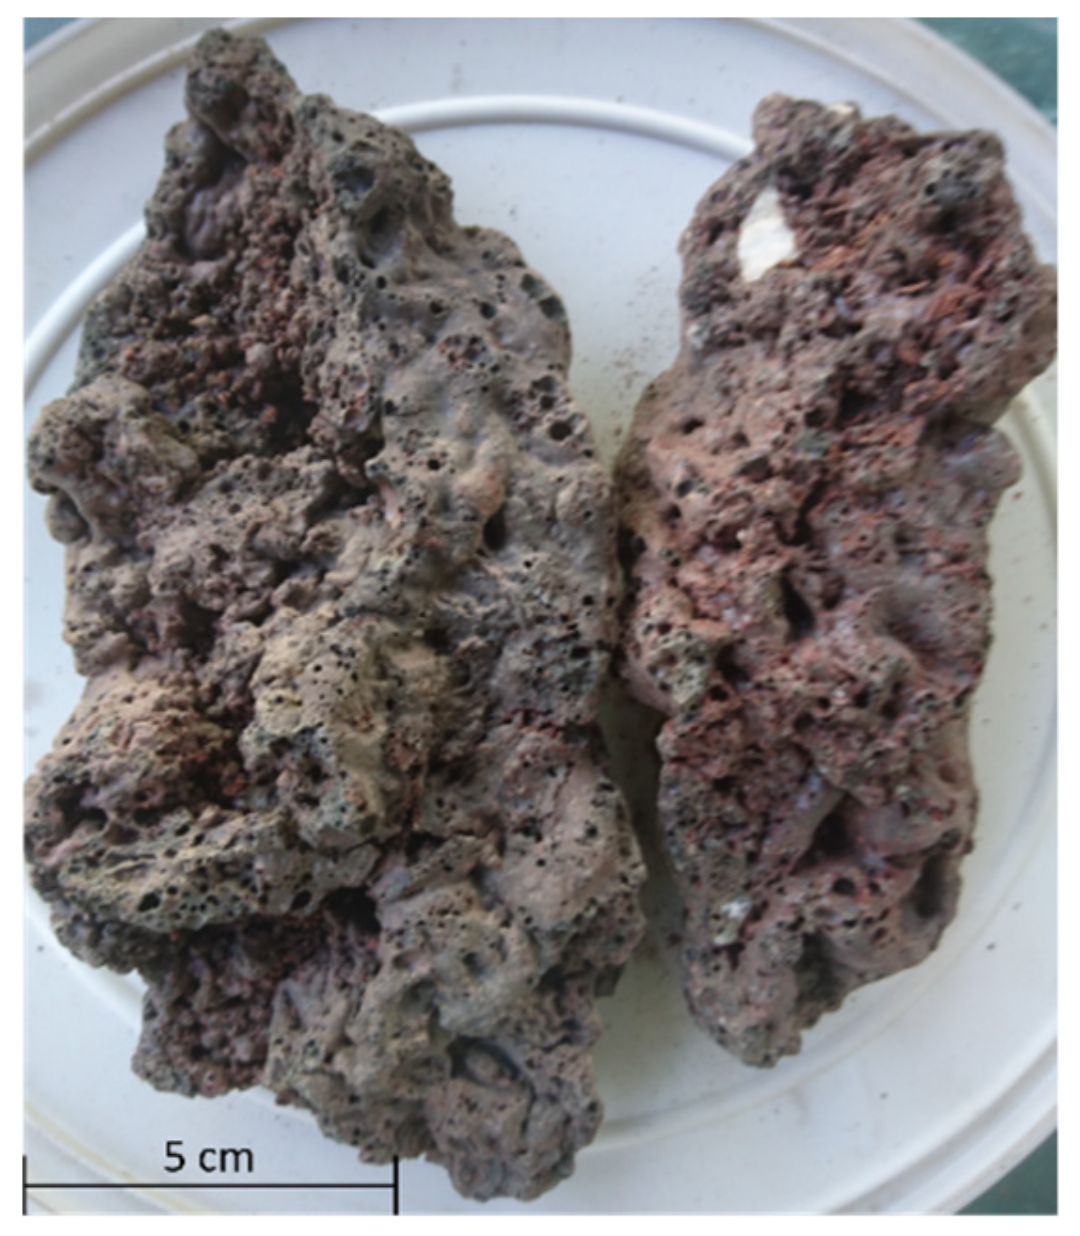
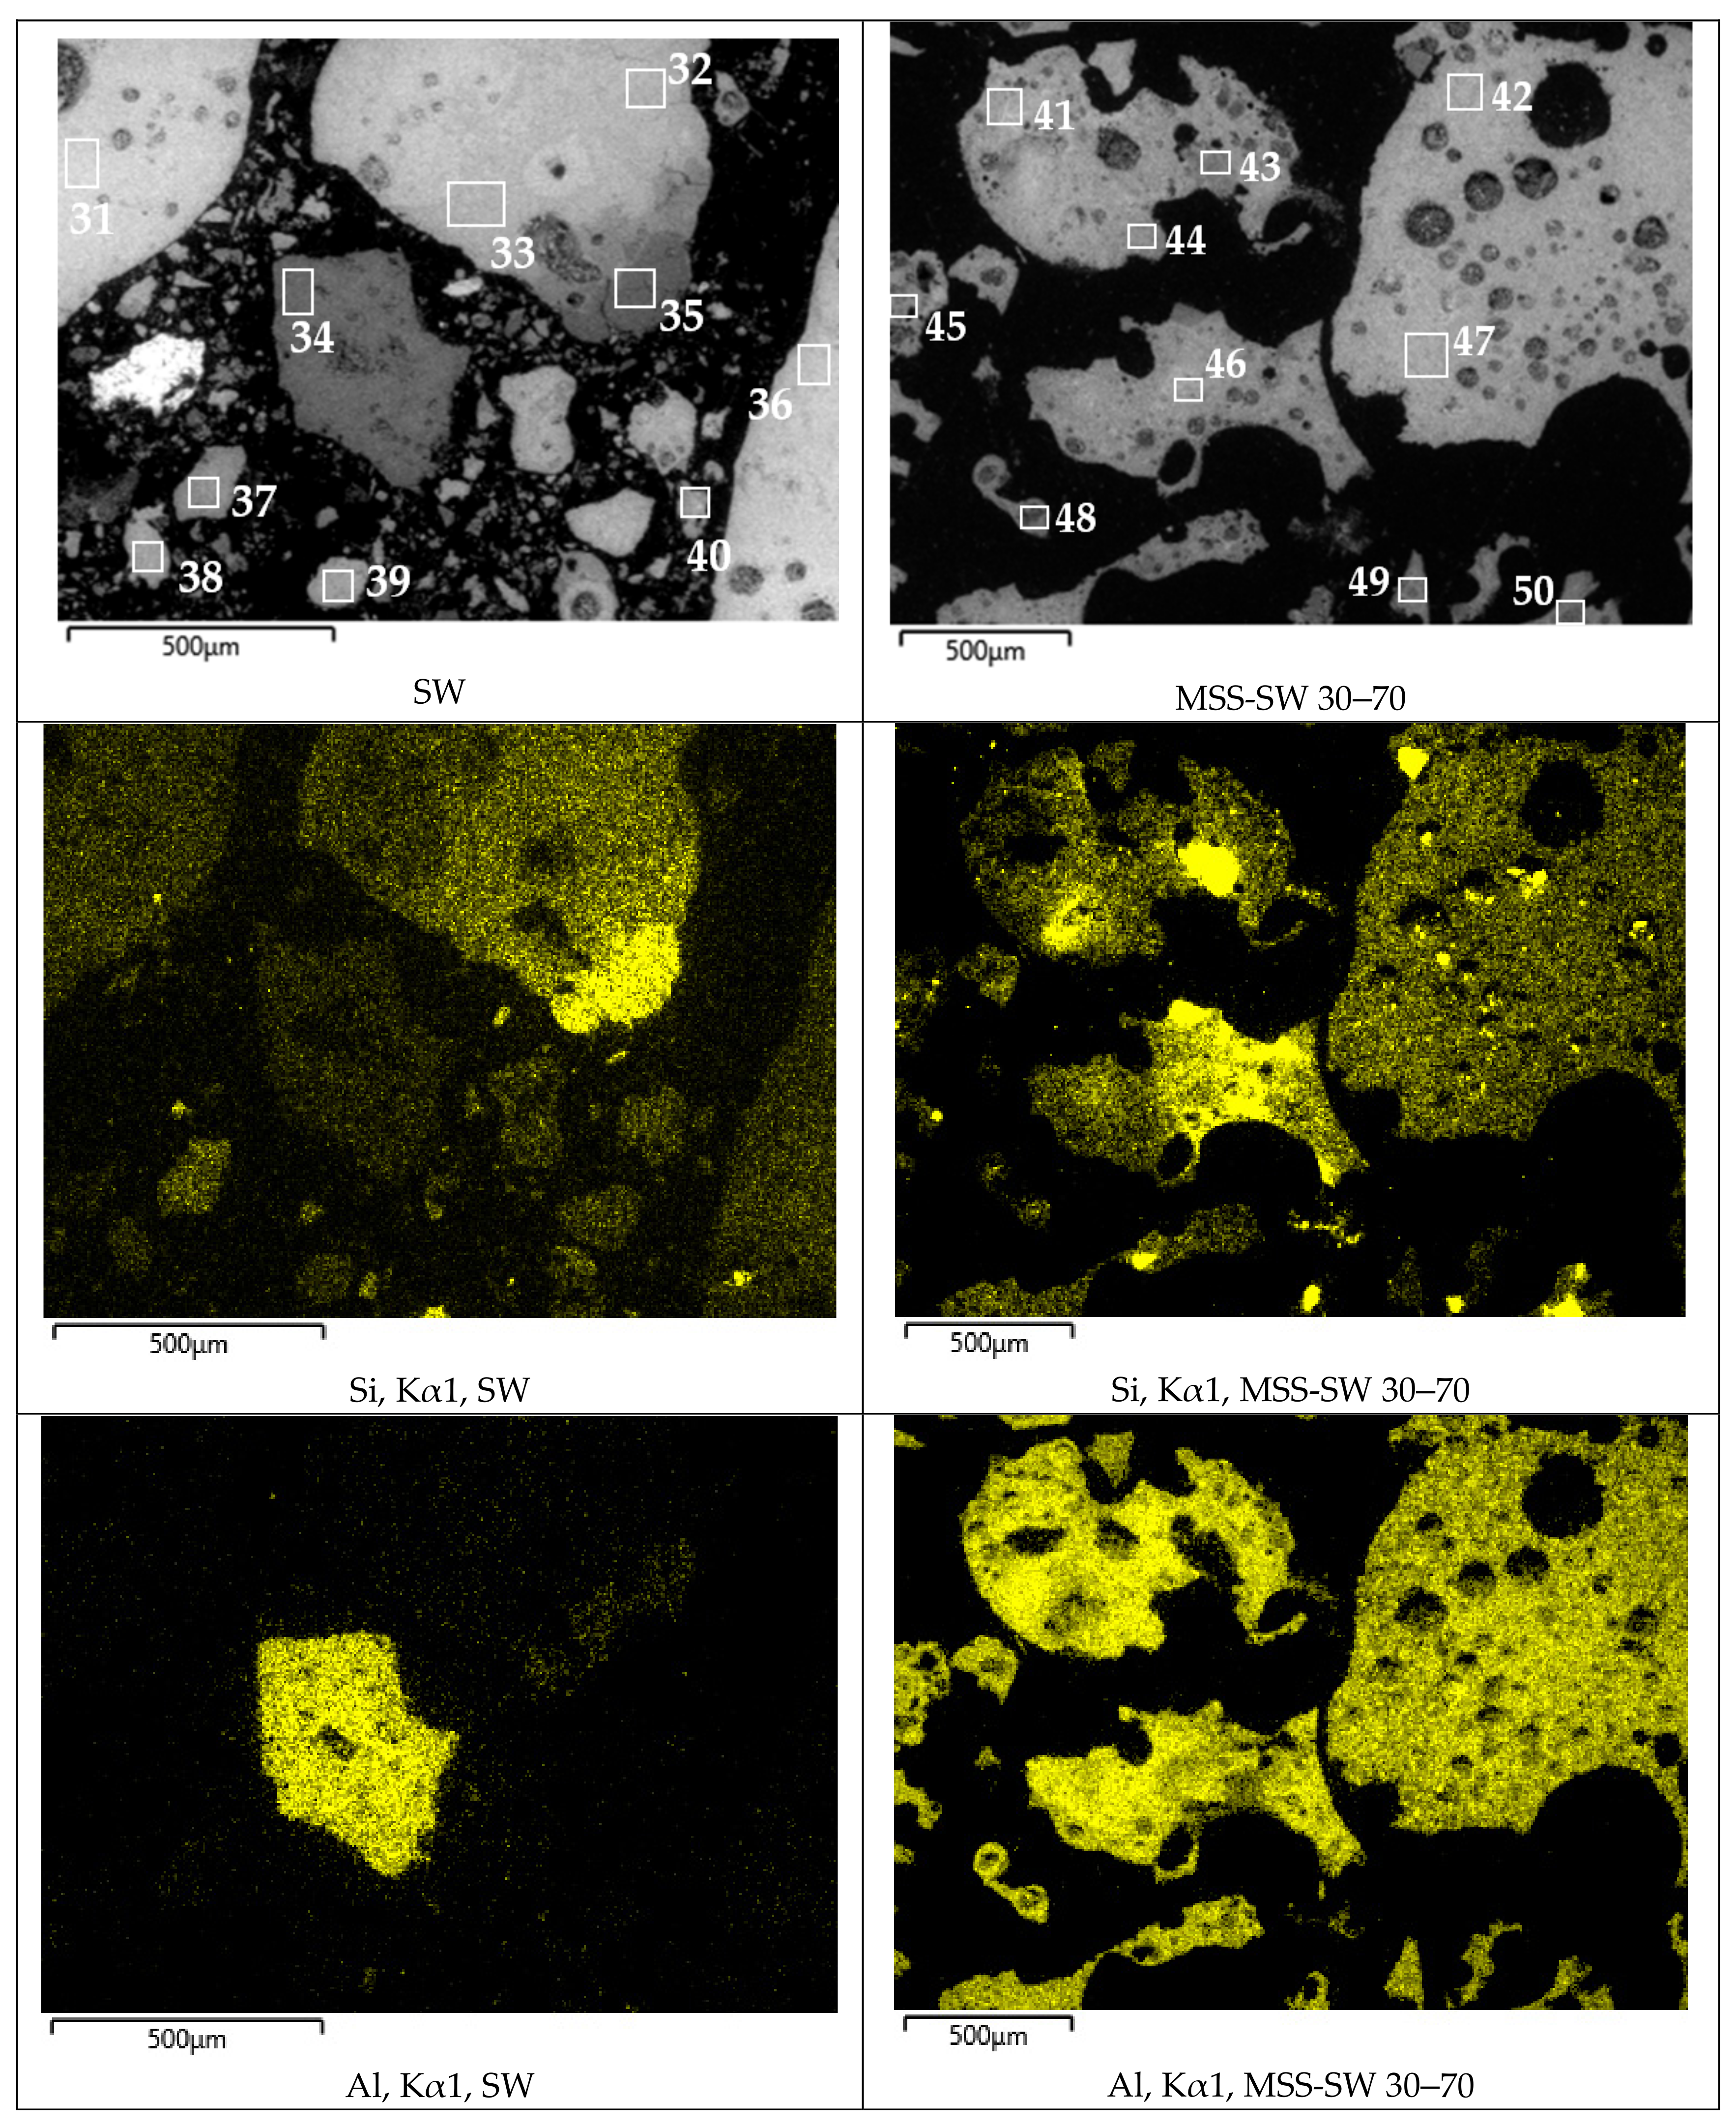
The molten bottom ash from the large-scale combustion of the mixed fuel sample MSS-SW, Figure 4, supports this theory. This slag might be the result of a higher temperature on the grate during the combustion compared to the reference soft wood where no slagging was observed. The boiler was designed for raw soft wood which is a wet biofuel. The fuel mixture containing SW and dried MSS had a lower moisture content than SW alone, which likely gave an increased temperature on the grate, high enough to melt the ashes. Differences in ash composition between MSS and SW might have contributed to a lower ash melting temperature for the MSS-fuel mixture compared to SW which might explain why no slagging was observed for the reference case.
The phosphate composition was dominated by whitlockite or merrillite-type structures according to XRD analysis for all co-combustion cases. This was also supported by the composition results from the SEM-EDX analysis, Table 7 and Table 8. The aluminum phosphate reported by Graetsch [37] was identified in laboratory-scale experiments with similar structural parameters as Al0.667Fe0.333PO4. This compound has previously been reported by Peplinsky et al. [38] from laboratory work and mono-combustion of MSS, but the results here suggest that the compounds relevant in co-combustion cases will rather be phosphates of whitlockite or merrillite type. It should be noted that aluminum from industrial-scale experiments was only found in two different forms: corundum and anorthite; the first is a stable oxide and the latter is a Ca-aluminosilicate. The phosphate identified in co-combustion have large unit cells that can accommodate an array of cations, where Ca2+ is the dominant one in reference structures. The general formula could be considered as Ca(10-x,y,z)(K,Na)xMgyFez(PO4)7, and the crystal structure is in space group 161, R3c. This contrasts to the reference case with soft wood where the only identified phosphorus-containing compound was Ca15(PO4)2(SiO4)6. The authors are not aware of this being reported as a compound present in bottom ash from woody-type biomass combustion previously, where hydroxyapatite (Ca5(PO4)3OH) is more common. The cause could be a high process temperature that causes an interaction between partially molten Ca-silicates and Ca-phosphates.
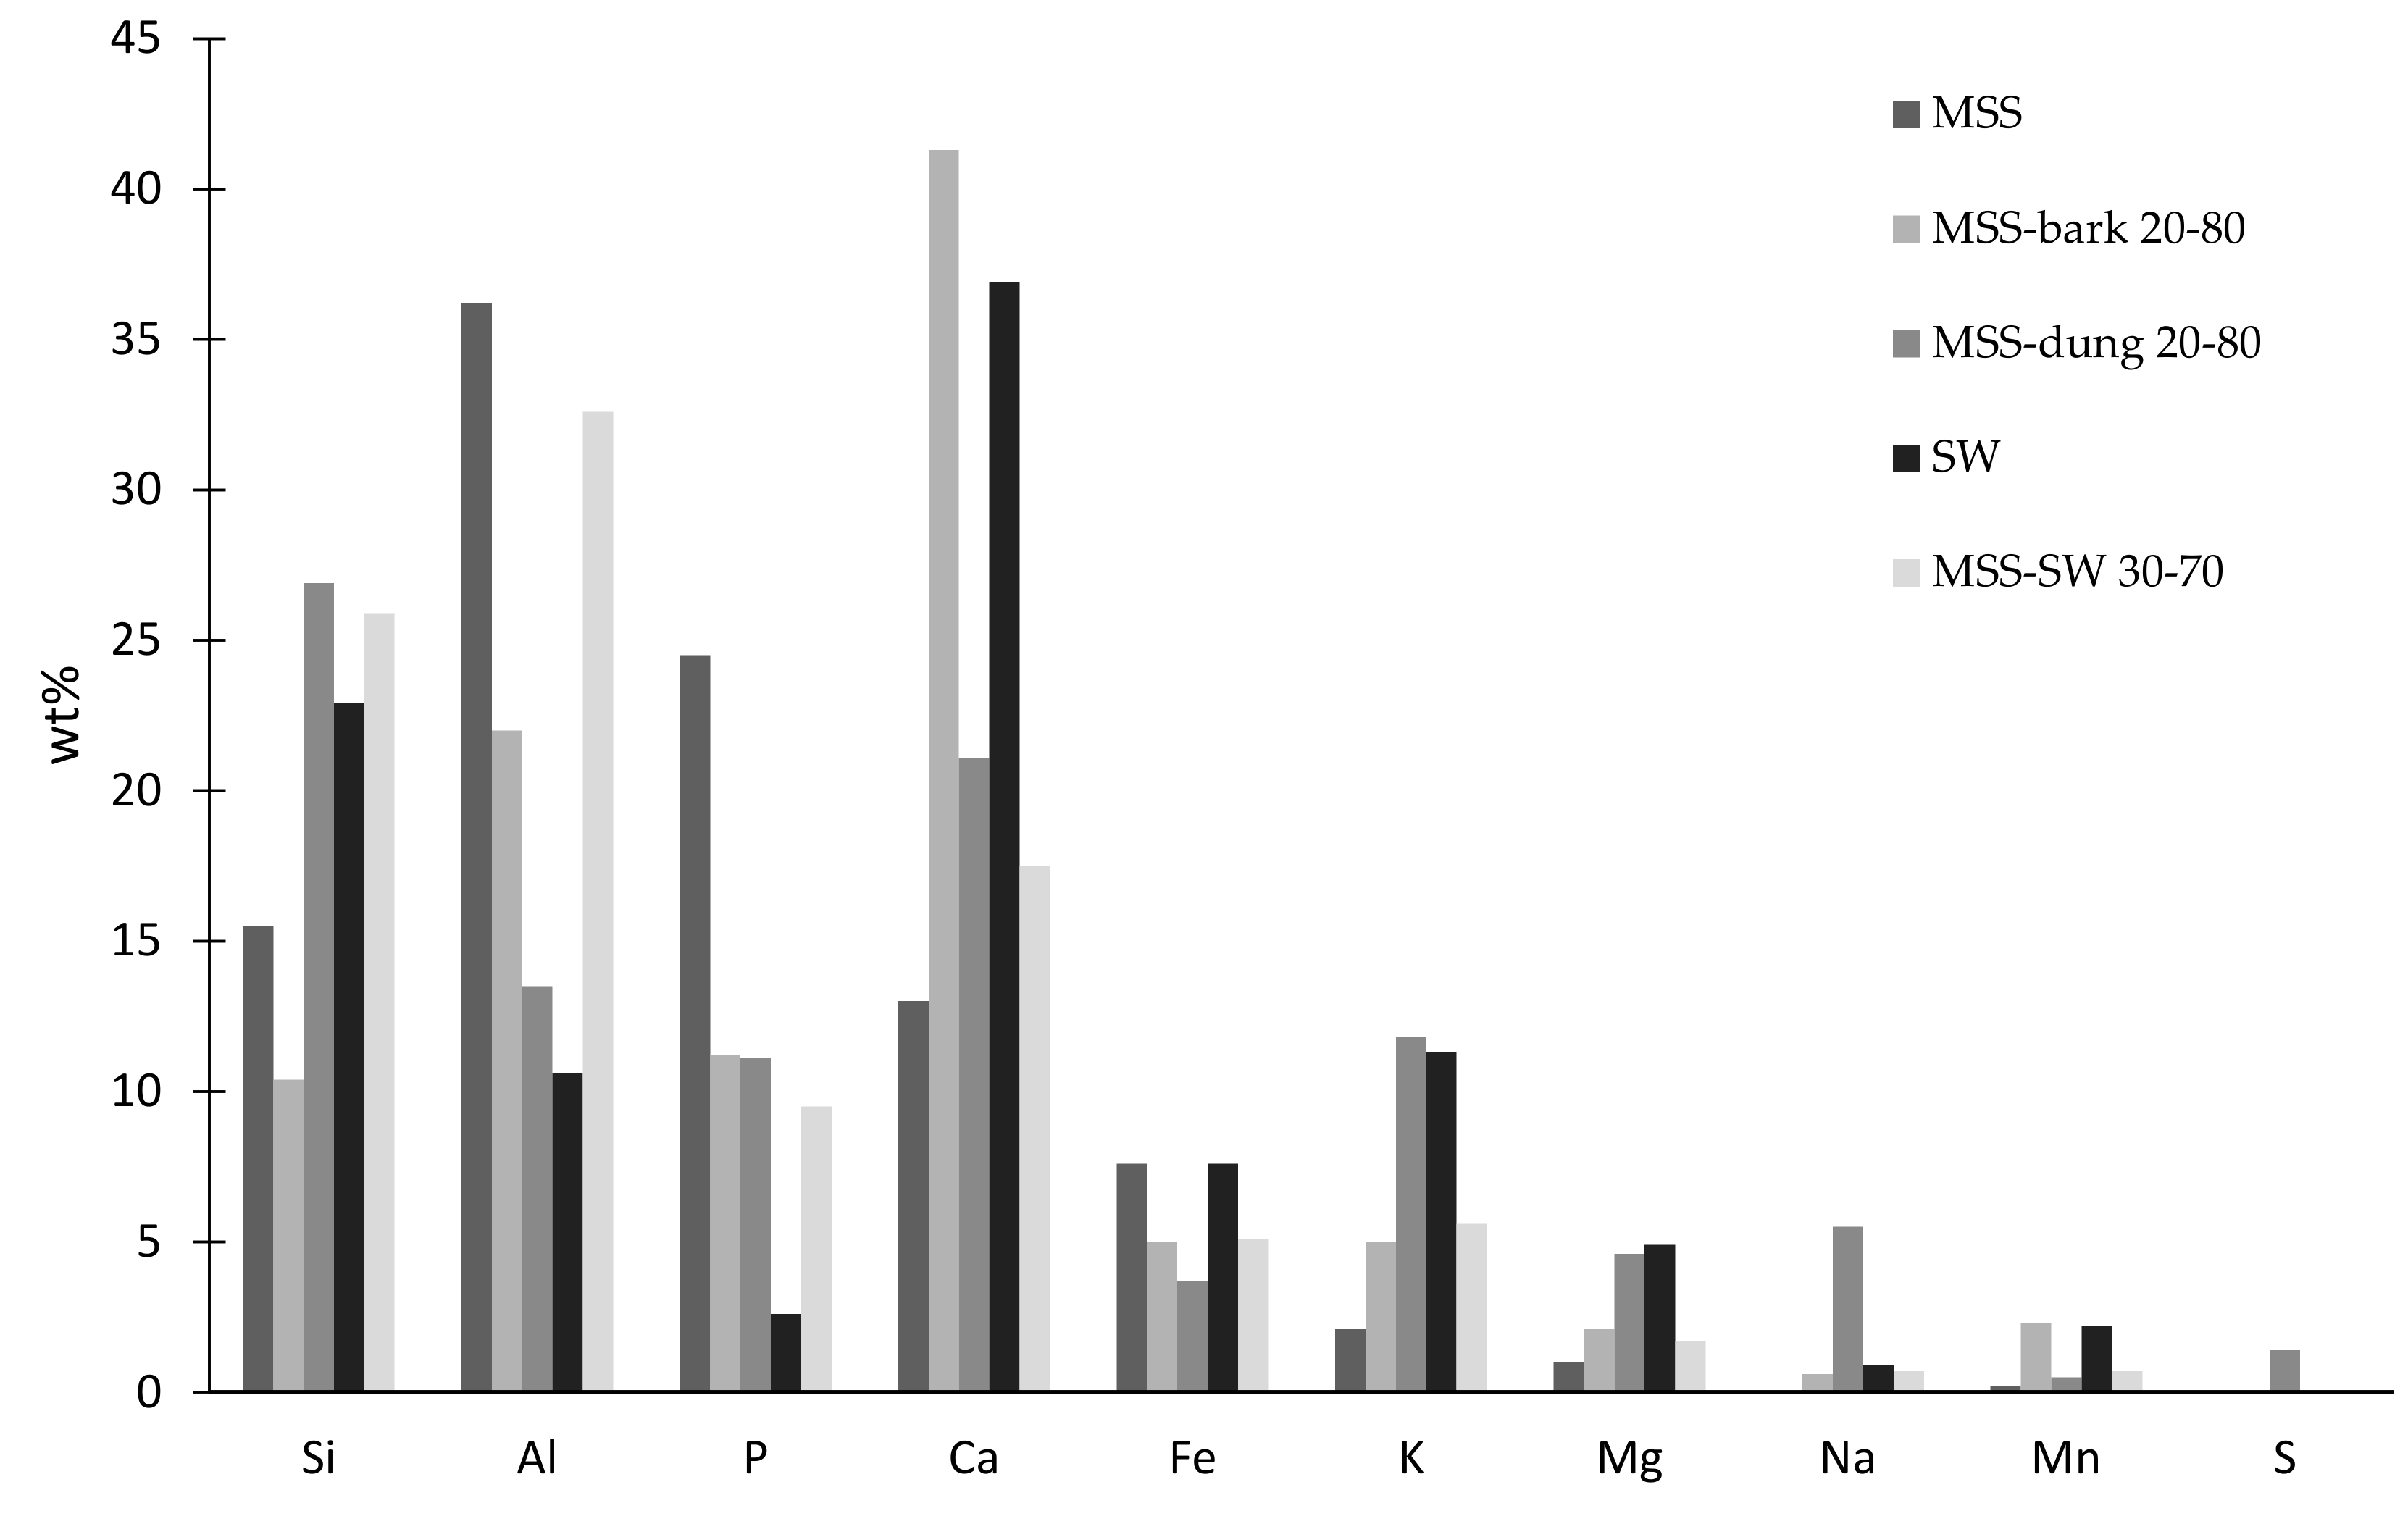
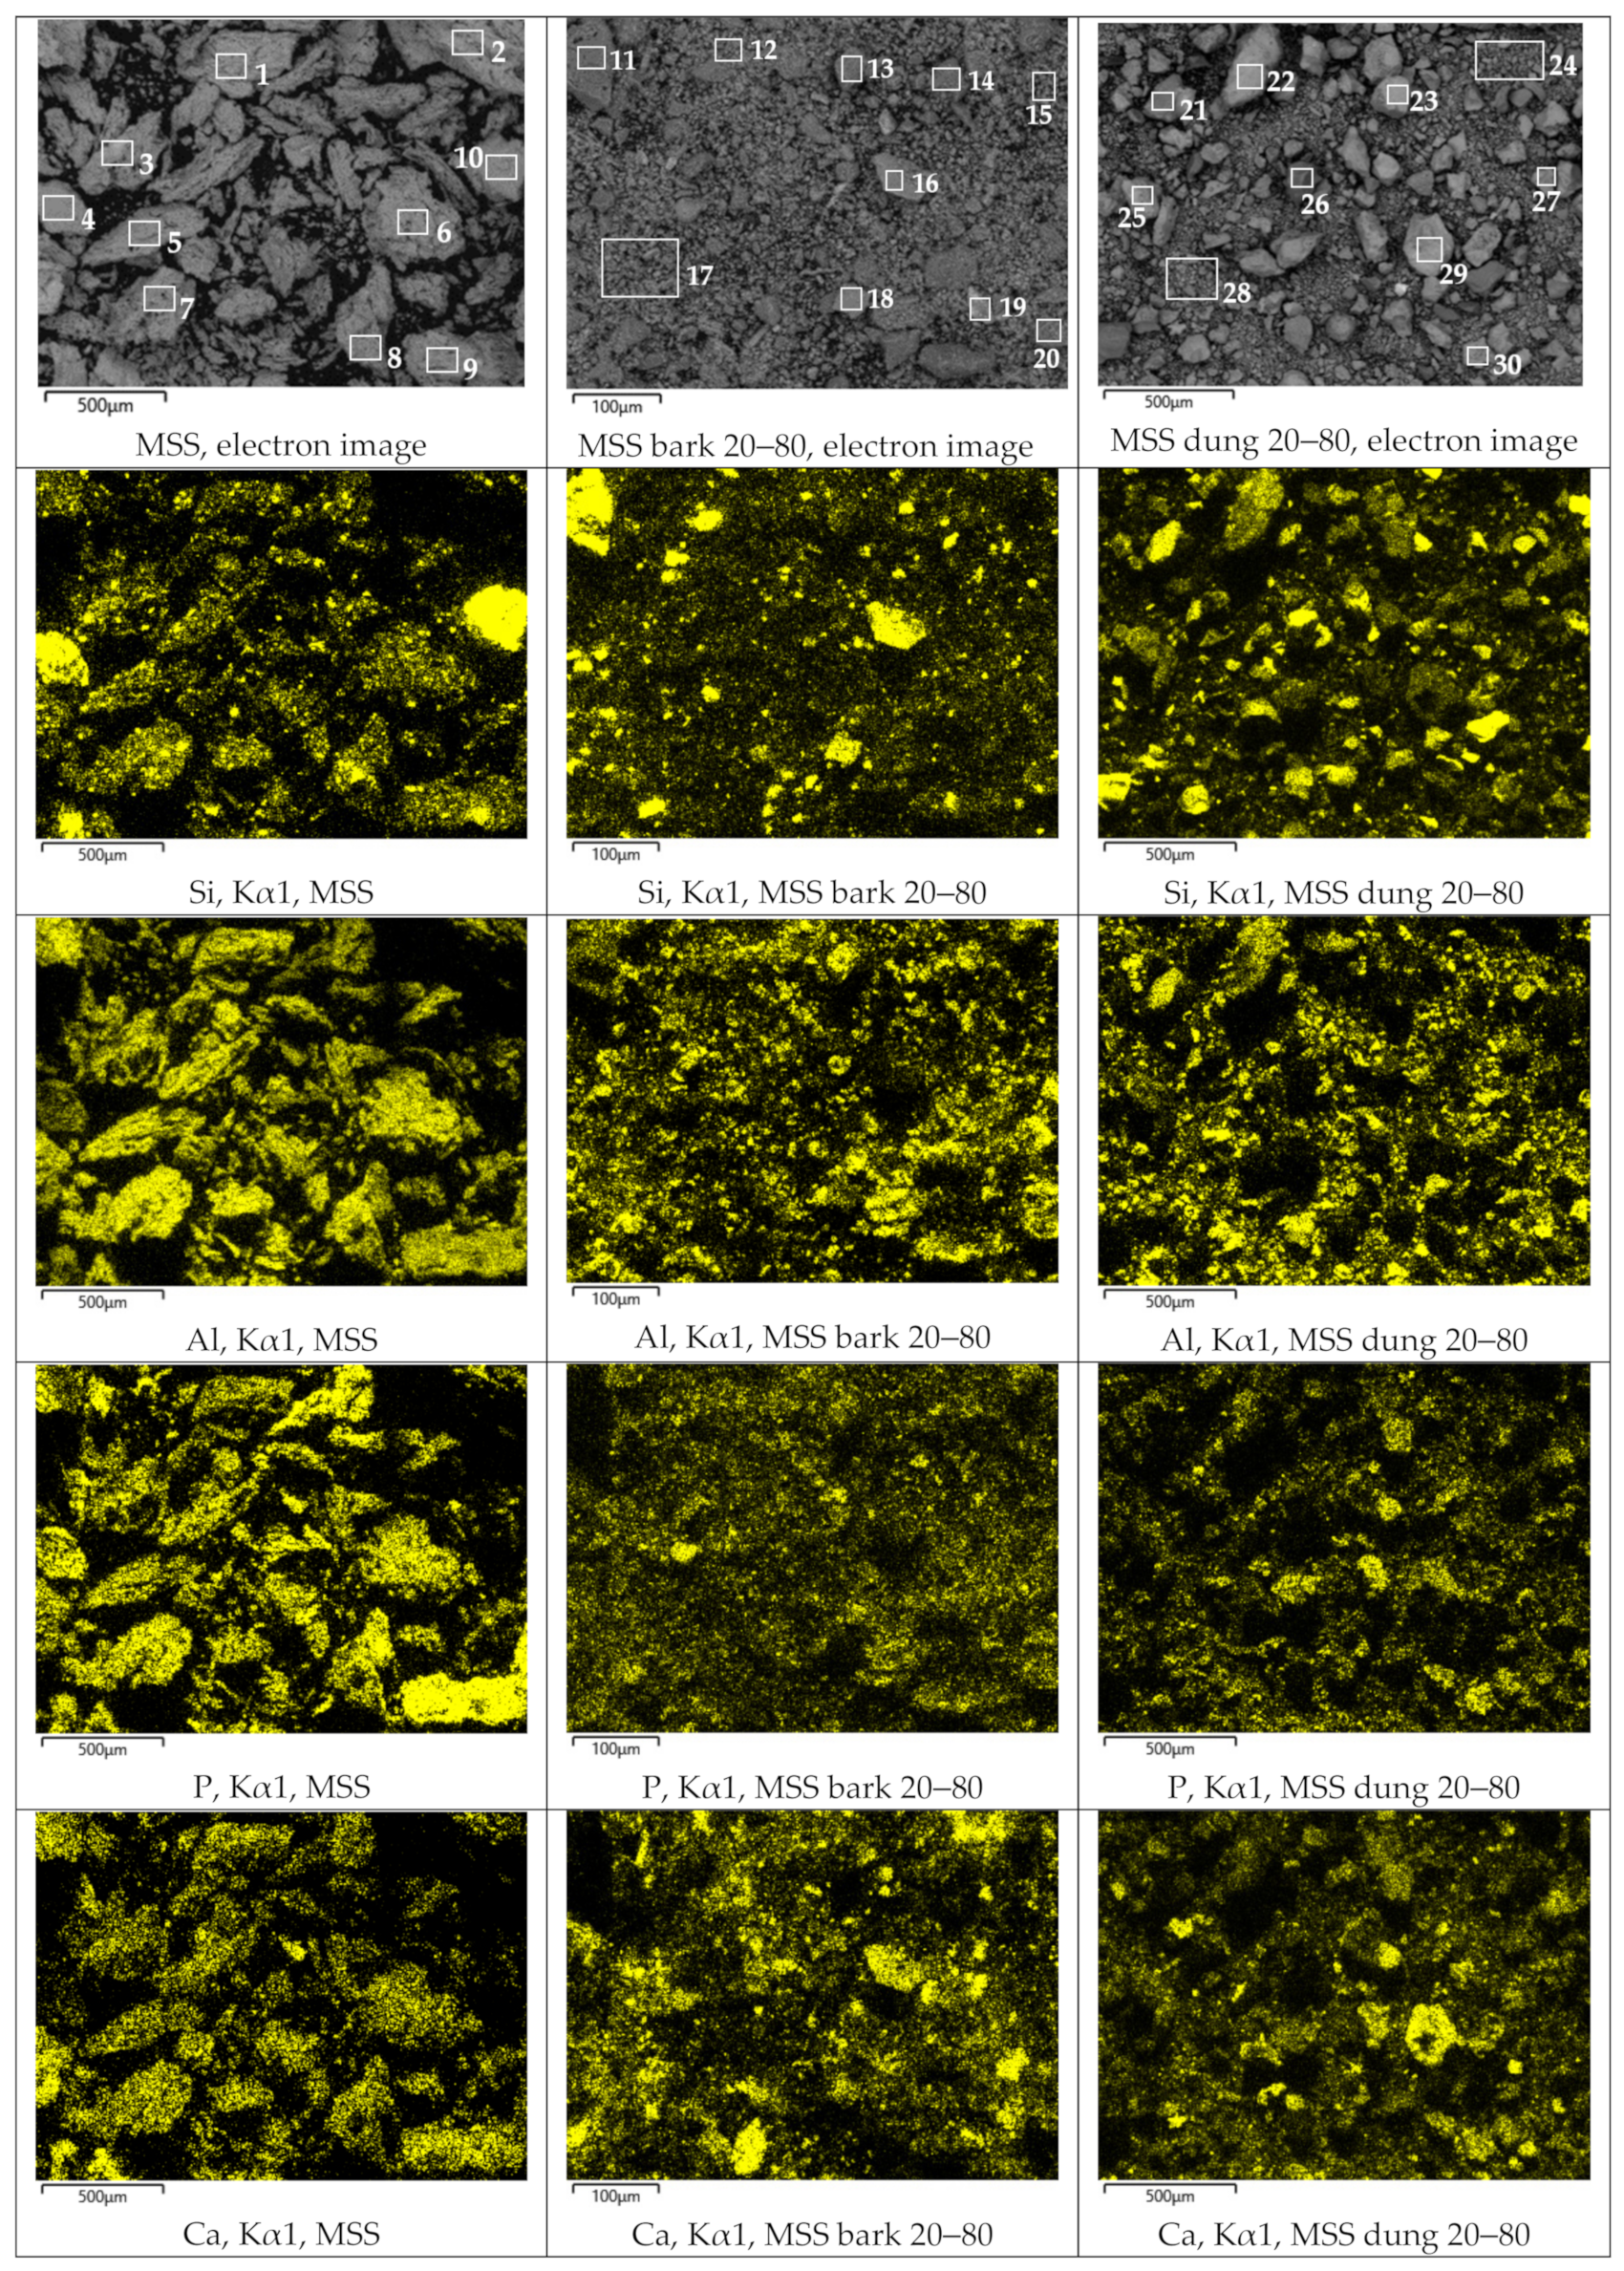
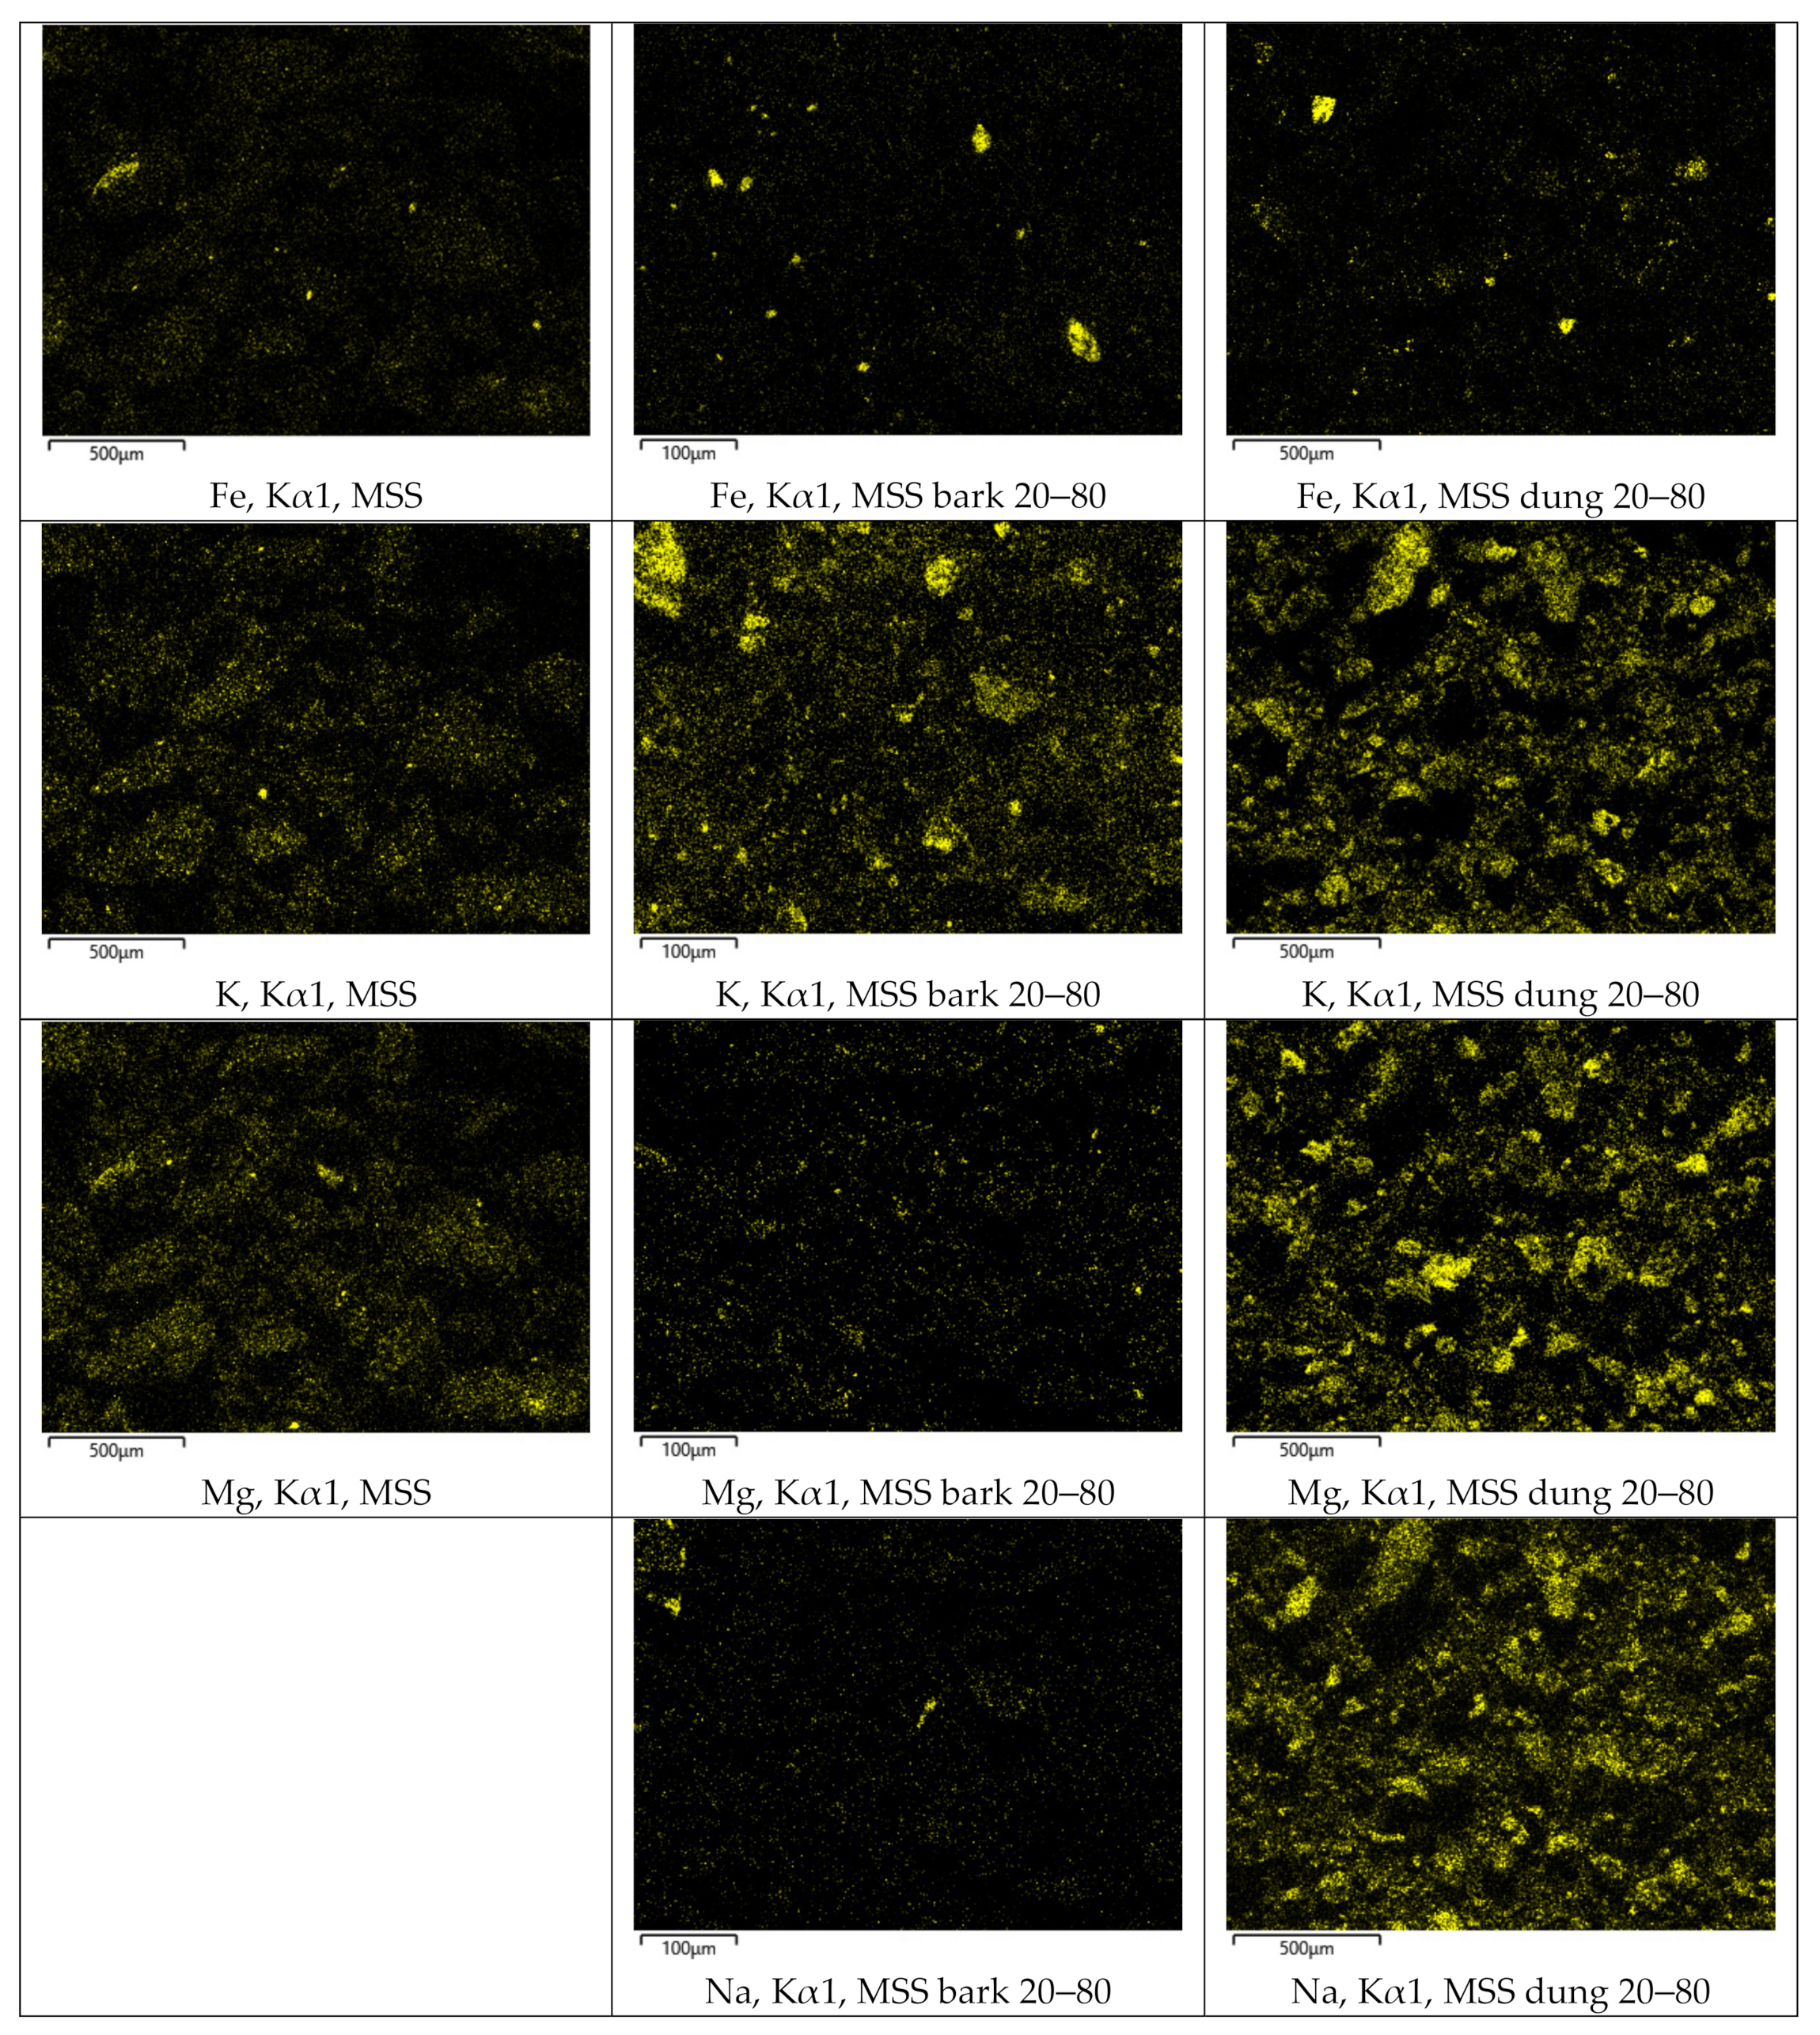
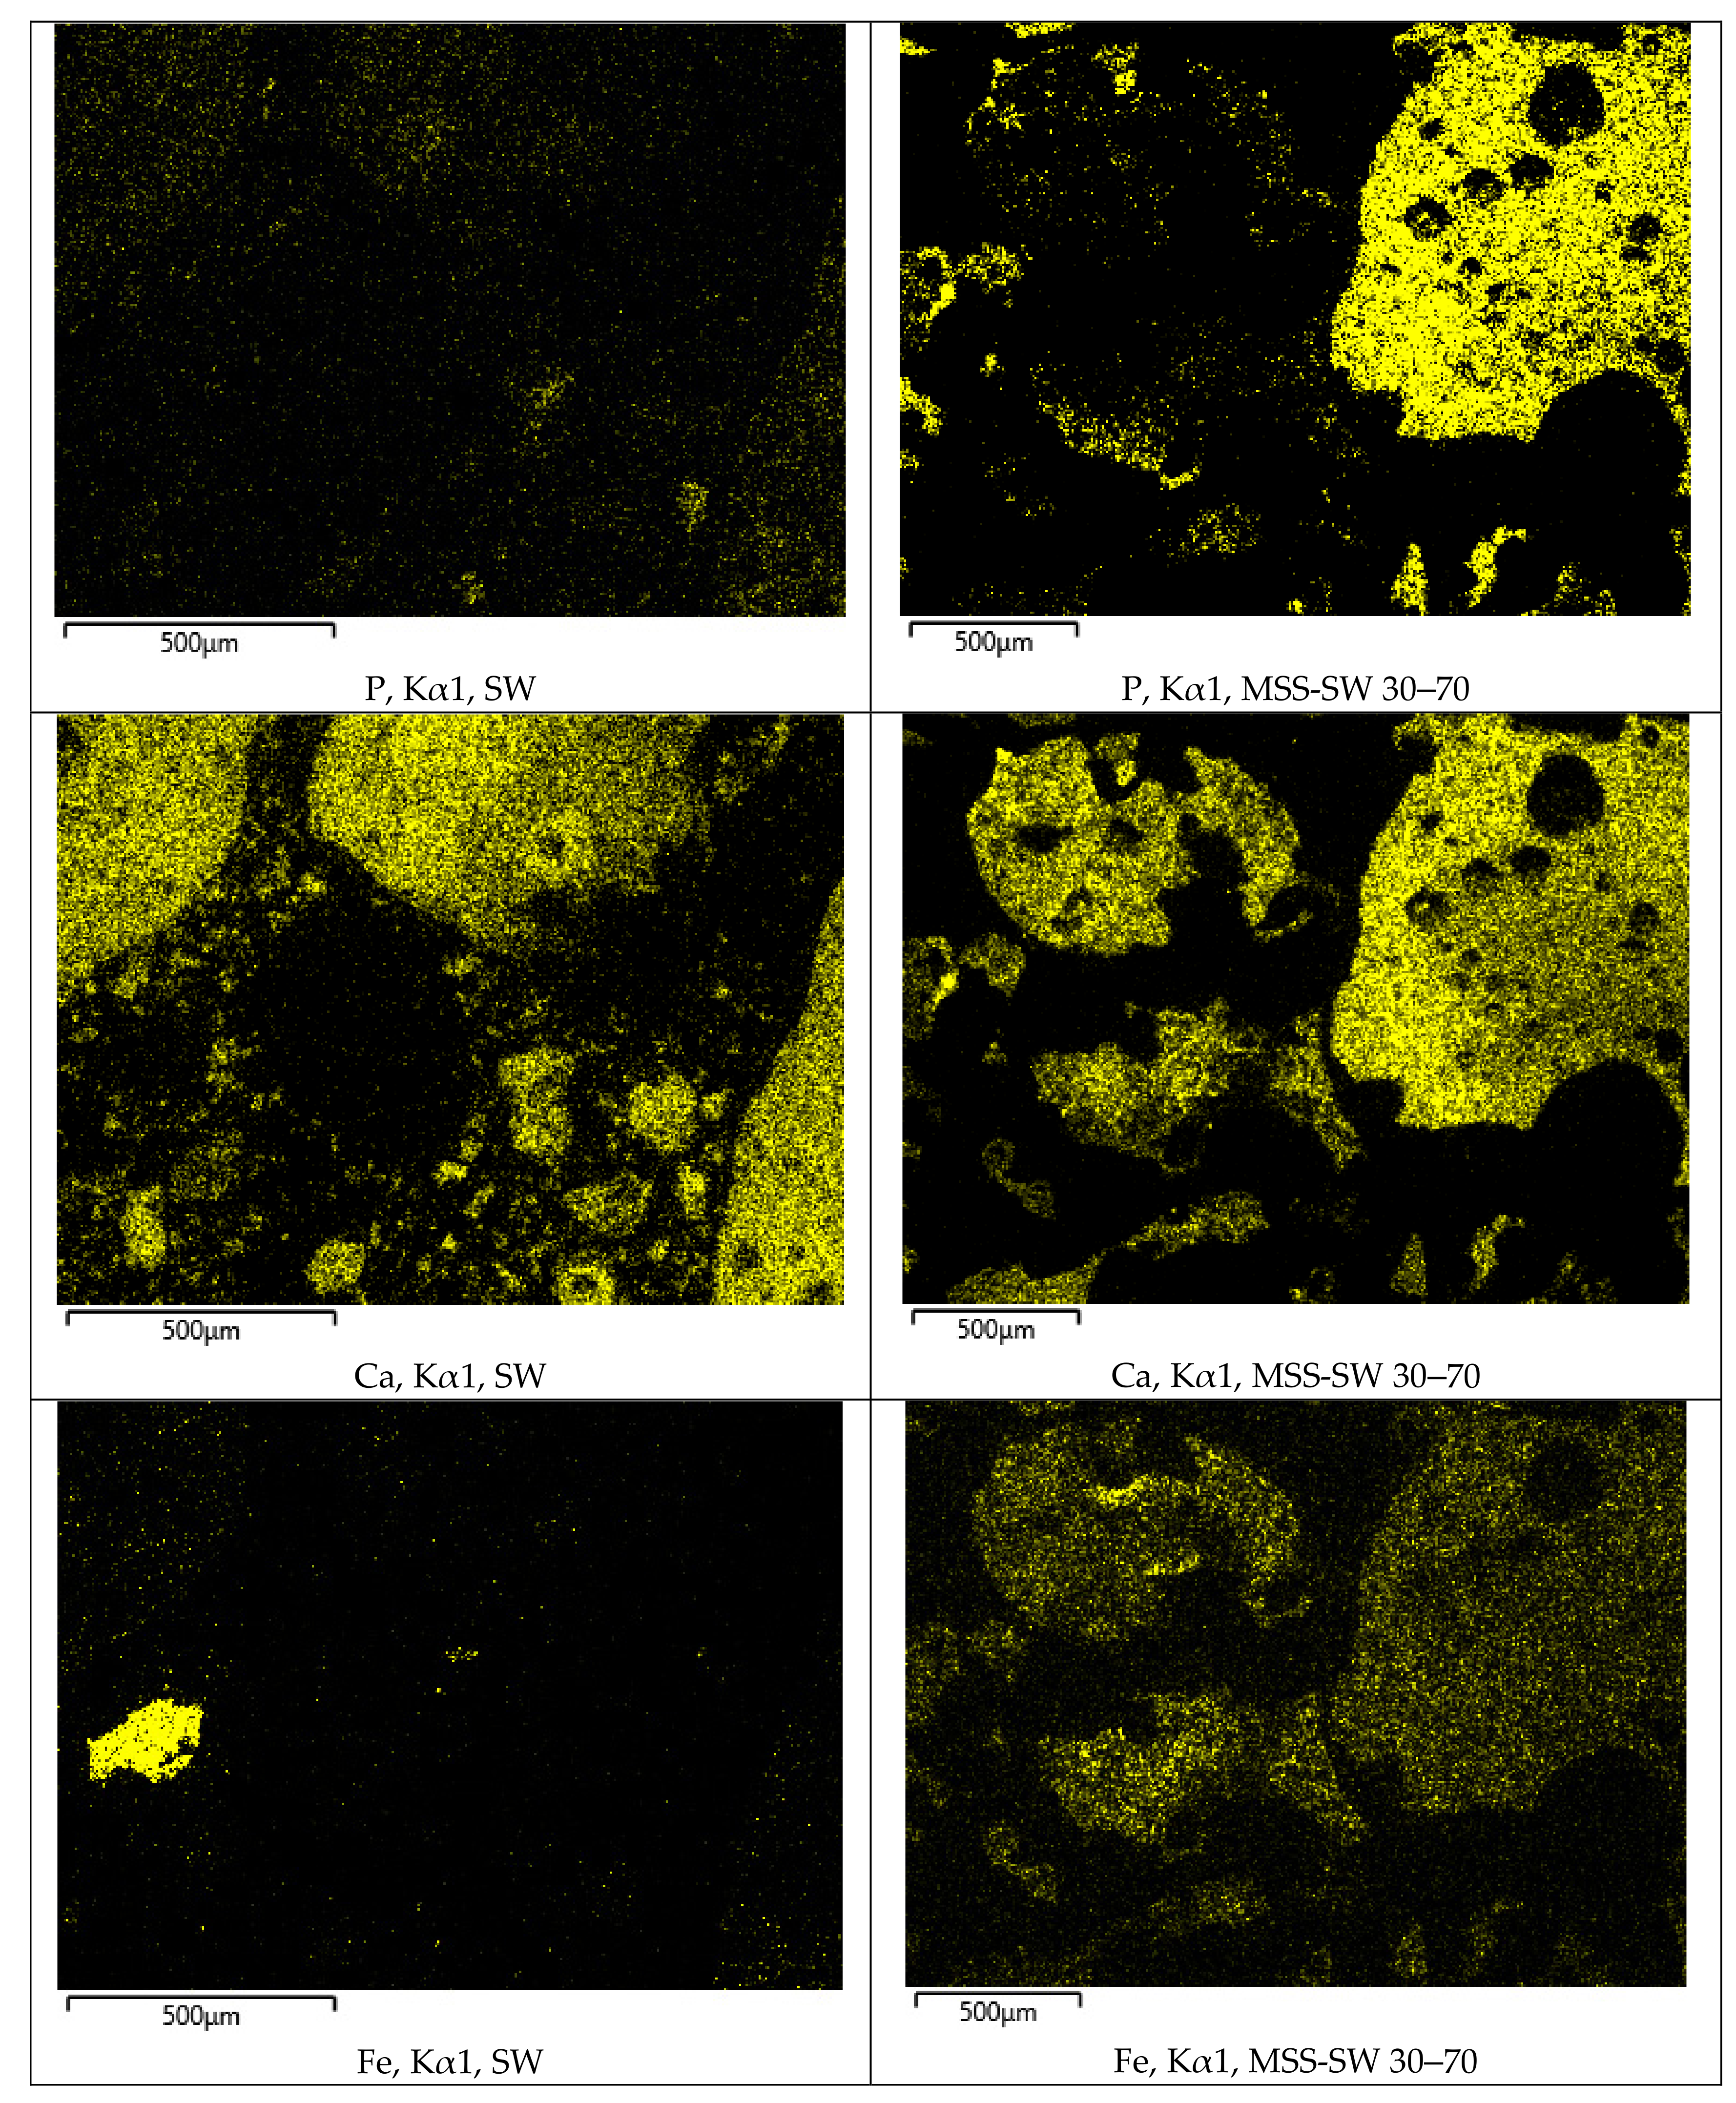
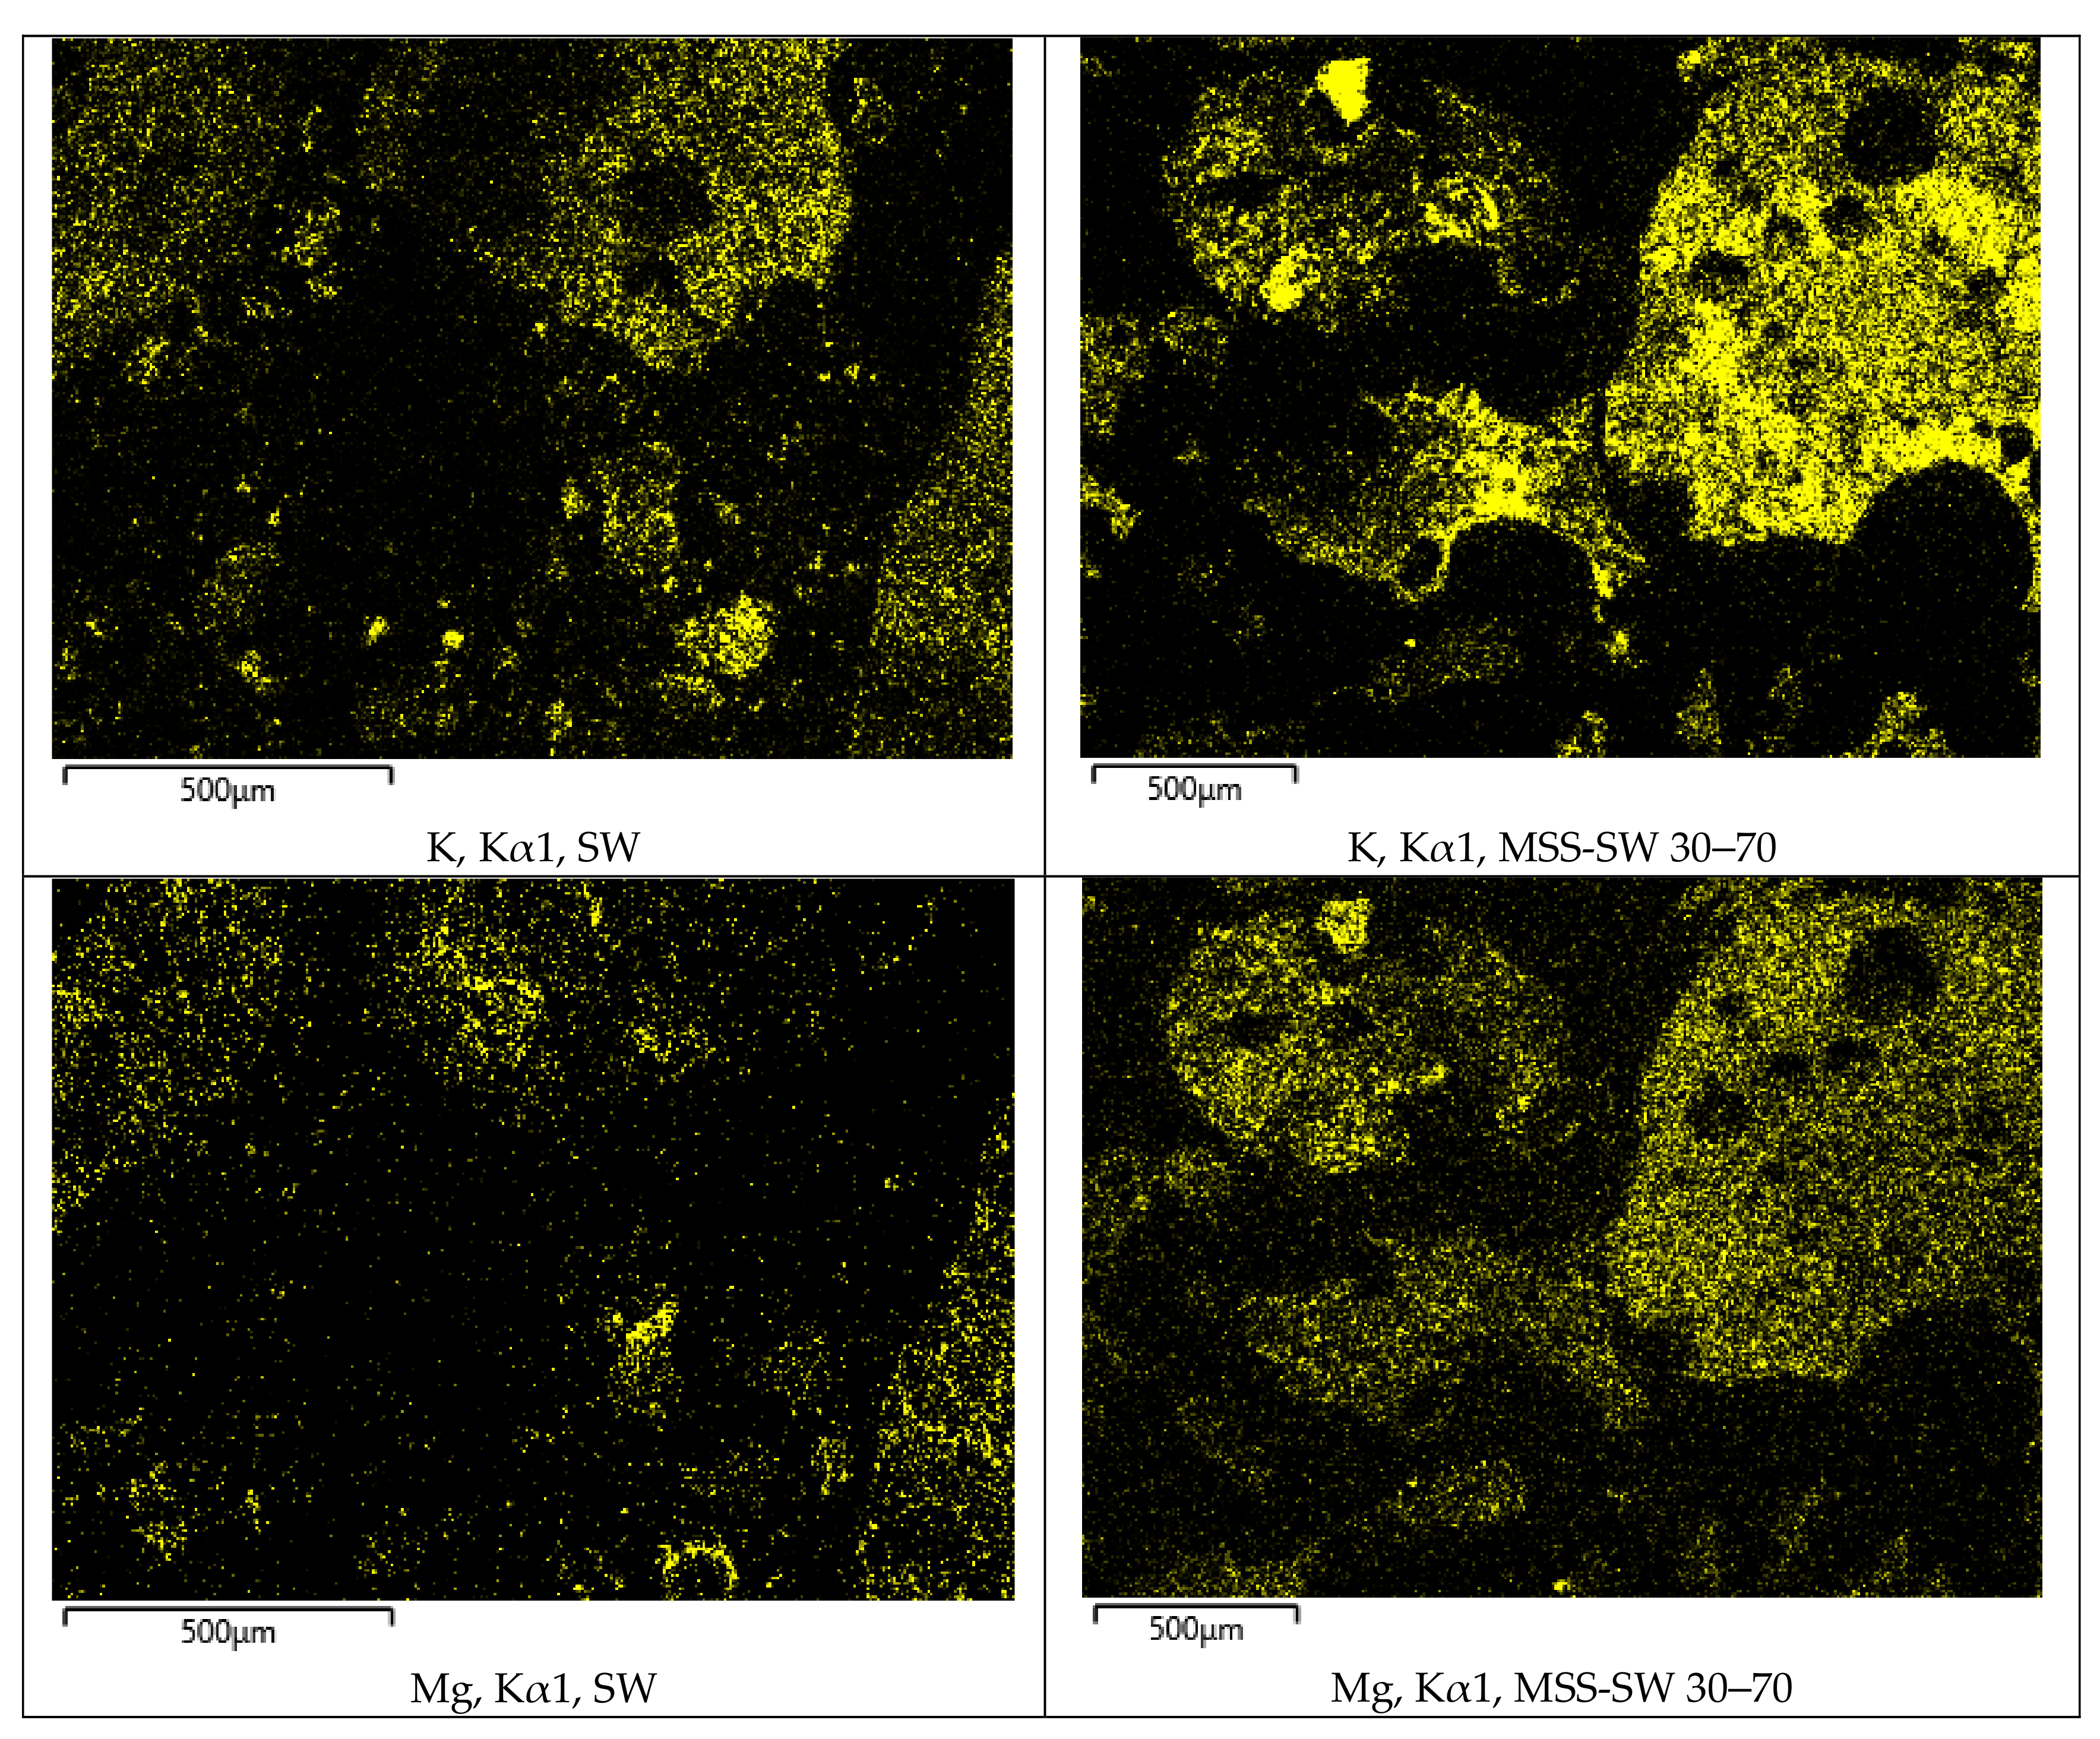
Looking at the SEM-EDX results in Figure 5, Table 7 and Table 8, Al followed by P was dominant in the ash from the pure MSS combustion, while Ca was more dominant in MSS bark 20-80 and SW. For MSS-SW 30-70, Al was predominant, followed by Si; however, the wt.% of P was much lower compared with MSS, less than 10 wt.% compared to 25 wt.% in the MSS case. This indicates that in mono-combustion of MSS the precipitation product, AlPO4 survives the combustion, while in co-combustion it breaks and reacts and new compounds like whitlockite or merrillite are formed [39].

4.2. Heavy Metal Concentration in the Ashes

A clear result from these combustion tests was the reduced concentration of As, Cd, Hg, Pb and Zn in all bottom ashes from fuels with MSS, except the Zn concentrations in all MSS dung ashes, which varied substantially, as indicated by their large standard deviations. A possible explanation might be the addition of Zn as a food supplement to horses and the variation in Zn levels the result of a mixed diet.
When comparing the results from the large-scale tests, it is interesting to note that ash from the reference SW had higher concentrations than the sludge mixture ash for all the selected trace elements As, Cd, Cr, Hg, Ni, Pb and Zn except Cu. The soft wood ashes even exceeded the limits for forest application for As, Cr and Cu which is interesting as ashes from biomass combustion generally are considered clean in contrast to sewage sludge ashes which are classed as waste and strictly regulated.
Compared to the fuel analysis in Table 1, As concentration in the bottom ash from the mixed fuel MSS-SW 30–70, Table 6, was at the same level as the calculated value, but there was also a significantly higher concentration in the filter ash and cyclone ash which would indicate evaporation of As from the fuel bed. This is a contradictory conclusion, as both retention in the bottom ash as well as increase by condensation in the fly ashes should not be possible, unless either material was somehow added or the fuel concentration was higher in the fuel sample than given by the fuel analysis.
The increase in Cr and Ni concentrations in the bottom ash from all combustion tests, Table 3 and Table 6, indicate bleeding of these metals from the steel in the moving grate boiler and the lab furnace respectively. This phenomenon has been reported previously by Corella and Toledo [40] with sewage sludge combustion in a fluidized bed. On the prospect of recycling P from MSS ashes through the approach here tested, this phenomenon might prove problematic as the added amounts of Cr and Ni from the boiler equipment are high enough to substantially increase the concentration of these metals in the bottom ash.

4.3. Fertilizer Potential

The P concentration in ashes from laboratory and industrial scale co-combustion of MSS with biomass or residues indicates that the formed bottom ashes are suitable either for further refinement or possibly for direct application as fertilizer. The phosphates formed during co-combustion are dominated by the mixed cation whitlockite and merrillite structures, which exhibits shown suitable properties with respect to plant availability [27]. There are few reports on the plant availability of complex mineral phosphates, but altering pure Ca-whitlockite (Ca3(PO4)2) by inclusion of Na in its structures has been shown to improve plant availability [41]. Phosphates present in ashes from mono-combustion have potential as long-term fertilizer [42], but further study is required to determine how further substitution of Ca, Al, and Fe with alkali in the phosphates affects plant uptake of P. Importantly, the changes in phosphate composition observed here demonstrate that it is possible to change what phosphates are formed through co-combustion in ways that may improve their plant availability.
The potential for direct application of ashes as fertilizer is therefore mainly dependent on concentrations of heavy metals. In this case, it was possible to separate Hg, Cd, Zn, and Pb efficiently from the P-rich bottom ash fraction. The concentration of Cu in relation to concentration of P in the bottom ash was largely unaffected by the thermal process. The elements present in steel materials in the grate process, Ni and Cr, increased in relation to P.

Author Contributions

Conceptualization, methodology and formal analysis, A.N., A.S., N.S., L.-E.Å. and A.P.; investigation, A.N., S.E., N.S., A.S., L.-E.Å. and A.P.; validation, N.S., L.-E.Å. and A.P.; writing—original draft preparation, A.N., writing—review and editing, N.S., A.S., L.-E.Å. and A. Pettersson; visualization, A.N.; supervision, N.S., L.-E.Å. and A.P.; project administration, A.P. All authors have read and agreed to the published version of the manuscript.

Funding

This research was funded by the Swedish Energy Agency, ReSource and Borås Energy and Environment to which the authors are very grateful.

Acknowledgments

The support of the Bio4Energy national strategic research program is gratefully acknowledged. Rambo, Uddevalla Energy and Rangsells are gratefully acknowledged for sharing the data at the industrial-scale experiments at Hovhultsverket in Uddevalla. The authors would also like to give a special acknowledgement to NODAVA for the supply of dried municipal sewage sludge. The authors acknowledge the facilities and technical assistance (Cheng Choo Lee) of the Umeå Core Facility for Electron Microscopy (UCEM—NMI node) at the Chemical Biological Centre (KBC), Umeå University. The authors would also like to acknowledge the research facilities and technical assistance of the Energy laboratory at University of Borås for the support and equipment regarding the laboratory-scale experiments.

Conflicts of Interest

The authors declare no conflict of interest.

References

  1. European Commission. Communication from the Commission to the European Parliament, the Council, the European Economic and Social Committee and the Committee of the Regions on the Review of the List of Critical Raw Materials for the EU and the Implementation of the Raw Materials Initiative; European Commission: Brussels, Belgium, 2014; Available online: https://ec.europa.eu/growth/sectors/raw-materials/specific-interest/Critical_en (accessed on 20 June 2019).
  2. Ivanová, L.; Mackuľak, T.; Grabic, R.; Golovko, O.; Koba, O.; Staňová, A.V.; Szabová, P.; Grenčíková, A.; Bodík, I. Pharmaceuticals and Illicit Drugs – A New Threat to the Application of Sewage Sludge in Agriculture. Sci. Total. Environ. 2018, 634, 606–615. [Google Scholar] [CrossRef] [PubMed]
  3. Malmborg, J.; Magnér, J. Pharmaceutical Residues in Sewage Sludge: Effect of Sanitization and Anaerobic Digestion. J. Environ. Manag. 2015, 153, 1–10. [Google Scholar] [CrossRef] [PubMed]
  4. Gasperi, J.; Rocher, V.; Gilbert, S.; Azimi, S.; Chebbo, G. Occurrence and Removal of Priority Pollutants by Lamella Clarification and Biofiltration. Water Res. 2010, 44, 3065–3076. [Google Scholar] [CrossRef] [PubMed] [Green Version]
  5. Mailler, R.; Gasperi, J.; Chebbo, G.; Rocher, V. Priority and Emerging Pollutants in Sewage Sludge and Fate During Sludge Treatment. Waste Manag. 2014, 34, 1217–1226. [Google Scholar] [CrossRef] [PubMed] [Green Version]
  6. Marani, D.; Braguglia, C.; Mininni, G.; Maccioni, F. Behaviour of Cd, Cr, Mn, Ni, Pb, and Zn in Sewage Sludge Incineration by Fluidised Bed Furnace. Waste Manag. 2003, 23, 117–124. [Google Scholar] [CrossRef]
  7. Olofsson, U.; Brorström-Lundén, E.; Kylin, H.; Haglund, P. Comprehensive Mass Flow Analysis of Swedish Sludge Contaminants. Chemosphere 2013, 90, 28–35. [Google Scholar] [CrossRef]
  8. Hurley, R.R.; Nizzetto, L. Fate and Occurrence of micro(nano)plastics in Soils: Knowledge Gaps and Possible Risks. Curr. Opin. Environ. Sci. Heal. 2018, 1, 6–11. [Google Scholar] [CrossRef]
  9. Da Costa, J.P.; Santos, P.; Duarte, A.C.; Rocha-Santos, T. (Nano)plastics in the Environment – Sources, Fates and Effects. Sci. Total. Environ. 2016, 566, 15–26. [Google Scholar] [CrossRef]
  10. Krüger, O.; Adam, C. Recovery Potential of German Sewage Sludge Ash. Waste Manag. 2015, 45, 400–406. [Google Scholar] [CrossRef]
  11. Herzel, H.; Krüger, O.; Hermann, L.; Adam, C. Sewage Sludge Ash — A Promising Secondary Phosphorus Source for Fertilizer Production. Sci. Total. Environ. 2016, 542, 1136–1143. [Google Scholar] [CrossRef]
  12. Krüger, O.; Grabner, A.; Adam, C. Complete Survey of German Sewage Sludge Ash. Environ. Sci. Technol. 2014, 48, 11811–11818. [Google Scholar] [CrossRef] [PubMed]
  13. Verordnung Zur Neuordnung Der Klärschlammverwertung; Bundesanzeiger Verlag: Köln, Germany, 2017; Vol. 65.
  14. Hiller, G.; Werther, J. Phosphorus Recycling from Sewage Water via Fluidized Bed Sludge Combustion. In Proceedings of the 6th Workshop on “Operating Experience With Fluidized Bed Firing Systems”, Cracow, Poland, 22 May 2017. [Google Scholar]
  15. Larsson, F.K.; Johansson, M.H.; Lindblad Hammar, I. Hållbar Slamhantering SOU 2020:3; Norsteds Juridik AB: Stockholm, Sweden, 2020. [Google Scholar]
  16. Wollmann, I.; Gauro, A.; Müller, T.; Möller, K. Phosphorus Bioavailability of Sewage Sludge-Based Recycled Fertilizers. J. Plant Nutr. Soil Sci. 2017, 181, 158–166. [Google Scholar] [CrossRef]
  17. Nanzer, S.; Oberson, A.; Huthwelker, T.; Eggenberger, U.; Frossard, E. The Molecular Environment of Phosphorus in Sewage Sludge Ash: Implications for Bioavailability. J. Environ. Qual. 2014, 43, 1050–1060. [Google Scholar] [CrossRef] [PubMed] [Green Version]
  18. Wilken, V.; Gerhardt, A.; Kabbe, C.; Rastetter, N.; Stemann, J. P-REX D8.1 Quantification of Nutritional Value and Toxic Effects of Each P Recovery Product, Sustainable Sewage Sludge Management Fostering Phosphorus Recovery and Energy Efficiency; Zenodo: Genéve, Switzerland, 2015; Available online: https://zenodo.org/record/242550/files/PREX%20D8.1%20Quantification%20of%20nutritional%20value%20and%20toxic%20effects%20of%20each%20P%20recovery%20product.pdf?download=1 (accessed on 19 March 2020).
  19. Egle, L.; Rechberger, H.; Krampe, J.; Zessner, M. Phosphorus Recovery from Municipal Wastewater: An Integrated Comparative Technological, Environmental and Economic Assessment of P Recovery Technologies. Sci. Total. Environ. 2016, 571, 522–542. [Google Scholar] [CrossRef] [Green Version]
  20. Syed-Hassan, S.S.A.; Wang, Y.; Hu, S.; Su, S.; Xiang, J. Thermochemical Processing of Sewage Sludge to Energy and Fuel: Fundamentals, Challenges and Considerations. Renew. Sustain. Energy Rev. 2017, 80, 888–913. [Google Scholar] [CrossRef]
  21. Åmand, L.-E.; Leckner, B. Metal Emissions from Co-Combustion of Sewage Sludge and coal/Wood in Fluidized Bed. Fuel 2004, 83, 1803–1821. [Google Scholar] [CrossRef]
  22. Lopes, H.; Abelha, P.; Lapa, N.; Oliveira, J.; Cabrita, I.; Gulyurtlu, I. The Behaviour of Ashes and Heavy Metals During the Co-Combustion of Sewage Sludges in a Fluidised Bed. Waste Manag. 2003, 23, 859–870. [Google Scholar] [CrossRef]
  23. Ren, Q.; Li, L. Co-Combustion of Agricultural Straw With Municipal Sewage Sludge in a Fluidized Bed: Role of Phosphorus in Potassium Behavior. Energy Fuels 2015, 29, 4321–4327. [Google Scholar] [CrossRef]
  24. Xiao, Z.; Yuan, X.; Jiang, L.; Chen, X.; Li, H.; Zeng, G.; Leng, L.; Wang, H.; Huang, H. Energy Recovery and Secondary Pollutant Emission from the Combustion of Co-Pelletized Fuel from Municipal Sewage Sludge and Wood Sawdust. Energy 2015, 91, 441–450. [Google Scholar] [CrossRef]
  25. Skoglund, N.; Bäfver, L.; Fahlström, J.; Holmén, E.; Renström, C. Fuel Design in Co-Combustion of Demolition Wood Chips and Municipal Sewage Sludge. Fuel Process. Technol. 2016, 141, 196–201. [Google Scholar] [CrossRef] [Green Version]
  26. Elled, A.-L.; Amand, L.-E.; Leckner, B.; Andersson, B.-Å. The Fate of Trace Elements in Fluidised Bed Combustion of Sewage Sludge and Wood. Fuel 2007, 86, 843–852. [Google Scholar] [CrossRef]
  27. Kumpiene, J.; Brännvall, E.; Wolters, M.; Skoglund, N.; Čirba, S.; Aksamitauskas, V.Č. Phosphorus and Cadmium Availability in Soil Fertilized With Biosolids and Ashes. Chemosphere 2016, 151, 124–132. [Google Scholar] [CrossRef] [PubMed]
  28. Van De Velden, M.; Dewil, R.; Baeyens, J.; Josson, L.; Lanssens, P. The Distribution of Heavy Metals During Fluidized Bed Combustion of Sludge (FBSC). J. Hazard. Mater. 2008, 151, 96–102. [Google Scholar] [CrossRef] [PubMed]
  29. Ordinance (1998:944) on prohibitions etc. in certain cases in connection with the handling, importation and export of chemical products. Available online: https://www.riksdagen.se/sv/dokument-lagar/dokument/svensk-forfattningssamling/forordning-1998944-om-forbud-mm-i-vissa-fall_sfs-1998-944 (accessed on 20 June 2019).
  30. Hjerpe, K.; Andersson, S.; Eriksson, H.; Lomander, A.; Samuelsson, H.; Stendahl, J.; Wallstedt, A. Rekommendationer Vid Uttag Av Avverkningsrester Och Askåterföring; Swedish Forest Agency: Jönköping, Sweden, 2008. [Google Scholar]
  31. Agency, S.E.P. Kungörelse Med föreskrifter Om Skydd för miljön, särskilt Marken, när Avloppsslam används I Jordbruket. Available online: https://www.naturvardsverket.se/Stod-i-miljoarbetet/Rattsinformation/Foreskrifter-allmanna-rad/NFS/1994/SNFS-19942---Skydd-for-miljon-nar-avloppsslam-anvands-i-jordbruket/ (accessed on 19 June 2019).
  32. EUR-Lex, Regulation (EU) 2019/1009 of the European Parliament and of the Council of 5 June 2019 laying down rules on the making available on the market of EU fertilising products and amending Regulations (EC) No 1069/2009 and (EC) No 1107/2009 and repealing Regulation (EC) No 2003/2003. Available online: https://eur-lex.europa.eu/eli/reg/2019/1009/oj (accessed on 20 June 2019).
  33. Razmjoo, N.; Sefidari, H.; Strand, M. Measurements of Temperature and Gas Composition Within the Burning Bed of Wet Woody Residues in a 4 MW Moving Grate Boiler. Fuel Process. Technol. 2016, 152, 438–445. [Google Scholar] [CrossRef]
  34. Kabekkodu, S. PDF-4+ 2019 (Database); International Centre for Diffraction Data: Newtown Square, PA, USA, 2019. [Google Scholar]
  35. Kanchanapiya, P.; Mikuni, T.; Furuuchi, M.; Han, J.; Sakano, T.; Wang, G. The Behaviour of Phosphorus and Heavy Metals in Sewage Sludge Ashes. Int. J. Environ. Pollut. 2009, 37, 357. [Google Scholar] [CrossRef]
  36. Havukainen, J.; Nguyen, M.T.; Hermann, L.; Horttanainen, M.; Mikkilä, M.; Deviatkin, I.; Linnanen, L. Potential of Phosphorus Recovery from Sewage Sludge and Manure Ash by Thermochemical Treatment. Waste Manag. 2016, 49, 221–229. [Google Scholar] [CrossRef]
  37. Graetsch, H. Thermal Expansion and Thermally Induced Variations of the Crystal Structure of AlPO4 Low Cristobalite. Neues Jahrbuch für Mineralogie Monatshefte 2003, 2003, 289–301. [Google Scholar] [CrossRef]
  38. Peplinski, B.; Adam, C.; Adamczyk, B.; Muller, R.; Michaelis, M.; Krahl, T.; Emmerling, F.L. Nanocrystalline and Stacking-Disordered β-Cristobalite AlPO4: The Now Deciphered Main Constituent of a Municipal Sewage Sludge Ash from a Full-Scale Incineration Facility. Powder Diffr. 2015, 30, S31–S35. [Google Scholar] [CrossRef]
  39. Gorazda, K.; Tarko, B.; Wzorek, Z.; Kominko, H.; Nowak, A.K.; Kulczycka, J.; Henclik, A.; Smol, M. Fertilisers Production from Ashes After Sewage Sludge Combustion – A Strategy towards Sustainable Development. Environ. Res. 2017, 154, 171–180. [Google Scholar] [CrossRef]
  40. Corella, J.; Toledo, J.M. Incineration of Doped Sludges in Fluidized Bed. Fate and Partitioning of Six Targeted Heavy Metals. I. Pilot Plant Used and Results. J. Hazard. Mater. 2000, 80, 81–105. [Google Scholar] [CrossRef]
  41. Severin, M.; Breuer, J.; Rex, M.; Stemann, J.; Ch, A.; Weghe, H.V.D.; Kucke, M. Phosphate Fertilizer Value of Heat Treated Sewage Sludge Ash. Plant Soil Environ. 2014, 60, 555–561. [Google Scholar] [CrossRef]
  42. Mackay, J.; Cavagnaro, T.; Jakobsen, I.; Macdonald, L.; Grønlund, M.; Thomsen, T.P.; Müller-Stöver, D. Evaluation of Phosphorus in Thermally Converted Sewage Sludge: P Pools and Availability to Wheat. Plant Soil 2017, 418, 307–317. [Google Scholar] [CrossRef]
Figure 1. (a) Schematic view of the ENTECH fixed bed laboratory-scale reactor. 1: combustion chamber; 2: fixed bed; 3: primary air; 4: secondary air; 5: thermocouples; 6: heating zone; 7: cyclone; (b) hot fixed bed (2) withdrawn from the bottom of the reactor; (c) fixed bed (Gooch crucible) from above; and (d) fixed bed from above with ash.
Energies 13 01708 g001
Figure 2. A modified [33] schematic picture of the HOTAB/Saxlund 8MWth sloping reciprocating grate furnace at Uddevalla Energy AB, Sweden. A) fuel inlet, B) glass window, C1–C3) Box 1 to Box 3, D) ash outlet, E) reciprocating grate, F) secondary air ports, G) tertiary air ports, H) exit of the after burner section.
Energies 13 01708 g002
Figure 3. Trend curve of the stability in the operating conditions of the grate fired boiler. = District heating water temperature (°C); = Combustion chamber temperature (°C); = Oxygen in flue gas (% on wet flue gas); = Flue gas temperature after boiler section (°C); = Carbon monoxide (CO) (ppm on wet flue gas); = Nitric oxides (NOx) (mgNO2 /mn3 in dry flue gas).
Energies 13 01708 g003
Figure 4. Bottom ash slag from the co-combustion of sewage sludge with soft wood, MSS-SW 30–70.
Energies 13 01708 g004
Figure 5. Major element distribution (map sum spectra representation) from SEM-EDX analysis of the samples MSS, MSS bark 20–80 and MSS dung 20–80, SW and MSS-SW 30–70 on carbon and oxygen free basis.
Energies 13 01708 g005
Figure 6. SEM-EDX images for ash samples MSS, MSS bark 20–80 and MSS dung 20–80. Specific areas for P association analysis are marked with numbers in each electron image.
Energies 13 01708 g006aEnergies 13 01708 g006b
Figure 7. SEM-EDX images for ash samples SW and MSS-SW 30–70. Specific areas for P association analysis are marked with numbers in each electron image.
Energies 13 01708 g007aEnergies 13 01708 g007bEnergies 13 01708 g007c
Table 1. Some analytical properties of the raw fuels and calculated properties of the mixture, n = 3.
FuelMSS4SW530% MSS + 70% SW6Bark7Dung8
Proximate analysis (wt.%)
Moisture111 ± 2443410 ± 78.3 ± 6.0
Ash221 ± 10.68.94.0 ± 116 ± 1
Combustibles27899919784
Ultimate analysis (wt.%1)
C55 ± 0505255 ± 154 ± 1
H8.0 ± 1.011106.1 ± 0.06.7 ± 0.0
O31 ± 1383638 ± 136 ± 1
N4.4 ± 0.20.181.70.54 ± 0.102.7 ± 0.1
S0.7 ± 0.00.020.200.100.49 ± 0.01
Cl0.05 ± 0.000.020.030.02 ± 0.000.84 ± 0.04
Heating value (MJ/kg)
LHV, daf323.519.220.723.1na
LHV, ar116.79.511.719.6na
Ash analysis (g·(kg ash)−1)2
Al180 ± 167.017010 ± 225 ± 3
Ca47 ± 325055260 ± 2178 ± 3
Fe20 ± 310202.5 ± 0.49.7 ± 1.7
K8.6 ± 3.01601452 ± 392 ± 6
Mg4.9 ± 0.7356.119 ± 129 ± 1
Na2.9 ± 1.58.83.11.7 ± 0.445 ± 0
P77 ± 2157513 ± 131 ± 4
Si90 ± 9889011 ± 2160 ± 3
Ti2.1 ± 1.41.82.00.2 ± 0.11.1 ± 0.1
Trace elements (mg·(kg ash)−1)2
As 5.9 ± 1.38.36.06.3 ± 1.51.9 ± 0.1
Cd2.1 ± 0.3232.914 ± 21.6 ± 0.3
Co7.2 ± 0.6207.76.5 ± 1.23.2 ± 0.2
Cr160 ± 335016027 ± 914 ± 5
Cu730 ± 190200710140 ± 33150 ± 12
Hg1.2 ± 0.13.31.3<1.4<0.2
Mn500 ± 1117,000110018,000 ± 3001600 ± 33
Ni43 ± 21704823 ± 119.6 ± 1.2
Pb49 ± 16655032 ± 117.5 ± 0.8
Sb6.1 ± 3.6337.2<1.8<0.26
V37 ± 316.3364.0 ± 0.924 ± 3
Zn1600 ± 100420017004700 ± 630560 ± 130
1 as received, 2 dry, 3 dry and ash free, 4 Municipal Sewage Sludge, from the wastewater treatment plant in Mora, Sweden, 5 Soft Wood from the county of Dalsland and Värmland in Sweden, 6 calculated data, based on measured data for MSS and SW, 7 bark from a saw mill in Mora, Sweden, 8 horse dung, from a local horse stable in Borås, Sweden, na—not analyzed.
Table 2. Calculated properties of the fuel mixtures used in the lab experiments, based on the measured data given in Table 1.
FuelMSS bark 20–80MSS bark 40–60MSS bark 50–50MSS dung 20–80MSS dung 40–60MSS dung 50–50
Proximate analysis (wt.%)
Moisture110 + 610 + 510 ± 58.7 ± 59.2 ± 49.5 ± 4
Ash27.4 ± 111 ± 113 ± 117 ± 118 ± 119 ± 1
Ash analysis (g·(kg ash)−1)2
Al105 ± 5141 ± 8151 ± 962 ± 695 ± 8111 ± 10
Ca138 ± 1794 ± 1481 ± 1271 ± 364 ± 361 ± 3
Fe13 ± 216 ± 217 ± 212 ± 314 ± 216 ± 2
K27 ± 318 ± 316 ± 372 ± 554 ± 546 ± 5
Mg11 ± 18.0 ± 17.1 ± 124 ± 118 ± 116 ± 1
Na2.3 ± 0.62.6 ± 0.82.7 ± 1.035 ± 0.326 ± 0.621 ± 0.8
P49 ± 163 ± 167 ± 242 ± 452 ± 557 ± 6
Si56 ± 372 ± 577 ± 6142 ± 4127 ± 5120 ± 6
Ti1.2 ± 0.41.6 ± 0.61.8 ± 0.81.3 ± 0.41.5 ± 0.61.6 ± 0.8
Trace elements (mg·(kg ash)−1)2
As 6.1 ± 1.56.0 ± 1.46.0 ± 1.42.9 ± 0.33.7 ± 0.64.1 ± 0.7
Cd7.3 ± 1.74.8 ± 1.34.0 ± 1.21.7 ± 0.31.8 ± 0.31.9 ± 0.3
Co6.9 ± 1.17.0 ± 1.07.1 ± 0.94.2 ± 0.35.0 ± 0.45.4 ± 0.4
Cr100 ± 8127 ± 7135 ± 647 ± 578 ± 493 ± 4
Cu474 ± 64599 ± 96636 ± 112287 ± 48414 ± 83473 ± 101
Hg1.3 ± 01.2 ± 01.2 ± 00.4 ± 00.7 ± 00.8 ± 0
Mn8300 ± 2424500 ± 1843400 ± 1561400 ± 291100 ± 241000 ± 22
Ni34 ± 938 ± 739 ± 718 ± 125 ± 228 ± 2
Pb42 ± 1245 ± 1346 ± 1418 ± 427 ± 731 ± 9
Sb4.2 ± 0.75.1 ± 1.45.4 ± 1.81.7 ± 0.72.9 ± 1.43.5 ± 1.8
V23 ± 129 ± 231 ± 227 ± 330 ± 331 ± 3
Zn3000 ± 5202300 ± 4202100 ± 370820 ± 1201100 ± 1201200 ± 120
1 as received, 2 dry.
Table 3. Concentrations of selected elements in ashes from lab-scale experiments given as mean values with sample standard deviations (n = 2–9). Values given in italics are based on single data points. All concentrations are given on dry weight basis.
ElementPAs4Cd4Cr5Cu5Hg4Ni5Pb4Zn5
Ashes Unitg*kg−1mg*kg−1mg*kg−1mg*kg−1mg*kg−1mg*kg−1mg*kg−1mg*kg−1mg*kg−1
Bark17 ± 7e13 ± 18b<0.05b850 ± 850e150 ± 34e<0.01b580 ± 680e2.4 ± 0.5b260 ± 160e
Dung37 ± 4enana75 ± 26e160 ± 21ena50 ± 13ena180 ± 80e
MSS70 ± 4dna0.11160 ± 70d810 ± 21d<0.0159 ± 13d15810 ± 220d
MSS bark 20–8070 ± 2g3.2 ± 0.2b0.10 ± 0.04c550 ± 160g670 ± 94g<0.25c300 ± 200g6.9 ± 2.2c210 ± 130g
MSS bark 40–6082 ± 3f3.3 ± 0.4b0.12 ± 0.10c390 ± 180f750 ± 110f<0.50c210 ± 200f7.1 ± 2.7c190 ± 58f
MSS bark 50–5074 ± 8f3.6 ± 0.8b0.09 ± 0.04c400 ± 310f720 ± 76f<0.01c250 ± 280f10 ± 4a300 ± 110f
MSS dung 20–8040 ± 2bnana72 ± 12b280 ± 35bna25 ± 5bna590 ± 160b
MSS dung 40–6046 ± 3bnana97 ± 8b380 ± 20bna33 ± 3bna1400 ± 830b
MSS dung 50–5054 ± 3cna0.12130 ± 50c500 ± 24c<0.0159 ± 21c13820 ± 330c
Farmland limits1 21006002.550 100800
EU limits fertilizer2 40362760011001201500
Forest limits3>7830302004003703007000
1 Limits set by Swedish government for concentration of heavy metals in sewage sludge intended for application on farmland, regulation SFS 1998:994, 2 Regulation (EU) 2019/1009, which regulates content of heavy metals in inorganic macronutrient fertilizers, 3 Recommended levels set by the Swedish Forest Agency for forest application of ashes, 4 analyzed at ALS Scandinavia, see Section 2.2.1 for details, 5 analyzed both by ALS Scandinavia and the authors, values given with respect to mixed data, 6 when P2O5 is < 5 wt.% the phosphorus limit value is 3 mg per kg dry matter, 7 for Cr (VI) the limit value is 2 mg per kg dry matter while in this table the total Cr concentrations are given, 8 the phosphor concentration should be higher than 7 g/kg ash for the ash to be eligible for forest application, na—not analyzed, the following letters a–g denote the number of replicates for each sample: a = 2, b = 3, c = 4, d = 5, e = 6, f = 7, g = 9.
Table 4. Calculated concentrations from Table 3 of selected trace elements in ashes from laboratory-scale experiments given as g*(ha, year)−1, calculated on a maximum supply of 22 kg P (ha, year)−1. The result is presented as mean values with sample standard deviations (n = 2 − 9). Values in italics are based on single data points.
Ash ElementAsCdCrCuHgNiPbZn
bark12 ± 160.05990 ± 810220 ± 590.01620 ± 5602.3 ± 0.5510 ± 460
dungnana45 ± 1594 ± 4na31 ± 10na110 ± 54
MSSna0.0351 ± 20260 ± 110.00318 ± 34.5260 ± 71
MSS bark 20–801.0 ± 0.10.03 ± 0.01170 ± 50210 ± 330.02 ± 0.0496 ± 622.1 ± 0.767 ± 42
MSS bark 40–600.9 ± 0.10.03 ± 0.03100 ± 48200 ± 340.04 ± 0.0757 ± 511.9 ± 0.850 ± 15
MSS bark 50–501.0 ± 0.20.02 ± 0.01120 ± 88220 ± 440.00372 ± 752.7 ± 1.089 ± 29
MSS dung 20–80nana39 ± 4150 ± 12na14 ± 2.1na330 ± 110
MSS dung 40–60nana46 ± 3180 ± 2na16 ± 2na670 ± 440
MSS dung 50–50na0.0555 ± 22200 ± 90.00424 ± 95.1330 ± 130
SNFS 1994:21 0.75403001.52525600
1 Limits set by Swedish Environmental Protection Agency in regulation SNFS 1994:2, [31].
Table 5. Calculated concentrations from Table 3 where P2O5 was calculated with the assumption that all P was in the form P2O5.
P2O5P2O5Cd
Element (g*(kg ash)−1)(wt.%)(mg*(kg P2O5)−1)
bark3841.3
dung848na
MSS161160.7
MSS bark 20–80161160.6
MSS bark 40–60187190.7
MSS bark 50–50171170.5
MSS dung 20–80929na
MSS dung 40–6010611na
MSS dung 50–50124121.0
EU limits fertilizer1 60
1 Regulation (EU) 2019/1009 which regulates content of heavy metals in inorganic macronutrient fertilizers.
Table 6. Results of the analysis of ashes, (bottom ash, filter ash and multi-cyclone ash). Comparison between the reference case SW and the fuel-mixture MSS-SW 30–70. Both bottom ashes are given as mean values with standard deviation (n = 2).
SWMSS-SW 30–70
Bottom AshFilter AshMulti-Cyclone AshBottom AshFilter AshMulti-Cyclone Ash
Ash analysis (g*(kg ash)−1)1
Al25 ± 32716160 ± 331513
Ca270 ± 8724027081 ± 0160250
Fe42 ± 3585629 ± 23839
K76 ± 6635624 ± 15554
Mg41 ± 10203910 ± 11537
Na7.3 ± 0.6109.85.3 ± 0.11310
P18 ± 69.42149 ± 18132
Si92 ± 305332120 ± 11724
Ti1.2 ± 0.05.00.922.9 ± 0.13.20.74
Trace elements (mg*(kg ash)−1)1
As 41 ± 42501206.722061
Cd5.1 ± 2.12245<0.513175
Cr600 ± 26470400220 ± 7420440
Cu250 ± 29490310620 ± 8550290
Hg<0.050.260.09<0.050.750.41
Ni100 ± 251106659 ± 37965
Pb86 ± 629604508.5 ± 1.51000380
Zn1300 ± 18044006700240 ± 15299006700
Calculated values2
P2O5 (g*(kg ash)−1)41224811019073
Cd (mg*(kg P2O5)−1)13010009404.51701000
1 dry ash, 2 values calculated with the assumption that all P is in the form P2O5, na—not available.
Table 7. Element distribution in marked areas in Figure 6 given as wt.% on a carbon- and oxygen-free basis.
AreaSiAlPCaFeKMgNaMnTiSCr
MSS
111412214821
21234211716
3143219111912 2
44418317
51342241272
61141241372 1
71441231462
810392713102
910333414721
10581814532
MSS bark 20–80
114319513 18 2
128241342542 2
1392913305122
1415231040552
159211144443 3
162111750272
171021114444212 1
18221754359
195156283332 3 5
2012241435552 2
MSS dung 20–80
215216373829
222911111731946 1
23255152521369
242516112231245 2
25301171771565 2
26637812 723
2722121228 1647
282415122331345 2
2919810393946 1
3017131631 1076 2
Table 8. Element distribution in marked areas in Figure 7 given as wt.% on carbon and oxygen free basis.
AreaSiAlPCaFeKMgNaMnTi
311933429109 4
32334 41 184
333262433114
342849 1065 4
35782 13 8
3617344610148
37369 301115
3821 65 87
391854489106
408 1262 613
MSS-SW 30–70
411541623862
4222301321652 2
436615 8 101
442444320332
45254181566
463332416941 1
47212913215721 1
48284261663
4919341617661
50651587 5
Table 9. Semi-quantitative analysis results from XRD. The industrial-scale samples provided enough sample amounts for a more reliable quantification.
SWMSS-SWMSSMSS BarkMSS Dung
Crystalline 5041
Amorphous 5059
Phosphates/Phosphosilicates
Calcium phosphate silicateCa15(PO4)2(SiO4)623
WhitlockiteCa2.589Mg0.411(PO4)2 16
MerrilliteCa9MgNa(PO4)7 ***(***)
Al0.667Fe0.333PO4 *****(**)
Silicates/Aluminosilicates
QuartzSiO2108******(***)
ÅkermaniteCa2MgSi2O74
MerwiniteCa3Mg(SiO4)221
AnorthiteCaAl2Si2O8 42
MicroclineKAlSi3O86
Oxides/hydroxides
LimeCaO8
PortlanditeCa(OH)25 **
PericlaseMgO20
CorundumAl2O3 32********
HematiteFe2O3 2 **
Carbonates
CalciteCaCO33
Total 100100
For the laboratory-scale experiments the samples are annotated with asterisks; * detected (0–5 wt.%); ** minor peak area contribution (5–15 wt.%); *** major (15–30 wt.%); **** dominant (>30 wt.%). MSS dung could not be assigned a complete qualitative identification; therefore, the resulting quantification is estimated within parenthesis.

