1. Introduction
There has been significant renovation of the electricity network in the last years. The increasing limitations in the expansion of the network have been solved via the installation of local power supply units, which allowed for distributed generation (DG) since they were not placed in centralized configurations as in traditional generation systems. In the meantime, climate change has become one of the most discussed themes affecting all aspects of society. Therefore, in order to lessen the dependence on fossil fuel in the energy sectors, DG has been combined with power systems [
1,
2] based on renewable energy sources. To integrate DG [
3], in an effective and optimized way, into the electricity network [
4], the concept of microgrids (MG) was born [
5,
6]. Via this method, DG works in synergy with energy storage devices [
7] for moderate and low voltage electrical loads. In the near future, the role of MGs will be extremely relevant, and it will be possible to assist distribution networks consisting of internally interconnected MGs and MGs connected with each other [
8]. The former means that a single MG will supply an aggregation of the user, e.g., all the users in the same building, while the latter means that several MGs will exchange energy with each other to increase the exploitation of the energy produced, which introduces new types of users, jointly-acting renewable self-consumers, and energy communities.
From the main grid point of view, an MG is a controllable set that can act as a load or power supply. In fact, MGs are able to operate in grid connection and island mode [
9]. An exciting aspect of grid mode is the services that an MG could provide to the network if considered as a virtual power plant [
10]. In this case, it can be seen as a source of ancillary services. Thus, it can help support the normal operation of the grid. However, factors such as interruptions in the main grid, grid loss, power quality, or maintenance issues can cause the MG to be disconnected from grid mode to island mode operation.
In order to satisfy customers’ needs, an MG needs to increase its interaction with the electricity grid while guaranteeing the safety, quality, and continuity of the supply. For this reason, power electronic devices play an essential role as interfaces between distributed generation sources and the MG system, where the voltage source inverters are the most essential equipment.
The presence of DG units in MGs has caused higher complexity in power control and voltage regulation. MG control is generally performed through a control structure that is very similar to the frequency control structure in traditional power grids, with the difference that, in addition to frequency control, other control topics such as voltage control, power-sharing, harmonic compensation, and energy management can be implemented [
11]. In these controls, voltage source inverters are controlled in a centralized and decentralized manner [
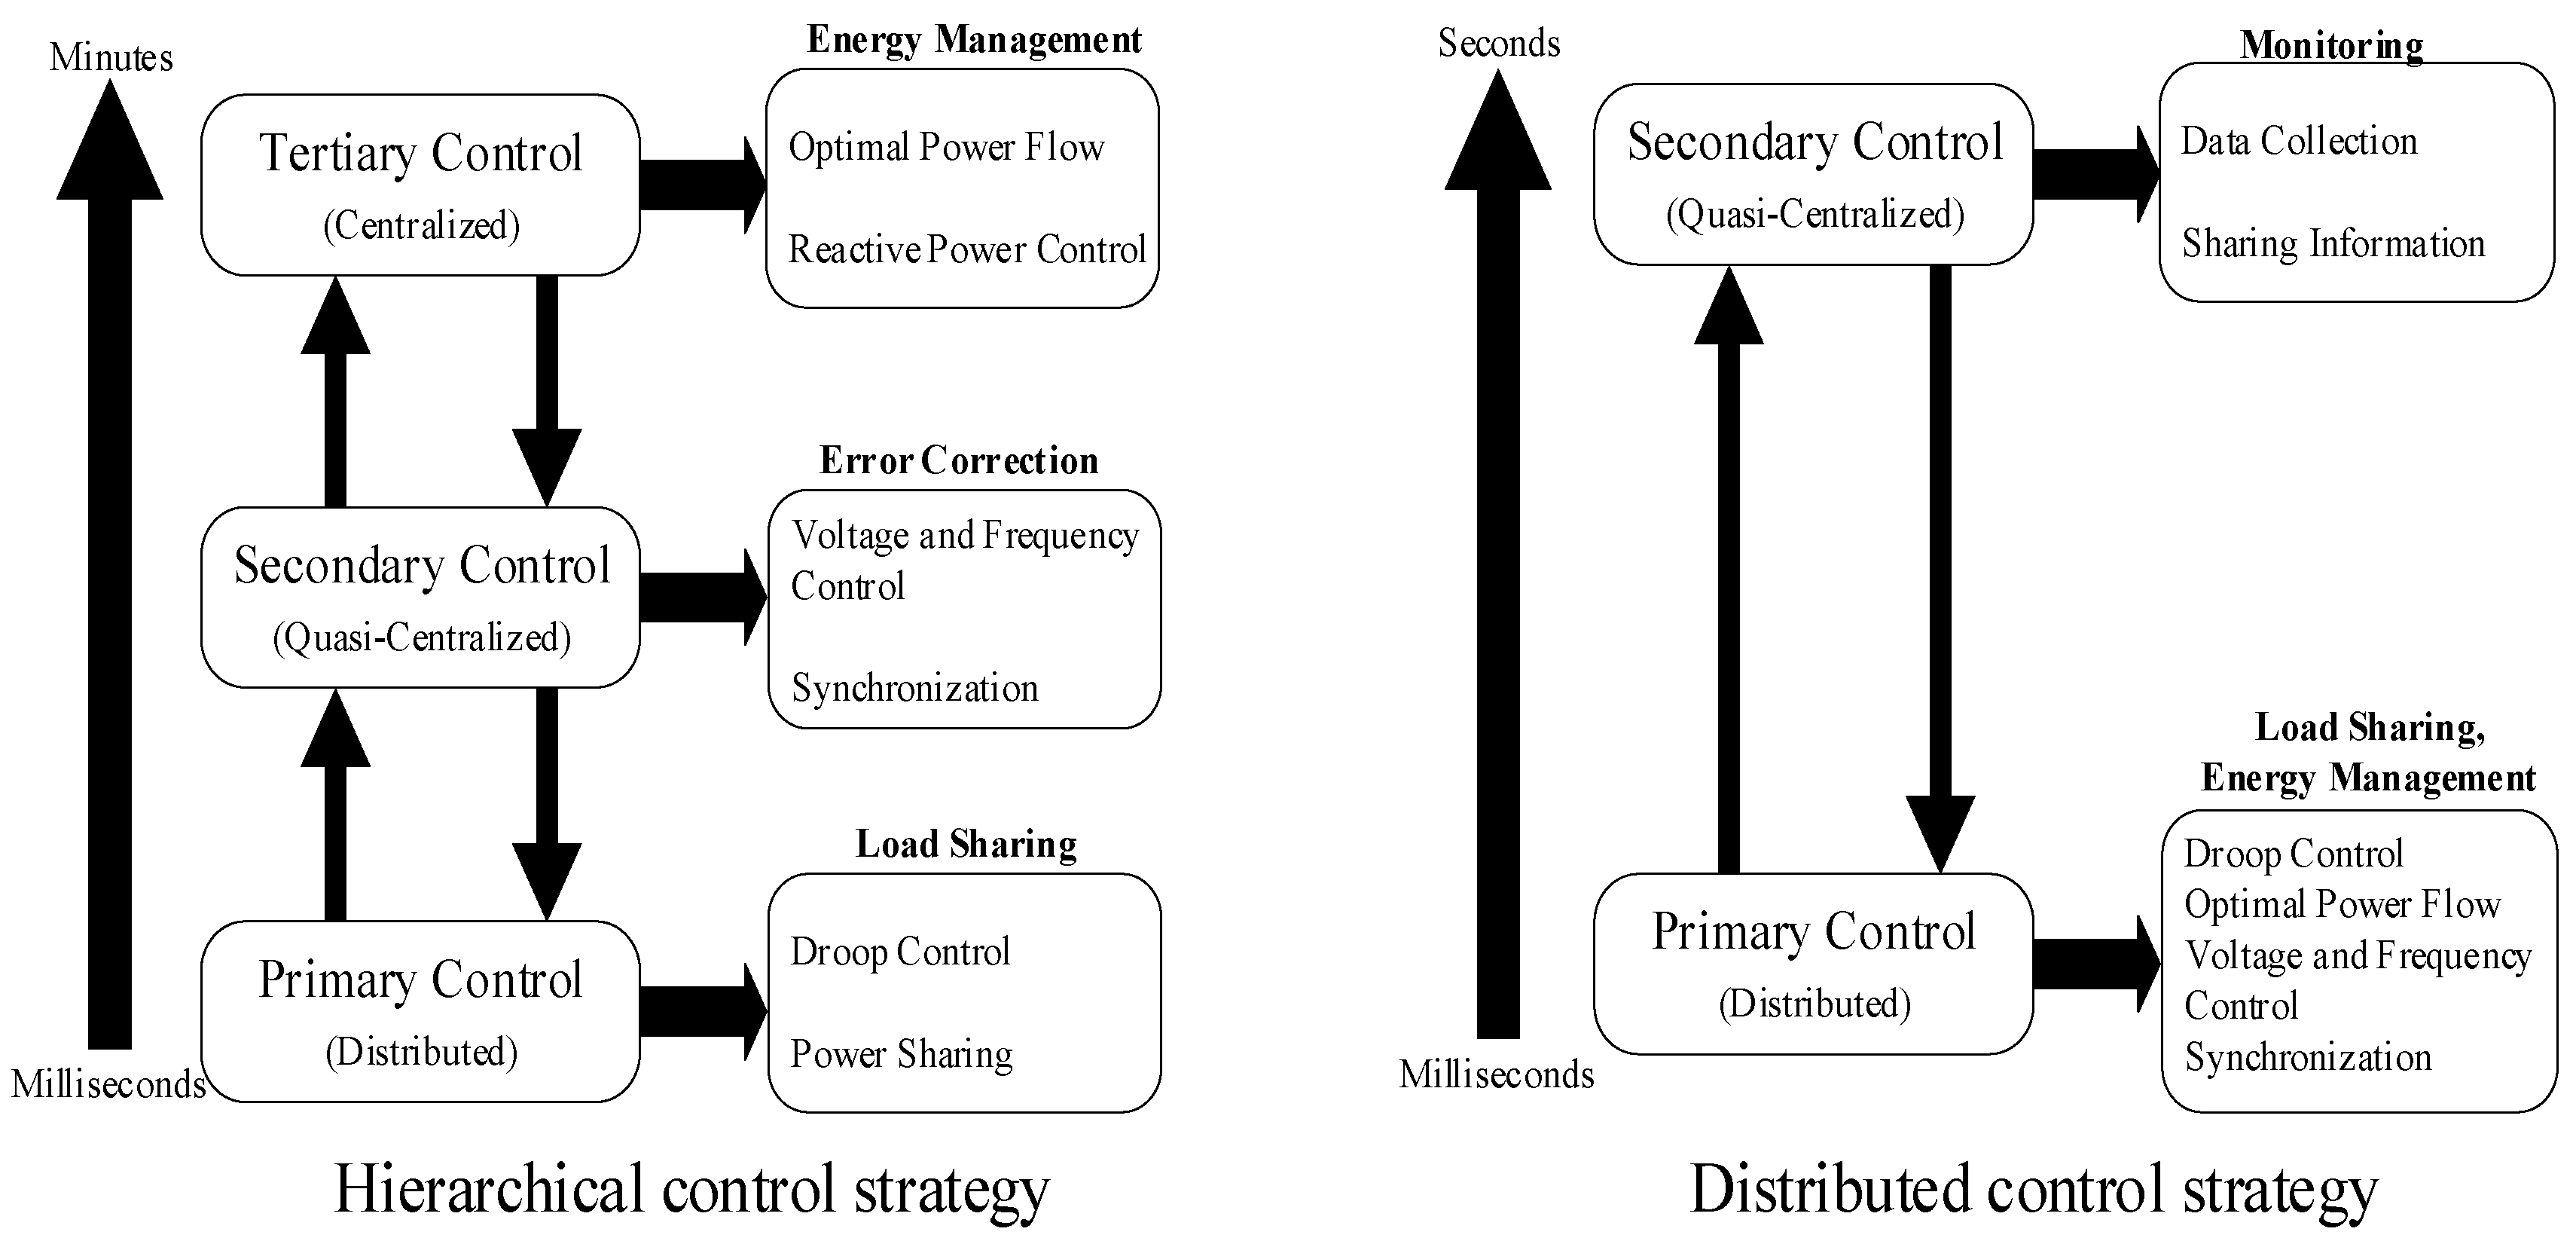
12]. The centralized control is based on communication links similar to the master–slave method in which the DG unit is responsible for the highest voltage power control capability. In the decentralized control method each DG unit is controlled by a local controller, which is based on frequency control. Although this method does not guarantee the voltage and frequency of the system, the simplicity and advantages of not using control based on telecommunication have determined it to be an appropriate solution for controlling MGs. The relationship between centralized and decentralized control is carried out by hierarchical control, which is formed by primary, secondary, and tertiary control levels as shown in
Figure 1 [
13,
14].
In general, the initial points of power can be adjusted with the primary/inner control loops. In the secondary control, the frequency deviation and voltage range are restored. Finally, at the third level, the power distribution control between the main grid and the MG is set at the point of common coupling. Since energy management in an MG requires a large amount of data for long distances, this will increase the length of the communication channel and reduce the reliability of data transmission. For this reason, two centralized and decentralized control strategies are used in supervisory control and data acquisition (SCADA) systems to overcome this problem. The outline for this manuscript is as follows. In the next section, the LAMBDA MG LAB is described. The proposed SCADA system and centralized energy management system (CEMS) in the LAMBDA LAB are discussed in
Section 3 and
Section 4, respectively. Finally, the conclusion is discussed in
Section 5.
2. LAMBDA MG Testbed LAB
Design, control, protection [
16,
17], security [
18], operation status (grid-connected or/and island mode), and energy management [
19] are the main areas of the MG field. The LAMBDA MG LAB consists of several sources: a 12 kW three phase PV system (PV1), a single-phase PV system (PV2) with 2 kW rated power, an emergency generator set (EGS) with 5.2 kW installed for island mode, a battery energy storage system (BESS) with 6.5 kWh of rated capacity (2.2 kW charge, 1.8 kW of AC discharge), and an uninterruptible power supply (UPS) to supply the electronic components [
20].
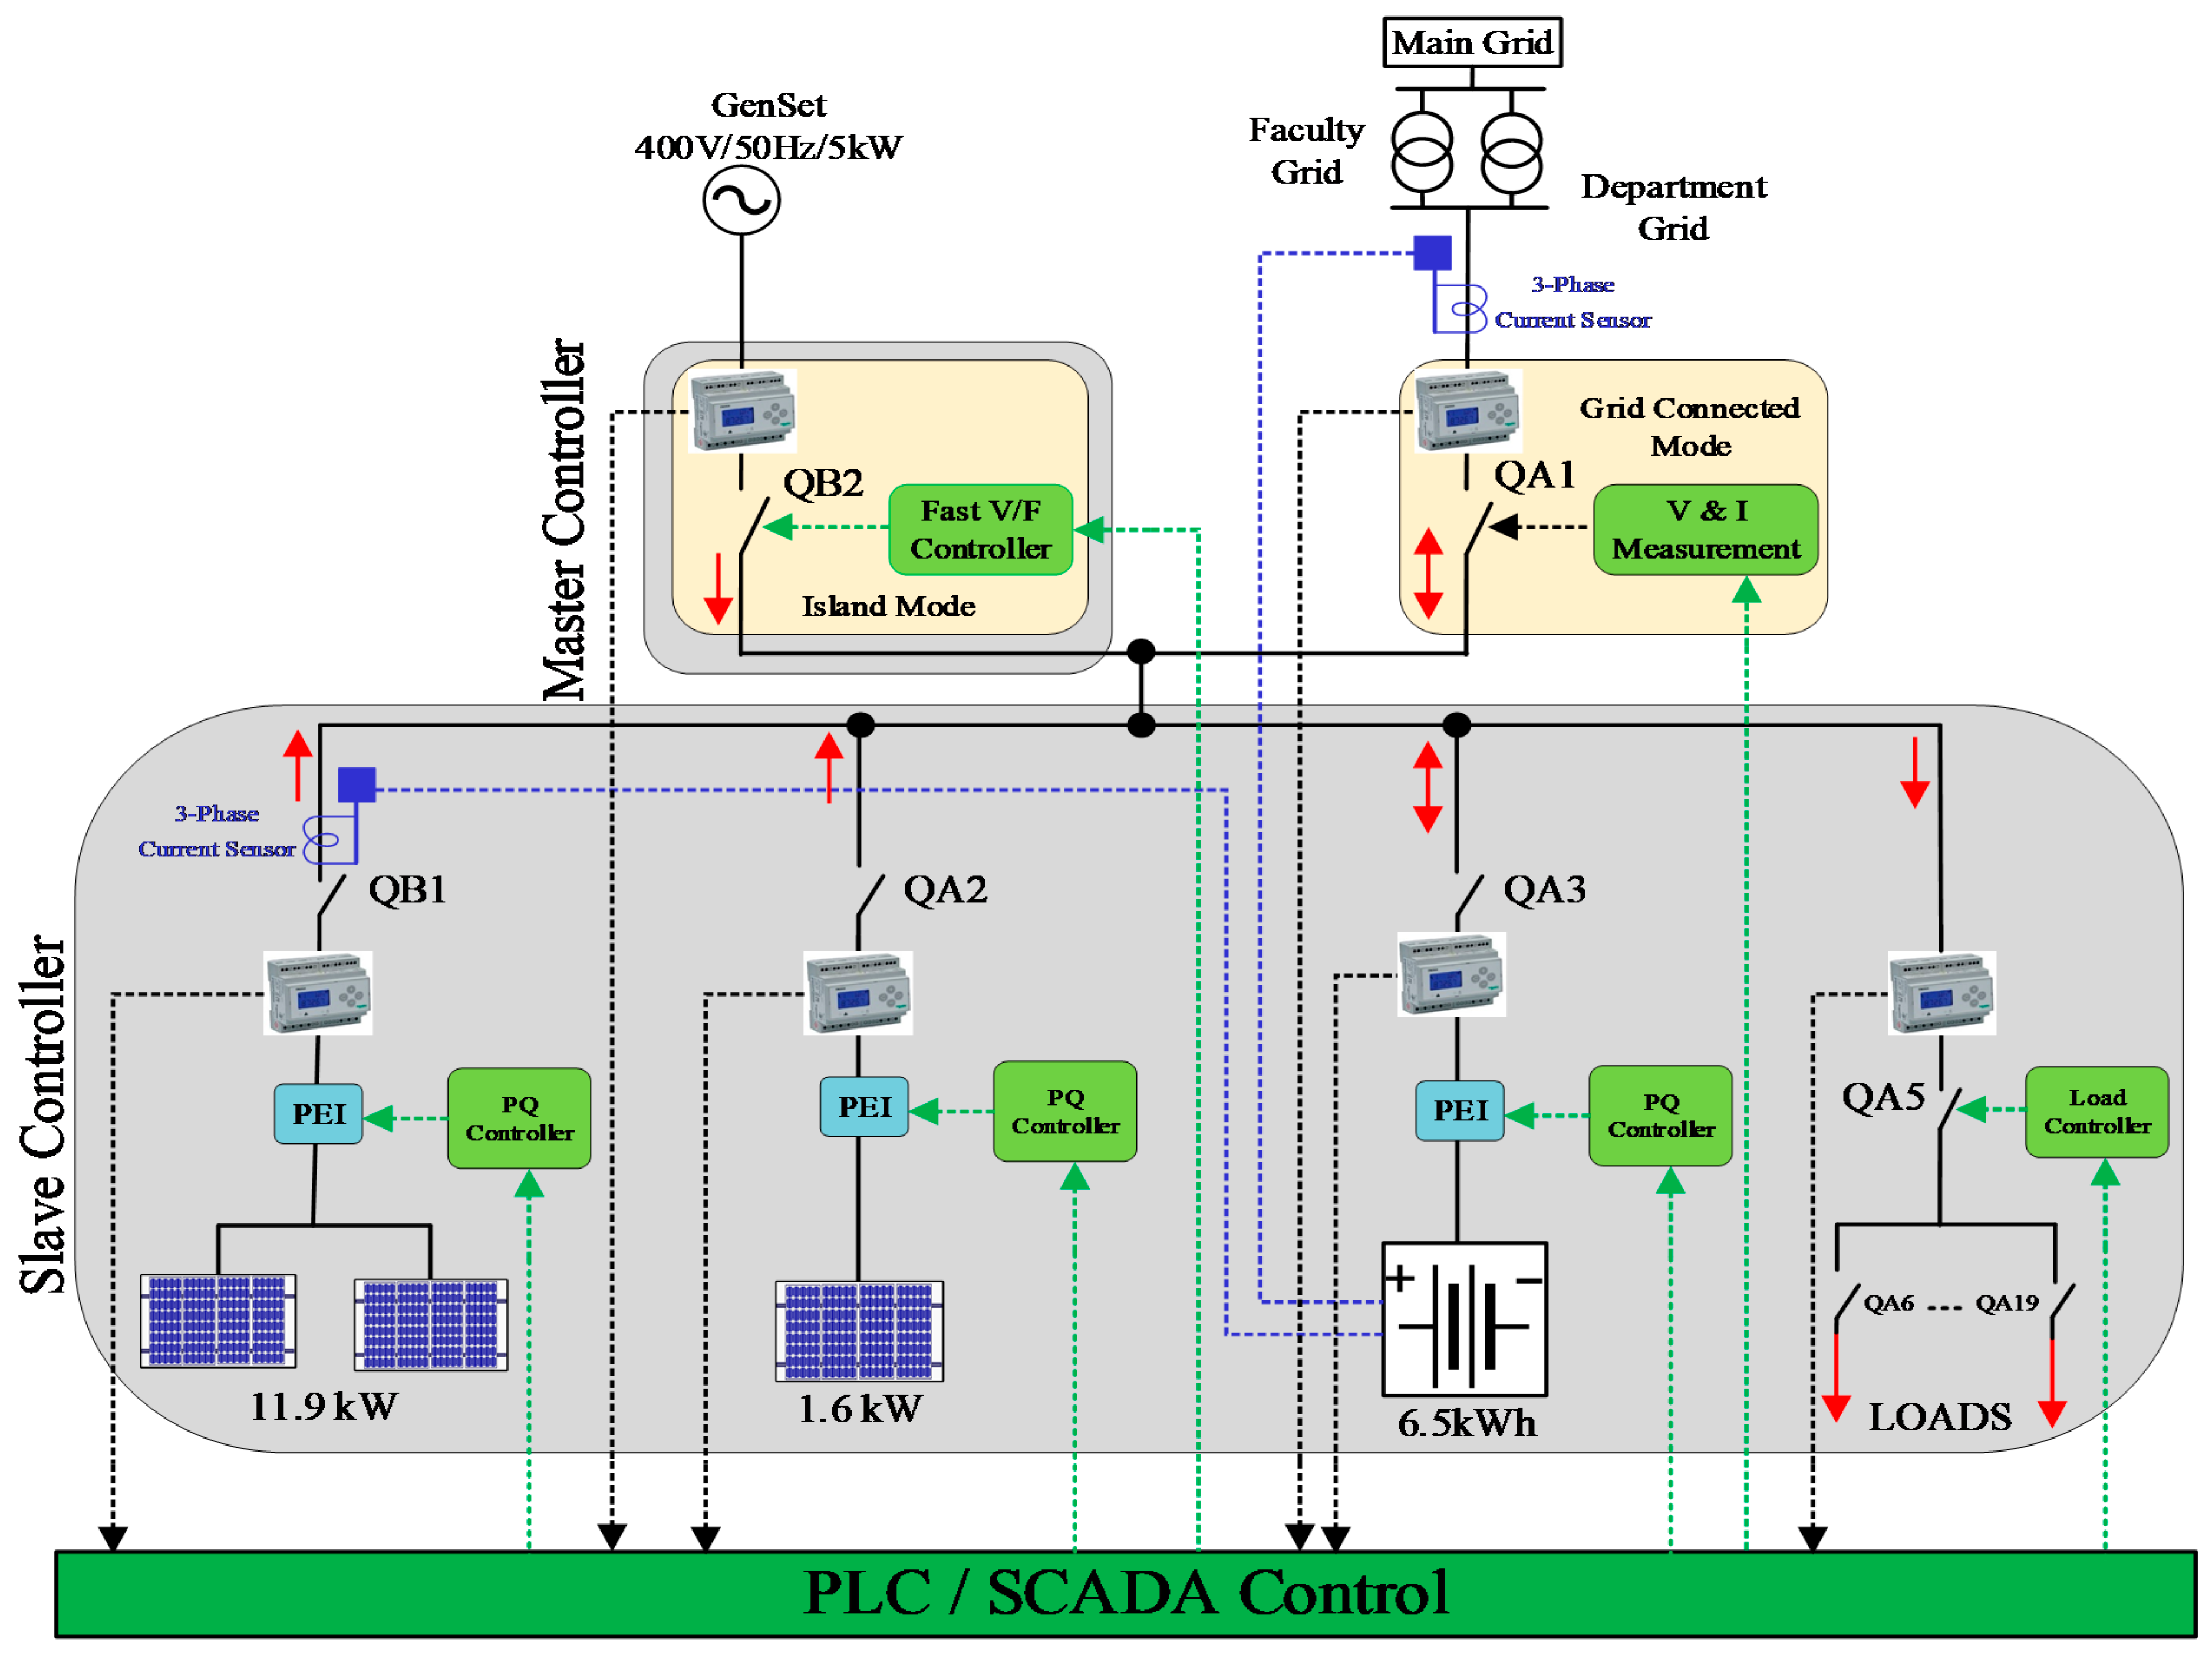
The master–slave control structure in LAMBDA MG LAB is shown in
Figure 2. Generally, when an MG operates in grid-connected mode, the voltage and frequency are dictated by the main grid, while in island mode a DG or an BESS of the master controller should operate in V/f mode to provide voltage and frequency references for other DGs and ESS in the MG, which work in active and reactive (PQ) control mode [
21]. The controller with the V/f control method is named the master controller, while the other controllers are slave controllers. As a future plan in LAMBDA LAB, an emergency generator set EGS will be used as the master controller (V/f mode) in order to regulate the voltage and frequency so that the LAMBDA MG can operate in island mode.
In this paper, a CEMS based on a real-time SCADA system was used in a LAMBDA testbed to achieve a nearly zero-energy MG. All the processes for the implementation and SCADA programming were done by the LAMBDA MG group. The proposed control strategy based on SCADA operated in such a way to catch real-time data of devices equipped with smart meters. Then, energy management was evaluated to consider appropriate strategies for the future. Those strategies are meant to be carried out by the SCADA system by sending comfortable orders, by means of network server, to the smart switches installed next to each component to turn them on or off by used power electronic interfaces.
3. SCADA System in LAMBDA Laboratories
SCADA systems, after the latest developments, are the best choice to manage processes such as oil, gas, and distribution systems. The most critical applications of SCADA systems in MGs include data collection, communication [
22], processing, remote control, and demand-side planning tools [
23]. The remote terminal unit (RTU), programmable logic controller (PLC), human–machine interface (HMI), and telecommunications infrastructure are the main components of a SCADA system [
24]. The combination of these components makes the execution of logical processes independent. The programming language (IEC61131-3) is used to write the commands and programs needed on RTU and PLC. Distribution network operators perform RTUs by connecting smart relays that lead to short time alerts, programmable pulse length digital outputs, and so on. Centralized and decentralized control are the main strategies in SCADA systems. One of the most important functions of centralized control in SCADA systems is demand-side management. A CEMS is used in SCADA systems for easy management, support, and dedicated monitoring. In addition to low-cost telecommunications infrastructure, fast response time is one of the most important benefits of this control strategy. The main screen of the SCADA system in the LAMBDA lab includes three main stages. The first represents the power system scheme, such as the electrical switchboard panel and single line diagram of the system. Lighting control, sensors, controllable plugs, weather stations, and air conditioning have been characterized in the KNX part as the second stage, in order to program and implement the smart home and building projects as zero-energy buildings [
25,
26,
27,
28,
29,
30]. The last part is for the energy meters in the switchboard with Modbus communication protocol.
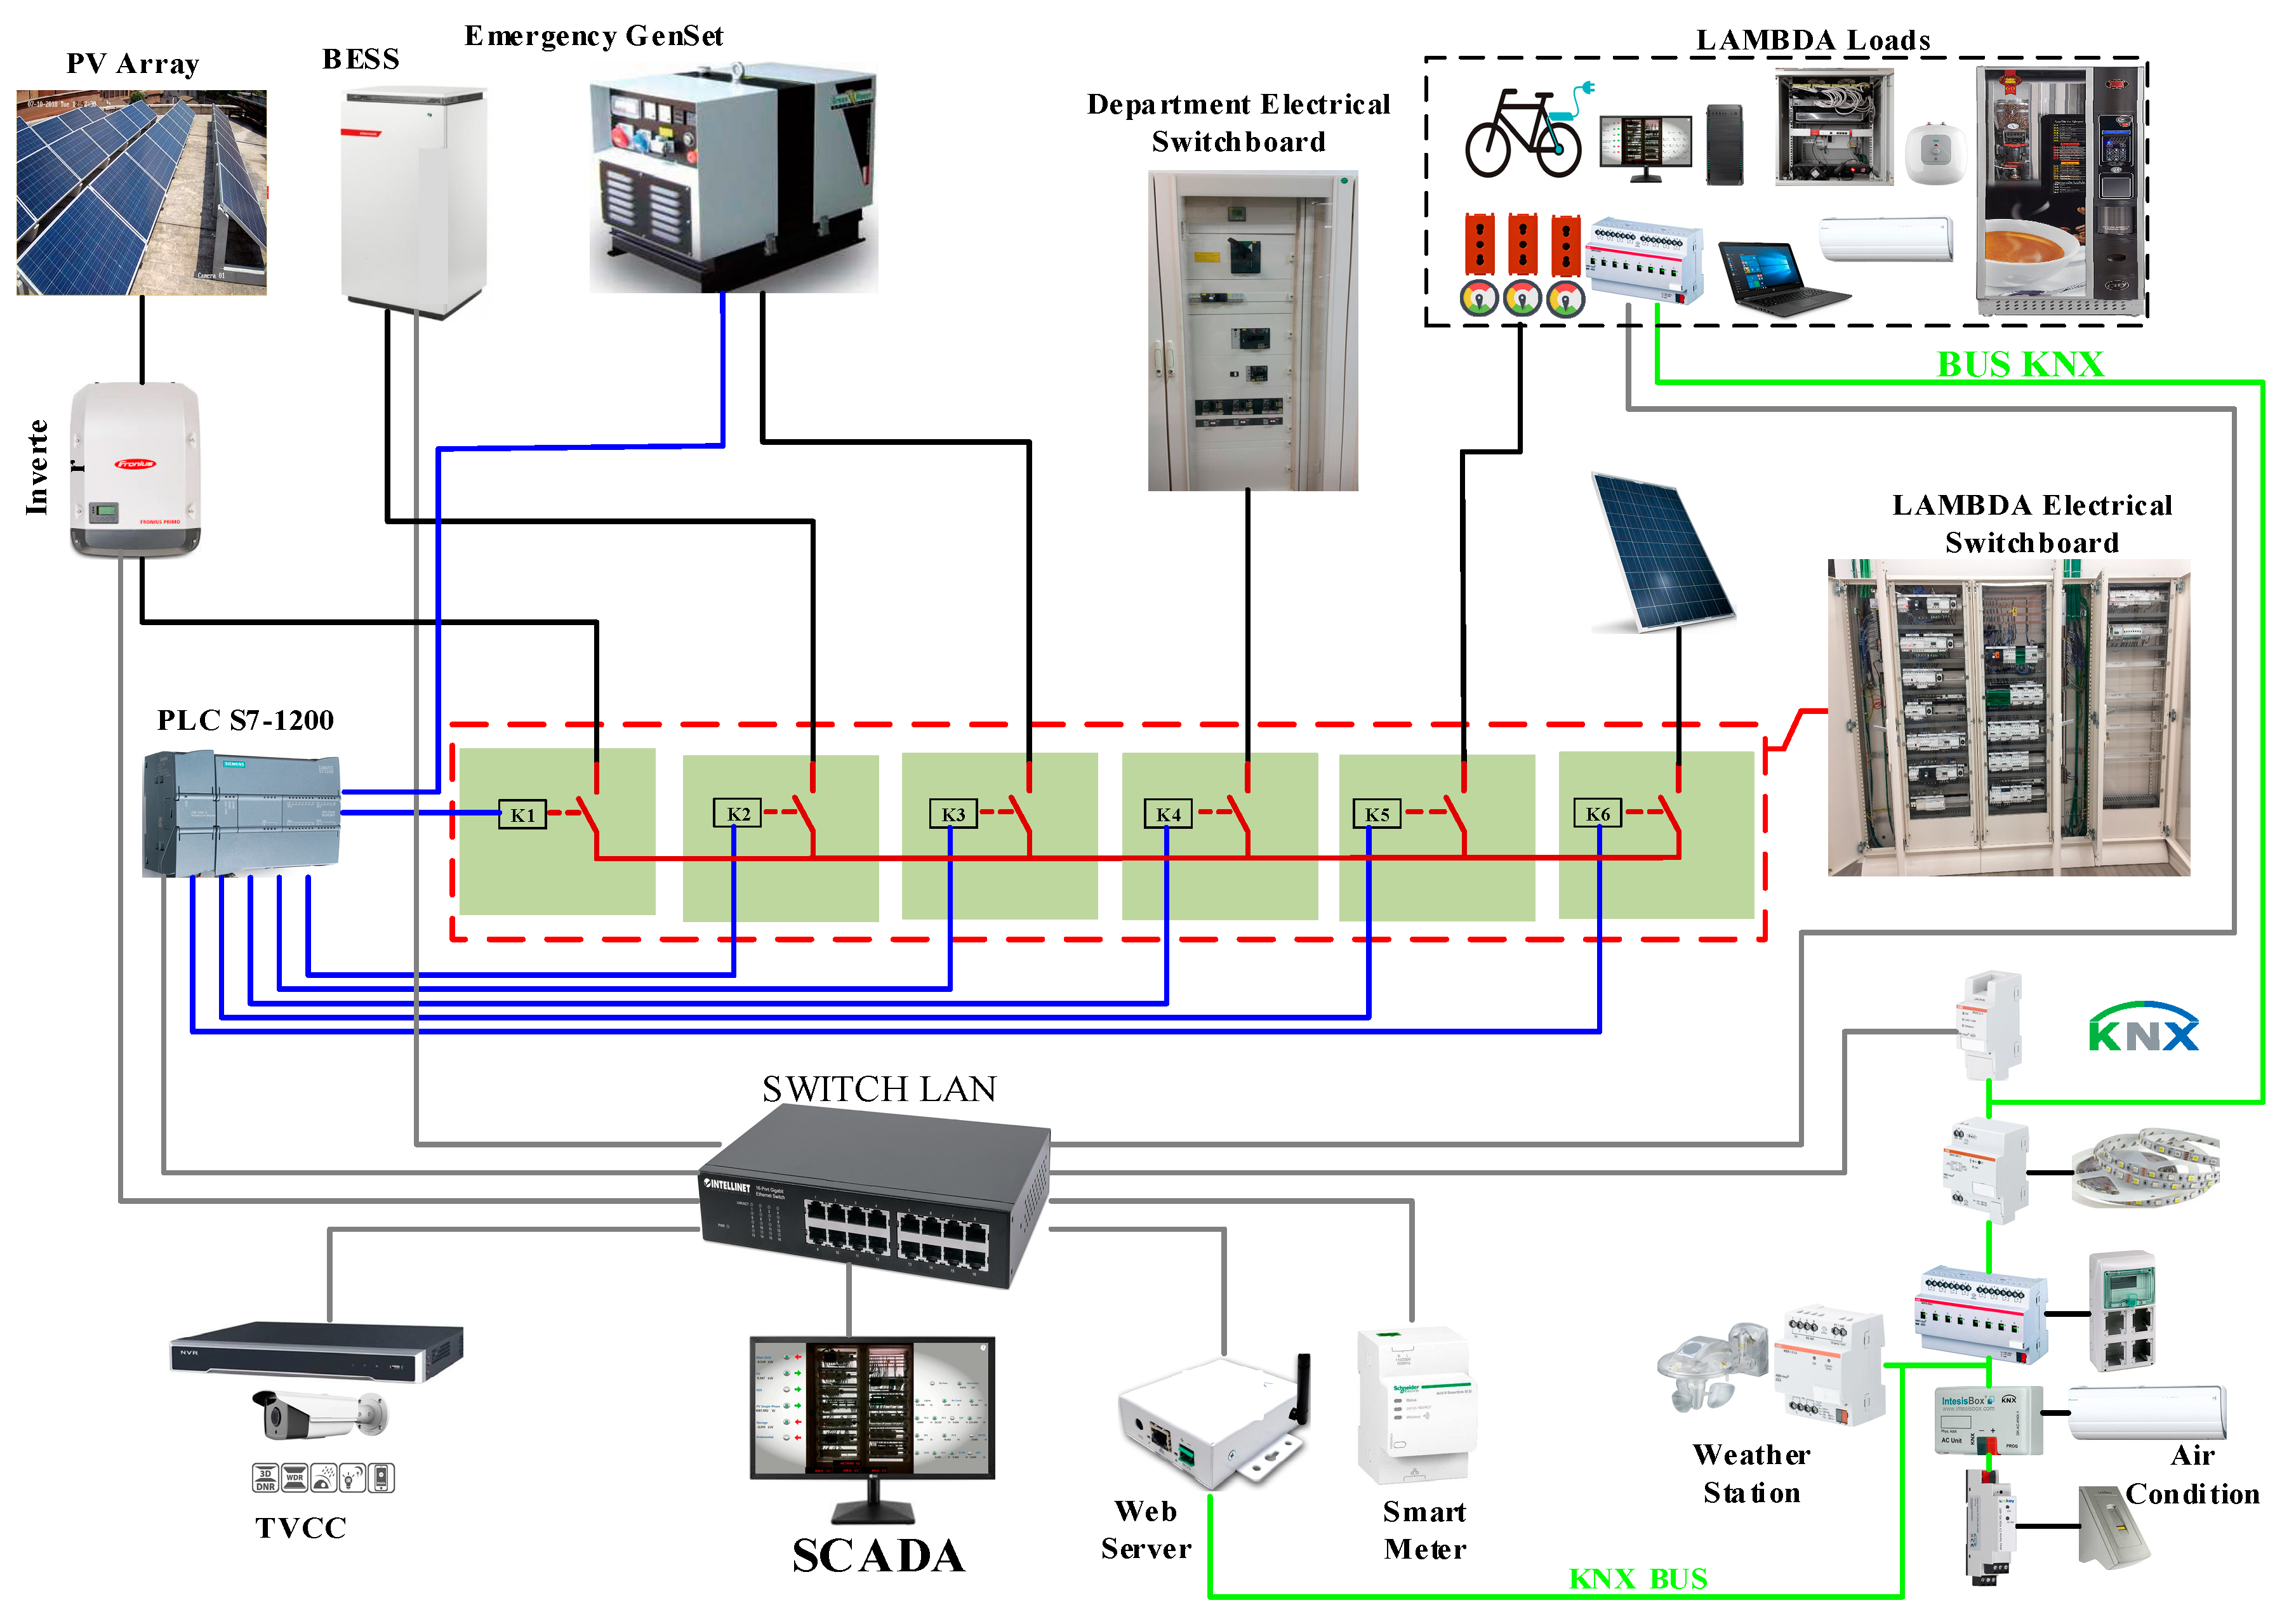
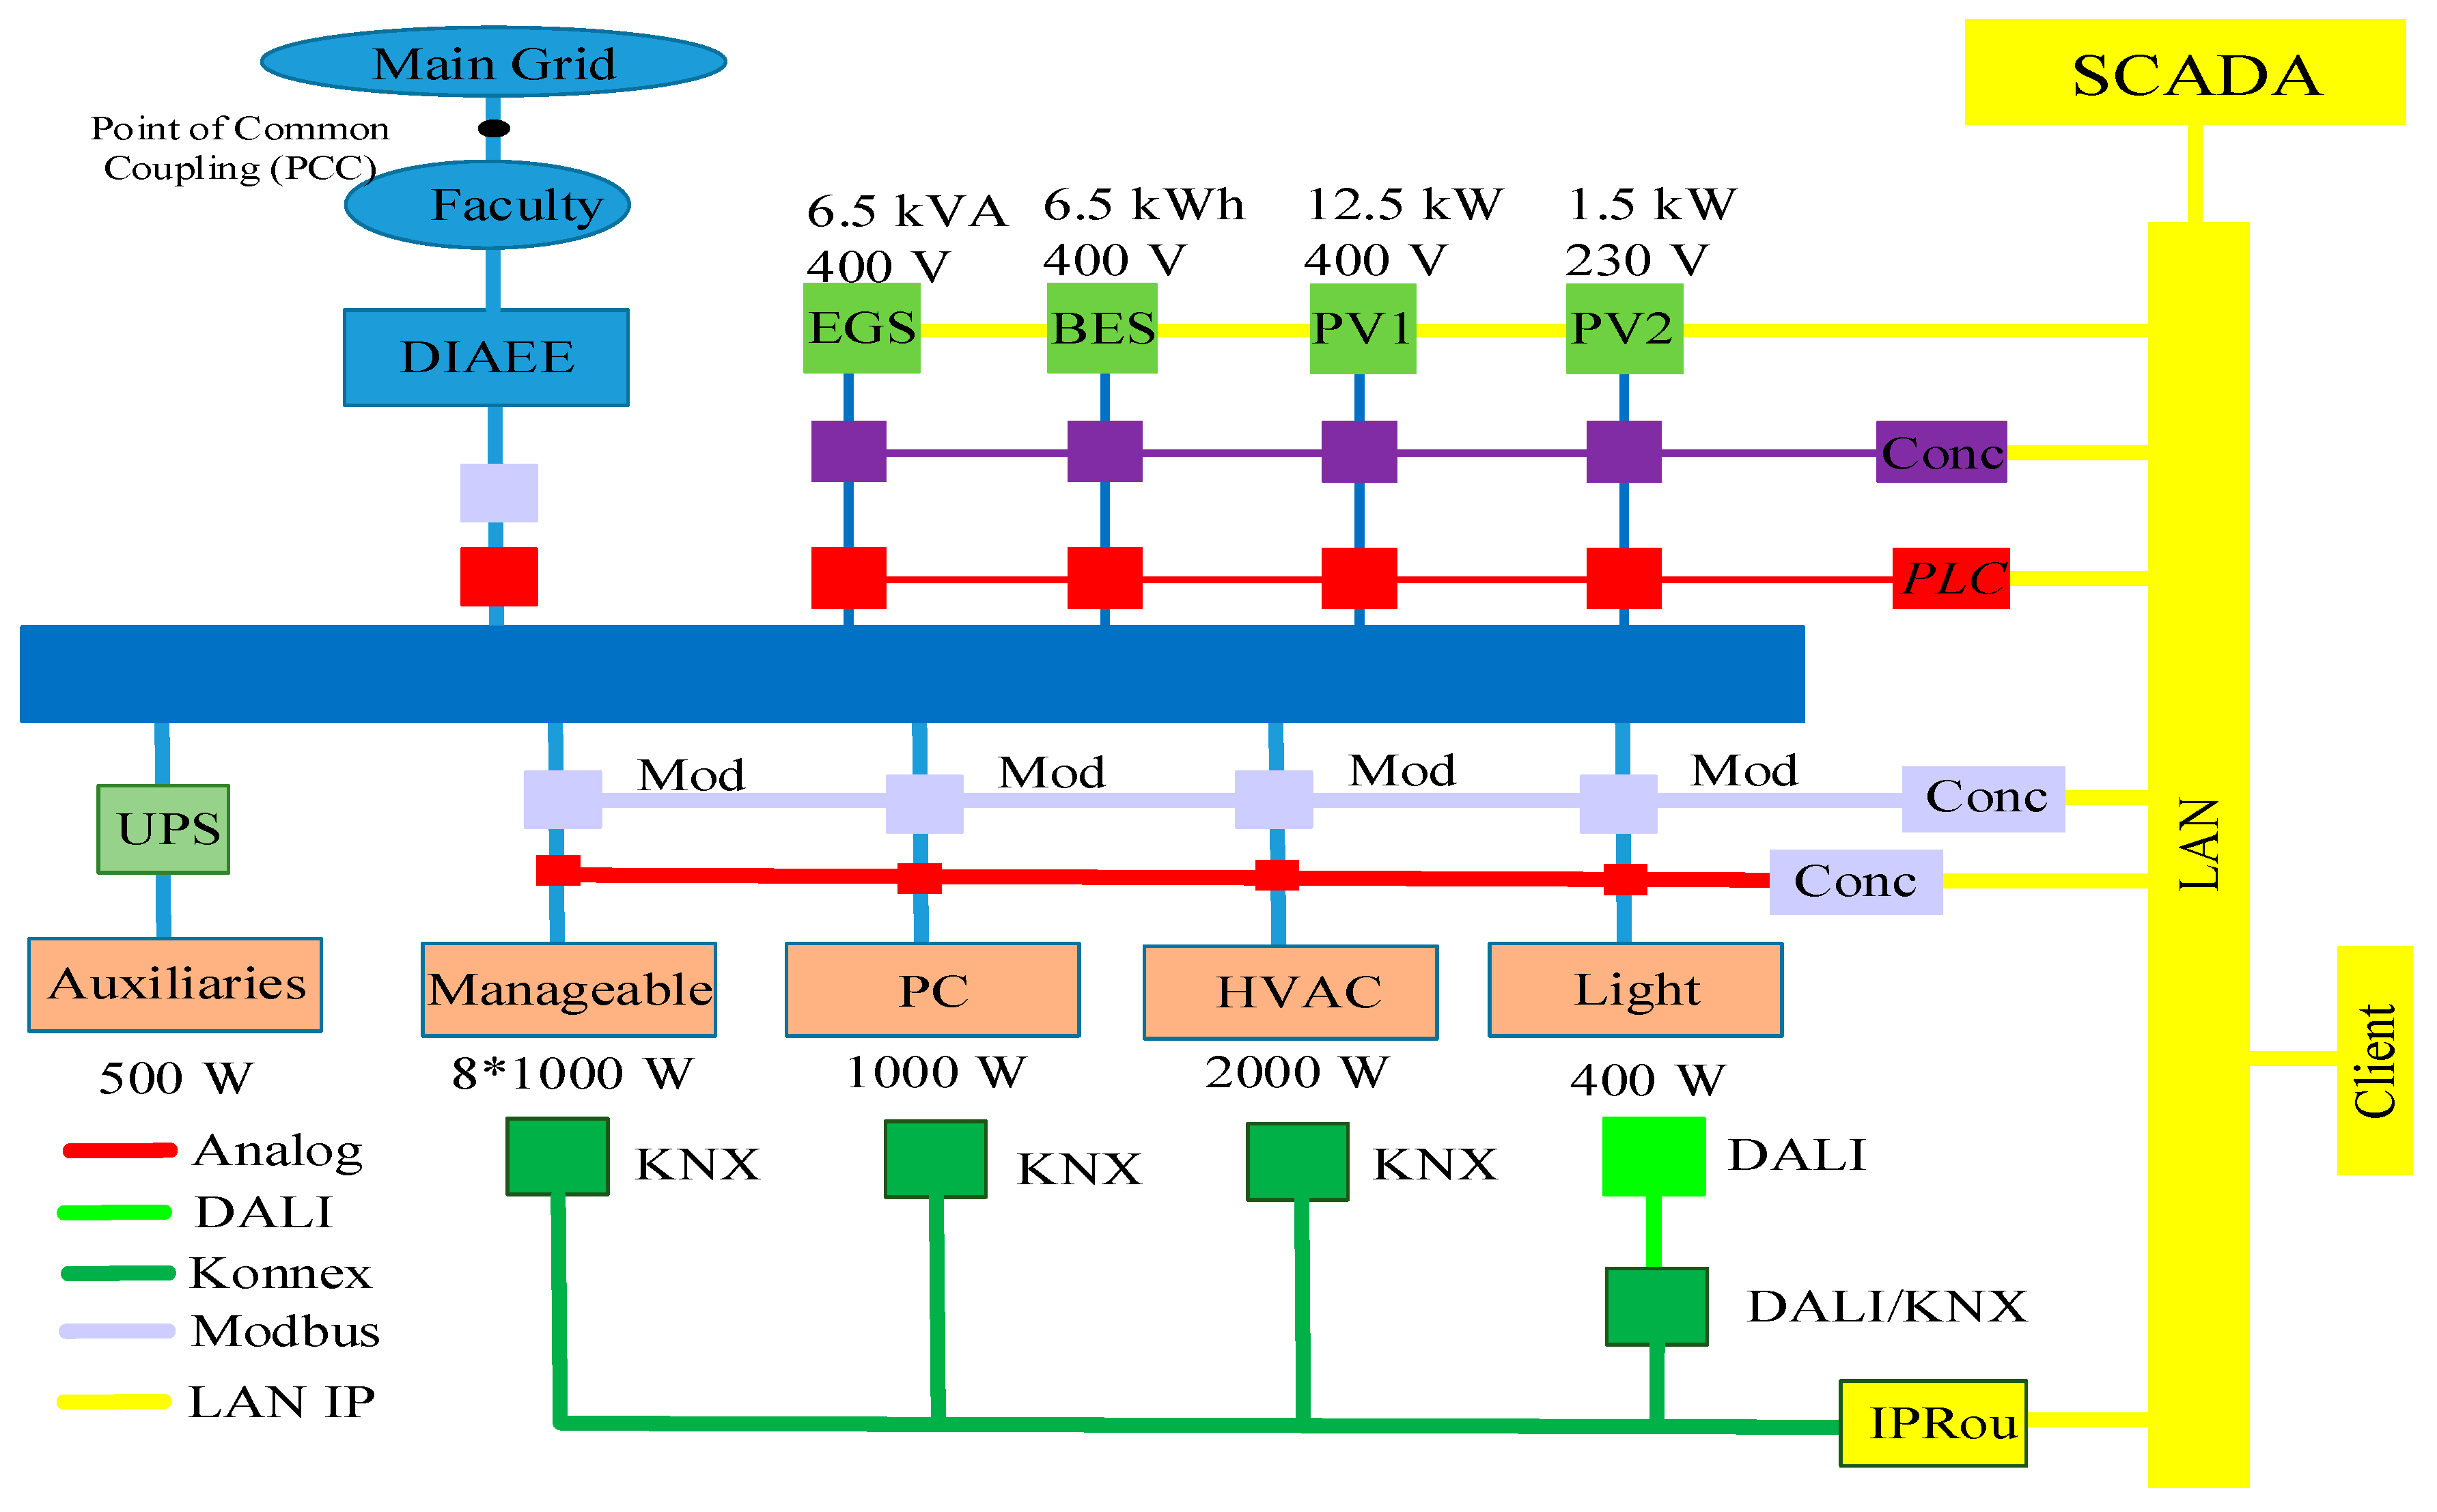
In
Figure 3, the LAMBDA communication scheme is shown. Two protocols are fundamentals in order to make all the devices communicate, i.e., Modbus and KNX. In other words, two gateways relate these two protocols with the LAN network. This allows every node to possess an IP address in order to easily and remotely manage the laboratory. For the same reason, a smart control strategy may be implemented to automate the room accurately. A UPS is used to assure the continuity of supply to the main lab components.
The SCADA network was based on a master station unit, RTU, and data link to send and receive inputs and outputs. The process was as follows: The RTUs withdraw all the necessary data by the sensors; then, this information is sent through the data link to the main workstation in order to be processed; finally, the needed operations are performed. In this way, the LAMBDA LAB system directly adjusts itself on the basis of what the server processed and established as the optimal configuration. The physical means by which the communication function, such as telephone, fiber optics, radio communication, and especially the PLC S7–1200 Siemens model, is present in the lab is a crucial part of the SCADA network. With the proper combination of the two, it was feasible to control the grid and island mode MG behavior to manage the system efficiency.
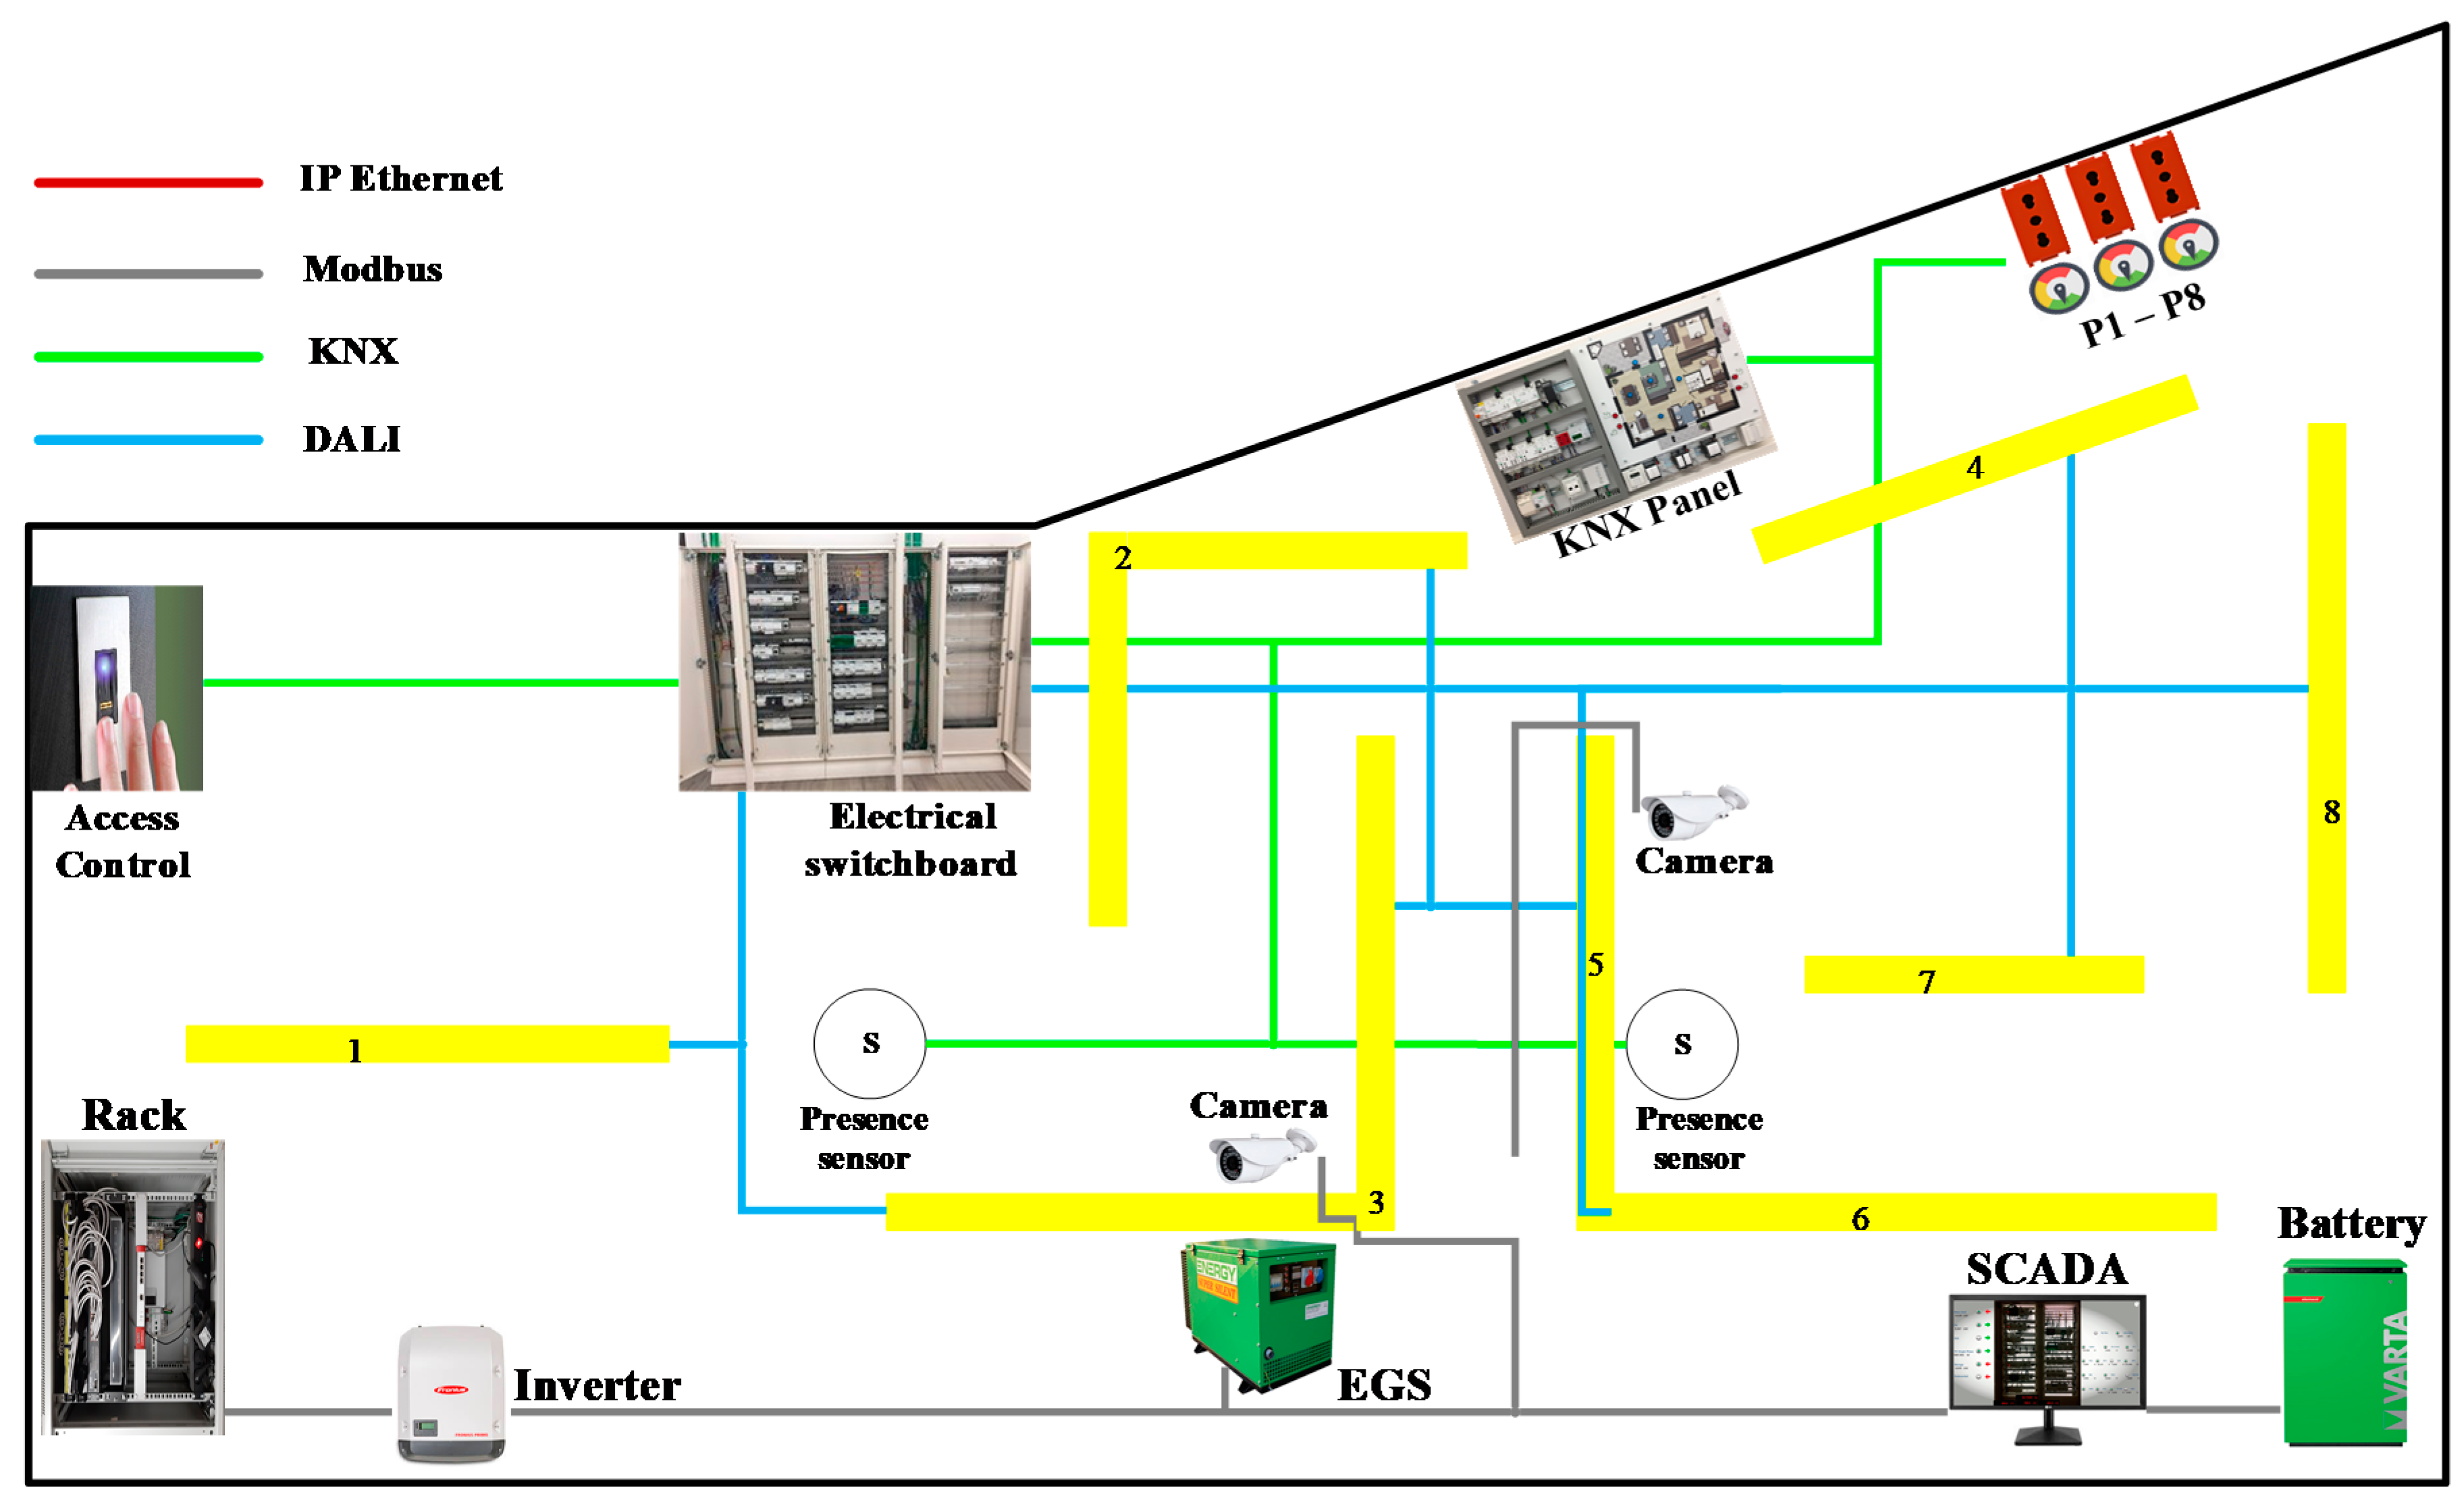
Figure 4 depicts the lab planimetry along with the physical disposition of the essential components that made the lab work properly. The core of the whole connection was the rack Lan (violet, on the left), which dispatched all the Ethernet cables that got into the relevant components, i.e., giving them a proper and unique IP address. Connected to this are the 3ph inverter of the PV system (located in the upper part of the building), BESS (blue box, on the right), security cameras, EGS (located by the exterior wall; brown, on the bottom center), KNX and Modbus gateways placed in the local switchboard, and the PC workstation where the SCADA software was installed (on the desk by the BESS).
The LAMBDA lab included different types of loads that had to be supplied based on the considered strategy. We categorized the load into the three main groups, namely critical, essential, and normal loads, according to necessity in the system operator’s point of view. The critical loads had to be supplied in any case, while essential and normal loads were supplied in case of existing extra power based on the battery energy management strategy. This strategy follows generated power by the PV array and consumes power by loads. If the PV power is more than the load power in the first step the essential loads will be turned on. In the case of existing extra power the normal loads will be imported to the grid in the second step. Finally, in the third step, extra power was transmitted to the BESS. However, if the load power was more than the PV generation then both the essential and normal loads had to be turned off and, in the case of insufficient power provided by the BESS, the critical load was satisfied by imported power from the main grid.
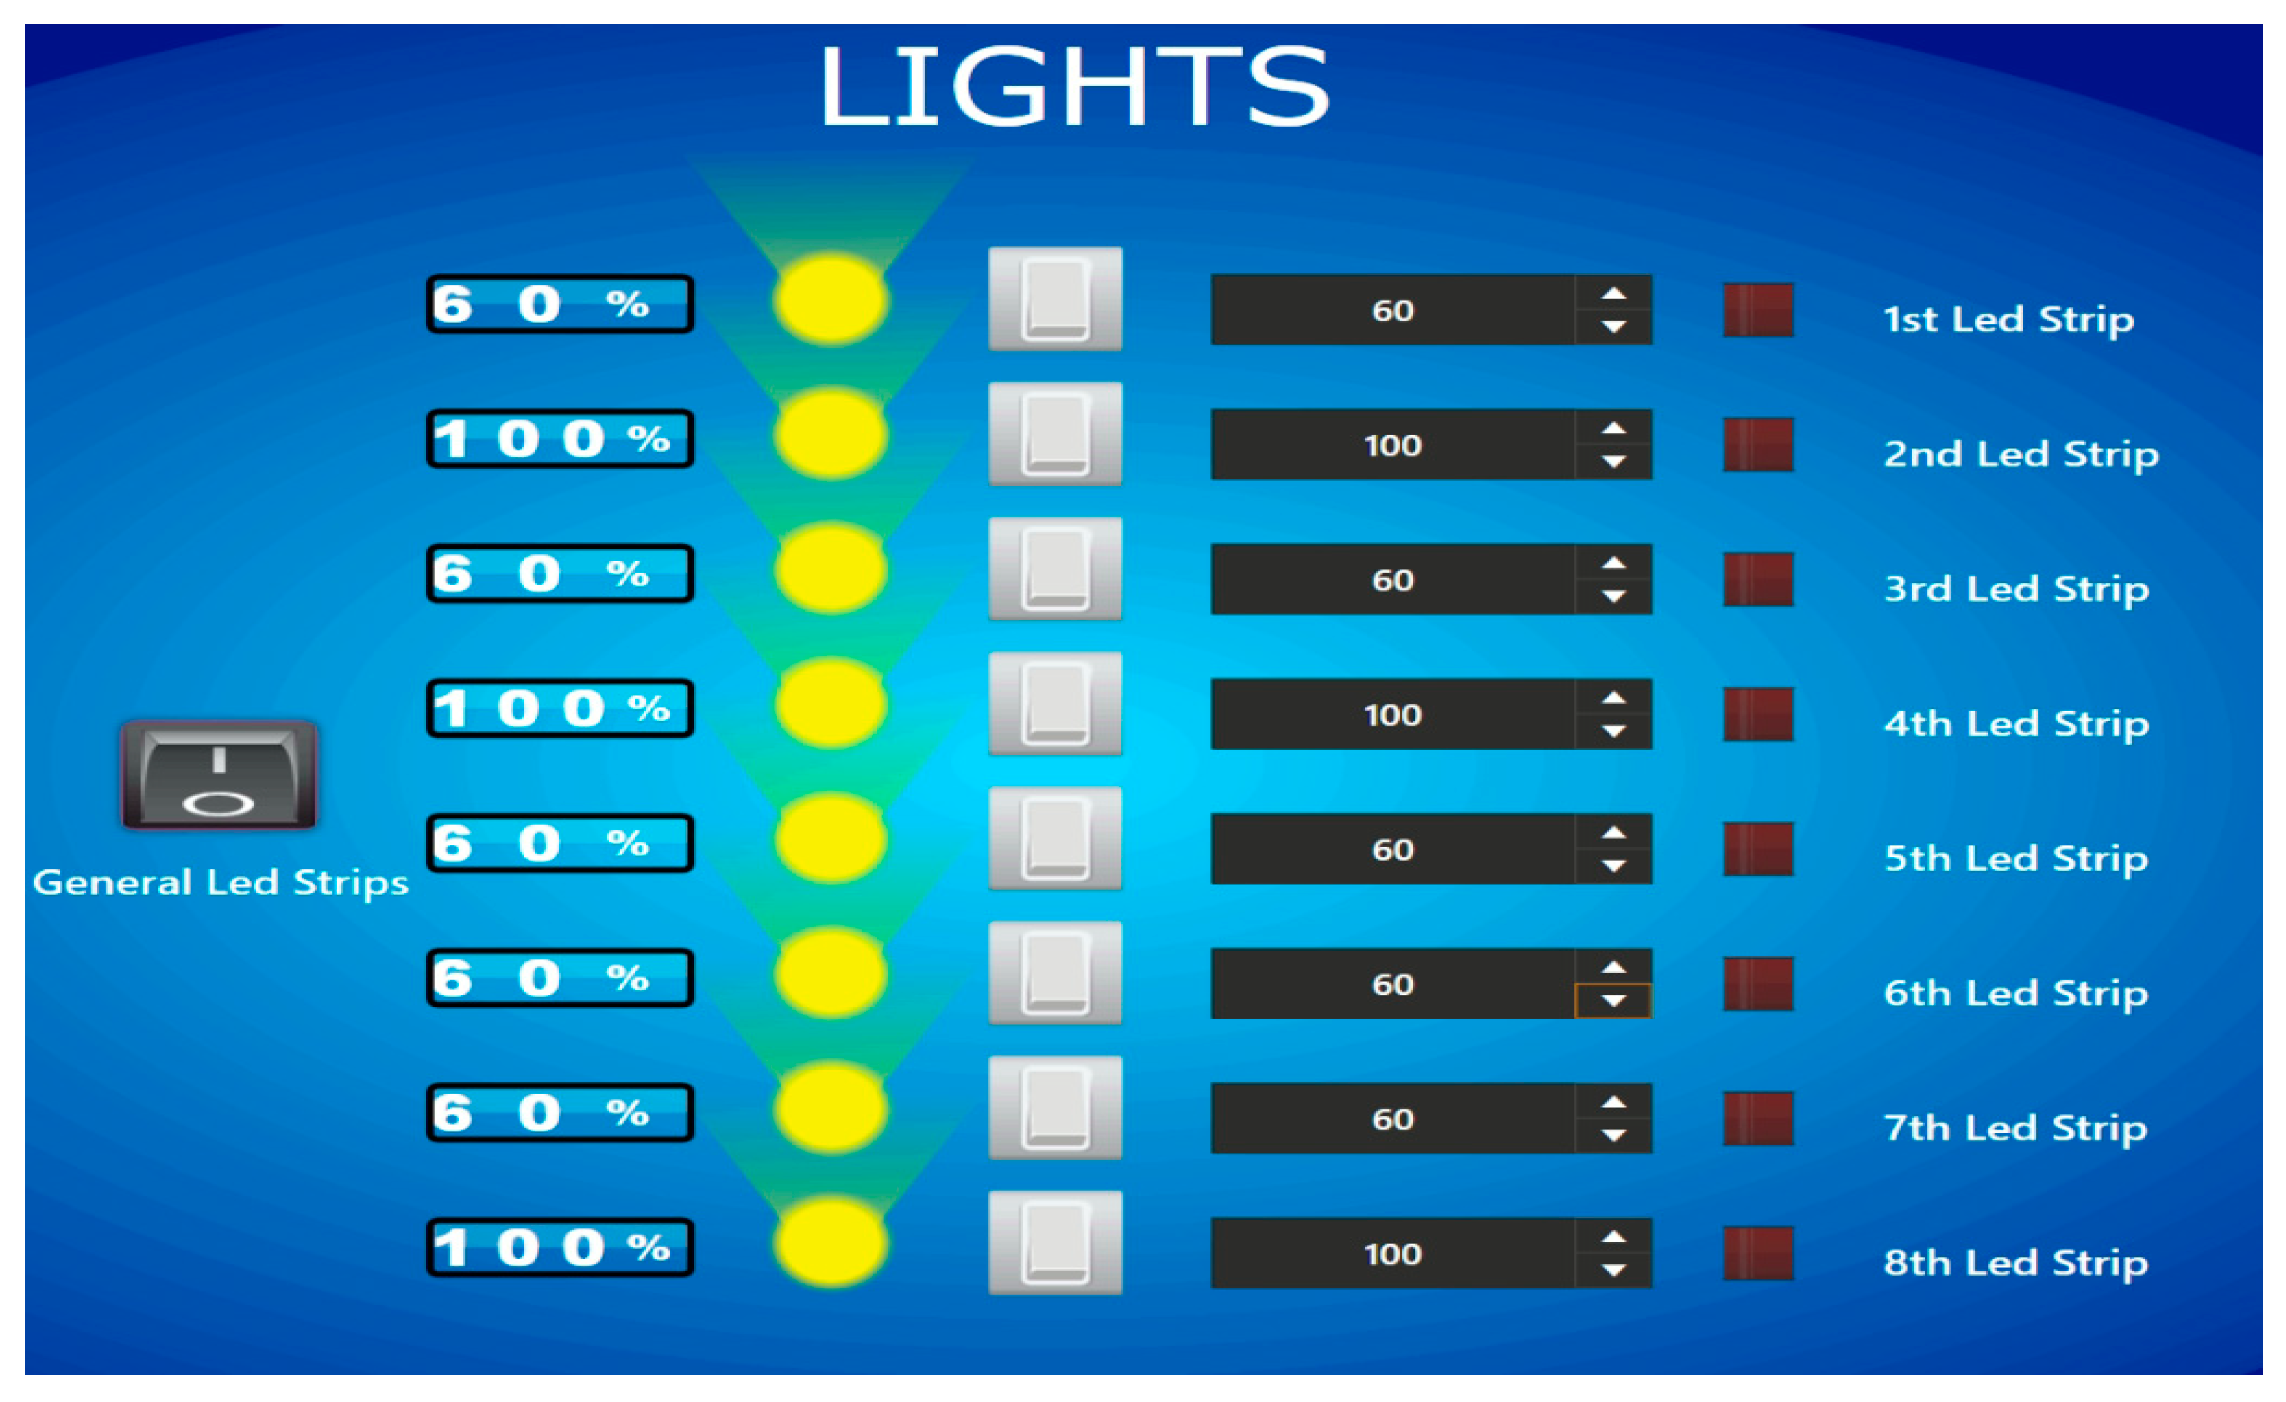
Table 1 provides information regarding the rated power of different load categories and their subsets. According to
Figure 4, the LAMBDA LAB is divided into eight different lighting zones. A required power of 40% was considered the essential load and the rest of the lighting system was classified as the normal load, which will be supplied if the system has extra power. The zone classification was based on the importance of the places. In this regard, the lighting of zones 2, 4, and 8, which are the main, had the highest value, 100%. This issue is clearly shown in
Figure 5.
Modbus is a communication protocol responsible for communication with energy meters and the auxiliary’s contractors located in the switchboard. KNX is another communication protocol related to the distributed devices present in the lab, such as fingerprint door, A/C, commanded plugs, and presence sensors. Finally, there is the last gateway between KNX and other communication protocol, called digital addressable lighting interface (DALI), which is responsible for the regulation and dimming of the lighting system.
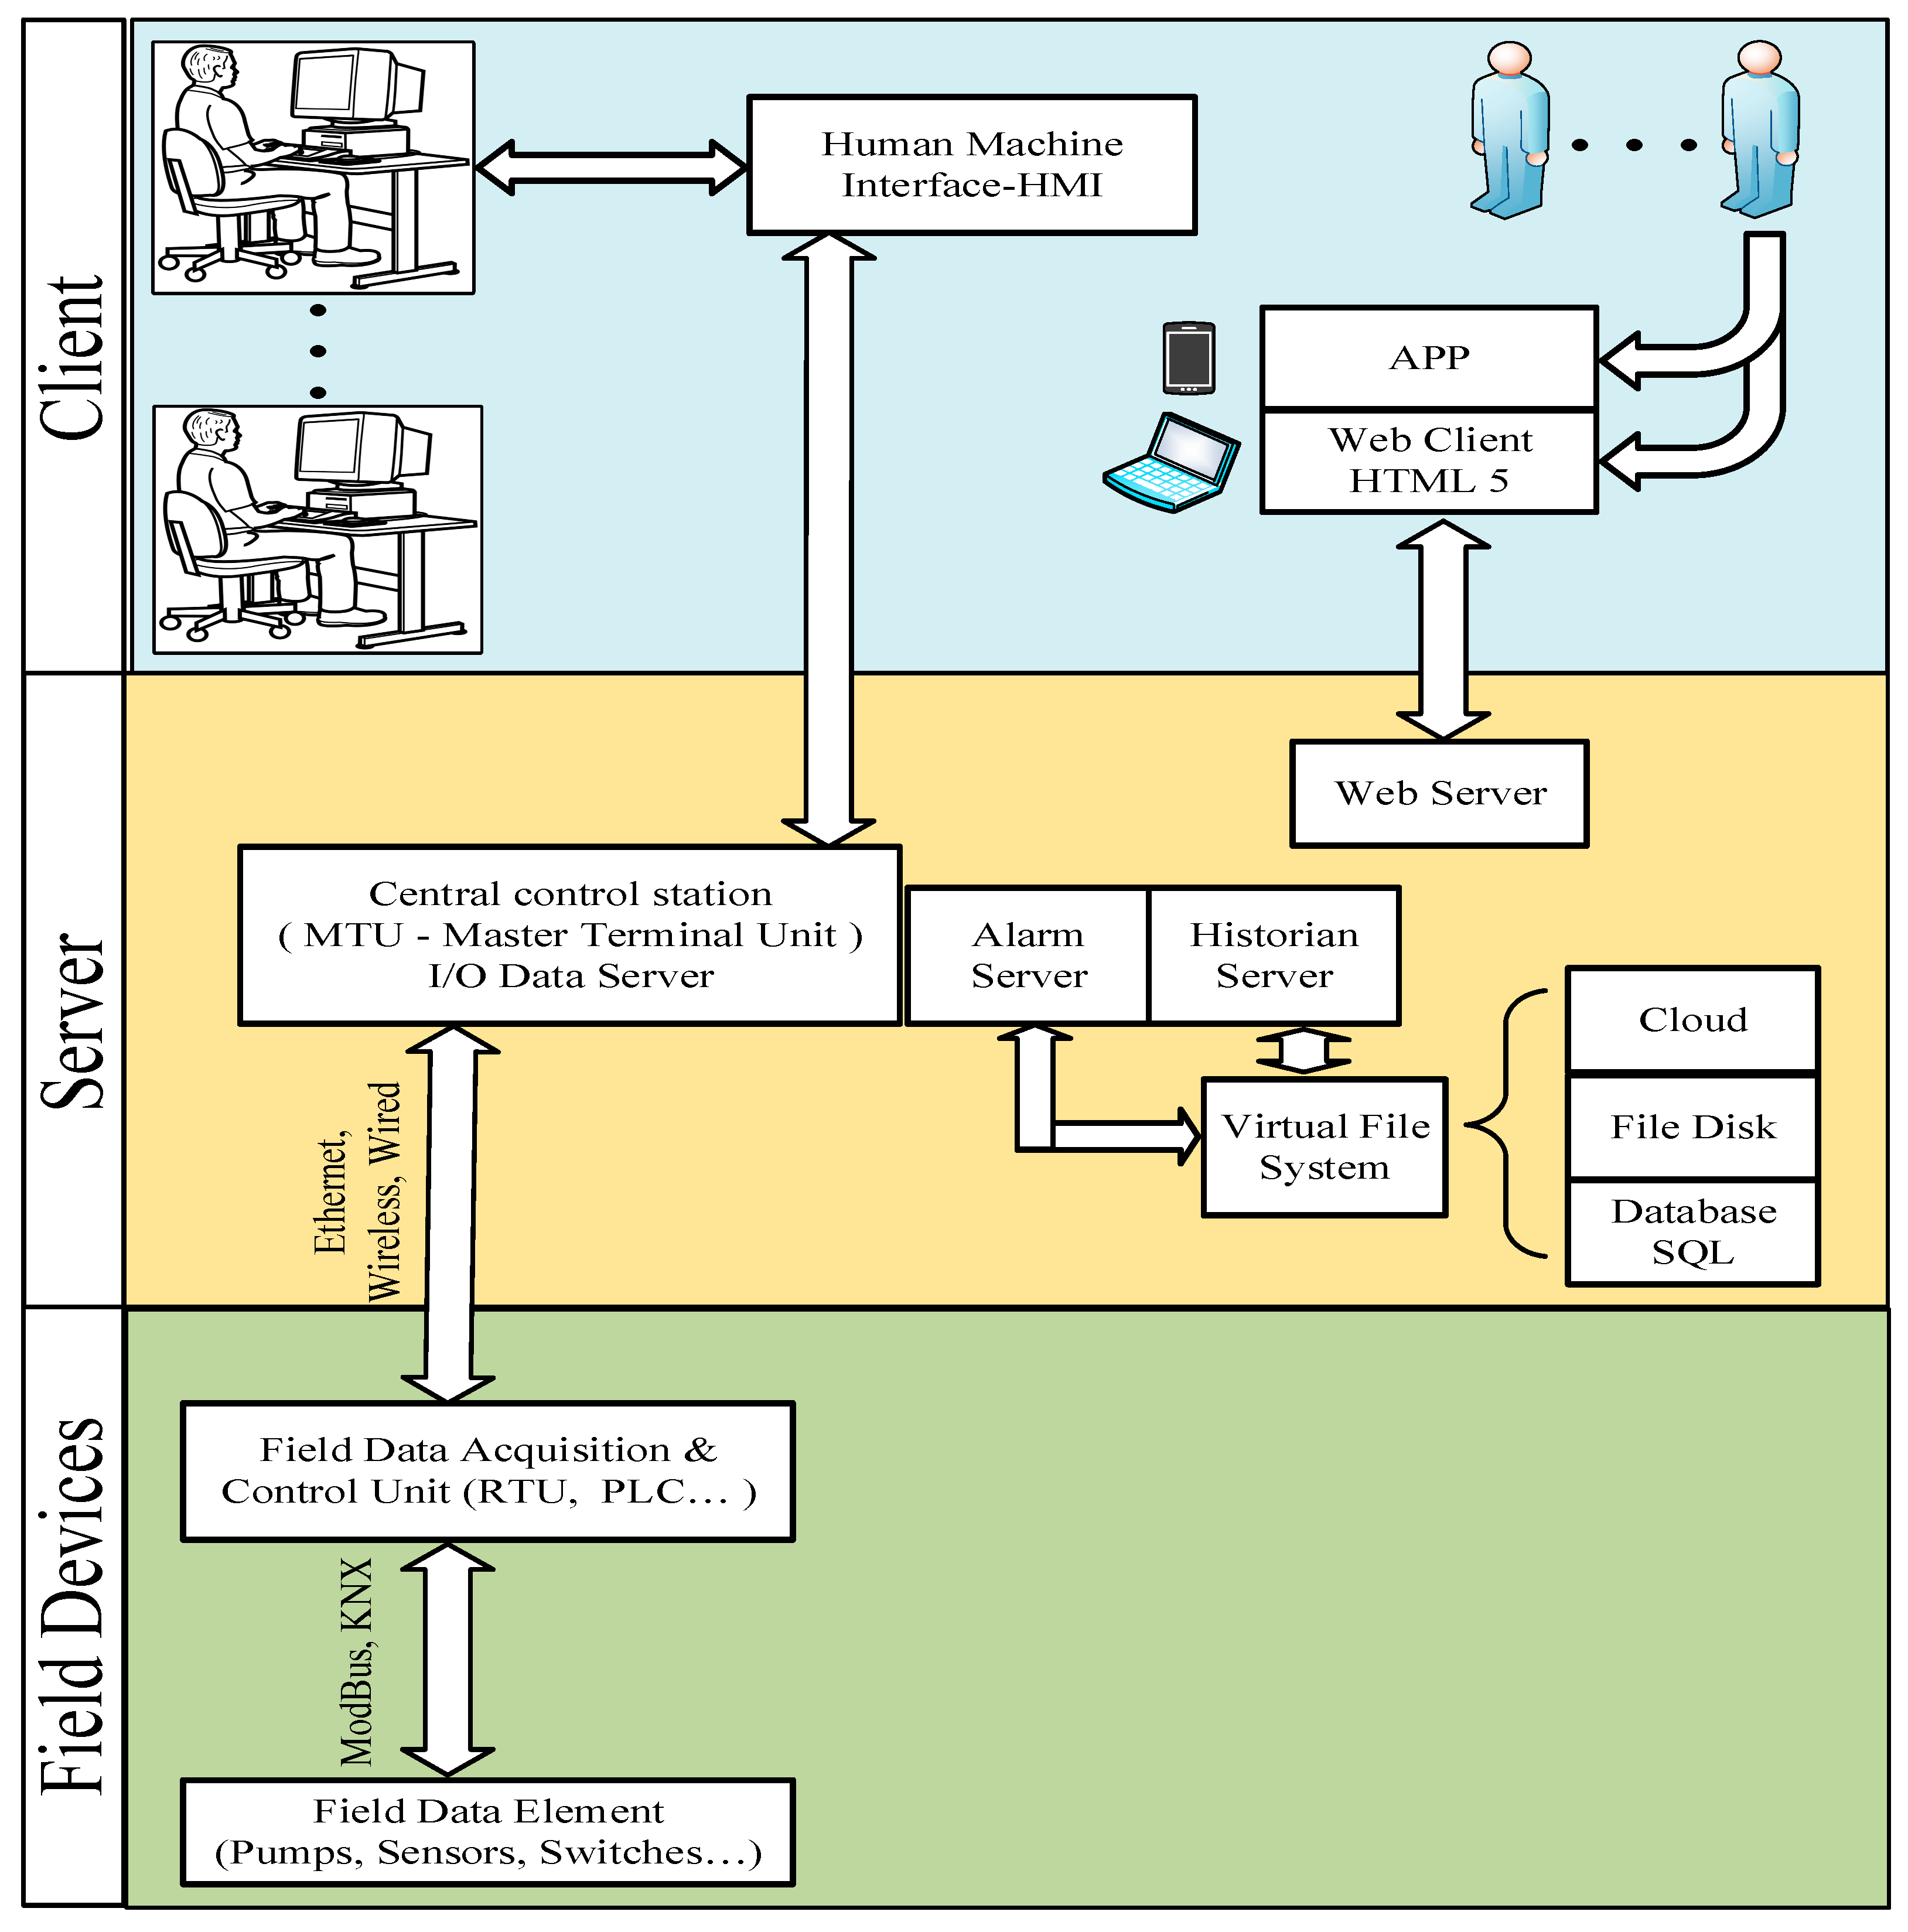
As shown in
Figure 6, a SCADA system is usually presented through a client–server architecture. The core of the client side is the HMI, which acts as an interface between one or more operators and the server. The client side is responsible for the visualization and supervision of the process. Furthermore, remote client visualization is possible via the internet through smartphones, tablets, and notebooks located far from the geographical point of view. This is possible thanks to a part of the server called webserver. Therefore, the server is divided into the central control station, or master terminal unit (MTU) which is the core of the server and processes and collects all the information derived from slave units or field devices, the branches, which are the alarm server and manage the alarms and notifications, the historian server, which is a logic module responsible for the archaization and data logging, and the webserver for the remote connections. The server is supported by the virtual file system, which allocates the recorded data into three possible manners: cloud, file disk, or database. Finally, at the bottom level, there are field devices. The field data acquisition unit or slave unit is an interface between the server and the field data element, such as sensors and switches. This unit is composed of PLC or RTU, which are the interface between the sensors and the actuators. The communication between the slave control unit and the field data element is carried out by communication protocols such as Modbus and KNX.
4. SCADA System for CEMS in LAMBDA LAB
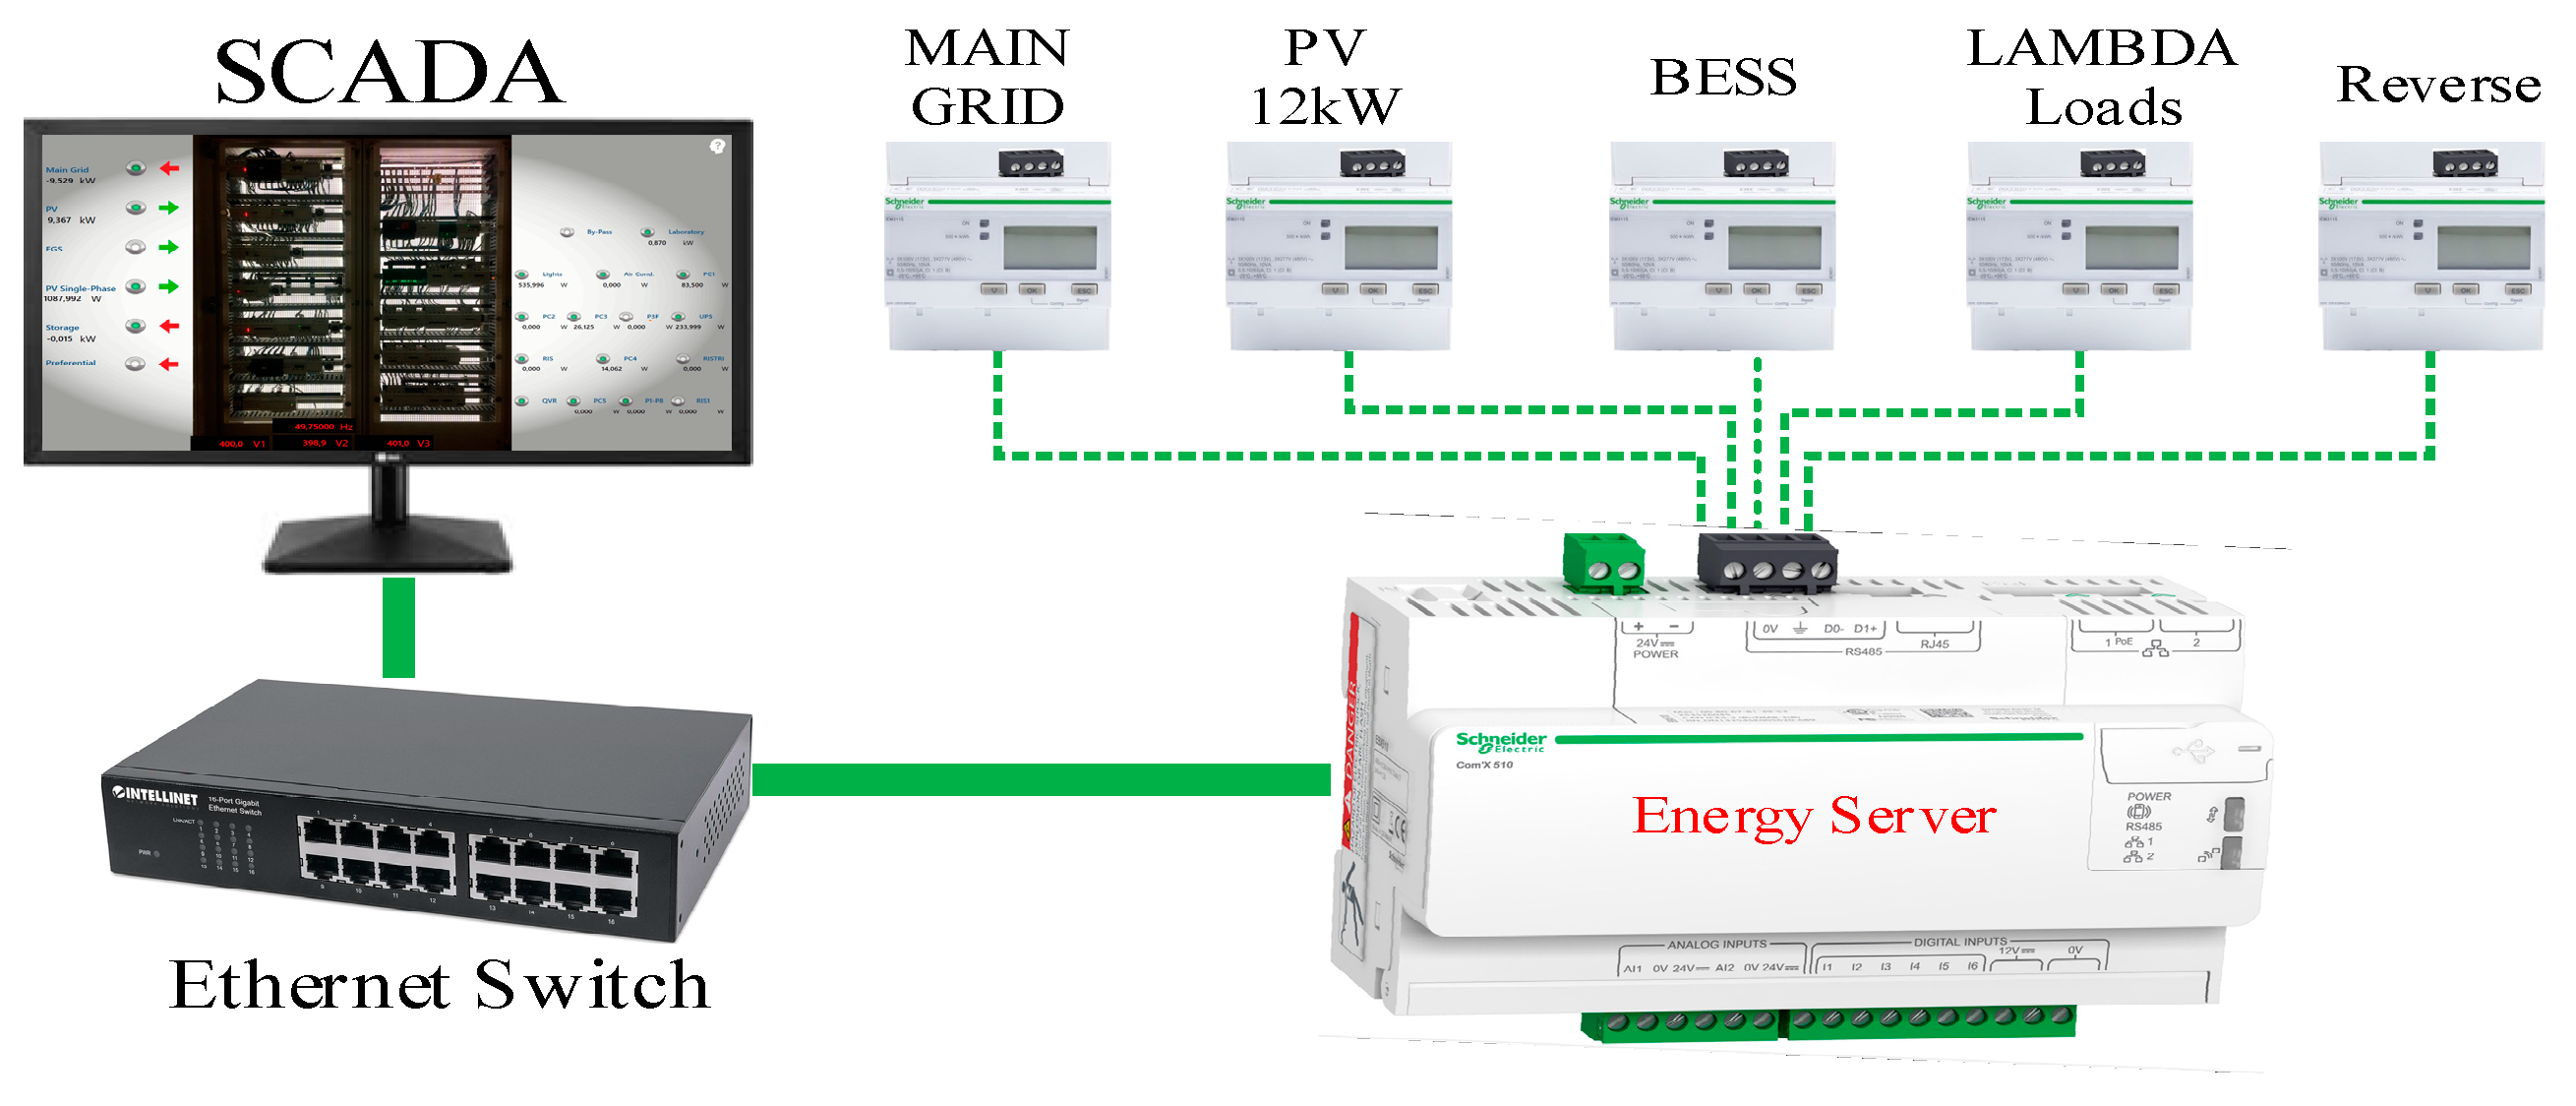
The SCADA system in the LAMBDA MG LAB communicated with the CEMS through both the Com’X 510 energy server and the BESS Element’s web application, directly. Com’X 510 is a compact plug and play gateway and data logger, and collects and stores consumption of water, air, gas, electricity, steam, and environmental parameters such as temperature, humidity, and CO
2 levels in a building. It provided access to reports such as onboard device and circuit summary pages, as well as on-board data logging. Data could be securely accessed in real-time or transmitted as a report to an Internet database server. As in
Figure 7, the Com’X 510 energy server receives data from five energy meters through the Modbus protocol, main grid, PV system, BESS, reverse and load.
As shown in
Figure 8, the data are ready to be processed once it is received by the server and displayed as web pages through energy management services to support the optimization of energy performance and cost management. Com’X provides device views of real-time data and trends along with historical data log trends, such as voltage, current, active power, power factor, breaker status, exchange energy, and frequency. It is even possible to export each of the previously described measurements in comma-separated values. Moreover, the energy storage is a three phase BESS with an integrated inverter. It uses lithium-ion cell modules with a current sensor, which acts as an instrument to measure the current draw or feed into the public grid. It was installed directly behind the electricity meter inside the fuse box for measuring the current flow through the house connection line. Furthermore, a sensor unit mounted on the current sensor transmitted the measurement result to the energy storage system, and it was possible to integrate both programmable relays for the load control and a linear power control resistor. The system was fitted with an integrated web server which, through a network connection, allowed settings to be locally managed and the data monitored. Furthermore, VARTA also offers a remote monitoring website. These web services provided a view (charts and graphs) of real-time data and trends along with historical data log trends about battery SoC, energy stored, the energy transferred to the load, and the energy exchanged with the main grid. The SCADA system in the LAMBDA LAB communicated with both Com’X 510 and VARTA Element through the Ethernet connection via the rack LAN. It was possible to have the data collected from the two devices in order to analyze the results more accurately.
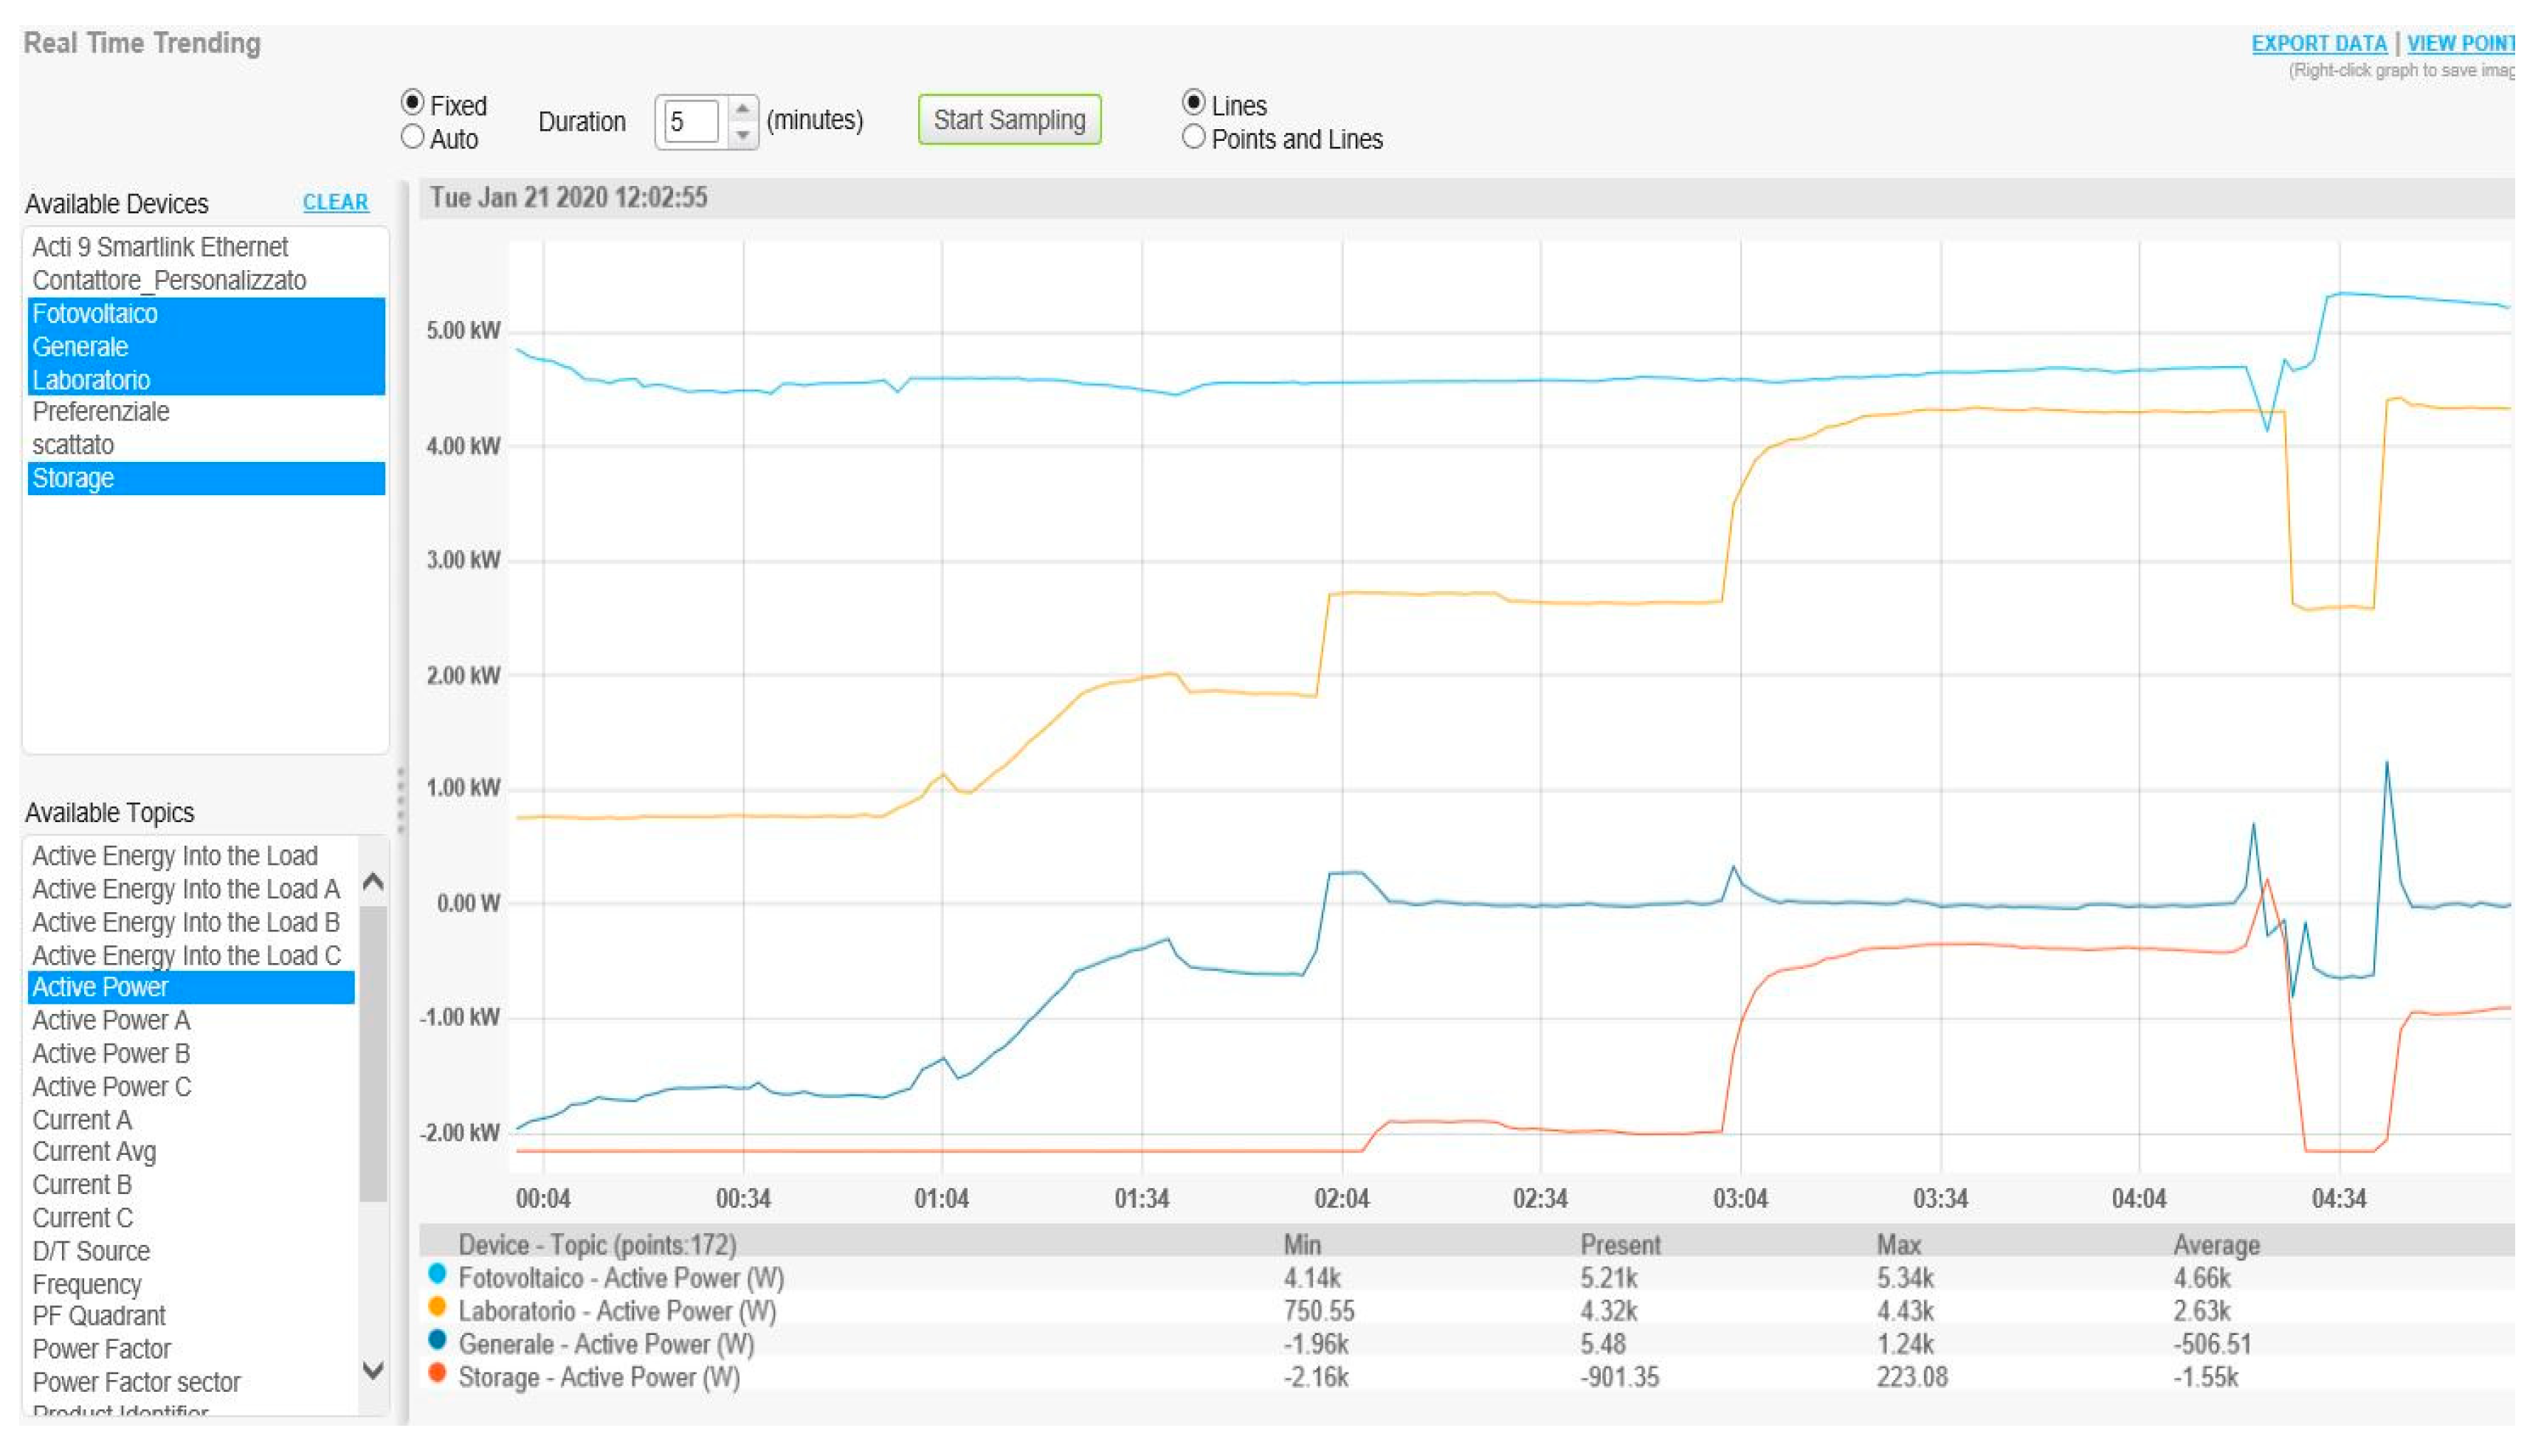
Figure 9 shows five minutes based on real data of the LAMBDA LAB, indicating that at the beginning the load consumption was about 750 W, which is related to critical loads, while the PV production was about 4.5 kW when the BESS was in charging mode with a rate around 2200 W. Consequently, the extra power had to supply essential and normal loads, but the system automatically applied a defined delay to ensure sufficient power in the upcoming periods. In this regard, even though we had extra power in the first minute, the system made sure that the power remained stable before adding essential and critical loads. By adding HVAC, the essential load was supplied from the second minute onwards, and, as a result, the amount of load rose to almost 2 kW, and the BESS remained in charging mode with the rate of 2200. Due to the extra power, the normal load had to be added to the system after a one-minute duration to ensure extra power can satisfy the normal loads in upcoming minutes. At the end of the second and third minutes, the normal load was added in two steps and the total power increased to almost 2.7 kW and 4.3 kW, respectively. The most outstanding point in this period was the 4:20 that the PV generation felt because of the environmental problem. The amount of load consumption was more than that of PV production. At this point, the BESS condition altered to discharging mode, while the normal load was eliminated, causing the battery to receive energy. Consequently, the PLC system rapidly eliminated the normal load to stop receiving energy from the main grid, and, after a period, the normal load was added to the system again. The overall trend of power exchanged with the grid was upward, which meant the power transmitted to the main grid decreased because of the added local loads.
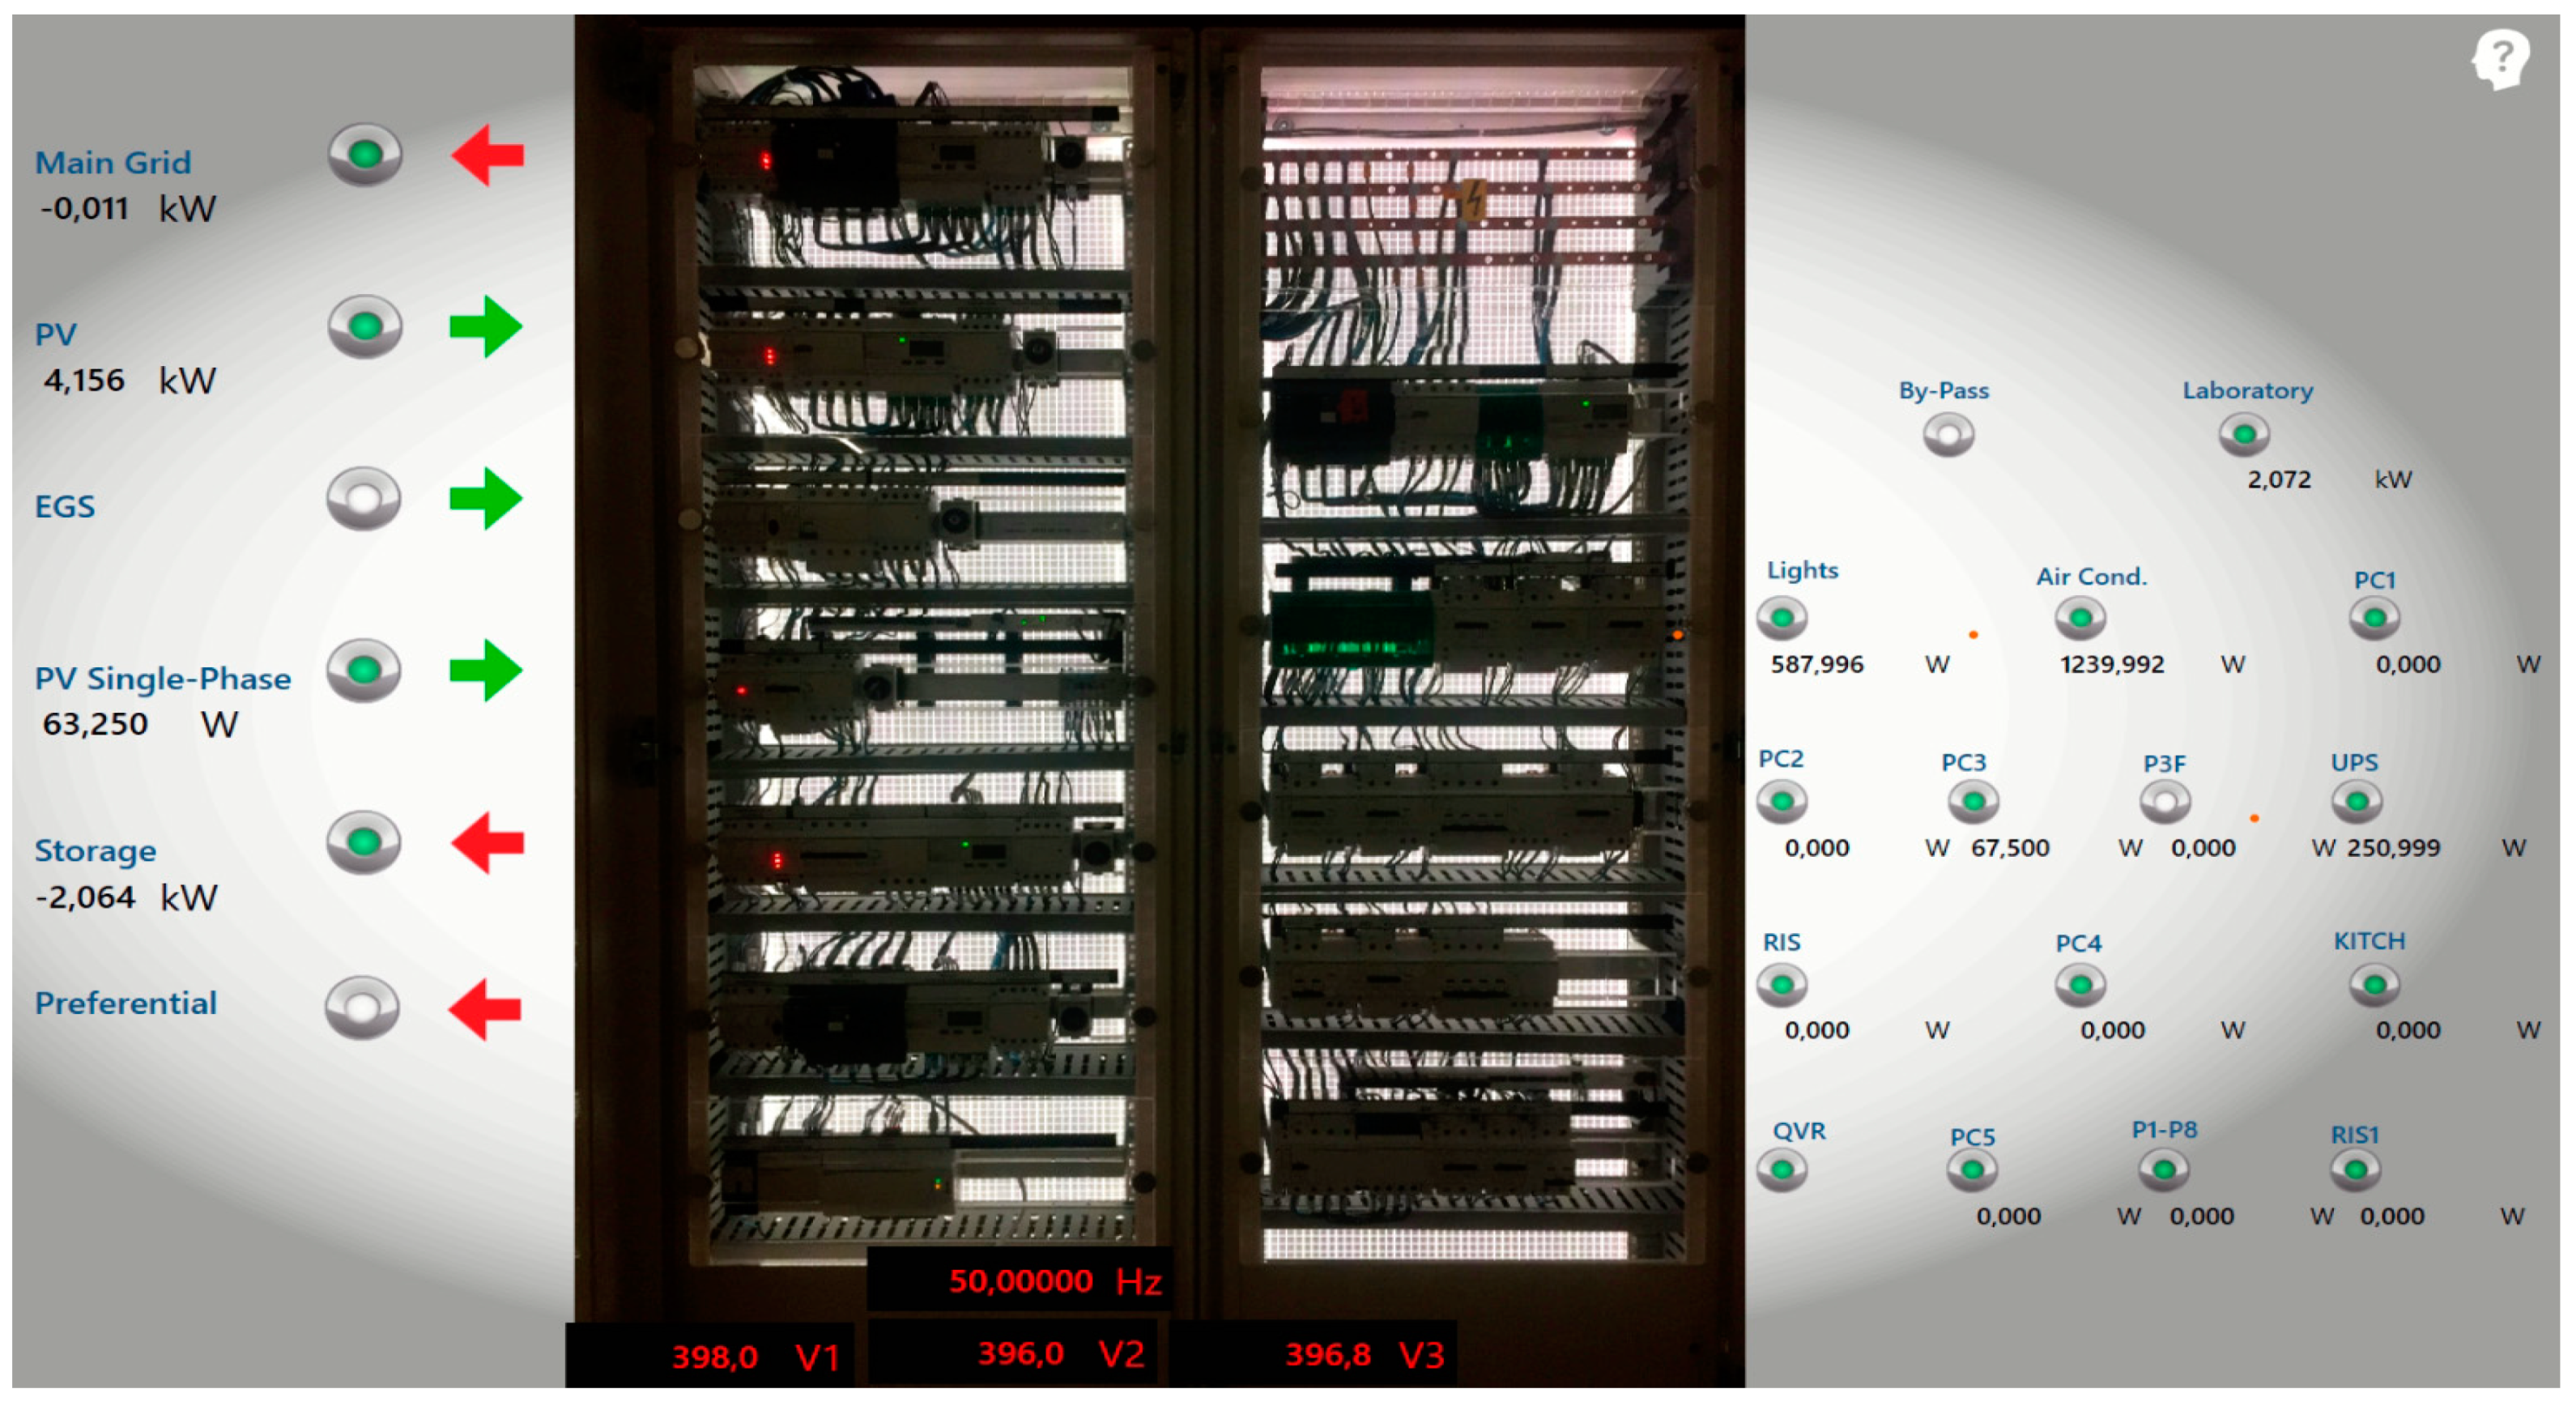
Figure 10 provides a screenshot of the SCADA system that reveals the power flow of the system in a moment. The PV production was almost 4.1 kW, and the BESS was charging with 2.064 kW. Consequently, the system automatically added the essential and normal loads to reach almost 2 kW to minimize the amount of energy that the system transmitted to the main grid. Meanwhile, the power transmitted to the main grid was about 11 W, which can be neglected.
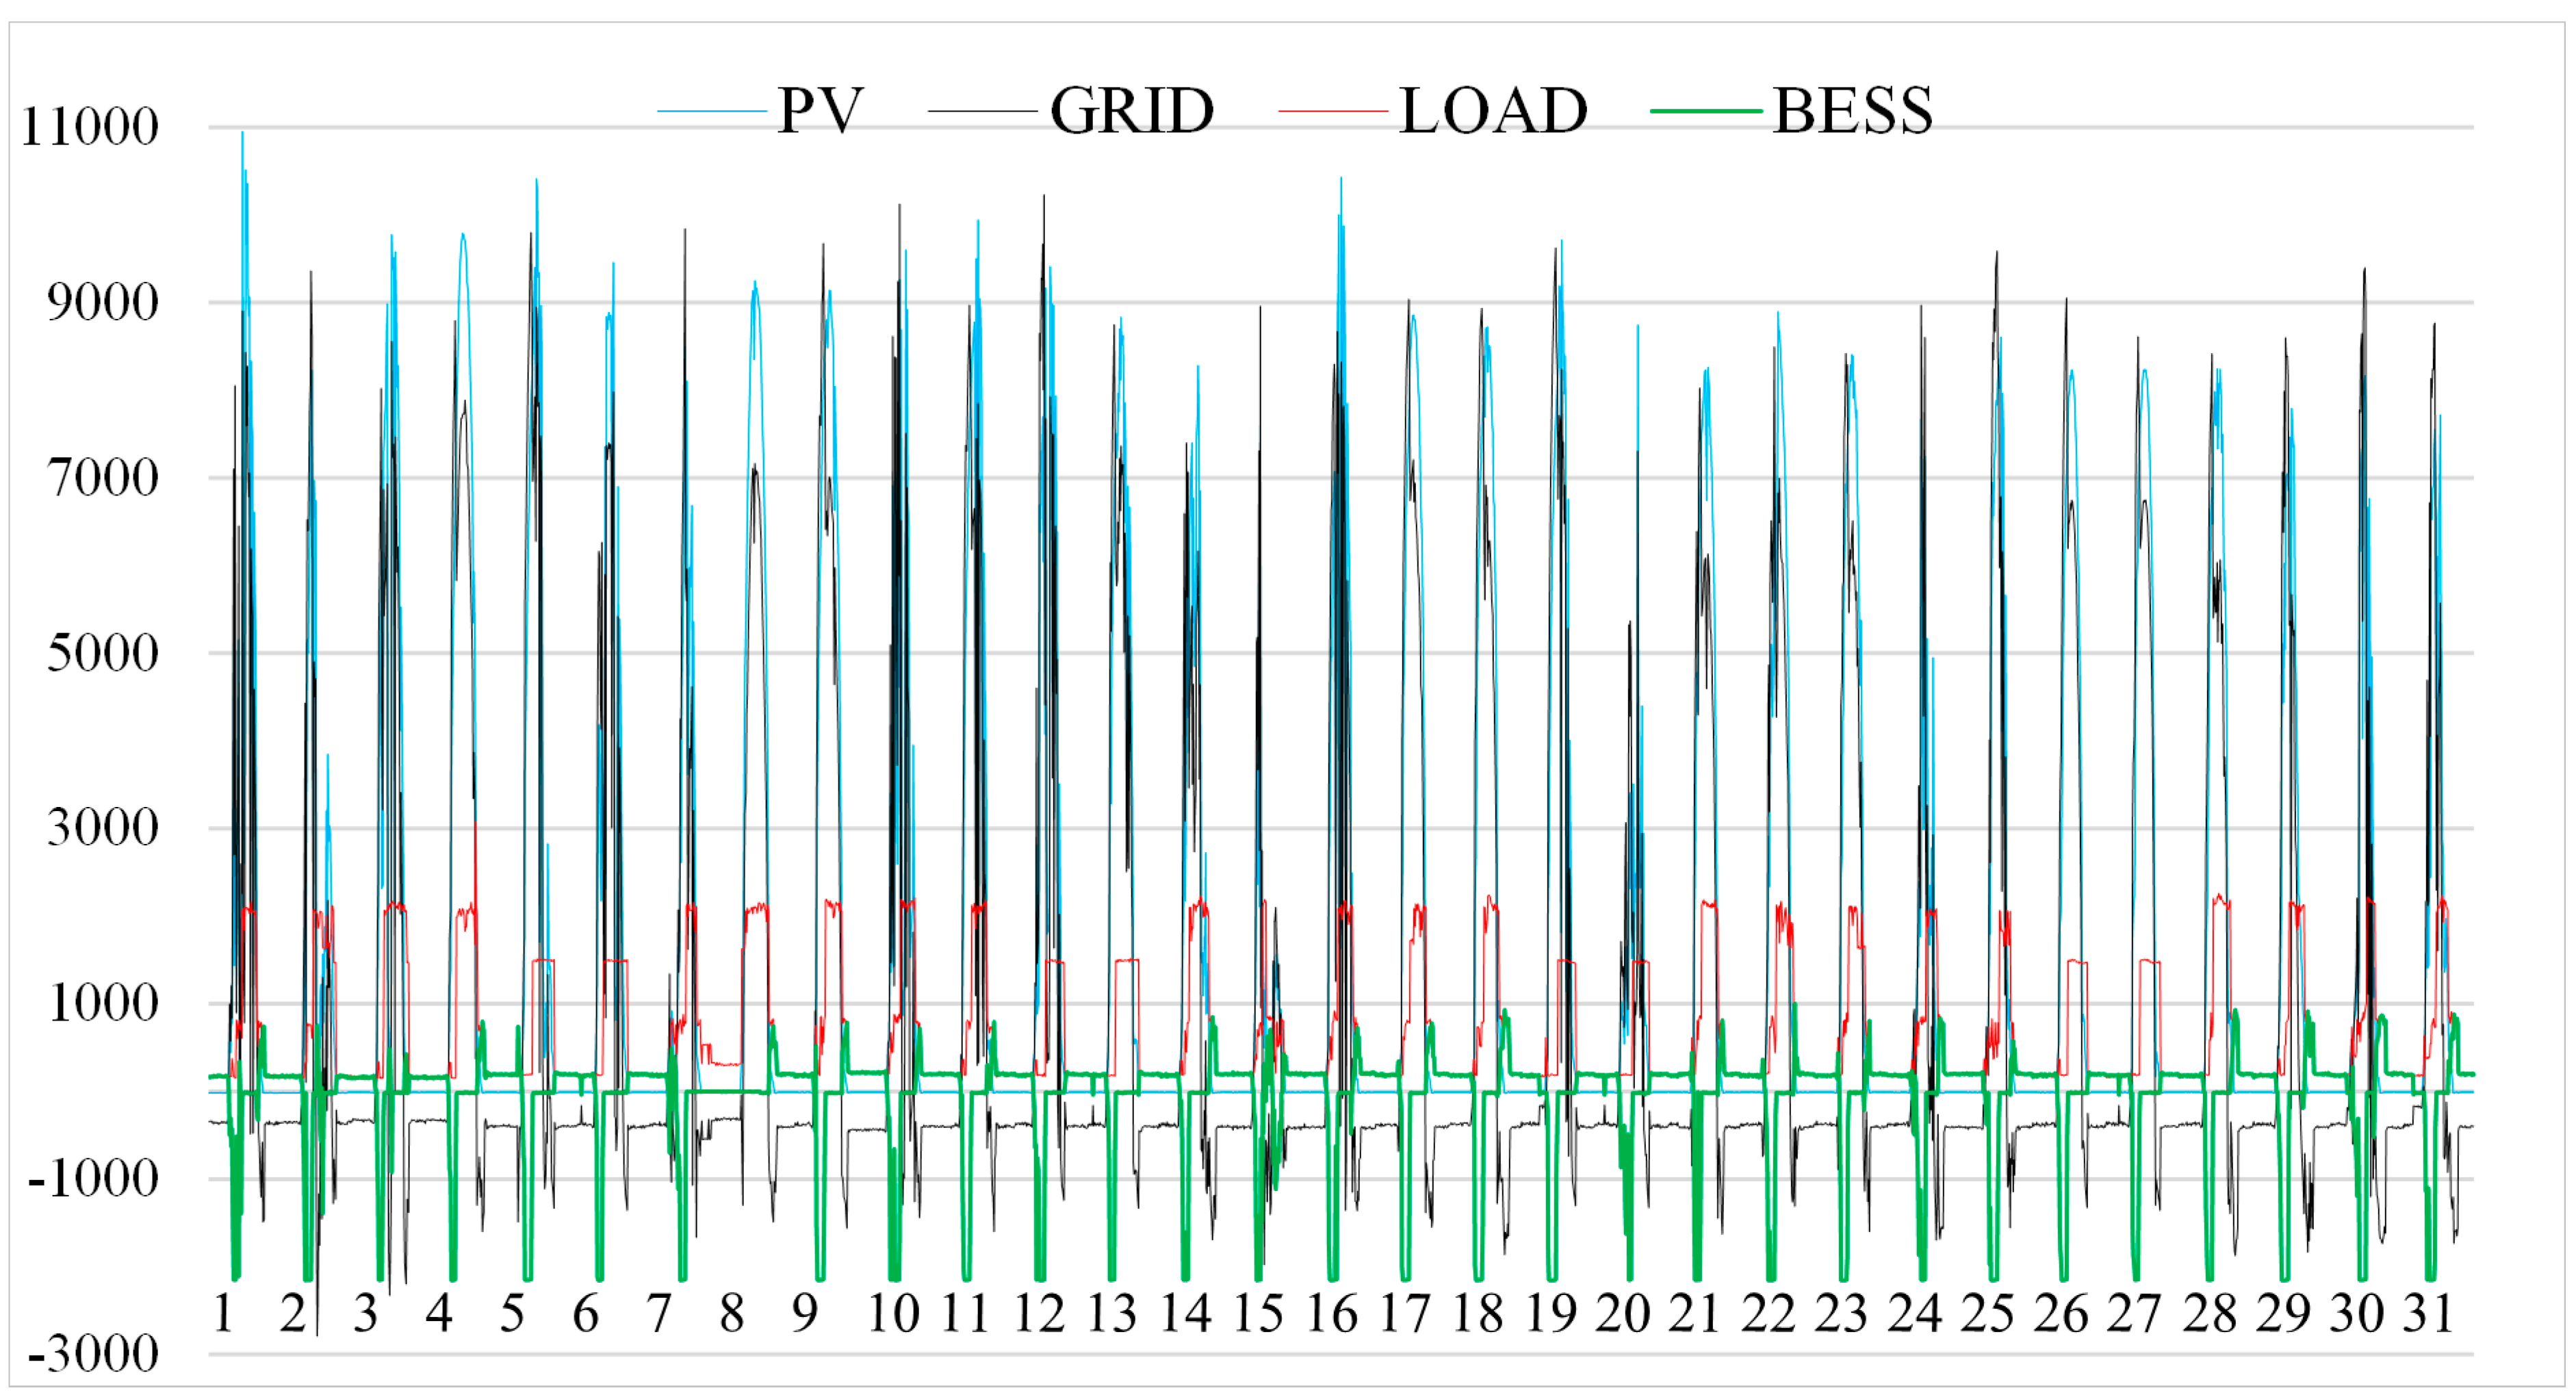
Figure 11 represents the behavior of the sources and loads exported from the Com’X 510 energy server in October 2019 in the LAMBDA LAB. According to the recorded data, the SCADA system, by collecting data from smart meters, was able to create an energy management system by load control to minimize the exchange power with the main grid. In this way, the PV system supplied the critical loads and the excess power went to charge the battery, with a top rate of 2200 W, and supply priority loads of the microgrid. Finally, if there was any residual power, it went to the main grid. On the other hand, in the case of lack of sufficient PV power, the BESS started to supply the critical loads and discharged at a top rate of 1800 W. However, if the required power was more than the BESS discharge rate, or if the BESS SoC was low, the system started to take power from the main grid, as shown by the black line in
Figure 11. This rarely happened.
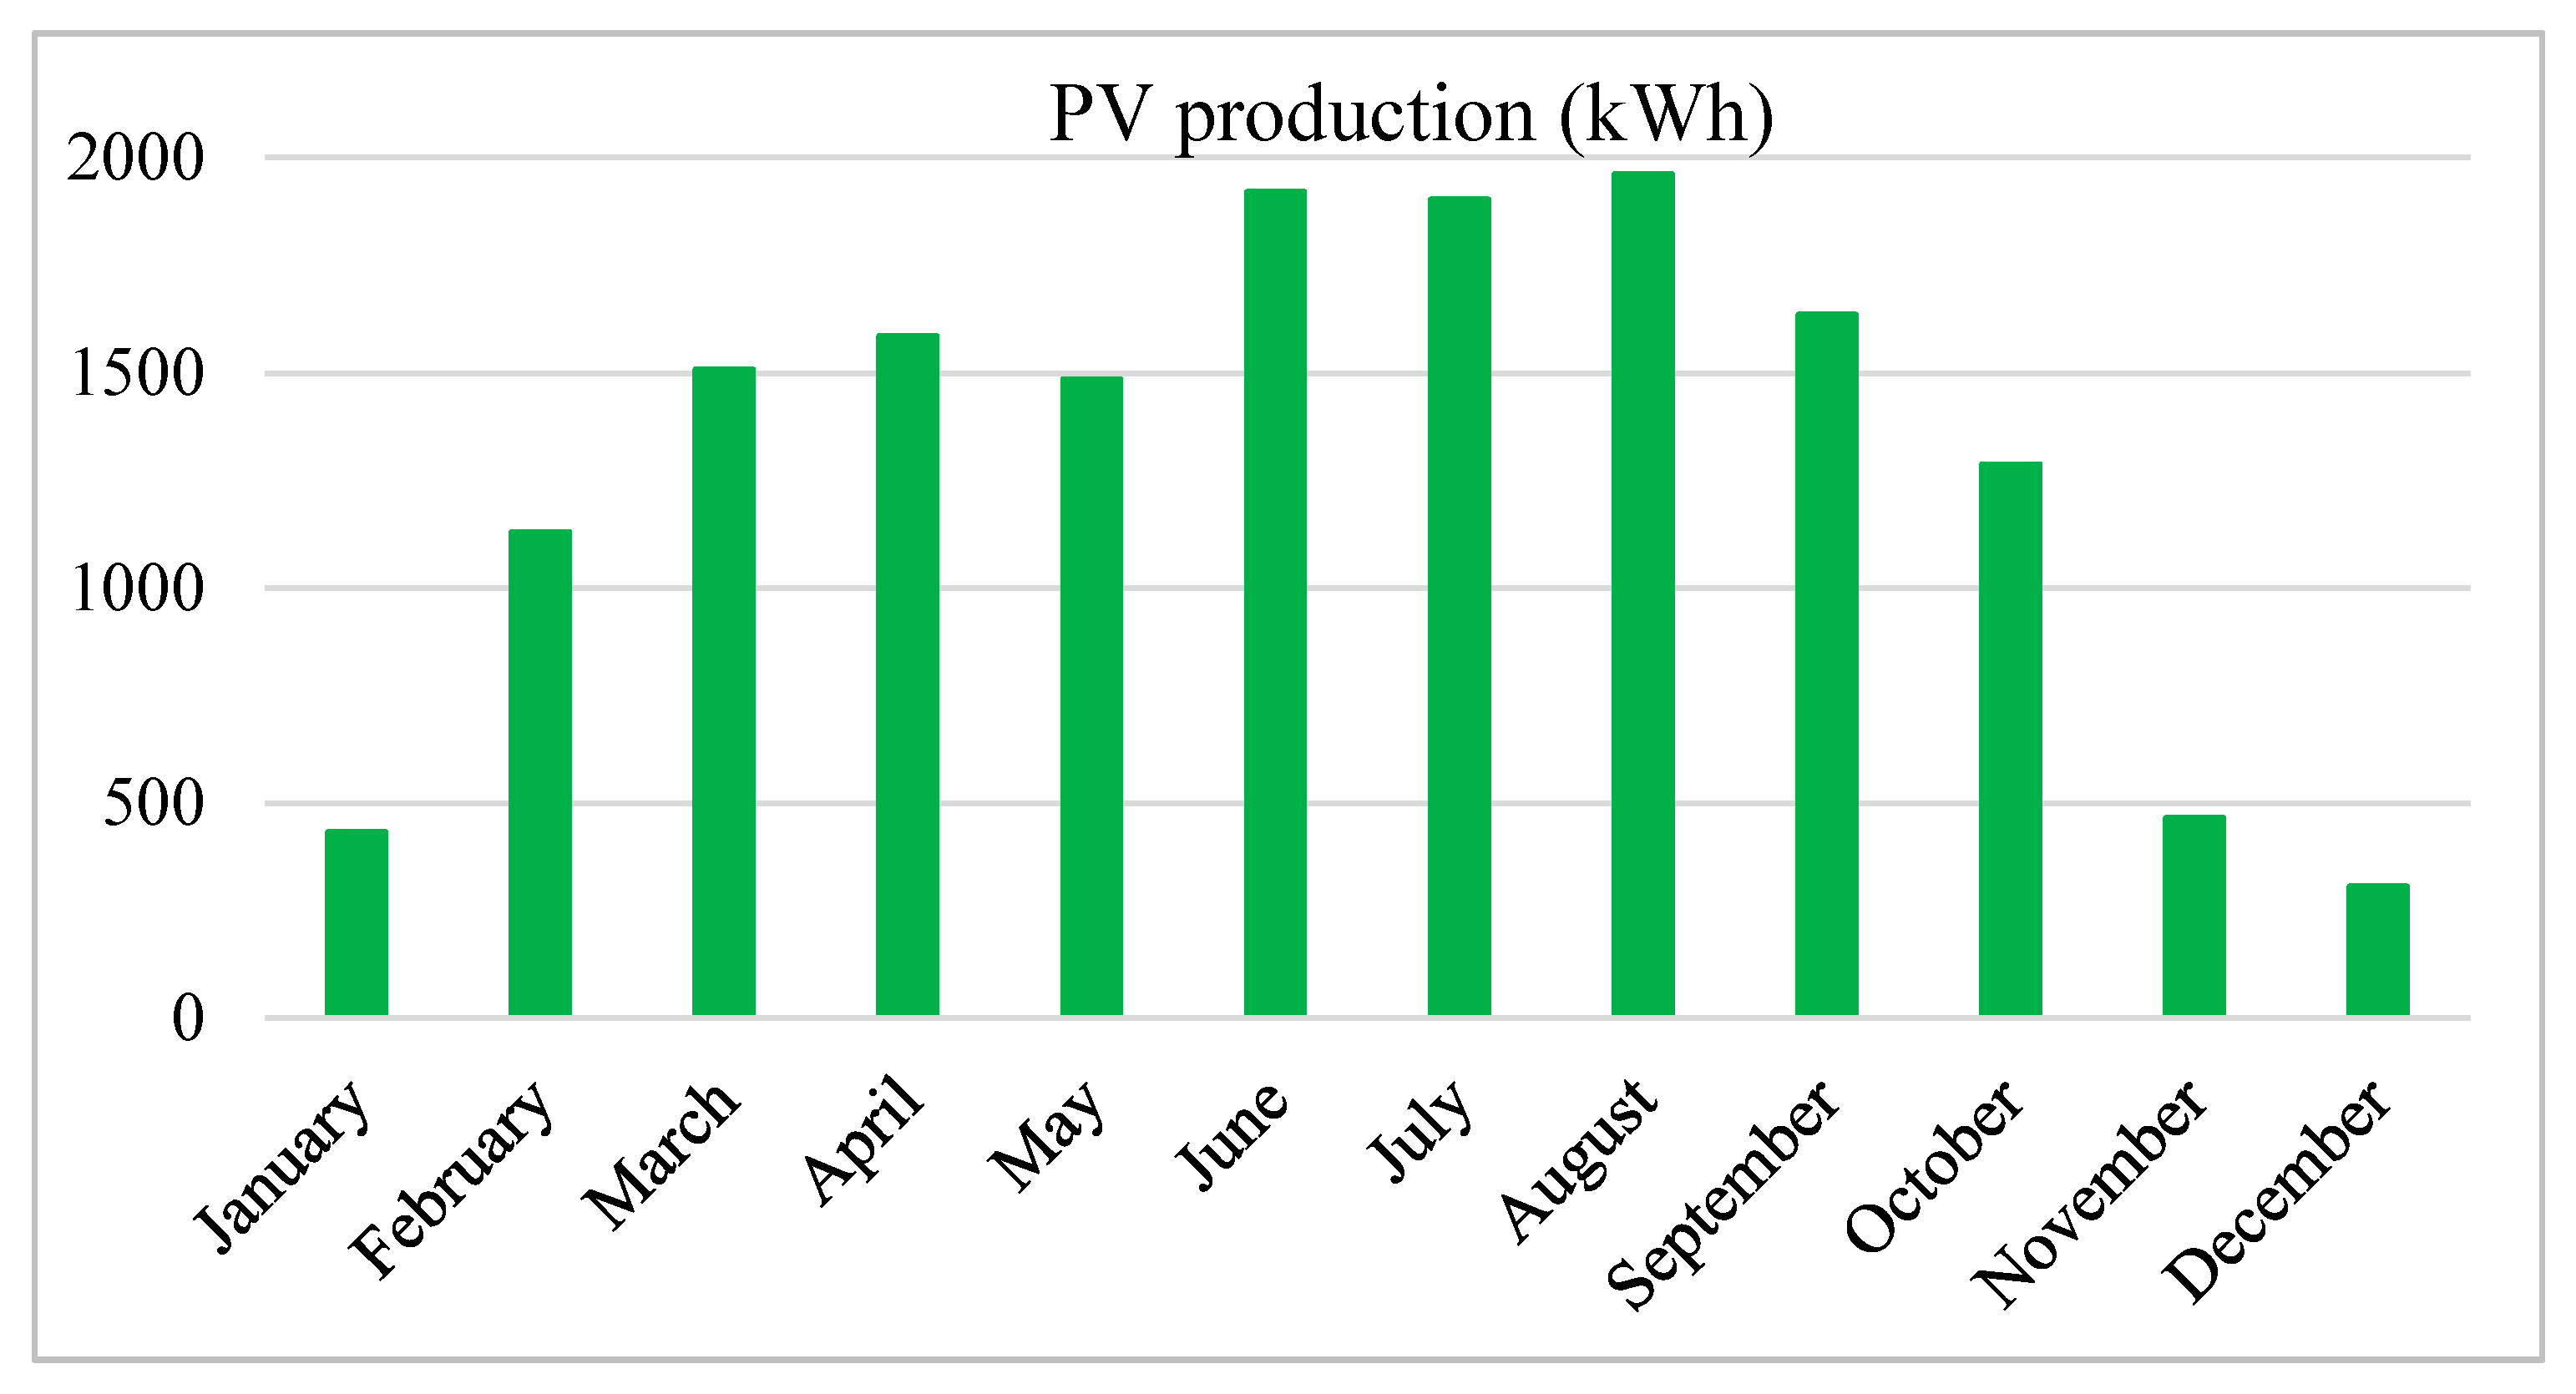
As shown in
Figure 12, the amount of energy produced by the PV array varied month to month in 2019. In this regard, the peak was just under 2000 kWh in August due to higher irradiation and temperature compared to other months. It fell to almost 300 kWh in December, and the monthly average value of generated energy was about 1300 kWh.
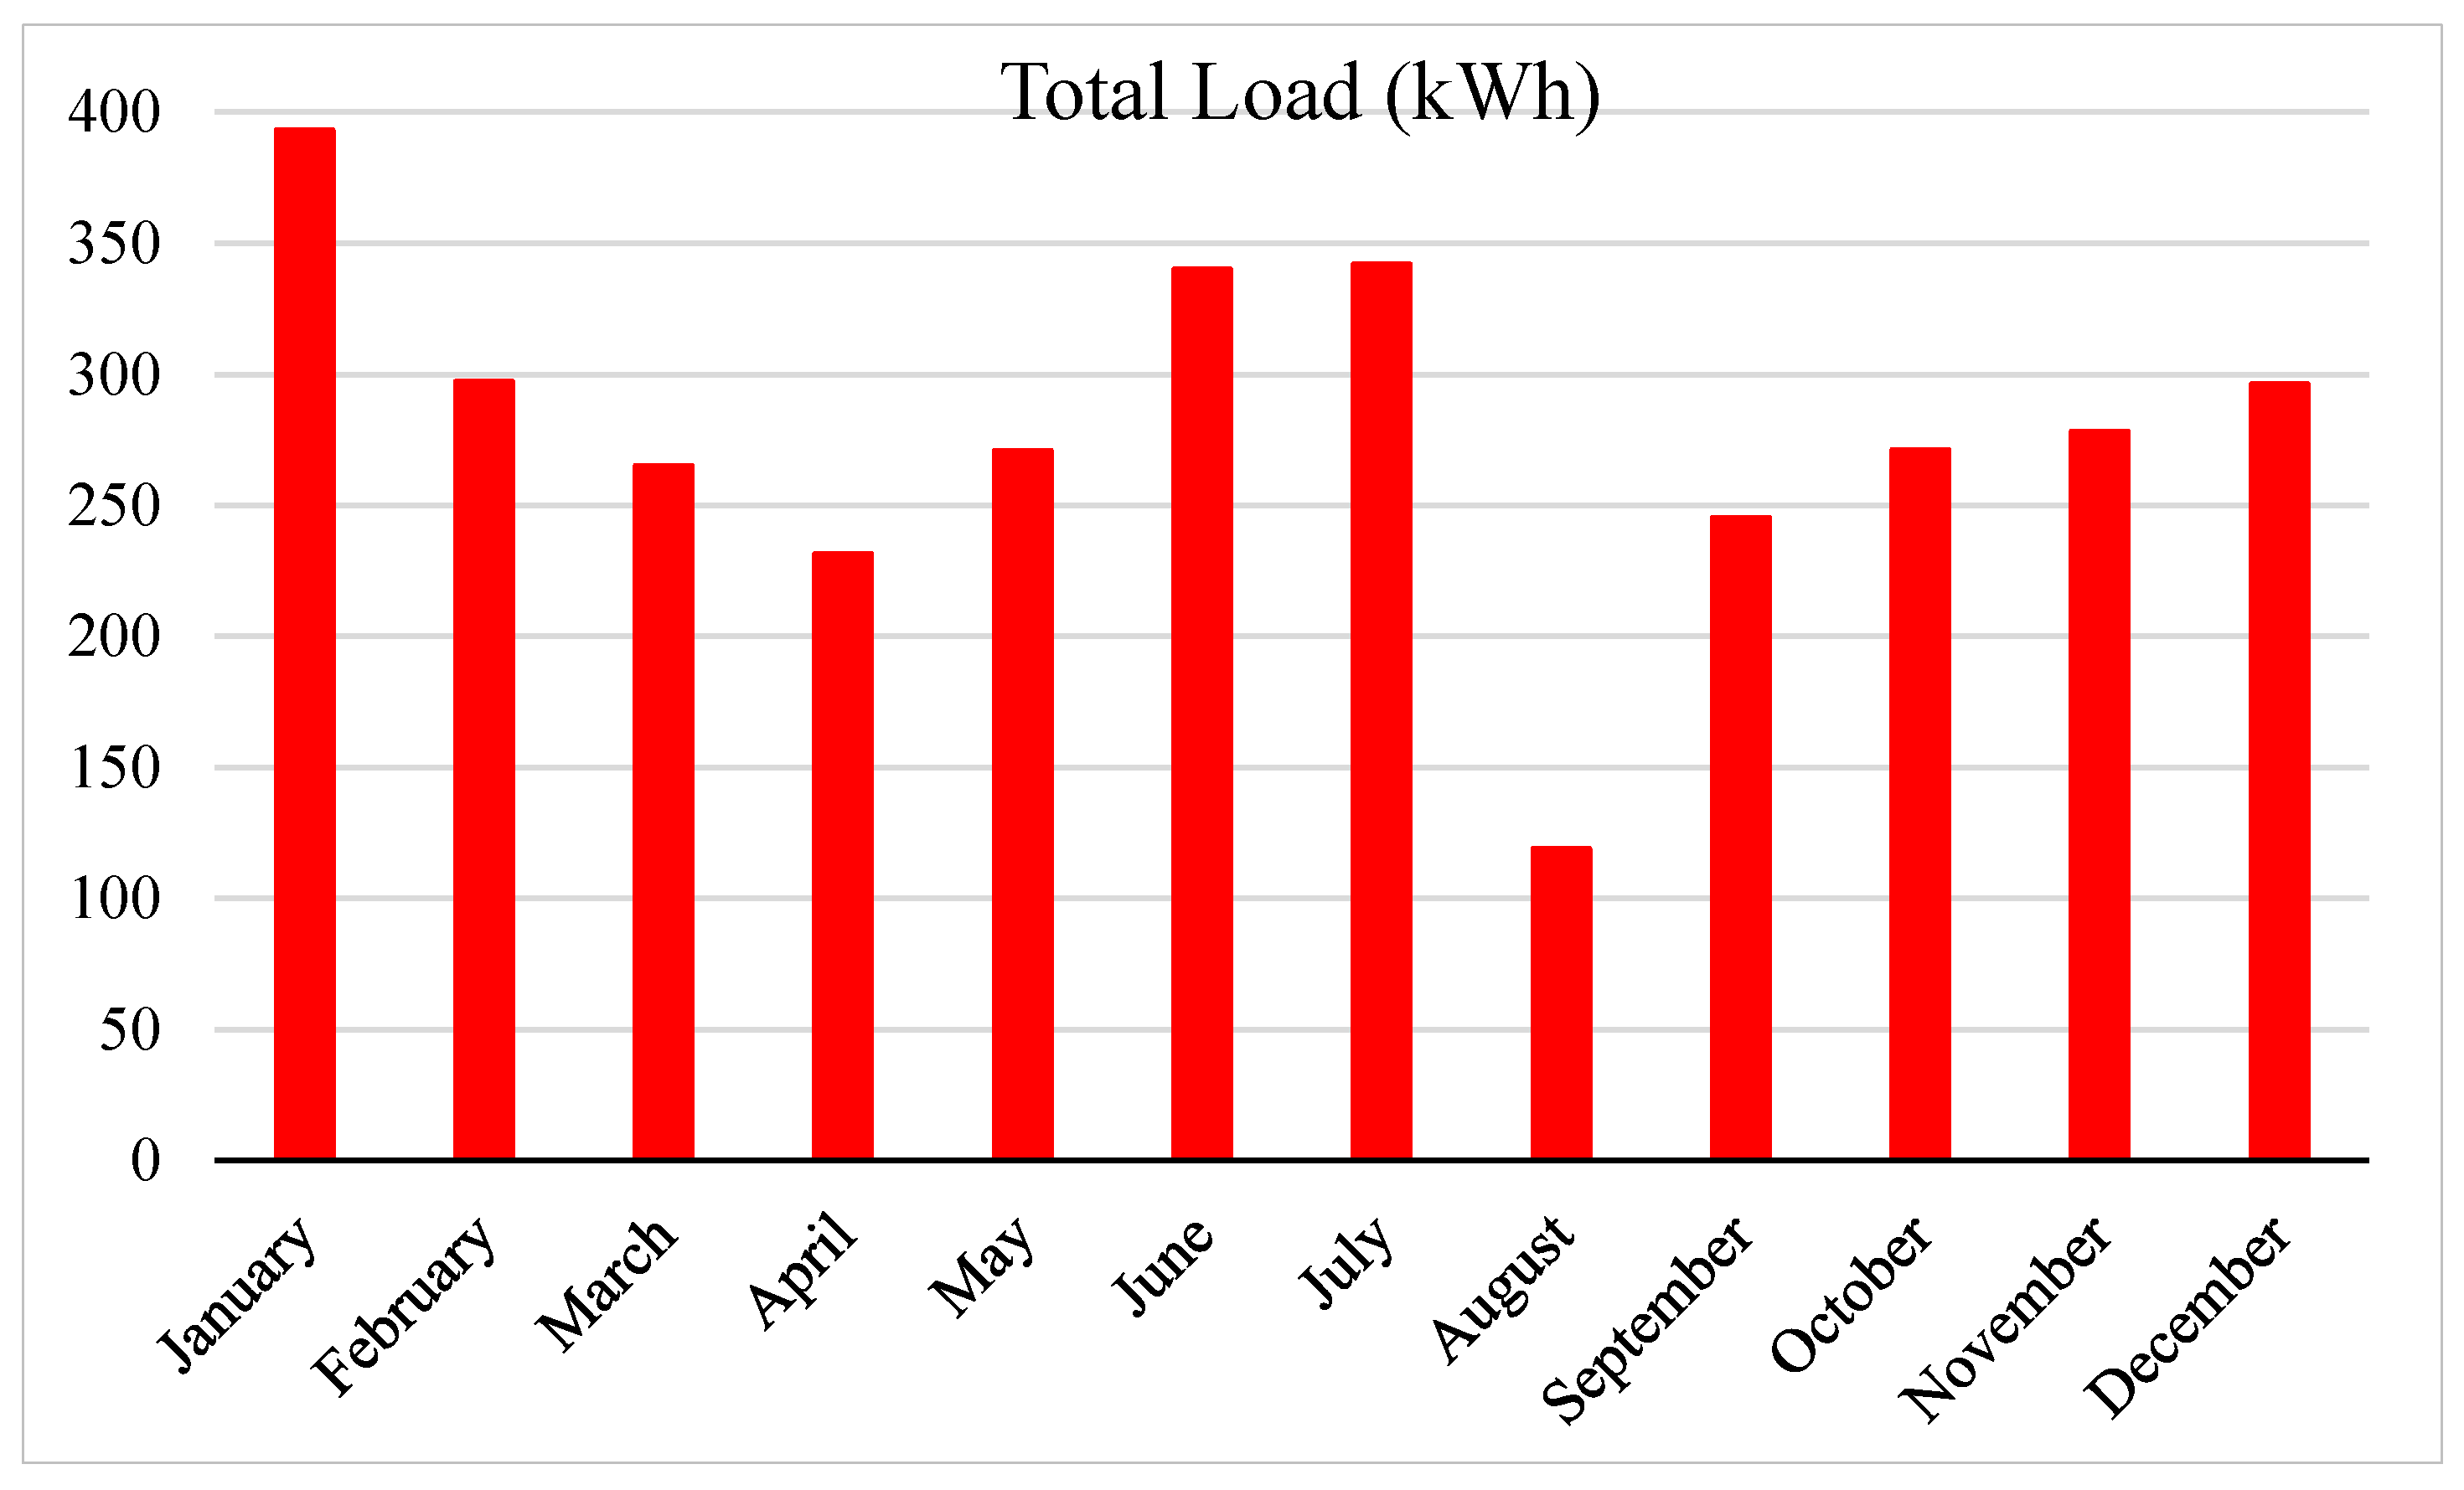
Figure 13 provides information regarding the amount of consumed energy by different loads in 2019. It reached almost 400 kWh in January as a result of the highest heating system usage. However, in August, it decreased to about 120 kWh because of the closure of the LAMBDA LAB. The average loads’ energy consumption had an average value of 280 kWh in 2019.
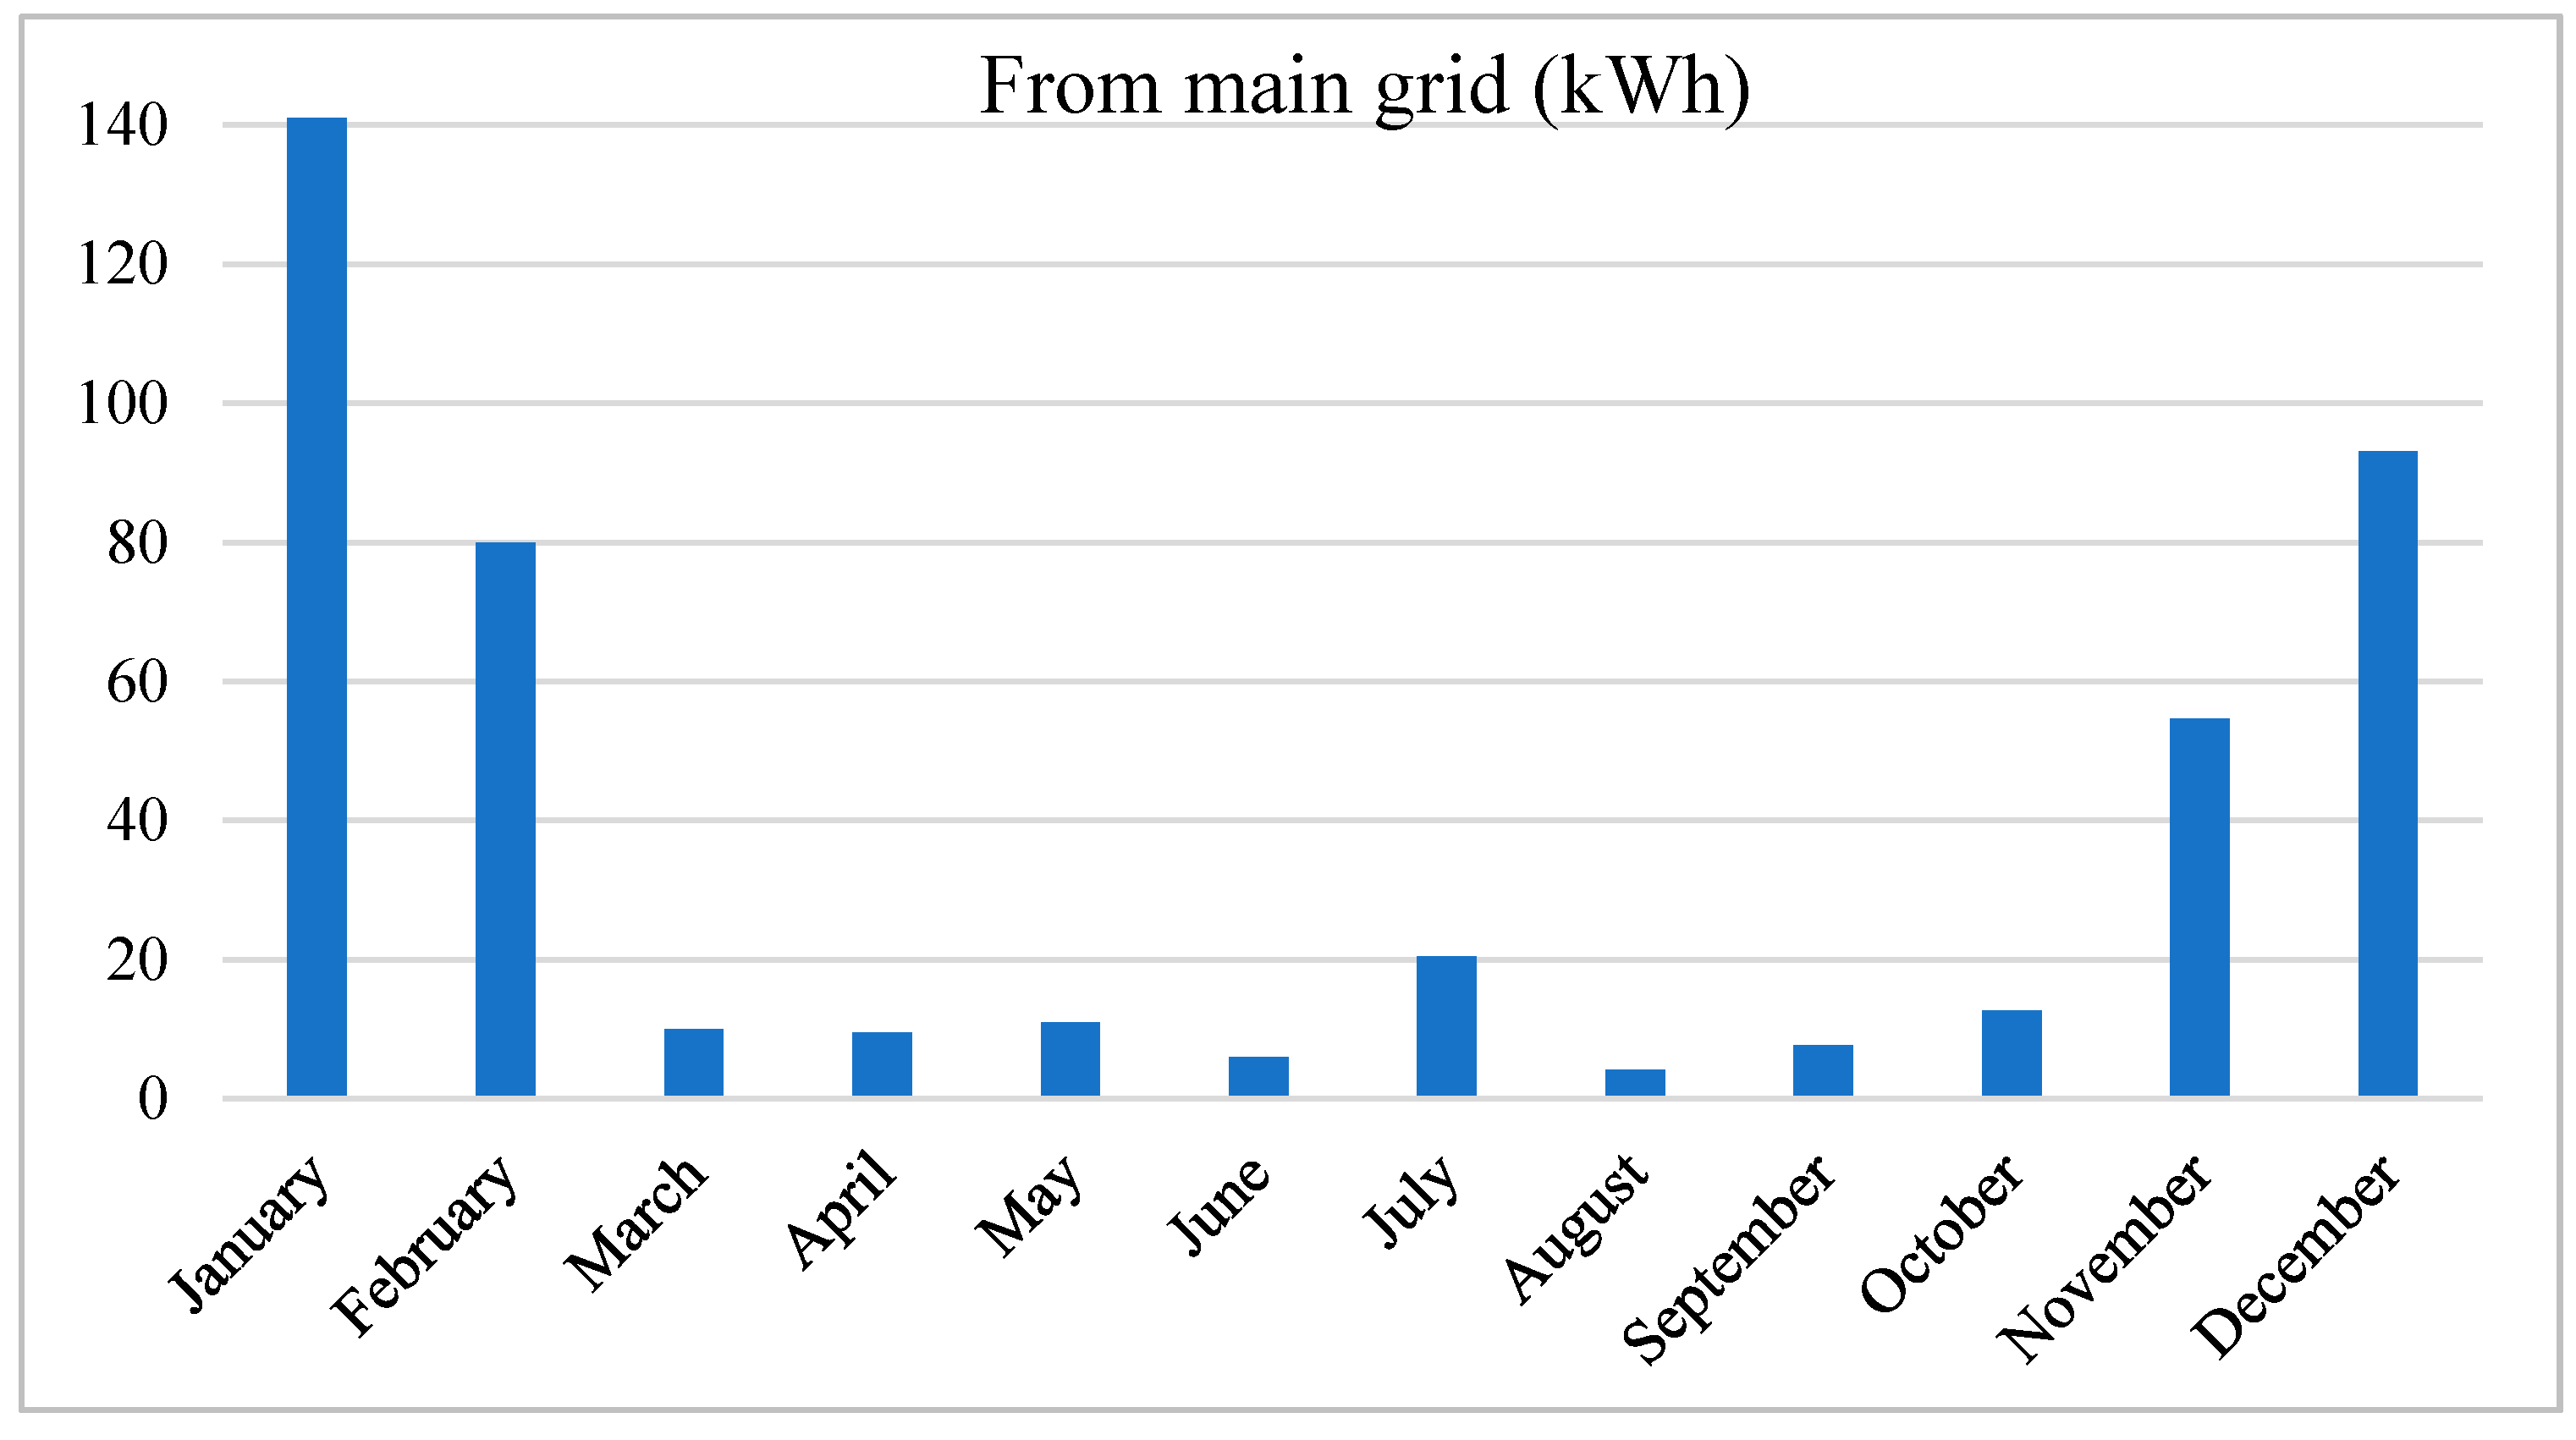
Figure 14 shows the amount of energy received from the main grid in different months in 2019. As expected, in month 8, due to high irradiation and temperature and as a result of higher PV production, the amount of imported energy from the main grid was minimized. The amount of exchanged power with the main grid strongly depended on the synchronization of the BESS and the PV array. For example, although in January the produced energy by the PV system satisfied the loads, almost 140 kWh had to be imported from the main grid because in the night the PV array production was zero and when the BESS was empty energy had to be imported from the min grid to satisfy the loads.
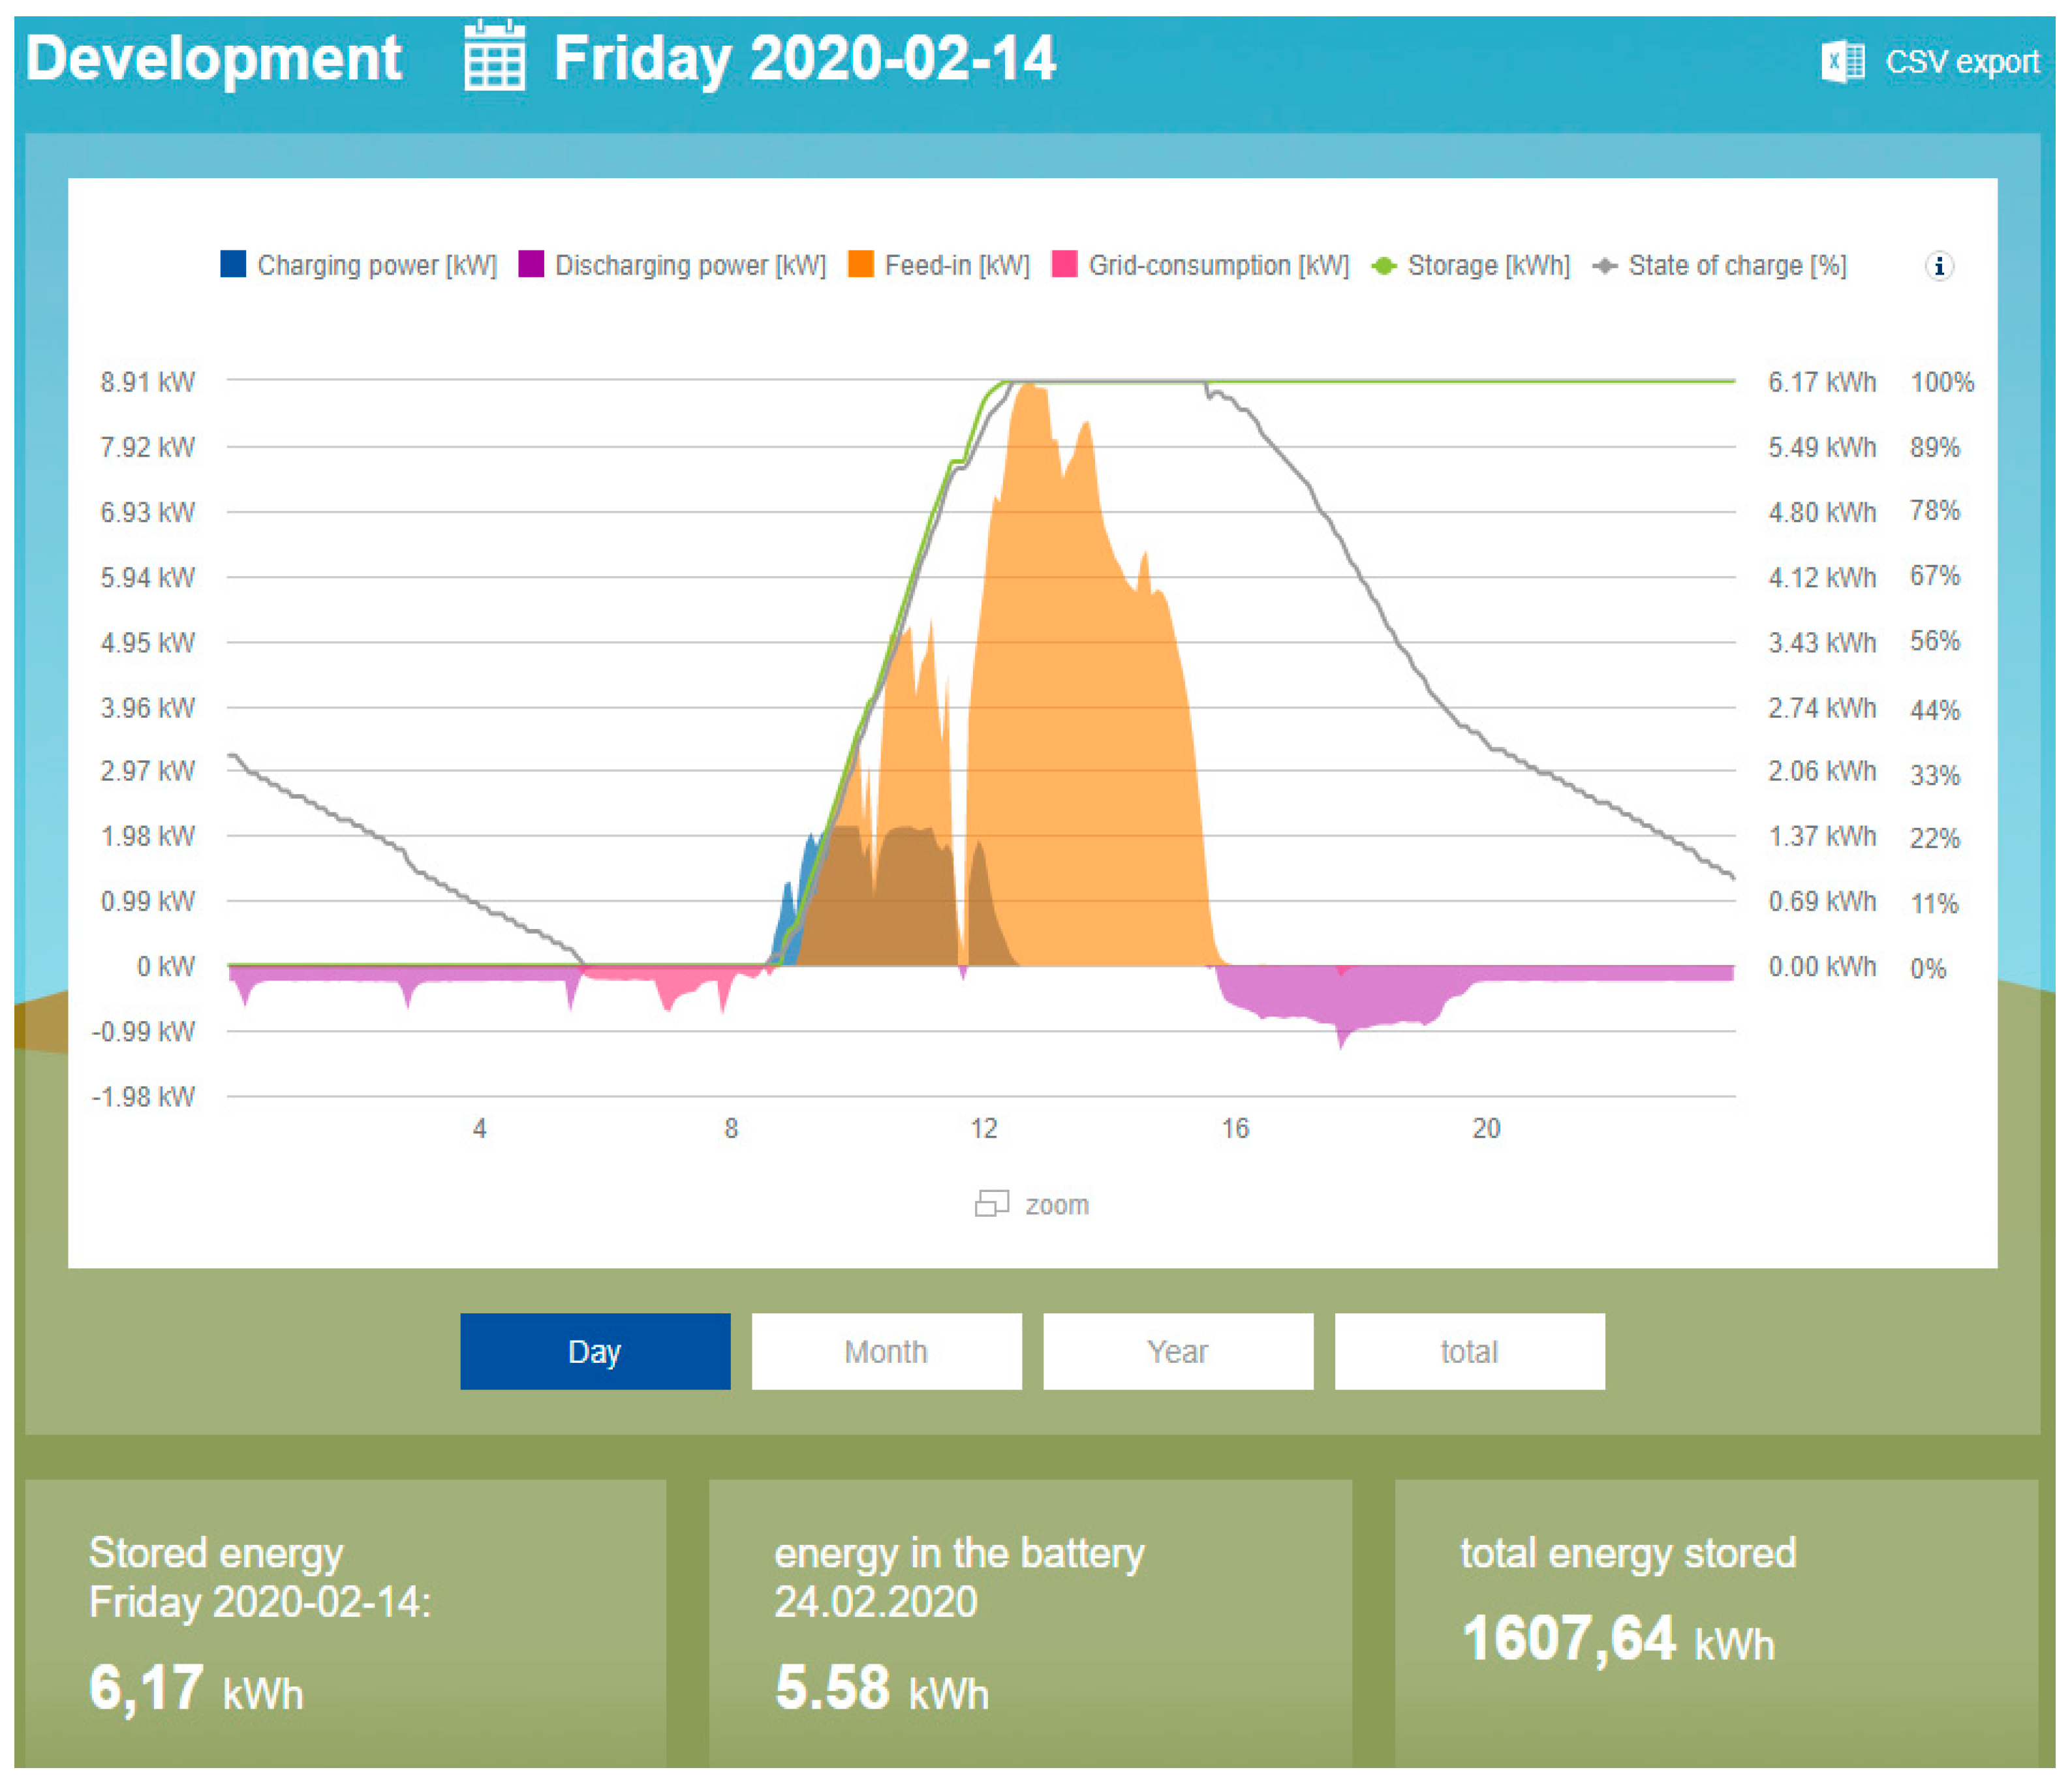
Figure 15 shows the amount of charging and discharging power of the BESS, and the amount of transmitted and received powers from the main grid, which are in orange and red, respectively. It also provides the amount of stored energy in the BESS in a green line that is relative to its SoC.
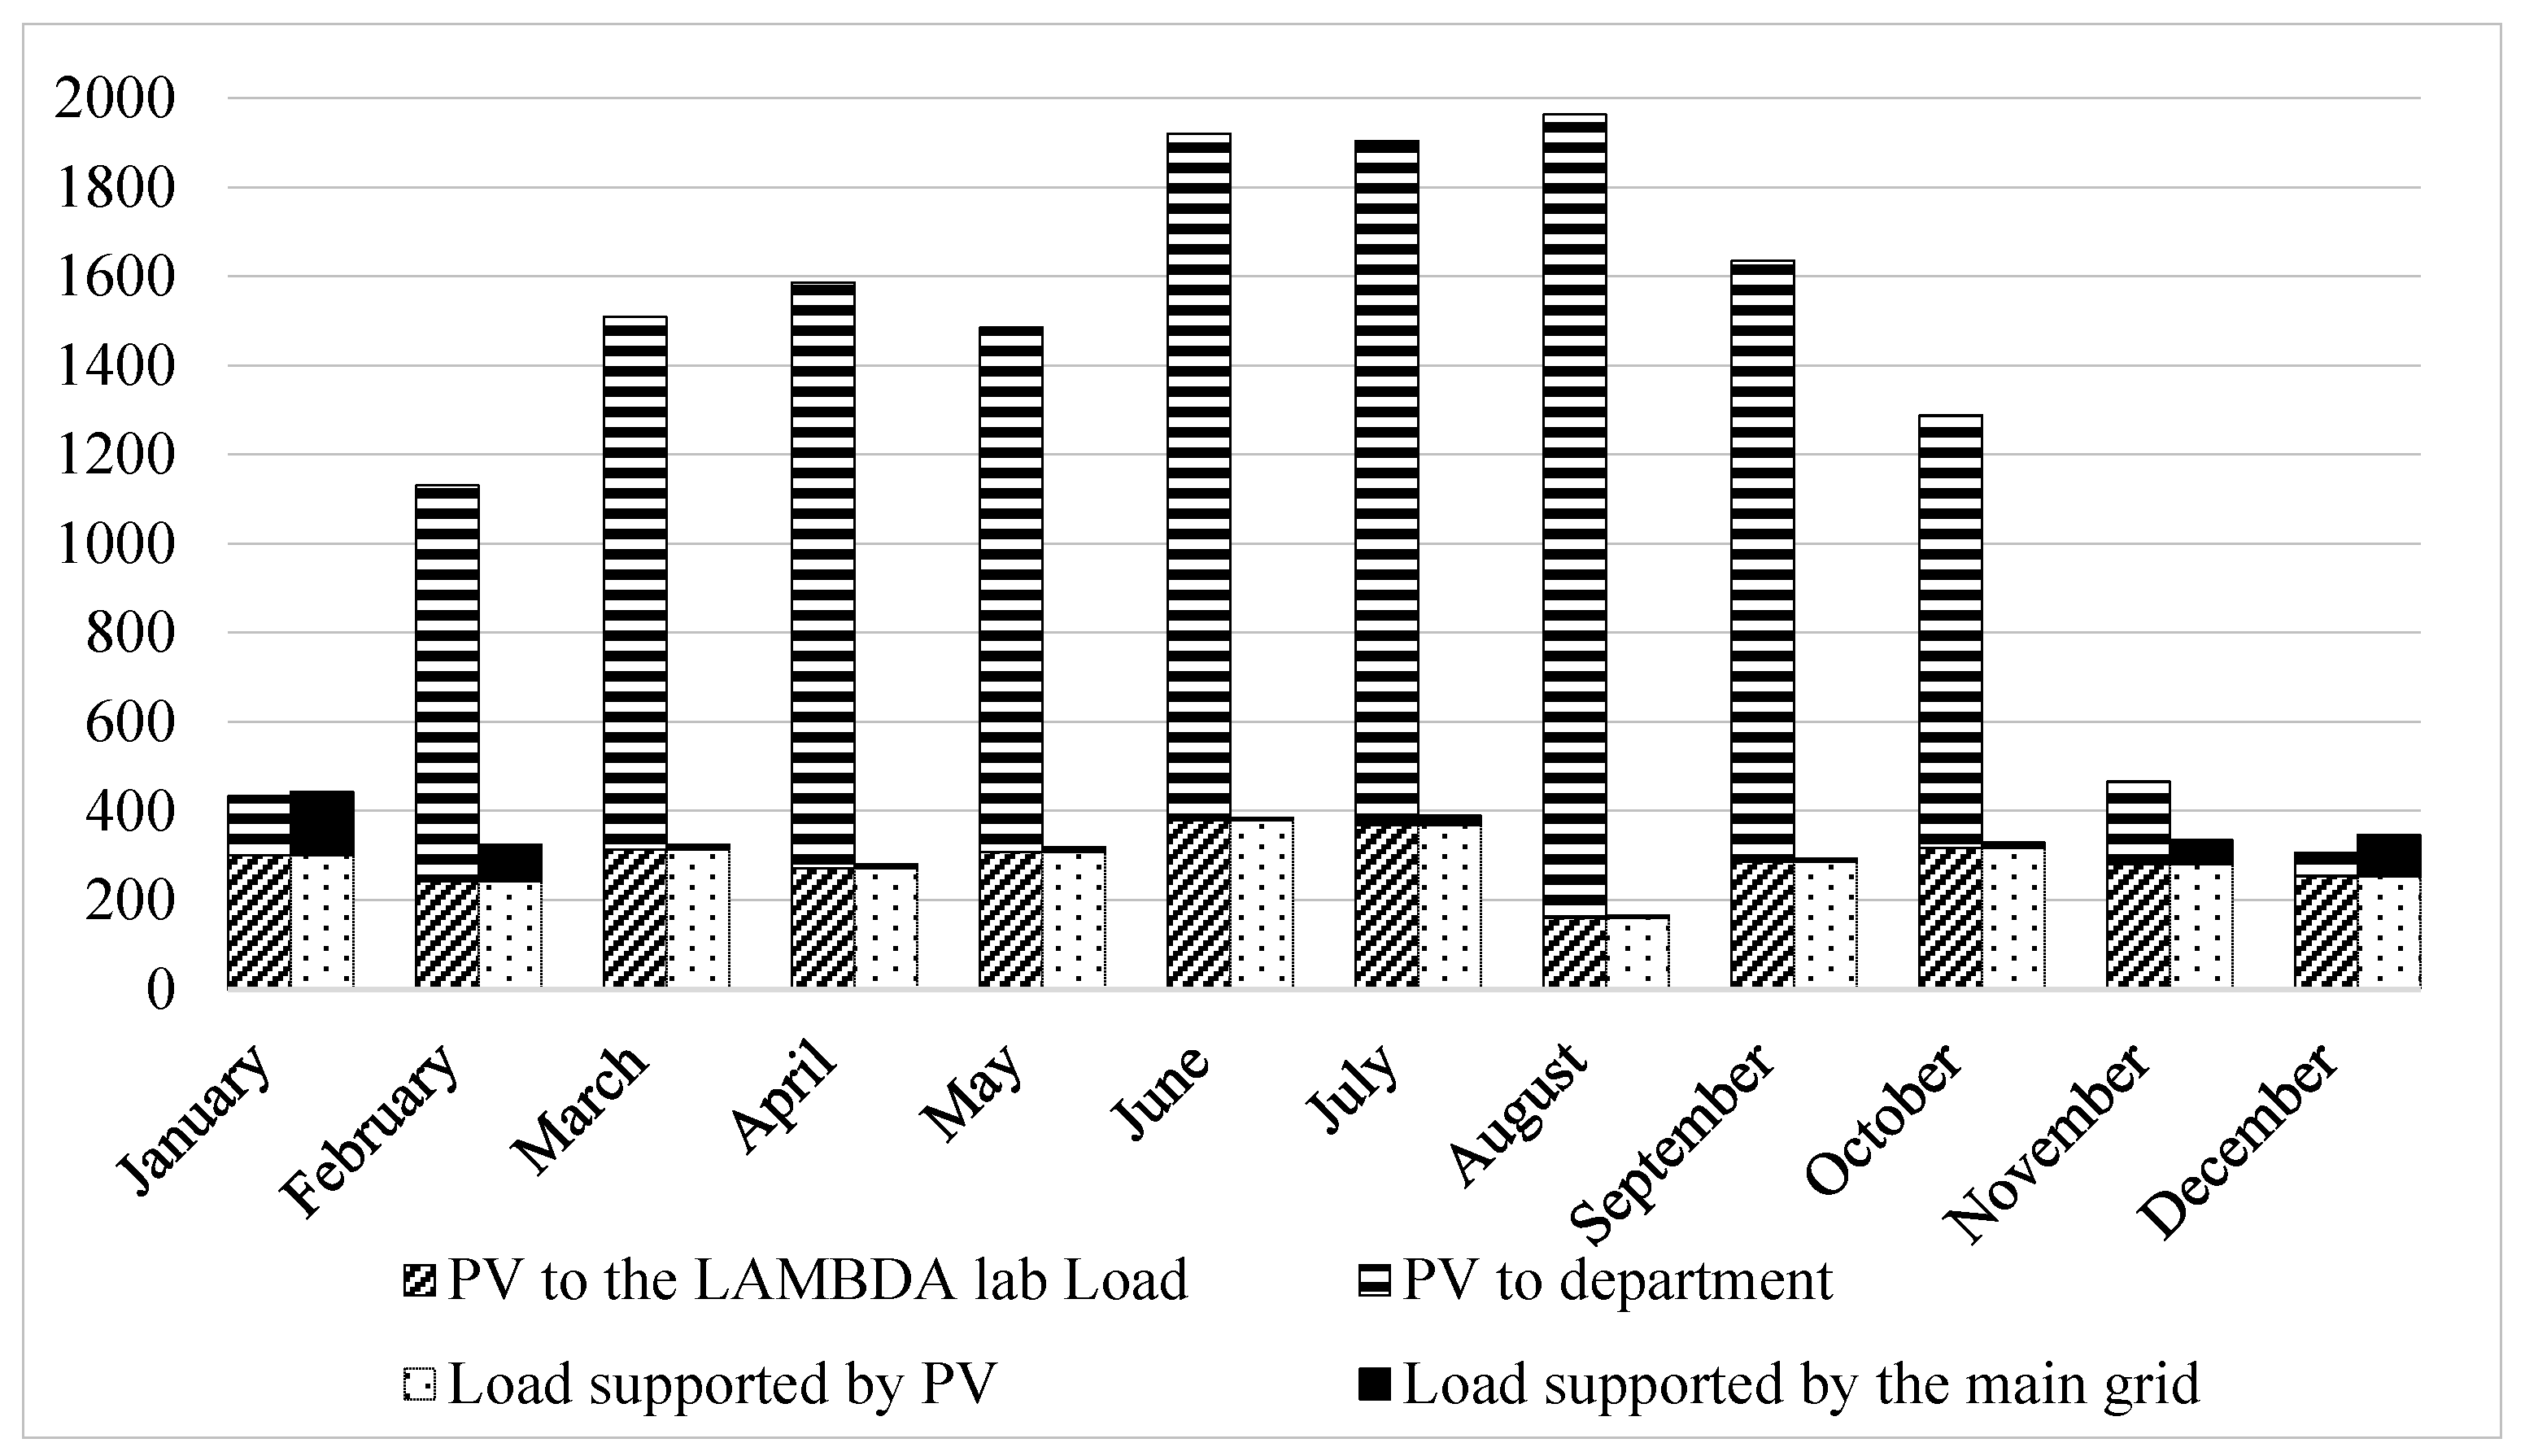
The key points after a one-year investigation based on
Figure 16 are summarized as follow:
In the period from March to October (Spring, Summer, and Fall), the quantity of energy taken from the main grid was nearly zero, with a very high value of self-consumption thanks to the management of the battery storage system.
In the winter period, from November to February, because of low irradiation, the quantity of energy from the main grid was more significant, but the monthly balance was positive (more energy produced than consumed).
5. Conclusions
The world MG testbed system can be useful for scientific research, and commercial and industrial applications. In this paper, a real MG system (LAMBDA MG) was installed at the University of Rome Sapienza, Italy, and investigated. Two kinds of controls for the LAMBDA MG testbed were designed and implemented: one for energy optimization of the local sources in normal operations based on HBES/SCADA and a second for emergency conditions in order to operate the MG in island mode operation based on a fast PLC. In this paper, the first approach, i.e., increasing the capacity of the BESS, was considered. The results of one year of investigation highlight that from March to October the quantity of energy taken from the grid was nearly zero, with a very high value of self-consumption thanks to the management of the storage system. In the winter period from November to February, because of low irradiation resulting in less PV production, the quantity of received energy from the main grid was more significant but the monthly balance remained positive (more energy produced than consumed).
The results of nearly zero-energy from the main gridhad a tremendous economic impact, considering the savings of energy bought from the grid. It is possible to conclude that by the operation of the MG with the PV and battery storage systems, LAMBDA MG is a “nearly zero-energy laboratory.” For future work, other approaches will be implemented. First, we plan to gather the installed 1.6 kW sigle-phase PV panel data into the SCADA system, which will satisfy the LAMBDA LAB single-phase loads, such as lightings. Second, emergency generators will be involved through a fast PLC controller to investigate island mode operation in the LAMBDA LAB.


