Energy Consumption and Lifecycle Cost Analysis of Electric City Buses with Multispeed Gearboxes


Department of Mechanical Engineering, School of Engineering, Aalto University, 02150 Espoo, Finland
*
Author to whom correspondence should be addressed.
Energies 2020, 13(8), 2117; https://0-doi-org.brum.beds.ac.uk/10.3390/en13082117
Submission received: 29 March 2020
/
Revised: 17 April 2020
/
Accepted: 20 April 2020
/
Published: 24 April 2020
(This article belongs to the Special Issue Electric Systems for Transportation)
Abstract
:This study investigates the potential of improving the energy efficiency and reducing the lifecycle costs of electric city buses with multispeed gearboxes. A two-speed dual clutch gearbox and a continuously variable transmission were studied and compared to a reference fixed gear ratio powertrain. A novel two-level optimization model was introduced. The top level involves an exhaustive search algorithm and quasi-static vehicle dynamic model for optimizing the two-speed gearbox gear ratios, utilizing efficiency maps for the electric motor and the inverter. The second level is an integer programming model, which finds an optimal gear shifting policy subject to constraints on hysteresis and gear shifting induced losses. The model was applied with a standard driving cycle and additionally with three measured cycles acquired from a prototype battery electric city bus operating on a daily schedule on a suburban route in Espoo, Finland. The results showed that a two-speed gearbox reduced energy consumption by 2–3.2%, depending on the driving cycle characteristics. On the other hand, the continuously variable transmission was found to increase consumption by 1.9–4.0% due to large losses of the belt mechanism. It was concluded that the two-speed gearbox is a cost-effective investment for electric city buses characterized by operation profiles with frequent acceleration and braking events.
1. Introduction
In recent years, electric city buses (ECB) have experienced exponentially growing production rates and deployment to the public transportation systems of many cities around the world, as the lifecycle cost has decreased below traditional diesel bus levels in many routes and operating conditions [1]. In 2018, the global ECB fleet grew by 32% and reached 425,000 units worldwide [2]. The major advantage of ECBs is the higher energy conversion efficiency of the powertrain compared to diesel buses. ECBs are also locally emission-free, whereas diesel buses emit harmful particles that stay trapped between buildings, causing significant damage to human health in urban environments [3].
Although battery and charging technologies have developed at a fast pace in recent years, limited range is still a challenge with electric vehicles in general, because energy density of batteries is 25–100 times less than in liquid hydrocarbon fuels [4]. Increasing the battery capacity extends the range, but the size, weight, and cost set upper bound on the battery capacity. This limitation puts an emphasis on efficiency and optimal component selection in ECBs. Improved efficiency translates to an increasing rate at which ECBs displace diesel buses in cities’ transportation systems, leading to reduced emissions and cleaner air.
The traction motor is the key component of an electric powertrain, and enabling the motor to operate at its highest efficiency region improves energy efficiency. Traction motors used in ECBs need to provide sufficient torque for acceleration and climbing inclined roads, while the maximum power output needs to be sufficient for high speed cruising. A motor with a wide speed range fulfills these requirements, and there is no absolute need for a multispeed gearbox as in ICE-powered vehicles [5]. However, in a traction application, a motor uses a wide speed range and thus is not operating at optimal efficiency [6]. ECB provides a promising application for a multispeed gearbox, because the vehicle operation consists of frequent braking and acceleration events that use a wide torque and speed range of the motor, which has been shown to result in reduced efficiency with a single gear drivetrain [7]. By contrast, electric vehicles that operate mostly at constant speed, such as long distance buses and trucks, can be equipped with a single speed reduction gear. The gear ratio is selected to operate the motor at the high-efficiency design point at nominal vehicle speed.
1.1. Previous Work
The literature on the advantages of a multispeed gearbox in electric vehicles is extensive, although it is primarily focused on light-duty vehicles. To the knowledge of the authors, there are no studies that investigate multispeed gearbox options for electric city buses.
Wu et al. [8] developed a simulation model in Autonomie to study the impact of a two-speed gearbox (AMT) on the fuel economy of an electric car. Dynamic programming was applied to the optimization problem—A 4.2% reduction in energy consumption in city driving was observed.
Ren et al. [9] reported a simulation study using a backward modeling approach (wheels to motor) and a comparison of different gearbox options in terms of the energy consumption of EVs. The reference was the original single-speed transmission, which was compared to continuous variable transmission (CVT) and multispeed gearbox with two, three, and four speeds. The authors observed that the losses of the multispeed gearbox cancel the improvement in energy efficiency for the NEDC cycle. For the other five cycles studied, the improvement in efficiency varied from 5.3% to 12.4%. The authors also point out that in addition to a possible improvement in energy efficiency, the acceleration performance of the vehicle improves. Specifically, the acceleration time from zero to 100 km/h was reduced from 18.6 s to 12.4 s with a two-speed gearbox.
A similar study of powertrain efficiency comparison was completed by Bottiglione et al. [10]. The gearbox efficiency and increase in vehicle mass were taken into account. The compared gearbox options were infinitely variable transmission (IVT) and CVT with toroidal technology. Single and two-speed transmission were also considered. Both IVT and CVT had two different configurations. The planetary gear in the IVT was assumed to work with 100% efficiency. The simulations were run for the Urban driving cycle (UDC) and the Japanese 10–15 cycle (J10-15). For both cycles, the IVT and CVT were found superior to the two-speed gearbox, with the largest consumption improvement reaching 16.7%. The authors concluded that the energy efficiency of EVs could be significantly improved by optimizing the torque dependent efficiency of CVT and IVT.
Gao et al. [11] focused on the potential of a two-speed gearbox for EVs. The study included simulation and optimization of gear ratios and shift control. The gearbox efficiency was considered equal to the single-gear alternative, and the overall efficiency of the powertrain was assumed to be 96%. The reported results were in agreement with those discussed previously. One notable difference was that the largest energy savings were achieved in the NEDC cycle, which in [9] was found to produce the least savings potential. The authors also mentioned the improved performance of the EV with a two-speed gearbox, i.e., better acceleration and top speed. Their modeling efforts highlight the friction losses due to the clutch in the gear change and the effect of a gear change smoothness to the friction losses. Calm gear shift which is comfortable for the passengers with no torque interrupt generates substantial losses in comparison to more rough and rapid change.
In addition to simulation studies, Spanoudakis et al. [12] discussed a prototype for an experimental test of the potential of a two-speed gearbox for improving the efficiency of an ultralight vehicle for urban environment transportation. The power source in the test vehicle was a hydrogen fuel cell. The gear selection was manual, and the test drive was conducted on a simple oval test track. The results showed that energy savings of 3.4% were reached in comparison to the single-speed gearbox and most of the energy savings were achieved during the acceleration phases of the test run. The energy savings potential is higher in city driving conditions with frequent accelerations and decelerations compared to highway driving.
In the realm of heavy-duty vehicles, Tan et al. [13] reported a study on an iron mine electric dump truck gear ratio optimization using particle swarm optimization algorithm. For a typical working cycle in a mine, energy consumption was found to be reduced by 6.1% with the gearbox and optimized ratios compared to the reference powertrain, which had only a single-speed reduction gear. The study is limited with respect to the conclusions that can be established for ECBs because the operation cycle of the electric dumb truck has significantly less variation than that of a city bus.
1.2. Goals and Scope
Even though the feasibility of multispeed gearboxes has been previously studied for EVs and fuel cell vehicles, the feasibility of this concept for ECBs has not been investigated before. A separate feasibility study is required, since the driving cycles, vehicle structure and powertrain design of an ECB are different by definition from that of an EV. This study seeks to contribute to the literature by providing answers to the following research questions:
- How does the driving cycle impact the benefit of a multispeed gearbox?
- What is the optimal gear shifting policy of a two-speed dual clutch gearbox?
- Does an energy consumption advantage achieved with a multispeed gearbox translate to a lifecycle cost advantage as well?
A simulation model is constructed to study these three aspects of feasibility. The simulation model considers longitudinal dynamics and hence speed, voltage and current signals from real-world operation were measured from a prototype ECB operating in the city of Espoo, Finland. The signals were collected with 1 Hz sampling rate on all driving cycles. The collected dataset presents an opportunity to evaluate the feasibility of a multispeed gearboxes in real-world conditions. The availability of representative driving cycles is considered a valuable contribution in this work, since in previous research standard driving cycles have been used extensively, as described in the previous section. The standard driving cycles are appropriate estimates of driving behavior but cannot capture the complexities and variation of real-world driving. A detailed explanation of the data is provided in Section 2.4 and Section 2.5.
Considering new vehicle design, it would be worthwhile to take into account the interaction between the installed two-speed gearbox and the electric motor configuration. The simulation and optimization models developed in this work are in a general form, supporting motors of different sizes, so they can be applied to the motor sizing problem as well although this is not directly addressed in this work.
2. Vehicle Powertrain Model
2.1. Multispeed Gearbox Options for Heavy Duty Vehicles
Multispeed gearbox configurations for EVs constitute automatically shifted multispeed gearboxes, including two-speed gearboxes, and continuously variable transmissions [14]. Hydraulic automatic transmission is considered infeasible for the ECB application due to very low efficiency [15]. Additionally, gearbox designs that are still in the development stage, such as a planetary gear two-speed gearbox presented in [16], are considered out of scope.
CVT permits the electric motor to operate at the ideal point continuously. Power is transmitted by friction via a chain that runs between two axially adjustable taper discs. The diameter of the discs can be varied. Another CVT configuration is a toroidal variator. In this design the variable gear ratio is achieved by swiveling the friction gears.
The major drawback of CVT is the poor efficiency, compared to gear transmission. The traditional CVT that is used with internal combustion engine vehicles has efficiency of less than 85% but with EVs a simpler construction without a torque converter is feasible. Thus, efficiency of over 93% can be achieved [17].
Superior efficiency is achievable with gearboxes that have a discrete number of gear ratios. A greater than 95% efficiency and less than 150 millisecond gearshifts are reported for a two-speed dual clutch gearbox in [18] with 450 Nm maximum input torque and 13,000 rpm maximum speed. A single speed gearbox with the same performance specifications is reported to have two percentage points higher efficiency.
An automatic multispeed gearbox requires actuation for gear shifts. This is commonly implemented with an electrohydraulic actuator. A gear shift loss model for automatic manual transmission is presented in [19]. In this single clutch model, the losses consist of partially lost traction during clutch disengagement and engagement due to slipping, and the total loss of traction during the shifting phase. The clutch slipping is unavoidable, because engagement and disengagement must occur smoothly.
The primary power loss sources are clutch drag, gear churning, gear meshing and bearing seals [14]. Additional losses incur from energy consumption of a pumping cooling and lubricating fluid to the gearbox housing in the case of a wet clutch design. A dry clutch does not have a need for oil pumping, but can sustain lower torques.
The traction loss that occurs in shifting results in the vehicle velocity tracking loss compared to a vehicle equipped with a single speed reduction gear [19]. This loss needs to be compensated by an increased power output after the shifting event.
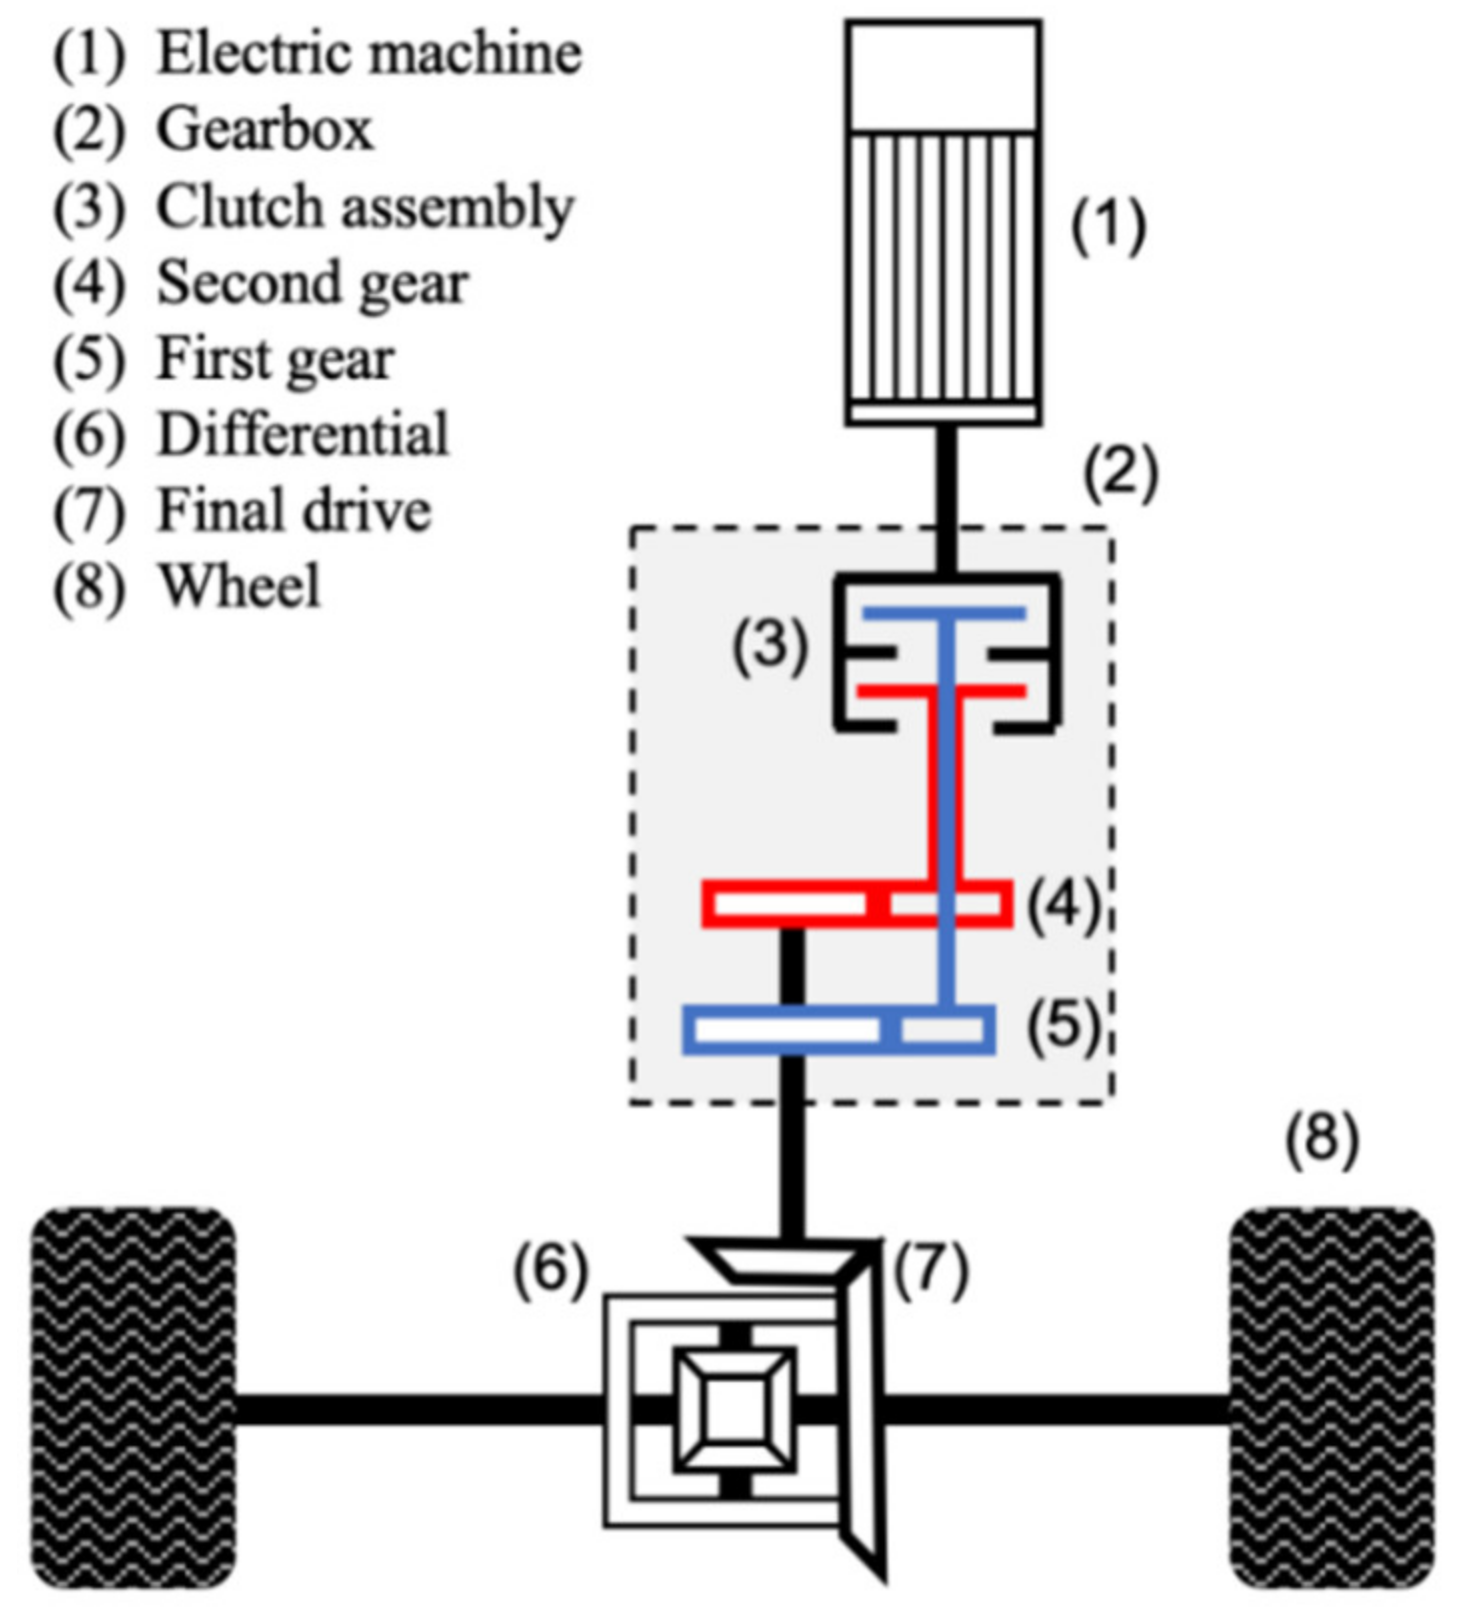
Based on a preliminary analysis, this work focuses on two gearbox alternatives that are estimated to have the most potential in an electric city bus. The first is a two-speed dual clutch gearbox (Figure 1) and the second is a traditional belt CVT without a torque converter. The model for the two-speed alternative includes both design (gear ratios) and operation (shifting policy) optimization levels. By contrast the CVT model simply selects, at each time step, the gear ratio that represents the highest efficiency operating point of the motor and the inverter.
2.2. Quasi-Static Modeling of Vehicle Dynamics
EV and ECB powertrain models have been presented in detail in previous work [20,21,22]. A comprehensive physics-based dynamic ECB model is presented and validated with measurement data in [22]. The model was found accurate but computationally intensive, which limited the usefulness of the model for powertrain design.
Quasi-static, or backward progressing, modeling provides a computationally light alternative to dynamic models that make use of differential equations to describe the system. A quasi-static approach is feasible in research and design applications where fast transients are not the central focus. The backward modeling approach means that the input to the model is a specific driving cycle, which is a presentation of the vehicle speed as a function of time. The powertrain load computation flows from the wheels towards the power source, such as a traction motor.
Discrete time is used instead of continuous time for the numerical computation. In each step, the system is interpreted as a static system. This approach is suitable for slow phenomena, such as energy consumption on a driving cycle. Because this approach is computationally light, a large number of topology and component size options can be explored in a short time. This is fitting to the multispeed gearbox selection problem, which requires a search for optimal gear ratios.
The following assumptions are included in the modeling:
- Energy consumption is computed from the inverter input terminals
- Constant efficiency is applied for the powertrain components other than the motor and the inverter
- The motor is used for regenerative braking within its torque limits while the rest of the braking demand is provided with the mechanical disc brakes if needed
- Regenerative braking is never limited by a fully charged battery
- The motor control electronics provide sufficient response to gear change induced step changes in motor reference speed
- The road profile has zero altitude variation
- Only forward motion and longitudinal forces influence the energy consumption
- Auxiliary power for heat and air conditioning is discarded
The modeled ECB dynamics, gear changing policy, and gear ratio optimization models are introduced in Section 2.2, Section 2.3 and Section 2.4. A specific configuration of the model, in which parameter values from the case study are applied, is discussed in Section 3.
2.3. Vehicle Dynamics
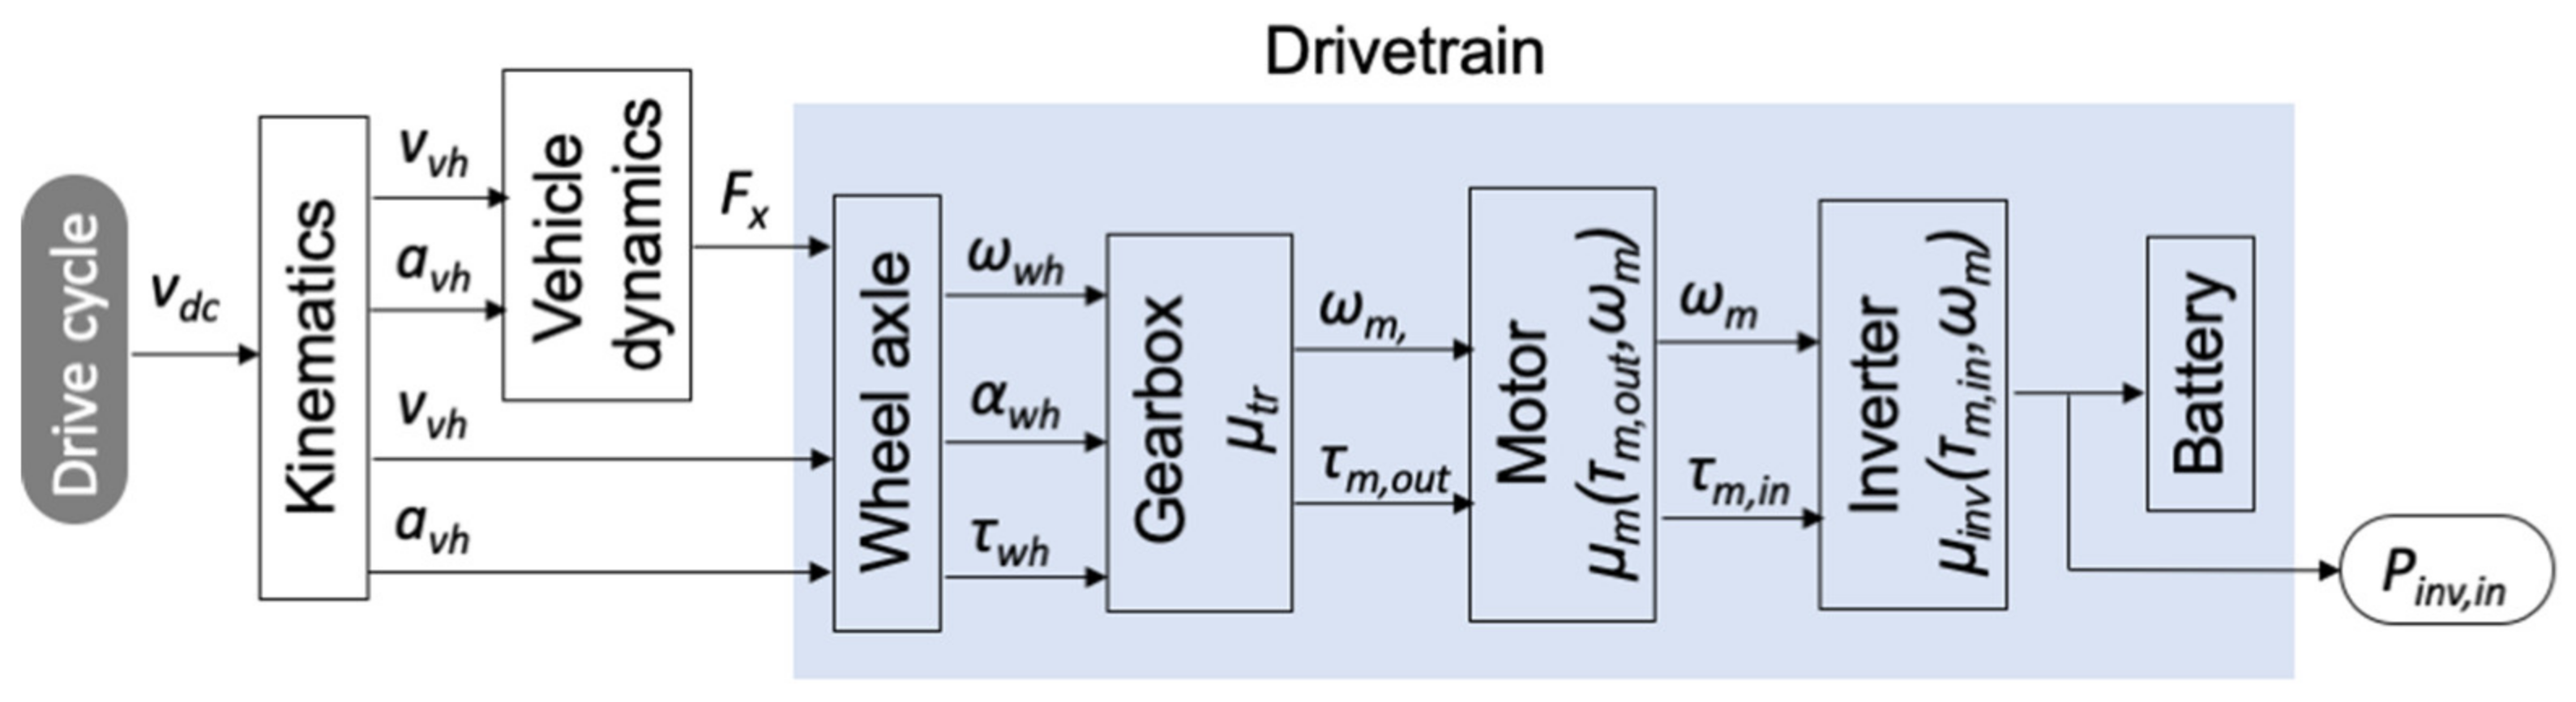
The computation starts from the driving cycle vdc(k), which gives the target speed for each time step k. The computation flows from the driving cycle to the inverter (Figure 2).
Vehicle speed and acceleration are computed by
where vvh(k) is the vehicle speed, avh(k) is acceleration, and h is the time step duration, which is constant for the cycle. Wheel axle angular speed and acceleration at the wheel are given by dividing corresponding vehicle speed and acceleration with the tire radius according to
where ωvh(k) is axle angular speed, αvh(k) is the axle angular acceleration, and rwh is the tire radius. The torque on the axle τwh(k), required for thrusting the vehicle forward at a given speed and acceleration, is determined by the tractive force Fx(k), which is the sum of the forces acting on the vehicle body.
Rolling resistance, aerodynamic drag and inertia forces as well as the resulting axle torque are given by
where M is the vehicle mass, g is gravitational acceleration, cr is the rolling resistance coefficient, cw is the aerodynamic drag coefficient, ρ is air density, and A is the frontal area of the vehicle. In the next step of the calculation flow, the torque and speed of the rear wheels are conveyed to the motor. The gearbox gear ratio determines the conversion, and in the case of the motor torque, the rotational inertia must also be taken into account. The motor speed ωm(k) and the torque τm(k) are given by
where i is the total gear ratio, ηtr is the transmission efficiency, ηgb is the gearbox efficiency and Im is the motor moment of inertia. Finally, the motor input power requirement Pm,in is computed by
where ηm(ωm(k), τm(k)) is the motor efficiency function, and where the arguments are the motor speed and torque. Likewise, ηinv(ωm(k), τm(k)) is the inverter efficiency function. In the case of regenerative braking, the efficiencies in Equations (8) and (9) become multipliers instead of dividers.
2.4. Optimal Shifting Policy
The shifting policy for the two-speed gearbox is optimized with an integer programming model. The objective is to minimize energy consumption for the driving cycle by assigning the gear that translates to the most efficient motor operating point, taking into account the efficiency loss of shifting events and hysteresis. The optimization model is formulated as
The objective function in Equation (10) to be minimized is the vehicle energy consumption for the cycle, composed of the sum of the consumptions of each time step t in the set {1,..,T}. The consumption for each step has three components: the vehicle propulsion, the actuator energy for the shifting procedure, and the friction loss. The first component, motor propulsion energy demand, is represented by the parameters Ct (C’t), for the low (high) gear. The gearbox has in this case only two gear ratio options to select from, and either one is active at each step, which allows for modeling the gear selection with a single binary variable yt. The formulation in Equation (10) includes this binary variable to switch on and off the consumption parameter that corresponds to the active gear selection at each step. Both the actuator energy and the friction loss are included in the parameter St, which contributes to the objective function at step t. The shifting event at that step is indicated by the binary variable y’t receiving a value of one.
Equations (11)–(13) define the downshift, upshift, and hysteresis constraints, respectively. The downshift constraint in Equation (11) forces the binary variable y’t, which indicates a shifting event, to equal one when the gear indicator binary variable yt changes from one to zero in consecutive time steps. The logic in the constraint Equation (12) is the same as in Equation (11), but the functionality applies to upshifting instead of downshifting.
The hysteresis constraint Equation (13) sets a limit to the shifting frequency. A gear shift is allowed after M time steps have passed since the previous shifting event. The constraint formulation utilizes the binary variable y’t, which receives a value of one when an upshift or downshift occurs in step t and zero otherwise.
The resulting objective function value is returned to the gear ratio optimizer function, which compares the consumption to the previous lowest value and replaces it in the case that the current run returns the lowest value.
2.5. Gear Ratio Optimization
The two-speed gearbox gear ratios function as an input to the vehicle dynamic model and the shifting policy optimization model. The gear ratios are iterated through such that each combination is covered from a range for both gears. Before the gear ratio optimization is initiated, the search scope is determined by setting the starting and ending gear ratios and the increment. For example, a search between ratios 3.0 and 8.0 with a 0.1 increment is represented by the set {3.0, 3.1,…, 7.9, 8.0}. In the following representation, the gear ratio choice set, which contains a sequence of gear ratios, is denoted with list 1 for the first gear and list 2 for the second gear.
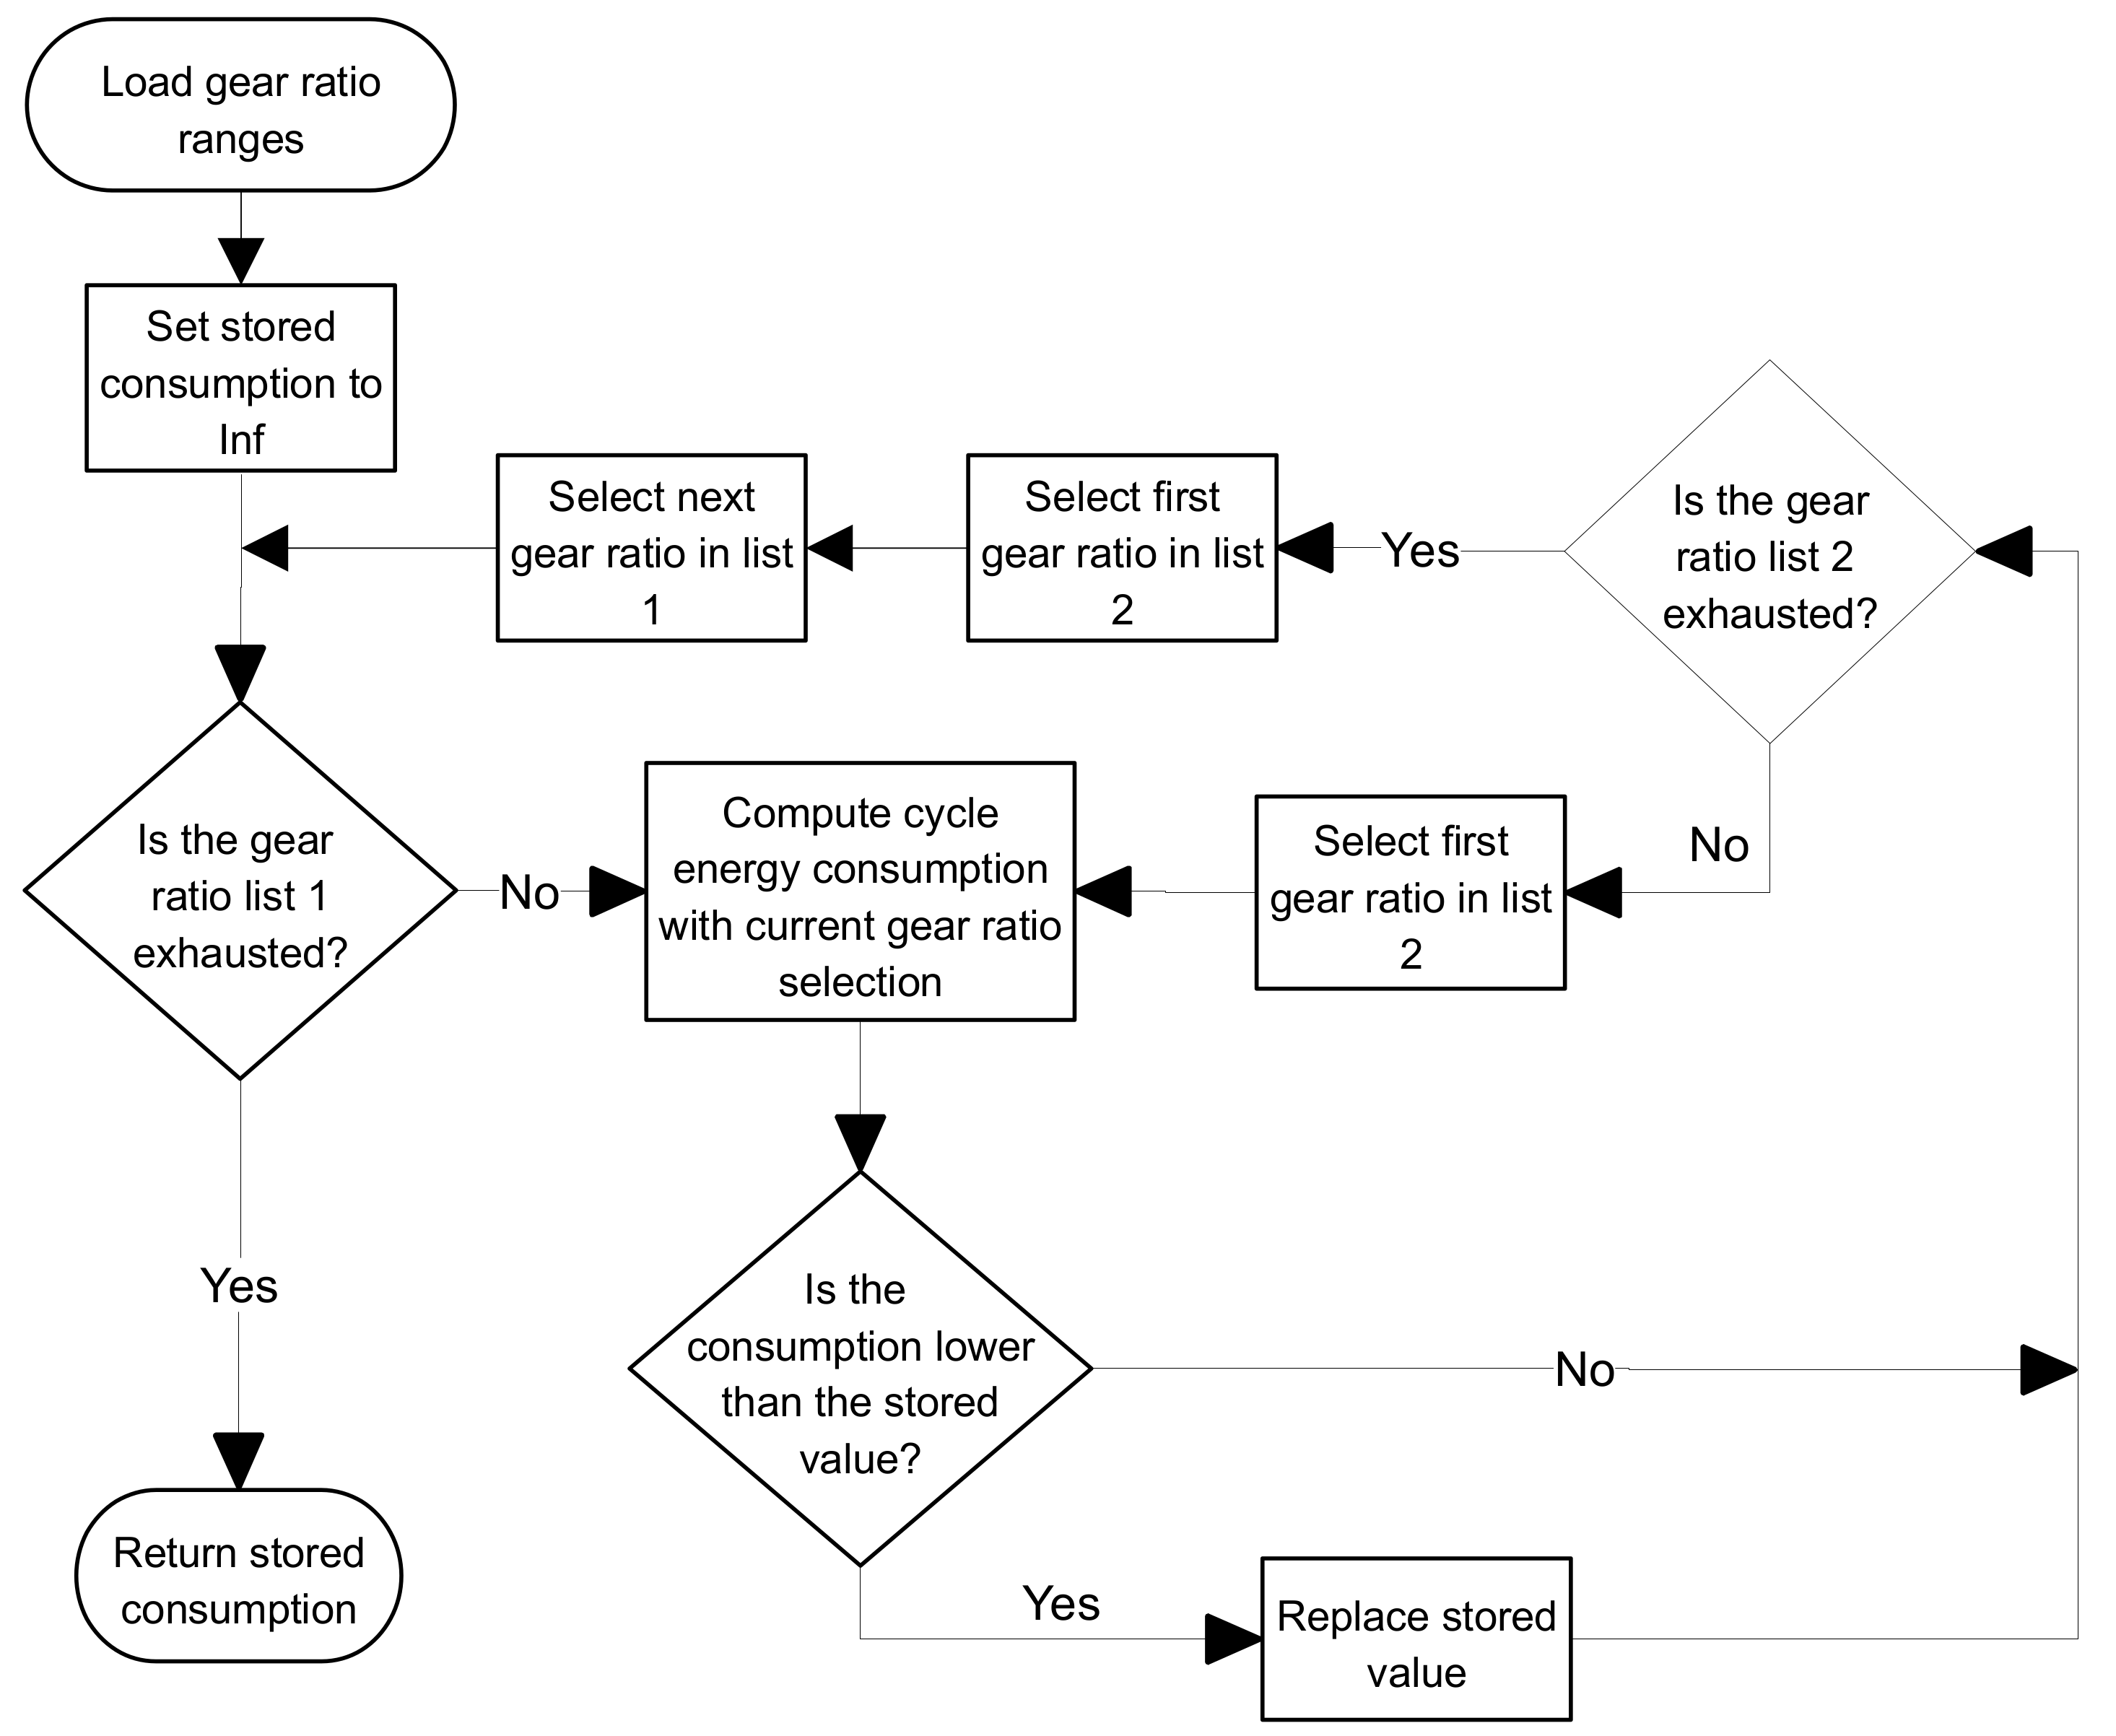
Figure 3 shows the exhaustive search process for the gear ratios that produce the lowest consumption for a specific driving cycle. The process consists of an inner loop for the low gear ratio range and an outer loop for the high gear ratio range of the two-speed gearbox. The cycle energy consumption block in the chart constitutes the vehicle dynamics model, described by Equations (1)–(9) and the gear shifting optimization model in Equations (10)–(13). The energy consumption is therefore computed for each combination of gear ratios from the ranges that are selected at the beginning of the process. Finally, the lowest consumption, represented by the stored value, and the corresponding gear ratios are returned.
3. Numerical Case Study
The case vehicle examined in this work is a fully electric city bus operating on a predetermined suburban route with a fast-charging station at one end of the route. The vehicle was first deployed for continuous operation at the beginning of 2016. The electric motor is a 180 kW permanent magnet synchronous machine (PMSM) and the energy storage system consists of a lithium-titanate (LTO) battery with 690 V nominal voltage and 55 kWh capacity. The bevel type differential has a ratio of 7.0. The curb weight is 10,500 kg and the maximum allowed payload is 5500 kg, which limits the passenger capacity to 78, assuming that the mean passenger mass is 70 kg. A constant 1500 kg load from 18 passengers and the driver was assumed in the case study. Increased mass from the multispeed gearbox options was considered negligible.
3.1. Parameter Values
The parameter values for the case study are presented in Table 1. All the values for the reference single speed transmission are from the work of Vepsäläinen et al. [23], who developed a dynamic simulation model for the case study vehicle. The model has been validated previously based on measurements from multiple electric city buses operating in Finland. In the present work auxiliary power was discarded since it would make no difference for powertrain comparisons.
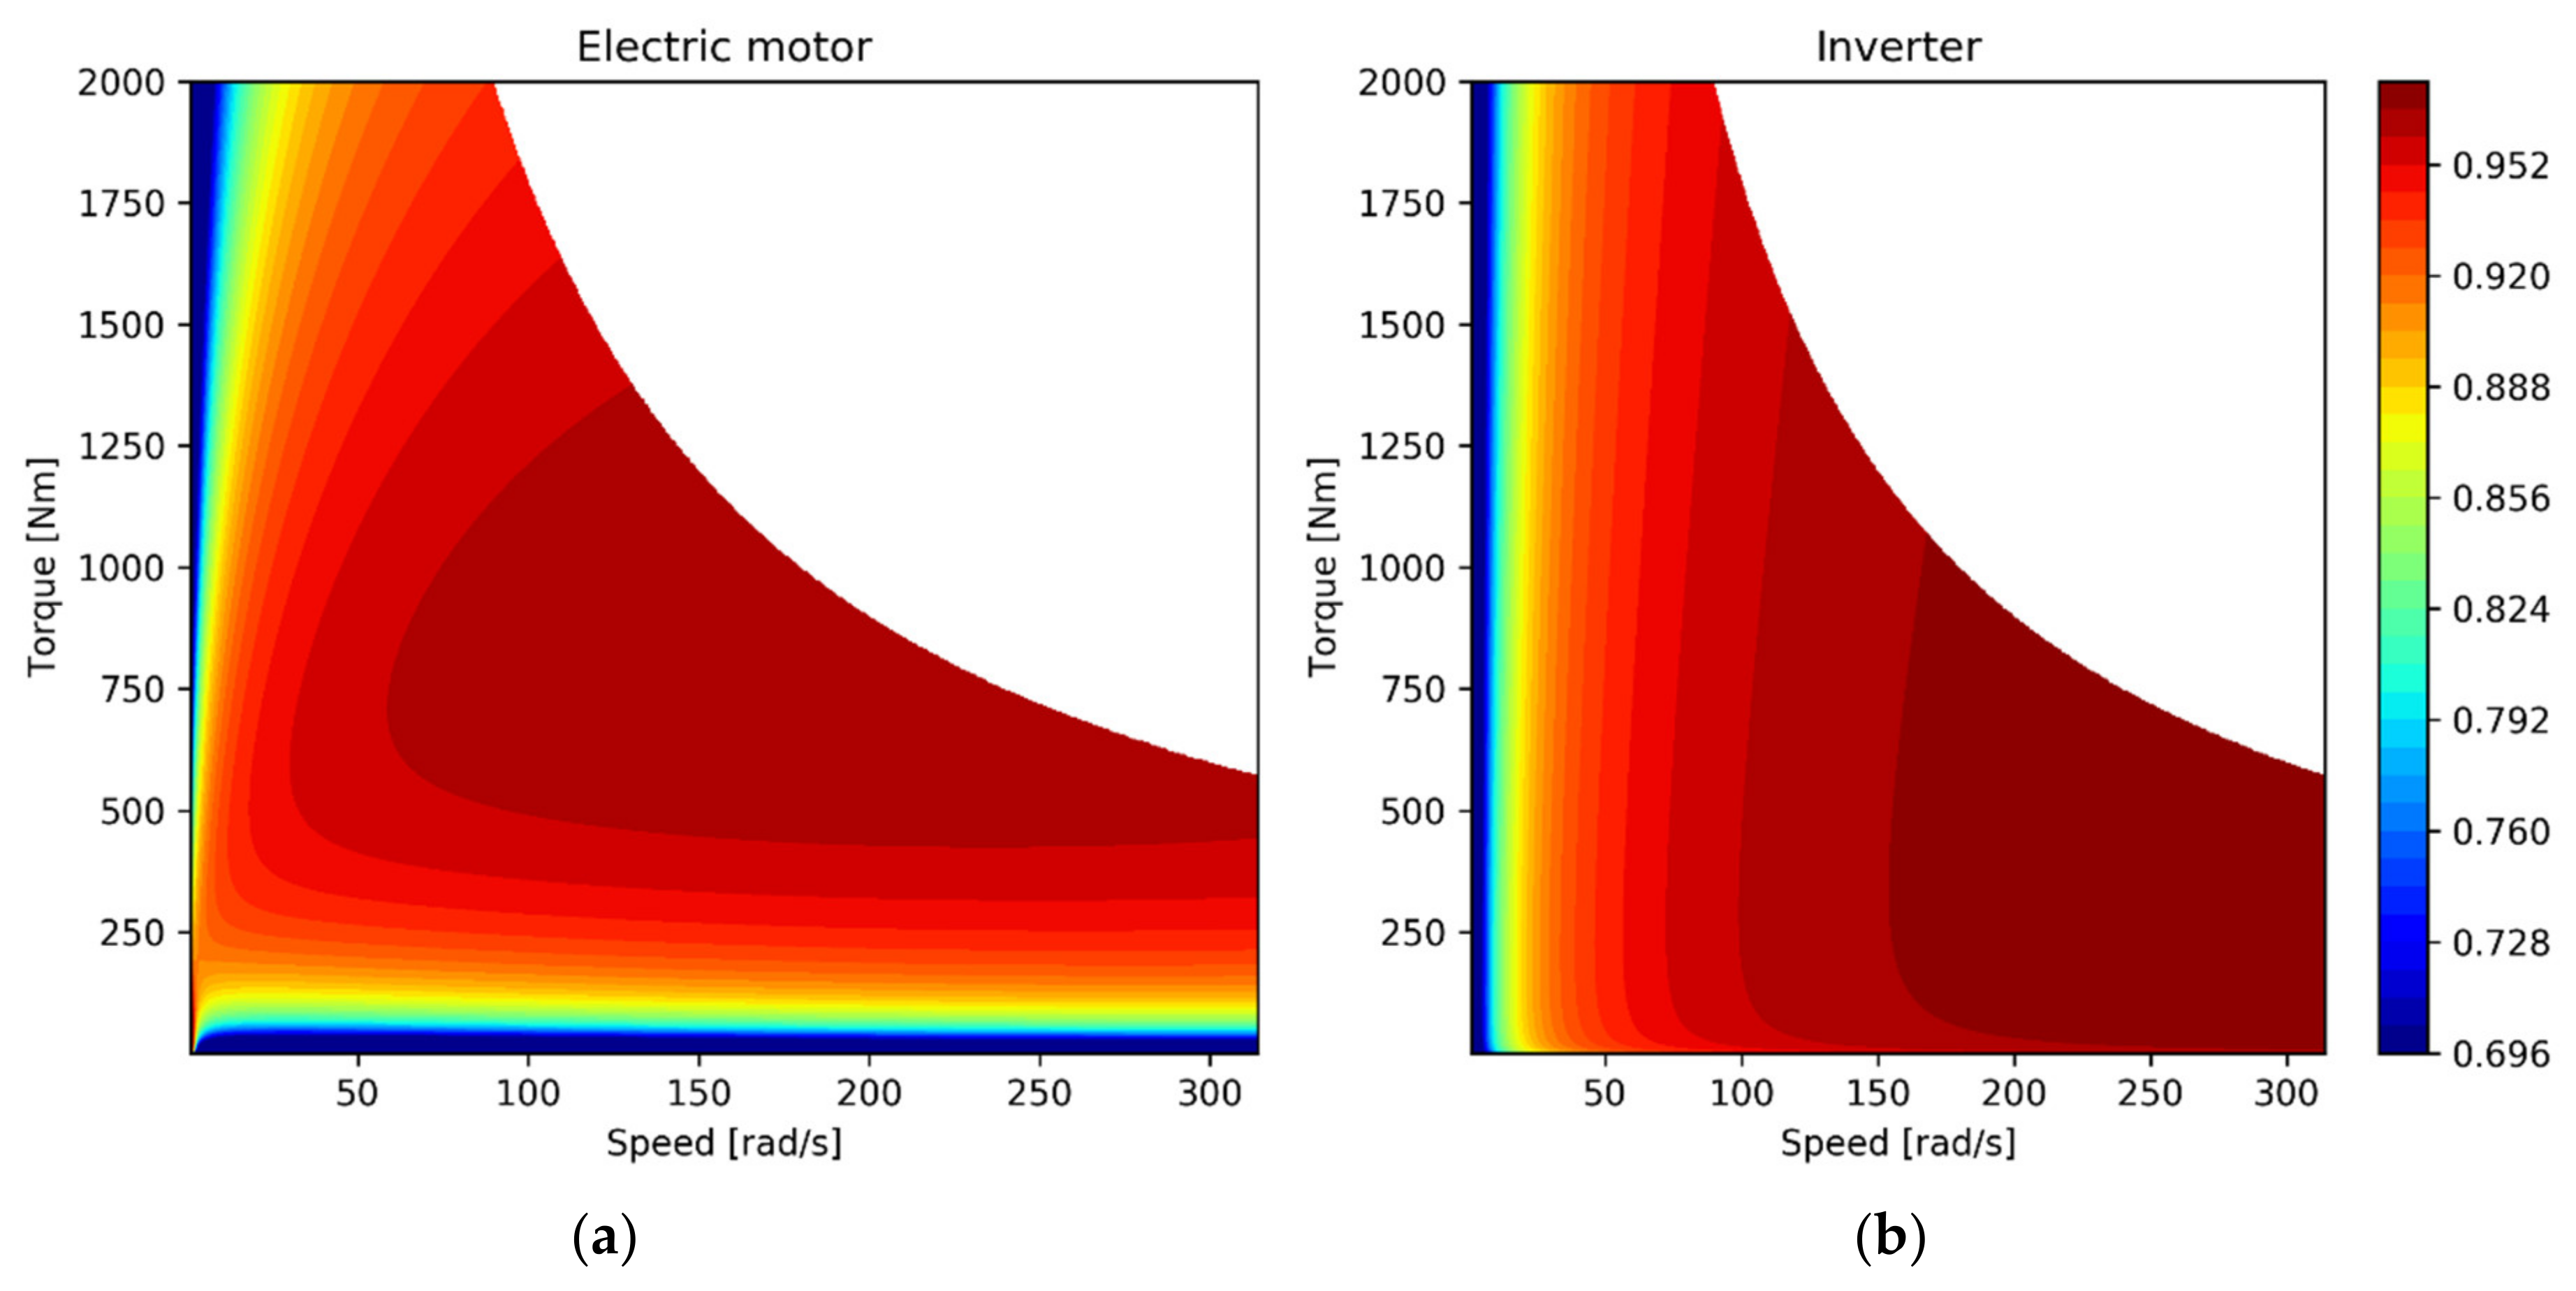
The motor efficiency map model was based on the work of Mahmoudi et al. [24] for PMSM motors. The map that was modeled based on their work was modified by changing the loss coefficients to match the specifications of the case vehicle, which has 180 kW maximum rating motor with 2000 Nm and 314 rad/s limits for torque and speed. Figure 4a shows the motor efficiency map and Figure 4b shows the inverter map. Appendix A presents the equations and parameters values for drawing the maps.
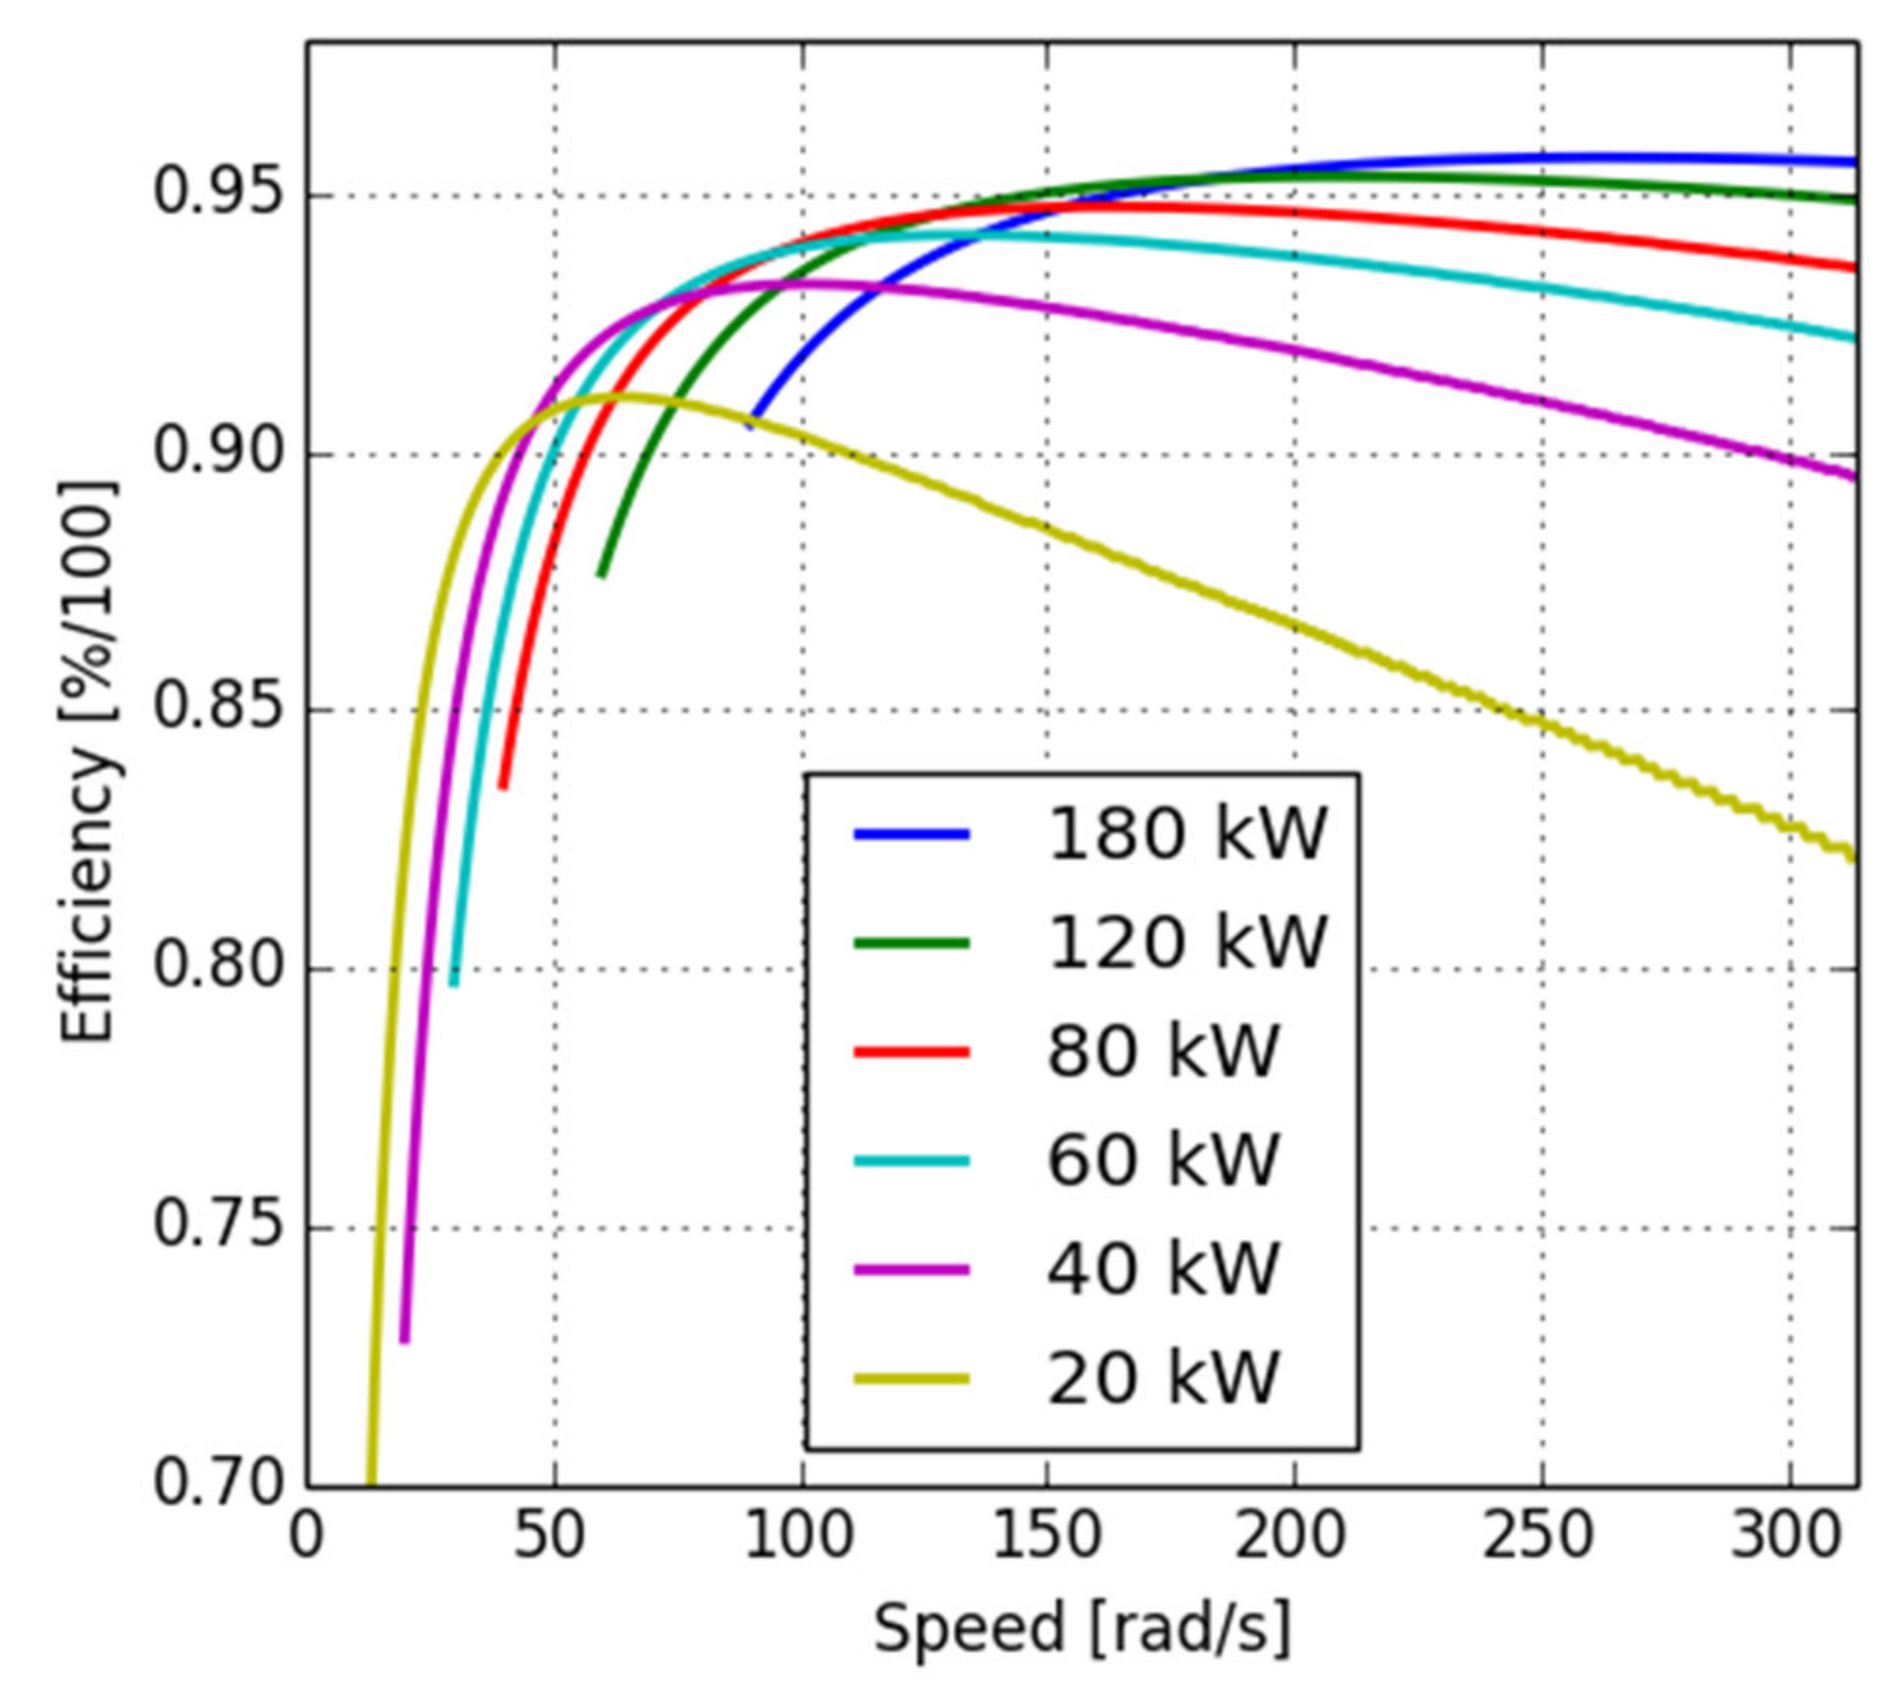
The potential of a multispeed gearbox to increase energy efficiency originates from the option to convert between torque and speed, which moves the motor operating point along a power level contour. The instantaneous motor torque and speed are determined by power demand, gear ratios, and gear selection. The advantage that comes from shifting the point along the curve depends on the efficiency characteristics of the motor and the inverter as well as the power level. Figure 5 shows efficiencies on four power levels for the case vehicle motor and inverter combination.
The transmission and the gearbox efficiencies were assumed to be constant throughout the study. Efficiency of the reference transmission that was comprised of a differential and a final drive only was 0.95. Efficiencies of 0.99 and 0.95 were used for the two-speed and CVT gearboxes, respectively. The total efficiency of the transmission for the multispeed gearbox configurations was computed by multiplying the gearbox and the differential efficiencies. Due to the lack of experimental data that authors are aware of, the value of the shifting loss parameter S was set to zero.
3.2. Driving Cycle Data Acquisition
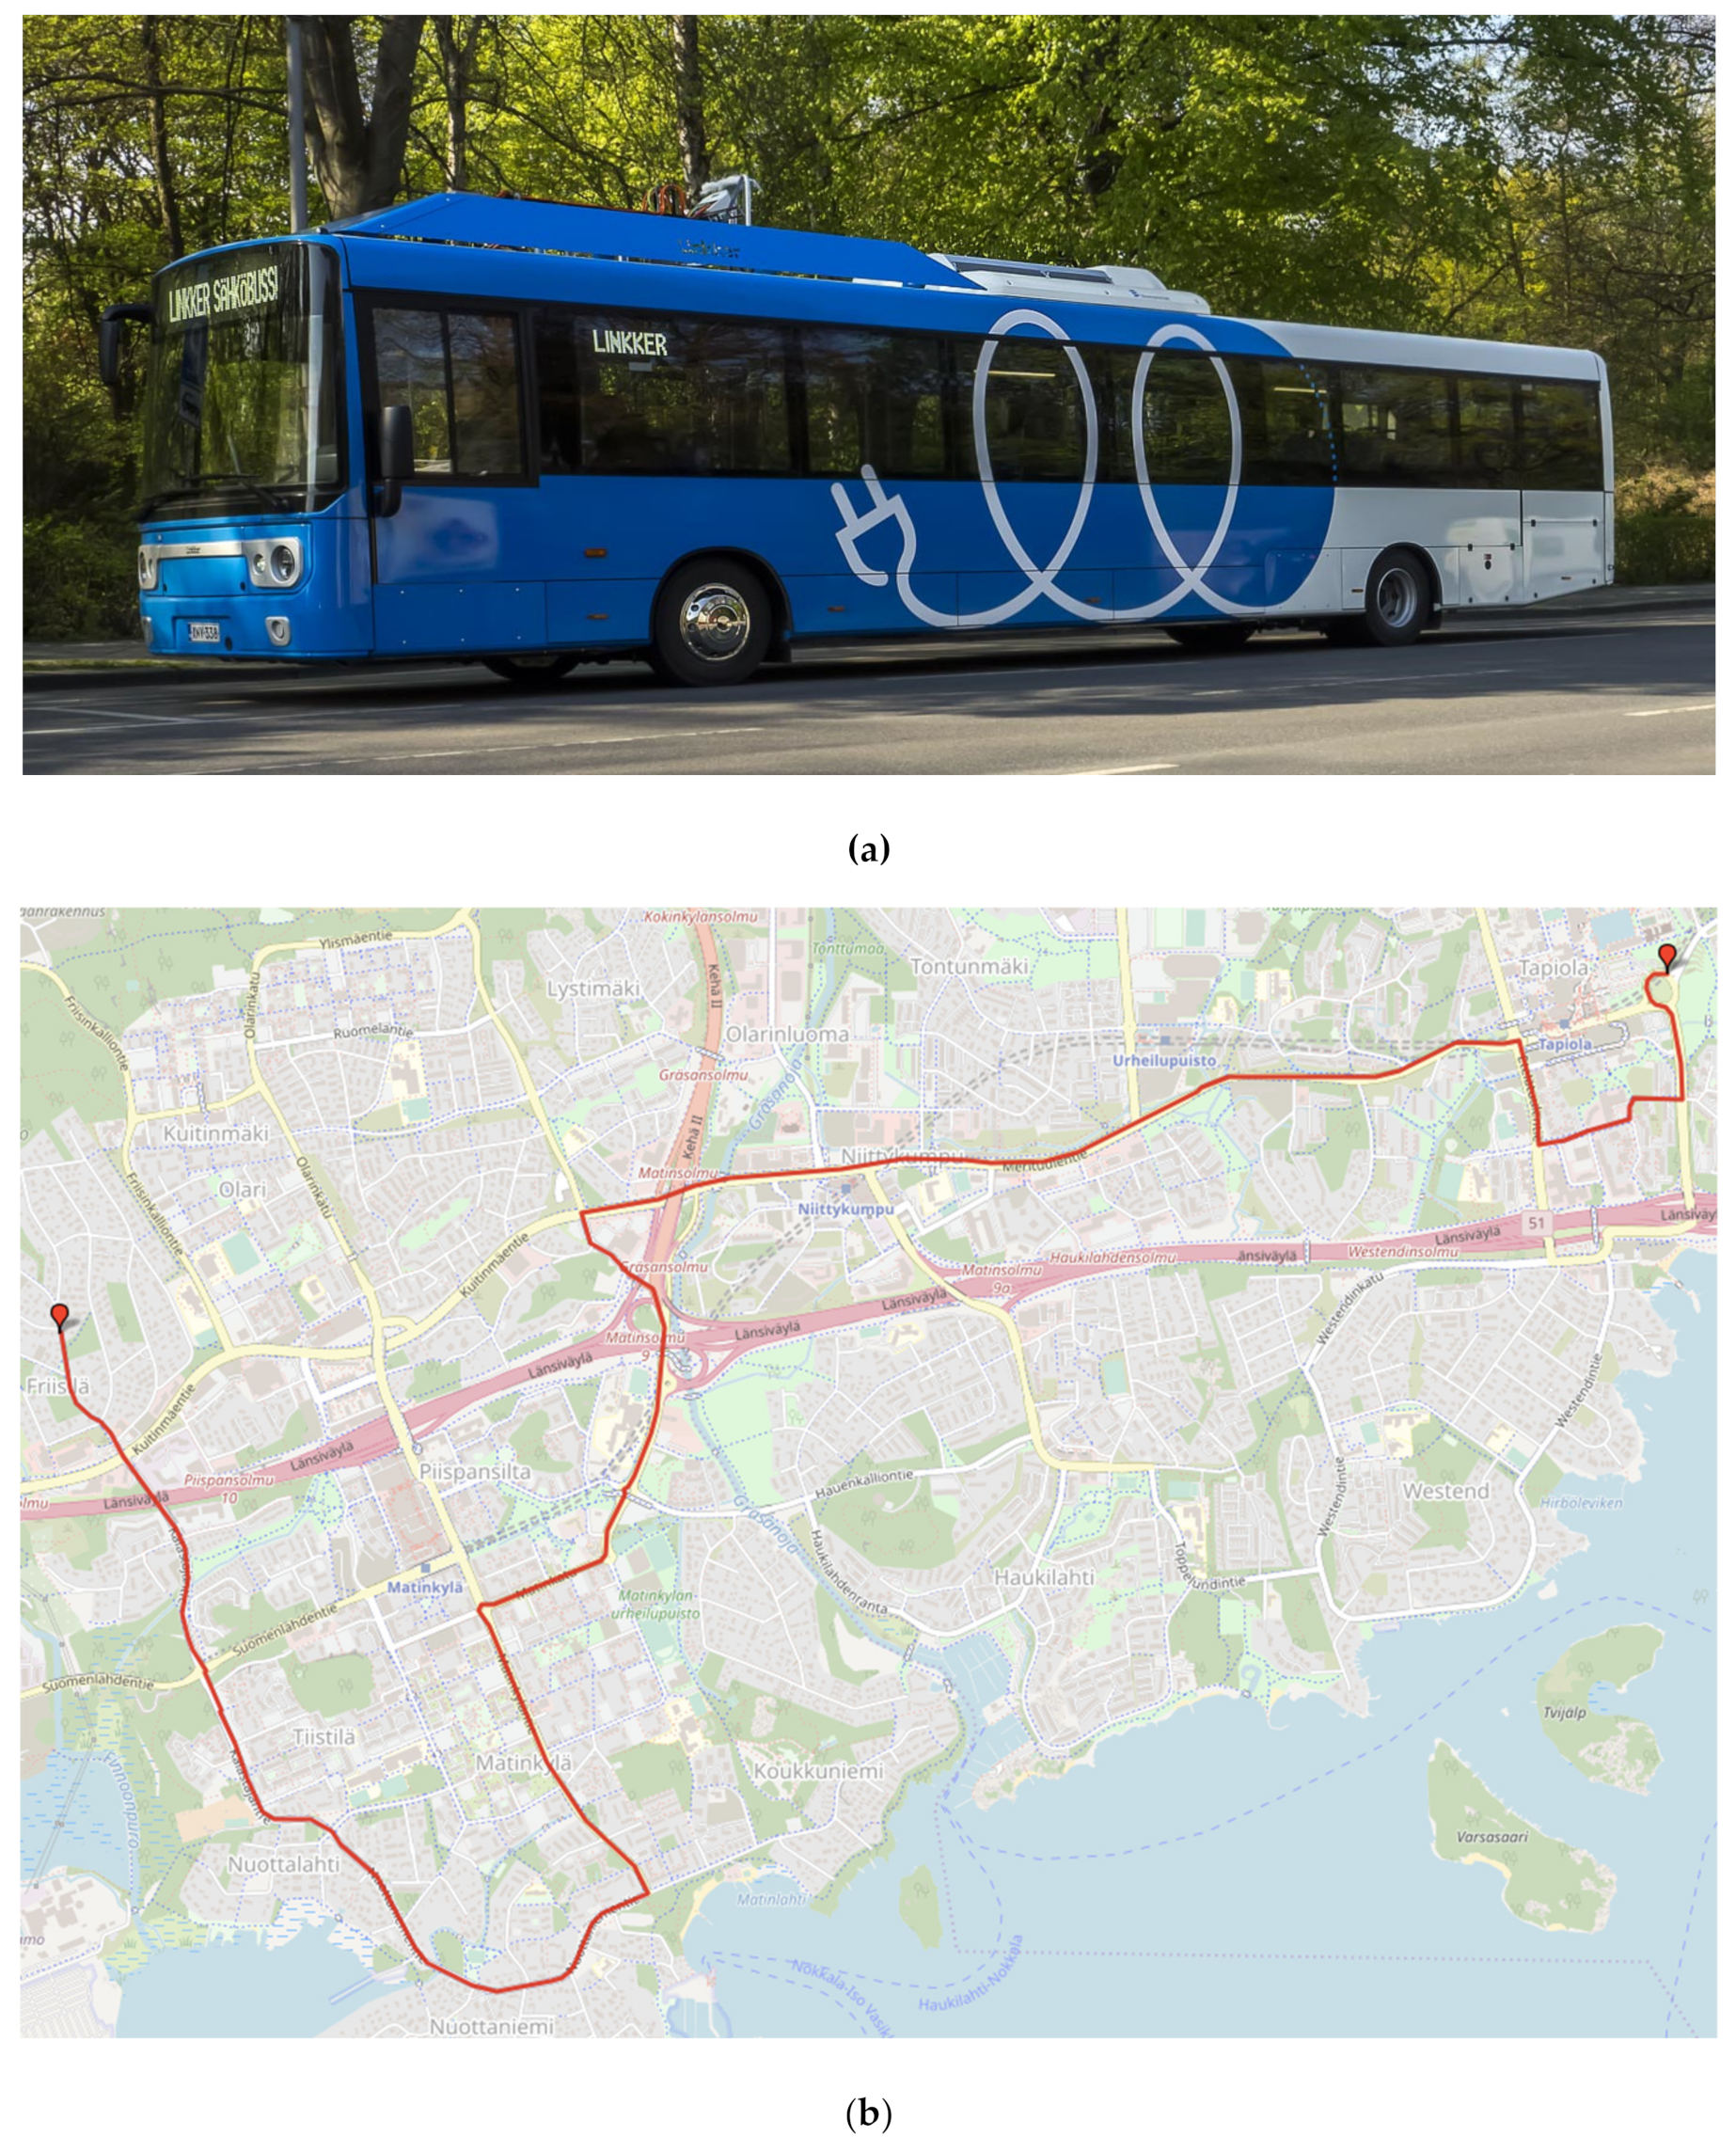
The studied vehicle, shown in Figure 6a, was equipped with an online data acquisition system. Speed and GPS coordinate measurements, and the corresponding timestamps, were acquired from this system. The speed signal was obtained from the anti-lock brake system (ABS) sensors with 1 Hz sampling rate.
The suburban bus route examined is line 11 in Espoo, Finland, shown in Figure 6b. This 10.4 km line is a typical suburban bus line consisting of commutes between local business and residential centers, featuring short urban sections and periods with higher speed limits. The route includes a multilevel stack interchange, which causes the route profile and total distance to vary according to the direction of driving. All the cycles in line 11 considered in this work start from Friisilä terminus and end at Tapiola, excluding the drive from the terminus to the fast-charging station nearby. As all the cycles have the same direction, the distances are the same as well.
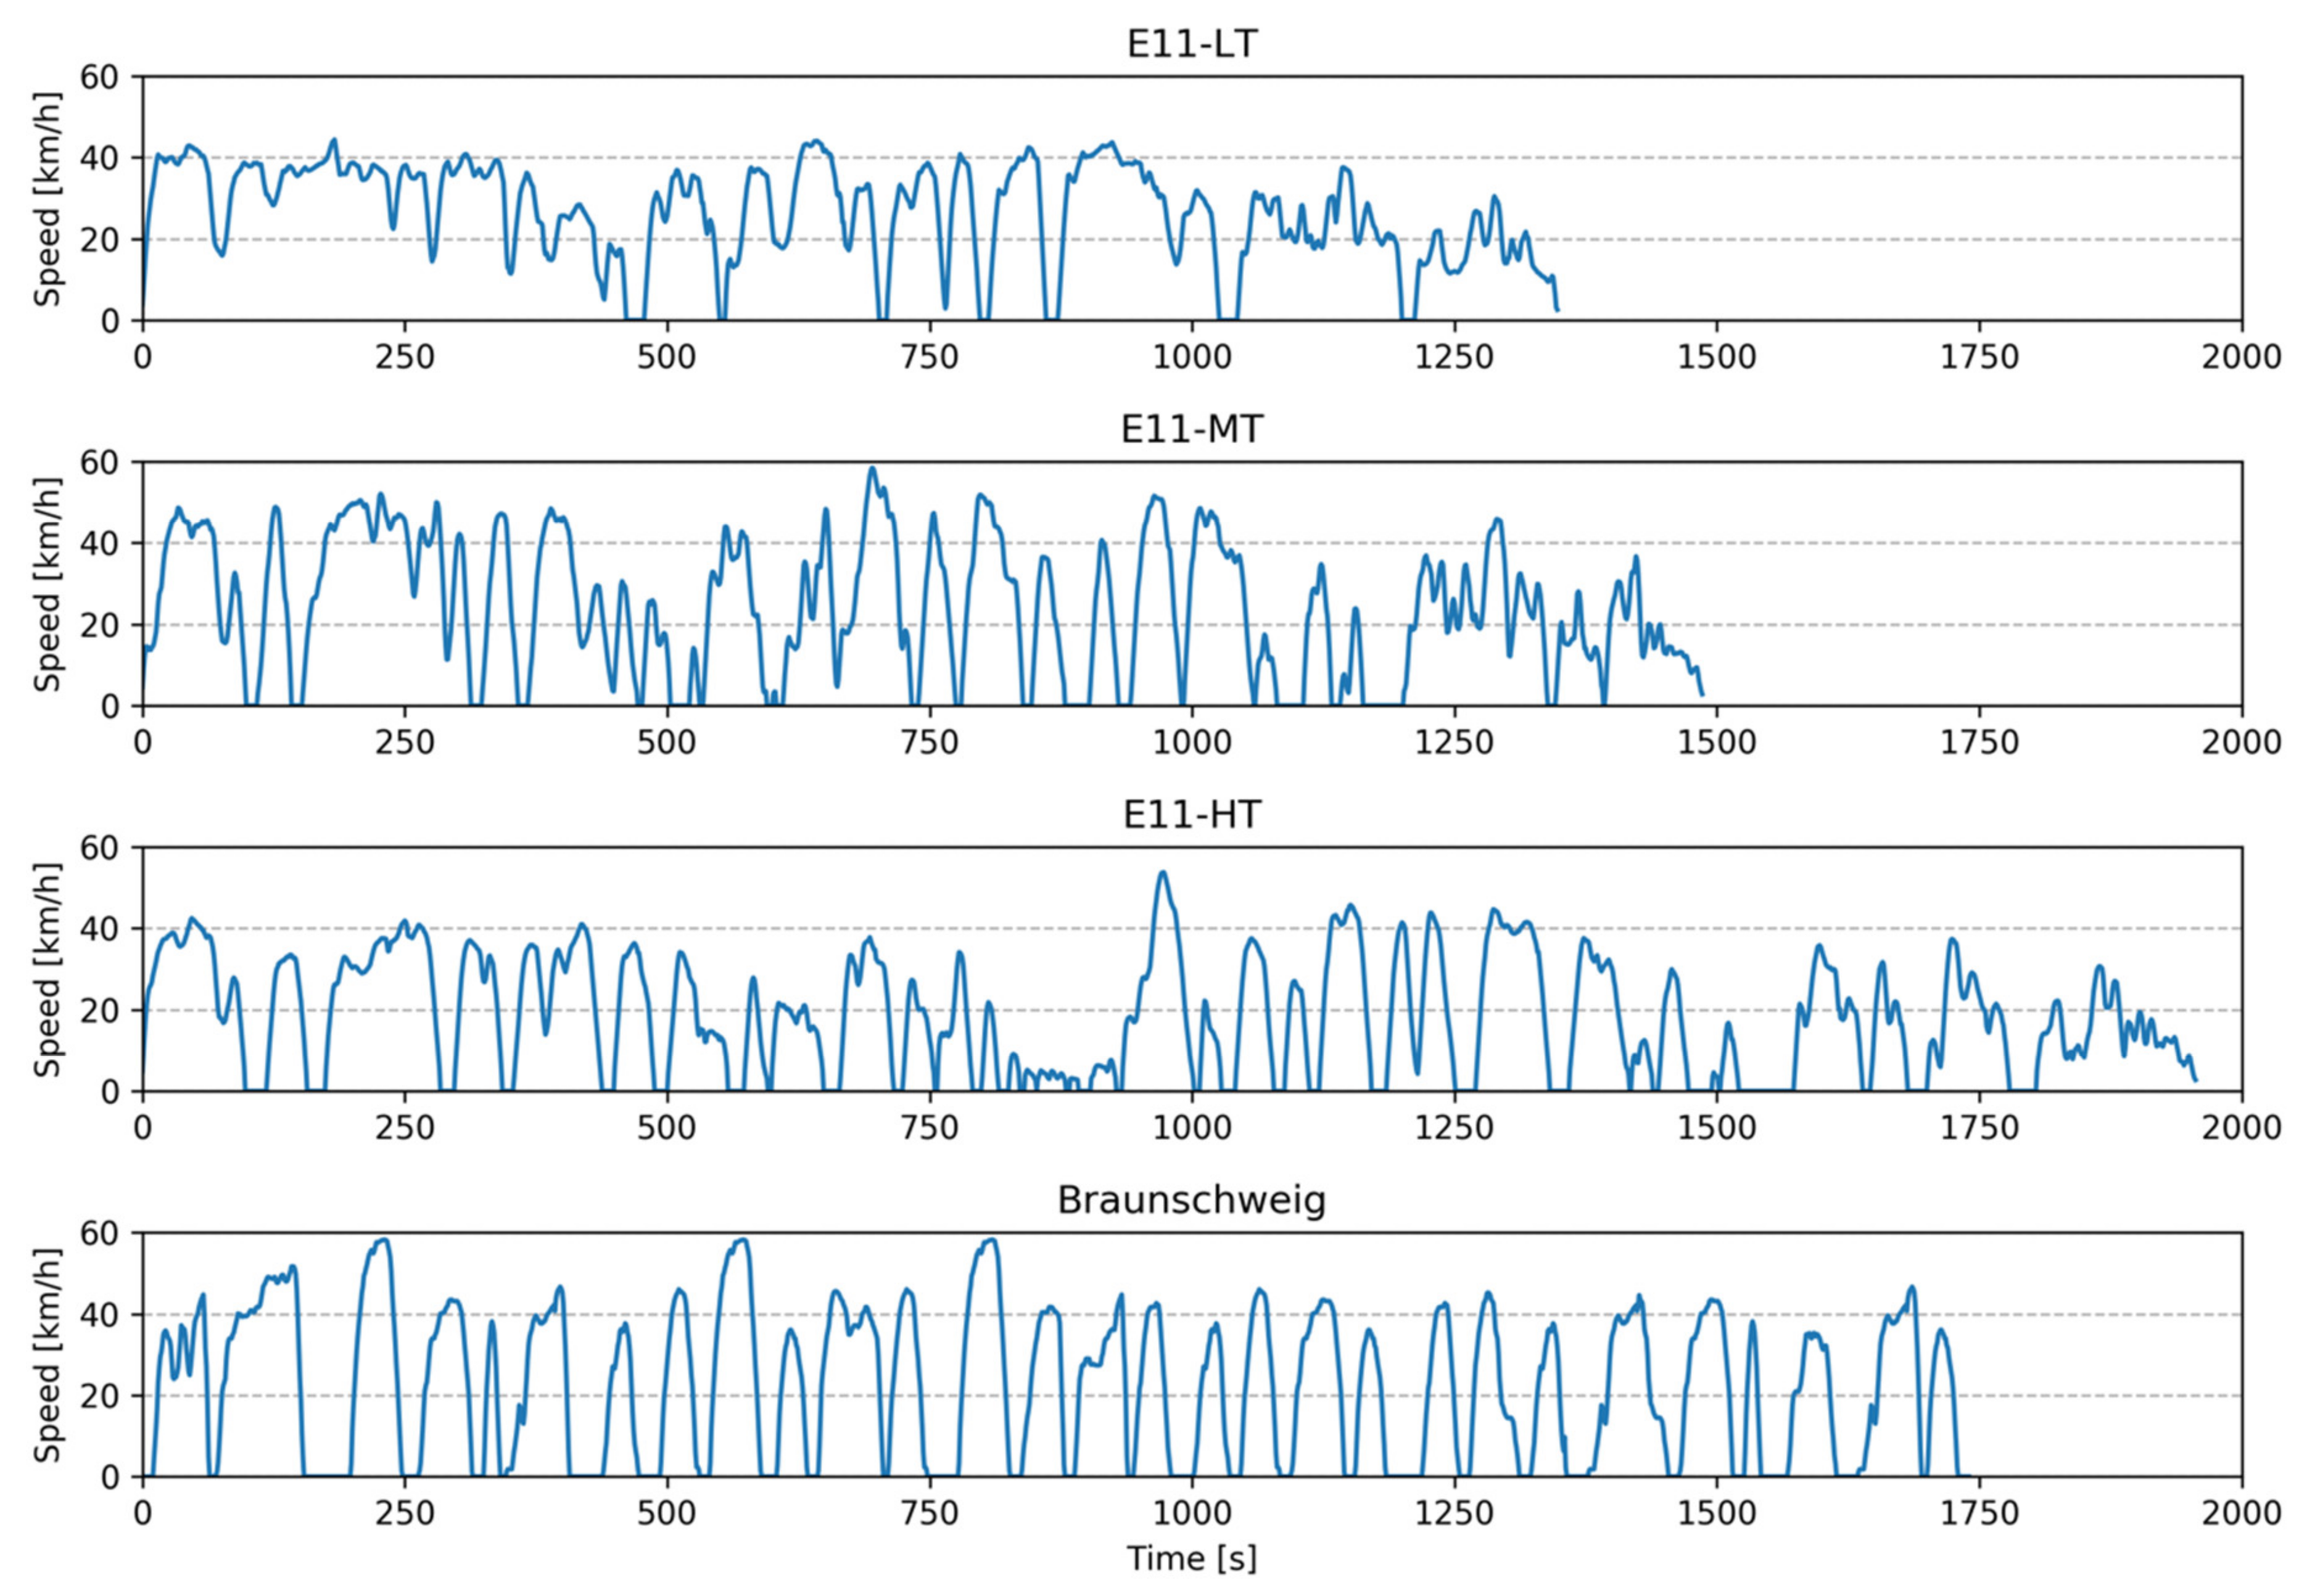
Suburban bus routes are characterized by a large variation in speed profiles between cycles due to daily and hourly passenger and traffic level variation. To account for this, the speed profile of the bus was measured in three distinctly different traffic intensity levels from the line 11. These cycles in line 11 in Espoo are denoted by the abbreviation E11 and extensions LT, MT, and HT are applied, respectively, for the low, medium, and high traffic instances. Two additional cycles are included for comparison. First, the standard Braunschweig bus cycle is commonly used in academic research and in emission testing. Second, a combined cycle E11-C, which has the three E11 cycles in consecutive order, was constructed. Table 2 shows the cycle features and Figure 7 shows the speed profiles.
The altitude profile of the route E11 included a variation of 14 m between the extreme points, and a road grade change of at most one degree per meter. However, in this work the altitude changes were discarded.
3.3. Lifecycle Costs
Lifecycle costs of electric city buses consist of capital, operation and technology replacement costs [1]. Capital costs consist of only the bus purchase cost, as the salvage value at the end of service life is assumed to be zero and the charging device costs are not included. Operation costs include charged electrical energy and maintenance cost. Technology replacement cost is the cost of replacing the battery system after it has reached the end of its useful life. Table 3 describes the lifecycle costs applied in this work.
The electricity price is the average price from 28 EU member states for non-household consumers in the first six months of 2019 and includes all taxes and levies [25]. The other cost parameter values, other than the two-speed gearbox, are from the work of Lajunen [1] and Fries et al. [26]. The service life of the bus is 16 years, while the LTO battery maximum calendar life is only ten years. This indicates that the battery must be replaced at least once.
Transmission complexity and cost are related to the maximum input torque, gear ratio and number of gears. Regarding the additional cost to the transmission due to a two-speed gearbox in all electric vehicles, Ruan et al. [17] present an estimate of 20% based on a statistical model built from a comprehensive transmission cost dataset. This translates to a 2000 € cost margin for the electric bus in the case study in the present work.
3.4. Building and Solving the Model
For the model with a two-speed gearbox, the gear ratios were determined. The optimization objective was to minimize the energy consumption of the vehicle. This process was executed for different cycles separately because the optimal gear ratios and shifting policy vary between cycles.
The gear ratio search range of the two-speed gearbox was split at the single speed differential gear ratio of the reference model in order to retain the vehicle acceleration and top speed performance. The reference single speed ratio was 7.0 and, therefore, the first gear ratio in the two-speed gearbox was set to be larger than 7.1 and the second gear smaller than 7.0. In the gear ratio optimization process, ratios from 2.0 to 7.0 and from 7.1 to 20.0 were covered, for the low and high gear, respectively. Increment for the iteration was set to 0.1.
The simulations were carried out for five driving cycles: The standardized city bus cycle Braunschweig, and three measured cycles from Espoo bus line 11. In addition to the measured cycles E11-LT, E11-MT, and E11-HT, the combined cycle E11-C was used.
The vehicle dynamics, powertrain and gear ratio optimization models were formulated with the Python programming language. The integer programming model was formulated algebraically using Gurobi Python interface functions, and solved with Gurobi 8.1 solver with the default settings. The used solver is based on the branch-and-bound algorithm and comes with additional acceleration techniques, such as cutting planes and preprocessing.
4. Results and Discussion
The results of the simulations are first presented graphically for the reference and the two-speed gearbox case to illustrate optimal gear shift scheduling and efficiency improvement by motor and inverter operation point shifting. Then, differences in energy consumption between the reference and the two-speed gearbox and CVT alternatives are presented numerically to address the first research question. In the final section, a comparison of lifecycle costs of the powertrain alternatives shows that the two-speed gearbox is the cost optimal solution on the standard Braunschweig driving cycle.
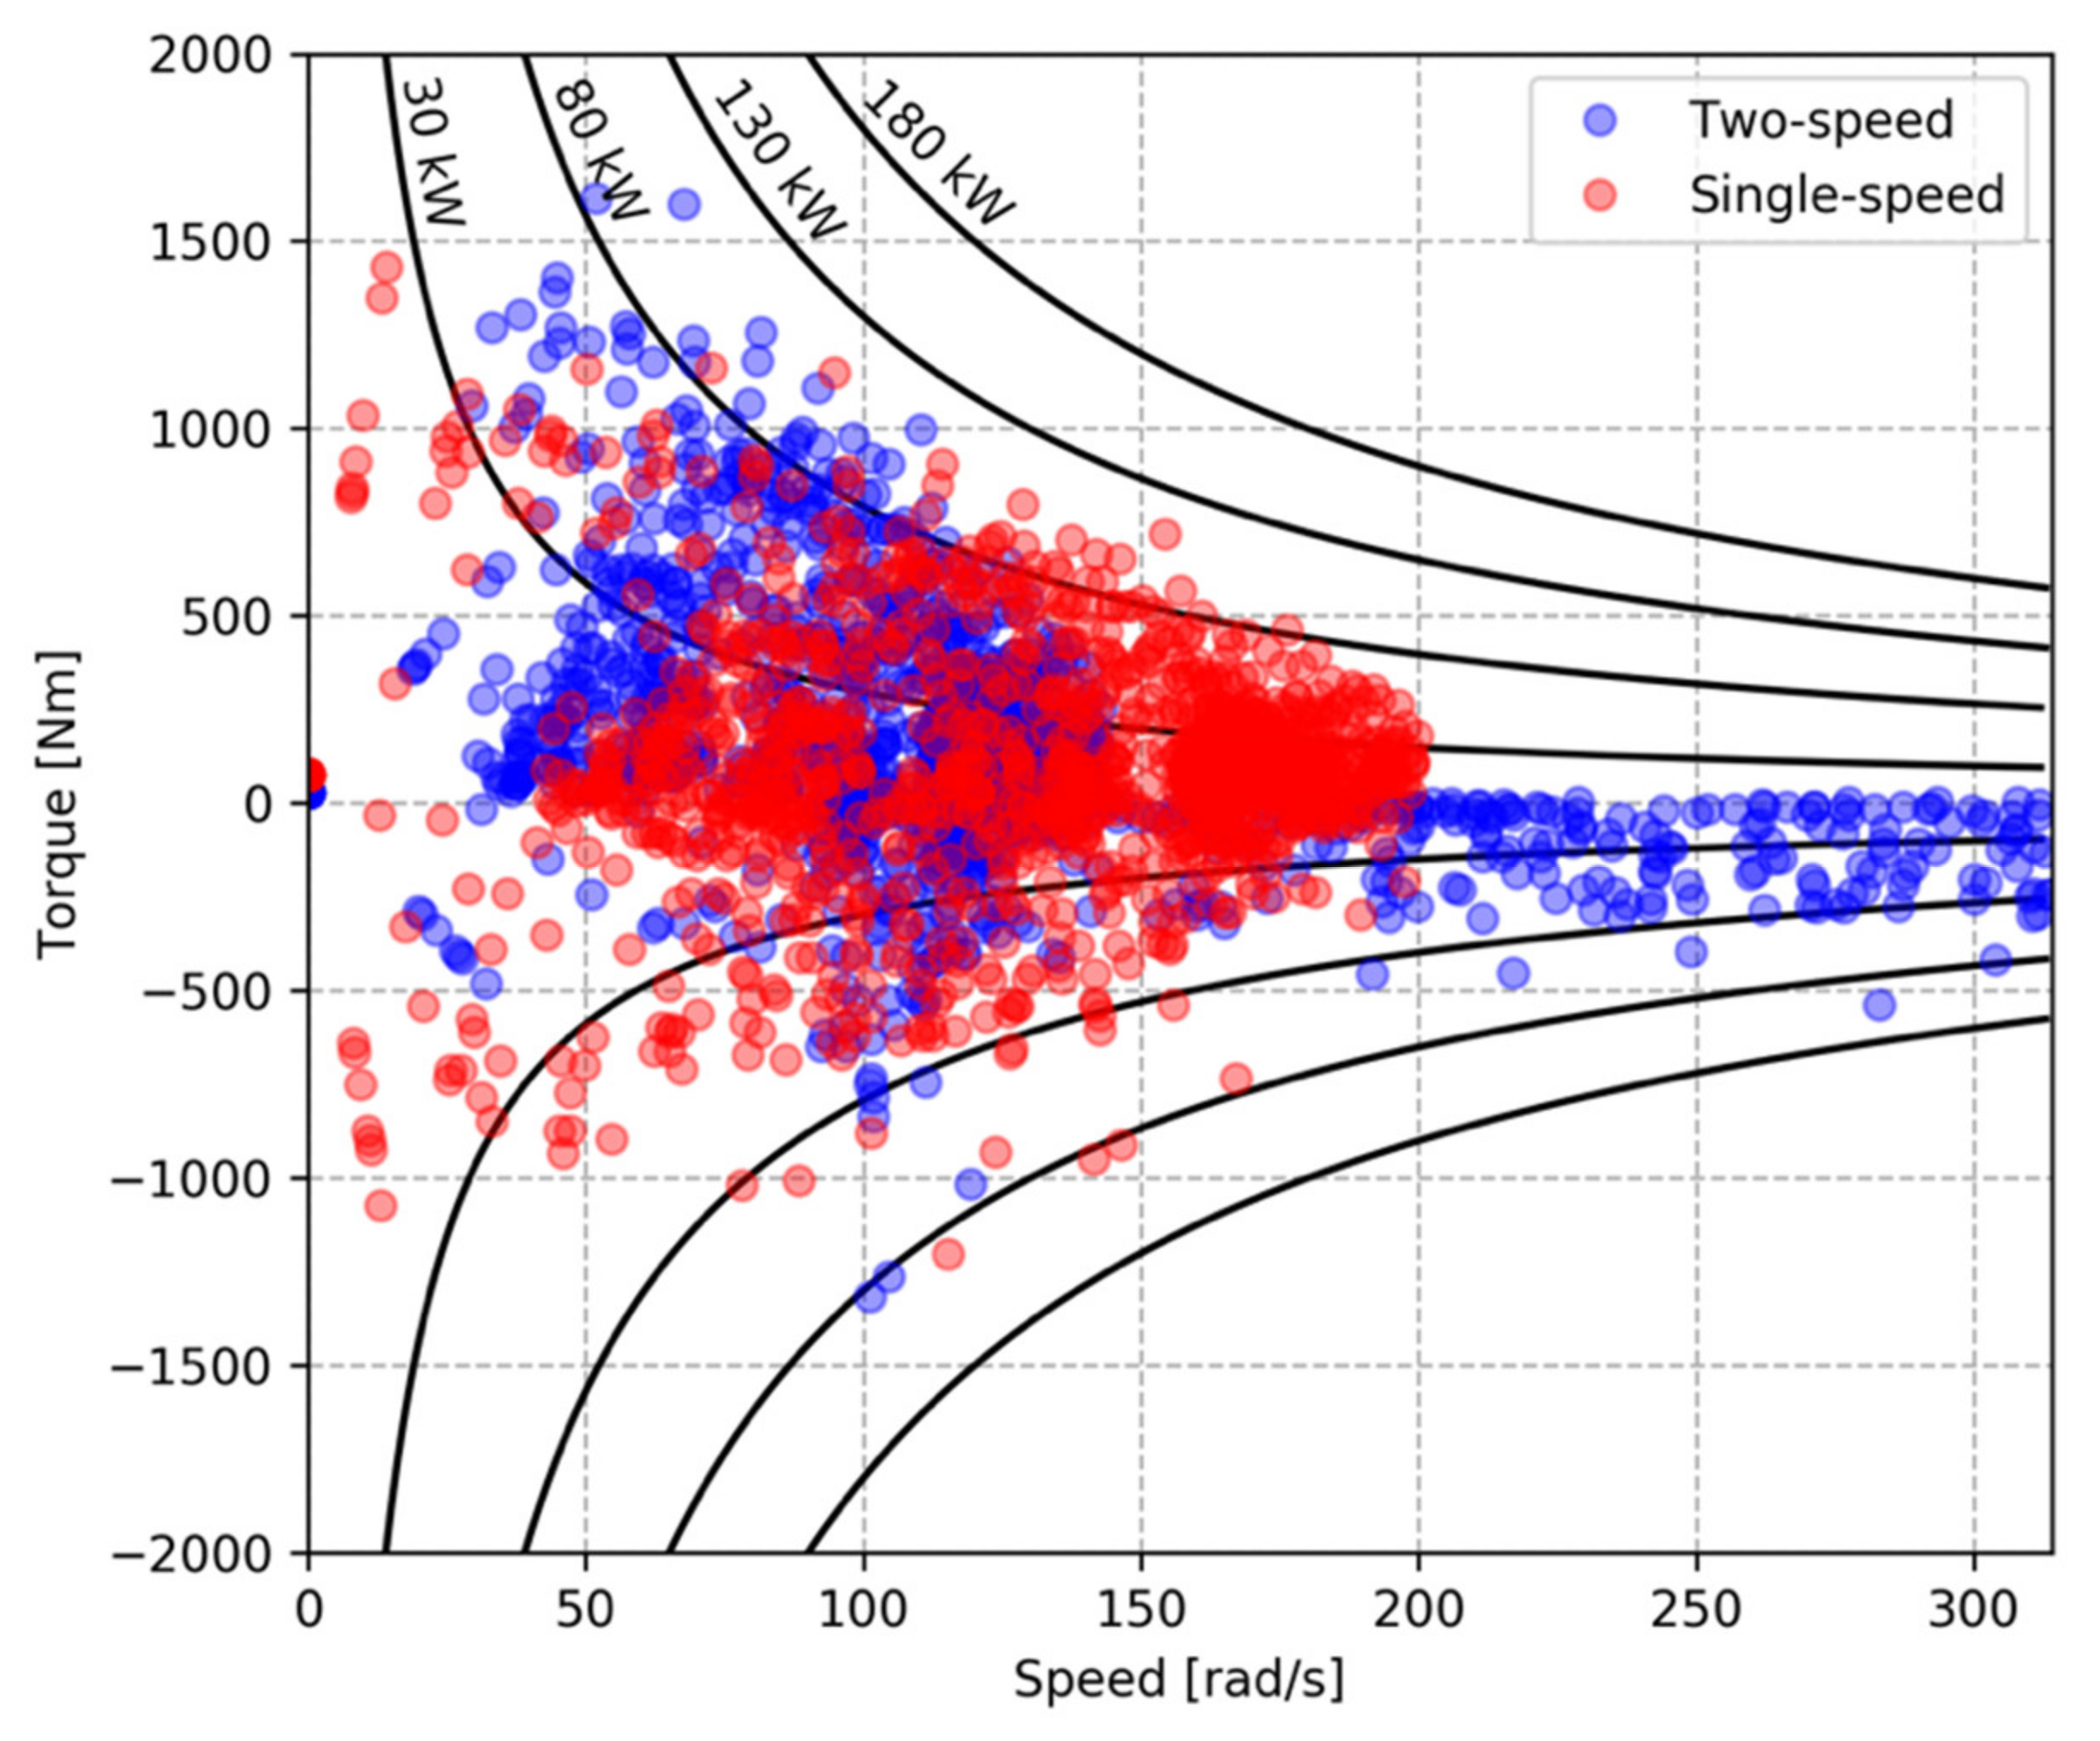
Figure 8 shows the two-speed gearbox induced efficiency improvement in terms of motor operating points on the E11-MT cycle, which had the highest energy consumption on the Espoo 11 route. The most notable effect of the two-speed gearbox is that the operating points were shifted towards lower motor speeds and higher torques in the positive torque region. In the negative torque region during regenerative braking the full speed range of the motor was utilized. More generally, the operating point pattern variation between propulsion and braking is larger for the two-speed gearbox compared to the reference.
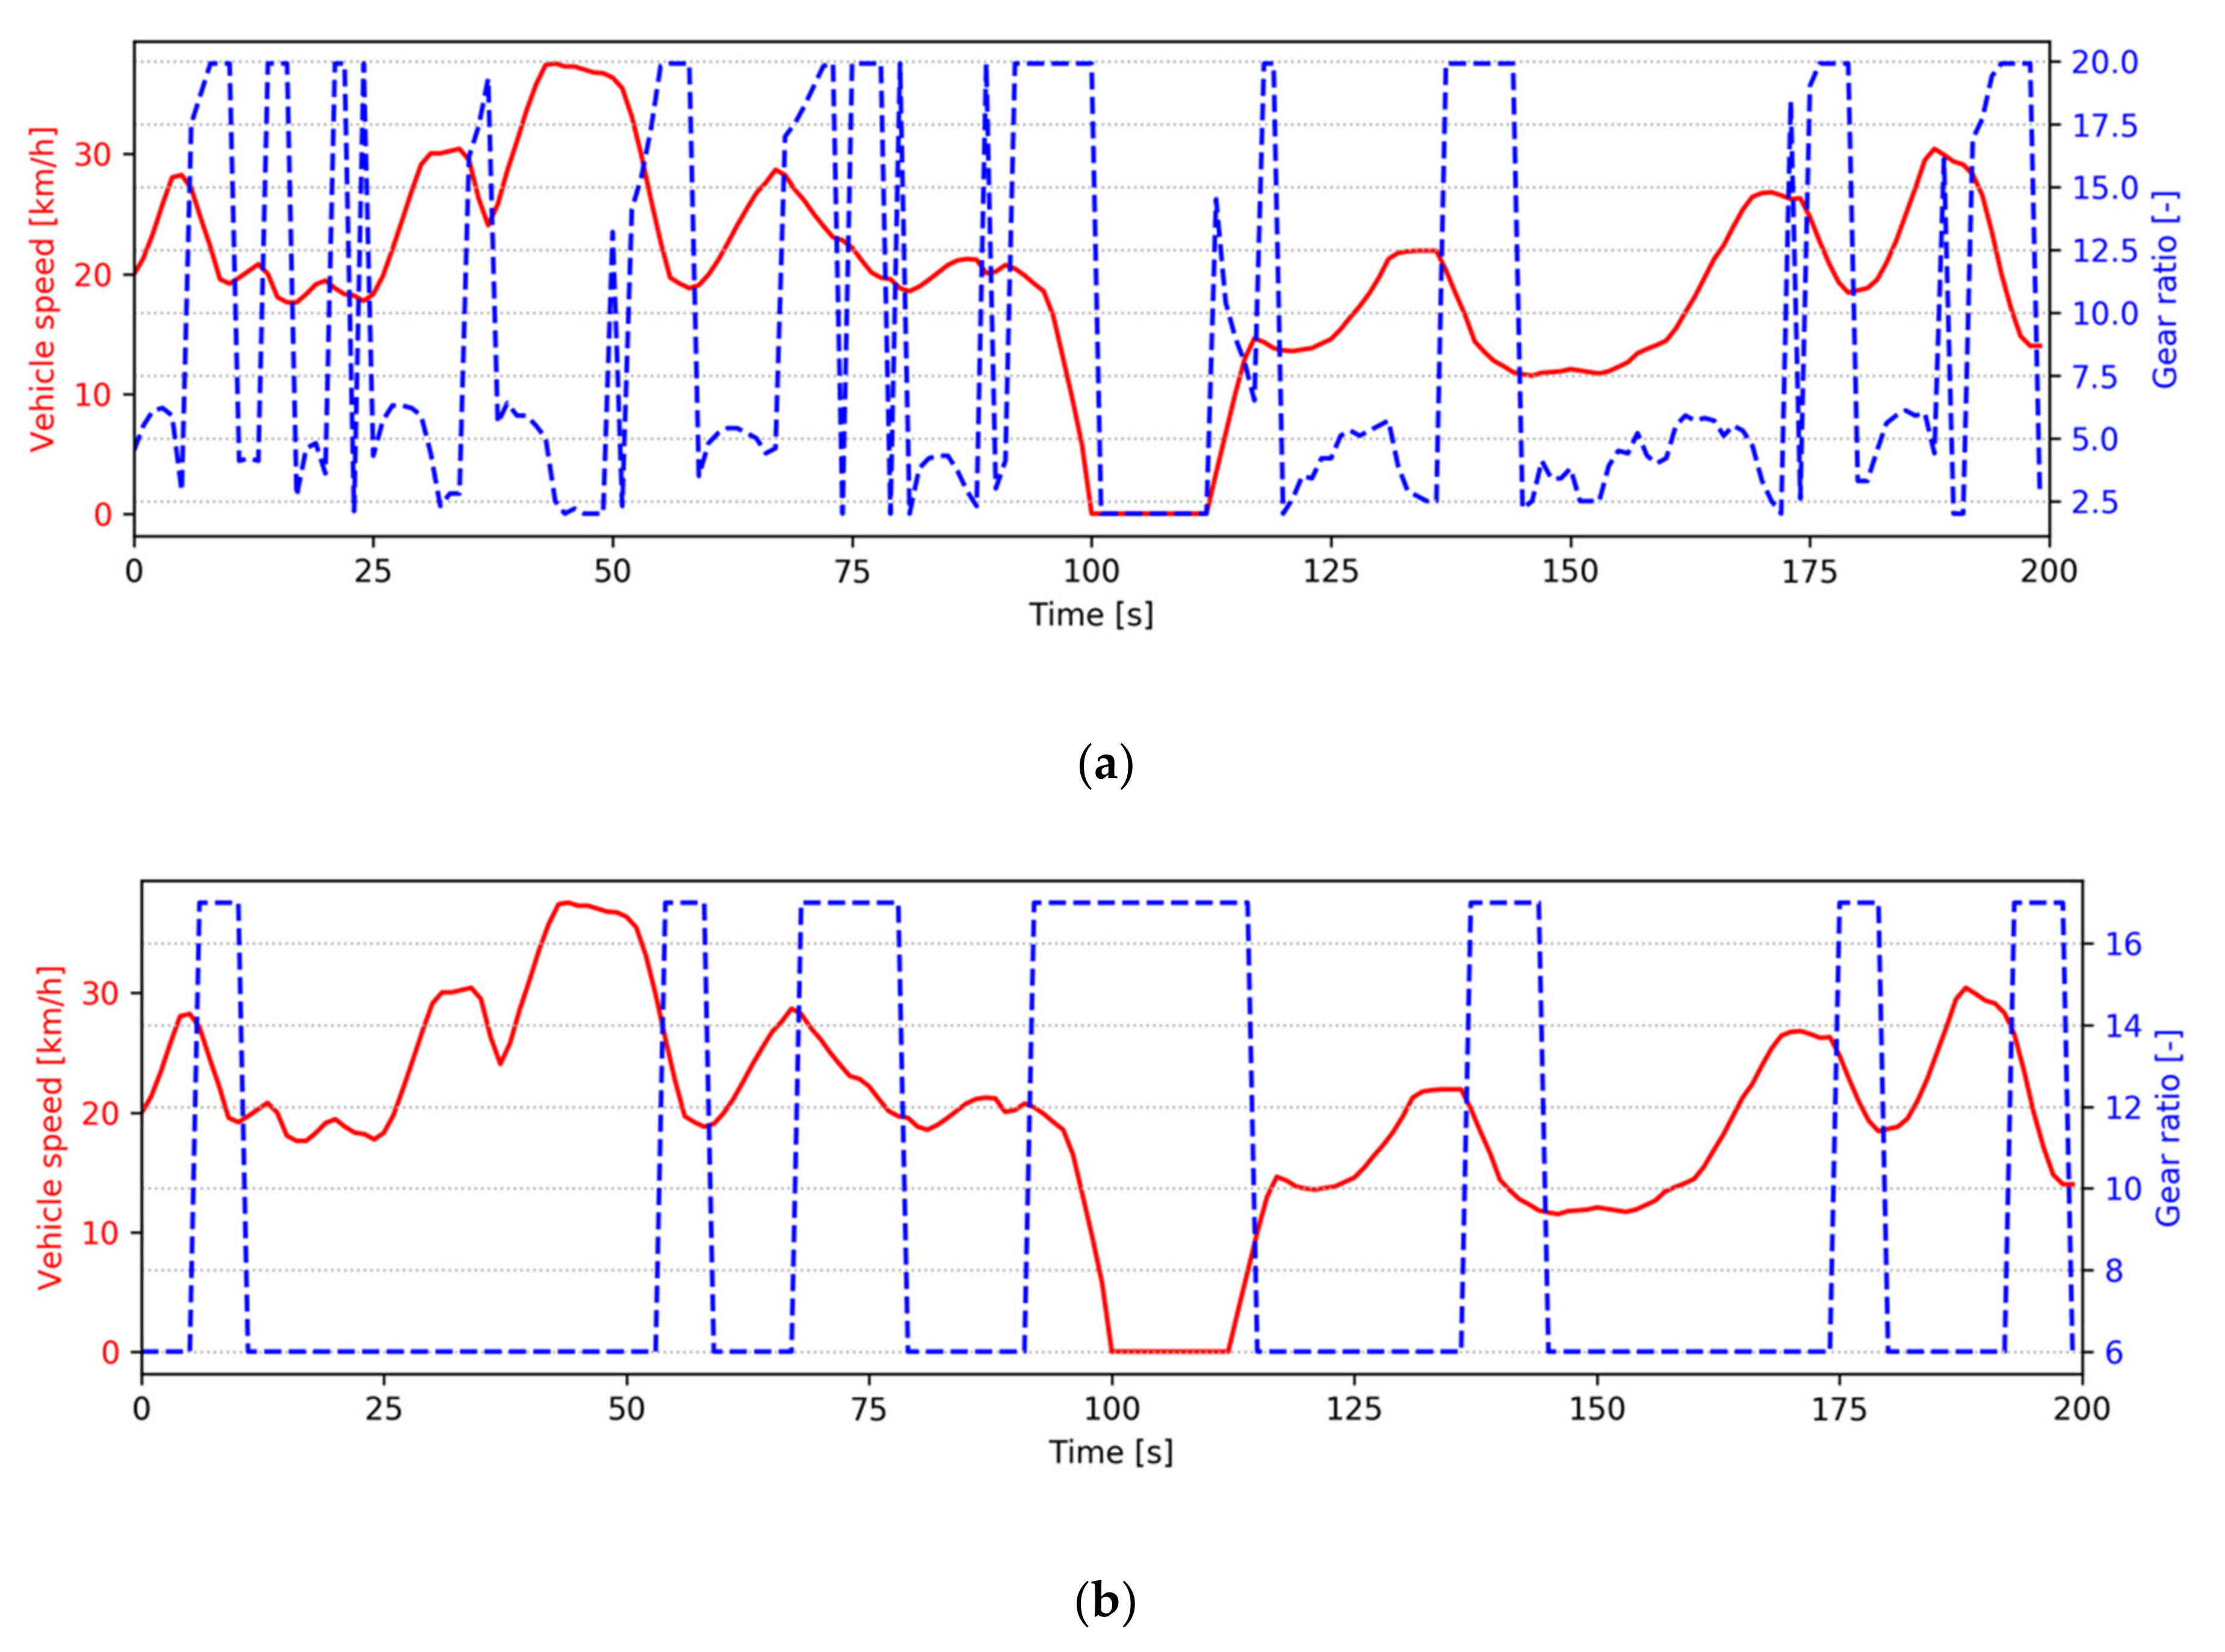
The Espoo 11 reference cycle is characterized by a high number of stops and subsequently a high number of acceleration and braking events. With the two-speed gearbox, regenerative braking is frequently executed with the first gear (high gear ratio) resulting in lower torque and higher speed of the motor compared to the second gear. This is evident from the negative torque region in Figure 8. Additionally, Figure 9 shows clearly that high gear ratios are favored for decelerations with both multispeed gearbox options.
Table 4 and Table 5 show numerical values of energy consumption for each of the five studied routes, comparing the reference two-speed gearbox and CVT alternatives. The gear shift time limit parameter was set to one second in all the simulations that are reported in the tables.
With the two-speed gearbox the results show increased combined efficiency of the motor, inverter and the gearbox in all the E11 cycles, resulting in lower energy consumption. On the contrary, the CVT results in increased consumption in all the cases. Although the CVT reaches higher efficiency operating points of the motor and the inverter due to continuous gear ratio adjustment, this advantage is undone by the losses in the belt system.
Overall, the two-speed gearbox could improve energy efficiency by 2.0 to 3.2%, depending on the driving cycle and the powertrain characteristics. Energy consumption decreased most on the E11-HT cycle with the two-speed gearbox and inversely increased least with the CVT. This cycle has higher speed variation than the other E11 cycles. The Braunschweig cycle is also characterized by high speed variation and shows a significant 2.5% consumption decrease. On all the cycles the CVT performed worse than the two-speed option.
The difference in optimal gear ratios across all the cycles is small, with the optimal ratios found on the higher ends of the ranges for both the low and high gears on all the E11 cycles. Due to the optimal ratios located at the end of their ranges, the gap between the ratios is wide. Subsequently, the motor control needs to respond to large changes in the reference speed.
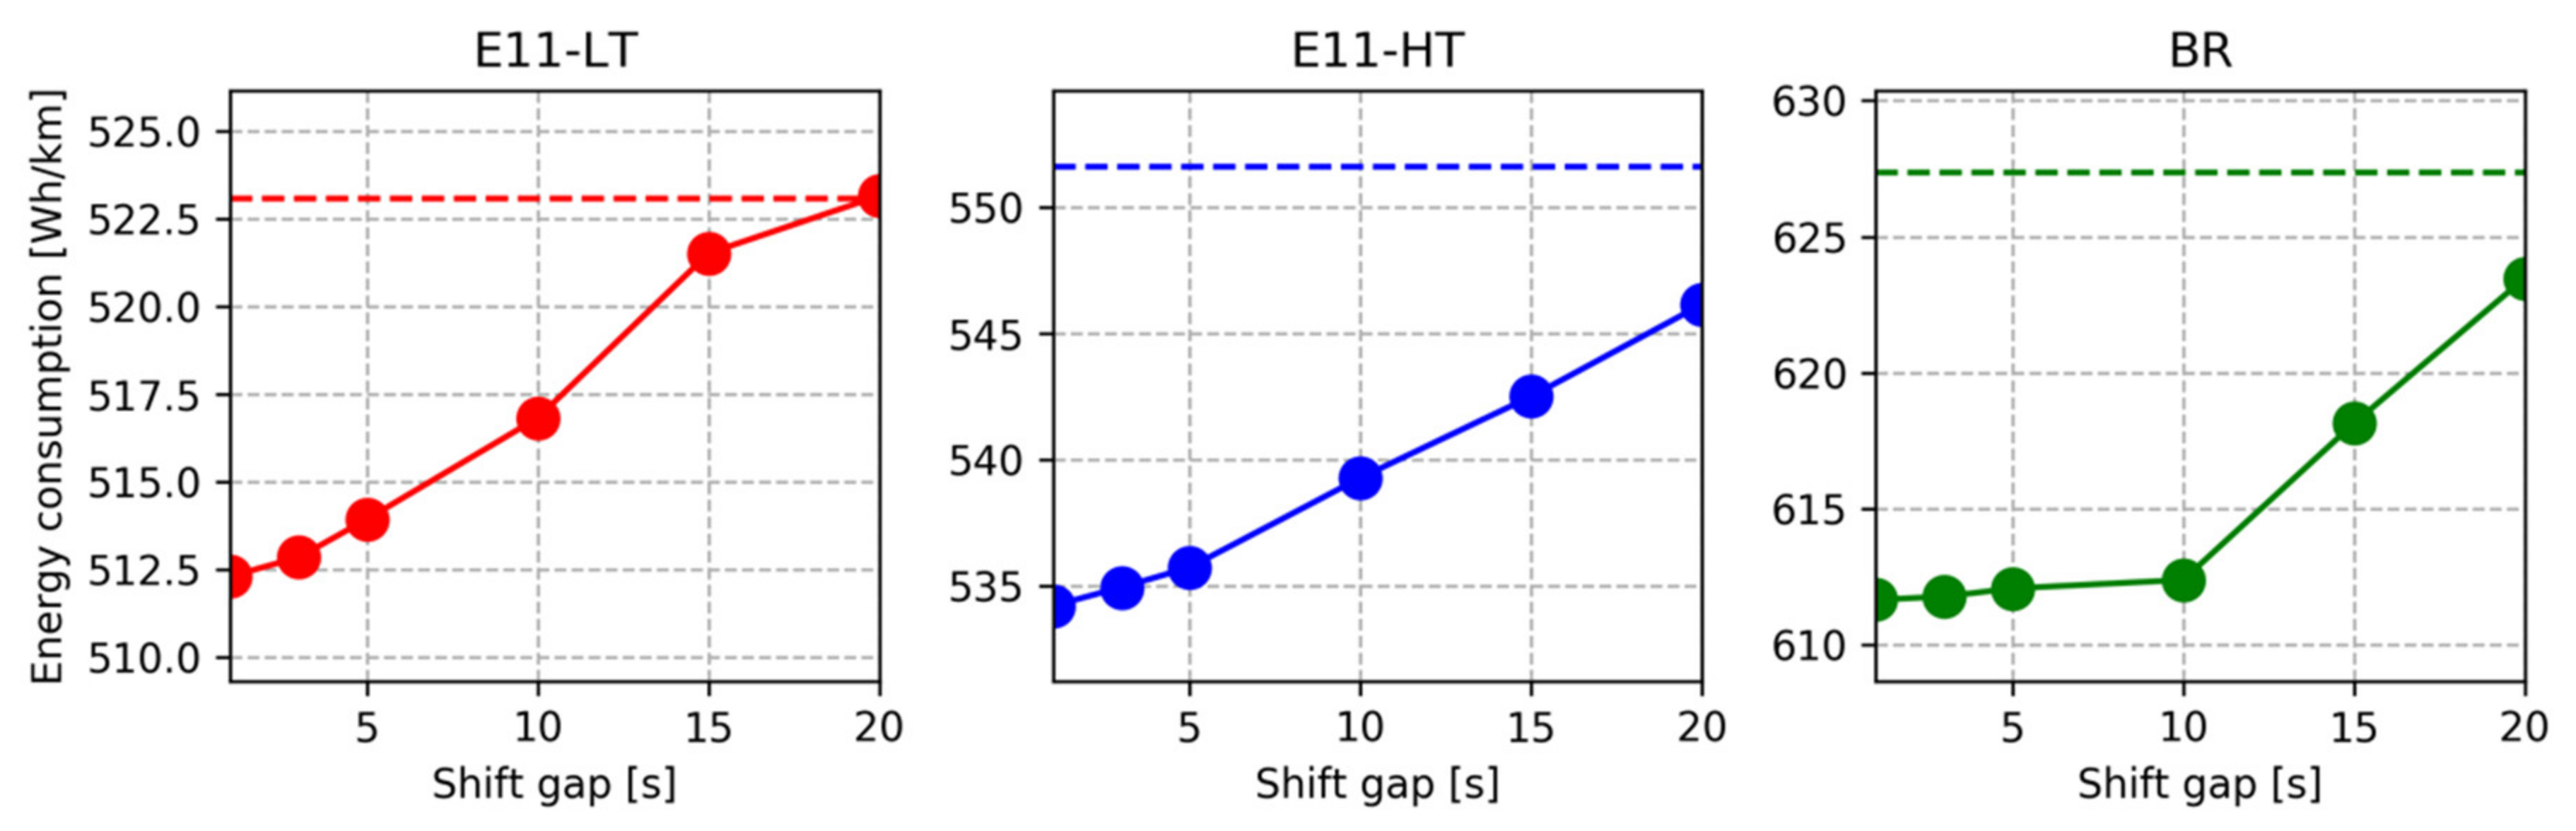
The relationship between the two-speed gearbox shifting time delay (gap) parameter M and the energy consumption is presented in Figure 10 for the E11-LT, E11-HT and Braunschweig cycles. The pattern is similar in E11-LT and E11-HT, showing consumption increasing roughly linearly with the shift gap values between 1 and 20 s. For the E11-LT cycle, all of the consumption advantage of the two-speed gearbox is lost when the shift gap value reaches 20 s. On the other hand, increasing the shift gap from one to ten seconds has only a marginal influence on the consumption with the Braunschweig cycle.
Table 6 shows the tradeoff between capital, operation and technology replacement costs. Only comparison between the reference single-speed and the two-speed option are shown, as the CVT didn’t show any efficiency improvement. Importantly, the savings in charging cost and battery investment and replacement costs achieved with two-speed gearbox option exceed the increased investment cost of the transmission. The savings are distributed rather evenly between battery cost and charging cost.
5. Conclusions
The results of this work point towards a marginal potential of a two-speed gearbox utilization to improve ECB energy efficiency. The developed gearbox gear ratio and shifting policy two-level optimization model was found to be a practical and useful tool for vehicle powertrain design. The computational of the two-level optimization time was only a few seconds with a standard desktop computer for a typical 30 min driving cycle with one second time step duration.
The motor and inverter losses were found to depend on the driving cycle characteristics, and the simulation results suggest that powertrain efficiency was increased at higher power, which correlates with higher speeds and frequency of acceleration and deceleration events. On the other hand, utilization of motor and inverter operation point shifting along a power contour brings larger benefits on above average vehicle speeds when power demand is low instead of high. This is most evident in Figure 5, where the slope of the 20 kW power line is the steepest. The energy efficiency of an ECB can be improved with a two-speed gearbox, but the best utilization requires the consideration of the optimal motor-inverter-gearbox combination.
The PMSM motor in the case study vehicle was originally selected because it has high efficiency on a wide speed and torque range, which is useful when the power is transmitted through a single speed gearbox. However, a multispeed gearbox can favor other motor types, such as an induction motor, that have narrow high efficiency region, but lower capital cost than PMSM. Although the focus of the present work was energy efficiency, a two-speed gearbox also improves acceleration and top speed performance. A smaller motor could then be installed to the bus while retaining acceleration and top speed performance with the help of the two-speed gearbox. Further work is needed on the question of how the motor and gearbox interact in terms of selecting the motor design and power rating.
Innovations in gearbox technology, with respect to lower losses, would increase the attractiveness of the multispeed gearbox options for battery electric busses. This is evident from the large increase in motor and inverter efficiency with the CVT, which is then more than canceled out by the losses of the gearbox components. On the other hand, technology improvements in electric machines may lead to a more even efficiency throughout the motor operating region and thus reduce the potential to improve powertrain efficiency by operating point shifting. For instance, a prototype direct liquid cooled PMSM shows variation in efficiency that is at most only five percentage points between the extremes [27].
In translating the reported energy consumption advantages to real vehicles, the limitations of the modeling approach need to be considered. Lower efficiency of the multispeed gearbox options, both during continuous operation and shifting, compared to the single speed reference, influence the attractiveness of the gearbox alternative. Experimental tests, considerations on the increased complexity, and extending the scope of the analysis to reliability, serviceability, and compatibility are advised before final design decisions are made. In the end, the design decision comes down to the relative economic value of the alternatives. The increased efficiency with the multispeed gearbox options translate to lower electricity charging cost and battery investment cost but these advantages may be partially canceled by higher investment and maintenance costs.
Compared to light duty electric vehicles, ECBs have more consistent driving cycles, and the powertrains are dimensioned according to the nominal operation with only a small margin for excess performance. This results in higher overall powertrain efficiency because operating points are close to the motor and inverter maximum power rating, which provides the highest efficiency. Assuming similar main component selection, such as PMSM motor, it can be assumed that the results of the present work can be generalized to ECBs that operate in different, but similar urban routes.
Previous work on light-duty EV multispeed gearbox feasibility has found that the typical power demand in these vehicles is only around 10% of the maximum rating [28]. Optimal gear ratio selection and shifting of operation points in these low-power contours are different from the higher power region, which explains the results in the present work differ from similar work for light-duty vehicles, such as Nissan Leaf. This suggests that a separate analysis for different vehicle types and operating environments is required.
Author Contributions
Conceptualization, A.R., J.V., K.K., H.L. and K.T.; methodology, A.R., H.L. and K.T.; investigation, A.R.; writing—original draft preparation, A.R. and H.L.; writing—review and editing, A.R., J.V., K.K. and K.T.; supervision, K.T.; project administration, K.T. All authors have read and agreed to the published version of the manuscript.
Funding
This research received no external funding.
Acknowledgments
The authors thank Linkker Ltd. for providing data for this study.
Conflicts of Interest
The authors declare no conflict of interest.
Nomenclature
| Greek Symbols | |
| αwh | Angular acceleration |
| η | Efficiency |
| ρ | Density of air |
| τ | Torque |
| ω | Angular speed |
| Symbols | |
| a | Acceleration |
| A | Vehicle frontal area |
| cr | Rolling resistance coefficient |
| cw | Aerodynamic drag coefficient |
| C | Energy consumption with first gear |
| C’ | Energy consumption with second gear |
| Fx | Tractive force |
| g | Gravitational acceleration |
| h | Step size |
| i | Gear ratio |
| Im | Motor output shaft total moment of inertia |
| k | Index of time step in vehicle dynamic model |
| M | Vehicle total mass |
| N | Number of consecutive time steps before gear shift is allowed |
| P | Power demand |
| r | Tire dynamic radius |
| S | Gear shift energy consumption penalty |
| t | Index of time step in gear change model |
| T | Number of time steps |
| vdc | Driving cycle speed |
| vvh | Vehicle speed |
| y | Binary variable to indicate which gear is active |
| y’ | Binary variable to indicate if gear change was executed |
| Subscripts | |
| dc | Driving cycle |
| gr | Gearbox |
| inv | Inverter |
| m | Electric motor |
| tr | Transmission |
| wh | Wheel axle |
| Abbreviations | |
| BW | Braunschweig driving cycle |
| CVT | Continuously variable transmission |
| E11 | Espoo, Finland bus route 11 |
| ECB | Electric city bus |
| EV | Electric vehicle |
| HT | High traffic |
| IVT | Infinitely variable transmission |
| LT | Low traffic |
| LTO | Lithium-titanium oxide |
| MT | Medium traffic |
| NEDC | New European driving cycle |
| PMSM | Permanent magnet synchronous machine |
| UDC | Urban driving cycle |
Appendix A
This section presents the motor/generator and the inverter efficiency functions that were applied to compute the maps featured in Figure 4. Modelling of the motor/generator efficiency is based on the work in [24], but with substantially different parameter values due to the different motor characteristics.
Motor/generator efficiency is defined by:
where ai, bi, mi, ni, and Pbase_loss are parameters in the motor power loss function Pm,loss(ωm, τm). The max function in (A2) gives a lower limit ηm,min of the motor/generator efficiency. In the numerical case study, the parameter ωm,max is 314, τm,max is 2000, Pbase_loss is 11000 and ηm,min is 0.5. The other parameters that are indexed over i = 1…10 are given in Table A1.

Table A1.
Numerical case study parameter values for the motor power loss function.
| i | ai | bi | mi | ni |
|---|---|---|---|---|
| 1 | −0.003 | 0 | 0 | 0 |
| 2 | 0.520 | 0 | 0 | 1 |
| 3 | 0.020 | 0 | 1 | 0 |
| 4 | −1.022 | −4000 | 1 | 1 |
| 5 | 1.300 | 0 | 2 | 1 |
| 6 | 0.103 | 0 | 2 | 0 |
| 7 | −0.334 | 0 | 0 | 2 |
| 8 | 0.450 | 0 | 3 | 0 |
| 9 | 0.500 | 0 | 1 | 2 |
| 10 | 0.120 | 4000 | 0 | 3 |
The inverter efficiency is computed similarly as the engine/generator, but with only three terms in the weighted sum. The formulation is:
where c1, c2 and c3 are parameters of the power loss function (A3) and receive values 5 × 10⁻⁴, 0.5 and 2.0, respectively, in the numerical case study. Additionally, the lower threshold of the inverter efficiency ηinv,min is set to 0.8.
References
- Lajunen, A. Lifecycle costs and charging requirements of electric buses with different charging methods. J. Clean. Prod. 2018, 172, 56–67. [Google Scholar] [CrossRef]
- Eckhouse, B. The U.S. Has a Fleet of 300 Electric Buses. China Has 421,000. Available online: https://www.bloomberg.com/news/articles/2019-05-15/in-shift-to-electric-bus-it-s-china-ahead-of-u-s-421-000-to-300 (accessed on 20 June 2019).
- Anenberg, S.C.; Milled, J.; Henze, D.K.; Minjares, R.; Achakulwisut, P. The global burden of transportation tailpipe emissions on air pollution-related mortality in 2010 and 2015. Environ. Res. Lett. 2019, 14, 094012. [Google Scholar] [CrossRef]
- Besselink, I.J.M.; van Oorschot, P.F.; Meinders, E.; Nijmeijer, H. Design of an Efficient, Low Weight Battery Electric Vehicle Based on a VW Lupo 3L. In Proceedings of the EVS-25 Symposium, Shenzhen, China, 5–9 November 2010. [Google Scholar]
- Ehsani, M.; Gao, Y.; Gay, S. Characterization of Electric Motor Drives for Traction Applications. In Proceedings of the IECON 03, Roanoke, VA, USA, 2–6 November 2003. [Google Scholar]
- De Santiago, J.; Bernhoff, H.; Ekergård, B.; Eriksson, S.; Ferhatovic, S.; Waters, R.; Leijon, M. Electrical motor drivelines in commercial all-electric vehicles: A review. IEEE Trans. Veh. Technol. 2012, 61, 475–484. [Google Scholar] [CrossRef] [Green Version]
- Ji, F.; Xu, L.; Wu, Z. Effect of driving cycles on energy efficiency of electric vehicles. Sci. China, Ser. E Technol. Sci. 2009, 52, 3168–3172. [Google Scholar] [CrossRef]
- Wu, G.; Zhang, X.; Dong, Z. Impacts of Two-Speed Gearbox on Electric Vehicle’s Fuel Economy and Performance. SAE Tech. Paper 2013. [Google Scholar] [CrossRef]
- Ren, Q.; Crolla, D.A.; Morris, A. Effect of transmission design on Electric Vehicle (EV) performance. In Proceedings of the VPPC 09, Dearborn, MI, USA, 7–10 September 2009. [Google Scholar]
- Bottiglione, F.; De Pinto, S.; Mantriota, G.; Sorniotti, A. Energy consumption of a battery electric vehicle with infinitely variable transmission. Energies 2014, 7, 8317–8337. [Google Scholar] [CrossRef] [Green Version]
- Gao, B.; Liang, Q.; Xiang, Y.; Guo, L.; Chen, H. Gear ratio optimization and shift control of 2-speed I-AMT in electric vehicle. Mech. Syst. Signal Process. 2015, 50–51, 615–631. [Google Scholar] [CrossRef]
- Spanoudakis, P.; Tsourveloudis, N.C.; Koumartzakis, G.; Krahtoudis, A.; Karpouzis, T.; Tsinaris, I. Evaluation of a 2-speed transmission on electric vehicle’s energy consumption. In Proceedings of the IEVC 2014, Florence, Italy, 17–19 December 2014. [Google Scholar]
- Tan, S.; Yang, J.; Zhao, X.; Hai, T.; Zhang, W. Gear Ratio Optimization of a Multi-Speed Transmission for Electric Dump Truck Operating on the Structure Route. Energies 2018, 11, 1324. [Google Scholar] [CrossRef] [Green Version]
- Dietsche, K.-H. Automotive Handbook, 8th ed.; Roberth Bosch: Plochingen, Germany, 2011. [Google Scholar]
- Naunheimer, H. Automotive Transmissions: Fundamentals, Selection, Design and Application, 2nd ed.; Springer: London, UK, 2011. [Google Scholar]
- Shin, J.W.; Kim, J.O.; Choi, J.Y.; Oh, S.H. Design of a 2-speed transmission for an electric commercial vehicle. Int. J. Automot. Technol. 2014, 15, 145–150. [Google Scholar] [CrossRef]
- Ruan, J.; Walker, P.; Zhang, N. A comparative study energy consumption and costs of battery electric vehicle transmissions. Appl. Energy 2016, 165, 119–134. [Google Scholar] [CrossRef] [Green Version]
- Rimac Automobili Gearbox System; Rimac Automobili: Sveta Nedelja, Croatia, 2019.
- Ngo, V.; Hofman, T.; Steinbuch, M.; Serrarens, A. Effect of gear shift and engine start losses on energy management strategies for hybrid electric vehicles. Int. J. Powertrains 2015, 4, 141–162. [Google Scholar] [CrossRef]
- Lajunen, A.; Kalttonen, A. Investigation of thermal energy losses in the powertrain of an electric city bus. In Proceedings of the ITEC 15, Dearborn, MI, USA, 14–17 June 2015. [Google Scholar]
- Kivekas, K.; Vepsalainen, J.; Tammi, K. Stochastic Driving Cycle Synthesis for Analyzing the Energy Consumption of a Battery Electric Bus. IEEE Access 2018, 6, 55586–55598. [Google Scholar] [CrossRef]
- Vepsäläinen, J.; Kivekäs, K.; Otto, K.; Lajunen, A.; Tammi, K. Development and validation of energy demand uncertainty model for electric city buses. Transp. Res. Part D 2018, 63, 347–361. [Google Scholar] [CrossRef]
- Vepsäläinen, J.; Ritari, A.; Lajunen, A.; Kivekäs, K.; Tammi, K. Energy Uncertainty Analysis of Electric Buses. Energies 2018, 11, 3267. [Google Scholar] [CrossRef] [Green Version]
- Mahmoudi, A.; Soong, W.L.; Pellegrino, G.; Armando, E. Efficiency maps of electrical machines. In Proceedings of the ECCE 2015, Montreal, QC, Canada, 20–24 September 2015. [Google Scholar]
- Eurostat. Electricity Prices for Non-Household Consumers; European Commission, Eurostat: Luxembourg, 2020. [Google Scholar]
- Fries, M.; Kerler, M.; Rohr, S.; Schickram, S.; Sinning, M.; Lienkamp, M. An overview of Costs for Vehicle Components, Fuels, Greenhouse Gas Emissions and Total Cost of Ownership 2017; Institute of Automotive Technology, Technische Universität München: München, Germany, 2017. [Google Scholar]
- Lindh, P.; Petrov, I.; Immonen, P.; Pyrhonen, J.; Niemela, M.; Anttila, J.; Paakkinen, M.; Scherman, E. Performance of a Direct-Liquid-Cooled Motor in an Electric Bus under Different Load Cycles. IEEE Access 2019, 7, 86897–86905. [Google Scholar] [CrossRef]
- Laitinen, H.; Tammi, K.; Lajunen, A. Improving electric vehicle energy efficiency with two-speed gearbox. In Proceedings of the VPPC 2017, Belfort, France, 11–14 December 2017. [Google Scholar]
Figure 1.
Two-speed dual clutch gearbox layout.

Figure 2.
Signal flow in the vehicle model.

Figure 3.
Flow chart of the gear ratio optimization process.

Figure 4.
(a) Motor efficiency map; (b) Inverter efficiency map.

Figure 5.
Combined efficiency of the motor and the inverter at different power contours.

Figure 6.
(a) The case study ECB operating in Espoo, Finland; (b) The bus route 11 in Espoo. Map data is by OpenStreetMaps.
Figure 6.
(a) The case study ECB operating in Espoo, Finland; (b) The bus route 11 in Espoo. Map data is by OpenStreetMaps.

Figure 7.
Three measured driving cycles from Espoo line 11 and the Braunschweig standard reference cycle.
Figure 7.
Three measured driving cycles from Espoo line 11 and the Braunschweig standard reference cycle.

Figure 8.
Comparison of operating points of the motor (E11-MT).

Figure 9.
Illustration of optimal gear ratio selection policy for the CVT (a) and the two-speed gearbox with five second minimum gap between changes (b). The speed profile is a 200 second section from the E11-LT driving cycle.
Figure 9.
Illustration of optimal gear ratio selection policy for the CVT (a) and the two-speed gearbox with five second minimum gap between changes (b). The speed profile is a 200 second section from the E11-LT driving cycle.

Figure 10.
Energy consumption as a function of the minimum shift gap parameter value. The dashed horizontal lines represent the reference consumptions.
Figure 10.
Energy consumption as a function of the minimum shift gap parameter value. The dashed horizontal lines represent the reference consumptions.

Table 1.
Parameter values for the numerical case study.
| Parameter | Description | Value | Unit |
|---|---|---|---|
| M | Vehicle total mass | 12,000 | kg |
| rwh | Tire dynamic radius | 0.43 | m |
| g | Gravitational acceleration | 9.81 | m/s2 |
| cr | Rolling resistance coefficient | 0.01 | - |
| cw | Aerodynamic drag coefficient | 0.6 | - |
| A | Frontal area | 6.2 | m2 |
| ρ | Density of air | 1.27 | kg/m3 |
| i | Differential gear ratio | 7.0 | |
| ηtr | Differential efficiency | 0.95 | - |
| ηgb,2s | Two-speed gearbox efficiency | 0.99 | - |
| ηgb,CVT | CVT efficiency | 0.95 | - |
| Im | Motor moment of inertia | 0.63 | kg m2 |
| S | Shifting energy loss | 0 | J |
| M | Shifting time delay | 1–30 | s |
| h | Simulation step size | 1 | s |
Table 2.
Braunschweig (BR) and three Espoo 11 (E11) cycle characteristics.
| Feature | E11-LT | E11-MT | E11-HT | BR |
|---|---|---|---|---|
| Distance (km) | 9.96 | 9.96 | 9.96 | 10.9 |
| Duration (s) | 1349 | 1487 | 1957 | 1741 |
| Stops per km | 0.70 | 2.01 | 2.91 | 2.57 |
| Max. speed (km/h) | 44.4 | 58.4 | 53.8 | 58.26 |
| Avg. driving speed (km/h) | 28.4 | 28.5 | 28.5 | 30.48 |
| Max. acceleration (m/s2) | 1.37 | 1.41 | 1.41 | 2.41 |
| Max. deceleration (m/s2) | 1.79 | 2.00 | 1.36 | 3.59 |
| Avg. acceleration (m/s2) | 0.31 | 0.53 | 0.43 | 0.55 |
| Avg. acceleration (m/s2) | 0.30 | 0.50 | 0.37 | 0.72 |
Table 3.
Lifecycle cost parameters.
| Description | Value |
|---|---|
| Bus purchase cost without a battery and transmission (€) | 340,000 |
| Single speed (final drive) transmission (€) | 10,000 |
| Two-speed dual clutch transmission (€) | 12,000 |
| Battery cost (high power LTO) (€/kWh) | 800 |
| Battery useful life (cycles) | 10,000 |
| Battery maximum calendar life (years) | 10 |
| Maintenance cost (€/km) | 0.2 |
| Electricity cost (€/kWh) | 0.155 |
| Service life (years) | 16 |
| Annual operation (h) | 4000 |
Table 4.
Energy consumption advantage achieved with the two-speed gearbox in five driving cycles. All energy consumption related numerical values are reported in units of Wh/km.
Table 4.
Energy consumption advantage achieved with the two-speed gearbox in five driving cycles. All energy consumption related numerical values are reported in units of Wh/km.
| Cycle | Eref | EGB | ΔE | ΔE(%) | i1 | i2 |
|---|---|---|---|---|---|---|
| E11-LT | 523.1 | 512.3 | −10.8 | −2.1 | 5.0 | 17.2 |
| E11-MT | 596.5 | 584.6 | −11.9 | −2.0 | 6.8 | 19.9 |
| E11-HT | 551.6 | 534.2 | −17.4 | −3.2 | 6.4 | 19.9 |
| E11-C | 557.0 | 545.0 | −12.0 | −2.2 | 6.3 | 19.9 |
| BW | 627.4 | 611.7 | −15.7 | −2.5 | 6.8 | 19.2 |
Table 5.
Energy consumption comparison between the CVT and the reference powertrains. Positive ΔE value represents consumption disadvantage with CVT.
Table 5.
Energy consumption comparison between the CVT and the reference powertrains. Positive ΔE value represents consumption disadvantage with CVT.
| Cycle | Eref | EGB | ΔE | ΔE(%) |
|---|---|---|---|---|
| E11-LT | 523.1 | 533.6 | 10.2 | 1.9 |
| E11-MT | 596.5 | 620.4 | 23.9 | 4.0 |
| E11-HT | 551.6 | 561.9 | 10.3 | 1.9 |
| E11-C | 557.0 | 571.8 | 14.8 | 2.7 |
| BW | 627.4 | 644.9 | 17.5 | 2.8 |
Table 6.
Comparison of lifecycle costs between the reference and two-speed gearbox vehicles for the Braunschweig cycle. Energy consumption advantage of the two-speed gearbox is translated proportionally to battery capacity and cost.
Table 6.
Comparison of lifecycle costs between the reference and two-speed gearbox vehicles for the Braunschweig cycle. Energy consumption advantage of the two-speed gearbox is translated proportionally to battery capacity and cost.
| Cost Item (€) | Reference | Two-Speed | Δ |
|---|---|---|---|
| Purchase cost without battery and transmission | 340,000 | 340,000 | 0 |
| Transmission | 10,000 | 12,000 | 2000 |
| Maintenance | 192,000 | 192,000 | 0 |
| Battery | 44,000 | 42,900 | −1100 |
| Battery replacement | 44,000 | 42,900 | −1100 |
| Lifetime electricity | 90,288 | 88,031 | −2257 |
| Total | −2457 |
© 2020 by the authors. Licensee MDPI, Basel, Switzerland. This article is an open access article distributed under the terms and conditions of the Creative Commons Attribution (CC BY) license (http://creativecommons.org/licenses/by/4.0/).
Share and Cite
MDPI and ACS Style
Ritari, A.; Vepsäläinen, J.; Kivekäs, K.; Tammi, K.; Laitinen, H. Energy Consumption and Lifecycle Cost Analysis of Electric City Buses with Multispeed Gearboxes. Energies 2020, 13, 2117. https://0-doi-org.brum.beds.ac.uk/10.3390/en13082117
AMA Style
Ritari A, Vepsäläinen J, Kivekäs K, Tammi K, Laitinen H. Energy Consumption and Lifecycle Cost Analysis of Electric City Buses with Multispeed Gearboxes. Energies. 2020; 13(8):2117. https://0-doi-org.brum.beds.ac.uk/10.3390/en13082117
Chicago/Turabian StyleRitari, Antti, Jari Vepsäläinen, Klaus Kivekäs, Kari Tammi, and Heikki Laitinen. 2020. "Energy Consumption and Lifecycle Cost Analysis of Electric City Buses with Multispeed Gearboxes" Energies 13, no. 8: 2117. https://0-doi-org.brum.beds.ac.uk/10.3390/en13082117
Note that from the first issue of 2016, this journal uses article numbers instead of page numbers. See further details here.