
Effect of Mechanical Ventilation on Accidental Hydrogen Releases—Large-Scale Experiments

Department of Process, Energy and Environmental Technology, University of South-Eastern Norway, Faculty of Technology, Natural Science and Maritime Science, Campus Porsgrunn, 3918 Porsgrunn, Norway
*
Author to whom correspondence should be addressed.
Energies 2021, 14(11), 3008; https://0-doi-org.brum.beds.ac.uk/10.3390/en14113008
Submission received: 13 April 2021
/
Revised: 11 May 2021
/
Accepted: 18 May 2021
/
Published: 22 May 2021
(This article belongs to the Collection Women in Hydrogen Energy)
Abstract
:This paper presents a series of experiments on the effectiveness of existing mechanical ventilation systems during accidental hydrogen releases in confined spaces, such as underground garages. The purpose was to find the mass flow rate limit, hence the TPRD diameter limit, that will not require a change in the ventilation system. The experiments were performed in a 40 ft ISO container in Norway, and hydrogen gas was used in all experiments. The forced ventilation system was installed with a standard 315 mm diameter outlet. The ventilation parameters during the investigation were British Standard with 10 ACH and British Standard with 6 ACH. The hydrogen releases were obtained through 0.5 mm and 1 mm nozzles from different hydrogen reservoir pressures. Both types of mass flow, constant and blowdown, were included in the experimental matrix. The analysis of the hydrogen concentration of the created hydrogen cloud in the container shows the influence of the forced ventilation on hydrogen releases, together with TPRD diameter and reservoir pressure. The generated experimental data will be used to validate a CFD model in the next step.
1. Introduction
Existing mechanical ventilation systems used in semiconfined spaces are designed for conventional fuels only. The increasing number of hydrogen-driven vehicles requires investigation if a change in those ventilation systems is needed.
Hydrogen releases in semiconfined spaces can be significantly more dangerous than in the open air. The released hydrogen can form a cloud/layer under the ceiling and build up its concentration, increasing hazards of ignition and explosion. The wide range of the hydrogen flammability limit (4–75%) [1,2] obliges investigation in the mitigation system to keep concentration within safety limits. There are many studies on hydrogen dispersion in semiconfined enclosures [1,3,4,5,6,7,8]. The concentration levels in the enclosure mainly depend on the hydrogen leakage source (mass flow rate, its pressure, location, and direction) and the ventilation area [4,6,7]. Insufficient ventilation results in higher concentrations and requires a longer time to reduce it under the flammability limit [6]. A study by Merilo et al. [5] investigated the risks of deflagration in a private garage as a result of leakage from the car. The concentration from a mass flow rate from 1.52 kg/h to 9.22 kg/h resulted in well-mixed layers under the ceiling (with natural and mechanical ventilation). The results showed a decrease in concentration with an increase in ventilation rate. Tests with the highest mass flow rates, 4.92 kg/h and 6.7 kg /h, and the lowest ventilation rate, resulted in average concentration (at the ignition time) over 10% increasing hazards of deflagration.
When hydrogen is released with a low-momentum jet (low Fr number) [9], the formed cloud will be a result of buoyancy motion. As a consequence, the stratification of hydrogen will form hydrogen layers in the enclosure. The buoyancy effect is less significant from the releases from the high pressurized reservoir when the high-momentum jets (high Fr number) are occurring [9,10]. It results in a well-mixed system where hydrogen will mix with surrounding gases [11]. The authors developed a simple analytical model to investigate the consequences of hydrogen releases from high pressurized releases with natural and forced ventilation. The releases from a 40 MPa container with 1 to 5 ACH were studied through a 6, 3, and 1 mm nozzle. The overpressures that occurred during the releases were much higher for releases through a 6 mm nozzle. The analytical model results showed that with increasing forced ventilation the duration of flammable H2–air mixture will decrease. A similar study [12] was performed in a full-scale residential garage to validate the analytical model. The model resulted in overpredicting 1% of forced ventilation. The study showed a significant effect of forced ventilation on the reduction in flammable concentration in an enclosure.
The level of hydrogen concentration is crucial to limit flame acceleration [13,14]. The limits for slow flame acceleration have been developed by Dorofev et al. [15], to be under 10% hydrogen in air. Minimum ignition energy (MIE) for 10% H2–air mixture significantly decreases from 0.052 mJ for 10% to 0.017 mJ for 20% air mixture [14]. The MIE of hydrogen–air mixtures compared to other fuels (order of 0.1 mJ [16]) has higher ignition risks. Therefore, the hydrogen concentration in the enclosure has to be kept under flammability limits, or at least under 10% vol, above which the flame propagation is more violent.
A numerical investigation of hydrogen release in the naturally ventilated enclosure was performed by Hussein et al. [17]. The study examined the hydrogen concentrations that resulted from blowdown type releases from 700 bar, through different diameters of TPRD (Thermal and Pressure Relief Device). The release source was located under the car, between the back wheels. TPRDs with diameters larger than 0.5 mm resulted in a flammable cloud, filling the major part of the enclosure in less than 20 s. The author outlined the unacceptable large diameters of TPRD, which lead to high concentrations in a short time, and may result in pressure peaking phenomena described in previous studies, also by authors of this article [18,19,20,21]. Forced ventilation as a mitigation method in the semiclosed space was investigated by Malakhov et al. [22]. The computational fluid dynamics (CFD) methods and conducted experiments resulted in concentration distribution from horizontal hydrogen release. The results show the effect of mechanical ventilation on the hydrogen jet behavior, its length, and on the reduction in hydrogen concentration in a tested compartment.
In this study, series of experiments were conducted to investigate the effect of existing standards of ventilation rates on concentration in the hydrogen cloud. The 40 ft ISO container was used to create a scenario of accidental hydrogen releases in a parking garage, with a release source under the car (placed 4.5 m from the ventilation). The hydrogen concentrations from blowdown and constant mass flow releases from low- and high-pressurized reservoirs are presented. The authors put a major focus on the releases through 0.5 mm TPRD diameter as proposed by Hussein et al. [17]. The experimental results will be used to validate the CFD model in further work developed within the HyTunnel consortium (https://hytunnel.net/, accessed on 20 May 2020).
2. Materials and Methods
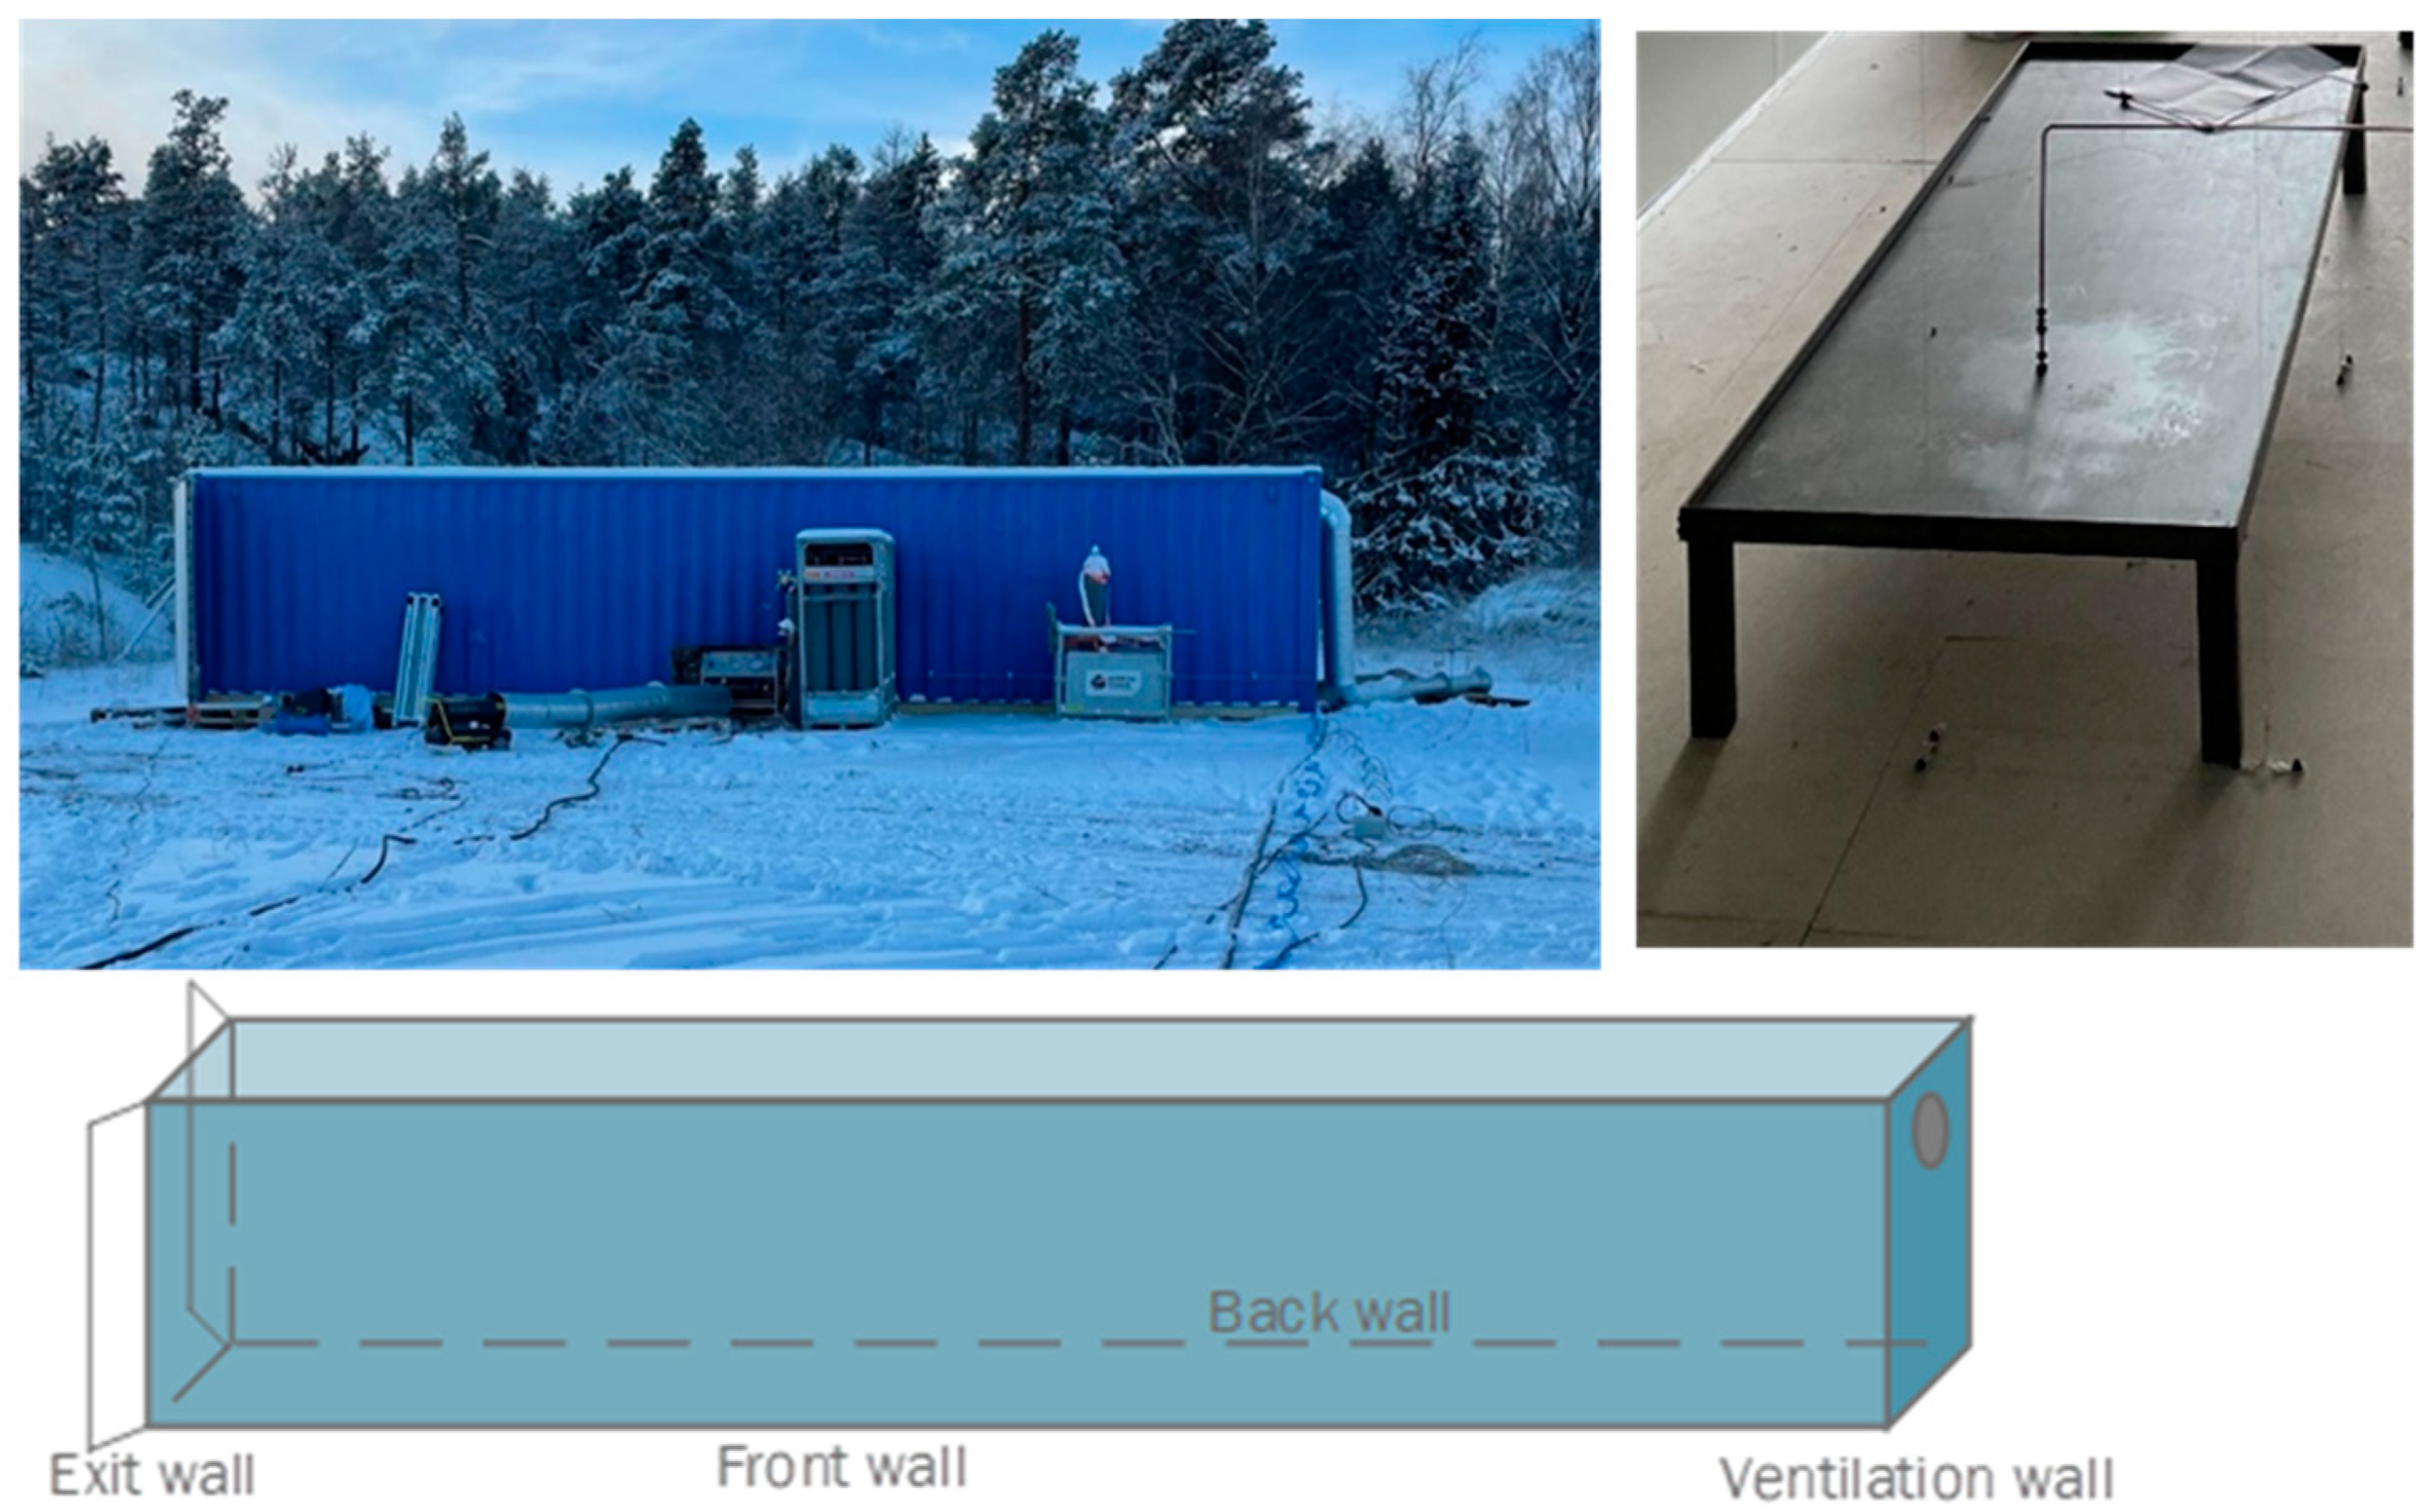
The 40 ft ISO container (Figure 1) with isolated walls was used for all experiments with open exit doors. Its inner dimension (L × W × H: 11885 × 2240 × 2285 mm) gives a total volume of 60.8 m3.
For all experiments, the Coriolis mass flowmeter for high-pressure flows (up to 1043 bar) was used, and forced ventilation with an outer diameter of 315 mm was installed at the ventilation wall. The ventilation was a blowing type ventilation (exit at the open doors) instead of sucking type, typical for underground parking garages. The choice was made due to safety reasons. The air fan used during experiments was not certified for explosive atmospheres. Nevertheless, the ventilation rate used in underground parking garages was applied in experiments to investigate if the rate is sufficient to limit the hydrogen concentration during accidental releases in confined spaces. The ventilation rate (air change per hour ACH) was measured by airflow at an IRIS damper with a GAMS differential pressure transmitter.
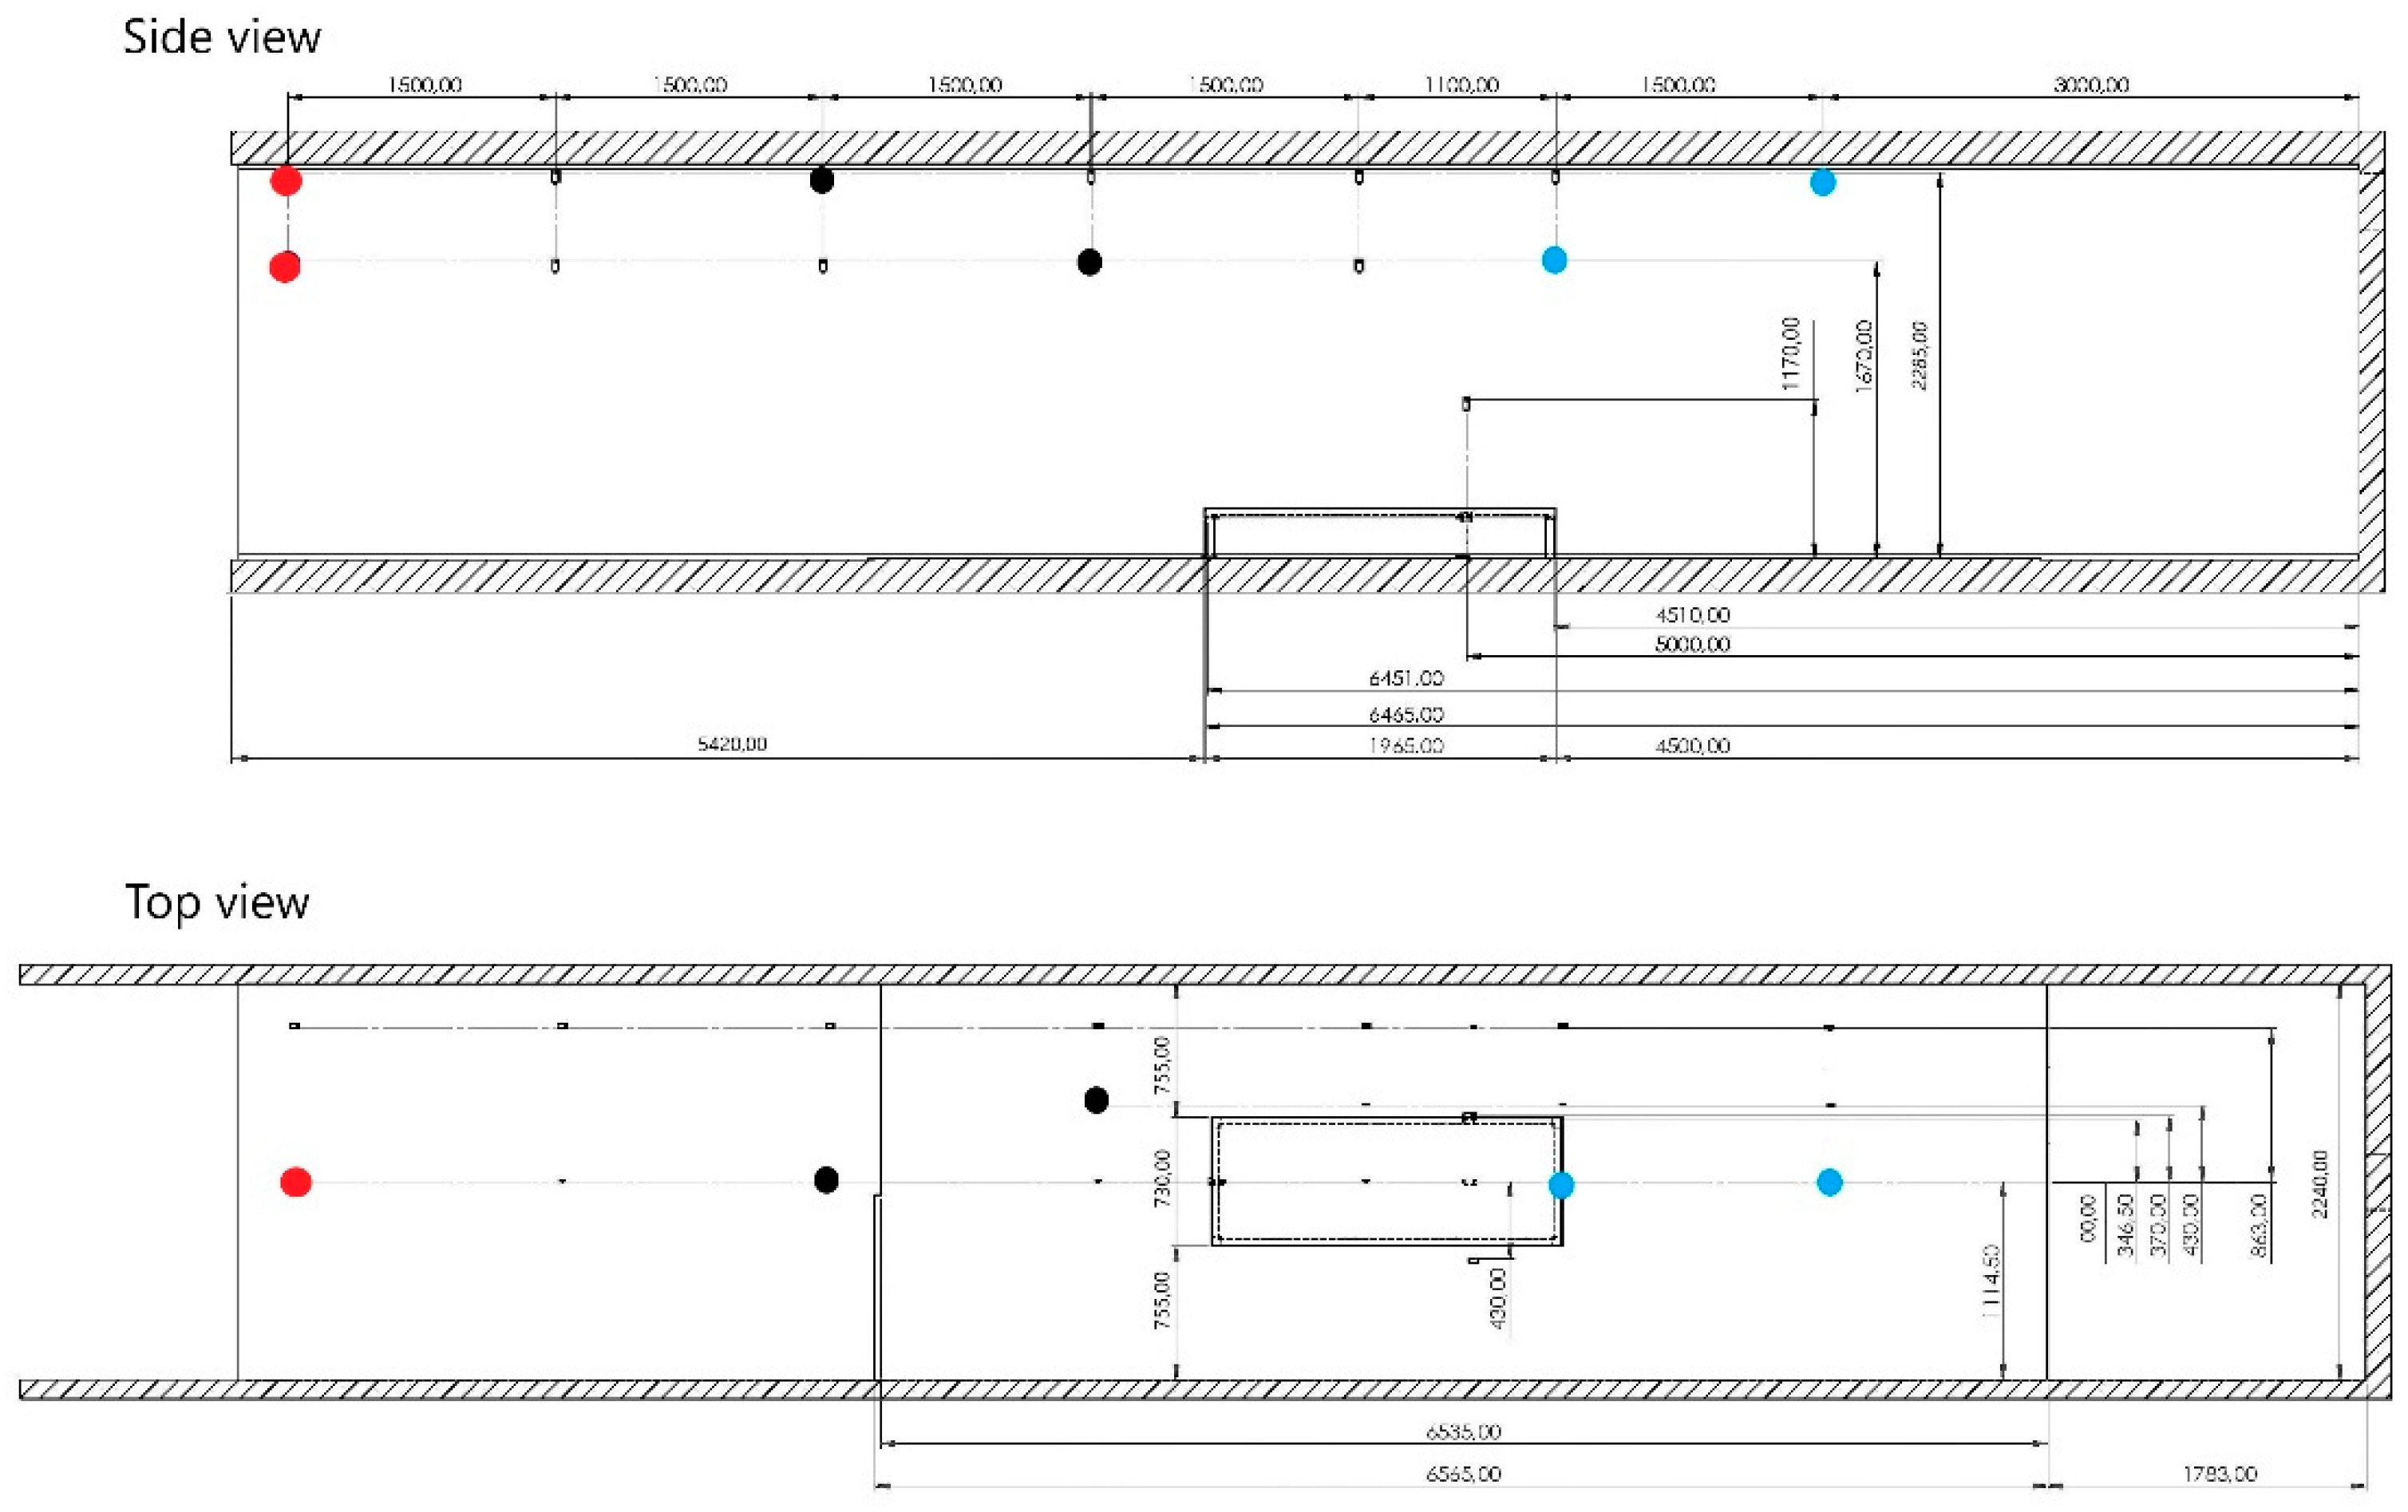
Inside the container, a steel table (scaled 1:4 of a hydrogen car) with dimensions L × W × H: 1965 × 730 × 250 mm was placed 4500 mm from the ventilation wall. The hydrogen was discharged vertically downwards through the steel table. The nozzle outlet was placed 250 mm above the floor and 5000 mm from the ventilation wall.
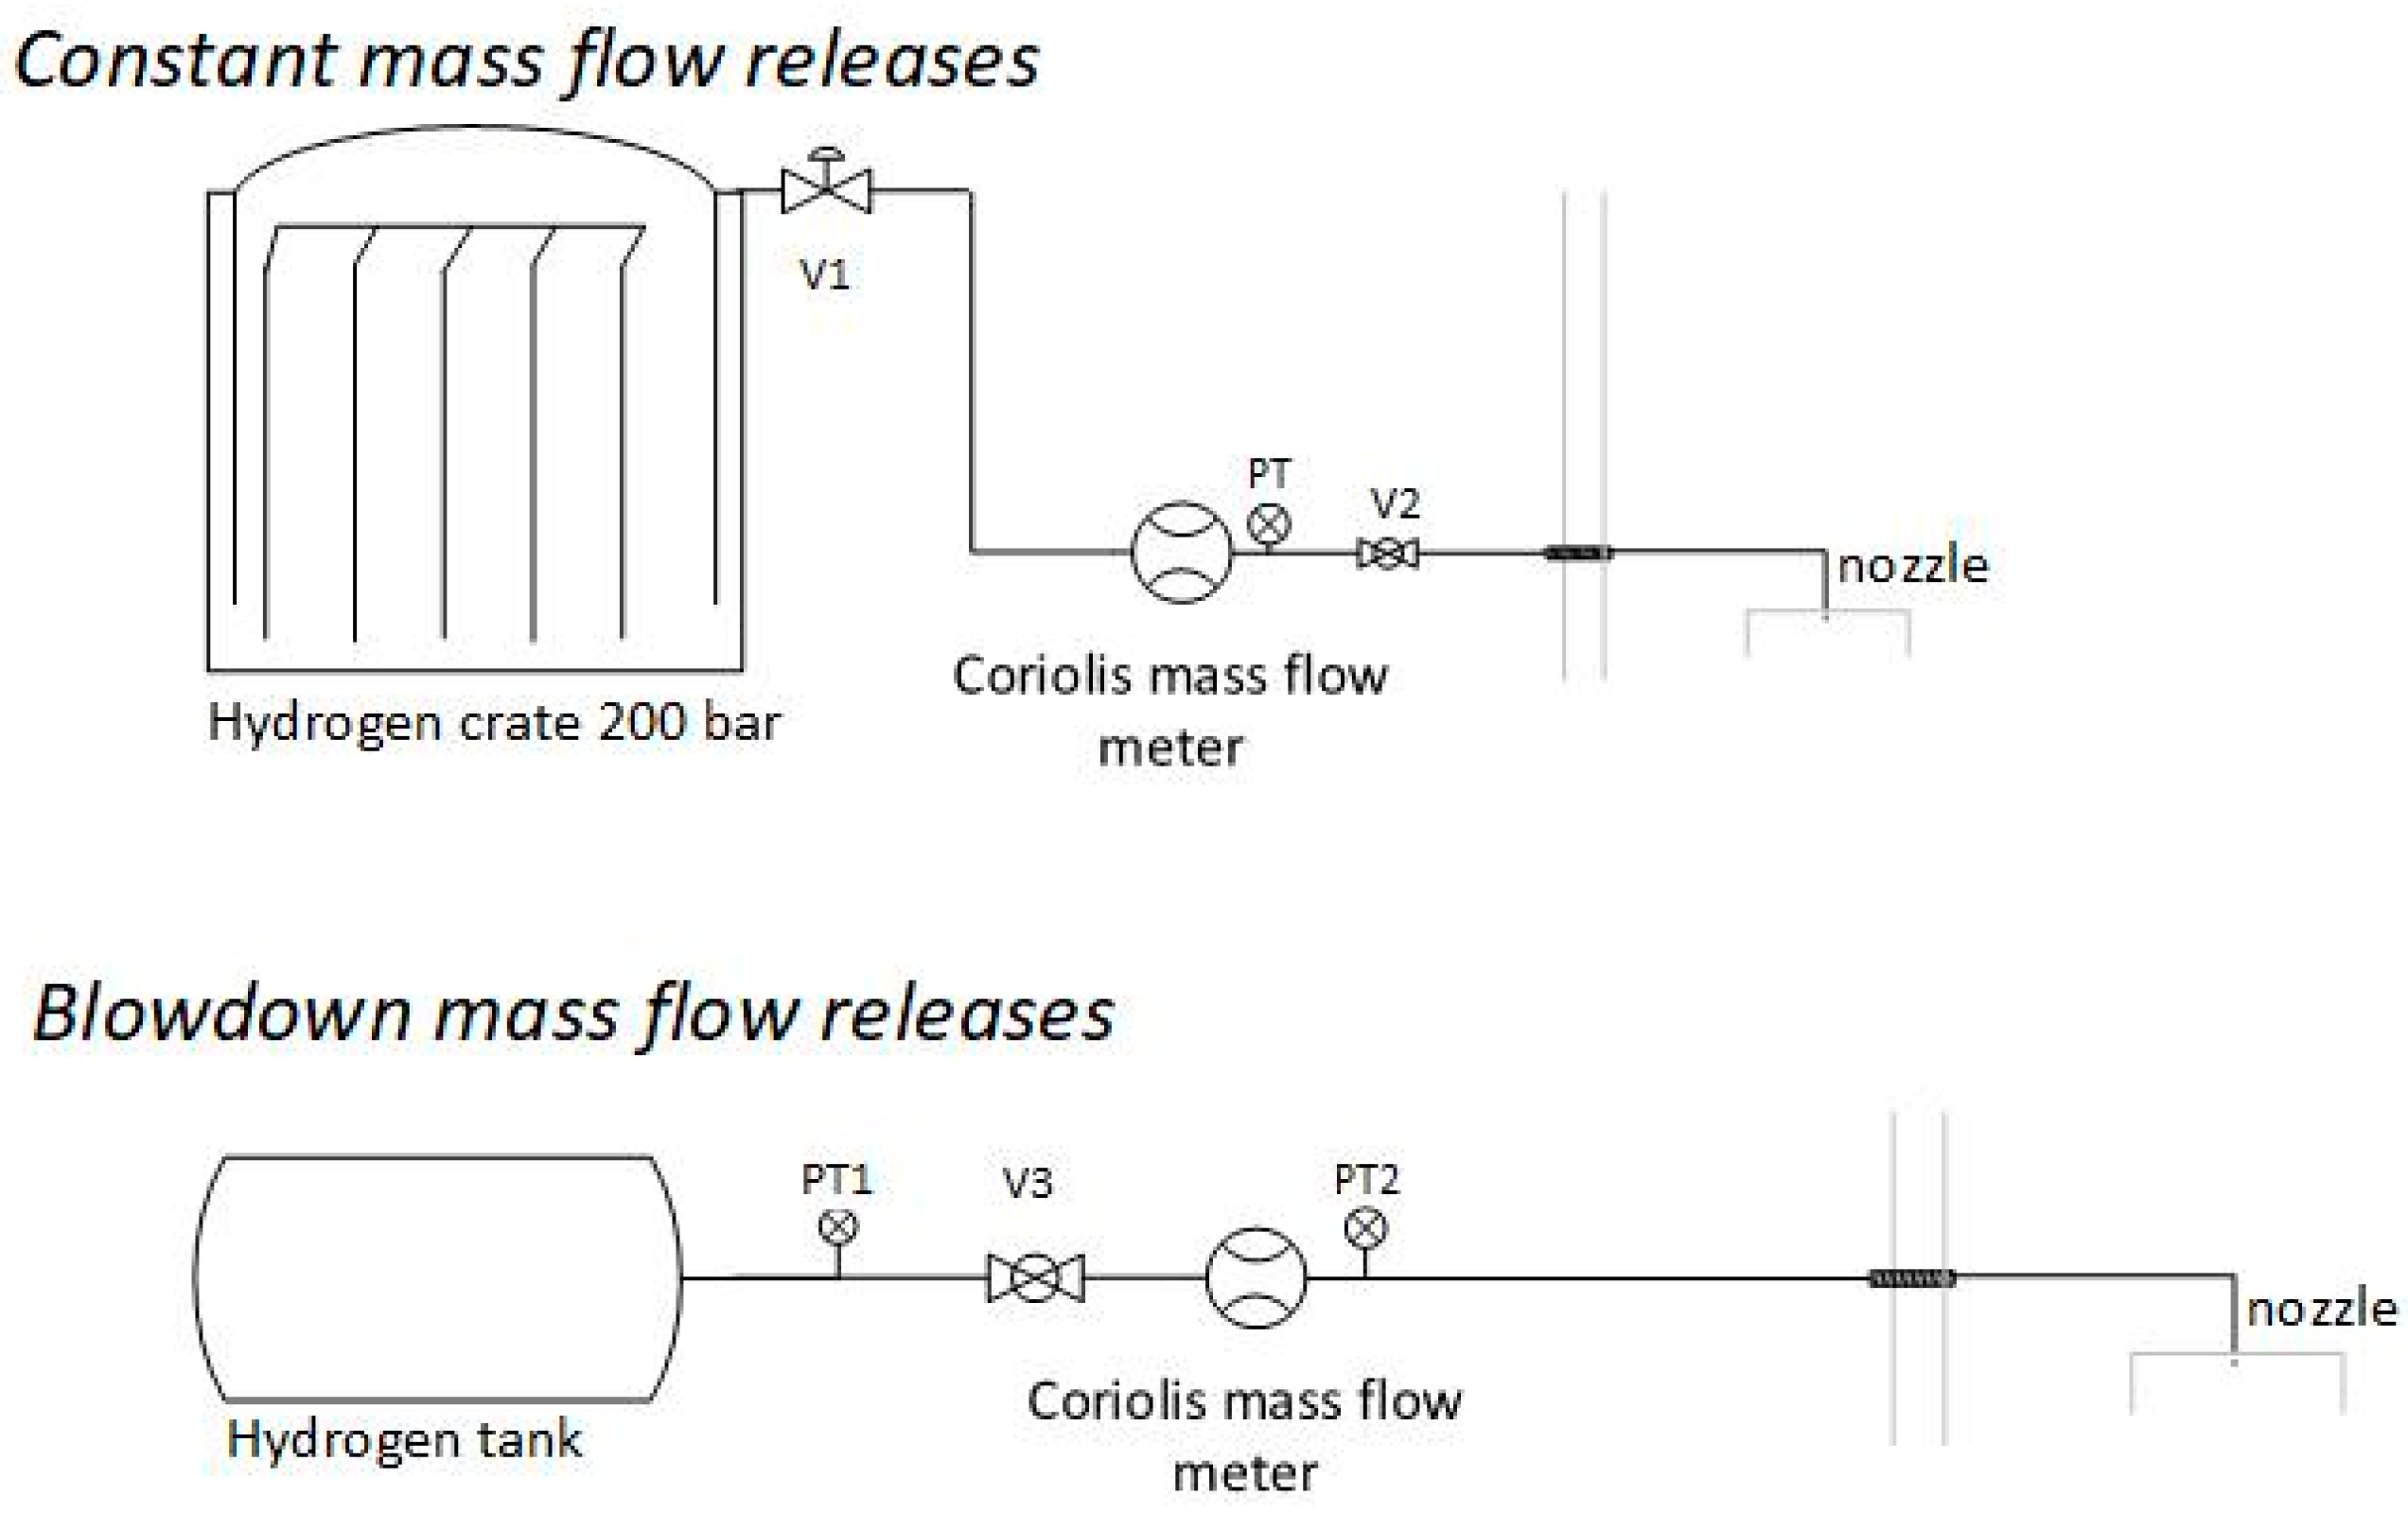
The experiments were performed with constant and blowdown type of flow with two hydrogen supply setups (Figure 2):
- Constant mass flow releases. The hydrogen flowed from the hydrogen crate (12 bottles with 200 bar) through the Coriolis mass flow meter and was released through a 1 mm or 0.5 mm nozzle inside the container. The inner diameter of the discharge line was 4 mm outside the container and 3 mm inside (1370 mm), with a total length of 3840 mm (1620 mm before the Coriolis mass flow meter and 2220 mm after). The initial pressure was set by a pressure regulator (V1) at the H2 crate and kept constant. The release pressure was constantly measured at the exit of the Coriolis mass flow meter with an ESI pressure transmitter (PT). The pneumatic valve (V2) was used to discharge hydrogen during experiments.
- Blowdown-type mass flow releases. The hydrogen was pumped from the hydrogen crate by a gas booster pump (Haskel-Proserv operating pressure 1600 bar) to the hydrogen tank (Hexagon, Type 4 composite high-pressure tank-carbon fiber). During experiments, hydrogen flowed from the tank through the Coriolis mass flow meter and was released through a 0.5 mm nozzle. The inner diameter of the discharge line was 3 mm with a total length of 3860 mm (1510 mm before the Coriolis mass flow meter and 2350 mm after). The release pressure was constantly measured at the exit of the tank (PT1) with an ESI pressure transmitter. Due to technical issues, the signal from the PT2 was not measured.
The uncertainty of all the instrumentation is listed in the Table 1. The absolute measurement uncertainty includes the derived uncertainty of the air changes per hour. The data used in the analysis are averages of more than 25 kilo-samples and effectively reduce the uncertainty of the data. The concentration sensors with a data rate of 3 Hz gave the concentration measurements pointwise, every 0.33 s.
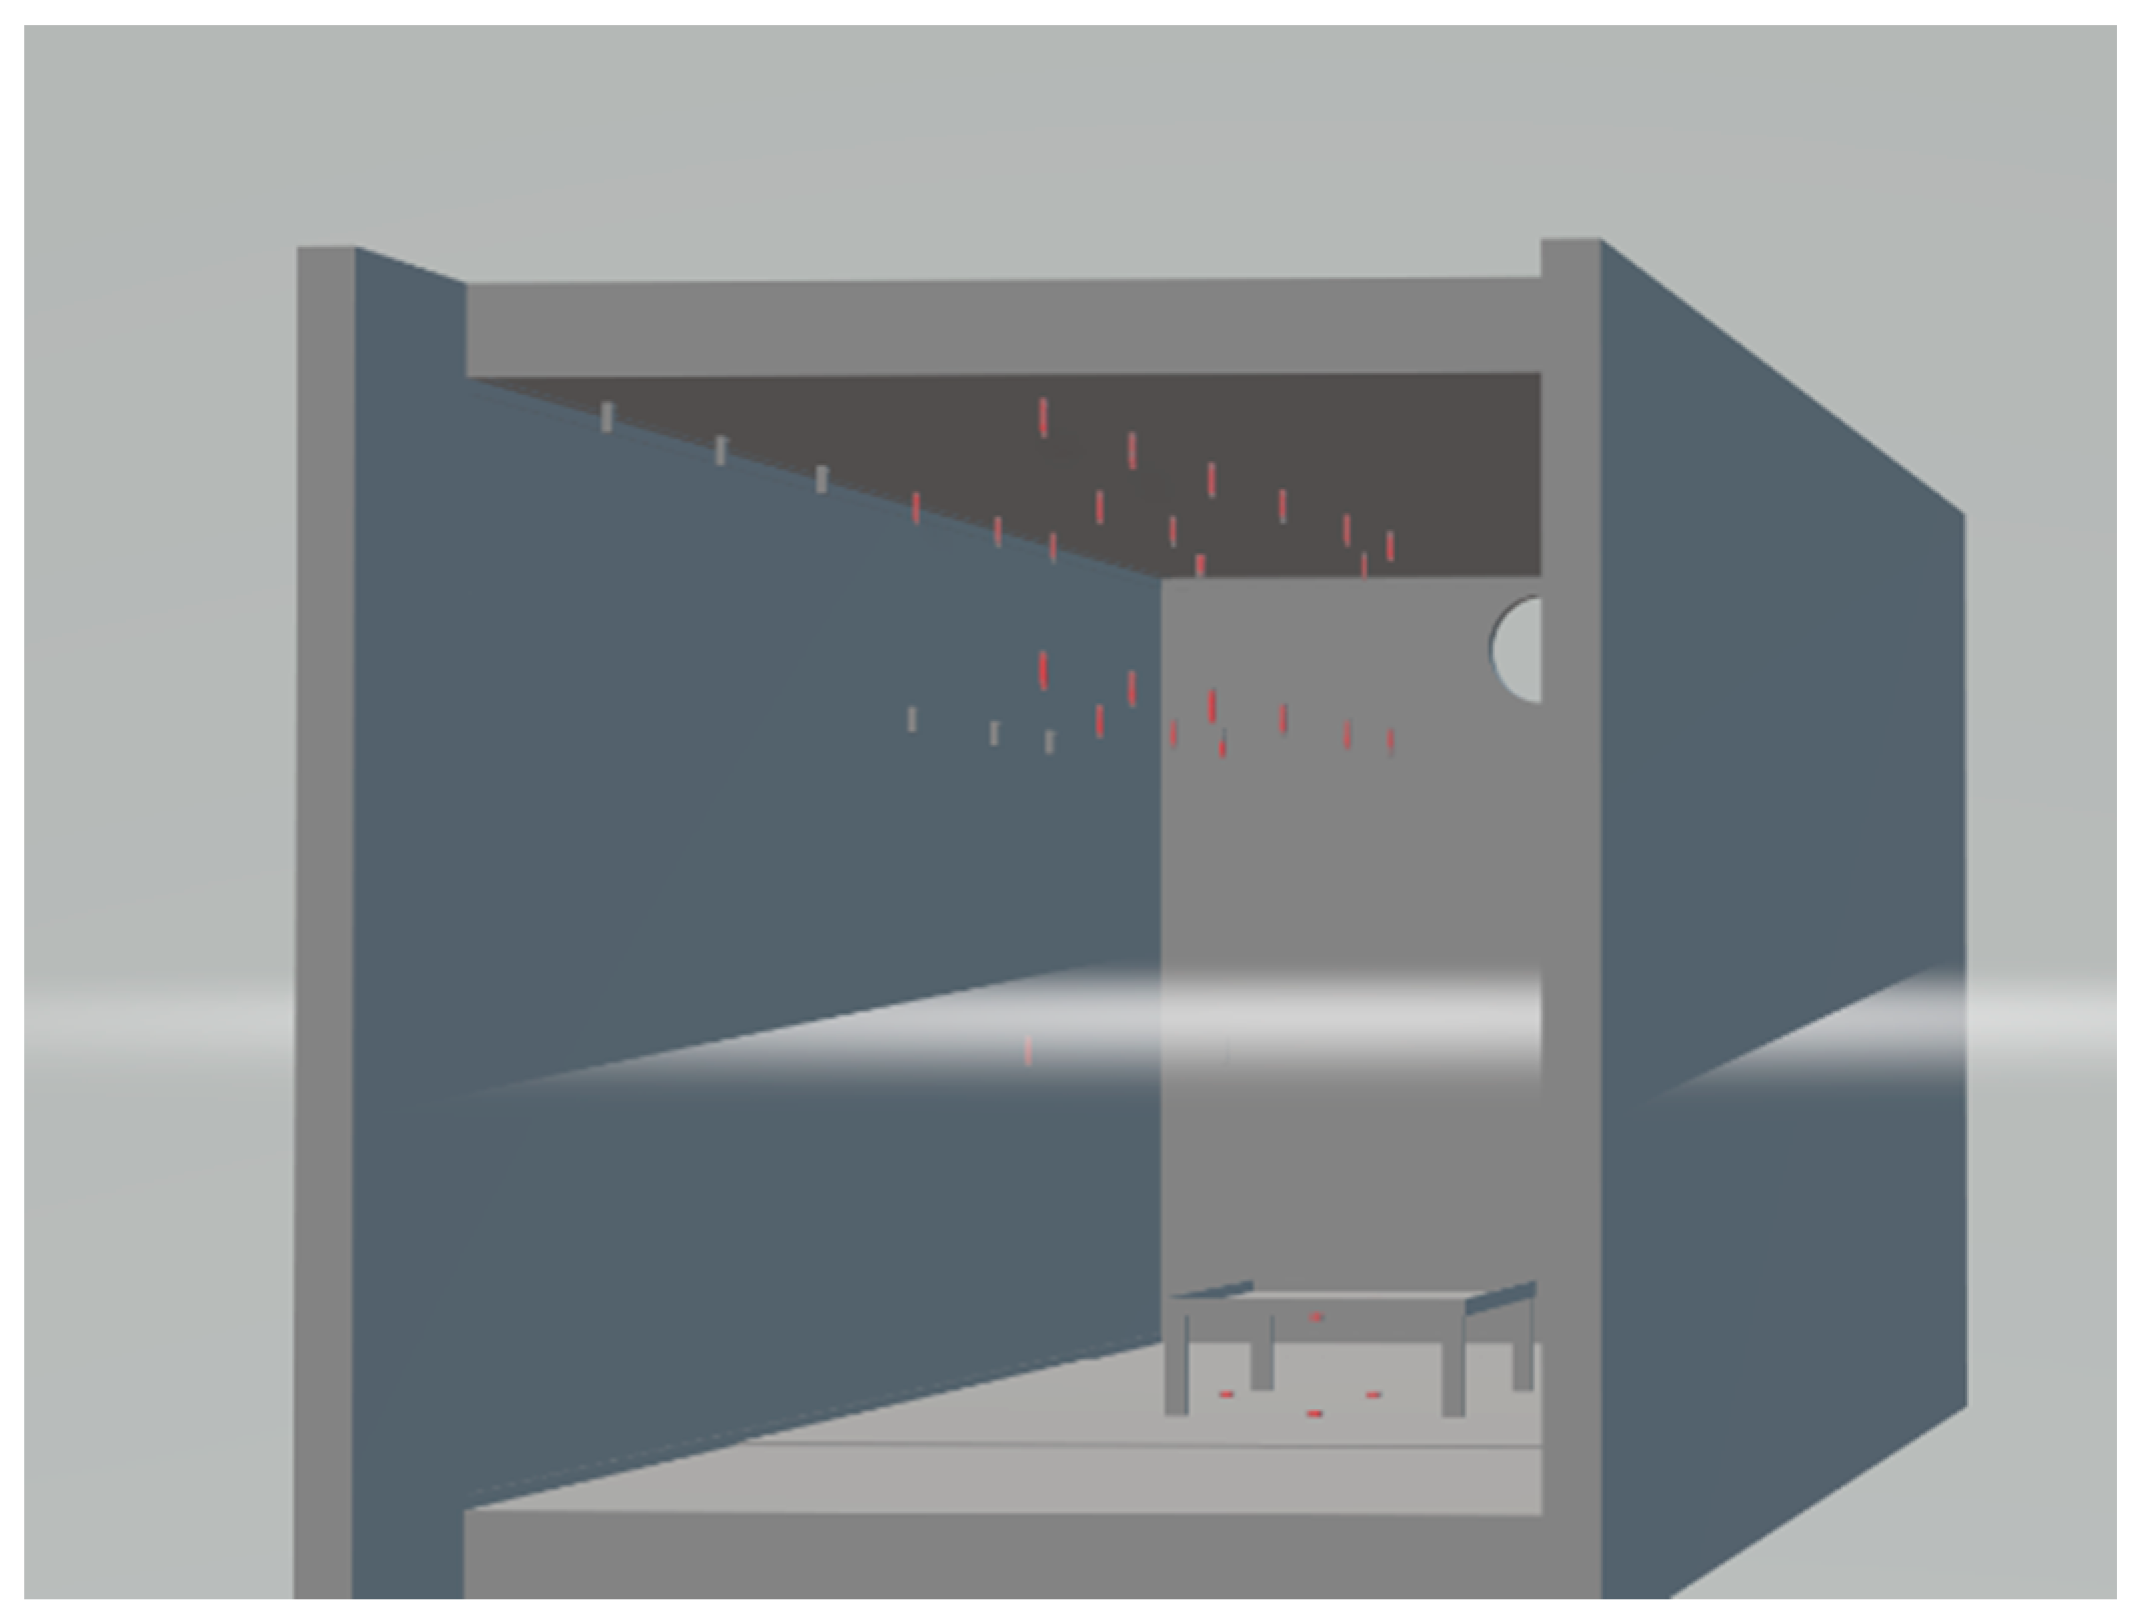
The hydrogen concentration was measured in the container with the 30 CANbus hydrogen sensors (mounted under the ceiling, 500 mm under the ceiling, and under the table) and 8 WIFI hydrogen sensors (mounted on the back wall of the container). Sensor location is illustrated in Figure 3 and Figure 4.
The experiments were designed for two ventilation volumetric airflow rates according to British Standard for 10 ACH and 6 ACH. The needed airflow rate was calculated to be 608 m3/h and 365 m3/h for 10 ACH and 6 ACH accordingly. The effect of the forced ventilation (ACH) on the hydrogen cloud concentration and duration was tested. The hydrogen was released through a 1 mm and 0.5 mm diameter nozzle from 60, 120, and 160 bar reservoir pressures (constant releases), and through a 0.5 mm diameter nozzle from 200, 350, and 700 bar reservoir pressures (blowdown). The pressure at the hydrogen crate and nozzle diameter were the controlling methods for mass flow rates during constant mass flow releases, while the pressure at the hydrogen tank, obtained during the filling process, was the controlling method for blowdown releases.
3. Results and Discussion
Experiments were performed in January 2021, regardless of weather conditions. The results and parameters of each experiment are listed in Table 2. Due to low temperatures (up to −19 °C) freezing issues occurred during experiments. For this reason, Exp. 1–3 and Exp. 17–18 do not have representative data and are not included in Table 2. The volumetric airflow was constantly measured during experiments, and the averaged ACH is listed in Table 2 (column 4). The initial pressure was read by the pressure transmitter (Table 2, column 6), and the mass flow rate (MFR) by the Coriolis mass flow meter (Table 2, column 7).
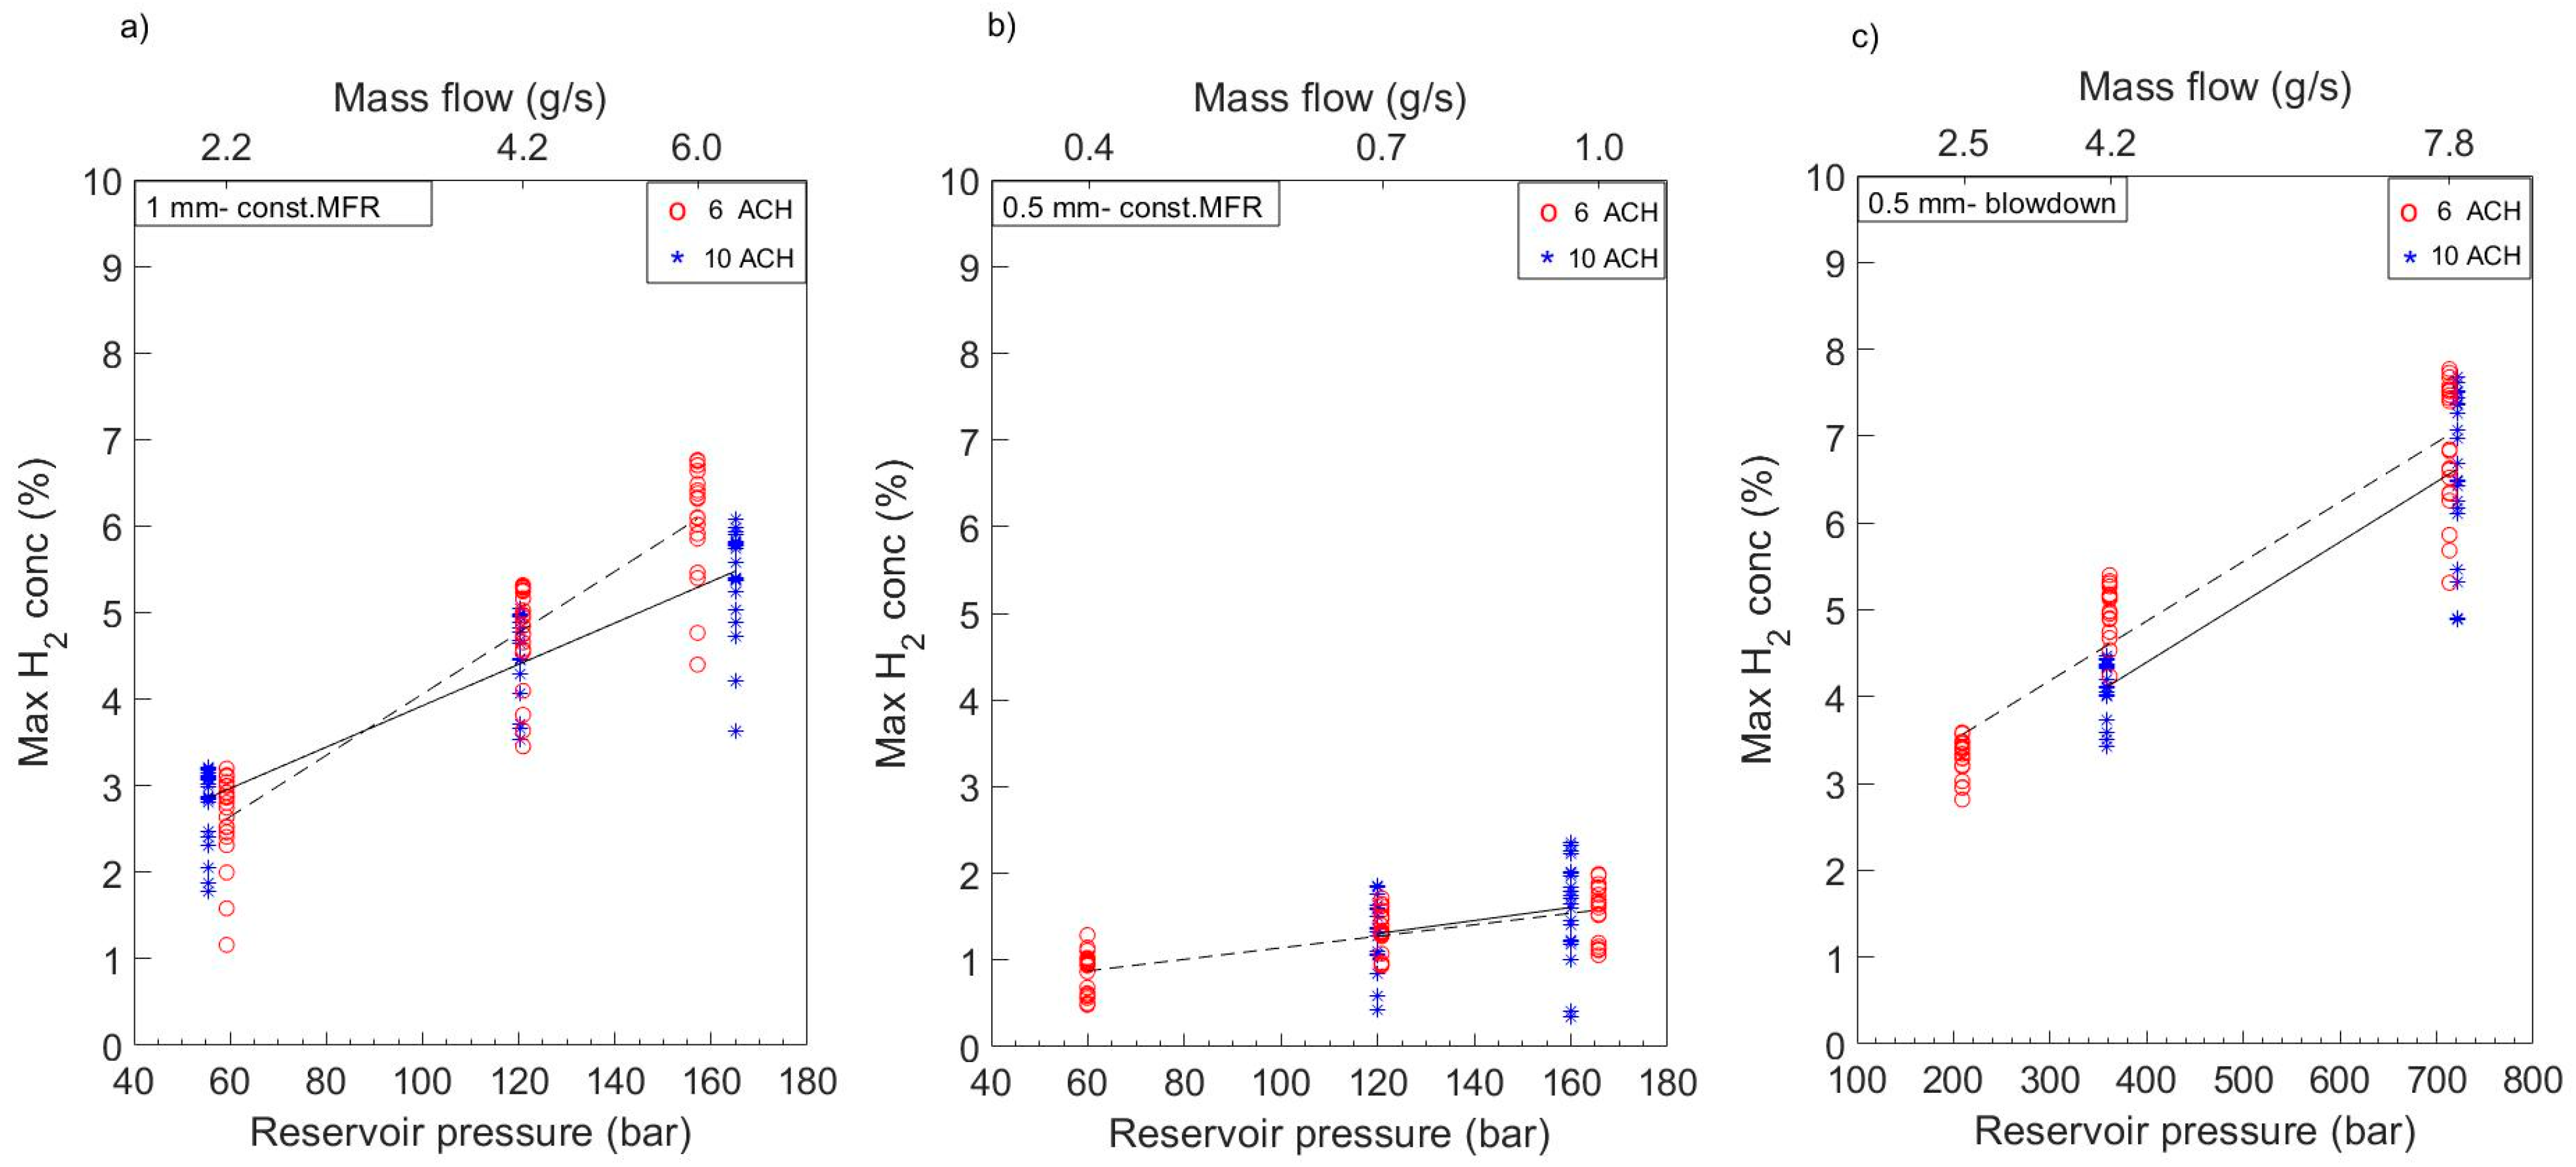
The higher hydrogen mass flows occurred with increasing reservoir pressure and/or nozzle diameter. The mass flow rates during all experiments were chocked at the nozzle. Hence, the non-reacting hydrogen jets (formed under the table) were momentum-dominated jets. Nevertheless, with a higher MFR the concentration in the cloud increased (Figure 5). Increasing nozzle diameter to 1 mm resulted in an MFR 6 times higher than the MFR that resulted during releases through a 0.5 mm diameter nozzle from the same reservoir pressure (Figure 5). The hydrogen concentration in the cloud, accordingly, was ~3 times higher. Decreased diameter with much higher reservoir pressure (Figure 5c) resulted in concentrations similar to those that resulted from releases through 1 mm (Figure 5a). Merilo at al. [5] pointed out the risk of deflagration for hydrogen releases with high mass flow rates when the ventilation rate was kept too low. Therefore, the mass flow rate limits have to be determined for the ventilation rate to keep hydrogen concentration under 10% to limit flame acceleration [13].
The effect of the mechanical ventilation on the concentration is shown in Figure 5. The red-circle markers represent the maximum concentration from each sensor above the car during the experiment with 6 ACH. The blue-star marker, accordingly, represents the maximum concentration with 10 ACH. The results of maximum concentration (constant mass flow releases (a) and (b) and blowdown releases (c)) with 6 ACH and 10 ACH were compared in Figure 5. The dashed line demonstrated a straight line fit to the experimental data with 6 ACH, as did the solid line with 10 ACH. The results in Figure 5 do not decisively show a decreased concentration with increased ventilation rate in this particular geometry. The maximum concentrations from 10 ACH and 6 ACH from releases at the same reservoir pressure overlapped with each other, showing small differences.
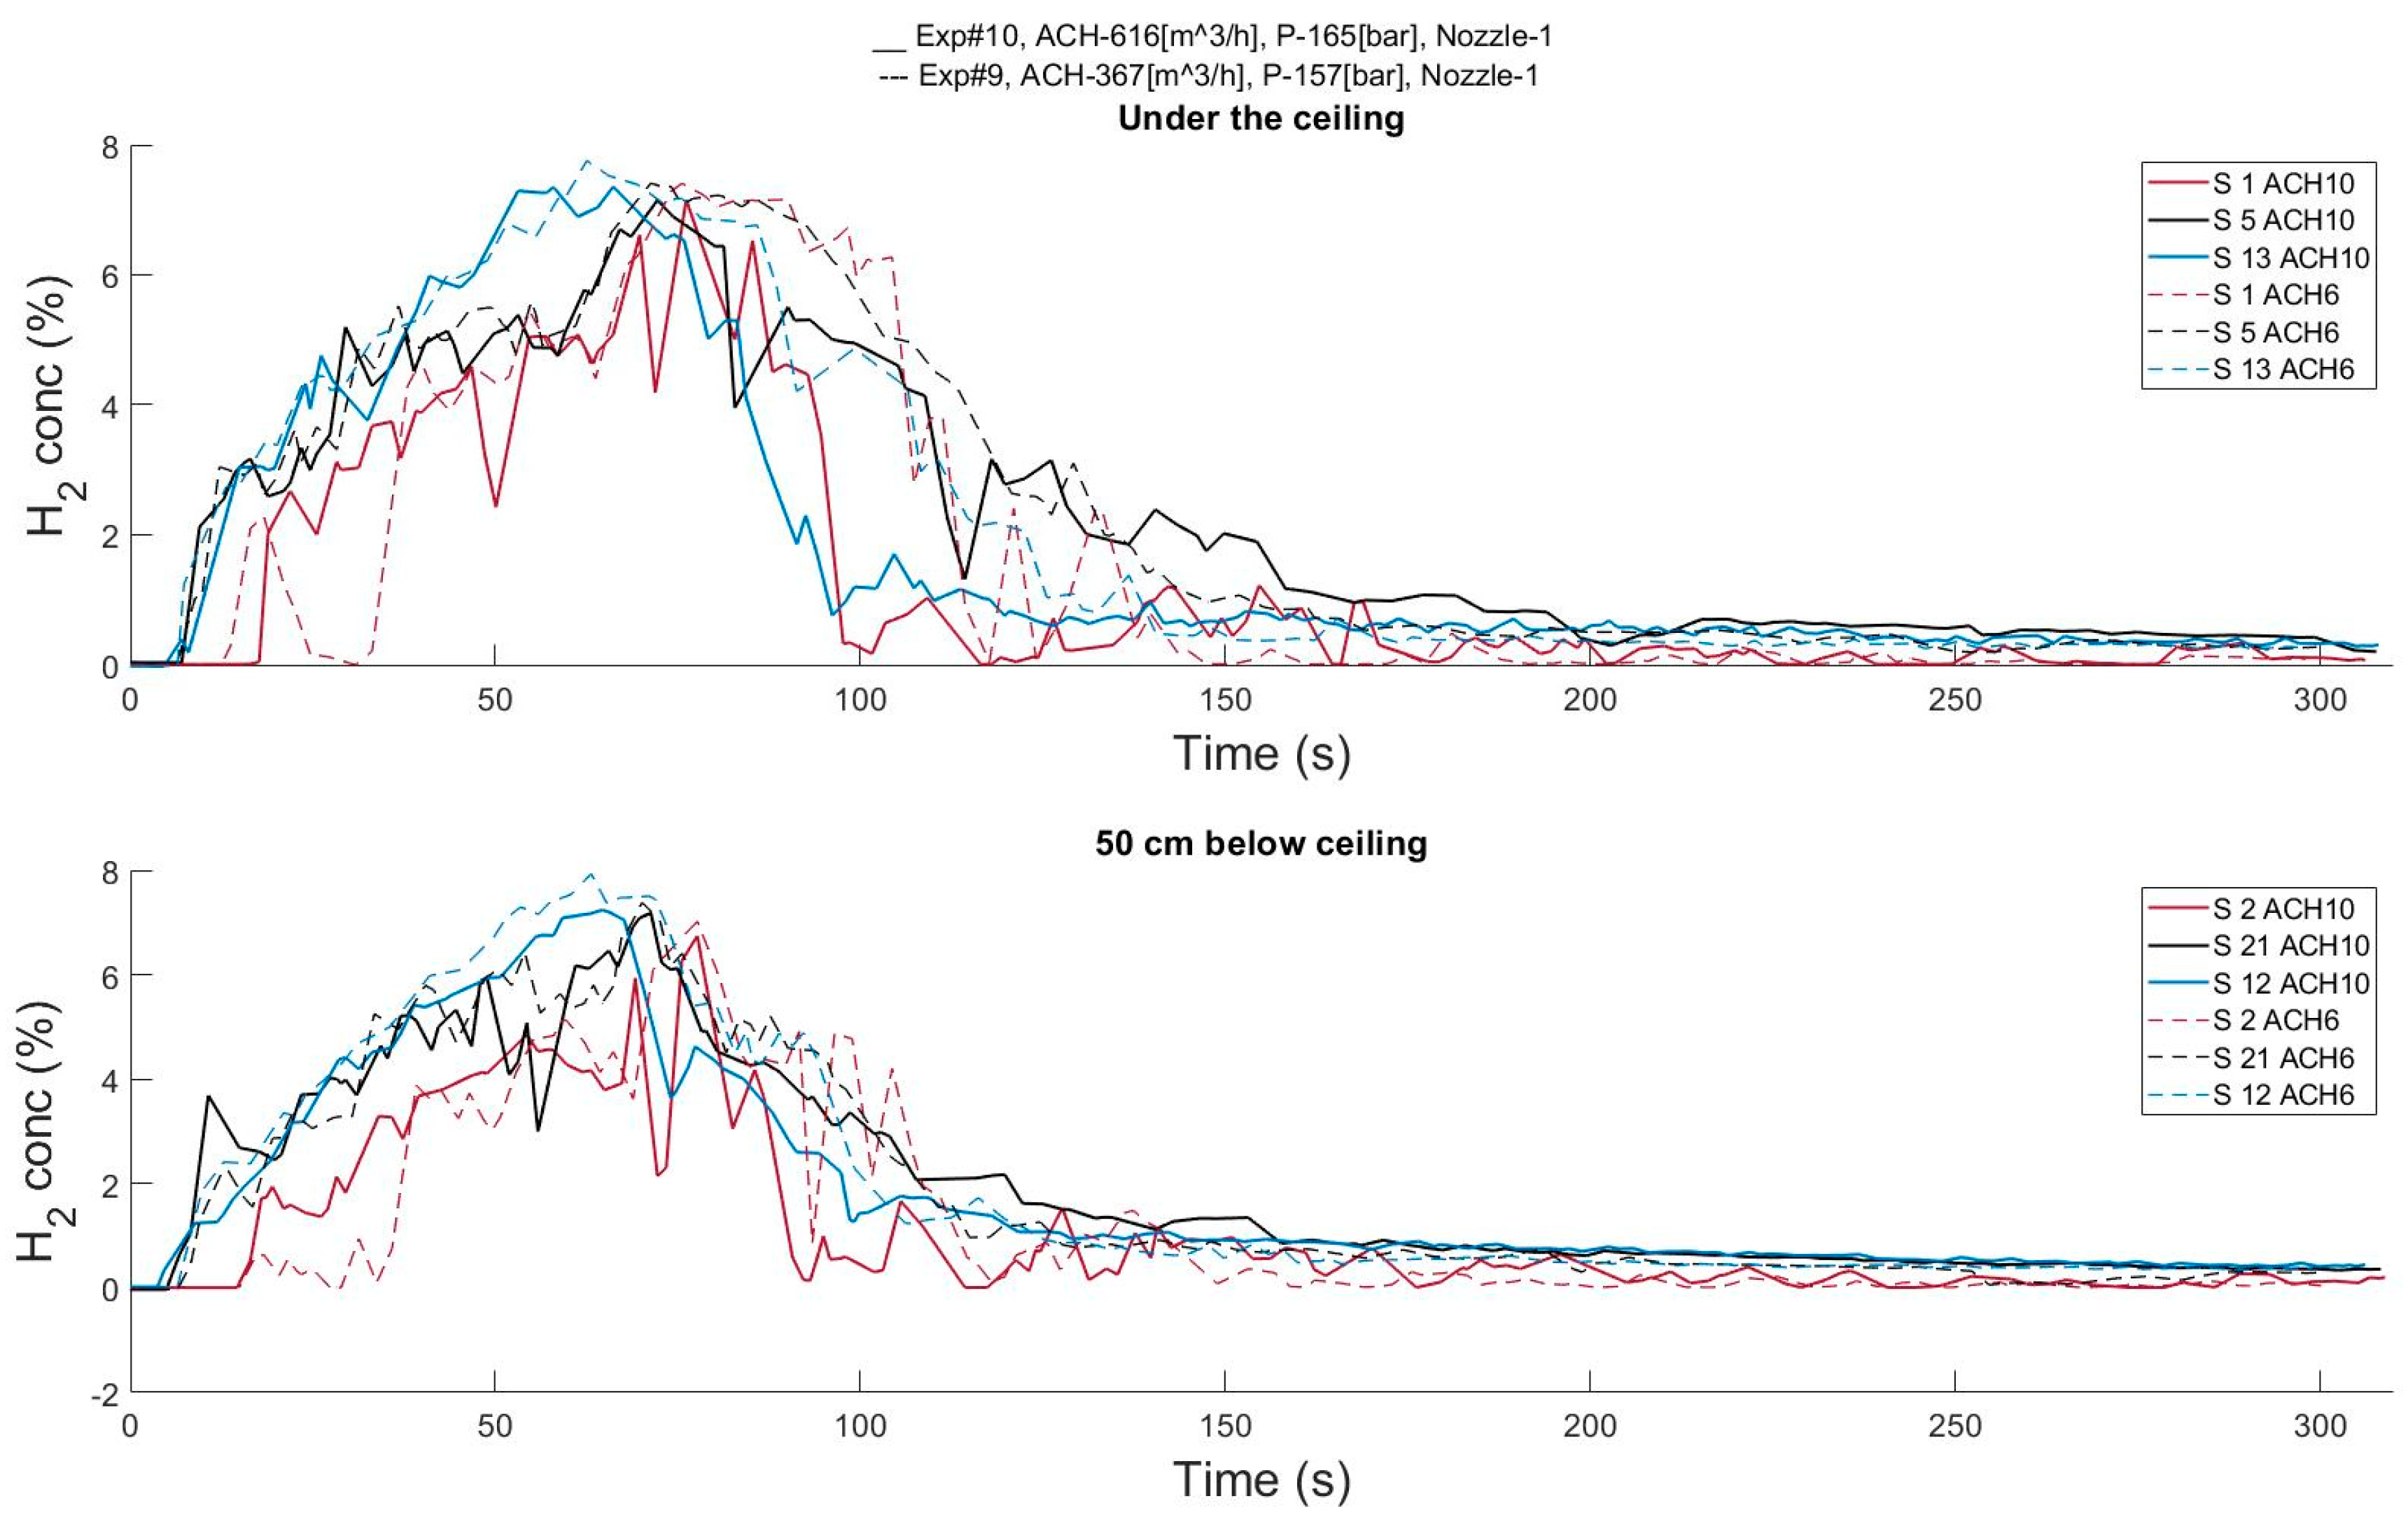
The concentration results from experiments with 10 ACH (Exp. 10, solid lines) and 6 ACH (Exp. 9, dash lines) are shown in Figure 6. The color of the line corresponds to the sensor’s location marked (with the same color) in Figure 3. The top plot shows concentration results from sensors mounted under the ceiling, as does the bottom plot for chosen sensors mounted 50 cm below the ceiling. The results from sensors mounted under the ceiling showed similar concentrations to sensors mounted 50 cm below the ceiling (Figure 6). Since sensors were not mounted closer to the container floor, the results indicate the cloud was at least 50 cm high, as the concentrations were more or less equal. By following line colors, the cloud propagation was observed from sensors closest to the nozzle—blue line (3.0 m and 4.5 m from the ventilation wall), black line (7.1 m and 8.6 m from the ventilation wall), and red line (11.6 m from the ventilation wall). The highest concentration was observed under the ceiling, closest to the ventilation wall (behind the table, upstream the ventilation flow). The hydrogen plume from under the table (car) rises towards the ceiling, and the increased concentration is measured simultaneously on both the blue and the black sensors. This indicates that there are plumes rising in front and behind (as well as along the sides) the table. For lower mass flows, the plumes are mostly at the rear of the table (closes to the nozzle). During blowdown releases, the plume at the front of the table decreases and disappears as the mass flow rate (and tank pressure) decreases.
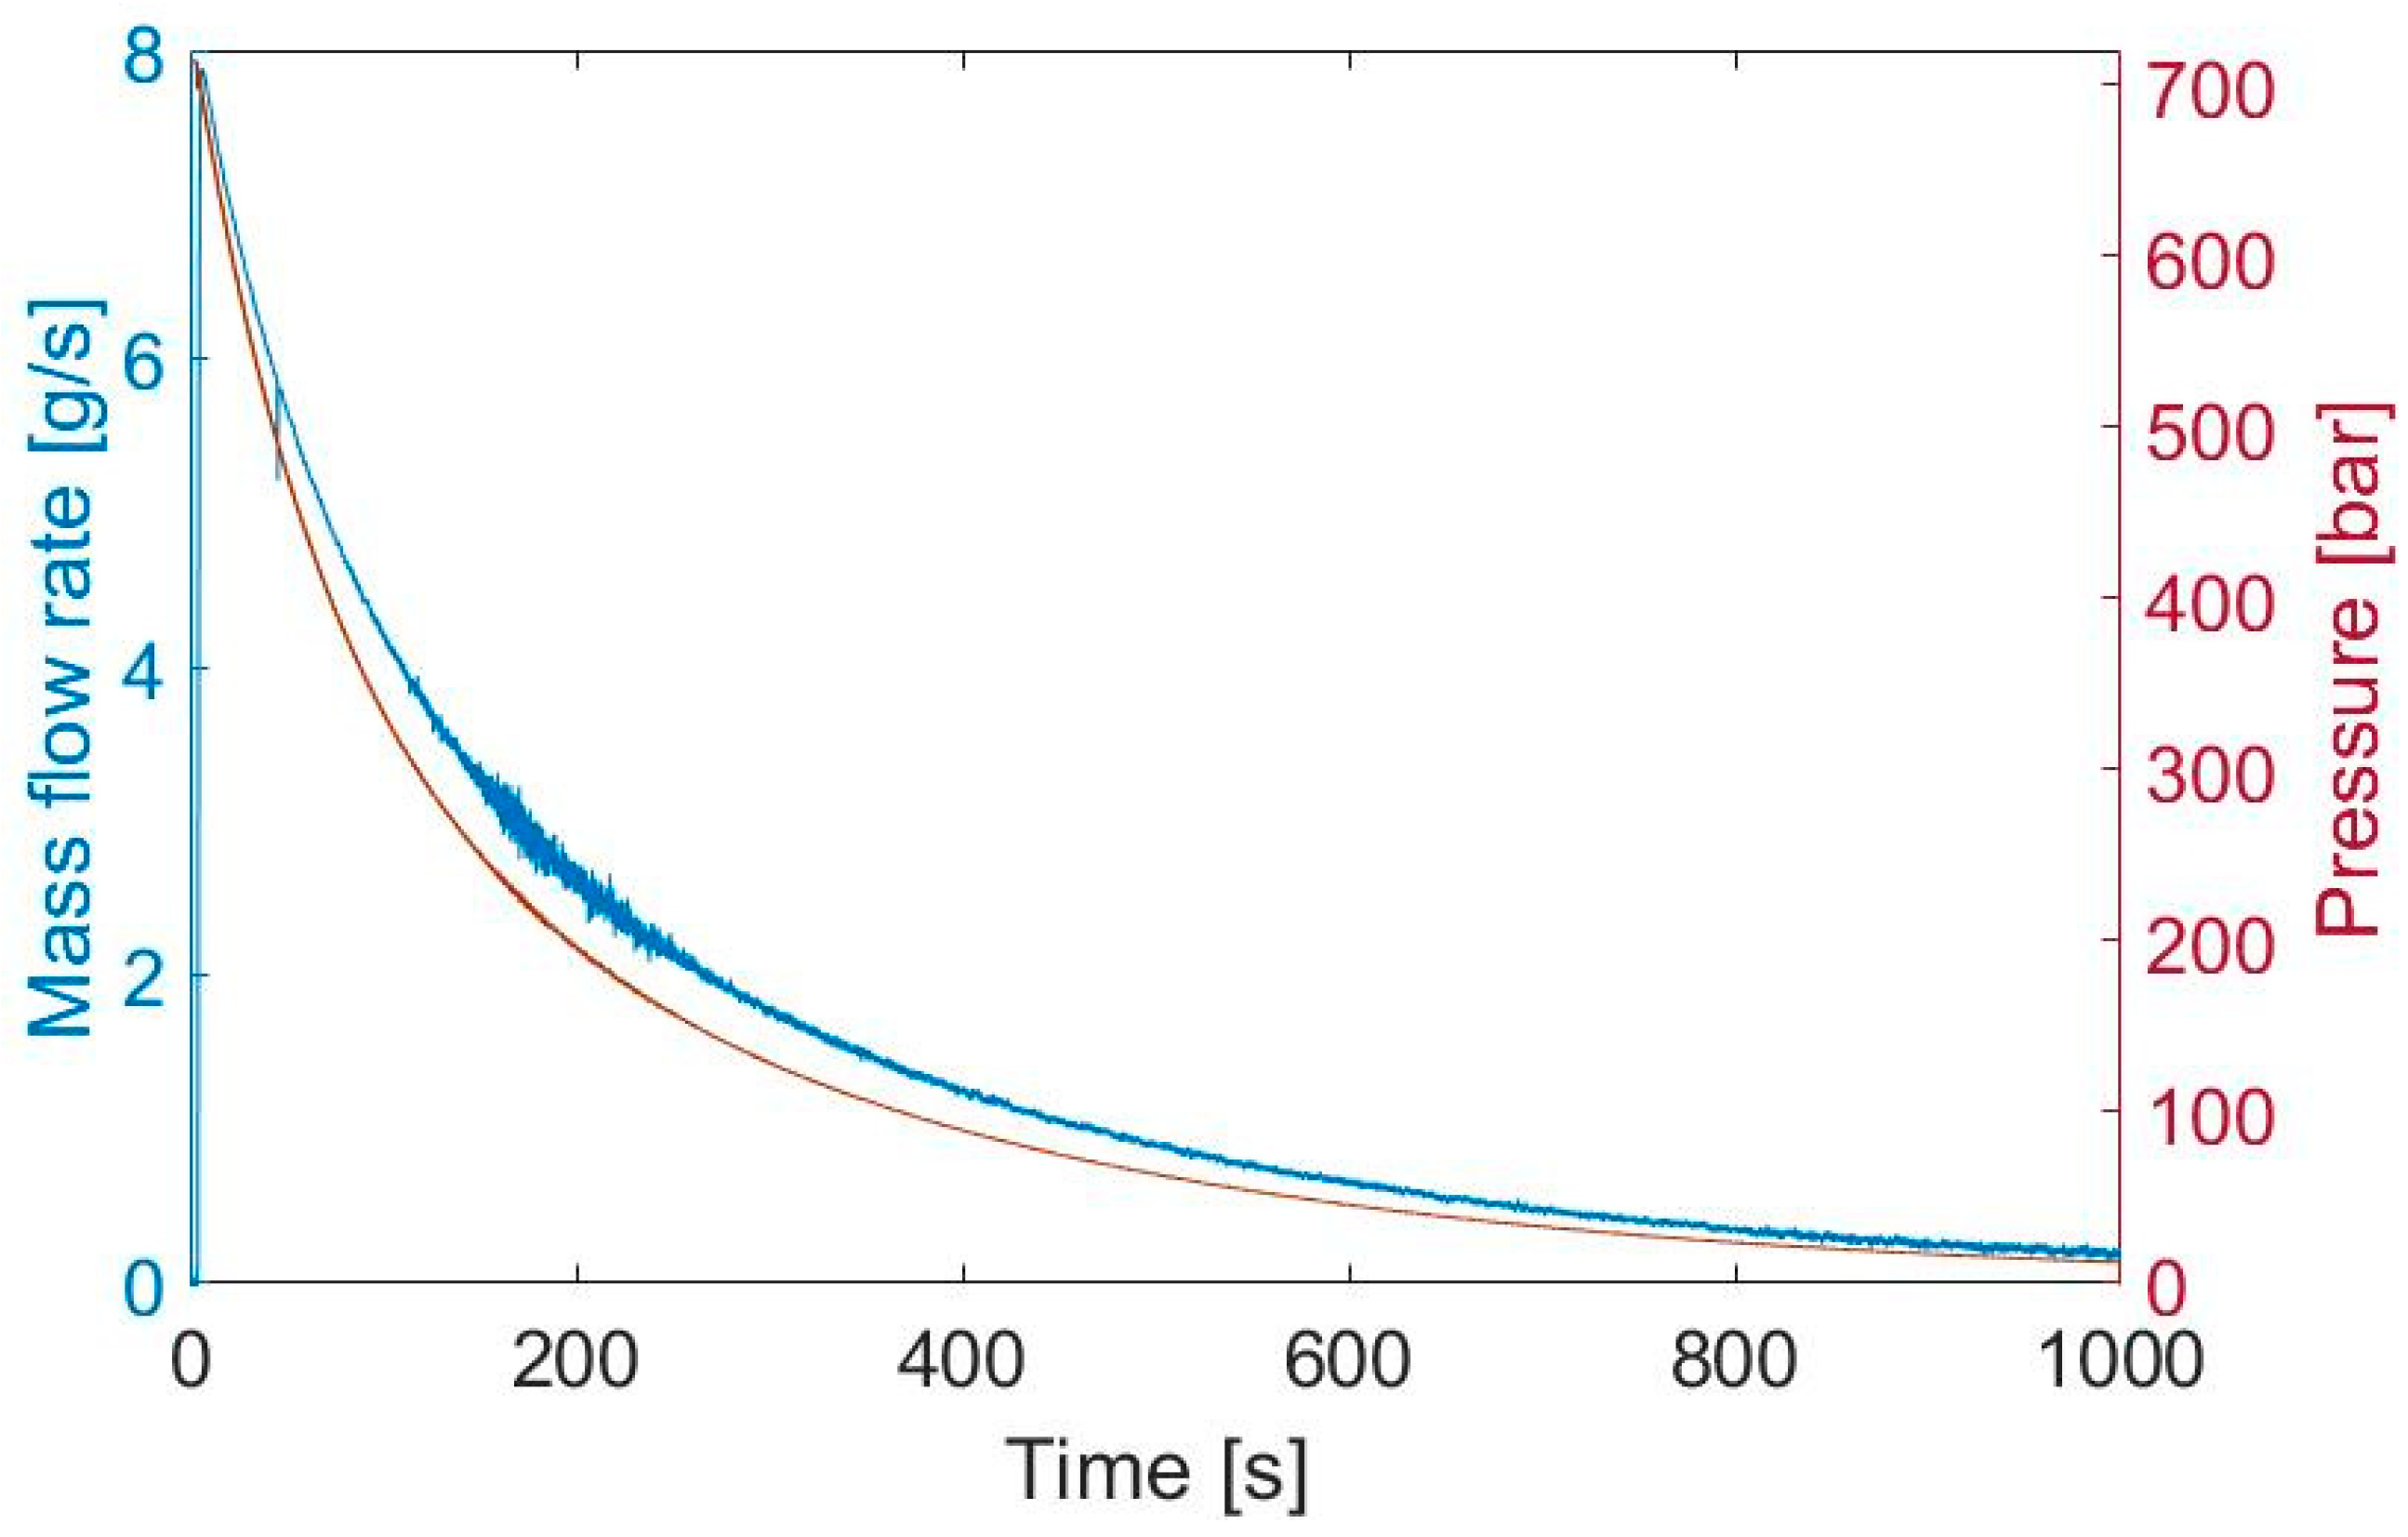
The effect of the ventilation on the duration of the flammable cloud was investigated further for the blowdown hydrogen releases. The blowdown experiments recorded the mass flow rate for a total of 900 s (Figure 7), after which the remaining pressure in the tank was 2–3% of the initial pressure. A hydrogen–air cloud can ignite when the concentration is within 4–75% by volume.
In Table 3, the total time, tf (column 6), when the cloud is flammable is presented together with the time when the concentration in the cloud reached 4% for the first time, tf0 (column 7).
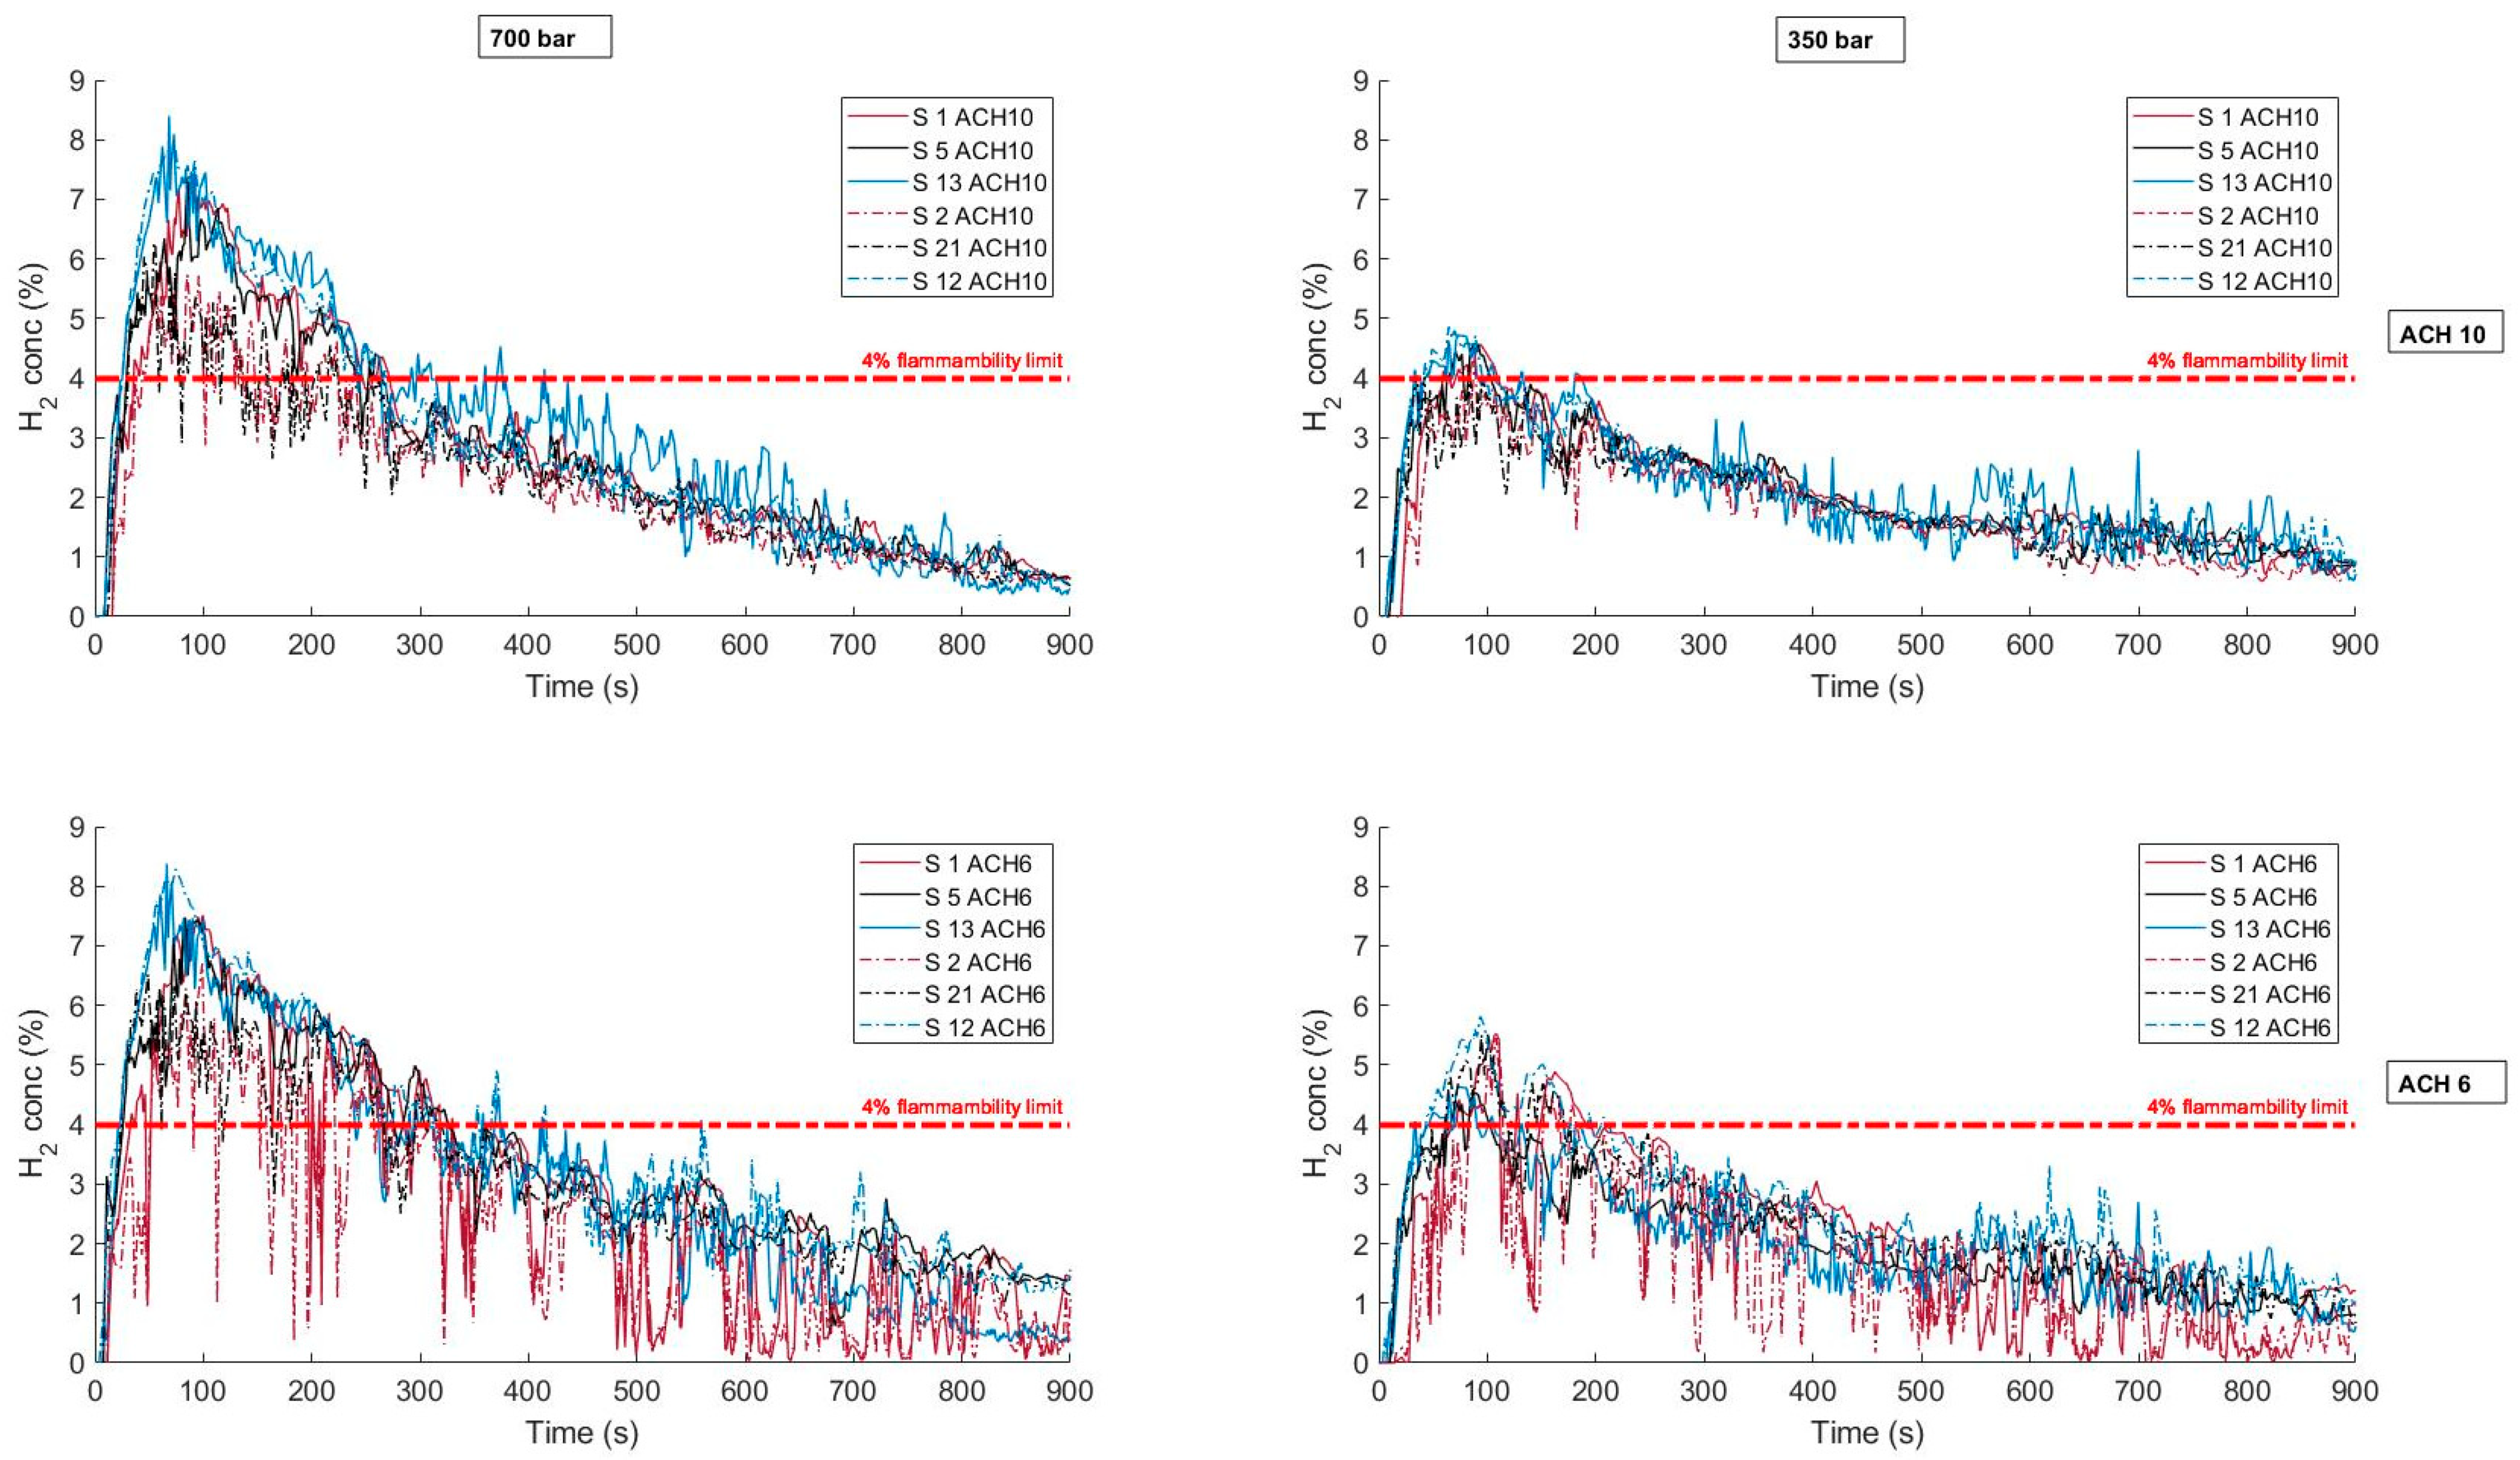
The total time when the hydrogen cloud is flammable was longer when the ventilation rate was lower (6 ACH), see Figure 8 and Table 3. When we compare Exp. 23 (p0 = 359, 10.2 ACH) with Exp. 21 (p0 = 362, 6.2 ACH), we observe that the total flammable time was almost 2 min longer. A 1 min increase in duration was observed when we compared the 700 bar experiments (Exp. 20 and Exp. 19). Since the MFR from reservoirs with higher pressure is higher, the natural consequence is that the flammable cloud occurs faster from those releases. Nevertheless, the ventilation rate has no (or very little) effect on the time when the cloud starts to be flammable. It is important to notice that the flammable time presented in Table 3 and Figure 8 is only for the geometry used during the experiments. However, the difference between flammable time resulting from the releases with 6 ACH and 10 ACH demonstrate the effect of higher ventilation rate on the time of risk of ignition or explosion. The shorter flammable time as an effect of increasing forced ventilation rate was presented earlier by Prasad et al. [12].
The concentration results from all experiments did not exceed 9%. This is below the 10% limit for fast flames described by Dorofeev et al. [15]. The authors, nevertheless, cannot state that it was due to applied ventilation rates since a ‘no-ventilation’ case was not performed. However, the concentrations were above the 4% lower flammability limit. The flame propagation in a slow regime is regarded to result in minor consequences.
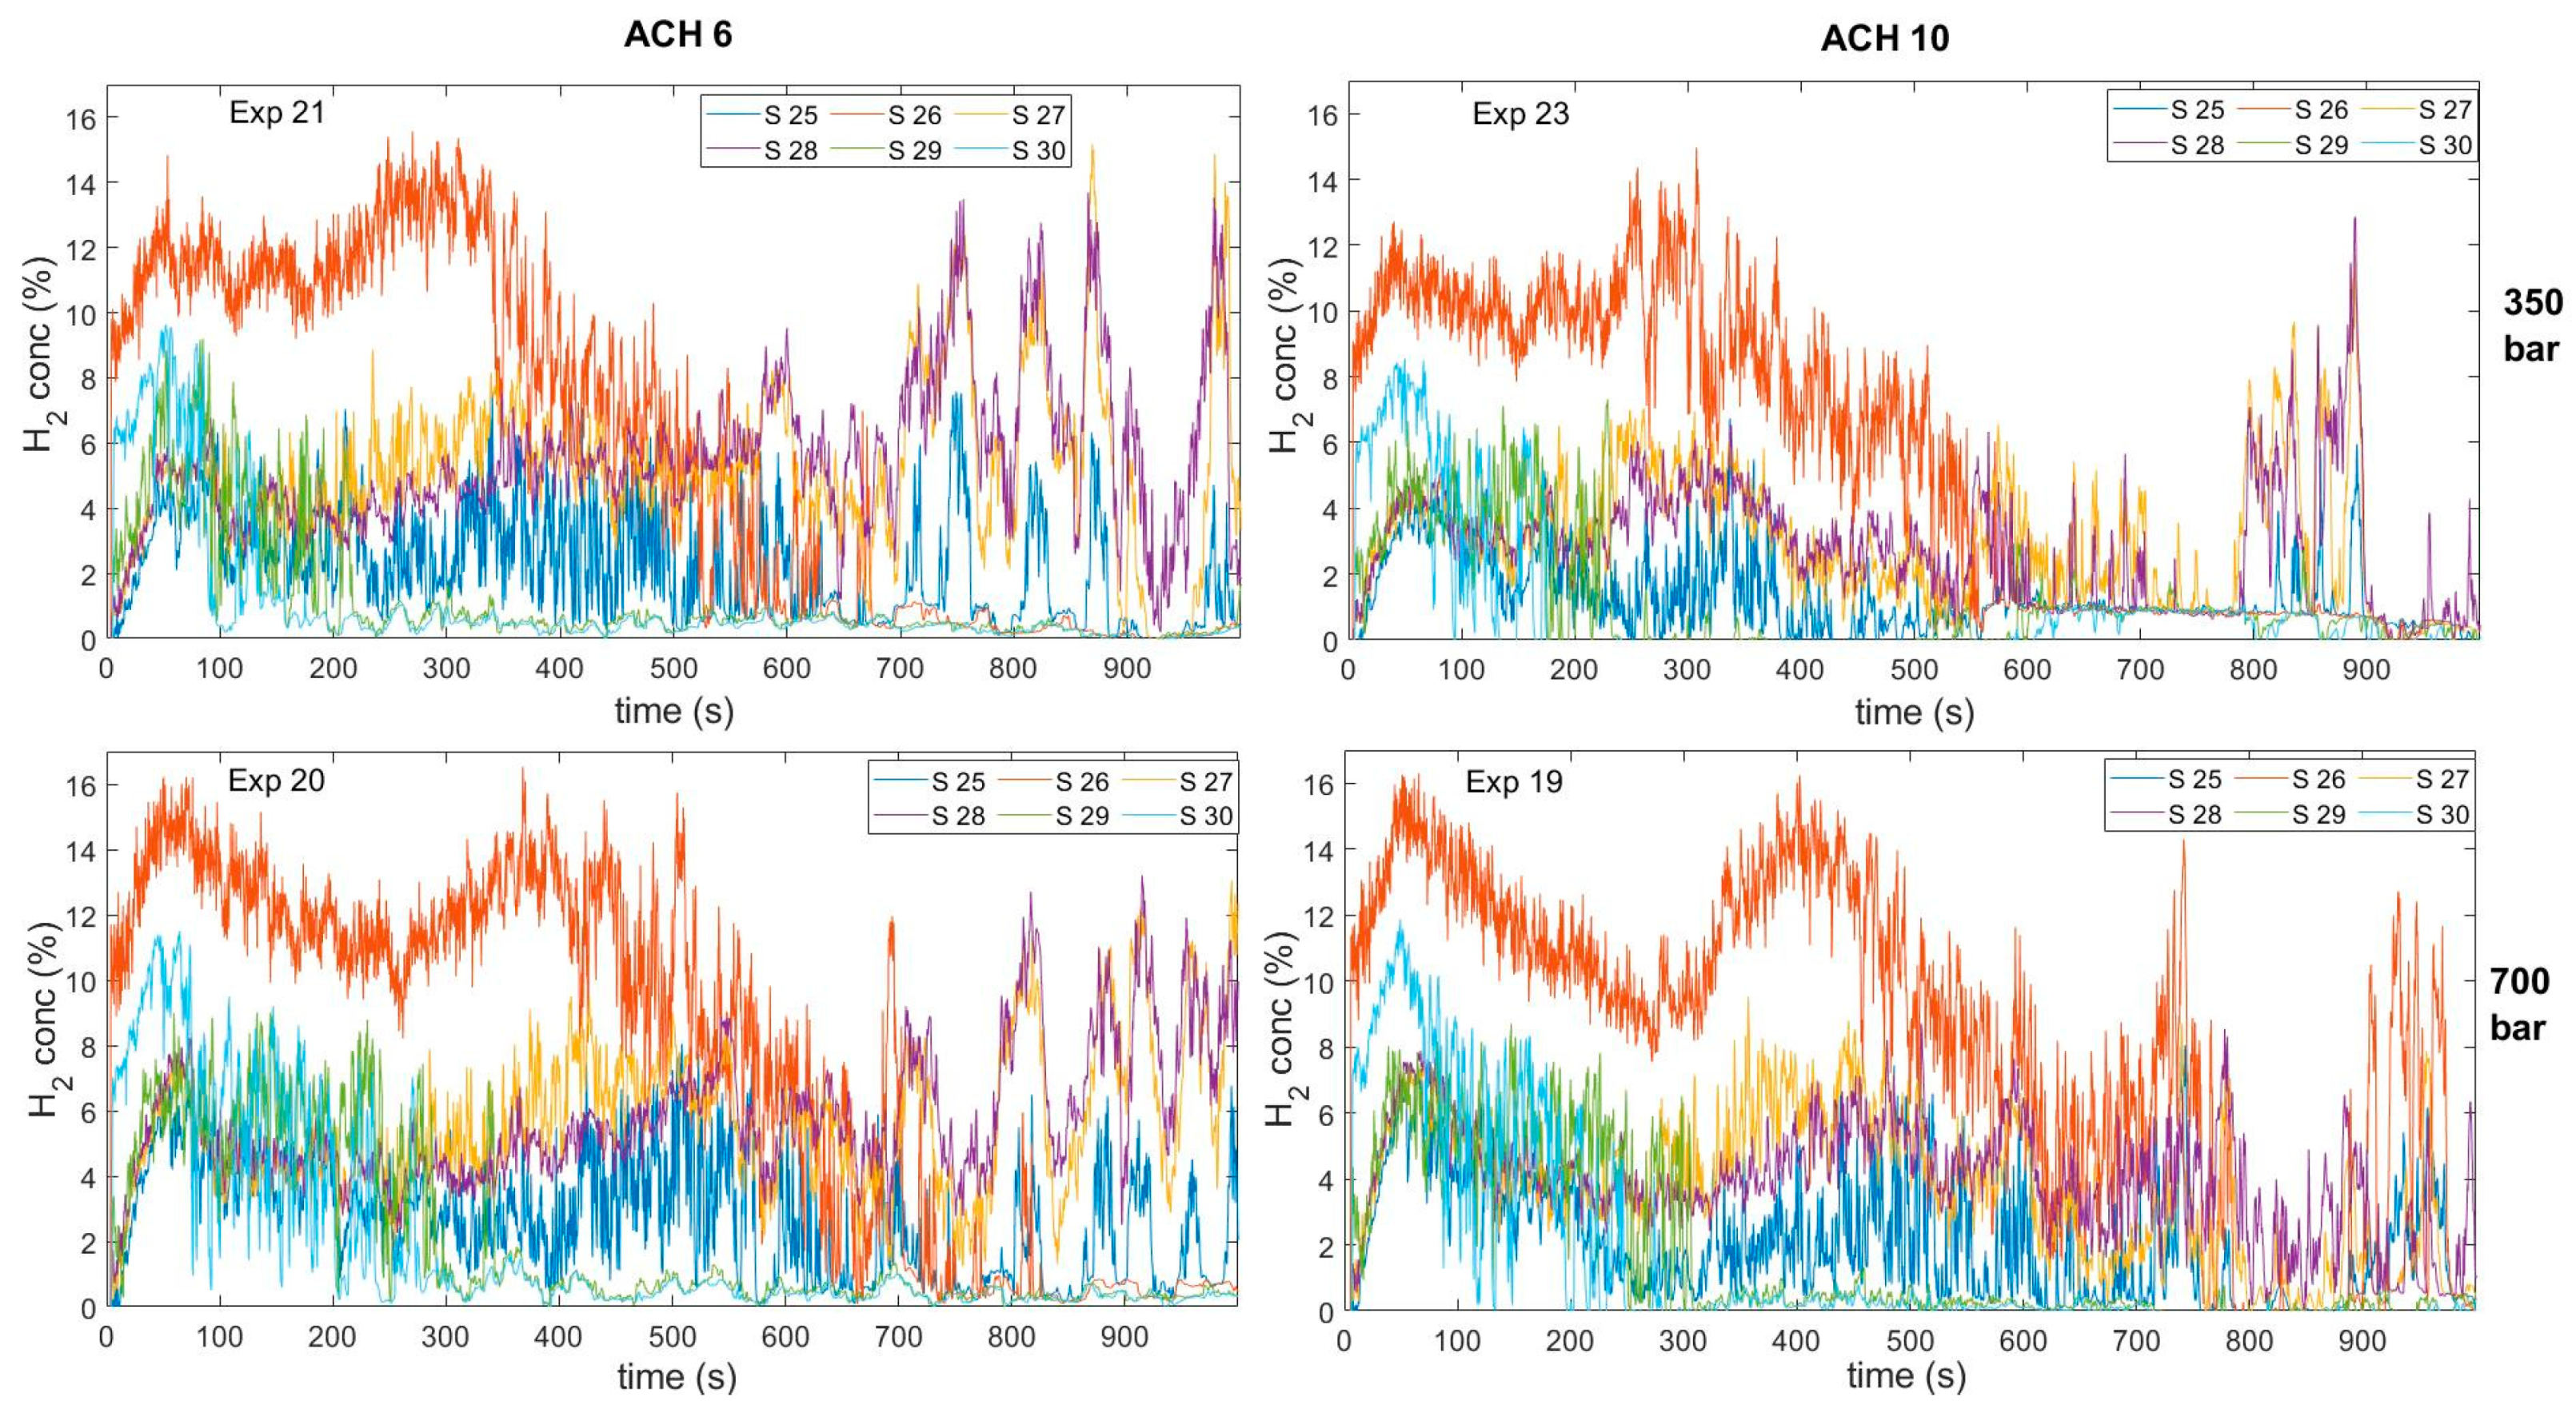
Six concentration sensors were placed under the car (Table 4) to measure hydrogen concentration in formed hydrogen plumes. During the releases, the main hydrogen plumes were on the sides, close to the nozzle (Figure 9, S 26). At the first 3–4 min of the release, the strong hydrogen plume was observed at the front of the table (S 29 and S 30). With decreasing mass flow, the hydrogen was eluding on the sides of the table. This can be observed in Figure 9, looking at the orange curve (S 26), which increased after the green (S 29) and light blue (S 30) curves decreased. The accumulation of the hydrogen under the table was observed at the end, where the purple curve (S 28) and the yellow curve (S 27) increased. The higher ventilation rate shows a decrease in hydrogen concentration at the end of the blowdown releases for both experiments with 350 bar and 700 bar initial pressure. Nevertheless, the influence of mechanical ventilation on the concentration under the car needs more investigation in further work.
4. Conclusions
The effect of the forced ventilation was investigated. The results of the presented experiments show the relation between hydrogen concentration from mass flow rate, reservoir pressure, and ventilation rate.
The maximum concentration results for 6 ACH and 10 ACH did not show a significant difference. The time when the cloud becomes flammable (reaches the minimum flammability limit 4%) has been observed differently for hydrogen releases with the same mass flow rate and different ventilation rates. The strongest effect observed during the experiments is on the duration of the flammable cloud, which reduces the duration twice for a ventilation rate with 10 ACH. The sufficiency of forced ventilation, used today, on hydrogen concentration was not conclusive in geometry used during experiments.
As per the recommendation for regulation codes and standards, it is recommended to keep the TPRD diameter small. A 0.5 mm diameter is preferred since the releases through 1 mm TPRD resulted in 3 times higher maximum concentrations. In the case of unintended hydrogen releases in the parking garage, the ventilation rate should be 10 ACH (or higher). Lower ventilation rates will result in a longer duration of a flammable cloud.
The experimental results will be used to validate the model in further work. The model will be an important tool to estimate the required forced ventilation rate for given hydrogen mass flow rates in a geometry.
Author Contributions
A.W.L. and A.V.G. devised the main conceptual ideas and methodology, A.W.L. conceived and planned experimental matrix, A.W.L. and A.V.G. carried out the experiments, A.V.G. developed and performed computation of raw data with A.W.L. assistance, A.W.L. possessed the experimental data, A.W.L. and A.V.G. analyzed the data and performed visualization, A.W.L. took the lead in writing the manuscript., A.V.G. supervised the project and reviewed the manuscript. All authors have read and agreed to the published version of the manuscript.
Funding
This research was funded by the Fuel Cells and Hydrogen 2 Joint Undertaking (JU) under grant agreement No. 826193. The JU receives support from the European Union’s Horizon 2020 research and innovation programme and United Kingdom, Germany, Greece, Denmark, Spain, Italy, Netherlands, Belgium, France, Norway, Switzerland.
Institutional Review Board Statement
Not applicable.
Informed Consent Statement
Not applicable.
Data Availability Statement
Data supporting reported results are available in public USN repository that issues datasets with doi:10.23642/usn.14405903.
Acknowledgments
This work was performed within MoZEES. A Norwegian Centre for Environment-friendly Energy Research (FME), co-sponsored by the Research Council of Norway (project number 257653) and 40 partners from research, industry, and the public sector.
Conflicts of Interest
The authors declare no conflict of interest.
References
- Dadashzadeh, M.; Ahmad, A.; Khan, F. Dispersion modelling and analysis of hydrogen fuel gas released in an enclosed area: A CFD-based approach. Fuel 2016, 184, 192–201. [Google Scholar] [CrossRef]
- De Stefano, M.; Rocourt, X.; Sochet, I.; Daudey, N. Hydrogen dispersion in a closed environment. Int. J. Hydrogen Energy 2018, 44, 9031–9040. [Google Scholar] [CrossRef]
- He, J.; Kokgil, E.; Wang, L.L.; Ng, H.D. Assessment of similarity relations using helium for prediction of hydrogen dispersion and safety in an enclosure. Int. J. Hydrogen Energy 2016, 41, 15388–15398. [Google Scholar] [CrossRef] [Green Version]
- Pitts, W.M.; Yang, J.C.; Fernandez, M.G. Helium dispersion following release in a 1/4-scale two-car residential garage. Int. J. Hydrogen Energy 2012, 37, 5286–5298. [Google Scholar] [CrossRef]
- Merilo, E.G.; Groethe, M.A.; Colton, J.D.; Chiba, S. Experimental study of hydrogen release accidents in a vehicle garage. Int. J. Hydrogen Energy 2011, 36, 2436–2444. [Google Scholar] [CrossRef]
- Gupta, S.; Brinster, J.; Studer, E.; Tkatschenko, I. Hydrogen related risks within a private garage: Concentration measurements in a realistic full scale experimental facility. Int. J. Hydrogen Energy 2009, 34, 5902–5911. [Google Scholar] [CrossRef]
- Cariteau, B.; Brinster, J.; Studer, E.; Tkatschenko, I.; Joncquet, G. Experimental results on the dispersion of buoyant gas in a full scale garage from a complex source. Int. J. Hydrogen Energy 2011, 36, 2489–2496. [Google Scholar] [CrossRef]
- Beard, T.; Bragin, M.; Malalasekera, W.; Ibrahim, S.S. Numerical Simulation of hydrogen discharge in a partially enclosed space. Energy Procedia 2015, 66, 153–156. [Google Scholar] [CrossRef] [Green Version]
- Kim, J.S.; Yang, W.; Kim, Y.; Won, S.H. Behavior of buoyancy and momentum controlled hydrogen jets and flames emitted into the quiescent atmosphere. J. Loss Prev. Process Ind. 2009, 22, 943–949. [Google Scholar] [CrossRef]
- Veser, A.; Kuznetsov, M.; Fast, G.; Friedrich, A.; Kotchourko, N.; Stern, G.; Schwall, M.; Breitung, W. The structure and flame propagation regimes in turbulent hydrogen jets. Int. J. Hydrogen Energy 2011, 36, 2351–2359. [Google Scholar] [CrossRef]
- Prasad, K. High-pressure release and dispersion of hydrogen in a partially enclosed compartment: Effect of natural and forced ventilation. Int. J. Hydrogen Energy 2014, 39, 6518–6532. [Google Scholar] [CrossRef]
- Prasad, K.; Pitts, W.M.; Fernandez, M.; Yang, J.C. Natural and forced ventilation of buoyant gas released in a full-scale garage: Comparison of model predictions and experimental data. Int. J. Hydrogen Energy 2012, 37, 17436–17445. [Google Scholar] [CrossRef]
- Hu, P.; Zhai, S. Experimental study of lean hydrogen-air mixture combustion in a 12 m3 tank. Prog. Nucl. Energy 2021, 133, 103633. [Google Scholar] [CrossRef]
- Ono, R.; Nifuku, M.; Fujiwara, S.; Horiguchi, S.; Oda, T. Minimum ignition energy of hydrogen-air mixture: Effects of humidity and spark duration. J. Electrostat. 2007, 65, 87–93. [Google Scholar] [CrossRef]
- Dorofeev, S.B.; Kuznetsov, M.S.; Alekseev, V.I.; Efimenko, A.A.; Breitung, W. Evaluation of limits for effective flame accelaration in hydrogen mixtures. J. Loss Prev. Process Ind. 2001, 14, 583–589. [Google Scholar] [CrossRef] [Green Version]
- Kumamoto, A.; Iseki, H.; Ono, R.; Oda, T. Measurement of minimum ignition energy in hydrogen-oxygen-nitrogen premixed gas by spark discharge. J. Phys. Conf. Ser. 2011, 301, 012039. [Google Scholar] [CrossRef] [Green Version]
- Hussein, H.; Brennan, S.; Molkov, V. Dispersion of hydrogen release in a naturally ventilated covered car park. Int. J. Hydrogen Energy 2020, 45, 23882–23897. [Google Scholar] [CrossRef]
- Brennan, S.; Molkov, V. Pressure peaking phenomenon for indoor hydrogen releases. Int. J. Hydrogen Energy 2018, 43, 18530–18541. [Google Scholar] [CrossRef]
- Makarov, D.; Shentsov, V.; Kuznetsov, M.; Molkov, V. Pressure peaking phenomenon: Model validation against unignited release and jet fire experiments. Int. J. Hydrogen Energy 2018, 43, 9454–9469. [Google Scholar] [CrossRef]
- Lach, A.W.; Vagner Gaathaug, A.; Vaagsaether, K. Pressure peaking phenomena: Unignited hydrogen releases in confined spaces- Large scale experiments. Int. J. Hydrogen Energy 2020, 45, 32702–32712. [Google Scholar] [CrossRef]
- Lach, A.W.; Gaathaug, A.V. Large scale experiments and model validation of Pressure Peaking Phenomena-ignited hydrogen releases. Int. J. Hydrogen Energy 2021, 46, 8317–8328. [Google Scholar] [CrossRef]
- Malakhov, A.A.; Avdeenkov, A.V.; du Toit, M.H.; Bessarabov, D.G. CFD simulation and experimental study of a hydrogen leak in a semi-closed space with the purpose of risk mitigation. Int. J. Hydrogen Energy 2020, 45, 9231–9240. [Google Scholar] [CrossRef]
Figure 1.
40 ft ISO container with installed equipment and instrumentation.

Figure 2.
P and ID for hydrogen releases during experiments with constant and blowdown mass flow releases.
Figure 2.
P and ID for hydrogen releases during experiments with constant and blowdown mass flow releases.

Figure 3.
Location of the hydrogen sensors. Circle markers: red—S1, S2; black—S5, S21; blue—S13, S12.
Figure 3.
Location of the hydrogen sensors. Circle markers: red—S1, S2; black—S5, S21; blue—S13, S12.

Figure 4.
Hydrogen sensors’ placement in the container. Red—CANbus sensors, grey—WIFI sensors.

Figure 5.
Maximum hydrogen concentration resulted with 6 ACH (dash line) and 10 ACH (solid line) during constant mass flow releases (a) through 1 mm diameter nozzle, (b) 0.5 mm diameter nozzle, and (c) blowdown mass flow releases through 0.5 mm nozzle. Maximum concentrations at each sensor during 10 ACH (blue star) and 6 ACH (red circle).

Figure 6.
Concentration in the cloud and its propagation from hydrogen releases with 10 ACH and 6 ACH.
Figure 6.
Concentration in the cloud and its propagation from hydrogen releases with 10 ACH and 6 ACH.

Figure 7.
Mass flow rate and pressure at the tank measured during Exp. 20: 700 bar.

Figure 8.
Concentration results from blowdown hydrogen releases with ventilation 10 ACH and 6 ACH. Solid lines-sensors mounted under the ceiling, dash lines-sensors mounted 50 cm under the ceiling.
Figure 8.
Concentration results from blowdown hydrogen releases with ventilation 10 ACH and 6 ACH. Solid lines-sensors mounted under the ceiling, dash lines-sensors mounted 50 cm under the ceiling.

Figure 9.
Concentration results from sensors mounted under the car for Experiments 19–21 and 23.


Table 1.
Uncertainty of measurements.
| Equipment | Measurement Uncertainty | Absolute Measurement Uncertainty |
|---|---|---|
| ESI Pressure transmitter | ±1% FSO BFSL | ±10 bar |
| GAMS Differential pressure transmitter | ±1% FS | ±15 m3/h (±0.2 ACH) |
| Mass flow | ±0.2% of flow rate | |
| Concentration | ±1% FS | ±1% |
Table 2.
Experimental parameters.
| Exp | Nozzle Diameter (mm) | ACH (1/h) | ACH Measured (1/h) | Exp Matrix p0 (bar) | Measured p0 (bar) | MFR (g/s) | H2 Release Time (s) | Out Temp. (°C) |
|---|---|---|---|---|---|---|---|---|
| 3 | 0.5 | 10 | 9.5 | 120 | - | 1.1 | 30 | −1 |
| 4 | 0.5 | 10 | 9.8 | 120 | - | 0.8 | 60 | −1 |
| 5 | 0.5 | 10 | 9.8 | 160 | - | 1.1 | 60 | −1 |
| 6 | 0.5 | 6 | 6.0 | 160 | 166 | 1.0 | 60 | −3 |
| 7 | 0.5 | 6 | 6.0 | 120 | 121 | 0.7 | 60 | −3 |
| 8 | 0.5 | 6 | 6.0 | 60 | 60 | 0.4 | 60 | −3 |
| 9 | 1.0 | 6 | 6.0 | 160 | 157 | 6.0 | 60 | −3 |
| 10 | 1.0 | 10 | 10.0 | 160 | 165 | 6.0 | 60 | −3 |
| 11 | 1.0 | 10 | 10.0 | 120 | 140 | 5.2 | 60 | −3 |
| 12 | 1.0 | 10 | 10.0 | 120 | 120 | 4.2 | 60 | −3 |
| 13 | 1.0 | 6 | 6.0 | 120 | 121 | 4.2 | 60 | −1 |
| 14 | 1.0 | 6 | 6.0 | 60 | 59 | 2.2 | 60 | −1 |
| 15 | 1.0 | 10 | 9.8 | 60 | 55 | 2.2 | 60 | −1 |
| 16 | 1.0 | 10 | 9.8 | 140 | 144 | 5.3 * | 1000 | −1 |
| 19 | 0.5 | 10 | 10.2 | 700 | 721 | 7.9 * | 1000 | −5 |
| 20 | 0.5 | 6 | 6.2 | 700 | 713 | 7.8 * | 1000 | −3 |
| 21 | 0.5 | 6 | 6.2 | 360 | 362 | 4.2 * | 1000 | −4 |
| 22 | 0.5 | 6 | 6.2 | 207 | 209 | 2.5 * | 1000 | −2 |
| 23 | 0.5 | 10 | 10.2 | 360 | 359 | 4.2 * | 1000 | −3 |
* mass flow rate at t0.
Table 3.
The flammable time during blowdown releases.
| Exp. Nr | Preservoir (bar) | ACH (h−1) | Blowdown Time (s) | Pend (bar) | Total Flammable Time tf (s) | tf0 (s) |
|---|---|---|---|---|---|---|
| 22 | 209 | 6.0 | 900 | 6 | 11 | 82 |
| 23 | 359 | 10.2 | 900 | 12 | 83 | 30 |
| 21 | 362 | 6.2 | 900 | 10 | 195 | 32 |
| 19 | 721 | 10.2 | 900 | 16 | 285 | 16 |
| 20 | 713 | 6.2 | 900 | 17 | 336 | 18 |
Table 4.
Hydrogen sensor location under the car.
| Sensor Nr | x | y | z |
|---|---|---|---|
| 25 | −5000 | 0 | 370 |
| 26 | −5000 | 250 | 370 |
| 27 | −5010 | 250 | 0 |
| 28 | −4760 | 250 | 0 |
| 29 | −6465 | 250 | 0 |
| 30 | −6465 | 0 | 0 |
Publisher’s Note: MDPI stays neutral with regard to jurisdictional claims in published maps and institutional affiliations. |
© 2021 by the authors. Licensee MDPI, Basel, Switzerland. This article is an open access article distributed under the terms and conditions of the Creative Commons Attribution (CC BY) license (https://creativecommons.org/licenses/by/4.0/).
Share and Cite
MDPI and ACS Style
Lach, A.W.; Gaathaug, A.V. Effect of Mechanical Ventilation on Accidental Hydrogen Releases—Large-Scale Experiments. Energies 2021, 14, 3008. https://0-doi-org.brum.beds.ac.uk/10.3390/en14113008
AMA Style
Lach AW, Gaathaug AV. Effect of Mechanical Ventilation on Accidental Hydrogen Releases—Large-Scale Experiments. Energies. 2021; 14(11):3008. https://0-doi-org.brum.beds.ac.uk/10.3390/en14113008
Chicago/Turabian StyleLach, Agnieszka W., and André V. Gaathaug. 2021. "Effect of Mechanical Ventilation on Accidental Hydrogen Releases—Large-Scale Experiments" Energies 14, no. 11: 3008. https://0-doi-org.brum.beds.ac.uk/10.3390/en14113008
Note that from the first issue of 2016, this journal uses article numbers instead of page numbers. See further details here.