
Multivariate Analysis of a Wind–PV-Based Water Pumping Hybrid System for Irrigation Purposes


1
Faculty of Electrical Engineering, Technical University of Sofia, 1000 Sofia, Bulgaria
2
Laboratory Sciences for Environment, University of Corsica, UMR CNRS 6134, 20000 Ajaccio, France
*
Author to whom correspondence should be addressed.
Energies 2021, 14(11), 3231; https://0-doi-org.brum.beds.ac.uk/10.3390/en14113231
Submission received: 13 April 2021
/
Revised: 24 May 2021
/
Accepted: 27 May 2021
/
Published: 31 May 2021
(This article belongs to the Collection Feature Papers on Wind, Wave and Tidal Energy)
Abstract
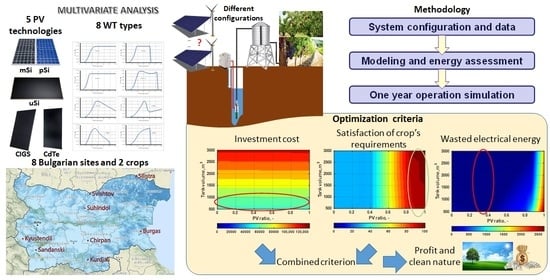
:The Green Deal and increased nutritional needs are driving factors in human activities nowadays. Agriculture is an essential economic sector that can profit from the application of renewable energy sources by the assimilation of off-grid, arid and barren terrains. Power supplied by hybrid systems for water pumping is a solution for overcoming the stochastic character of the renewable energy sources. This paper presents a sizing methodology for a hybrid system with wind and PV generation and water tank storage, based on the consideration of the entire energy conversion chain with energy models and a one-year operation simulation. The PV generator is modeled using a reduced Durisch’s model, while for the wind generator a piecewise interpolation is used. The methodology is applied for sites in Bulgaria with specific agricultural crops and meteorological data. Combinations of PV (different technologies) and wind (different types) generators and water tank capacities are considered and discussed. The combinations are compared on the basis of three criteria: the investment cost, the satisfaction of crop requirements and system oversizing. The possibility for the introduction of battery storage is also examined. The results show some trends in the hybrid system sizing and the possibility to apply the proposed methodology for various sites, generators and crops.
1. Introduction and Literature Overview
1.1. Driving Factors
Different political efforts from the Kyoto protocol [1], through the European 2020 climate and energy package [2] to the latest European Green Deal [3], encourage the growth of renewable energies. As a result, the total installed capacity of renewable energy generators has increased in the past decades [4]. Figure 1 illustrates that, for photovoltaic (PV) generators, the increase is quadratic (a), while fo-r wind turbines (WT) it is almost linear (b).
On the other hand, agriculture is an industry sector with a low contribution to the gross domestic product (about a 4% average value on a global basis for the past decade [5]), but with a very high importance for humanity. According to the Food Agriculture Organization of the United Nations, food production has increased by more than 100% in the last 30 years [6]. The expected growth until 2050 is a further 60% increase. These expectations raise the necessity to improve agricultural production. The main mechanism for increasing agricultural yields is irrigation. Research [7] shows that yields can be significantly increased though improved irrigation for almost all of the studied crops, reaching up to 250% for some of them (Figure 2).
According to [8], irrigation is the main agricultural activity with an influence on yields, apart from planting, cultivating and harvesting, in which renewable energies have significant uses. The sun and wind are the renewable energy sources used for water pumping for irrigation by the means of PV generators and wind turbines. This paper considers the application of a hybrid system with tank storage for irrigation purposes.
1.2. Sizing of Hybrid Systems for General Application
The Hybrid Renewable Energy System (HRES) is considered to be the main solution to overcome the stochastic nature of the sun and wind for the power supply of different electrical consumers [9]; a smoothing of the production occurs due to the complementarity of the two energy sources and often a better synchronization between production and consumption. An impressive review of the studies on HRES, which provide a “qualitative-quantitative prospect” is presented in [10], while [11] summarizes the geographical distribution of the studied sites. However, the modelling of the generators in the HRES is not considered. A review of the models is presented in [12], but the elapsed time from the paper’s publication in 2015 requires the additional analysis of more recent papers on the models used.
One of the most studied HRES configurations uses PV, WT and batteries. A powerful system in Jordan is considered in [13], proving that the battery can improve the system’s reliability and reduce the cost of energy. A new reliability indicator is introduced in a study in Columbia [14]. The optimal solution according to this indicator can reduce the cost of energy. The introduction of WT in the HRES located in Germany and the Czech Republic is favorable, especially for higher latitudes [15]. A multi-objective optimization tool, named HYRES (Hybrid Renewable Energy System) is presented in [16], showing better results than the HOMER software. A study in Taiwan demonstrates that the HRES is a more ecological solution, but the use of WT is not economically reasonable [17]. Similar conclusions are presented in [18] for Colombia, where the most reliable system is with a 100% WT fraction, while the most economical system is with a 100% PV fraction. The opposite results are obtained in [19] for a grid-connected system in Oman, because the ratio of the rated powers PV:WT is 1:2.64. Some authors use TRNSYS for their studies for an office building in the Mediterranean area [20] and for a bitumen tank [21]. Additional generators are introduced in [22] and [23], respectively: a diesel generator and concentrated solar panels. The first study proposes a methodology for HRES sizing without data for the solar radiation and the wind speed, applied to Iran. The methodology precision increases with the augmentation of the training sites. The second study demonstrates an advantage for the concentrated solar panels in the optimal system for Morocco, for a fraction of about 65%.
In some studies, the battery is replaced by pumped hydro storage, because of the lower cost of energy. Alturki and Awwad [24] studied a system located in Saudi Arabia where the optimal configuration is with higher PV fraction, while the WT has a higher fraction for a system in Libya [25]. The advantage of the pumped hydro storage over batteries is confirmed in [26] for a system in Bangladesh, powered by a PV and a diesel generator.
The author of [27] proposes a system with PV and fuel cell with hydrogen storage in Nigeria. The proposed system is a good alternative for the diesel generator and achieves a renewable energy share of 96.7%.
The above-mentioned studies use models with different levels of complexity for the PV and WT. The PV efficiency is considered constant in [14,24]. A linear equation without temperature influence is used in [27]. The authors of [13,22,23] consider only the influence of the cell temperature on the PV efficiency, while the influence of the solar radiation is neglected. In [18,19,26], the solar radiation influence is taken into account. Both influences are also considered with different models in [15,16]. The studies with specialized software use a model based on the PV cell’s equivalent circuit with one diode [17,20,21,25]. All of the mentioned models are appropriate for the modeling of monocrystalline and polycrystalline panels, which limit their application in this study because of the consideration of thin-film PV technologies.
The estimation of the WT output power uses models with equations or the interpolation of the power curve. The models differ in the form of the power curve between the cut-in speed and the rated speed. This part of the curve can be linear [23], quadratic [22], cubic [18,24], exponential [14], or have a higher order [13]. Some authors use the power factor to determine the output power in this speed range [16,20,21]. The WT in [17] is vertical, and its model is specialized and uses the manufacturer’s data. The linear interpolation of the manufacturers’ data is used in [15,19,25]. The equation models are not appropriate for small WT, due to the power curve form, while the linear interpolation requires information for the power curve with small steps of the wind speed.
It appears that, according to the implantation site of the HRES, the share of the solar and wind production can be different, with impacts on the profitability of the system.
This paper deals with the application of renewable energy sources for irrigation, and the following literature overview is oriented to this usage.
1.3. Systems with One Renewable Generator for Irrigation
Some authors use only PV generators as the power supply. The authors of [27] propose an integrated model for the estimation of the irrigation quality on the basis of different meteorological data, and show the results of the application of the tool to a site in Spain. Another study [28] considers the strategies for overcoming different faults during the irrigation system’s operation. The proposed approaches are validated by the electrical modeling of a system located at a site in India. Such modelling is also used in [29] for the sizing of a PV generator with power converters, using Matlab. The authors of [30] examine the feasibility of an irrigation power supply with a PV system in Bulgaria, while in [31] the PV system replaces a diesel generator to reduce CO2 emissions. The profit from the integration of a PV system for the irrigation of greenhouses in Spain is estimated in [32]. The results show that the increase of the irrigated sectors improve the system’s profits. A system sizing on the basis of the shortest day of the year is proposed and applied in Saudi Arabia by [33]. In [34], two types of PV systems are considered—grid-connected and stand-alone—for irrigation purposes in Chile and Latin America. The aim of this paper is to determine the cost effectiveness and the system payback. The results show that the grid-connected systems have an advantage over the stand-alone case due to their reliability.
Different authors consider approaches for improving the reliability of the stand-alone irrigation systems. The main approach consists of the introduction of a storage device into the system. A review of the studies of systems with a water tank as storage is proposed in [35], which highlights the advantages of this configuration. A sizing methodology of a PV system with a water tank, based on genetic algorithms, is presented in [36]. The results for Spain show a higher influence of the PV generator rated power and the pump type, while the influence of the pipe system’s parameters and the water tank capacity is lower. Such a configuration of real systems is also considered in [37]. The rated power of the PV generators varies between 40 and 360 kWp, and the installation sites are located in Spain and Italy. The PV panels are mounted on solar trackers to increase the energy yield. The exploitation results show a significant decrease in CO2 emissions and fast payback. A PV-based irrigation system with a water tank, using data for Moldova, is studied in [38] as a possibility to increase the irrigated areas in the country. The results illustrate the feasibility of such a system even for sites with a latitude of around 50°. The operation of a PV system with a water tank for a site in Iraq is considered in [39]. The results on the basis of electrical modelling show a good reliability of the system. Another possibility for a storage device, considered in the literature, is battery storage. A similar system is investigated in [40] using HOMER software for a site in India. The results illustrate the viability of the system, which is increased by the introduction of a controller with Internet of Things capability. Similar results are also presented for India in [41]. A sizing of such a system for the irrigation of asparagus in Myanmar is shown in [42], while a practical realization with remote control is presented in [43,44]. A PV system with a battery is considered in [45] for the power supply of a water pump during the irrigation period, and for fruit storage during the rest of the year, which increases the use of the system to all year round.
Another approach for the improvement of the supply system’s reliability is the use of diesel generators. This solution is in conflict with the green energy concept, but according to [46], the solution with a diesel generator has advantages over batteries due to the security of supply and the lower cost. This allows the operation of high power systems, i.e., 140 kWp instead of 40 kWp. The PV system in the study is mounted on single-axis trackers, which increases the system’s energy yield to better follow the load profile of the irrigation of olives in Portugal. The results show good utilization of the PV energy. Different scenarios for irrigation are considered in [47] among the other loads in a stand-alone micro grid in Bangladesh with PV and diesel generators. The daily irrigation scenario has an advantage because of the better use of the PV energy, the reduced emissions of gases with greenhouse effects and the decreased electricity cost.
The irrigation systems can also be powered by wind turbines, which convert the energy of the wind into mechanical energy [48]. The obtained energy can be used directly to pump water or can be converted into electricity by an electrical generator to supply a water pump. The first possibility is studied in [49], in which it is compared with irrigation systems powered by diesel or photovoltaic generators. The study was conducted with data from three countries: Spain, Cuba and Pakistan. The results show the advantage of renewable energy sources for the reduction of harmful emissions and the price of the obtained energy for the pumping of 1 m3 water. It should be noted that for some of the considered sites the advantage goes to the wind application, while for others it is the sun. Which source should be used depends on the energy potential of the installation site.
The application of WT for supplying water pumps with electricity is discussed more in the literature. The energy studies mainly consider whether the available wind potential is sufficient to supply the water pumps or for the performance of the system. A comparison of different WT and their performance when installed in different locations in Oman is presented in [50], while in [51] seven wind turbines and three locations in Saudi Arabia are considered; [52] discusses the wind potential in two places in Algeria. The results show the relevance of wind turbines for applications in pumping systems for irrigation purposes.
A system with WT in India is studied in [53] to provide for a farm’s water consumption (including irrigation). The results obtained from three-day simulations show the operability of the system, especially at higher wind speeds. The wind turbine can also be used for other agricultural purposes. For example, [54] considers the use of a WT to power a seawater desalination plant for irrigation and drinking needs in the Canary Islands. The possibility of wind turbines to participate in the energy mix as part of a farm micro-network is discussed in [55].
Electrical studies with wind generators are performed with short-term simulations and examine the operability of the system in [56,57]. The first discusses the autonomous operation of an induction generator to drive a pump with an induction motor, and the second pays more attention to the electronic converter that supplies the pump.
Battery storage is added to the wind generator to supply the pumps when the wind speed is insufficient in [58,59]. The second paper uses real data from a site in India. The results illustrate the possibility to increase the implementation of such a combination. The combination of wind turbines and battery storage is studied through electrical simulations in [60]. The results show the correct operation of the system and the possibility of using this system in practice.
Thus, this small literature review shows that the topic of the application of renewable energy to irrigation is extensively studied over the world, which proves that there is currently a high degree of interest in this issue.
1.4. Systems with Two Renewable Generators for Irrigation
Hybrid systems with two or more energy sources (with or without storage devices) are also studied in the literature. The authors of [61] offer a combination of a WT and a PV generator for irrigation purposes in Indonesia, while the system in [62] is in India. Some authors consider different configurations of the hybrid system in order to find the best one for a considered place. Systems without storage have been investigated for the irrigation of cassava in China [63] and of sugar cane in Australia [64]. Both studies show that WT are not involved in optimal configurations of the irrigation system. A similar result is obtained in [65] through a comparison of systems in China, powered by PV and wind generators. In contrast, [66] shows through a study in Texas that both generators can have a positive result with an increase of the pumped water.
An improvement of the performances of hybrid systems with PV and WT generators can be obtained by the introduction of a storage device: [67] adds a battery, while [68] adds a combination of battery and fuel cells in Tunisia. Another option to improve performance is to add a diesel generator. Such configurations are studied by [69] for sites in Sudan, and by [70] for sites in Spain. The results in both cases show that the inclusion of generators with renewable energy sources leads to a reduction of the produced electricity price.
1.5. Conclusions from the Literature Overview and the Definition of the Paper’s Objective
The review of HRES for general applications [11] shows that this study covers a well-researched area, i.e., stand-alone systems with low-rated power. From the 550 articles reviewed, 291 papers report the use of the mathematical optimization method. The rest likely use multivariate analysis, which makes it the most widely used approach. The models in this part of the literature overview have some disadvantages, which are overcome with the application of the reduced Durisch’s model for the PV generator and monotone piecewise interpolation for the WT. The models have high precision and take into account different characteristics: cell technology and the influence of solar irradiation and the cell temperature for the PV generator, and the variation of the power curve for the WT.
The non-exhaustive review of the literature for irrigation shows that the use of renewable energy for water pumping has been considered by many authors across the world and in Bulgaria. Some of them use limited information for the primary energy source (i.e., average monthly or daily values), unsophisticated models (with limitations or with constant efficiencies) or software with hidden code (HOMER, TRNSYS, GridLAB-D etc.). This paper presents a proposed methodology for the sizing of the power supply for an irrigation system with a combination of PV and WT with a water tank on the basis of simulations of the system’s operation for one year, recorded at intervals of 1 h, taking into account precipitation. This methodology is not limited, and can use data with smaller steps. The methodology’s aim is to determine the combination of the installed power, the type of renewable energy generators and the tank volume which satisfies the optimization criteria—minimal investment cost, maximum satisfaction of crop requirements and minimal electrical energy waste—using multivariate analysis. For this purpose, the available meteorological data is converted according to the generators’ mounting specificities. The output of the renewable energy generators is estimated with the models mentioned above. Different combinations of rated powers of PV and WT, tank volumes, various PV technologies and WT power curves are considered. The methodology is applied to eight sites in Bulgaria with different primary potentials. The sites are typical for Bulgaria, with a high harvest of the investigated agricultural crops: wine grapes and cherries. The influence of the introduction of battery storage into the power supply system is also estimated. The influence of the different parameters of the system is investigated and discussed.
2. Considered Irrigation System and Proposed Methodology
The paper considers an irrigation system, powered by an autonomous hybrid system with photovoltaic and wind generators. The structure of the studied system is presented in Figure 3. During the sizing procedure, the rated power of the hybrid system varies to find the most appropriate installation. The share of both generators in this rated power also varies. The hybrid system powers a submersible pump via a pump converter. During the operation of the generators, the pumped water is stored in an elevated water tank, which supplies a drip irrigation system. When battery storage is considered, it is part of the hybrid system.
The proposed sizing methodology has three elements: (1) the information for the system configuration and meteorological data; (2) the modelling and energy and water assessment; and (3) the simulation of the system’s operation during the year.
2.1. System Configuration and Meteorological Data
The necessary input information is the meteorological data for the installation site, and the parameters for the hydraulic configuration and for the hybrid system. In this first step, one of the optimization criteria is calculated: the investment cost, as discussed below.
2.1.1. Meteorological Data
The meteorological data are provided by Meteonorm [71] with a one-hour step for one-year period. These hourly data are used as an input for the generators’ models, and the operation of the system is simulated for one year in view in order to take into account the seasonal variability of wind and solar radiation. The needed data are:
- Global solar irradiation on horizontal surface: G, Wh/m2;
- Wind speed at 10 m height: V10, m/s;
- Ambient temperature: Ta, °C;
- Precipitation: P, mm.
2.1.2. Hydraulic Configuration
The methodology uses information for:
- The pump parameters: the head and flow rate, which depend on the height of the level of the groundwaters, the elevation of the water tank, the height losses in the pipes, the maximal debit (which is limited by the authorities in the country and the crop’s needs), and the depth of the well and of the pump.
- The pump converter starting threshold, which depends on the selected pump.
- The tank size, which is variable during the optimization.
2.1.3. Hybrid System Configuration
As mentioned above, the HRES rated power varies during the optimization (respectively the PV peak power and WT rated power). For PV generators, information on the PV cells’ technology and tilt angle is required, while for the WT, the hub height and the power curve are necessary. The five most popular PV cells’ technologies [72] are used: monocrystalline (mSi), polycrystalline (pSi) and microcrystalline silicone (uSi), Copper indium gallium selenide (CIGS), and Cadmium telluride (CdTe). The PV panels are south-oriented (because the sites are located in the Northern Hemisphere) and tilted according to the site latitude. The WT hub height depends on its rated power (18 m for powers up to 10 kW, 23 m for powers up to 20 kW, and otherwise 28 m). The WT is characterized by its power curves, which vary greatly according to the manufacturer and have a strong effect on its productivity; eight typical power curves are used, which originate from the manufacturers’ database for small WT of NREL’s SAM software [73]. They are presented in a per-unit power scale in Figure 4 in order to be applied for various peak powers.
2.1.4. Investment Cost
The first optimization parameter considered is the investment cost (IC), which includes the HRES equipment (generators, power converters, wiring and water tank) and its installation. The IC utilization facilitates the study because the operation and maintenance costs require precise information for the inflation rate, which is not always available. The investment cost depends on the water tank’s volume and the rated powers of the generators in the HRES. The costs can vary for the different countries. In the proposed sizing methodology, the costs are sourced from [74,75] for the PV generators, [76] for the WT and [77] for the water tank.
2.2. Modeling and Energy Assessment
The measured meteorological data are first converted into appropriate data, and the WT and PV generators and the pump are then modelled.
2.2.1. Meteorological Data Conversion
As the PV modules are tilted, the solar irradiation on the horizontal plane (as measured in most meteorological stations) must be converted into the solar irradiation on a tilted panels’ surface. For this purpose, different approaches are used in the literature. The approach in [33] is very simple but has low precision. Artificial Neural Networks can be used [78], but this requires a significant amount of data and is very specific for each site. A good compromise between simplicity and precision is proposed in [79], in which a combination of the CLIMED2 and Klutcher’s methods and geometric relationships is used. The CLIMED 2 method determines the diffuse radiation Gd on horizontal surface by the following equations:
where Gext is the solar irradiation outside Earth’s atmosphere. The numbers in the right side conditions, given by the authors of the CLIMED 2 method [80], represent clear sky conditions (up to 0.21 for high cloud density, from 0.21 to 0.76 for average cloud density, and clear sky for values greater of 0.76).
The diffuse solar irradiation is used to calculate the diffuse solar radiation on the tilted surface Gdβ by Klutcher’s method:
where β is the inclination angle of the tilted surface, θs is the incidence angle (the angle between the Sun’s rays and the normal of the tilted surface), and θz is the zenith angle (the angle between the Sun’s rays and the normal vector of the horizontal surface).
The incidence and zenith angles are used to determine the beam component of the solar radiation on the tilted surface Gbβ:
Finally, the reflected solar radiation on the inclined surface Grβ is calculated by:
where ρg is the albedo coefficient used for the estimation of the reflection of the Sun’s rays by the ground.
The wind speed is generally measured at a 10 m height in meteorological stations, but the WT hub height is rarely 10 m; as such, it is then necessary to convert it. The wind speed Vh at the hub height h is calculated from the 10 m measured wind speed using the Justus’s Equation [81] and the Hellmann exponent αJ.
The electrical efficiency of a PV module depends on the solar irradiation and also the cell temperature Tcell, which is calculated from the ambient temperature Ta, the inclined solar radiation Gβ and the coefficient hR using Ross’ Equation [82]:
2.2.2. Renewable Energy Generator Models
The PV generator can be presented by an electrical model [83], a polynomial model [84] or an efficiency model [34,85]. The proposed methodology uses the last possibility, applying the reduced Durisch’s model [86], which allows the modelling of different PV cell technologies without astronomical calculations for the air mass. The reduced and the original Durisch’s model were verified experimentally by the authors, and showed the best accuracy compared with other models with a relative root mean square error of around 3–4% [86,87]. The PV module efficiency is given by:
where ηPV is the PV efficiency, Gref = 1000 Wh/m2 and Tref = 25 °C, which are the reference values, respectively, for the solar radiation and the cell temperature and p, q, m and r: empirical coefficients with specific values for each PV technology.
The values of the empirical coefficients, including the coefficient hR from Ross’ formula (Equation (6)) are determined in [86] and are presented in Table 1. The five PV technologies are affected differently by the solar radiation and the cell temperature. Thus, the application of a given technology with lower efficiency can be justified by its better performances during the summer: a period with high temperatures and solar radiations. The variation of the PV technology in the sizing methodology seeks the verification of this hypothesis.
The wind turbine’s output can be estimated from the wind speed, the swept area and the power coefficient [88]. Another possibility is the use of the modelled power curve or the interpolation of real power curves. Due to the complex form of the eight WT power curves, in Figure 4, a modelling with a monotone piecewise cubic interpolation (MPCI) is used. The wind turbine output power is determined for a given wind speed by the interpolation of the power curve’s points, as provided by the manufacturer. The MPCI takes into account the form of the curve, and thus its precision is better than the linear one. The interpolation uses the following interpolant [89]:
where x is the argument that is between the two points xi and xi+1. The coefficients are determined by:
where fi is the function value in the point xi, is its derivative, is the derivative of the function for xi+1, and is the slope of the linear interpolant.
The applied necessary and sufficient condition for monotone interpolation is that the interpolant in (8) is monotone in the interval [xi, xi+1] if, for each I, the derivative respects the following interval:
where si is determined by:
where sign = 1 for a positive argument and sign = −1 for a negative one.
The interpolation’s limiter function is defined by:
The Monotone piecewise cubic interpolation is integrated in Matlab®, which is used for the methodology implementation.
The last element in the hybrid system is the battery storage. The aim of the sizing methodology is only to estimate the profit from the introduction of the battery into the power supply. This is why the battery model is not sophisticated: a constant value (80% [90]) for the charging and the discharging efficiency is chosen, while the other parameters of the battery are neglected.
2.2.3. Pump Model
Usually, the pump manufacturer provides information that links the head, the flow rate and the consumed power. On the basis of this information, the variation of the flow rate per hour Qout is determined, depending on the input power PHS, which is considered to be constant during the hour. This dependence is used for the pump modeling. Using [91], the modelling Equation (13) for the pump is obtained. In the case of battery storage in the hybrid system, the inverse Equation (14) is used to determine the power requested from the battery to fulfill the irrigation needs.
2.3. One Year Operation Simulation
Two processes are simulated during the year: the pumping and the irrigation. They are illustrated in Figure 5.
2.3.1. Pumping
The pumping starts several days before the required irrigation period in order to guarantee a full water tank during the first irrigations. In this study, this preliminary period is 15 days. The pumping period ends with the irrigation period. During the pumping period, for each hour, the hybrid system’s output power is compared with the pump converter’s starting threshold. In the case of insufficient power, no water is pumped. In the opposite case, the pumped water volume is determined by (13) and added to the stored water. If, during this hour, the tank is filled, the rest of the produced energy is considered wasted. This wasted electrical energy (WEE) is the second optimization criterion. For the simulations with batteries, this wasted energy increases the state of charge of the battery.
2.3.2. Irrigation
The irrigation in this study is simplified by considering only the reduction of water volume in the tank, because only this process is related to the HRES sizing.
During the irrigation period, the needed water depends on the crops’ needs, the irrigated area and the precipitation. If this water is available in the water tank, the irrigation is realized and the water volume in the tank is reduced. If the stored water is not sufficient, the tank is emptied and the satisfaction of crop’s requirements (SCR) is reduced. SCR is the third optimization criterion used in this study.
For the systems with batteries, in the case of insufficient water in the tank, an additional verification is performed, i.e., the sufficient state of charge of the battery to pump additional water to meet the irrigation needs. In the case of there being enough energy in the battery, the tank is filled to the needed level. After that, the irrigation is performed and the tank is emptied. At the same time, the battery’s state of charge is reduced.
If the energy in the battery is not sufficient, the energy remaining in the battery is used for pumping, and then the irrigation is done and the tank is emptied. The satisfaction of the crop’s requirements is decreased according to the shortfall of water.
2.4. Multivariate Analysis
Several configurations are studied iteratively conducing to a multivariable analysis. Firstly, the site and the irrigated crop are chosen. The HRES rated power takes different values, seeking the optimum. It is the sum of the PV and WT’ rated powers, which also vary. The term ‘PV ratio’ is defined as the percentage of the PV peak power in the total HRES power. It varies between 0 and 1 (1 for a PV system alone and 0 for a WT system alone). For each PV ratio, the water tank volume is changed and a variety of combinations are obtained.
The number of configurations is then very high, keeping in mind that the PV cells’ technology and the WT power curve change too. For each combination (site, crop, HRES rated power, PV technology, PV ratio, WT power curve, water tank volume), the system operation is simulated during one year. The generators’ output varies according to the meteorological data. The investment cost is calculated for each configuration and the other optimization criteria are calculated during the simulation. Finally, the configurations’ results are compared and analyzed in order to guide the sizing of the irrigation system.
The proposed methodology is implemented in Matlab® program code.
3. Methodology Application and Results
3.1. Application Hypotheses
The proposed sizing methodology was applied to irrigation systems for two agricultural crops: cherries and wine grapes. Bulgaria is one of the leading producers of these crops. According to the Food and Agriculture Organization [92], Bulgaria was sixteenth in the world for cherry production in 2018 and twenty-first for wine (about 93% of the produced wine grapes are used for wine production [93]). The irrigation of these crops is very important for their quality [94,95], and for both cultures the drip irrigation method shows best results [96,97]. The irrigation norm for the crops is the same [98,99]—6 L/m2/day—but the periods of irrigation differ: 15 March to 1 September for cherries and 1 June to 1 September for wine grapes. The irrigated surface is taken to be equal to 5 hectares.
The meteorological data were measured on eight Bulgarian sites. Three are popular for cherry production: Kyustendil, Kurdjali and Silistra; three are popular for wine grapes: Burgas, Suhindol and Svishtov; and the last two are favorable for both crops: Chirpan and Sandanski. Figure 6 illustrates the geographical positioning, the coordinates and the respective crops of the sites. The monthly average of the hourly solar irradiation and the precipitations for one year (red line) and during the irrigation period of the crop characteristic for the site, are presented in Figure 7. Figure 8 shows Weibull’s distribution of wind speed for one year and during both irrigation periods for the studied sites.
The solar potential is roughly similar for all of the sites due to the short distance between the sites, with higher values during the summer. The wind potential differs: Kurdjali and Burgas have better potential, with respective average wind speeds of 3.75 and 5.36 m/s, while Kyustendil has the worst one (1.53 m/s). For Kyustendil, Kurdjali, Chirpan and Sandanski, the wind speed distribution is better for WT utilization during the irrigation period.
The hydraulic configuration of the irrigation system is considered to be identical for all sites. Its main parameters are listed in Table 2. The height losses are first calculated (4.8 m) and the total dynamic head—the sum of the groundwater height, water tank elevation and height losses—is found to be equal to at least 44.8 m (when the water level is minimal). From the technical data sheet, a 9.2 kW electrical pump was chosen, powered by an electronic converter with a rated electrical power of t 11.6 kW and a starting threshold of 4.4 kW.
The HRES rated power changes from 10 kW to 25 kW with a step of 2.5 kW. For each HRES power, the PV ratio increases from 0 to 1. For each PV/WT combination, the five PV cells’ technologies and the eight WTs’ power curves are used successively. The investment costs for each PV cell technology, WT and water tank are listed in Table 3. The costs are assumed to be identical for all WT types. The cost of the tank depends on its volume TV.
The other parameters of the methodology are detailed in their description in point 2.
3.2. Results and Discussion
As the number of parameters varying in this study is very high, it is impossible to show the results for each combination. Instead, the influence of the variables is studied and discussed.
For each combination of variables, three optimization criteria are calculated: the investment cost, wasted electrical energy and satisfaction of the crop’s requirements. An example is presented in Figure 9 for cherry crops in Kyustendil with a 15 kW hybrid system using m-Si PV panels, a Type 1 WT and no battery. The results are shown for different combinations of the water tank volume and PV ratio. The ellipses in each subfigure highlight the “optimal” areas for each criterion. It is clear that these areas do not overlap, and it is impossible to satisfy the three optimization criteria at the same time: the optimal investment cost is for a low water tank capacity and a relatively high PV ratio, the optimal wasted electrical energy is for a high water tank capacity and a medium PV ratio, and the optimal level for meeting the crop’s needs is a high capacity of water tank and a high PV ratio.
The owner of the irrigation system requires the best possible satisfaction of the crop’s requirements with lower investments. As such, those two criteria should be highlighted. For better comparison of the variants, a new (forth) combined criterion Cr is introduced:
with IC being the investment cost and SCR being the satisfaction of the crop’s requirements. The minimum Cr means a lower investment cost and the higher satisfaction of the crop’s requirements, which are the owner’s demands.
3.2.1. Influence of the HRES Rated Power
The variations of SCR (left) and WEE (right) versus the PV ratio for different HRES rated powers are shown in Figure 10 (wine grapes in Suhindol, mSi PV panels and WT, and the values of the optimization criteria).
The increase of the HRES rated power rapidly improves the SCR for a high PV ratio due to the good solar potential of the site. For a medium PV ratio, the influence is smaller, especially for high rated powers. The variation of the satisfaction of the crop’s requirements for a small PV ratio depends on the wind potential and the WT power curve. A good satisfaction is observed only for high water tank volumes in the sites with good wind potential and a high productivity WT.
The wasted electrical energy (WEE) increases rapidly with the augmentation of the hybrid system’s power when the PV ratio is high. The high values of the water tank volume improve this criterion.
The investment cost follows the variation of the hybrid system’s installed power because of the increased powers of the generators in the system.
For a given combination (crop, site, PV cell technology and WT power curve), Cr decreases rapidly with the enlargement of the HRES power until the minimal value is reached, and it then rises smoothly. Table 4 shows that the optimal configurations for the different hybrid systems include a high PV ratio until the minimal combined criterion, and after that the PV ratio decreases but the hybrid system’s power is still dominated by the PV generator. In all cases, the tank’s capacity is at its minimum value of 500 m3.
3.2.2. Influence of the PV Cell Technology
The influence of the PV cell technology on SCR is illustrated for Silistra (cherry crop) in Figure 11. Table 5 shows the optimal configurations according to Cr for a 15 kW hybrid system (optimal for some of the PV technologies) and WT Type 4.
We note a small influence of the PV technology on SCR. The uSi technology is an exception because of the improved SCRs for a low PV ratio and a high water tank volume. A higher influence is observed for HRES with a high PV ratio (over 0.8). CIGS has the worst performance in this case because full irrigation is obtained only for high values of water tank volumes. The pSi technology shows the best performances for a high PV ratio and a medium water tank volume. The comparison in Table 5 confirms the leadership of pSi and uSi PV panels, respectively, for a good SCR and investment cost. The CIGS technology has the lowest wasted electrical energy.
3.2.3. Influence of the Wind Turbine Type
The influence of the WT type on SCR is illustrated in Figure 12. The results are for Burgas, i.e., the site with the best wind potential. The respective crop is wine grapes. The PV generator uses pSi technology and the HRES rated power is 15 kW, which is optimal according to the combined criterion for the site. The subfigures show the high influence of the WT power curve on the distribution of the SCR for different water tank volumes and PV ratios. Only type 3 can afford full SCR (in combination with a high water tank volume) for small values of the PV ratio. The influence on SCR for this WT type extends to relatively high values of PV ratio, which is not the case for the other WT. This power curve is characterized by a low-rated wind speed (the wind speed on which the rated power is obtained) and a lack of a cut-off speed (this is the upper limit of operation of the WT). Type 2 follows the leader, but the level of SCR is significantly lower: up to 75–80%. The reason for this decrease is the presence of a cut-off speed, which hinders the operation of the WT at high wind speeds. The WT type 7, type 1 and type 4 take the middle position in the ranking. These WT are characterized by a relatively good performance at low wind speeds. The last positions are for type 8, type 5 and type 6 which use in the low wind speeds in the least efficient manner. For these WT, SCR is under 35% (even under 25% for type 6), and their use with high installed powers is not favorable.
3.2.4. Influence of the Primary Potential
To study the influence of the primary potential, the cherry crop is used because of the distinguishing wind potential of all of the sites with this crop. The HRES rated power is 12.5 kW, which is optimal for almost all of the sites (except for Chirpan) with u-Si PV panels and WT type 3. The variation of SCR for different water tank volumes and PV ratios is presented in Figure 13. The optimal configurations for the different sites, according to the combined criterion, are shown in Table 6.
The highest average monthly solar irradiation (Figure 7) for Kurdjali allows for the full irrigation for this site in combination with a very large water tank for the considered HRES rated power. The six months with almost constant average monthly solar irradiation for Chirpan are not sufficient to fully meet the crop’s needs. The subfigures show that the good solar potential allows the use of a large number of combinations between the PV, WT and water tank volume with a satisfactory irrigation. The wind potential of the sites is not sufficient for the domination of the WT in the hybrid system. Only for Kurdjali SCR afford 85% for a low PV ratio, which is not sufficient. The imbalance between the primary resources leads configurations with a medium PV ratio to have poor performances.
For all of the sites, the optimal configuration, according to Cr, is supplied only with a PV generator, due to the insufficient wind potential. The full SCR is not optimal for a 12.5 kW HRES. This highlights one of the possible disadvantages of the proposed combined criterion: the irrigation needs are not fully met in the optimal configuration. In the case when full SCR is required, this should be taken into account with an increased weight of the SCR criterion. The high primary potential increases the wasted electrical energy, especially for low water tank volumes.
3.2.5. Influence of the Irrigation Period
This influence can be estimated on the basis of the results for Chirpan and Sandanski because they have favorable conditions and traditions in the cultivation of both crops. The six months with almost identical average monthly solar radiation in Chirpan hinder the estimation; thus, Sandanski is more appropriate and will be used. Figure 14 presents the SCR (first row) and WEE (second row) for wine grapes (left) and cherries (right) for a 12.5 kW HRES with pSi PV technology and WT Type 3. The influence of the irrigation period on SCR is negligible for a high PV ratio, but increases for a lower PV ratio. This can be explained with the higher precipitation during the spring and the better wind potential for the cherry irrigation period because of spring’s unstable weather. The longer irrigation period significantly increases the quantity of wasted electrical energy for low water tank volumes and extreme PV ratios (near zero and one).
3.2.6. Influence of the Battery Storage
Despite the statement in [46] against the application of batteries in the supply systems for irrigation purposes, this solution is widespread in the literature. This is the reason for the estimation of the battery storage’s influence on the studied configurations. As mentioned in Section 2, the battery consideration is simplified, and only the charging and discharging efficiency is considered. The battery capacity is unlimited and the simulation results allow its sizing. Figure 15 shows the variation of SCR without a battery (left) and with a battery (right). The presented HRES is with 15 kW rated power, with an mSi PV generator and WT type 3. The site is Svishtov, with wine grapes. The introduction of the battery storage can decrease the water tank volume for which a certain level of SCR is obtained. This influence is observed for extreme values of the PV ratio, but is negligible except for hybrid systems which are dominated by the PV generator.
Partial confirmation of the figures’ treatment can be obtained from the optimal configurations according the combined criterion for both cases (with and without a battery), presented in Table 7. Because the water tank in this optimal configuration is already minimal, the satisfaction of crop’s requirements is improved with the battery’s introduction. It should be highlighted that the cost of the battery is not calculated because it is outside of this paper’s scope.
Figure 16 presents useful information about the battery sizing: the maximal achieved capacity during the irrigation period (left) and the state of the charge in the end of the irrigation period (right) for different combinations of water tank volume and PV ratio for the 15 kW HRES in Svishtov (wine grapes), using mSi PV technology and WT type 3. The maximal achieved capacity represents the capacity which it is necessary to install in order to obtain the respective SCR.
The required capacity of the battery is high for HRES with a high PV ratio. For lower PV ratios, the required capacity is smaller because of the lower wind potential of the sites. The required battery capacity decreases for larger water tanks, but this is not very useful because those volumes are not used in the optimal configurations. The final state of the charge almost reaches the maximal required capacity of the battery for a PV ratio near 1. This can be explained by the good weather in Bulgaria at the end of summer, which coincides with the end of the irrigation period. This can encourage the owner to use the supply system for other purposes outside the irrigation period, as proposed in [45].
4. Conclusions and Final Discussions
The realized literature overview shows a high variety of approaches for the study of HRES for different applications, including irrigation. This overview guided the authors to define their aim to propose a multivariate sizing methodology for an irrigation system, using a stand-alone hybrid system with a PV generator and a wind turbine for power supply, and a water tank as an energy storage device. The proposed methodology takes into account the energy conversion phenomena in the generators. The sizing is based on the simulation of one year’s operation of the HRES with a one hour time step without limitations for smaller steps. The meteorological conditions and the HRES configuration are used as the input data after appropriate conversion and treatment. Five PV cell technologies and eight WT types are considered. Each subsystem is modelled with an appropriate and accurate model (previously verified and adopted): a reduced Durisch’s model (for the PV generator) and a monotone piecewise cubic interpolation (for the WT). A pump model is proposed, using a logarithmic function, which links the pumped water with the input electrical power. During the system’s simulation, two operation modes were considered: pumping and irrigation. Three initial optimization criteria—the investment cost, the SCR and the wasted electrical energy—were proposed and used, and a fourth one, a combined criterion, was then added. The smaller time step for the simulations increases its precision, but sometimes it is difficult to obtain such meteorological data.
Numerous sizing parameters were taken into account: the HRES rated power, PV ratio and water tank volume. The results were given for different PV cell technologies and WT types. Those multivariate combinations allow the selection of the optimal HRES rated power with the respective PV and WT power, and tank volume. The methodology requires specific input data and was applied on eight Bulgarian sites, which allowed us to choose the best PV technology and WT type for each site and two agricultural crops (five sites for each crop): wine grapes and cherries. The share of PV and WT generators varied according to the site, but as the solar potential is relatively the same for all Bulgarian sites it is mainly the wind potential of the site which influences the ratio PV/WT. Generally, for the Bulgarian sites considered in this study, the PV generator has a much greater peak power than the associated wind turbine.
It has been shown that it is impossible to satisfy the three optimization criteria together: to obtain at the same time a cheaper HRES system, which satisfies totally the irrigation needs and for which no wind or solar energy is lost. Thus, a new (fourth) combined criterion was introduced, as the ratio between the investment cost and the SCR, two criteria which are both important for the HRES owner. This new criterion allowed a better comparison of the different HRES configurations.
The three initial optimization criteria increase with the HRES power, especially for a higher PV generator share due to the better solar potential of the considered sites. The PV domination confirms some results in the literature. The combined criterion determines an optimal solution with relatively small oversizing of the generators and a low water tank volume. Unfortunately, the optimum does not guarantee full SCR. If this condition is essential, then an additional weight of the SCR criterion should be given. For greater HRES powers, the combined criterion is not optimal but the SCR is 100%.
The consideration of various PV technologies and wind turbine types gives a specific originality and attractiveness to this work because it has never been considered in the read literature, and it appears that the influence of these two aspects is not negligible. The pSi shows an increase of the SCR with a medium water tank volume, while the investment cost and the combined criterion for the uSi are lower. However, it should be noted that the technology’s influence is significant only for PV-dominated hybrid systems, and is due to differences in the influence of the solar radiation and ambient temperature on the PV panels’ efficiency. The relatively low wind potential of the sites favors wind turbines with better efficiencies for low wind speeds.
The complementarity of the two primary resources (wind and solar) is particularly visible for a site like Kurdjali, for which good performance (in terms of SCR) is reached for a medium PV ratio. For sites with low wind potential, a full SCR is obtained for HRES with a high PV ratio and, unfortunately, high wasted solar energy. Similar results are reported by other authors in the literature. The solar and wind generators’ coupling improves the performances when wind energy is present, taking into account that the solar energy is often more available everywhere.
Another distinctiveness of this study is the modelling of the irrigation requirements for two crops—cherries and wine grapes—which influences the HRES sizing. The longer irrigation period of the cherries improves SCR for low PV ratios due to higher wind speeds and precipitations in the spring, when their irrigation period starts. Along with that, the wasted electrical energy increases because of the greater electrical energy production, which cannot be transformed in pumped water due to the water tank constraints.
The introduction of an additional energy storage device (battery) both improves the HRES performance and reduces the water tank volume. Because the optimal HRES sizing according to the combined criterion Cr is obtained with a minimal water tank, the introduction of batteries increases the SCR. The observed decrease in the Cr value is not indicative because the battery’s cost is not taken into account. For PV-dominated hybrid systems, the state of charge of the battery at the end of the irrigation period is relatively high.
The presence of wasted electrical energy during the irrigation period, the high state of charge of the battery (when it is present in the HRES) and the possibility of the HRES to produce energy outside the irrigation period can be driving factors to use the hybrid system’s overage production for other purposes. This utilization will increase the profit which was already realized with the HRES application for irrigation. Different applications are possible, but they depend on the HRES’s surroundings (farming facilities, grid connection, etc.) and are not considered in this paper.
The experimental validation of the proposed methodology with all of the combinations for a given site (purchased or rented) is a very expensive (different PV installations, WT with various types and power, and tanks with different volumes, along with the measurement and monitoring of the system are required) and long (at least one year per configuration) procedure. This deters the authors from such a type of validation. However, the precision of the methodology is considered to be good enough because the accuracy of the used physical models was verified experimentally by the authors for the PV technologies, and by the manufacturers for the WT and the pump, providing the respective datasheet. Thus, the results’ precision depends only on the input meteorological data. The use of accurate data with a small time step (one hour in this study) improves the results’ precision.
Numerous highlights can be summarized as having been introduced in this work: the utilization of accurate models for PV and WT generators; the utilization of hourly meteorological data, allowing us to observe more precisely the dephasing between productions, and between production and consumption; the introduction of various PV and WT technologies; and the introduction of the particularities of two crop irrigations. The used multivariate analysis is more intuitive and simple for application in comparison to other complex mathematical optimization approaches. It can be successfully used for feasibility studies or during the design process of HRES for irrigation.
Author Contributions
Conceptualization, L.S., V.L., Z.Z. and G.N.; methodology, V.L. and L.S.; software, L.S. and I.B.; validation, V.L., L.S. and I.B.; formal analysis, L.S. and Z.Z.; investigation, L.S. and I.B.; resources, I.B.; data curation, L.S., I.B. and G.N.; writing: original draft preparation, L.S.; writing: review and editing, Z.Z., V.L., I.B. and G.N.; visualization, L.S.; supervision, V.L., Z.Z and G.N.; funding acquisition, Z.Z., L.S. and I.B. All authors have read and agreed to the published version of the manuscript.
Funding
The APC was funded by the R&D sector of the Technical University of Sofia, Bulgaria.
Institutional Review Board Statement
Not applicable.
Informed Consent Statement
Not applicable.
Data Availability Statement
The data presented in this study are available on request from the corresponding author or the first author. The data are not publicly available due to privacy and the large quantity of the information.
Acknowledgments
The authors would like to thank the R&D sector of the Technical University of Sofia for the financial support.
Conflicts of Interest
The authors declare no conflict of interest.
References
- United Nations Framework Convention on Climate Change, Kyoto Protocol Reference Manual: On Accounting of Emissions and Assigned Amount. 2008. Available online: https://unfccc.int/kyoto_protocol (accessed on 5 April 2021).
- EU 2020 Climate & Energy Package. Available online: https://ec.europa.eu/clima/policies/strategies/2020_en#tab-0-1 (accessed on 5 April 2021).
- European Green Deal. Available online: https://ec.europa.eu/clima/policies/eu-climate-action_en (accessed on 5 April 2021).
- REN21. Renewables 2020 Global Status Report. Available online: https://www.ren21.net/wp-content/uploads/2019/05/gsr_2020_full_report_en.pdf (accessed on 5 April 2021).
- World Bank National Accounts Data, and OECD National Accounts Data Files. Agriculture, Forestry, and Fishing, Value Added (% of GDP). Available online: https://data.worldbank.org/indicator/NV.AGR.TOTL.ZS?name_desc=true (accessed on 5 April 2021).
- Food and Agriculture Organization of the United Nations. Water for Sustainable Food and Agriculture: A Report Produced for the G20 Presidency of Germany. Available online: http://www.fao.org/3/i7959e/i7959e.pdf?fbclid=IwAR1eV3HuHfHdxH6ca11yhMBTD6U78LnwqUxZlKrTWaxfUgOQF4rpuFwJtWo (accessed on 5 April 2021).
- Petkov, P.; Petrova, R.; Markov, N.; Gadzhalska, N.; Kireva, R.; Chekhlarova, S.; Karaivanov, K. Good Practices for Irrigation of Agricultural Crops; Avangard Prima: Sofia, Bulgaria, 2007; 200p. (In Bulgarian) [Google Scholar]
- Forestry for Local Community DEVELOPMENT Programme, “Wood Fuel Survey”, Food and Agriculture Organization of the United Nations. 1983. Available online: http://www.fao.org/3/Q1085e/q1085e00.htm (accessed on 5 April 2021).
- Kaldellis, J.K. Stand-Alone and Hybrid Wind Energy Systems; Woodhead Publishing: Sawton, Cambridge, UK, 2010; pp. 3–28. ISBN 9781845695279. [Google Scholar]
- Mazzeo, D.; Matera, N.; De Luca, P.; Baglivo, C.; Congedo, P.M.; Oliveti, G. A literature review and statistical analysis of photovoltaic-wind hybrid renewable system research by considering the most relevant 550 articles: An upgradable matrix literature database. J. Clean. Prod. 2021, 295, 126070. [Google Scholar] [CrossRef]
- Mazzeo, D.; Matera, N.; De Luca, P.; Baglivo, C.; Congedo, P.M.; Oliveti, G. Worldwide geographical mapping and optimization of stand-alone and grid-connected hybrid renewable system techno-economic performance across Köppen-Geiger climates. Appl. Energy 2020, 276, 115507. [Google Scholar] [CrossRef]
- Mahesh, A.; Sandhu, K.S. Hybrid wind/photovoltaic energy system developments: Critical review and findings. Renew. Sustain. Energy Rev. 2015, 52, 1135–1147. [Google Scholar] [CrossRef]
- Al-Ghussain, L.; Ahmed, H.; Haneef, F. Optimization of hybrid PV-wind system: Case study Al-Tafilah cement factory, Jordan. Sustain. Energy Technol. Assess. 2018, 30, 24–36. [Google Scholar] [CrossRef]
- Acuña, L.G.; Padilla, R.V.; Mercado, A.S. Measuring reliability of hybrid photovoltaic-wind energy systems: A new indicator. Renew. Energy 2017, 106, 68–77. [Google Scholar] [CrossRef]
- Camargo, L.R.; Nitsch, F.; Gruber, K.; Valdes, J.; Wuth, J.; Dorner, W. Potential Analysis of Hybrid Renewable Energy Systems for Self-Sufficient Residential Use in Germany and the Czech Republic. Energies 2019, 12, 4185. [Google Scholar] [CrossRef] [Green Version]
- Donado, K.; Navarro, L.M.; Quintero, C.G.M.; Pardo, M. HYRES: A Multi-Objective Optimization Tool for Proper Configuration of Renewable Hybrid Energy Systems. Energies 2019, 13, 26. [Google Scholar] [CrossRef] [Green Version]
- Shivam, K.; Tzou, J.-C.; Wu, S.-C. Multi-Objective Sizing Optimization of a Grid-Connected Solar–Wind Hybrid System Using Climate Classification: A Case Study of Four Locations in Southern Taiwan. Energies 2020, 13, 2505. [Google Scholar] [CrossRef]
- Torres-Madroñero, J.; Nieto-Londoño, C.; Sierra-Pérez, J. Hybrid Energy Systems Sizing for the Colombian Context: A Genetic Algorithm and Particle Swarm Optimization Approach. Energies 2020, 13, 5648. [Google Scholar] [CrossRef]
- Al Shereiqi, A.; Al-Hinai, A.; Albadi, M.; Al-Abri, R. Optimal Sizing of a Hybrid Wind-Photovoltaic-Battery Plant to Mitigate Output Fluctuations in a Grid-Connected System. Energies 2020, 13, 3015. [Google Scholar] [CrossRef]
- Mazzeo, D. Solar and wind assisted heat pump to meet the building air conditioning and electric energy demand in the presence of an electric vehicle charging station and battery storage. J. Clean. Prod. 2019, 213, 1228–1250. [Google Scholar] [CrossRef]
- Anoune, K.; Laknizi, A.; Bouya, M.; Astito, A.; Ben Abdellah, A. Sizing a PV-Wind based hybrid system using deterministic approach. Energy Convers. Manag. 2018, 169, 137–148. [Google Scholar] [CrossRef]
- Jamshidi, S.; Pourhossein, K.; Asadi, M. Size estimation of wind/solar hybrid renewable energy systems without detailed wind and irradiation data: A feasibility study. Energy Convers. Manag. 2021, 234, 113905. [Google Scholar] [CrossRef]
- Chennaif, M.; Zahboune, H.; Elhafyani, M.; Zouggar, S. Electric System Cascade Extended Analysis for optimal sizing of an autonomous hybrid CSP/PV/wind system with Battery Energy Storage System and thermal energy storage. Energy 2021, 227, 120444. [Google Scholar] [CrossRef]
- Alturki, F.A.; Awwad, E.M. Sizing and Cost Minimization of Standalone Hybrid WT/PV/Biomass/Pump-Hydro Storage-Based Energy Systems. Energies 2021, 14, 489. [Google Scholar] [CrossRef]
- Nassar, Y.F.; Abdunnabi, M.J.; Sbeta, M.N.; Hafez, A.A.; Amer, K.A.; Ahmed, A.Y.; Belgasim, B. Dynamic analysis and sizing optimization of a pumped hydroelectric storage-integrated hybrid PV/Wind system: A case study. Energy Convers. Manag. 2021, 229, 113744. [Google Scholar] [CrossRef]
- Das, B.K.; Hasan, M.; Rashid, F. Optimal sizing of a grid-independent PV/diesel/pump-hydro hybrid system: A case study in Bangladesh. Sustain. Energy Technol. Assess. 2021, 44, 100997. [Google Scholar] [CrossRef]
- Cervera-Gascó, J.; Montero, J.; Del Castillo, A.; Tarjuelo, J.M.; Moreno, M.A. EVASOR, an Integrated Model to Manage Complex Irrigation Systems Energized by Photovoltaic Generators. Agronomy 2020, 10, 331. [Google Scholar] [CrossRef] [Green Version]
- Sharma, V.; Hossain, M.J.; Ali, S.M.N.; Kashif, M. A Photovoltaic-Fed Z-Source Inverter Motor Drive with Fault-Tolerant Capability for Rural Irrigation. Energies 2020, 13, 4630. [Google Scholar] [CrossRef]
- Pushpraj, N.; Gupta, N.; Gupta, V.; Mulla, M.A. Solar energy harvesting for irrigation water pumping system. In Proceedings of the 2017 IEEE International Conference on Power, Control, Signals and Instrumentation Engineering (ICPCSI), Chennai, India, 21–22 September 2017; pp. 1398–1402. [Google Scholar]
- Evstatiev, B.; Gabrovska-Evstatieva, K.; Trifonov, D.; Mihailov, N. Solar energy potential to power the irrigation of orchards in Bulgaria. In Proceedings of the 47th International Symposium, Actual Tasks on Agricultural Engineering, Opatija, Croatia, 5–7 March 2019; pp. 213–221, ISSN 1848-4425. [Google Scholar]
- Powell, J.; Welsh, J.; Farquharson, R. Investment analysis of solar energy in a hybrid diesel irrigation pumping system in New South Wales, Australia. J. Clean. Prod. 2019, 224, 444–454. [Google Scholar] [CrossRef]
- Reca, J.; Torrente, C.; López-Luque, R.; Martínez, J. Feasibility analysis of a standalone direct pumping photovoltaic system for irrigation in Mediterranean greenhouses. Renew. Energy 2016, 85, 1143–1154. [Google Scholar] [CrossRef] [Green Version]
- Almarshoud, A.F. Sizing of PV array for water pumping application. In Proceedings of the 32nd European Photovoltaic Solar Energy Conference and Exhibition, Munich, Germany, 20–24 June 2016; pp. 2811–2816. [Google Scholar] [CrossRef]
- Guzmán, A.B.; Vicencio, R.B.; Ardila-Rey, J.A.; Ahumada, E.N.; Araya, A.G.; Moreno, G.A. A Cost-Effective Methodology for Sizing Solar PV Systems for Existing Irrigation Facilities in Chile. Energies 2018, 11, 1853. [Google Scholar] [CrossRef] [Green Version]
- Shinde, V.B.; Wandre, S.S. Solar photovoltaic water pumping system for irrigation: A review. Afr. J. Agric. Res. 2015, 10, 2267–2273. [Google Scholar] [CrossRef] [Green Version]
- Monís, J.I.; López-Luque, R.; Reca, J.; Martínez, J. Multistage Bounded Evolutionary Algorithm to Optimize the Design of Sustainable Photovoltaic (PV) Pumping Irrigation Systems with Storage. Sustainability 2020, 12, 1026. [Google Scholar] [CrossRef] [Green Version]
- Todde, G.; Murgia, L.; Carrelo, I.; Hogan, R.; Pazzona, A.; Ledda, L.; Narvarte, L. Embodied Energy and Environmental Impact of Large-Power Stand-Alone Photovoltaic Irrigation Systems. Energies 2018, 11, 2110. [Google Scholar] [CrossRef] [Green Version]
- Sobor, I. Photovoltaic pump system design for small irrigation. In Proceedings of the 2017 International Conference on Electromechanical and Power Systems (SIELMEN), Iasi, Romania, 11–13 October 2017; pp. 315–320. [Google Scholar]
- Sado, K.A.; Hassan, L.H.; Moghavvemi, M. Design of a PV-powered DC water pump system for irrigation: A case study. In Proceedings of the 2018 53rd International Universities Power Engineering Conference (UPEC), Glasgow, UK, 4–7 September 2018; pp. 1–6. [Google Scholar] [CrossRef]
- Chatterjee, A.; Ghosh, S. PV based Isolated Irrigation System with its Smart IoT Control in Remote Indian Area. In Proceedings of the 2020 International Conference on Computer, Electrical & Communication Engineering (ICCECE), Kolkata, India, 17–18 January 2020; pp. 1–5. [Google Scholar]
- Gopikanna, A.; Shankar, V.K.; Shankar, S.; Sridhar, A.C.; Vijayaraghavan, V. Hybrid Architecture for Integrating Solar PV Irrigation Pumps with Existing Rural Indian Microgrid. In Proceedings of the 2018 IEEE Global Humanitarian Technology Conference (GHTC), San Jose, CA, USA, 18–21 October 2018; pp. 1–2. [Google Scholar]
- Kyi, M.S.; Maw, L.; Tun, H.M. Study of solar PV sizing of water pumping system for irrigation of asparagus. Int. J. Sci. Technol. Res. 2016, 5, 71–75. [Google Scholar]
- Waleed, A.; Riaz, M.T.; Muneer, M.F.; Ahmad, M.A.; Mughal, A.; Zafar, M.A.; Shakoor, M.M. Solar (PV) Water Irrigation System with Wireless Control. In Proceedings of the 2019 International Symposium on Recent Advances in Electrical Engineering (RAEE), Islamabad, Pakistan, 28–29 August 2019; pp. 1–4. [Google Scholar]
- Immanue, T.; Rathnavel, P.; Adarsh, P.; Duraipandi, A.; Yaseer, N. PV Powered Standardised Irrigation System Using Soil Moisture Sensor. In Proceedings of the 2020 6th International Conference on Advanced Computing and Communication Systems (ICACCS), Coimbatore, India, 6–7 March 2020; pp. 1017–1020. [Google Scholar]
- Gabrovska-Evstatieva, K.; Evstatiev, B.; Trifonov, D.; Mihailov, N. Autonomous powering of an orchard irrigation system and fruit storage. In Proceedings of the 47th International Symposium, Actual Tasks on Agricultural Engineering, Opatija, Croatia, 5–7 March 2019; pp. 203–211, ISSN 1848-4425. [Google Scholar]
- Almeida, R.H.; Carrêlo, I.B.; Lorenzo, E.; Narvarte, L.; Fernández-Ramos, J.; Martínez-Moreno, F.; Carrasco, L.M. Development and Test of Solutions to Enlarge the Power of PV Irrigation and Application to a 140 kW PV-Diesel Representative Case. Energies 2018, 11, 3538. [Google Scholar] [CrossRef] [Green Version]
- Shoeb, A.; Shafiullah, G. Renewable Energy Integrated Islanded Microgrid for Sustainable Irrigation—A Bangladesh Perspective. Energies 2018, 11, 1283. [Google Scholar] [CrossRef] [Green Version]
- Wong, K.H.; Chong, W.T.; Poh, S.C.; Shiah, Y.-C.; Sukiman, N.L.; Wang, C.-T. 3D CFD simulation and parametric study of a flat plate deflector for vertical axis wind turbine. Renew. Energy 2018, 129, 32–55. [Google Scholar] [CrossRef]
- Díaz-Méndez, R.; Rasheed, A.; Peillón, M.; Perdigones, A.; Sanchez, R.; Tarquis, A.M.; García-Fernández, J.L. Wind pumps for irrigating greenhouse crops: Comparison in different socio-economical frameworks. Biosyst. Eng. 2014, 128, 21–28. [Google Scholar] [CrossRef] [Green Version]
- Ahshan, R.; Al-Badi, A.; Hosseinzadeh, N.; Shafiq, M. Small Wind Turbine Systems for Application in Oman. In Proceedings of the 2018 5th International Conference on Electric Power and Energy Conversion Systems (EPECS), Kitakyushu, Japan, 25–28 April 2018; pp. 1–6. [Google Scholar]
- Rehman, S.; Sahin, A.Z. Wind power utilization for water pumping using small wind turbines in Saudi Arabia: A techno-economical review. Renew. Sustain. Energy Rev. 2012, 16, 4470–4478. [Google Scholar] [CrossRef]
- Mazidi, A.; Guerri, O.; Boudia, S.M.; Larafi, M.M. Comparative Study Of Wind Pumping Performance In Two Algerian Coastal And Saharan Regions. In Proceedings of the 2018 International Conference on Wind Energy and Applications in Algeria (ICWEAA), Algiers, Algeria, 6–7 November 2018; pp. 1–5. [Google Scholar]
- Pali, B.S.; Vadhera, S. An Innovative Continuous Power Generation System Comprising of Wind Energy Along With Pumped-Hydro Storage and Open Well. IEEE Trans. Sustain. Energy 2020, 11, 145–153. [Google Scholar] [CrossRef]
- Serrano-Tovar, T.; Suárez, B.P.; Musicki, A.; Bencomo, J.A.D.L.F.; Cabello, V.; Giampietro, M. Structuring an integrated water-energy-food nexus assessment of a local wind energy desalination system for irrigation. Sci. Total Environ. 2019, 689, 945–957. [Google Scholar] [CrossRef] [PubMed]
- Ghasemi, A. Coordination of pumped-storage unit and irrigation system with intermittent wind generation for intelligent energy management of an agricultural microgrid. Energy 2018, 142, 1–13. [Google Scholar] [CrossRef]
- Kanoj, B.; Sanu, M.A.; Raju, A.B. Steady state analysis of autonomous wind energy conversion system for irrigation purpose employing induction machines using Python A free and open source software. In Proceedings of the 2013 IEEE Global Humanitarian Technology Conference: South Asia Satellite (GHTC-SAS), Trivandrum, India, 23–24 August 2013; pp. 292–297. [Google Scholar]
- Zhang, J.; Qi, Z.; Wen, J. Control of water pumping driven by wind turbine based on Quasi Z source inverter. In Proceedings of the 2017 Chinese Automation Congress (CAC), Jinan, China, 20–22 October 2017. [Google Scholar] [CrossRef]
- Calderon, J.; Cureg, J.; Diaz, M.; Guzman, J.; Rudd, C.; Le, H.T. Smart Agriculture: An Off-Grid Renewable Energy System for Farms using Wind Power and Energy Storage. In Proceedings of the 2019 IEEE Power & Energy Society Innovative Smart Grid Technologies Conference (ISGT), Washington, DC, USA, 18–21 February 2019. [Google Scholar]
- Mehta, A.; Srivastava, R.; Yadav, V.K.; Singh, P. Automatic Drip Irrigation System using Wind energy. Int. J. Geol. Agric. Environ. Sci. 2015, 3, 38–41, ISSN: 2348-0254. [Google Scholar]
- Behera, R.K.; Parida, S.K. PMSG based wind power generation for an isolated irrigation system with inbuilt frequency regulation capability. In Proceedings of the 2017 7th International Conference on Power Systems (ICPS), Pune, India, 21–23 December 2017; pp. 796–801. [Google Scholar]
- Saputra, M.; Syuhada, A.; Sary, R. Study of Solar and Wind Energy Using as Water Pump Drive-Land for Agricultural Irrigation. In Proceedings of the 2018 4th International Conference on Science and Technology (ICST), Yogyakarta, Indonesia, 7–8 August 2018; pp. 1–4. [Google Scholar]
- Ronad, B.F.; Jangamshetti, S.H. Optimal cost analysis of wind-solar hybrid system powered AC and DC irrigation pumps using HOMER. In Proceedings of the 2015 International Conference on Renewable Energy Research and Applications (ICRERA), Palermo, Italy, 22–25 November 2015; pp. 1038–1042. [Google Scholar]
- Xiang, C.; Liu, J.; Yu, Y.; Shao, W.; Mei, C.; Xia, L. Feasibility assessment of renewable energies for cassava irrigation in China. Energy Procedia 2017, 142, 17–22. [Google Scholar] [CrossRef]
- Powell, J.W.; Welsh, J.M.; Pannell, D.; Kingwell, R. Can applying renewable energy for Australian sugarcane irrigation reduce energy cost and environmental impacts? A case study approach. J. Clean. Prod. 2019, 240, 118177. [Google Scholar] [CrossRef]
- Campana, P.E.; Li, H.; Yan, J. Techno-economic feasibility of the irrigation system for the grassland and farmland conservation in China: Photovoltaic vs. wind power water pumping. Energy Convers. Manag. 2015, 103, 311–320. [Google Scholar] [CrossRef]
- Vick, B.D.; Neal, B.A. Analysis of off-grid hybrid wind turbine/solar PV water pumping systems. Sol. Energy 2012, 86, 1197–1207. [Google Scholar] [CrossRef] [Green Version]
- Nasiakou, A.; Vavalis, M.; Zimeris, D. Smart energy for smart irrigation. Comput. Electron. Agric. 2016, 129, 74–83. [Google Scholar] [CrossRef]
- Khiareddine, A.; Ben Salah, C.; Rekioua, D.; Mimouni, M.F. Sizing methodology for hybrid photovoltaic/wind/hydrogen/battery integrated to energy management strategy for pumping system. Energy 2018, 153, 743–762. [Google Scholar] [CrossRef]
- Elkadeem, M.; Wang, S.; Sharshir, S.; Atia, E.G. Feasibility analysis and techno-economic design of grid-isolated hybrid renewable energy system for electrification of agriculture and irrigation area: A case study in Dongola, Sudan. Energy Convers. Manag. 2019, 196, 1453–1478. [Google Scholar] [CrossRef]
- Carroquino, J.; Dufo-López, R.; Bernal-Agustín, J.L. Sizing of off-grid renewable energy systems for drip irrigation in Mediterranean crops. Renew. Energy 2015, 76, 566–574. [Google Scholar] [CrossRef]
- Meteonorm Software. Available online: https://meteonorm.com/en/ (accessed on 5 April 2021).
- Kumar, N.M.; Chopra, S.S.; de Oliveira, A.K.V.; Ahmed, H.; Vaezi, S.; Madukanya, U.E.; Castañón, J.M. Chapter 3—Solar PV Module Technologies. In Photovoltaic Solar Energy Conversion; Gorjian, S., Shukla, A., Eds.; Academic Press: Cambridge, MA, USA, 2020; pp. 51–78. [Google Scholar] [CrossRef]
- System Advisor Model Version 2020.11.29 (SAM 2020.11.29). National Renewable Energy Laboratory. Golden, CO, USA. Available online: https://sam.nrel.gov (accessed on 5 April 2021).
- PV Panels Cost. Available online: http://sunmetrix.com/solar-panel-installation-cost (accessed on 5 April 2021).
- Kaushal, P. Solar Panels Cost. Available online: https://solarenergyforus.com/solar-panels-cost/ (accessed on 5 April 2021).
- Bortolini, M.; Gamberi, M.; Graziani, A.; Manzini, R.; Pilati, F. Performance and viability analysis of small wind turbines in the European Union. Renew. Energy 2014, 62, 629–639. [Google Scholar] [CrossRef]
- Water Tanks Cost. Available online: https://agrodrip.com/ (accessed on 5 April 2021).
- Notton, G.; Paoli, C.; Vasileva, S.; Nivet, M.L.; Canaletti, J.-L.; Cristofari, C. Estimation of hourly global solar irradiation on tilted planes from horizontal one using artificial neural networks. Energy 2012, 39, 166–179. [Google Scholar] [CrossRef]
- Notton, G.; Poggi, P.; Cristofari, C. Predicting hourly solar irradiations on inclined surfaces based on the horizontal measurements: Performances of the association of well-known mathematical models. Energy Convers. Manag. 2006, 47, 1816–1829. [Google Scholar] [CrossRef]
- De Miguel, A.; Bilbao, J.; Aguiar, R.; Kambezidis, H.; Negro, E. Diffuse solar irradiation model evaluation in the North Mediterranean Belt area. Sol. Energy 2001, 70, 143–153. [Google Scholar] [CrossRef]
- Justus, C.G. Winds and Wind System Performance. Research Supported by the National Science Foundation and Energy Research and Development Administration. Franklin Institute Press: Philadelphia, PA, USA, 1978; Volume 1, 120p. [Google Scholar]
- Ross, R.G. Interface design considerations for terrestrial solar cell modules. In Proceedings of the 12th IEEE Photovoltaic Specialists Conference, Baton Rouge, LA, USA, 15–18 November 1976; pp. 801–806. [Google Scholar]
- Hameed, W.I.; Saleh, A.L.; Sawadi, B.A.; Al-Yasir, Y.I.A.; Abd-Alhameed, R.A. Maximum Power Point Tracking for Photovoltaic System by Using Fuzzy Neural Network. Inventions 2019, 4, 33. [Google Scholar] [CrossRef] [Green Version]
- Ascencio-Vásquez, J.; Bevc, J.; Reba, K.; Brecl, K.; Jankovec, M.; Topič, M. Advanced PV Performance Modelling Based on Different Levels of Irradiance Data Accuracy. Energies 2020, 13, 2166. [Google Scholar] [CrossRef]
- Vinod; Kumar, R.; Singh, S. Solar photovoltaic modeling and simulation: As a renewable energy solution. Energy Rep. 2018, 4, 701–712. [Google Scholar] [CrossRef]
- Zarkov, Z.; Stoyanov, L.; Milenov, V.; Voynova, H.; Lazarov, V. Modeling of PV generators from different technologies—Case study. In Proceedings of the 2016 IEEE International Power Electronics and Motion Control Conference (PEMC), Varna, Bulgaria, 25–28 September 2016; pp. 419–424. [Google Scholar]
- Notton, G.; Lazarov, V.; Stoyanov, L. Optimal sizing of a grid-connected PV system for various PV module technologies and inclinations, inverter efficiency characteristics and locations. Renew. Energy 2010, 35, 541–554. [Google Scholar] [CrossRef]
- Al-Addous, M.; Al Hmidan, S.; Jaradat, M.; Alasis, E.; Barbana, N. Potential and Feasibility Study of Hybrid Wind–Hydroelectric Power System with Water-Pumping Storage: Jordan as a Case Study. Appl. Sci. 2020, 10, 3332. [Google Scholar] [CrossRef]
- Huynh, H.T. Accurate Monotone Cubic Interpolation. SIAM J. Numer. Anal. 1993, 30, 57–100. [Google Scholar] [CrossRef] [Green Version]
- Pinnangudi, B.; Kuykendal, M.; Bhadra, S. Smart Grid Energy Storage. In The Power Grid; Brian, W.D., Ed.; Academic Press: Cambridge, MA, USA, 2017; pp. 93–135. [Google Scholar] [CrossRef]
- Grundfos Catalog.ue. Available online: https://product-selection.grundfos.com (accessed on 5 April 2021).
- Food and Agricultural Organization. FAOSTAT. Available online: http://www.fao.org/faostat/en/ (accessed on 29 July 2018).
- Ministry of Agriculture, Food and Forestry, Production of Wine Grapes and Wine—Harvest 2019, Agrostatistika, Volume 373, April 2020. Available online: https://www.mzh.government.bg/media/filer_public/2020/04/27/ra373-vinewine2019_final.pdf (accessed on 5 April 2021). (In Bulgarian)
- Carrasco-Benavides, M.; Antunez-Quilobrán, J.; Baffico-Hernández, A.; Ávila-Sánchez, C.; Ortega-Farías, S.; Espinoza, S.; Gajardo, J.; Mora, M.; Fuentes, S. Performance Assessment of Thermal Infrared Cameras of Different Resolutions to Estimate Tree Water Status from Two Cherry Cultivars: An Alternative to Midday Stem Water Potential and Stomatal Conductance. Sensors 2020, 20, 3596. [Google Scholar] [CrossRef] [PubMed]
- Cocco, M.; Mercenaro, L.; Cascio, M.L.; Nieddu, G. Effects of Vine Water Status and Exogenous Abscisic Acid on Berry Composition of Three Red Wine Grapes Grown under Mediterranean Climate. Horticulturae 2020, 6, 12. [Google Scholar] [CrossRef] [Green Version]
- Li, P.; Tan, H.; Wang, J.; Cao, X.; Yang, P. Evaluation of Water Uptake and Root Distribution of Cherry Trees Under Different Irrigation Methods. Water 2019, 11, 495. [Google Scholar] [CrossRef] [Green Version]
- Chandel, A.; Khot, L.; Molaei, B.; Peters, R.; Stöckle, C.; Jacoby, P. High-Resolution Spatiotemporal Water Use Mapping of Surface and Direct-Root-Zone Drip-Irrigated Grapevines Using UAS-Based Thermal and Multispectral Remote Sensing. Remote Sens. 2021, 13, 954. [Google Scholar] [CrossRef]
- Pepelyanokov, G.; Trenchev, G. Practical Orcharding; Dionis: Sofia, Bulgaria, 2001; p. 328. (In Bulgarian) [Google Scholar]
- Nedelchev, N.; Kondarev, M. Viticulture Part 1 and 2; Zemizdat: Sofia, Bulgaria, 1958; p. 383. (In Bulgarian) [Google Scholar]
Figure 1.
Annual increase and total installed capacity for: (a) photovoltaic; (b) wind generators [4].
Figure 1.
Annual increase and total installed capacity for: (a) photovoltaic; (b) wind generators [4].

Figure 2.
Influence of irrigation on the harvest for different crops [7].
Figure 2.
Influence of irrigation on the harvest for different crops [7].

Figure 3.
Illustration of the considered irrigation system.

Figure 4.
Typical power curves per unit (p.u.), as used in the methodology: (a) Type 1; (b) Type 2; (c) Type 3; (d) Type 4; (e) Type 5; (f) Type 6; (g) Type 7; (h) Type 8.
Figure 4.
Typical power curves per unit (p.u.), as used in the methodology: (a) Type 1; (b) Type 2; (c) Type 3; (d) Type 4; (e) Type 5; (f) Type 6; (g) Type 7; (h) Type 8.

Figure 5.
Simplified flowcharts of simulated processes during the year: (a) pumping; (b) irrigation.
Figure 5.
Simplified flowcharts of simulated processes during the year: (a) pumping; (b) irrigation.

Figure 6.
Considered sites: geographical position, coordinates and respective crops.

Figure 7.
Monthly average of the hourly solar irradiation and precipitation for one year, and during the irrigation period for each crop.
Figure 7.
Monthly average of the hourly solar irradiation and precipitation for one year, and during the irrigation period for each crop.

Figure 8.
Weibull distribution for the considered sites for one year (yellow solid line), the cherry irrigation period (purple dashed line with rounds) and the wine grape/period (blue dashed line with triangles), and the corresponding average wind speeds: Vav,A, Vav,C and Vav,W.
Figure 8.
Weibull distribution for the considered sites for one year (yellow solid line), the cherry irrigation period (purple dashed line with rounds) and the wine grape/period (blue dashed line with triangles), and the corresponding average wind speeds: Vav,A, Vav,C and Vav,W.

Figure 9.
Variation of the optimization criteria for a cherry crop in Kyustendil for a 15 kW hybrid system with mSi PV panels and WT type 1 without a battery: (a) investment cost IC ($); (b) wasted electrical energy WEE (kWh); (c) satisfaction of the crop’s requirement SCR (%).
Figure 9.
Variation of the optimization criteria for a cherry crop in Kyustendil for a 15 kW hybrid system with mSi PV panels and WT type 1 without a battery: (a) investment cost IC ($); (b) wasted electrical energy WEE (kWh); (c) satisfaction of the crop’s requirement SCR (%).

Figure 10.
Variation of SCR (%) and WEE (kWh) for different hybrid systems for wine grapes in Suhindol with mSi PV panels and WT type 5: (a) SCR for 10kW HRES; (b) WEE for 10kW HRES; (c) SCR for 15kW HRES; (d) WEE for 15kW HRES; (e) SCR for 20kW HRES; (f) WEE for 20kW HRES; (g) SCR for 25kW HRES; (h) WEE for 25kW HRES.


Figure 11.
SCR (%) for cherries in Silistra with 15 kW HRES and WT type 4 for each PV cell technology: (a) mSi; (b) pSi; (c) uSi; (d) CIGS; (e) CdTe.
Figure 11.
SCR (%) for cherries in Silistra with 15 kW HRES and WT type 4 for each PV cell technology: (a) mSi; (b) pSi; (c) uSi; (d) CIGS; (e) CdTe.

Figure 12.
Variation of SCR (%) for Burgas (wine grapes) with a 15 kW HRES using pSi PV technology for different WT types: (a) Type 1; (b) Type 2; (c) Type 3; (d) Type 4; (e) Type 5; (f) Type 6; (g) Type 7; (h) Type 8.
Figure 12.
Variation of SCR (%) for Burgas (wine grapes) with a 15 kW HRES using pSi PV technology for different WT types: (a) Type 1; (b) Type 2; (c) Type 3; (d) Type 4; (e) Type 5; (f) Type 6; (g) Type 7; (h) Type 8.


Figure 13.
SCR (%) for cherries with a 12.5 kW HRES, using uSi PV technology and WT type 3 for each site: (a) Kyustendil; (b) Kurdjali; (c) Silistra; (d) Chirpan; (e) Sandanski.
Figure 13.
SCR (%) for cherries with a 12.5 kW HRES, using uSi PV technology and WT type 3 for each site: (a) Kyustendil; (b) Kurdjali; (c) Silistra; (d) Chirpan; (e) Sandanski.

Figure 14.
Variation of SCR (%) and WEE (kWh) for wine grapes and cherries for Sandanski, with a 12.5 kW HRES, with pSi PV panels and WT type 3: (a) SCR for wine grapes; (b) SCR for cherries; (c) WEE for wine grapes; (d) WEE for cherries.
Figure 14.
Variation of SCR (%) and WEE (kWh) for wine grapes and cherries for Sandanski, with a 12.5 kW HRES, with pSi PV panels and WT type 3: (a) SCR for wine grapes; (b) SCR for cherries; (c) WEE for wine grapes; (d) WEE for cherries.

Figure 15.
Variation of the SCR (%) for Svishtov (wine grapes), with a 15 kW HRES, with mSi PV technology and WT type 3 (a) without battery; (b) with battery.
Figure 15.
Variation of the SCR (%) for Svishtov (wine grapes), with a 15 kW HRES, with mSi PV technology and WT type 3 (a) without battery; (b) with battery.

Figure 16.
Variation of battery parameters for different water tank volumes and PV ratios for Svishtov (wine grapes), with a 15 kW HRES, with mSi PV panels and WT type 3: (a) the maximal achieved capacity during the irrigation period (kWh); (b) the final state of the charge in the end of the irrigation period (kWh).


Table 1.
Values of the empirical coefficients used in the PV panel modelling [86].
Table 1.
Values of the empirical coefficients used in the PV panel modelling [86].
| Coefficient | PV Technology | ||||
|---|---|---|---|---|---|
| mSi | pSi | uSi | CIGS | CdTe | |
| p | 23.1 | 23.5 | 12.1 | 20.4 | 15.1 |
| q | −0.281 | −0.291 | −0.248 | −0.251 | −0.252 |
| m | 0.155 | 0.132 | 0.180 | 0.271 | 0.171 |
| r | −0.150 | −0.149 | −0.054 | −0.152 | −0.112 |
| hR | 0.028 | 0.026 | 0.022 | 0.032 | 0.030 |
Table 2.
Parameters of the hydraulic configuration of the irrigation system.
| Parameter | Value |
|---|---|
| Groundwater height | 35 m |
| Water tank elevation | 5 m |
| Maximal allowed debit | 50 m3/h |
| Pipes’ diameter | 90 mm |
| Depth of the well | 60 m |
| Depth of the pump | 50 m |
Table 3.
Investment costs for the different PV cell technologies, wind turbine and water tank.
| Generator | mSi | pSi | uSi | CIGS | CdTe | WT | Water Tank |
|---|---|---|---|---|---|---|---|
| Investment cost | 2.04 $/W | 1.74 $/W | 1.34 $/W | 1.44 $/W | 1.39 $/W | 2 $/W | 26.672 × TV + 12,489 $/m3 |
Table 4.
Optimal configurations for each HRES rated power for wine grapes in Suhindol with mSi PV panels and WT type 5.
Table 4.
Optimal configurations for each HRES rated power for wine grapes in Suhindol with mSi PV panels and WT type 5.
| Parameter | Unit | 10 kW | 12.5 kW | 15 kW | 17.5 kW | 20 kW | 22.5 kW | 25 kW |
|---|---|---|---|---|---|---|---|---|
| Cr | $/% | 761.52 | 610.84 | 566.7 | 614.65 | 664.65 | 714.65 | 764.65 |
| PV ratio | - | 1 | 0.96 | 1 | 0.914 | 0.80 | 0.71 | 0.64 |
| TV | m3 | 500 | 500 | 500 | 500 | 500 | 500 | 500 |
| SCR | % | 60.7 | 83.99 | 99.57 | 100 | 100 | 100 | 100 |
| IC | k$ | 46.23 | 51.31 | 56.43 | 61.47 | 66.47 | 71.465 | 76.47 |
| WEE | kWh | 102.39 | 189.05 | 1295.54 | 1923.78 | 2018.68 | 2179.6 | 2366.16 |
Table 5.
Optimal configurations for each PV cell technology for cherries in Silistra with a 15 kW HRES, using a WT type 4.
Table 5.
Optimal configurations for each PV cell technology for cherries in Silistra with a 15 kW HRES, using a WT type 4.
| Parameter | Unit | mSi | pSi | uSi | CIGS | CdTe |
|---|---|---|---|---|---|---|
| Cr | $/% | 576.3 | 527.37 | 470.89 | 499.36 | 479.47 |
| PV ratio | - | 1 | 1 | 1 | 1 | 1 |
| TV | m3 | 500 | 500 | 500 | 500 | 500 |
| SCR | % | 97.91 | 98.46 | 97.53 | 94.97 | 97.35 |
| IC | k$ | 56.43 | 51.93 | 45.93 | 47.43 | 46.68 |
| WEE | kWh | 3181.79 | 3626.59 | 3824.69 | 1777.09 | 3148.53 |
Table 6.
Optimal configurations for each site with cherries and a 12.5 kW HRES, using uSi PV panels and WT type 3.
Table 6.
Optimal configurations for each site with cherries and a 12.5 kW HRES, using uSi PV panels and WT type 3.
| Parameter | Unit | Kyustendil | Kurdjali | Silistra | Chirpan | Sandanski |
|---|---|---|---|---|---|---|
| Cr | $/% | 474.48 | 460.19 | 470.89 | 464.14 | 460.80 |
| PV ratio | - | 1 | 1 | 1 | 1 | 1 |
| TV | m3 | 500 | 500 | 500 | 500 | 500 |
| SCR | % | 96.79 | 99.80 | 97.53 | 98.95 | 99.66 |
| IC | k$ | 45.93 | 45.93 | 45.93 | 45.93 | 45.93 |
| WEE | kWh | 3123.02 | 4490.89 | 3824.69 | 2798.30 | 4223.21 |
Table 7.
Optimal configurations according the combined criterion for Svishtov (wine grapes) with a 15 kW HRES, mSi PV technology and WT type 3.
Table 7.
Optimal configurations according the combined criterion for Svishtov (wine grapes) with a 15 kW HRES, mSi PV technology and WT type 3.
| Parameter | Unit | Without Battery | With Battery |
|---|---|---|---|
| Cr | $/% | 570.70 | 564.88 |
| PV ratio | - | 1 | 1 |
| TV | m3 | 500 | 500 |
| SCR | % | 98.87 | 99.89 |
| IC | k$ | 56.43 | 56.43 |
| WEE | kWh | 1613.76 | 1280.04 |
Publisher’s Note: MDPI stays neutral with regard to jurisdictional claims in published maps and institutional affiliations. |
© 2021 by the authors. Licensee MDPI, Basel, Switzerland. This article is an open access article distributed under the terms and conditions of the Creative Commons Attribution (CC BY) license (https://creativecommons.org/licenses/by/4.0/).
Share and Cite
MDPI and ACS Style
Stoyanov, L.; Bachev, I.; Zarkov, Z.; Lazarov, V.; Notton, G. Multivariate Analysis of a Wind–PV-Based Water Pumping Hybrid System for Irrigation Purposes. Energies 2021, 14, 3231. https://0-doi-org.brum.beds.ac.uk/10.3390/en14113231
AMA Style
Stoyanov L, Bachev I, Zarkov Z, Lazarov V, Notton G. Multivariate Analysis of a Wind–PV-Based Water Pumping Hybrid System for Irrigation Purposes. Energies. 2021; 14(11):3231. https://0-doi-org.brum.beds.ac.uk/10.3390/en14113231
Chicago/Turabian StyleStoyanov, Ludmil, Ivan Bachev, Zahari Zarkov, Vladimir Lazarov, and Gilles Notton. 2021. "Multivariate Analysis of a Wind–PV-Based Water Pumping Hybrid System for Irrigation Purposes" Energies 14, no. 11: 3231. https://0-doi-org.brum.beds.ac.uk/10.3390/en14113231
Note that from the first issue of 2016, this journal uses article numbers instead of page numbers. See further details here.