
Moving Up the Electrification Ladder in Off-Grid Settlements with Rooftop Solar Microgrids


1
Center for Research in Energy Systems and Technologies, University of San Carlos, Cebu City 6000, Philippines
2
Department of Electrical and Electronics Engineering, University of San Carlos, Cebu City 6000, Philippines
3
Saab-NTU Joint Lab, Nanyang Technological University, 50 Nanyang Ave, Singapore 639798, Singapore
4
Department of Chemical Engineering, University of San Carlos, Cebu City 6000, Philippines
*
Author to whom correspondence should be addressed.
Energies 2021, 14(12), 3467; https://0-doi-org.brum.beds.ac.uk/10.3390/en14123467
Submission received: 14 May 2021
/
Revised: 1 June 2021
/
Accepted: 2 June 2021
/
Published: 11 June 2021
(This article belongs to the Special Issue Addressing Challenges of Low-Carbon Energy Transition)
Abstract
:The multi-tier framework (MTF) of electricity access defines a continuum of electrification from tier 0, where access is inexistent or very limited, to tier 5 where access is of grid quality. Transitioning households from lower to higher tiers unlocks the potential in meeting more of their energy needs. This study investigates the transition towards higher tier electricity access on Gilutongan Island, an off-grid island of Cebu, Philippines, which is also an informal settlement community with no open land available for a centralized solar PV system. The solar PV potential of suitable rooftops on the island was determined using satellite imagery, ground measurements, and computation. The electricity demand of a cluster of 11 households was examined in detail; these households, situated near two suitable rooftops, were connected to an installed 7.92 kWp solar PV-based microgrid. Results show that the households moved up from lower to higher tier levels in all MTF attributes except for affordability. Nevertheless, the cost of a standard electricity consumption package of 1 kWh/day dropped from 18% of the average household income to 6%. Moving up on the electrification ladder to higher tier electricity access in off-grid areas is attainable with households clustered as a microgrid using rooftop solar PV. Affordability remains to be the biggest challenge that needs to be addressed.
1. Introduction
The United Nations’ Sustainable Development Goal (SDG) 7 seeks to ensure access to affordable, reliable, sustainable, and modern energy for all by 2030 [1]. According to the World Bank in its 2018 annual report, 40 countries achieved universal electrification since 2010 [2]. Archipelagic countries such as Indonesia and the Philippines face unique challenges in achieving universal electrification because of their islandic geography. The electrification rates of rural areas in Indonesia and the Philippines in 2018 were 97% and 93%, respectively [3], but despite improvements year on year, segments of the rural population are still without electricity access.
Rural areas in archipelagic countries include small and remote islands where communities are not connected to the national grid because of the economic unviability of underwater grid extension. In a study by Blechinger et al. [4], the power supply in small islands all over the world is dominated by diesel power plants. In the Philippines, Bertheau and Blechinger [5] presented a techno-economic optimized electrification strategy for small islands with diesel systems to support the attainment of SDG 7. The proposed strategy is based on the hybridization—through the addition of renewable energy (RE) technologies—of diesel power plants where the high cost of electricity is currently subsidized by the country’s grid consumers through the national government. In another work by Meschede et al. [6], 649 islands in the Philippines that were not electrified were identified for cluster analysis and energy modelling. It was found that the cost-optimized 100% RE systems suitable for electrification are based on solar photovoltaics (PV) with battery energy storage and on the supplementary wind capacity for some islands. In the study of Agua et al. [7], the interconnection of hybrid RE systems in a group of islands through submarine cables was investigated, and it was shown that doing so would increase the reliability of the electricity supply, though resulting in a slight increase in the cost of electricity. In a study conducted in Greece, a hybrid RE system with solar PV and wind turbine—with substantial battery energy storage capacity—demonstrated the effectiveness of microgrids in providing energy access to remote islands [8]. These studies indicated that RE systems are definitely the major pathway for the provision of quality electricity access in off-grid islands.
The studies mentioned above model the attainment of universal electrification in small off-grid islands from the macro level. Going to the ground level, there are challenges that are specific to particular environments, and these slow down the path to a low-carbon energy transition in unelectrified or underelectrified areas. Bertheau et al. [9] looked at the challenges faced by an electric cooperative in the installation of a hybrid RE system in a small and remote island in the Philippines. The most serious implementation risk identified in the study was the discontinuity between the government policy pronouncements and the actual implementation practice. In installing a hybrid system that has a higher levelized cost of electricity (LCOE) than the authorized tariff, the very lengthy tariff adjustment process endangered the sustainability of the RE-based system.
Another challenge to off-grid electrification that macro-level studies have not covered is the availability of open land in small and remote island communities. Having an open land is critical for mini-grids or microgrids that are based on solar PV where panels are often installed in a centralized location. In small islands with dense population, open land is prime real estate, and using it for a centralized solar PV system would drive up the cost of electricity (COE). Another reason why open land may not be available for a community is that the residents are informal settlers.
1.1. Electricity Access in Informal Settlements
Poverty is one of the common characteristics of households in informal settlements. The United Nations defined informal settlements as residential areas where (1) inhabitants have no security of tenure on the lands that they inhabit, (2) there is usually a lack of basic services in the community, and (3) the housing may not comply with existing building regulations [10,11]. The lack of basic services typically encompasses water, sanitation, and electricity. Electricity access in informal settlements often involve illegal connections, as legal connections often require proof of dwelling formality [12]. This is usually the case in grid-connected informal settlements. For informal settlements in off-grid areas, the electricity access situation is even worse. Power is typically supplied by diesel generators with limited availability, usually only for 4 to 6 h in the evening.
Butera et al. [13] conducted a survey on two informal settlements in Rio de Janeiro to perform a detailed analysis on energy access and energy poverty levels. The study underlined the problems of power outages and connections that are either low voltage or illegal, or both, in the settlements’ electricity supply. Energy poverty was prevalent at 50% in one study site and 20% on the other, and household expenditures were disproportioned to the household income. In the work of Smit et al. [14], it was recognized that the attainment of SDG 7 requires a deep understanding of the issues that affect the energy access provision. Using a community-based system dynamics approach, the identified factors that affect energy access included affordability, availability, and land ownership, among the other sociopolitical factors considered in the study. The broader issues recognized as needing to be addressed included participation in the political process and the quest for legitimacy through direct electricity connections.
Universal electrification along the ideals of SDG 7 cannot be achieved without the provision of affordable, reliable, sustainable and modern energy to all, including households in informal settlements. The energy access literature contains studies on informal settlements in urban areas [15,16], but there is a dearth of work on electricity access in informal settlements located in small islands where people reside; these are close enough to urban centers yet still remote as it is unviable to connect them to the central grid. This work seeks to address this gap by investigating how higher tier electricity access can be provided in an informal settlement without the use of open land for a centralized solar PV system, as such land is not legally available. Instead, the solar PV potential of rooftops on an off-grid island is quantified, and the installation of a rooftop solar PV-based microgrid is demonstrated as capable of providing quality 24-h electricity access to a neighborhood of users. The quality of electricity access is assessed using the multi-tier framework of electricity supply.
1.2. The Multi-Tier Framework of Household Electricity Supply
With the rapid development of technologies that made possible the self-generation of electricity down to the household level, even to employ renewable energy, household electrification no longer just meant being connected to some form of a grid. A single household can be electrified with a standalone system that operates on flexible hours, depending on the system’s capacity and the household’s demand. The technological developments on distributed generation have resulted in a wide range of electricity access tiers from a low level of just a few watts of supply up to systems that can fully meet all electrical load requirements. The current electrification situation is similar to a ladder with several rungs that households can climb. Users can obtain initial access with electricity supplies that satisfy just the basic needs such as lighting and cellphone charging, then they can move onto higher capacity systems that can power entertainment and mass communication devices, air circulation, food storage, and eventually high-power appliances such as electric cookers.
Being on a low rung in the ladder of electrification is better than having no access to electricity at all. However, the universal goal is to ensure access to affordable, reliable, sustainable, and modern energy for all, as stated in SDG 7. In today’s modern society, electricity has become a common good that must be available to anyone who needs it, and some countries such as the Philippines have targeted 100% electricity access for its population. Moving communities up the electrification ladder where the quality of electricity access increases in a continuum is a challenge to all energy access stakeholders, as meeting the target for SDG 7 contributes greatly to the achievement of the other sustainable development goals.
The rise of distributed generation technologies—where the power output ranges from a few watts to millions of watts, and where the availability of electricity can vary on any given day—necessitated a new way of defining the quality of electricity access beyond just mere connections. In 2015, the World Bank, through the work of Bhatia and Angelou [17], put forth the multi-tier framework (MTF) of energy access that defined energy services as a continuum of tier levels, both for electricity and for cooking. The MTF matrix on household electricity access is shown in Table 1. The MTF defined several matrices for measuring the various types of energy access such as those for household electricity supply, street lighting, community infrastructure, and even cooking solutions. This study looks only at the MTF for household electricity supply and refers to the matrix presented in Table 1 when MTF is discussed in this work.
The MTF defines seven attributes of household electricity supplies. These are peak capacity, availability, reliability, quality, affordability, legality, and health and safety. The attributes are the characteristics of the electricity supply that determine its usability in delivering energy services. For the attributes of peak capacity and availability, descriptors for tiers 0 to 5 are defined. The attribute of reliability has only three tiers, namely 0, 4, and 5. The rest of the attributes have only two tiers: a lower tier of 0 and an upper tier of 5.
The attribute of peak capacity is defined as the ability of the supply to provide a certain amount of power to operate electrical loads. This can range from a few watts, which can used for situations such as powering up an LED lamp or a cellphone charger, to several kilowatts, which is the amount required to operate high-power loads such as shower water heaters. Peak capacity is measured across multiple tiers based on the amount of power an electricity supply can provide to a load, or based on the amount of electrical energy that a supply can provide daily, with the latter applying especially to constrained-generation systems such as solar home systems (SHS).
The availability attribute refers to the ability to draw electricity whenever it is needed. As Pelz and Urpelainen [18] observed, supply availability in terms of the number of hours per day is strongly associated with utilization, as one cannot utilize that which is not available. The tiers of availability is measured in terms of the number of hours in a whole day that the supply is available and also according to the number of available hours in the evening when electricity is most needed in households for lighting, entertainment, reading, and other activities.
The reliability of an electrical supply refers to the absence of unpredictable outages and is measured in terms of the frequency and duration of outages. The MTF assigns only three tiers for this attribute, which are tiers 0, 4, and 5 as defined in Table 1. The attribute of quality, on the other hand, refers to having the right voltage level within acceptable variations from the nominal value as specified in the electrical supply equipment. There are only two tiers, 0 and 5, where the higher tier means that the supply can provide the acceptable range of voltage level to the load, which is typically ± 5% of the nominal voltage.
The affordability attribute refers to the ability of the household to pay for needed electricity based on a defined energy consumption package. According to Bhatia and Angelou [17], the standard electricity consumption package is defined to be an annual consumption of 365 kWh. In this work, this is interpreted as 1 kWh of electricity consumption per day as the households involved in the study are already accustomed to paying for electricity on a daily basis. The threshold of affordability is 5% of the household income, i.e., electricity is considered affordable when households do not spend more than 5% of their income for electricity.
The attribute of legality means that users do not engage in actions prohibited by law in using the electricity supply. On the other hand, the health and safety attribute entails the absence of adverse health and safety risks in using the supply.
1.3. Low-Tier Electrification with SHS
The lower tiers of the MTF capture the state of electrification of the users that use household-scale supplies such as solar home systems (SHSs). The SHS is a popular solution for the electrification of remote communities. This is because SHSs are discrete systems that can be deployed in single households where the initial capital cost can be easily covered through distributed payments such as in pay-as-you-go schemes [19]. The capacity of an SHS typically ranges from 11 Wp to more than 100 Wp with suitable battery energy storage capacity [20]. Because of its capacity limitations, an SHS can power only very-low and low-power appliances, such as those up to 60 W. These can already meet the basic electricity requirements of households for lighting, communication, entertainment, and air circulation.
An SHS can provide basic electricity access for lighting, cell phone-charging, air ventilation, television, and other low-power appliances. Many households, however, desire to use medium-power appliances, such as rice cookers and small power tools for doing productive work, and to have 24 h availability of electricity for food storage applications such as in refrigerators and freezers. These appliances require at least a tier 4 level of electricity access to work properly.
In Narayan et al. [21], three electrification pathways were examined, namely grid extension, centralized microgrids, and standalone solar-based solutions such as an SHS. Grid extension was found to give broad-scale electricity access at lower costs, but it requires a certain demand threshold and population density to justify fairly large investments. Centralized microgrids were found to be the next best option where grid extension is economically not viable, but similarly though at a lesser extent, a certain demand threshold and population density need to justify the capital expenditure. The SHS seemed to be the option left for communities not meeting demand threshold and population density requirements, and it is in fact the solution of choice for millions of homes. However, the study investigated whether SHS can provide adequate levels of electricity access, and it found that although SHS can provide on-demand access to electricity, it achieves only tier 2 of electrification. To climb the electrification ladder, the study recommended the interconnection of multiple SHSs into a DC supply network, forming a bottom-up microgrid. In the study of Wróbel et al. [22], neighboring households exchange alternating current (AC) electricity from residential systems with rooftop solar PV and battery energy storage, forming micronetworks with the objective of energy independence. The same framework can be used in off-grid areas where independent RE systems are interconnected to provide higher tier electricity access.
1.4. Higher Tier Electrification Using Solar Microgrids on Rooftops
In archipelagic Philippines with 7641 islands [23], only around 2000 are inhabited. Bertheau [24] analyzed 649 unelectrified small islands in the country (50 < pop. < 5000) and found that the cost-optimized 100% renewable energy systems suitable for the islands are based primarily on solar PV with battery energy storage. The study focused on microgrids as a solution to island electrification, hence the exclusion of very small islands with population less than 50 where SHS would be the most appropriate technology solution. Typical solar PV-based microgrids have solar panels installed in a centralized location [9,25,26,27] where open land is available for the installation. However, in islands without open lands such as those with high household density or those with legality issues such as those in informal settlements, the next viable option for solar panel installation is on rooftops.
Quantifying the resources available in a location is the usual first step in an RE project implementation. The popular practice in quantifying solar rooftop potential is solar city mapping where light detection and ranging (LIDAR) and land use data are processed to come up with digital models that quantify the available rooftop area [28]. LIDAR data, however, is seldom available for small off-grid islands. The current studies on estimating the rooftop solar PV potential of islands have calculated rooftop areas using shapefiles in GIS software with satellite imagery coming from sources such as Google Earth [29,30]. For islands in developing world countries, however, an additional step is needed to physically investigate rooftops for their structural suitability to solar panel installation.
This paper investigates to what extent households in an off-grid informal settlement can move up in the electrification ladder as quantified by the tier levels of the MTF attributes of peak capacity, availability, reliability, quality, affordability, legality, and health and safety. The study site is an off-grid community that has low-tier electricity access and where open land is not legally available for a centralized solar PV system. Here, a rooftop solar PV-based microgrid is designed and installed for a cluster of 11 households that are connected to the microgrid, allowing us to investigate the extent of tier gains on the MTF attributes. Overall, the households in the microgrid moved up to higher tiers in all MTF attributes except that of affordability. Although there was a big drop in the cost of electricity paid for a standard consumption package of 1 kWh/day, the reduction did not breach the affordability threshold. The move to higher tiers in the six other attributes, however, gave the microgrid-connected households lots of benefits. These include being able to use high-power appliances such as rice cookers and having 24 h availability of electricity that enables round-the-clock loads such as freezers.
2. Materials and Methods
The steps in the implementation of this study are shown in Figure 1. The work started by describing the study site’s current state of electricity access using the multi-tier framework (MTF) for household electricity supply. This was followed by investigating the structurally-suitable rooftops on the island for solar PV installation and then quantifying the rooftop solar PV potential of structures that were found suitable. The household cluster where a microgrid would be installed was chosen based on a set of criteria that was followed by a participatory approach to demand profiling. The microgrid was then designed, installed, and commissioned. A system was put in place to monitor the system’s operation and to collect data with the participation of the user community. Finally, the changed status of electricity access in the microgrid-connected households was determined, again using the MTF as the basis for the assessment. The details of the methods for each of the nine steps are discussed in succeeding subsections.
2.1. Study Site
Gilutongan Island is an island village in the municipality of Cordova, province of Cebu in the central part of the Philippines. Its coordinates are 10°12′26.1″ N, 123°59′18.9″ E. The location of the island within the Philippines and close-up satellite imagery are both shown in Figure 2. The island has a land area of 0.1126 km2 and is about 5.5 km by sea from Mactan Island where the major part of the municipality of Cordova is located [31]. Mactan Island is connected to the Philippine national grid; however, Gilutongan Island is an off-grid island because of the economic unviability of connecting it to the centralized grid through submarine cables. As of the year 2017, the community has a population of 1875 living in 342 households. Additional details on the Gilutongan Island community are discussed in a study by Lozano et al. [32].
2.2. Electricity Access on Gilutongan Island
A household survey on electricity access was conducted on Gilutongan Island in May 2018, covering 301 out of the total of 342 households on the island. A survey questionnaire was designed to obtain relevant personal information of the respondents, household information including appliance ownership and electricity usage, household income, and plans on future usage of electricity. Data from the survey were processed and analyzed, serving as basis for describing the electricity access of the community based on the MTF. Interviews were also conducted with key village personnel to gain more insights on the community’s electrification status. The interviewees included the village leader (barangay captain), selected village council members, and the diesel generator operator. Table 2 lists the data obtained in order that a description for each MTF attribute can be made.
2.3. Assessment of Village Rooftops for Solar Panel Installation
A satellite image of Gilutongan Island was obtained from Google Earth. Due to the convenience and ease of use of the Google Earth interface, rooftop polygons were drawn in the same application. The polygons were exported to Quantum GIS (QGIS) software in order to compute for the total area. A correction factor further refined the area computation obtained from the measured dimensions of validation rooftops on the island. The correction factor accounts for the difference in the rooftop area computed through QGIS and the actual area as measured on site.
Most of the houses and other structures on Gilutongan Island did not go through the standard permitting and approval process, which is based on the country’s building code. This situation is not new to the Philippines’ housing situation, especially in informal settlements [33,34]. The island has never experienced 24 h availability of electricity, which could be one of the reasons for the low economic activity in the community. The locals settle with below-standard housing to save on construction costs. Thus, it was necessary to determine whether a structure can carry the mechanical load from solar PV modules and the occasional weight from solar installation and maintenance.
Site visits were conducted to assess the structural suitability of rooftops for the installation of solar PV panels. A simplified metric for structural integrity was used in this study to rapidly assess the roof’s capacity to carry solar panel load. A suitable structure must comply with all the conditions specified below:
- Use of concrete walls or columns;
- Use of standard roof components (trusses, rafters, and purlins);
- No apparent roof damage due to fire or other incidents; and
- Use of galvanized iron (GI) sheets as roofing material.
Roofs that were deemed unsuitable were excluded from the rooftop solar PV potential calculations, which were done using the PVsyst software. For suitable rooftops, every roof face was considered in the calculation. The total solar PV rooftop potential of Gilutongan Island was computed by adding up all suitable structures’ individual potential. Detailed workflow for the rooftop solar potential calculation is shown in Figure 3.
2.4. Solar PV Potential of Suitable Rooftops
The solar PV potential of suitable rooftops on Gilutongan Island was quantified using PVsyst, an industry-standard tool for solar PV calculations. The measurements gathered during field surveys were used to make three-dimensional models in SketchUp, a 3D modelling software. The 3D models were exported into the shading scene of PVsyst and became the basis of the solar PV potential calculation for each structure. The simulations were done in the standalone PV system mode, which required a load input. However, this should not be a problem with calculating the potential since only the rooftop solar PV generation was considered in this study, and it is independent of the defined load consumption. A generic demand profile with fixed battery-sizing was used for all structures.
2.5. Selection of Household Cluster for the Pilot Microgrid
A cluster of households was selected for the pilot microgrid implementation. Based on the research grant amount that was available for the microgrid installation against estimated system costs, it was decided to have 11 households for the study. With 342 households on the island, the selection of the household cluster was made based on a set of criteria, which were as follows:
- Availability of rooftops suitable for solar PV installation among the households in a cluster;
- Willingness of the heads of the households with suitable rooftops to have solar panels installed on their roofs;
- Availability of key persons living within the household cluster who can take leadership positions in operating a community-based microgrid;
- The household cluster’s voltage quality, with higher priority given to potential clusters with lower voltage supplied from the village diesel generator;
- Availability of a dedicated space for the installation of microgrid components, including batteries, inverters, protective devices, energy meters, and other monitoring equipment;
- Willingness of household cluster members to be connected to a 24 h electricity supply and to pay for their electricity consumption; and
- Willingness of household cluster members to actively participate in the community-based operation of a microgrid.
Potential household clusters were identified based on the survey data and discussions with community leaders and members. The identified clusters were subjected to the above-listed criteria, and a household cluster was selected for the pilot microgrid implementation.
2.6. Demand Profiling
Demand profiling is a critical step in microgrid design, as oversized systems have higher COE than optimally designed ones, with the costlier cases negatively impacting the MTF attribute of affordability. On the other hand, undersized systems would compromise the technical MTF attributes of peak capacity, availability, reliability, and voltage quality. Proper microgrid supply sizing based on reasonable demand ensures acceptable levels of the technical attributes at the least COE.
The actual demand of a microgrid varies dynamically on a day-to-day basis even with a fixed total connected load. In addition, availability of 24 h electricity was shown to create an uptake of electricity usage where the electrified households buy additional appliances [35], contributing to an increase in demand in the short-term (months) and medium-term (first few years) time horizons after 24 h electrification. However, electricity usage patterns and load growth are dependent on many factors, and projections may not be realized. To make the COE affordable, the microgrid supply was designed to grow with the demand through a scalable system. The initial system capacity was designed for the short-term projected demand but with supply expansion provisions for load growth.
The demand profiling considerations discussed above were addressed in this study in two steps. The first was to collect data on each household’s electrical load that they were using at the time when the system design was made, i.e., electricity usage with the limited nightly operation of the village diesel generator. The second step was a participatory demand profile data collection activity where household representatives joined in simulating the hourly usage of appliances over a 24 h period. Electrical loads that were represented as switches in a load simulation module developed by the researchers were turned on and off to simulate operation. After each 24 h simulation run, the household load profile data in the simulation modules were downloaded into a laptop computer and presented as data in a spreadsheet. The aggregated load profile data from each household were fed into a HOMER Pro simulation for us to obtain an estimate of the COE, which was then used to produce an estimate of the daily electricity fees for each household based on the estimated electrical energy consumption. Each household representative was then asked whether they were willing to pay for the simulated daily cost of electricity. Two scenarios were used in the simulations: the first one used only the electrical loads that they already had, and the second one considered the electrical appliances that they planned to acquire within one or two years’ time.
2.7. Microgrid Design and Techno-Economic Analysis
The design and techno-economic analysis of an optimal microgrid using the software tool HOMER Pro starts with providing the input data. These include meteorological data, renewable energy resource, load profile, and relevant technical and economic data [36]. Figure 4 shows the solar energy resource on Gilutongan Island through a plot of the monthly averages of the daily solar irradiation for the year 2007 taken from the National Solar Radiation Database (NSRDB) of the National Renewable Energy Laboratory (NREL). The daily solar irradiation in April peaked at 6.143 kWh/m2/day with an annual average of 5.287 kWh/m2/day. The island’s latitude of 10° north of the equator ensures that it would have abundant sunshine throughout the year, which is very appropriate for the installation of solar panels.
Another requirement for microgrid design is the demand profile. After obtaining the household cluster’s projected demand profile from the participatory activity described in Section 2.6, the profile was used for the design and techno-economic analysis in HOMER Pro. The profiles for both load scenarios were used in the techno-economic analysis, but the second scenario with the higher energy consumption was used for system sizing. A factor of 25% on top of the projected energy consumption was used in the system sizing to give a capacity allowance for load growth as studies have shown that the availability of 24 h electricity eventually leads to the purchase of additional appliances by the users [9].
The other inputs to HOMER Pro are the economic parameters (such as the discount and inflation rates), the capital cost of the microgrid’s major components (including solar PV panels, single unit charger-inverters or converters), and battery energy storage. Amounts for the balance-of-system components and those of the other fixed capital costs including the distribution system and roof retrofits were estimated. Annual operations and maintenance (O&M) costs include the personnel allowance for system oversight and weekly meter-reading and sustainability fee collection, solar panel cleaning, rooftop rust-protection painting, tree-trimming to minimize shading, and minor system repairs. Table 3 shows the costs of the microgrid’s major components as used in the HOMER Pro design, and Table 4 shows the parameter values used in the simulation.
2.8. Microgrid Installation
Retrofit work was done on the two rooftops chosen for the installation to strengthen the supporting structure of the solar panel mountings. The installation of the solar panels followed, along with the cabling to the electrical room housing the circuit breakers, inverters, batteries, and metering instruments. From the electrical room, a distribution system was constructed to connect the 11 households of the microgrid. Each household had a circuit breaker as a protective device and a digital energy meter for electrical consumption monitoring. After the installation of all the microgrid equipment, tests were conducted to ensure the proper and safe operation of the system. The members of one of the households hosting the solar panel installation on their rooftop received training in basic solar PV system monitoring so that they could act as the onsite operator of the community microgrid. The system was commissioned in March 2020 just before the whole country went into lockdown due to the COVID-19 pandemic.
2.9. Microgrid Operation and Monitoring
The supply-side and demand-side data of the microgrid were monitored. On the supply side, data on system voltage, generated power, and energy production were obtained from the inverter. On the demand side, digital EDMI Mk7C revenue energy meters were installed on the mains and on each household. The household energy meters are capable of storing data of various variables, including voltage, current, power, energy consumption, reactive power, power factor, voltage total harmonic distortion, and others that are useful in monitoring the supply’s characteristics and the household’s electricity usage.
The households in the solar microgrid formed themselves into an organization and designated key persons to do certain tasks to oversee the local operation of the system. The point person for operations reported abnormal conditions (such as outages) to the researchers for appropriate action if necessary. This same person recorded the weekly kWh consumption of each household, received the daily payment from each household to the system’s sustainability fund, and kept the microgrid operations’ financial records. The researchers and the solar microgrid organization’s members held regular monthly meetings to discuss operational concerns, issues, and other matters relevant to the household cluster’s electrical system and to their organization.
2.10. Electricity Access in the Microgrid-Connected Households
The electricity access attributes based on the MTF of the 11 households in the microgrid were assessed using one year of monitoring data. To assess the technical attributes of peak capacity, availability, reliability, and quality, data from the inverters and energy meters were downloaded, processed, and analyzed. On the peak capacity attribute, records from the energy meters were used to determine the peak demand in individual households and for the cluster load as a whole. The incapability of systems to carry high-power loads is seen in voltage dips when such loads are turned on. The behavior of the solar microgrid voltage at peak loads was analyzed so that we could assign a tier classification for the microgrid supply in the attribute of peak capacity.
The assessment of the attributes of availability, reliability, and quality was based on the voltage records of individual households and the whole system. The supply’s availability was determined from the voltage time availability at consumption points. Reliability was assessed from the unscheduled outages experienced in the system, with measures on the frequency and duration of outages. The quality attribute looked at the voltage level of the microgrid at all loading conditions where high-tier electricity access is the condition wherein voltage issues are not experienced in the operation of appliances. On the technical side, the requirement of having no voltage issues in using the supply is interpreted in this work as the supply voltage being within ±5% of the nominal operating voltage of the system. Based on Philippine standards, the nominal voltage in households is 220 V. Therefore, for the attribute of quality, the solar microgrid voltage was assessed in terms of falling within the range of 209 to 231 V while the system is in operation.
On the attribute of affordability, the baseline value for the percentage of household income going to electricity costs for a standard consumption package of 1 kWh/day was taken from the study in [32]. The value can be determined from the results of the study; based on the payments made by Gilutongan Island’s community for electricity consumption from the village diesel generator, the standard consumption package would take 18% of the average income of the households on the island. This figure was taken from the cost of a standard consumption package of 1 kWh/day of 1.21 USD calculated against the 6.72 USD average household daily income. On the assessment of the affordability of electricity from the solar microgrid, the cost of electricity for 1 kWh of consumption was used as the basis for the computation of how much did such an electricity consumption package take from the average daily household income on the island (which was 6.72 USD at that time).
On the legality attribute, assessment was done based on the formality of the operation of the solar microgrid, with particular focus on the financial operations. This included to whom the collections of the electricity consumption payments went to, what were the financial processes of the entity receiving the collection, and how the funds were used to finance the sustainability of the system. For the health and safety attribute, the microgrid was assessed in terms of compliance with standard codes and a review on records of incidents that concern safety from the start of the operation of the solar microgrid.
3. Results
3.1. Electricity Access on Gilutongan Island with the Village Diesel Generator
Survey results in April 2018 showed that 95.9% (i.e., 328 out of 342) of the households on Gilutongan Island were connected to the diesel generator that was operated by the village’s local government. With the high operational costs of running a diesel generator, electricity was provided only for 4.5 h per day from 6:00 to 10:30 in the evening. The three-phase generator is rated at 155 kW and was donated to the village by the provincial government of Cebu in the aftermath of the super typhoon Haiyan in November 2013. The shed that housed the diesel generator was located away from the household areas for safety reasons. Figure 5a shows the line-to-line voltages of the three-phase generator, and Figure 5b shows the power in each of the three phases and the total power. The measurements were made during the operating hours of the generator on 23 May 2019 using a Fluke 1730 electrical energy logger. Figure 5b shows that the total demand of the village is not evenly distributed among the generator’s three phases, with phase AB carrying the bulk of the total load.
Table 5 shows the values of the average line-to-line and average power of the three phases of the generator. Phase AB carries 45% of the total load while the rest of the demand is almost evenly supplied by phases BC and CA. This explains the lower average line-to-line voltage of phase AB at 227.8 V compared to the other two phases. The village had an average demand of 15.83 kW with a peak of 20.60 kW. Compared to the diesel generator’s capacity of 155 kW, this shows that the generator is way oversized with respect to the demand of the village, with the peak demand utilizing only 13.3% of the capacity. The total energy consumption on the day when the measurement was taken was 68.35 kWh. With the number of connected households at 328, the average daily electricity consumption per connected household on Gilutongan Island is 0.21 kWh. This value is just a fifth of the standard consumption package used in the multi-tier framework of electricity access in the assessment of affordability, which is 365 kWh per year, or 1 kWh/day.
The village located on Gilutongan Island has an electrical distribution system that connects the households to the diesel generator. The three phases of the generator are fanned out through cables to provide electrical connections to users, as shown in Figure 6. Upon investigation, the distribution cables were found to be undersized. This resulted in huge voltage drops across the lines, which greatly reduced the voltage reaching the households, especially to those that are farthest from the generator. Figure 6 also shows the voltages measured near the end-points of each phase.
Table 6 shows the average values of the line-to-line voltages at the end-points of the three phases in the electrical distribution system on Gilutongan Island. The values were based on the monitoring data of household voltages over a one-week period from 16 to 22 May 2019. Figure 7 shows the voltage in a household located near the end-point of phase BC, and it had an average value of 119.0 V. Households near the end-point of phase AB were at the worst situation with a voltage at 117.4 V, falling short from the nominal value by 46.6%. The end-point of phase CA had the best voltage level at 204.1 V, but nevertheless it still fell short by 7.23% from the nominal value of 220 V. This phase had the highest end-point voltage among the phases because of larger distribution cables, with a lesser voltage drop along the lines. All of the end-point voltages fell outside the acceptable 5% difference from the nominal value.
From the above data on the island’s electricity supply from the village diesel generator, tier levels in the technical attributes of peak capacity, availability, reliability and quality can be assigned. The major findings on these attributes and the respective tier assignments are shown in the first four rows of Table 7. The attribute with the best performance was reliability (at tier 4), as the diesel generator was relatively new and can be relied upon to work on almost all days of the month. When outages did occur, the most frequent reason was that the village’s electricity fee collection was not enough to purchase enough diesel fuel, and it would be decided to forego running the generator for the night. The worst performing attribute was quality (at tier 0), as the voltage in key points of the distribution system was extremely low.
The nontechnical attributes of affordability, legality, and health and safety were assigned as tier 0 based on the major findings as listed in the last three rows of Table 7. As discussed in Section 2.10, the estimated cost of electricity on Gilutongan Island was 1.21 USD/kWh. The island community had an unconventional way of collecting electricity fees on the island wherein 0.14 USD was collected daily for each household lamp and 0.16 USD for each outlet [32]. The estimated cost of electricity resulted in a value of 18% as the percentage of the cost of a standard consumption package of 1 kWh/day against the average daily household income on the island of 6.72 USD.
3.2. Assessment of Village Rooftops for Solar Panel Installation
The structures on Gilutongan Island were assessed in field surveys to determine their suitability to rooftop solar PV installation for the community-based microgrid. Certain structures were excluded, such as a resort and a tourism restaurant, since these were not owned or managed by locals of the island community. Structures that were community owned or managed, such as churches, were included. Most of the houses were made of lightweight materials, and for such houses, it can be said that the structural integrity of the roof was not given top priority during construction. Only 31 out of 396 rooftops were found to be suitable using the rapid suitability criteria listed in Section 2.3. Figure 8 shows the locations of the suitable structures on the island.
3.3. Solar PV Potential of Suitable Rooftops
Models of the 31 structures on Gilutongan Island with rooftops that were found suitable for solar panel installation were simulated for solar PV potential in the software PVsyst. The 3D models of the structures included the area available for solar panel installation, the orientation of the rooftop (tilt and azimuth), and the near-shading objects in the form of tree geometries as can be seen by the example shown in Figure 9.
The simulations used 245 Wp REC PV modules and 300 W EcoBoost maximum power point tracking (MPPT) solar charge controllers, wherein the quantity of the components was dictated by the area available for rooftop solar PV utilization. To retain uniformity in the stringing design for every structure, the number of strings was made equal to the number of panels that the roof can accommodate, with each paired to the same number of MPPTs. The solar PV energy production per year was extracted independent of the battery storage capacity and load consumption. The standalone PV system mode in PVsyst only supports simulating PV modules with the same orientation. Since the rooftops on the island were typically made with multiple roof faces, each face was simulated individually, and the total potential representative of the whole structure was computed by summing up all of the potential from all rooftop faces. The solar PV potential of the 31 suitable structures ranged from the highest value of 33,682 kWh/year to the lowest of 1158 kWh/year, as shown in Figure 10. The figure also shows the solar PV potential of structures S1 (13,136 kWh/year) and S22 (6892 kWh/year), which were eventually chosen in this work for the installation of rooftop solar panels to supply the 11-household microgrid.
3.4. Selection of Household Cluster for the Pilot Microgrid
From the neighborhoods surrounding the 31 suitable rooftops, nine household clusters were identified. Using a process of elimination based on the defined criteria for household cluster selection as discussed in Section 2.5, a cluster was identified for the pilot microgrid installation. The household cluster’s location within the island is shown in the inset image of Figure 11. The main image of the figure shows a zoomed-in satellite imagery of the neighborhood where the households that are connected to the microgrid are numbered from 1 to 11. In the succeeding discussions in this paper, the individual households are identified as HH1, HH2 and so on up to HH11.
3.5. Demand Profiling
Table 8 lists the existing electrical load of each of the 11 households in the Gilutongan Island solar microgrid. The power ratings of the electrical loads are indicated in the table, along with the estimated daily energy consumption based on the participatory load profiling activity that was done with the household representatives as described in Section 2.6.
The estimated total electricity consumption of the 11 households connected to the rooftop solar microgrid considering only the existing appliances was 10.53 kWh/day. During the load profiling activity, HH2 and HH8 planned to purchase a refrigerator each when 24 h electricity becomes available. HH2 also planned to purchase a rice cooker when the microgrid is able to supply them with the standard value of voltage. With the additional desired appliances, the estimated total daily electricity consumption increased to 16.35 kWh/day.
Figure 12 shows the demand profiles of the cluster of 11 households in the Gilutongan Island solar microgrid based on two scenarios. The first scenario assumed that the households operate their existing appliances only over a 24 h period instead of just 4 h per day with that of the diesel generator. The second considers the additional load desired by HH2 and HH8. The estimated demand profiles were typical for residential loads, i.e., with low demand during the day time and peaks in the early evening. These load profiles, labeled as load profile scenarios LF1 and LF2, served as inputs to microgrid design that was done using HOMER Pro. Scenario LF1 had a daily energy demand of 10.53 kWh, while scenario LF2’s daily demand was 16.35 kWh.
3.6. Microgrid Design
Using the inputs for HOMER Pro as discussed in Section 2.7, optimal microgrid sizing using generic components was obtained based on the demand profile of the projected load, which included the desired appliances (scenario LF2). HOMER modelling returned a solar PV capacity of 8.64 kWp, battery energy storage of 27 kWh, and a converter capacity of 3.10 kW. The system had an LCOE of 0.404 USD. Based on the capacity values that HOMER returned, the main components of the solar PV system were specified considering their availability in the local market. Solar panels rated at 330 Wp were used and from the available rooftop area in structures S1 and S22, and 12 units of solar panels were allocated for each rooftop. Each rooftop had 3.96 kWp of solar PV capacity for a total system capacity of 7.92 kWp.
On the battery energy storage capacity where HOMER modelling returned 27 kWh, the commercially-available battery units used for the implementation were rated at 12 V, 2.4 kWh. Using a string size of four batteries in series for a DC bus voltage of 48 V, a total of 12 batteries were specified for an overall capacity of 28.8 kWh. For the converter, inverters with built-in MPPT charge controllers were selected. A 5 kVA inverter was specified for each solar panel array considering the DC voltage and power input requirements of the inverters. The two inverters were capable of parallel operation through a communication cable between the units for AC voltage synchronization. The specification for the rooftop solar microgrid’s main components, adjusted according to the actual availability of capacity sizes in the market, is summarized in Table 9. The single-line diagram of the system is shown in Figure 13.
For the households’ payment of the cost of electricity (COE), which went into a microgrid sustainability fund, the first load profile to be considered in the HOMER modelling was scenario LF1. With the microgrid component ratings as specified in Table 9, the levelized cost of electricity (LCOE) from the HOMER model simulation for this scenario was 0.495 USD. Another HOMER model was created for scenario LF2 but with an additional load growth of 25%. The simulation of this second model gave an LCOE of 0.324 USD. The average value of the COE for LF1 and LF2+25% was 0.41 USD. From this average value, it was decided by the research team to implement a rate of 0.40 USD/kWh for the microgrid’s electricity as a sustainability fee to keep the system operational in the project’s lifetime of 25 years. This rate was seen as a reasonable middle ground between minimum and maximum system capacity utilization.
3.7. Microgrid Installation, Operation and Monitoring
The installation of the solar microgrid—which includes all equipment in the supply side from solar panels, charger/inverter, batteries, and all auxiliaries to the distribution system that connects the demand side to the source—took place from February to early March 2020. Testing and commissioning were conducted right after the installation, and the microgrid started its operation on 13 March 2020. The Philippines went into lockdown due to the COVID-19 pandemic three days after the microgrid began operations, and this hampered certain aspects of the data collection during the early phase of the system.
Figure 14 shows a box and whisker plot of the voltage in each of the 11 households in the microgrid during the months of October and November 2020. During this two-month period, the mean value of the voltage across the system was 229.18 V with a standard deviation of 0.17 V. The maximum voltage measured was 229.60 V, and the minimum was 225.71 V. The mean value of the system voltage as measured in the households was within the acceptable range of the nominal value of 220V ± 5%, which has a floor value of 209 V and a ceiling of 231 V.
The plot in Figure 15 shows the power demand in each of the household with data collected for 61 days in October and November 2020. All of the households, except HH2, HH5, and HH6, have narrow second and third quartile boxes, which are near the demand of zero. This is due to the consistent operation of low-power loads only, such as lamps, cellphone chargers, televisions, radios, and electric fans. The occasional high demand occurs mostly in the early evenings when most loads are operated at the same time. HH9 and HH10 have rice cookers, hence the occasional peak at more than 700 W. HH2 has a narrow second and third quartile box with a median at 278.2 W because of the dominant cyclic freezer load that operates for almost 24 h. HH5 and HH6 have broader second and third quartile boxes because of more varied loads and operating times. HH5 operates a coin-operated hot and cold water dispenser, while HH6 generates income by allowing neighbors to view television during daytime for a fee.
The individual household load profiles over the months of October and November 2020 are shown in Figure 16. Television dominates the demand in the early evening. The load in the households from late evening to dawn comprises mostly of lamps that users keep turned on overnight to keep certain areas of the houses lighted for safety purposes. The households who were using electricity for income-generation are apparent through the presence of relatively high daytime load. These are namely HH2 with a freezer load, HH5 with a coin-operated hot-and-cold water dispenser, HH6 with daytime television-viewing for a fee, and HH8 with a coin-operated videoke machine. The load profile of HH9 also shows that the household owns and uses a rice cooker, with the characteristic peak during meal preparation times, which in this case is before breakfast. The rice cooker load is not as apparent in HH10’s load profile as the plot shows a two-month average, and the rice cooker was used only sparingly. Most of the households accept cellphone charging for a fee, but the very minimal demand of cellphone chargers did not show up in the load profiles.
Figure 17 shows the daily load profile of the Gilutongan Island solar microgrid, averaged over a two-month period in October and November 2020. The characteristic of a residential load profile is apparent through the early evening peak with a maximum of 964.1 W. The demand is dominated by the freezer load in HH2 taking an average of 275.6 W over a 24 h period.
The average daily consumption for each household on a monthly basis is shown in Figure 18. The data were collected from consumption records for eleven months from April 2020 to February 2021. HH2 started operating a freezer in the third week of September, hence the energy consumption increase in the succeeding months. The income-generating uses of electricity in HH5, HH6, and HH8 can be seen in their higher energy consumption compared to the rest of the households.
Table 10 shows the average daily electricity consumption of the households in the microgrid for 11 months starting in April 2020. The households that did not use electricity for income generation (HH1, HH3, HH4, HH7, HH9, HH10, and HH11) all have daily consumption that are below 1 kWh/day. The overall average value for these seven households is 0.60 kWh/day. Although these households were not able to harness the 24 h availability of electricity to increase their household incomes, they benefited from electrification in being able to use electricity for basic needs such as lighting, air ventilation, and communication services (radio, television, cellphone charging) at any time of the day.
A comparison of the daily payments for electricity for each household with the currently used solar microgrid and with the previously used village diesel generator is also shown in Table 10. For the seven households that did not use electricity for income-generation applications, four (HH3, HH7, HH9, HH10) had an increase in their daily costs for the now 24 h available electricity, with an average increase of 28.7%. Three households (HH1, HH4, HH10), however, paid less daily for the 24 h electricity from the solar microgrid, with an average decrease of 54.5%. The analysis of the electrification benefits for the households that used electricity for income-generation is discussed in another paper due to publication limitations.
The solar microgrid experienced a total of 17 service disruptions during the one-year period from April 2020 to March 2021. The number of outages per month and the total outage duration for each month is shown in Table 11. The outages were due to successive cloudy or rainy days wherein the battery bank’s energy storage became depleted to a point that reached the set threshold for turning off the system. The worst month was in December 2020, as shown in Figure 19, which necessitated a review of the system’s design, and it was concluded that the appropriate solution was to add another string of batteries to the bank. This increased the microgrid’s battery energy storage capacity from 28.8 to 38.4 kWh. Implementation of the additional capacity solved the service disruption problem at an additional cost of only 0.01 USD in the COE.
3.8. Electricity Access in the Microgrid-Connected Households
The original electricity supply of the 11 households in the Gilutongan Island solar microgrid was the village generator, which operated only for 4 h in the early evening. Table 12 shows the tier levels of the MTF attributes of the diesel generator supply in the second column. The third column shows the tier levels of the households’ new electricity supply provided from a rooftop solar microgrid. It shows that the tier levels moved up in all of the attributes except that on affordability. Nevertheless, the cost of a standard electricity consumption package of 1 kWh/day on Gilutongan Island was reduced from 1.21 to 0.40 USD in the solar microgrid. This is a 67% decrease from the previous case wherein island residents, on the average, spent 18% of their household income for a standard consumption package, compared to the present wherein households in the microgrid spend only 6% for such a package.
4. Discussion
In moving up the electrification ladder, users benefit from supplies with the following characteristics:
- Capability to run appliances with higher power demand;
- Longer availability of electricity during the day;
- Reduced occurrence of power disruptions;
- Standard voltage quality for proper appliance operation;
- Affordable cost of electricity;
- Security of the connection; and
- Safety ensured regarding electricity supply.
The above list corresponds to the attributes of household electricity supply as defined in the multi-tier framework of electricity access and as shown in the first column of Table 11. The table shows the moving up in the electrification ladder of the 11-household neighborhood on Gilutongan Island where the solar PV-based microgrid with battery energy storage was installed. The solar panels were installed on two rooftops, as most of the residents on the island are informal settlers and do not have authorization to use land for semipermanent structures such as a centralized solar PV system.
Narayan et al. [20] investigated potential solutions to provide basic electricity in unelectrified/underelectrified areas. They examined the potential of an SHS to cater to every tier of the MTF wherein they found that beyond tier 2, SHS capacity needs significant expansion to cater to higher tiers. The study concluded that a microgrid based on interconnected SHSs can allow users to climb up the electrification ladder, especially to attain tier 4 or tier 5 electricity access.
In another work by Narayan et al. [21], the pathways to universal electrification were explored. They considered the paradox in SHS electrification wherein affordable appliances such as rice cookers cannot be used because of its high power demand, but low-power appliances (such as laptops) that can be easily powered by an SHS are not affordable to most rural and off-grid area consumers. One of the pathways to climb the electrification ladder is through scalable systems that can cater to growth in user demand as electricity is made available. The system should also be able to supply high-power appliances such as water kettles, as these are typically the loads that highlight the benefits of electrification.
This current work follows along the vein of the research findings of Narayan et al. The households in this study previously had low-tier electrification through a village diesel generator. The study quantified the shortcomings of the generator supply as assessed through the household electricity supply attributes of the MTF. With a centralized solar PV system out of the question due to the informal settlement status of most residents in the island community, the pathway which we explored towards climbing up the electrification ladder was through a microgrid powered by solar panels installed on rooftops.
The plot shown in Figure 20 illustrates the change in electricity access tiers for the households connected to the rooftop solar microgrid on Gilutongan Island. In the attribute of peak capacity, the increase from tier 3 to 4 means that the users can now use high-power appliances above 800 W. This was demonstrated in the Gilutongan Island microgrid with households having rice cookers. The attribute of availability jumped by three tiers from 2 to 5 since electricity is now available for 24 h. This climbing up of the electrification ladder is illustrated by one household already operating a freezer and using the appliance for income generation by selling frozen food products. The attribute of reliability increased from tier 4 tier 5 with a tolerable number and duration of disruptions. However, the most significant change is the moving up of voltage quality from tier 0 to tier 5. When the households were taking their electricity from the diesel generator, the voltage in the vicinity of the microgrid averaged only 119.0 V on a system with a nominal voltage of 220 V. This resulted in appliances not working properly and even causing occasional damage. With the voltage of the solar microgrid averaging 229.18 V, the users are now able to use whatever appliance they wanted to connect.
With the rooftop solar microgrid, significant jumps to tier 5 also resulted for the attributes of health and safety and of legality. Electricity supply safety came about through the use of standard components in the supply equipment, protection devices, and distribution system cabling. On the attribute of legality, the jump to tier 5 was brought about by the formalization of the collection and financial management of the system. The management of the microgrid is eventually turned over to a registered organization formed from household membership in the microgrid. While this research report is being written, capacity building for community management of the microgrid was still ongoing.
As can be seen in Figure 20, the attribute of affordability did not have a tier level change, but as discussed in Section 3.8, the percentage of the average household income needed to cover the cost of a standard electricity consumption package of 1 kWh/day dropped from 18% to 6%. It should be noted again that MTF set the affordability threshold at not more than 5% of the household income [17]. Although the MTF has broken down the technical attributes of electricity access into six tiers from 0 to 5, it still has a binary tier assignment for affordability, where tier 5 means that the cost of a standard compensation package is less than 5%, and tier 0 otherwise. The cost reduction due to the solar microgrid is greatly significant at 67%, but still the percentage cost of 6% of the household income did not fall within the MTF’s threshold. In this case, the MTF fails to capture the improvement of affordability as a continuum that can be represented by multiple tiers. This work recommends further studies on how improvements in affordability can be described in tiers similar to those for the other attributes, especially given that affordability can be numerically quantified. There have been attempts towards this direction in the study by Lozano and Taboada [40], but more studies need to be done to set the appropriate tier boundaries of the attribute of affordability.
Lozano et al. [32] conducted a techno-economic analysis of a power generation system intended for Gilutongan Island. The study considered a 100% RE system based on solar PV with battery energy storage, and a hybrid system with the addition of a diesel generator. The PV-only scenario yielded an LCOE of 0.3916 USD/kWh while the hybrid system had an LCOE of 0.3556 USD/kWh. The PV-only system’s LCOE is comparable to the LCOE in this present study that averages 0.41 USD/kWh. The study in [32] assumed the availability of open land for the centralized PV installation with a 314 kWp capacity for the PV-only scenario. Such a capacity would require no less than 2000 m2 of open land, including spacing between panels. The techno-economic analysis of the said study did not consider the cost of land usage, and the LCOE of a practical system would definitely rise when land costs are included. The viable and cheaper alternative is to use household rooftops as this approach will not take up open land space, which might even be not legally available.
In a study by Bertheau [24] on supplying unelectrified islands in the Philippines with 100% RE-based microgrids, the computed LCOE using HOMER for solar PV systems with battery storage was 0.522 USD/kWh. The system in the study had an annual demand of 62,050 kWh, and the modelled PV capacity was 118.9 kWp with a battery capacity of 136.0 kWh. The Gilutongan Island microgrid was designed for an annual demand of 7482 kWh, which is just 12% of the demand in [24]. The LCOE on Gilutongan Island ranged from 0.324 USD when the demand is at the system’s full capacity to 0.495 USD when demand is minimal with the households not adding to their existing electrical loads. This shows that the LCOE in the Gilutongan Island microgrid is in line with the findings of other researchers, specifically for studies in the Philippines, even though it is a smaller system and does not benefit from economies of scale.
This current study implemented a working rooftop solar PV-based microgrid with an average LCOE between minimal demand and full-capacity demand at 0.41 USD/kWh. The sustainability fee implemented for the upkeep of the system is 0.40 USD/kWh, which is comparable to the LCOE of a centralized solar PV system determined in [32]. The microgrid covers only 11 out of 342 households (i.e., 3.2%) on the island, as it is only a pilot system for a study with funding limitations. Nevertheless, the pilot microgrid demonstrated that higher tier electricity access along the ideals of SDG 7, except for the attribute of affordability, can be provided to the entire island if the system is replicated, even at higher capacities, to cover more households. Several such microgrids utilizing the suitable rooftops in the community can provide the whole island with quality electricity access.
5. Conclusions
Households in off-grid informal settlements where there are limitations in land availability for centralized renewable energy systems can still climb up the electrification ladder, as demonstrated in the case of the Gilutongan Island rooftop solar microgrid. Microgrids based on solar PV panels installed on rooftops can provide higher tier electrification, which is tier 4 or 5 in the multi-tier framework of household electricity supply. This study showed that with careful design that considers short- and medium-term demand growths, a rooftop solar microgrid can give users tier 4 electricity access in the technical attribute of peak capacity, and tier 5 in the technical attributes of peak availability, reliability, and voltage quality. Tier 5 electricity access in the attribute of health and safety was attained by ensuring that the microgrid complies with electrical standards, specifically on system protection. Tier 5 access in the attribute of legality was attained by organizing the users to self-manage the system as a community-based microgrid and eventually to register the organization with the appropriate government agencies. Long-term demand growth that can possibly bring down the tier level of the technical attributes was addressed by designing the microgrid as a scalable system where additional solar panels can be installed on adjacent rooftops, going hand in hand with an increase in battery energy storage and charger/inverter capacities.
In this work, the attribute where there was no change in the MTF tier classification was affordability. There was, however, a significant decrease in the cost that users pay for a standard electricity consumption package of 1 kWh/day from 18% of the average household income in the community to just 6%. This brings the rooftop solar microgrid’s affordability very close to the MTF threshold value of 5%. The microgrid’s cost of electricity can be brought within the threshold value, but this can jeopardize the system’s sustainability. Currently, the MTF’s measurement of improvements in affordability is binary. Future work may look at defining multiple tiers of affordability to capture, as a continuum, improvements in this attribute.
The biggest challenge in moving up the electrification ladder for off-grid areas is affordability. The primary reason for the higher cost of electricity in standalone systems, especially for the residential type of demand, is energy storage. This challenge may be eliminated in the coming years as the cost of batteries fall with breakthroughs in energy storage technologies. In the meantime, system optimization is the key to making the cost of electricity in off-grid systems hover above being affordable.
Author Contributions
I.R.: Conceptualization, methodology, software, validation, formal analysis, investigation, data curation, writing—original draft preparation, writing—review and editing, and visualization. M.L.: Methodology, software, validation, formal analysis, investigation, data curation, writing—original draft preparation, writing—review and editing, and visualization. M.L.A.: Conceptualization, methodology, formal analysis, writing—review and editing, visualization, and supervision. E.T.: Conceptualization, methodology, formal analysis, writing—review and editing, visualization, supervision, project administration, and funding acquisition. All authors have read and agreed to the published version of the manuscript.
Funding
This research was funded by the European Union through the Access to Sustainable Energy Programme (ASEP), Contract No. 2017/392-650 of the project Clean Energy Living Laboratories (CELLs): The development of centers of excellence on energy access, renewable energy and energy efficiency. The APC was funded by the Department of Science and Technology (DOST) through the Engineering Research and Development for Technology (ERDT) program. The Gilutongan Island load-profiling survey was funded by the Commission on Higher Education (CHED) and the British Council UK Newton Fund Institutional Links (Grant No. 261850721).
Institutional Review Board Statement
The study was conducted according to the guidelines of the Declaration of Helsinki, and approved by the Research Ethics Committee of the University of San Carlos protocol code 004/2018-01-rabuya et al on 26 February 2018.
Informed Consent Statement
Informed consent was obtained from all subjects involved in the study.
Data Availability Statement
Data available on request.
Acknowledgments
The authors are grateful for the support of the Visayas CELL project team, the Center for Research in Energy Systems and Technologies (CREST), the ASEP-CELLs Project Management Office, the University of San Carlos (USC), and the people of Gilutongan Island. I.R. expresses gratitude to Jaybee Lacea for analysis support, Teepu Cedi Camba for data collection support, Luzvisminda M. Bellotindos for the manuscript review, and AbuBakr S. Bahaj and Majbaul Alam of the University of Southampton, UK, for the research mentorship. M.L. expresses gratitude to the DOST ERDT program for the graduate scholarship.
Conflicts of Interest
The authors declare no conflict of interest and the funders had no role in the design of the study; in the collection, analyses, or interpretation of data; in the writing of the manuscript, or in the decision to publish the results.
Abbreviations
The following abbreviations are used in this manuscript:
| COE | Cost of electricity |
| GI | Galvanized iron |
| GIS | Geographic information system |
| HH | Household |
| HOMER | Hybrid Optimization Model for Multiple Energy Resources |
| LCOE | Levelized cost of electricity |
| LF | Load profile |
| LIDAR | Light detection and ranging |
| MPPT | Maximum power point tracking |
| MTF | Multi-tier framework |
| NREL | National Renewable Energy Laboratory |
| NSRDB | National Solar Radiation Database |
| O&M | Operation and maintenance |
| PH | Philippines |
| PV | Photovoltaic |
| PUE | Productive use of electricity |
| QGIS | Quantum Geographic Information System |
| RE | Renewable energy |
| SDG | Sustainable Development Goal |
| SHS | Solar home systems |
| THD | Total harmonic distortion |
References
- Goal 7|Department of Economic and Social Affairs. Available online: https://sdgs.un.org/goals/goal7 (accessed on 4 April 2021).
- Year in Review: 2018 in 14 Charts. Available online: https://www.worldbank.org/en/news/feature/2018/12/21/year-in-review-2018-in-14-charts (accessed on 28 May 2021).
- Tracking SDG 7|Progress Towards Sustainable Energy. Available online: https://trackingsdg7.esmap.org/ (accessed on 28 May 2021).
- Blechinger, P.; Cader, C.; Bertheau, P.; Huyskens, H.; Seguin, R.; Breyer, C. Global Analysis of the Techno-Economic Potential of Renewable Energy Hybrid Systems on Small Islands. Energy Policy 2016, 98, 674–687. [Google Scholar] [CrossRef]
- Bertheau, P.; Blechinger, P. Resilient Solar Energy Island Supply to Support SDG7 on the Philippines: Techno-Economic Optimized Electrification Strategy for Small Islands. Util. Policy 2018, 54, 55–77. [Google Scholar] [CrossRef]
- Meschede, H.; Esparcia, E.A.; Holzapfel, P.; Bertheau, P.; Ang, R.C.; Blanco, A.C.; Ocon, J.D. On the Transferability of Smart Energy Systems on Off-Grid Islands Using Cluster Analysis—A Case Study for the Philippine Archipelago. Appl. Energy 2019, 251, 113290. [Google Scholar] [CrossRef]
- Agua, O.F.B.; Basilio, R.J.A.; Pabillan, M.E.D.; Castro, M.T.; Blechinger, P.; Ocon, J.D. Decentralized versus Clustered Microgrids: An Energy Systems Study for Reliable Off-Grid Electrification of Small Islands. Energies 2020, 13, 4454. [Google Scholar] [CrossRef]
- Kaldellis, J.K. Supporting the Clean Electrification for Remote Islands: The Case of the Greek Tilos Island. Energies 2021, 14, 1336. [Google Scholar] [CrossRef]
- Bertheau, P.; Dionisio, J.; Jütte, C.; Aquino, C. Challenges for Implementing Renewable Energy in a Cooperative-Driven off-Grid System in the Philippines. Environ. Innov. Soc. Transit. 2020, 35, 333–345. [Google Scholar] [CrossRef]
- United Nations Human Settlements Programme (Ed.) The Challenge of Slums: Global Report on Human Settlements, 2003; Earthscan Publications: London, UK; Sterling, VA, USA, 2003; ISBN 978-1-84407-037-4. [Google Scholar]
- United Nations Statistics Division—Environment Statistics. Available online: https://unstats.un.org/unsd/environmentgl/gesform.asp?getitem=665 (accessed on 23 April 2021).
- Mimmi, L.M. From Informal to Authorized Electricity Service in Urban Slums: Findings from a Household Level Survey in Mumbai. Energy Sustain. Dev. 2014, 21, 66–80. [Google Scholar] [CrossRef] [Green Version]
- Butera, F.M.; Caputo, P.; Adhikari, R.S.; Mele, R. Energy Access in Informal Settlements. Results of a Wide on Site Survey in Rio De Janeiro. Energy Policy 2019, 134, 110943. [Google Scholar] [CrossRef]
- Smit, S.; Musango, J.K.; Brent, A.C. Understanding Electricity Legitimacy Dynamics in an Urban Informal Settlement in South Africa: A Community Based System Dynamics Approach. Energy Sustain. Dev. 2019, 49, 39–52. [Google Scholar] [CrossRef] [Green Version]
- Subbiah, A.; Mansoor, S.; Misra, R.; Jaffer, H.; Tiwary, R. Addressing Developmental Needs Through Energy Access in Informal Settlements. Field Actions Sci. Rep. 2016, 15, 80–91. [Google Scholar]
- Runsten, S.; Fuso Nerini, F.; Tait, L. Energy Provision in South African Informal Urban Settlements - A Multi-Criteria Sustainability Analysis. Energy Strategy Rev. 2018, 19, 76–84. [Google Scholar] [CrossRef]
- Bhatia, M.; Angelou, N. Beyond Connections: Energy Access Redefined; The International Bank for Reconstruction and Development/The World Bank Group: Washington, DC, USA, 2015; p. 230. [Google Scholar]
- Pelz, S.; Urpelainen, J. Measuring and Explaining Household Access to Electrical Energy Services: Evidence from Rural Northern India. Energy Policy 2020, 145, 111782. [Google Scholar] [CrossRef]
- Yadav, P.; Heynen, A.P.; Palit, D. Pay-As-You-Go Financing: A Model for Viable and Widespread Deployment of Solar Home Systems in Rural India. Energy Sustain. Dev. 2019, 48, 139–153. [Google Scholar] [CrossRef]
- Narayan, N.; Chamseddine, A.; Vega-Garita, V.; Qin, Z.; Popovic-Gerber, J.; Bauer, P.; Zeman, M. Exploring the Boundaries of Solar Home Systems (SHS) for off-Grid Electrification: Optimal SHS Sizing for the Multi-Tier Framework for Household Electricity Access. Appl. Energy 2019, 240, 907–917. [Google Scholar] [CrossRef]
- Narayan, N.; Vega-Garita, V.; Qin, Z.; Popovic-Gerber, J.; Bauer, P.; Zeman, M. The Long Road to Universal Electrification: A Critical Look at Present Pathways and Challenges. Energies 2020, 13, 508. [Google Scholar] [CrossRef] [Green Version]
- Wróbel, J.; Sołtysik, M.; Rogus, R. Selected Elements of the Neighborly Exchange of Energy – Profitability Evaluation of the Functional Model. Polityka Energ. Energy Policy J. 2019, 22, 53–64. [Google Scholar] [CrossRef]
- NAMRIA|The Central Mapping Agency of the Government of the Philippines. Available online: http://namria.gov.ph/list.php?id=1032&alias=administrator-tiangco-welcomes-2017&Archive=1 (accessed on 7 June 2021).
- Bertheau, P. Supplying Not Electrified Islands with 100% Renewable Energy Based Micro Grids: A Geospatial and Techno-Economic Analysis for the Philippines. Energy 2020, 202, 117670. [Google Scholar] [CrossRef]
- Hong, G.W.; Abe, N. Sustainability Assessment of Renewable Energy Projects for Off-Grid Rural Electrification: The Pangan-an Island Case in the Philippines. Renew. Sustain. Energy Rev. 2012, 16, 54–64. [Google Scholar] [CrossRef]
- Bahaj, A.; Blunden, L.; Kanani, C.; James, P.; Kiva, I.; Matthews, Z.; Price, H.; Essendi, H.; Falkingham, J.; George, G. The Impact of an Electrical Mini-Grid on the Development of a Rural Community in Kenya. Energies 2019, 21, 778. [Google Scholar] [CrossRef] [Green Version]
- Alam, M.; Bhattacharyya, S. Decentralized Renewable Hybrid Mini-Grids for Sustainable Electrification of the Off-Grid Coastal Areas of Bangladesh. Energies 2016, 9, 268. [Google Scholar] [CrossRef] [Green Version]
- Margolis, R.; Gagnon, P.; Melius, J.; Phillips, C.; Elmore, R. Using GIS-Based Methods and Lidar Data to Estimate Rooftop Solar Technical Potential in US Cities. Environ. Res. Lett. 2017, 12, 074013. [Google Scholar] [CrossRef]
- Singh, R.; Banerjee, R. Estimation of Rooftop Solar Photovoltaic Potential of a City. Sol. Energy 2015, 115, 589–602. [Google Scholar] [CrossRef]
- Doorga, J.R.S.; Tannoo, R.; Rughooputh, S.D.D.V.; Boojhawon, R. Exploiting the Rooftop Solar Photovoltaic Potential of a Tropical Island State: Case of the Mascarene Island of Mauritius. Int. J. Energy Environ. Eng. 2021. [Google Scholar] [CrossRef]
- Sotto, F.B.; Gatus, J.L.; Ross, M.A.; Portigo, M.F.L.; Freire, F.M. Coastal Environmental Profile of Olango Island, Cebu, Philippines; Coastal Resource Management Project of the Departement of Environment and Natural Resources: Cebu City, Philippines, 2001; ISBN 978-971-92290-1-8. [Google Scholar]
- Lozano, L.; Querikiol, E.M.; Abundo, M.L.S.; Bellotindos, L.M. Techno-Economic Analysis of a Cost-Effective Power Generation System for off-Grid Island Communities: A Case Study of Gilutongan Island, Cordova, Cebu, Philippines. Renew. Energy 2019, 140, 905–911. [Google Scholar] [CrossRef]
- Malaque, I.R., III; Bartsch, K.; Scriver, P. Learning from Informal Settlements: Provision and Incremental Construction of Housing for the Urban Poor in Davao City, Philippines; Crawford, R.H., Stephan, A., Eds.; The Architectural Science Association and The University of Melbourne: Melbourne, Australia, 2015; pp. 163–172. [Google Scholar]
- Malaque, I.; Bartsch, K.; Scriver, P. Thriving in the Slums: Progressive Development and Empowerment of the Urban Poor to Achieve Secure Tenure in the Philippines. Archit. Sci. Rev. 2018, 61, 313–318. [Google Scholar] [CrossRef]
- Bertheau, P. Assessing the Impact of Renewable Energy on Local Development and the Sustainable Development Goals: Insights from a Small Philippine Island. Technol. Forecast. Soc. Chang. 2020, 153, 119919. [Google Scholar] [CrossRef]
- Li, J.; Liu, P.; Li, Z. Optimal Design and Techno-Economic Analysis of a Solar-Wind-Biomass off-Grid Hybrid Power System for Remote Rural Electrification: A Case Study of West China. Energy 2020, 208, 118387. [Google Scholar] [CrossRef]
- Home–NSRDB. Available online: https://nsrdb.nrel.gov/ (accessed on 22 May 2021).
- Philippines Central Bank Key Rates 2020. Available online: https://countryeconomy.com/key-rates/philippines (accessed on 5 May 2021).
- Philippines Inflation Rate|1958–2021 Data|2022–2023 Forecast|Calendar. Available online: https://tradingeconomics.com/philippines/inflation-cpi?fbclid=iwar2w98f1w5hvdoxbyc-tcllxyxqeq-4urh1tbu7zlbtvdbqrydqti8ji88o (accessed on 5 May 2021).
- Lozano, L.; Taboada, E.B. Demystifying the Authentic Attributes of Electricity-Poor Populations: The Electrification Landscape of Rural off-Grid Island Communities in the Philippines. Energy Policy 2020, 145, 111715. [Google Scholar] [CrossRef]
Figure 1.
Diagram showing the steps in the implementation of the moving up the electrification ladder study.
Figure 1.
Diagram showing the steps in the implementation of the moving up the electrification ladder study.

Figure 2.
Gilutongan Island (pop. 1875 in 2017), as shown in the satellite imagery above, is located in the central part of the Philippines (inset map). The island is not connected to the national grid, as it is a remote area and is considered as unviable for grid electrification (satellite imagery from Google Earth).

Figure 3.
Workflow for the calculation of the rooftop solar PV potential on Gilutongan Island.

Figure 4.
Monthly averages of the solar irradiation per day and the clearness index on Gilutongan Island for the year 2007. Downloaded through HOMER Pro from the National Solar Radiation Database (NSRDB) of the National Renewable Energy Laboratory (NREL) [37].
Figure 4.
Monthly averages of the solar irradiation per day and the clearness index on Gilutongan Island for the year 2007. Downloaded through HOMER Pro from the National Solar Radiation Database (NSRDB) of the National Renewable Energy Laboratory (NREL) [37].

Figure 5.
Gilutongan Island’s village diesel generator voltage and power on 23 May 2019: (a) Line-to-line voltages; (b) power per phase and the total power of the 3-phase generator.
Figure 5.
Gilutongan Island’s village diesel generator voltage and power on 23 May 2019: (a) Line-to-line voltages; (b) power per phase and the total power of the 3-phase generator.

Figure 6.
The electrical distribution backbone on Gilutongan Island superimposed on satellite imagery from Google Earth. The voltages near the end-points of each phase are shown.
Figure 6.
The electrical distribution backbone on Gilutongan Island superimposed on satellite imagery from Google Earth. The voltages near the end-points of each phase are shown.

Figure 7.
Voltage of a household near the end-point of phase BC as supplied by the village diesel generator for one week in May 2019.
Figure 7.
Voltage of a household near the end-point of phase BC as supplied by the village diesel generator for one week in May 2019.

Figure 8.
Location of the 31 structures on Gilutongan Island that were found to be suitable for rooftop solar PV installation.
Figure 8.
Location of the 31 structures on Gilutongan Island that were found to be suitable for rooftop solar PV installation.

Figure 9.
Near-shading 3D simulation scene in PVsyst for the southeast roof face of structure S1.

Figure 10.
Rooftop solar potential of the structures on Gilutongan Island that are suitable for rooftop solar PV installation. The bars in red indicate the structures whose rooftops were used for the Gilutongan Island solar microgrid.
Figure 10.
Rooftop solar potential of the structures on Gilutongan Island that are suitable for rooftop solar PV installation. The bars in red indicate the structures whose rooftops were used for the Gilutongan Island solar microgrid.

Figure 11.
The household cluster of the rooftop solar microgrid showing the connected houses labelled from 1 to 11. The main image is a drone photo superimposed on Google Earth satellite imagery. The inset image shows the outline of Gilutongan Island with the yellow box indicating the solar microgrid’s location.

Figure 12.
Estimated load profiles of the Gilutongan Island rooftop solar microgrid based on two scenarios: the first considers only the existing electrical loads (scenario LF1, blue curve), and the second considers additional loads desired by HH2 and HH8 (scenario LF2, red curve).
Figure 12.
Estimated load profiles of the Gilutongan Island rooftop solar microgrid based on two scenarios: the first considers only the existing electrical loads (scenario LF1, blue curve), and the second considers additional loads desired by HH2 and HH8 (scenario LF2, red curve).

Figure 13.
Gilutongan Island solar microgrid single line diagram.

Figure 14.
Box and whisker plot of the system voltage in the Gilutongan Island solar microgrid as measured in each of the households during the months of October and November 2020.
Figure 14.
Box and whisker plot of the system voltage in the Gilutongan Island solar microgrid as measured in each of the households during the months of October and November 2020.

Figure 15.
Box plot of power demand in households of the Gilutongan Island solar microgrid based on two months of consumption monitoring data (October and November 2020).
Figure 15.
Box plot of power demand in households of the Gilutongan Island solar microgrid based on two months of consumption monitoring data (October and November 2020).

Figure 16.
Average load profiles of households for the months of October and November 2020 in the Gilutongan Island solar microgrid.
Figure 16.
Average load profiles of households for the months of October and November 2020 in the Gilutongan Island solar microgrid.

Figure 17.
Total daily demand profile of households in the Gilutongan Island solar microgrid averaged over the months of October and November 2020.
Figure 17.
Total daily demand profile of households in the Gilutongan Island solar microgrid averaged over the months of October and November 2020.

Figure 18.
Average daily kWh consumption on monthly basis from April 2020 to February 2021 of households in the Gilutongan Island solar microgrid.
Figure 18.
Average daily kWh consumption on monthly basis from April 2020 to February 2021 of households in the Gilutongan Island solar microgrid.

Figure 19.
Plot of voltage for the month of December 2020 in the Gilutongan Island solar microgrid, showing unscheduled outages due to rainy days, in turn necessitating the addition of battery energy storage capacity.
Figure 19.
Plot of voltage for the month of December 2020 in the Gilutongan Island solar microgrid, showing unscheduled outages due to rainy days, in turn necessitating the addition of battery energy storage capacity.

Figure 20.
Spider plot of Gilutongan Island’s electricity access MTF tiers before and after the installation of the solar microgrid.
Figure 20.
Spider plot of Gilutongan Island’s electricity access MTF tiers before and after the installation of the solar microgrid.


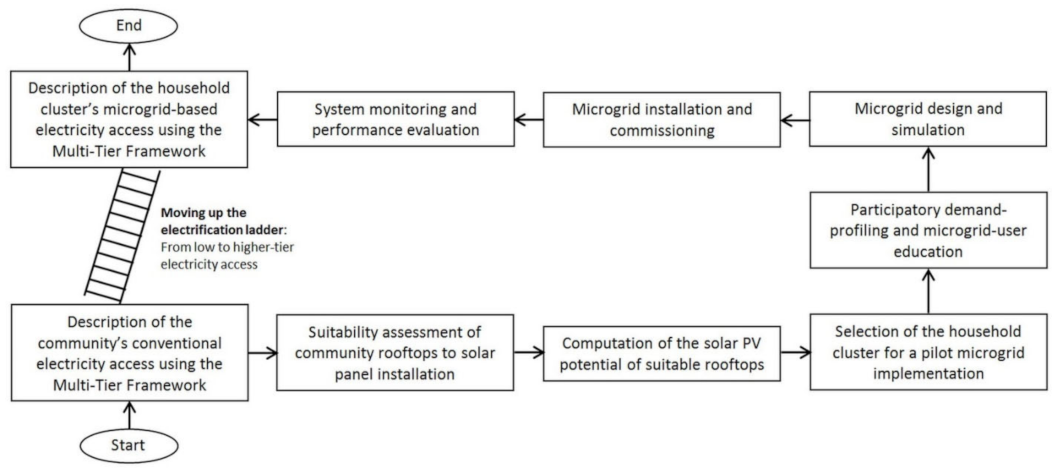
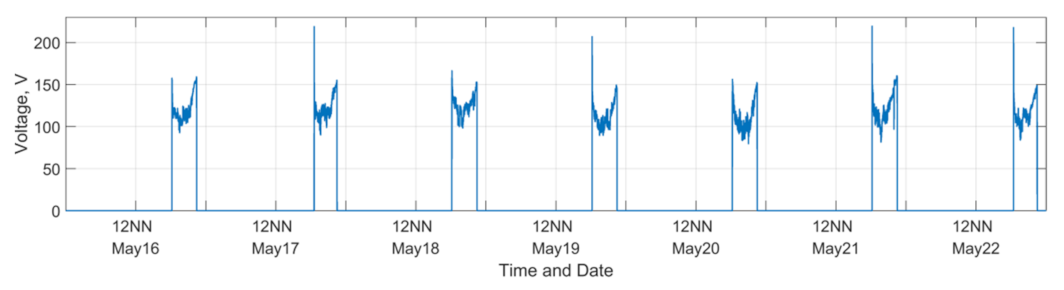
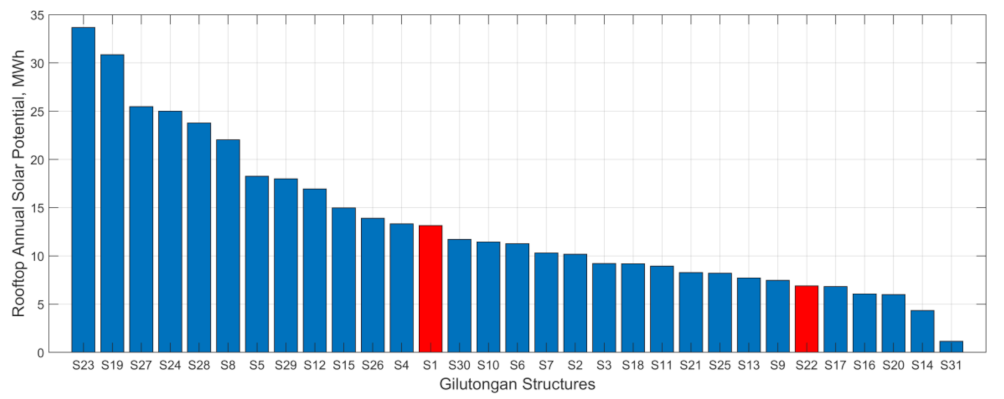
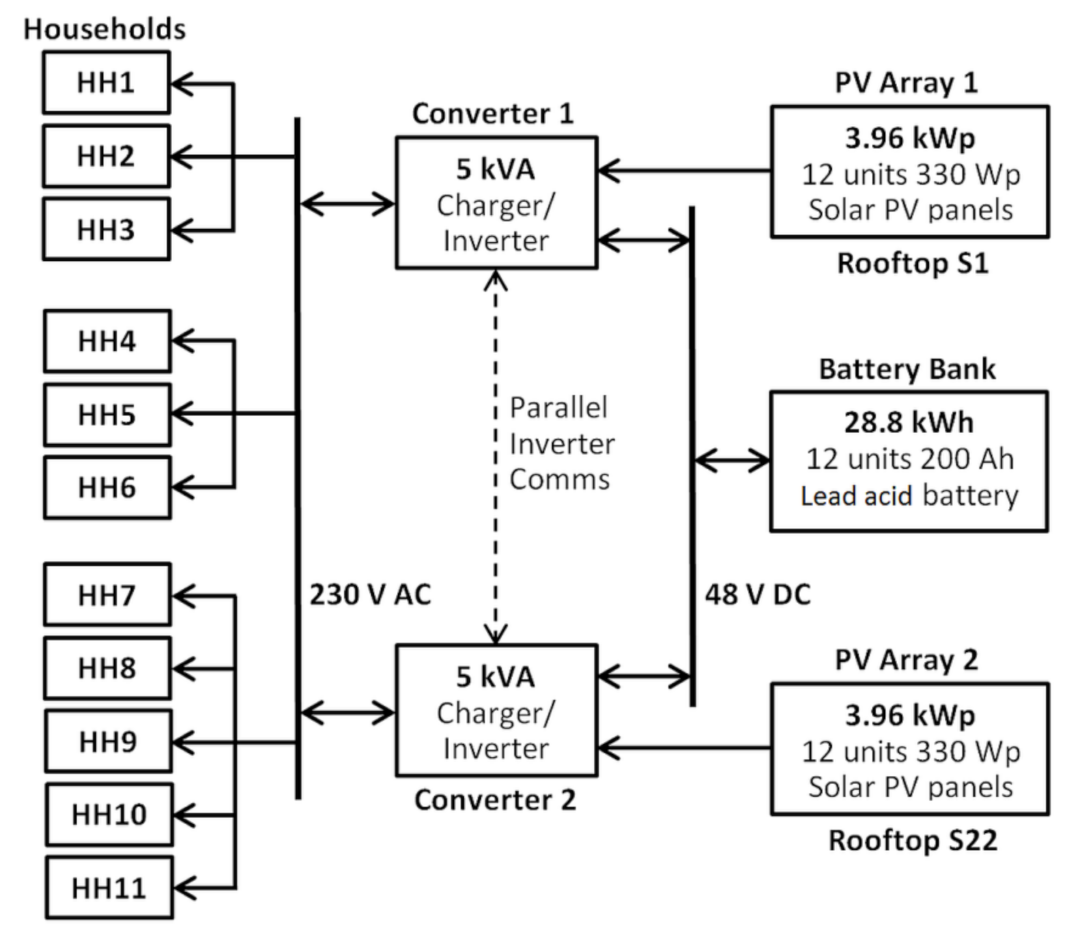
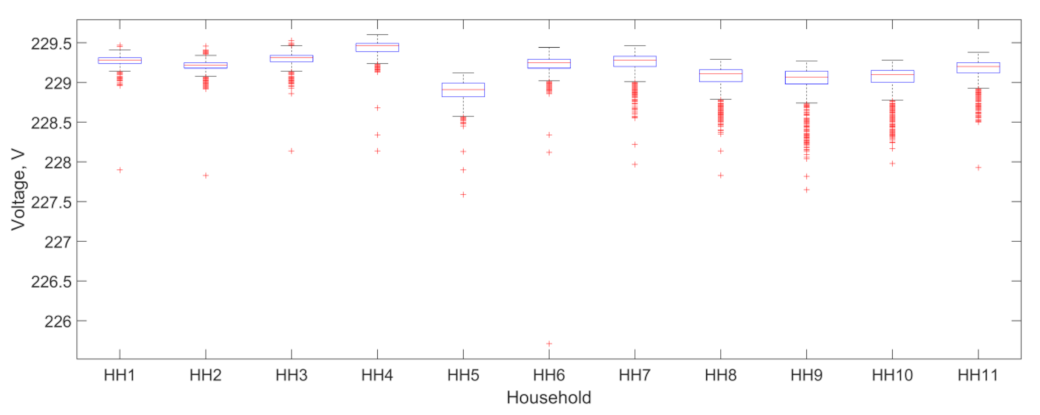
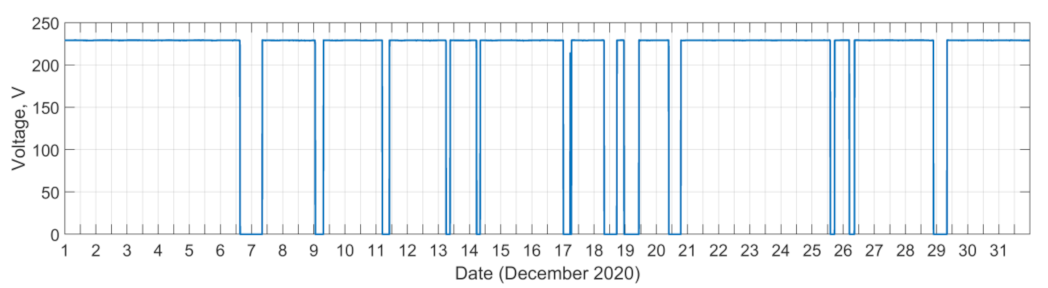
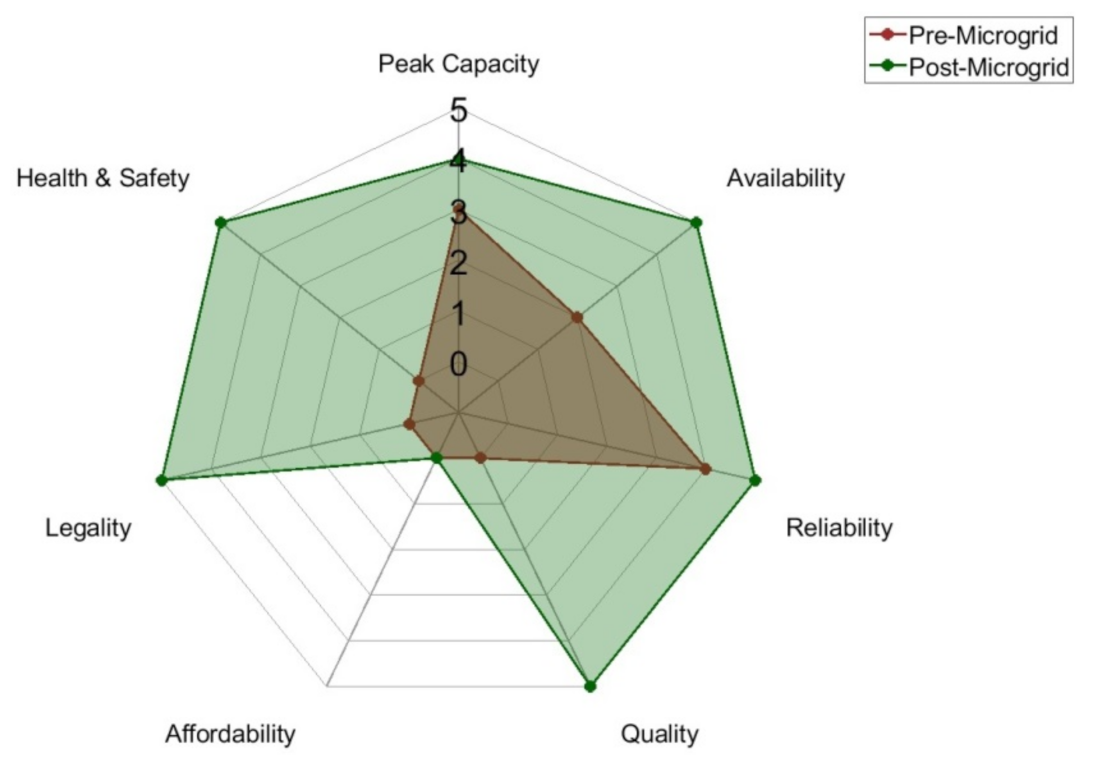
Table 1.
Multi-tier framework (MTF) for measuring access to household electricity supply [17].
Table 1.
Multi-tier framework (MTF) for measuring access to household electricity supply [17].
| Attribute | Tier 0 | Tier 1 | Tier 2 | Tier 3 | Tier 4 | Tier 5 | |
|---|---|---|---|---|---|---|---|
| Peak capacity | Power capacity ratings in W | ≥3 W | ≥50 W | ≥200 W | ≥800 W | ≥2 kW | |
| Power capacity ratings in daily Wh | ≥12 Wh | ≥200 Wh | ≥1.0 kWh | ≥3.4 kWh | ≥8.2 kWh | ||
| Availability | Hours per day | ≥4 h | ≥4 h | ≥8 h | ≥16 h | ≥23 h | |
| Hours per evening | ≥1 h | ≥2 h | ≥3 h | ≥4 h | ≥4 h | ||
| Reliability | Max 14 disruptions per week | Max 14 disruptions per week of total duration < 2 h | |||||
| Quality | Voltage problems do not affect the use of desired appliances | ||||||
| Affordability | Cost of a standard consumption package of 365 kWh/year < 5% of household income | ||||||
| Legality | Bill is paid to the utility, prepaid card seller, or authorized representative | ||||||
| Health and safety | Absence of past accidents and perception of high risk in the future | ||||||
Table 2.
Data that are needed for creating MTF descriptions of household electricity access on Gilutongan Island.
Table 2.
Data that are needed for creating MTF descriptions of household electricity access on Gilutongan Island.
| MTF Attribute | Data for MTF Description |
|---|---|
| Peak capacity |
|
| Availability |
|
| Reliability |
|
| Quality |
|
| Affordability |
|
| Legality |
|
| Health and safety |
|
Table 3.
Philippine (PH) market price of key microgrid components as used in the HOMER Pro design and the techno-economic analysis.
Table 3.
Philippine (PH) market price of key microgrid components as used in the HOMER Pro design and the techno-economic analysis.
| Description | Cost 1, USD | Price Source |
|---|---|---|
| Solar panel | 430 per kWp | Prevailing PH market price |
| Battery, lead-acid gel type | 129 per kWh | Prevailing PH market price |
| Charger/inverter | 184 per kW | Prevailing PH market price |
| Fixed capital cost | 10,200 | Fixed costs estimate |
| Annual O&M cost | 510 | O&M costs estimate |
1 Currency conversion rate used is 1 USD to 50 PHP.
Table 4.
Parameters used in the HOMER Pro design and techno-economic analysis.
| Parameter | Value | Data Source |
|---|---|---|
| Project lifetime | 25 years | Standard value |
| Discount rate | 3.75% | countryeconomy.com [38] |
| Inflation rate | 2.75% | tradingeconomics.com [39] |
| Annual capacity shortage limit | 5% | Researcher-determined acceptable value |
Table 5.
Average values of voltage and power in the Gilutongan Island village diesel generator from measurements made on 23 May 2019.
Table 5.
Average values of voltage and power in the Gilutongan Island village diesel generator from measurements made on 23 May 2019.
| Phase | Line-to-Line Voltage, V | Power, kW |
|---|---|---|
| AB | 227.8 | 7.10 |
| BC | 231.3 | 4.31 |
| CA | 232.3 | 4.43 |
Table 6.
Average voltage near the end-points of the phases of the distribution system on Gilutongan Island measured over a one-week period from 16 to 22 May 2019.
Table 6.
Average voltage near the end-points of the phases of the distribution system on Gilutongan Island measured over a one-week period from 16 to 22 May 2019.
| End-Point of Phase | Average Line-to-Line Voltage, V | Difference from the Nominal Voltage of 220 V |
|---|---|---|
| AB | 117.4 | −46.6% |
| BC | 119.0 | −45.9% |
| CA | 204.1 | −7.23% |
Table 7.
Description of the electricity access on Gilutongan Island based on the multi-tier framework.
Table 7.
Description of the electricity access on Gilutongan Island based on the multi-tier framework.
| Attribute | Major Findings | MTF Tier |
|---|---|---|
| Peak capacity |
| 3 |
| Availability |
| 2 |
| Reliability |
| 4 |
| Quality |
| 0 |
| Affordability |
| 0 |
| Legality |
| 0 |
| Health and safety |
| 0 |
Table 8.
Electrical loads in the 11 households of the Gilutongan Island solar microgrid.
| Household | Electrical Load | Quantity | Power Rating, W | Average Daily Consumption, Wh |
|---|---|---|---|---|
| HH1 | Lamp | 4 | 16 | 416 |
| Lamp | 1 | 9 | 99 | |
| Television | 1 | 150 | 750 | |
| Audio system | 1 | 150 | 150 | |
| Electric fan | 2 | 50 | 550 | |
| HH2 | Lamp | 2 | 11 | 187 |
| Television | 1 | 150 | 600 | |
| Television | 1 | 50 | 200 | |
| Electric fan | 1 | 50 | 500 | |
| Refrigerator 1 | 1 | 165 | 2310 | |
| Rice cooker 1 | 1 | 400 | 1200 | |
| HH3 | Lamp | 1 | 16 | 80 |
| Television | 1 | 150 | 600 | |
| HH4 | Lamp | 1 | 18 | 90 |
| Lamp | 1 | 7 | 35 | |
| Lamp | 1 | 5 | 20 | |
| Lamp | 1 | 13 | 52 | |
| Television | 1 | 50 | 250 | |
| HH5 | Lamp | 1 | 22 | 117 |
| Lamp | 1 | 9 | 132 | |
| Television | 1 | 40 | 400 | |
| Audio system | 1 | 200 | 400 | |
| Electric fan | 1 | 50 | 300 | |
| HH6 | Lamp | 1 | 25 | 250 |
| Lamp | 1 | 11 | 33 | |
| HH7 | Lamp | 2 | 9 | 153 |
| Television | 1 | 45 | 270 | |
| HH8 | Lamp | 1 | 20 | 140 |
| Television | 1 | 50 | 250 | |
| Electric fan | 2 | 50 | 690 | |
| Electric fan | 1 | 30 | 1000 | |
| Refrigerator 1 | 1 | 165 | 2310 | |
| HH9 | Lamp | 1 | 18 | 72 |
| Lamp | 1 | 5 | 45 | |
| HH10 | Lamp | 2 | 23 | 506 |
| Lamp | 1 | 9 | 99 | |
| Television | 1 | 150 | 900 | |
| HH11 | Lamp | 2 | 9 | 153 |
| Lamp | 1 | 8 | 40 |
1 During the load-profiling stage of the study, the appliance was not yet owned by the household but was expected to be acquired once the microgrid became operational.
Table 9.
Specifications for the main components of the Gilutongan Island rooftop solar microgrid as designed using HOMER Pro.
Table 9.
Specifications for the main components of the Gilutongan Island rooftop solar microgrid as designed using HOMER Pro.
| Component | Capacity | Implementation Details |
|---|---|---|
| Solar PV panel | 7.92 kWp | Divided into 2 × 3.96 kWp arrays for installation in two rooftops, each array having 12 units of 330 Wp solar panels |
| Battery energy storage | 28.8 kWh | Consisted of 12 units of 12 V, 200 Ah gel-type lead acid batteries, connected in 3 parallel strings with each string having 4 batteries in series |
| Charger/inverter | 10 kVA | Consisted of 2 units of 5 kVA charger/inverters connected in parallel, with one charger/inverter for each solar panel array |
Table 10.
Electricity consumption and daily household electricity costs.
| Household | Avg. Daily Consumption, kWh | Average Daily Payment for Consumption, USD | Previous Daily Payment for the Diesel Generator, USD |
|---|---|---|---|
| HH1 | 0.56 | 0.22 | 0.5 |
| HH2 | 6.61 | 2.65 | 0.4 |
| HH3 | 0.84 | 0.34 | 0.3 |
| HH4 | 0.81 | 0.32 | 0.8 |
| HH5 | 1.63 | 0.65 | 0.2 |
| HH6 | 1.57 | 0.63 | 0.3 |
| HH7 | 0.51 | 0.20 | 0.14 |
| HH8 | 1.41 | 0.56 | 0.3 |
| HH9 | 0.55 | 0.22 | 0.14 |
| HH10 | 0.56 | 0.22 | 0.42 |
| HH11 | 0.39 | 0.16 | 0.14 |
Table 11.
Electricity service outages in the Gilutongan Island solar microgrid for the one year period from April 2020 to March 2021.
Table 11.
Electricity service outages in the Gilutongan Island solar microgrid for the one year period from April 2020 to March 2021.
| Month and Year | Number of Disruptions/Outages | Outage Duration, h |
|---|---|---|
| April 2020 | 0 | |
| May 2020 | 1 | 3.5 |
| June 2020 | 1 | 6 |
| July 2020 | 0 | |
| August 2020 | 0 | |
| September 2020 | 0 | |
| October 2020 | 1 | 4.67 |
| November 2020 | 1 | 0.33 |
| December 2020 | 12 | 85.84 |
| January 2021 | 1 | 0.5 |
| February 2021 | 0 | |
| March 2021 | 0 | |
| Total for one year | 17 | 100.84 |
Table 12.
Description of the electricity access on Gilutongan Island based on the multi-tier framework before and after the solar microgrid.
Table 12.
Description of the electricity access on Gilutongan Island based on the multi-tier framework before and after the solar microgrid.
| Attribute | MTF Tier (Pre-Microgrid) | MTF Tier (Post-Microgrid) | Microgrid Electricity Supply Characteristics |
|---|---|---|---|
| Peak capacity | 3 | 4 |
|
| Availability | 2 | 5 |
|
| Reliability | 4 | 5 |
|
| Quality | 0 | 5 |
|
| Affordability | 0 | 0 |
|
| Legality | 0 | 5 |
|
| Health and safety | 0 | 5 |
|
Publisher’s Note: MDPI stays neutral with regard to jurisdictional claims in published maps and institutional affiliations. |
© 2021 by the authors. Licensee MDPI, Basel, Switzerland. This article is an open access article distributed under the terms and conditions of the Creative Commons Attribution (CC BY) license (https://creativecommons.org/licenses/by/4.0/).
Share and Cite
MDPI and ACS Style
Rabuya, I.; Libres, M.; Abundo, M.L.; Taboada, E. Moving Up the Electrification Ladder in Off-Grid Settlements with Rooftop Solar Microgrids. Energies 2021, 14, 3467. https://0-doi-org.brum.beds.ac.uk/10.3390/en14123467
AMA Style
Rabuya I, Libres M, Abundo ML, Taboada E. Moving Up the Electrification Ladder in Off-Grid Settlements with Rooftop Solar Microgrids. Energies. 2021; 14(12):3467. https://0-doi-org.brum.beds.ac.uk/10.3390/en14123467
Chicago/Turabian StyleRabuya, Isabelo, Melissa Libres, Michael Lochinvar Abundo, and Evelyn Taboada. 2021. "Moving Up the Electrification Ladder in Off-Grid Settlements with Rooftop Solar Microgrids" Energies 14, no. 12: 3467. https://0-doi-org.brum.beds.ac.uk/10.3390/en14123467
Note that from the first issue of 2016, this journal uses article numbers instead of page numbers. See further details here.