
The Economic Aspect of Using Different Plug-In Hybrid Driving Techniques in Urban Conditions
by
 , , , and
Piotr Wróblewski
1,* ,
,
Jerzy Kupiec
2,
Wojciech Drożdż
3,
Wojciech Lewicki
4 and
Jarosław Jaworski
3 1
Division of Aircraft Construction and Operation, Faculty of Mechatronics, Institute of Aviation Technology, Armament and Aerospace of the Military University of Technology, Sylwestra Kaliskiego 2, 00-908 Warsaw, Poland
2
Faculty of Civil and Transport Engineering, Institute of Machines and Motor Vehicles, Poznan University of Technology, Piotrowo Street 3, 60-965 Poznan, Poland
3
Research Center for Management of Energy Sector, Institute of Management, University of Szczecin, Cukrowa Street 8, 71-004 Szczecin, Poland
4
Faculty of Economics, West Pomeranian University of Technology Szczecin, Zołnierska 47, 71-210 Szczecin, Poland
*
Author to whom correspondence should be addressed.
Energies 2021, 14(12), 3543; https://0-doi-org.brum.beds.ac.uk/10.3390/en14123543
Submission received: 10 March 2021
/
Revised: 10 June 2021
/
Accepted: 11 June 2021
/
Published: 14 June 2021
(This article belongs to the Special Issue Economic and Policy Challenges of the Energy Transition in CEE Countries)
Abstract
:Plug-in hybrids (PHEV) have become popular due to zero-emission driving, e.g., in urban areas, and using an internal combustion engine on longer distances. Energy consumption by the PHEV depends on many factors which can be either dependent or independent of the driver. The article examines how the driver can use the vehicle’s capabilities to influence its wear. Determining the optimal driving technique, due to the adopted nature of the timetable, is the basic variable that determines the profitability of using a given drive system. Four driving techniques have been selected to determine which one can offer the largest advantages. A vehicle-dedicated application has recorded the drivetrain performance on a predetermined route through an urban area. The analysis of results has demonstrated which of the driving techniques provides measurable effects in terms of reduced energy consumption and the shortest travelling time. The study shows longitudinal acceleration and torque generated by the electric drive. The information included in the study can help any PHEV user reduce the operating cost by applying an appropriate driving technique. The proposed research introduces the possibilities of assessing the influence of the driving style on energy consumption. The innovative side of this research is the observation of stochastic phenomena that are difficult to detect when using approximation modelling.
1. Introduction
A large number of vehicles on our roads have a negative impact on the environment. This impact is already generated at the stage of manufacturing and operation. Manufacturers make every effort to make the construction of vehicles as light as possible [1,2]. Hence, internal combustion engines can use less fuel and produce small volumes of toxic compounds emitted to the atmosphere [3,4,5]. Alternative fuel technologies [6,7,8] and hybrid vehicle propulsion systems [9,10,11] have been extensively developed.
When analyzing the above technologies, it can be noted that hybrid vehicles are considered to be the most sensible solutions to reduce fuel consumption and toxic emissions without compromising the vehicle’s drivability [9,10,11,12,13]. PHEVs use energy management systems to reduce fuel and energy consumption originating from several energy sources [14,15,16]. Among hybrid vehicles, the largest attention of researchers has been drawn to the electric plug-in hybrid vehicles (PHEV) due to their batteries and an advanced propulsion system [17,18,19,20,21]. These are universal vehicles designed to produce zero-emission while driving in urban areas, and travel long distances while using the combustion engine. The complex propulsion system helps reduce carbon dioxide emission, in particular in urban areas [22,23].
PHEVs are cheaper than electric vehicles and, at the same time, still have advantages over internal combustion engine vehicles (ICEV) [24]. The analysis of distances covered by owners of conventional vehicles shows that most of them travel less than 32 km per day and, in the case of PHEV users, it is less than 11 km per day [25]. The plug-in hybrid (PHEV) is used to describe a conventional hybrid vehicle with a battery rechargeable from a conventional power socket, recuperated energy from braking or by a combustion engine-driven generator [26,27]. The PHEV uses an electric motor of 60–70 kW [28]. The optimal battery capacity compared to the BEV enables to maintain the range in the urban driving mode and a partial reduction of the combustion engine use over the distance [29,30]. When the battery is discharged, the internal combustion engine starts to drive the vehicle and the generator operated until the battery is recharged. The combustion engine also operates at the start-up when the outside temperature is low. This is referred to as a cold start and occurs after a continuous 12-h shut-down [31]. This is the cause of fuel consumption when driving on short distances with fully charged batteries.
The combination of an internal combustion engine and an electric engine makes the vehicle independent from access to the electric charger. However, if one travels on short distances in a zero-emission mode, the vehicle uses electricity. To reduce the energy used during a journey, one should plan the route well and take into account the traffic. Although the approach is presented by authors of numerous publications [32,33], the final energy needed to cover the route depends on yet another factor that has not been addressed by scientific research. It is the driving technique that, in addition to the factors mentioned above, such as the construction and capability of a vehicle and conditions and road infrastructure, has untapped potential in terms of energy saving. The driver is able to use systems installed in the vehicle and his assessment of the road traffic to use less energy on a previously planned route [34,35,36]. In the opinion of the authors, it is worth determining the extent and benefits of a few simple driving techniques in combination with systems made available by the vehicle manufacturer. The subject of electromobility of exhaust emissions and trends in discharged systems in Poland was discussed in the works [37,38,39,40,41,42].
This paper expands the current electromobility and PHEV studies by demonstrating which driving technique produces measurable results in terms of reduced energy consumption and the shortest travelling time. The goal is to determine optimum operating conditions for the electrical power management system in serial and parallel modes in an SUV 4 × 4 class PHEV. The combination of studies and real-time reading of operational parameters enables to examine the performance of the system and optimize parameters of the kinetic energy recuperation system and the systems monitoring the battery charging process. Such studies are based on the monitoring of the parameters and the performance of the electric drive and batteries in real driving conditions, in urban traffic, with a high traffic intensity and frequent energy recovery from braking. In addition, the study uses data pertaining to the speed profile in a given area and the operation of inbuilt systems. Data were derived from the GPS vehicle location reading and mobile applications. These procedures also provide data on vehicle movement in time, braking and acceleration frequencies, average traffic speed and mileage per traffic sections. Once we collated these data and detailed information from experimental studies of a test vehicle, it was possible to determine the nature of traffic and the expected electricity demand. Therefore, it is possible to set an appropriate energy management strategy to maximize the lifetime of the main batteries.
Drawbacks of electrochemical cells used in electric vehicles include their low power density which determines high current values and the loss of capacity, high mass, and a relatively small number of charge and discharge cycles. Despite the application of increasingly sophisticated energy storage technologies using rare elements, the operation of batteries needs to be continuously monitored. Therefore, a precise electricity management, depending on the area, vehicle class, and the number of driven axles, is essential to maintain the cost-efficiency of batteries. The power management system can therefore be enhanced with speed limit solutions, torque reduction and rated power depending on the temperature and the actual status of the batteries. The development of such systems is in progress, but most authors focus on real traffic vehicle testing over short distances to collect more reliable data. This study, however, combines user data and experimental data. Based on this data and a large population of vehicles, strategic conditions can be established to optimize the durability of electrochemical cells in the PHEV power supply system.
The main issue related to PHEVs is the range and life-cycle. These are determined by the capacity of the power source (main and secondary energy sources and capacitors), whose energy accumulation capacity is limited and the charging time unsatisfactory.
The battery management system (BMS) measures the current from the power unit, the voltage at individual cells, and the instantaneous temperature (temperature of cells inside the housing and safety unit). The measurement of these parameters enables to determine the state of charge (SOC) and the state of health (SOH) of the power unit and the rated capacity of cells. The BMS should intervene in case of overload, i.e., exceeded SOC limit or control system overheating. It should disconnect or request the electrochemical cell assembly to be disconnected from the electrical system. The BMS determines the instantaneous status of the cell pack and sends data (output signals) over the controller area network (CAN) to supervisory systems. These values include charge and discharge currents and critical power. The purpose of the system that monitors charging and operation is to keep the SOC within the acceptable range and to maintain the power range in the BMS control system. In the case the cell assembly is in continuous operation (discharge) during the urban mode driving (electricity consumption by an electric motor), the system needs to disconnect the power unit from the vehicle’s electrical system. The energy required to support safety or monitoring systems may be taken from the secondary source responsible for the start-up of the internal combustion engine, because of the negligible current and voltage if compared to the secondary (main) energy source. In some applications, the BMS controller determines the power range, and the circuit shutdown in the cell assembly is determined by a master controller. In this system, the BMS affects the cooling of the cell assembly and the SOC status.
To maintain the long life cycle of electrochemical cells during cyclic load changes, the temperature must be maintained between 5 °C and 25 °C depending on the base material of electrodes and electrolyte. The life cycle of batteries is reversely proportional to the average operating temperature.
In traction PHEVs, the secondary energy source is charged at regular charging and discharge intervals. The optimum cyclical changes affect the efficiency of the electric drive and the kinetic energy recuperation from braking or idle driving. The cycle frequency management strategy (loading-unloading) should take into account parameters describing the operation of electrochemical cells and the gravimetric capacity. The combination of these parameters enables to reduce the weight of the unit while maintaining the required service life. The strategy for the managing of energy transmission to the generator-combustion engine unit and from cells to the electric motor should be based on experimental tests. Tests should integrate the speed profile and input values defining the vehicle, durability of its energy unit, recuperation and absorption of kinetic energy by a set of capacitors, and efficiency of the combustion engine and power generator under predefined operating conditions, i.e., forced nominal power demand.
The battery management system should also provide the user with the possibility to exercise supervision and control over basic operating parameters of the vehicle, e.g., comfort and safety equipment, or to monitor their status automatically. The introduction of a passive power control algorithm would certainly allow increasing the range until battery discharge. If necessary, the electric power control unit stored in an automatic mode in the secondary energy source would switch off individual comfort devices in the agreed priority order, e.g., radio, interior lighting, air conditioning and ventilator, etc. This would certainly contribute to a more efficient use of energy and to maintain a long life cycle of batteries.
If the cell bank’s low state of charge is exceeded, the discharge process must be reduced and the heat engine started, especially in the warm-up mode. When the charging of the cell pack drops below its lower limit, it is recommended to start intensive charging by increasing the charging current and controlling the operation of the combustion engine. The discharge power reaches zero when the lower charging limit is significantly exceeded. During the operation of the system, the lower charging limit should never be reached to maintain the vehicle’s acceleration capacity. At the design stage, when energy balance is calculated, the rated power of the combustion engine and the generator should be adapted to the gravimetric capacity of the electrochemical cell unit and the electric motor to prevent reduced vehicle’s acceleration capability. The determination of the lower charging limit affects the vehicle’s acceleration capacity and the life cycle of the battery pack. For the battery pack adopted, based on performance parameters, the lower charging limit is 20%. The introduction of an additional control system (additional controller) will ensure that the designated control algorithms are integrated and durability and charging capacity maintained at the limit level. The strategy to maintain the preset charging level of the secondary energy source in traction vehicles requires the adjustment of the combustion engine operation frequency and its operating point to ensure the overall cost efficiency of the PHEV. The determination of the appropriate operating conditions for these systems based on precise charging and energy supply parameters based on tests is a valuable source of information about the behavior of the system and the maximum battery pack lifetime and the SUV class vehicles operated in the urban mode. It can also help other authors in similar studies.
The article focuses mainly on experimental research. The shortcomings of ICEV systems are discussed in the works [43,44,45]. The parameters of the timetable are intentionally very similar. There are quite a few studies that underpin the cost-effectiveness of introducing hybrid vehicles to the automotive market. In particular, data on the impact of aperiodic faults on the profitability of using individual types of drive systems are included in the authors’ works [46,47]. It is worth mentioning, however, that there are applied works on verifying the nature of driving for the battery consumption process. In these studies, careful attention was paid to the parameters of the battery, environmental conditions and the conditions for changing the operating parameters of batteries in SUVs often used in urban mode. These studies supplement the existing data set with new operational information.
Design trends in lithium-ion batteries show that an increase in energy density and safety can be expected over the next decade. Base material costs account for the bulk of the cost of a battery pack (66%). By using silicone batteries, costs can be reduced by 30% per kWh. Accordingly, the limit of $100/kWh will be reached in 2020–2025 for silicon batteries and in 2025–2030 for NMC batteries. This low price will have a significant impact on the overall price of the PHEV and BEV. This will translate into profitability of the mass use of these drive system solutions [48].
The article structure is as follows: Section 2 provides an overview of the study. Section 3 includes an analysis of test results. Section 4 presents final conclusions from the study while indicating its limitations, practical application and the focus of future research in the area.
The main scientific objective of the article is to present the energy consumption of various driving techniques used by the driver for a given type of urban route for PHEV vehicles with four-wheel drive. The article fills the scientific gap in the field of experimental research on the demand for electricity in SUVs depending on the driving techniques used. As part of the experimental research, it was assumed that the length of the route does not change, the external conditions are stable and the only variable is the driving style of the driver. The nature of the route, such as: the number of crossings, hills, traffic volume, stopping time, number of traffic lights and road traffic restrictions are constant. Five driving modes have been adopted: “normal”—driving without paying attention to consumption while maintaining traffic continuity and road regulations, “pedal gas”—braking and acceleration mode in order to maximize kinetic energy recuperation, “eco”—the mode in which the vehicle undergoes within the specified manufacturer parameters, for example, limiting speed, electric motor power and acceleration values, “rules”—traffic mode according to the road regulations with a speed limit of 50 km/h, “summer”—driving mode with maximum energy saving at 21 °C (air conditioning system and combustion engine are off). The “summer” mode was to be a reference to the most economical mode of driving the route during the research. Research in this area was not undertaken by researchers, they are limited to simulation calculations and the introduction of different timetables. In this study, the possibilities of reducing the energy consumption by the driver were analyzed using specific driving techniques implemented by the driver, and not the energy consumption monitoring systems. These studies provide a valuable complement to information on the energy consumption trends of 4WD SUVs and other PHEVs.
2. Materials and Methods
2.1. Characteristics of the PHEV Propulsion Used
The purpose of the study is to indicate optimum driving techniques supporting the reduction of energy consumption in the plug-in hybrid vehicle. A good example of such a vehicle already in-service is the SUV class Mitsubishi Outlander PHEV manufactured in 2014.
The study focuses on the SUV class which typically has an increased energy consumption compared to other vehicle classes, in particular, those of smaller dimensions and curb weight. Another advantage is the ability to incorporate a series and parallel drive, which provides additional research and knowledge aspects regarding trends in optimizing energy consumption in the urban driving mode. Results of the study will be used to estimate the electricity consumption in a wide range of vehicles and to optimize the energy management system in 4 × 4 SUVs. Based on information obtained and user data from GPS analysis of SUV vehicles, a simulation can be performed to introduce relevant energy forecasting algorithms based on accurate real-time traffic studies. They are very effective in the case of large urban agglomerations where the energy recuperation system is frequently operated comparing to the extra-urban mode. According to the authors, accurate experimental studies in combination with statistical data on braking and acceleration frequency, and the average speed in a given high traffic area with a high number of intersections and stopping points are used to better assess the range of SUV PHEVs. The main problem to be solved, which still limits the development of 4 × 4 PHEV electric motors fitted with energy recuperation systems, is the storage of energy required to drive the traction vehicle while maintaining its desired range and driving dynamics. To ensure that the optimization forecasts for the energy management system are correct, it is also necessary to provide information on the operating status and disturbances of the power supply system, as well as intermediate data, e.g., DC/DC converter. The latter data provide information on the power supply to stabilized voltage passive components (counteracting output voltage fluctuations), which causes changes in the DC voltage needed to correlate the high voltage system with the LDV vehicle’s 12 V voltage system.
At first, for further study, it is worth explaining the drive solution. It is a hybrid electric/petrol vehicle that can operate in parallel and series. Energy is transmitted to the wheels by two electric motors, one for the front and the other for the rear axle. These are two 60 kW engines of various torques: 137 Nm [front] and 197 Nm [rear]. The 2.0 L combustion engine cooperates with the front electric motor and has the power of 89 kW and a torque of 190 Nm [37]. It can have the front wheel propulsion through the gear in a parallel hybrid mode and the generator in a series mode. The series hybrid driving mode is used for heavy acceleration or driving in mountainous areas. When moving at high speeds, the combustion engine drives the front wheels and the generator operates as a parallel hybrid. The control unit is responsible for switching between the different driving modes. The vehicle can be driven in the electric mode using electric motors only, but then the combustion engine is switched off. The range in this driving mode is limited by the capacity of the battery, which is 50 km according to the manufacturer’s information. The electric motors are powered by a 300 V 12 kW Li-ion battery with 80 air-cooled cells. The battery is located in the middle section of the vehicle under the floor to improve the directional stability of the vehicle. Since two types of charging connectors and an external charger are provided, the vehicle can be charged using the AC240V (Type 1) connector from the home electrical socket and a DC charging station via the CHAdeMO connector. The individual modes of engine operation are presented in Table 1.
The two electric motors in the drivetrain of the vehicle are used to generate power for the 4 × 4 drive. They are also used as power generators to produce braking force and to recover energy from braking. This solution allows controlling the driving power and braking force without removing the foot from the accelerator pedal. The depth at which the pedal is depressed corresponds to the driving power, and the release of the pedal activates recuperative braking.
The recuperative braking force can be controlled within five levels by levers on the steering column and within two levels via the drive mode selector. Levers at the steering wheel can be adjusted to a braking position of 5 to 0, where 5 is the largest force and 0 corresponds to the absence of recuperative braking. The drive mode selector, once moved to position B, sets braking at 5, and when it is moved to position B again, braking is set to position 5. This functionality has been used in one of the tests. In Table 2. the technical data of the vehicle used in the tests is included.
The functions introduced in this vehicle allow the introduction of driving techniques independent of the supervisory systems. A very identical distribution of the route has been intentionally selected in order to assess the possibilities of reducing energy through interference by the driver himself. This makes it possible to determine the optimal driving technique in urban territory, especially for highly energy-consuming SUVs with 4 × 4 drive. In addition, a comparative drive at a temperature of about 21 °C was introduced to the four selected driving techniques, which excludes the maximum operation of the internal combustion engine and the air conditioning system. This allows one to realistically assess the energy benefits for different driving techniques and different weather conditions. This research provides a significant indication for future drivers of PHEV SUVs.
2.2. A Map with a Route and Speed Profile
Road tests were carried out in Poznań, Poland, and its surroundings in late November and early December 2020. For comparative purposes, an additional drive of the vehicle was made on the same route using the most effective driving technique at a temperature of 21 °C. This drive was performed in May 2021. This allows for a comparative analysis of this driving technique excluding additional disturbances. This applies to the operation of the air conditioning system and the internal combustion engine. The city of Poznań is a typical large Polish metropolis, which justifies its choice for vehicle testing. Additional GPS data from 10 users of PHEVs were obtained from the area of Poznań and similar urban agglomerations with a similar distribution of junctions and traffic flow. The proposed short period of the real traffic experimental studies (detailed studies) resulted from the need to ensure a relatively stable ambient temperature during all test runs. Due to the long battery charging time, ambient conditions and fluctuating traffic, it was possible to have only one trip per day. The situation was similar in the case of statistical data, which indicated a very similar character of trips according to information from PHEV users. During all tests, the car was driven mostly in the electric mode, and in the serial hybrid mode only when the coolant was heated to the temperature that would allow the passenger compartment to warm up.
The route started at a private property where the vehicle was charged from an electrical socket overnight. The route went from the suburbs of Poznań through its center to a destination located in the area of the Poznań University of Technology. The distance between the vehicle stopover location and the destination was 13.9 km. There were 28 intersections along the route with traffic lights and pedestrian crossings. The speed limits applied to the entire route and ranged from 30 km/h in the center to 50 km/h in most built-up areas and 70 km/h in the section of the main access road. Trips were made between 9:30 and 10:00 in the morning. The average travelling time for the entire route was 34 min. The test runs ensured similar measurement conditions for all tests. The test run for the temperature of 21 °C was made for the same route at the same hours, with the same traffic volume and distribution of encountered road obstacles.
2.3. Performance of Tests
Before each test, the vehicle was parked in a garage and, at the start of the test, the outside temperature and the temperature of the car interior was 14 °C. After entering the vehicle, the driver turned on the start button and activated the mobile application. Then, the application was used to record parameters and the test started. While driving, changes of temperature in the passenger compartment and the ambient temperature were noted. The vehicle’s interior temperature was set in the air-conditioning system at 21 °C. The ambient temperature was measured using a factory-mounted sensor in the car and the interior temperature was measures by the electronic service thermometer WT-2. The measuring range of the latter is −50 °C to +300 °C and the accuracy is ±1 °C.
Before the test, the vehicle’s battery was fully charged at 100% SOC (State of Charge). Measurements ended at a parking lot at the same location and logged in to a mobile application when the vehicle was stopped.
When driving at an ambient temperature of 21 °C, the interior of the vehicle had a similar temperature of about 22 °C, which excluded interference with the air conditioning system during tests. It also reduced the use of the internal combustion engine to a minimum.
2.4. Test Programs
The test programs used to compare energy consumption were selected in such a way that they do not absorb too much driver’s attention and make the most of the car’s capabilities. This enables any user of the vehicle to repeat the trip with similar energy consumption. The following four test programs were used:
- Regular driving in the “normal” driving mode—enables the vehicle to stay behind other vehicles without obstructing the traffic. All vehicle systems were set to “normal”. This is the standard driving mode most often used by drivers.
- Regular driving in the “eco” driving mode—enables the vehicle to stay behind other vehicles without obstructing the traffic. All vehicle systems were set to the “eco” mode by pressing the “eco” button on the center panel. According to the manufacturer’s information, this function changes the accelerator pedal’s operating characteristics, resulting in a slow response from the drive to the pedal. It also changes the functioning of the air-conditioning system.
- Driving with “gas pedal” in the “normal” mode—enables regeneration braking. This driving mode is activated at the fifth level of recovery using levers at the steering wheel or by shifting the drive mode selector twice to position B. This and the prediction of the traffic enables driving virtually without touching the brake pedal.
- The “rules” mode—driving in line with regulations means that the driver follows all vertical and horizontal signs and speed limits throughout the test. The vehicle’s speed limiter system was used to meet the requirement. After setting the speed limit, a message appeared on the dashboard and the vehicle did not allow the speed to be exceeded. Unfortunately, this type of driving requires continuous modification of speed limit settings depending on the required speed limit.
- The “summer” mode—driving in the most economical mode of the previous tests at an ambient temperature of around 21 °C. This allowed to reduce the maximum use of electricity from all systems determining the temperature of the interior of the vehicle. It also allows to reduce the share of the internal combustion engine to zero. According to the conducted analysis, this is the most effective mode of driving for SUVs with 4 × 4 drive.
2.5. Equipment and Software Used to Record Parameters
The tests used the communication with the vehicle via the standardized OBDII diagnostic interface. Information is picked up by the ELM 375 interface and transmitted via Bluetooth to the “PHEV Watchdog” application installed on the mobile device.
It is a free application that allows one to view real-time information from the Mitsubishi Outlander controllers. It enables to record 51 parameters and save their values in CSV files and provides 63 conversion parameters as maximum and average values. The information sampling frequency from the controllers during the tests was every 1.3 s. Such sampling is sufficient to compare energy consumption by the vehicle during tests. The number of parameters used for further analysis was limited to the most important ones from the point of view of energy consumption. Further analyses were based on the following values:
- Travelling time;
- Vehicle speed;
- Time of acceleration;
- Battery capacity used;
- Capacity recovered during the test;
- Power consumption by the EV during a test and its average value;
- Consumption of petrol by the combustion engine;
- Average regenerative braking power;
- Torque generated by the front and rear motors.
Additionally, the following values have been calculated based on the actual mileage:
- Longitudinal acceleration;
- Braking delays;
- Total traction torque of electric motors;
- Total braking torque of electric motors.
Parameters registered by the application have been converted to enable their processing in Microsoft Excel.
3. Results and Discussion
Three test runs were made for each of the four test programs. Weather conditions and computer indications related to the expected range were recorded. A summary of the results related to the characteristics of the vehicle’s route is shown in Table 3. Colors are used to mark maximum (green) and minimum (yellow) values. For each average value obtained from the measurements and given in Table 3, the accuracy of its measurement is given in square brackets. To assess this accuracy, the standard deviation method (σ) was used, which describes the dispersion of the measurement results around the average value. During road tests, the average ambient temperature was between −0.7 °C and 2 °C. The longest average travelling time was recorded for driving with the use of the acceleration pedal, and the shortest with the “eco” mode. However, the longest and shortest values attributed to the same driving techniques decreased slightly after the standstill time was subtracted.
The ambient temperature in the “summer” mode was 21 °C.
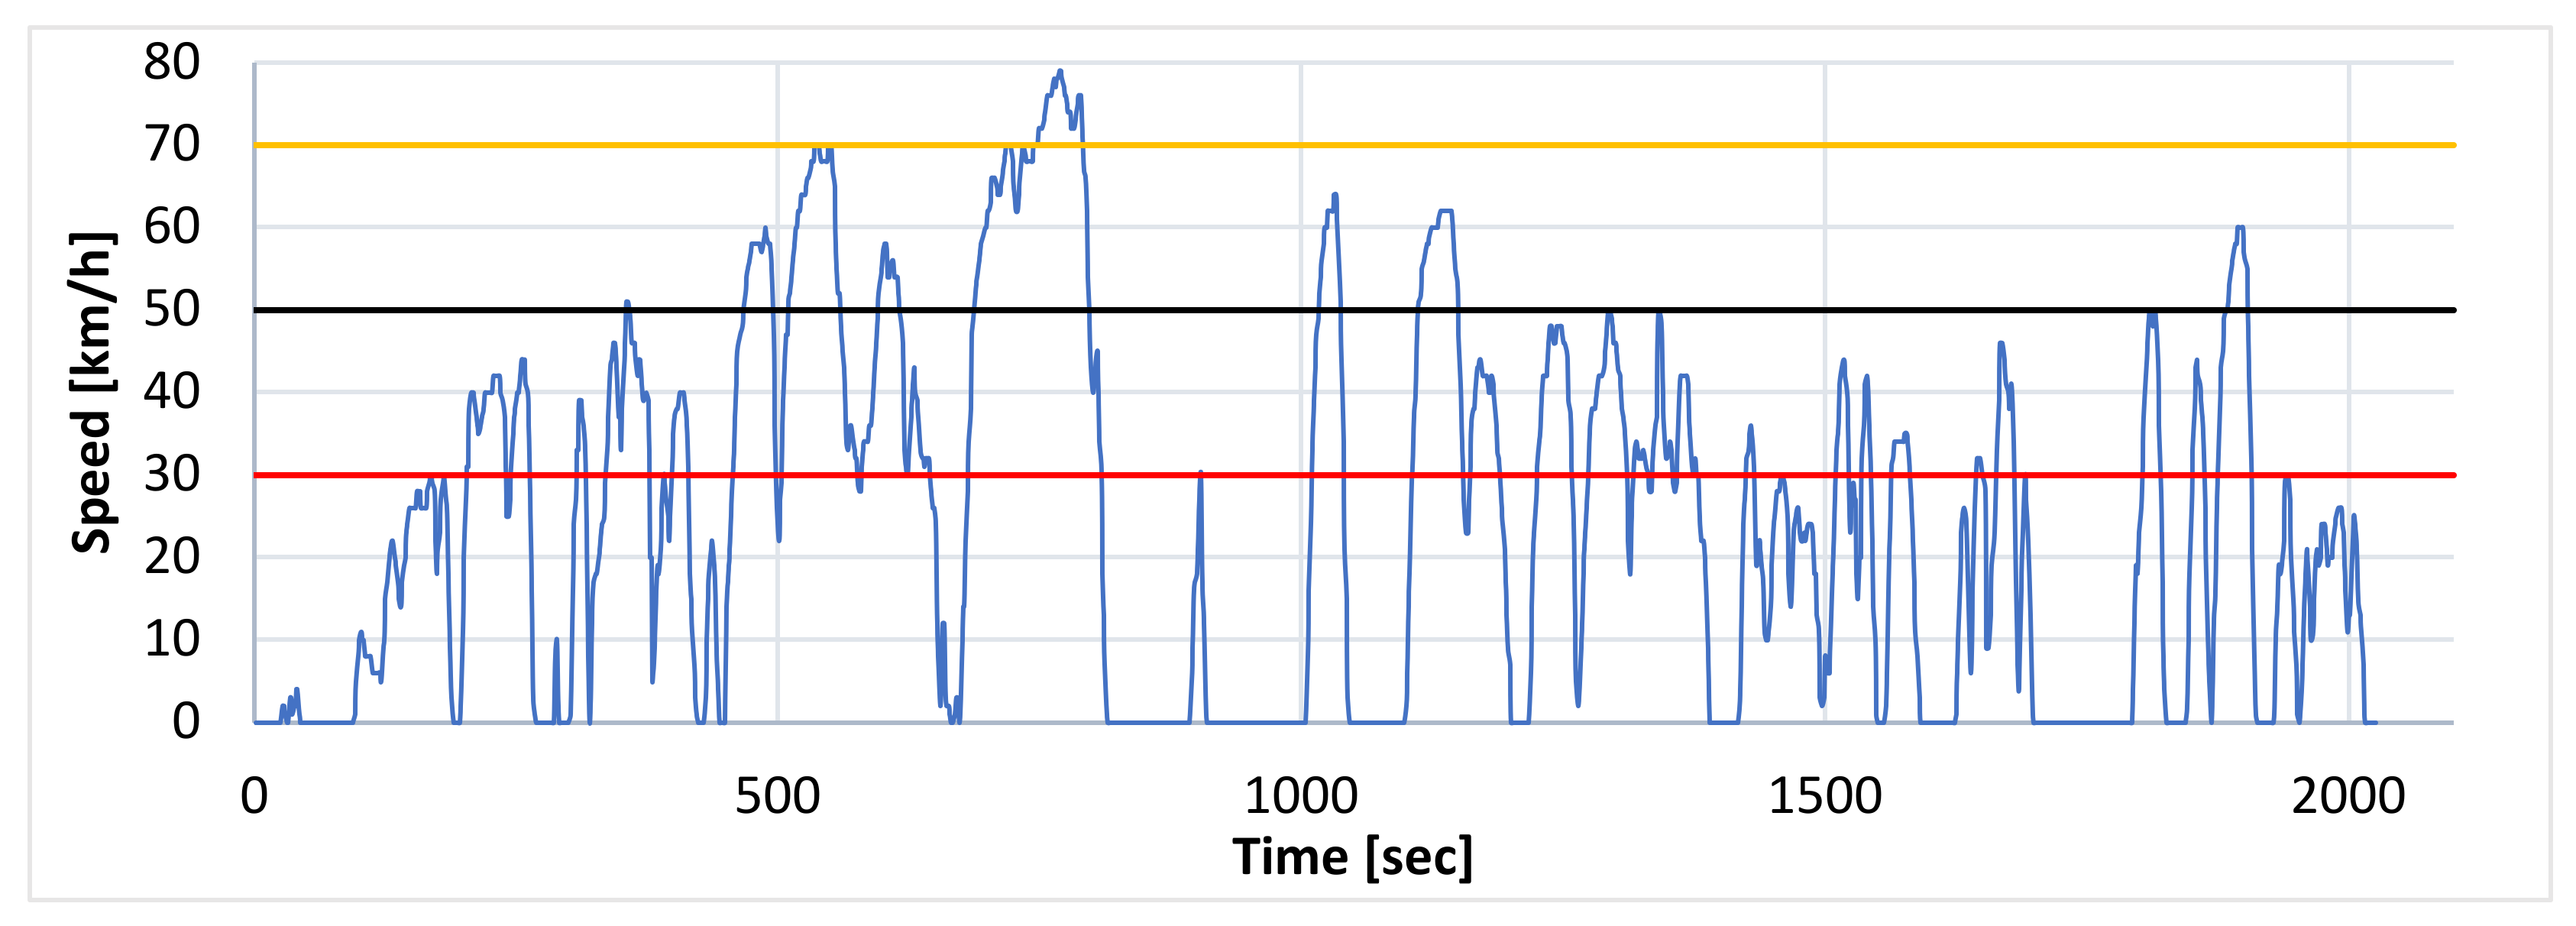
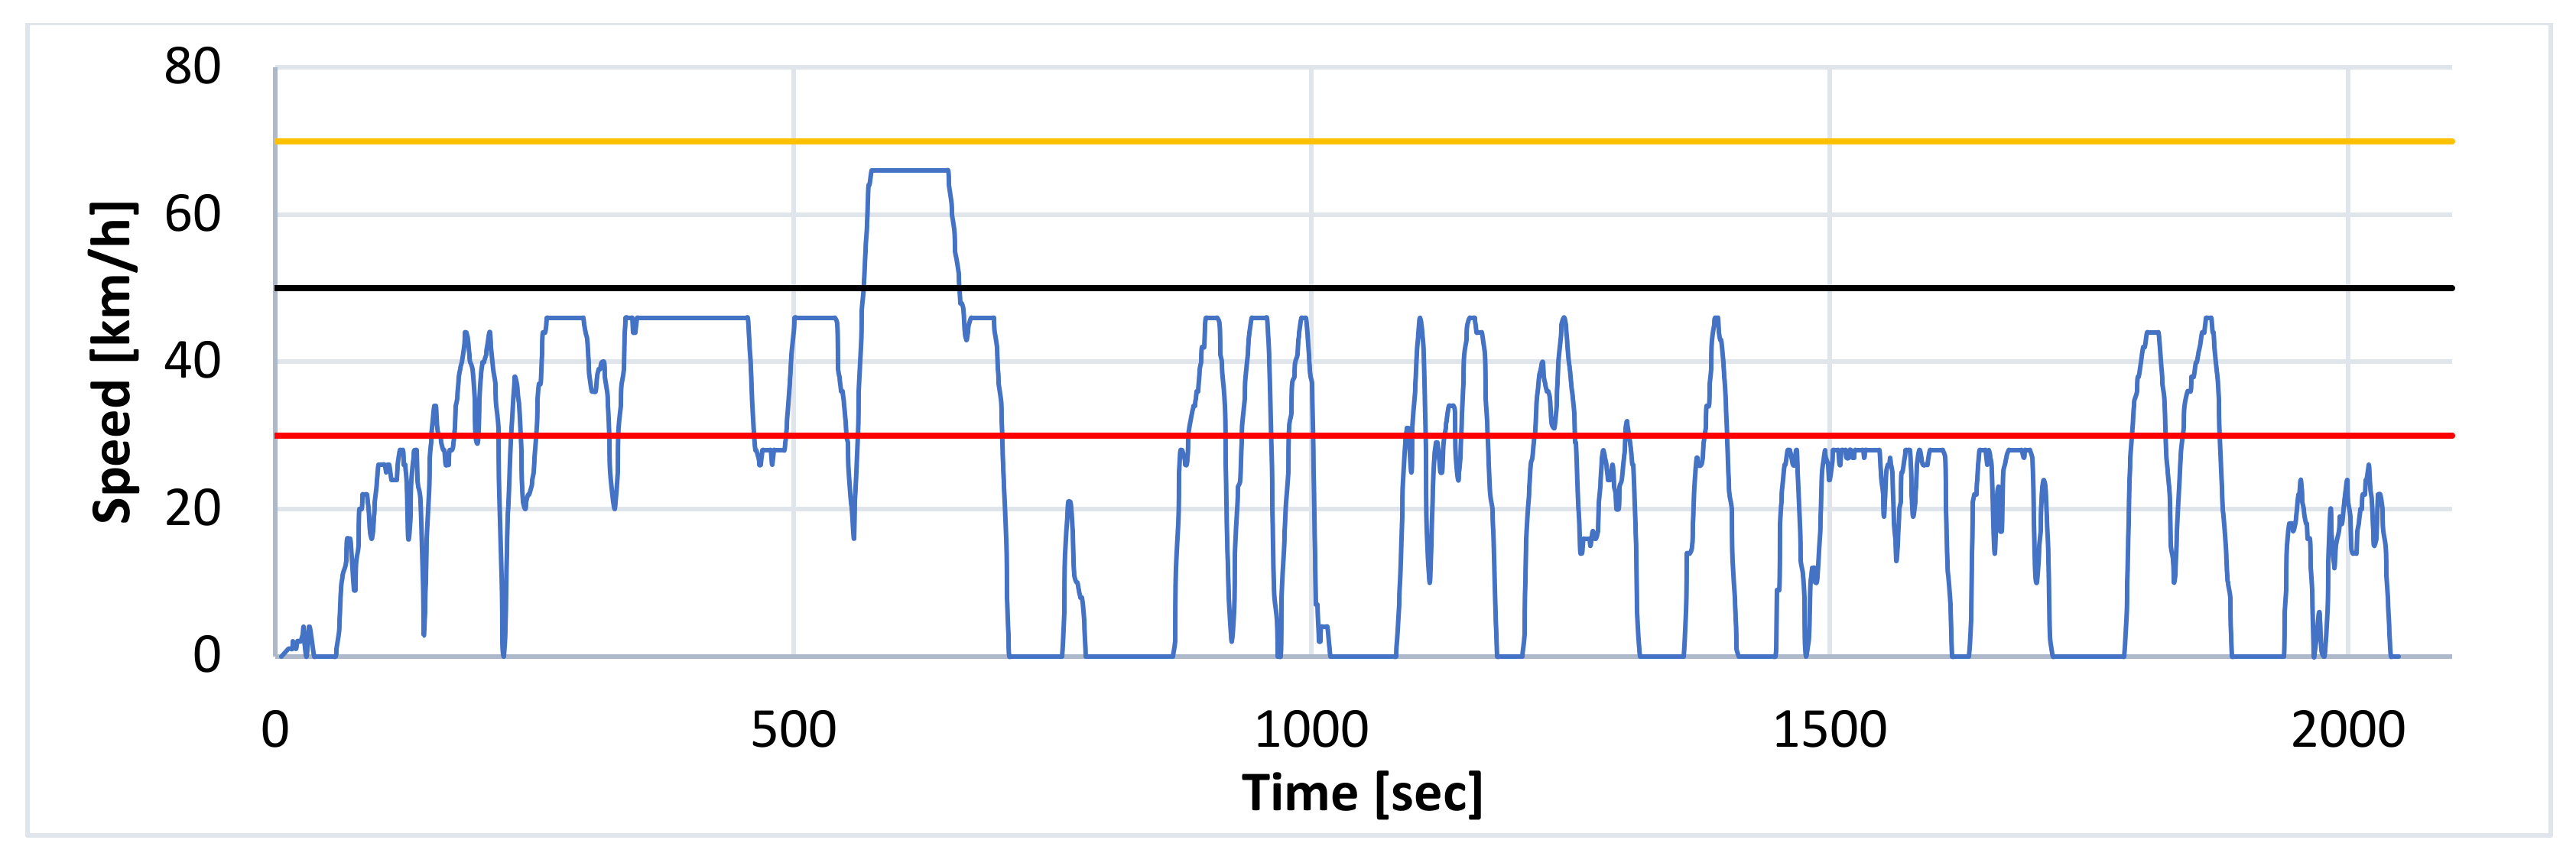
Other parameters, interesting from the point of view of the vehicle’s energy consumption, are listed in Table 4. Green indicates the highest values and yellow the lowest ones. The data from the “summer” mode have been shown in gray for comparison. The analysis of data from this driving mode allows to assess to what extent the air conditioning system and the lack of interference of the internal combustion engine with the power supply of the drive system affect the energy consumption of PHEV 4 × 4 SUV vehicles. The fuel consumption for the internal combustion engine in the “summer” mode is marked in red. When analyzing trip parameters, it can be noted that the average speed was between 24.3 km/h and 26.5 km/h and that the maximum value of 78 km/h was reached while driving in the “normal” mode. The lowest speed value of 66 km/h was recorded for a run with “rules”. Speed profiles for both cases are shown as test runs in Figure 1 and Figure 2. The speed fluctuations during the “normal” and “rules” driving modes can be seen in the speed profile diagrams provided. They show the sections of the route where speed limits to 30, 50 and 70 km/h have been made. Both figures also show three lines corresponding to the individual limit values. In the “eco” and “summer” modes, the distribution of the driving speed profiles was very similar to the “normal” and “rules” modes. It is caused by driving on the same route with the same restrictions, e.g., traffic volume, number of lights, number of additional territorial obstacles.
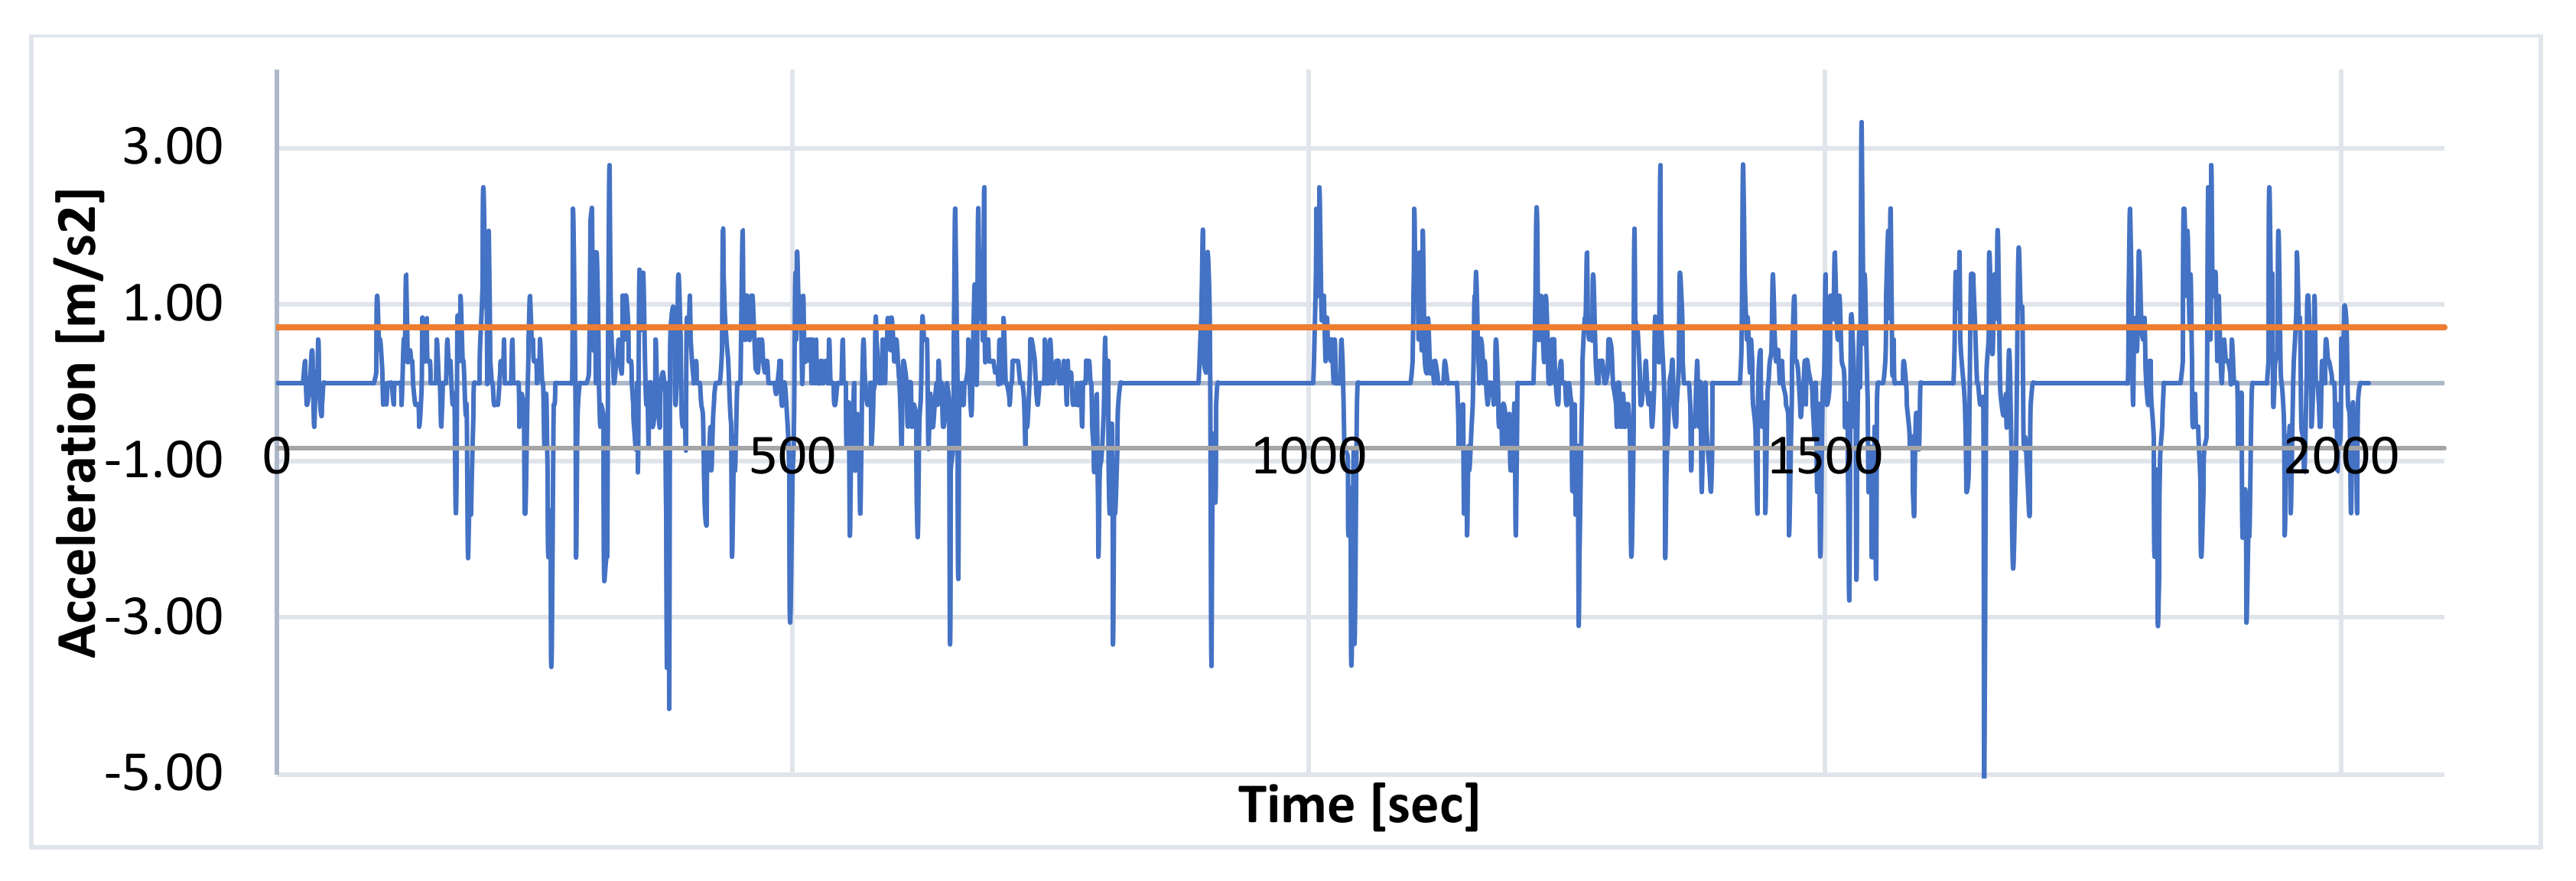
Acceleration values over the measured section were between 0.65 and 0.75 m/s2. Braking during the test was between −0.72 and −0.83 m/s2, the most frequently encountered in urban traffic [34]. Speed and acceleration values are consistent with those obtained by other researchers when analyzing vehicle behavior in urban traffic [35,36]. An example of acceleration values recorded during one of the tests is shown in Figure 3.
It is interesting that the vehicle also moved with an idle acceleration since the values obtained are related to the instantaneous traffic and according to traffic lights. These values are between 2.1% and 2.6% of the total travelling time. When driving, the driver can use the on-board computer readouts to determine the range of the vehicle. Such information is approximate and, therefore, the results should be considered indicative only. During the tests, the loss of range after the test run was between 18.7 km and 21.3 km. The lowest value of the loss of range according to the indications of the measuring equipment is recorded for the “summer” mode. This means that the adoption of a specific driving technique significantly translates into the theoretical range of the vehicle. The “eco” and “rules” modes are the best. The parameters of the speed limit and acceleration values are largely decisive here. The mode of using additional devices also plays an important role here. As can be seen in the “summer” mode, the loss of the theoretical range is the smallest, which is largely due to the lack of air conditioning system operation. As it can be easily observed, it has a huge impact on the theoretical range of vehicles. The influence of comfort systems is of great importance on the energy consumption of the entire vehicle, it also allows one to plan the range of the vehicle and increase it during the journey in emergency situations, e.g., access to the charging station by switching off the air conditioning system.
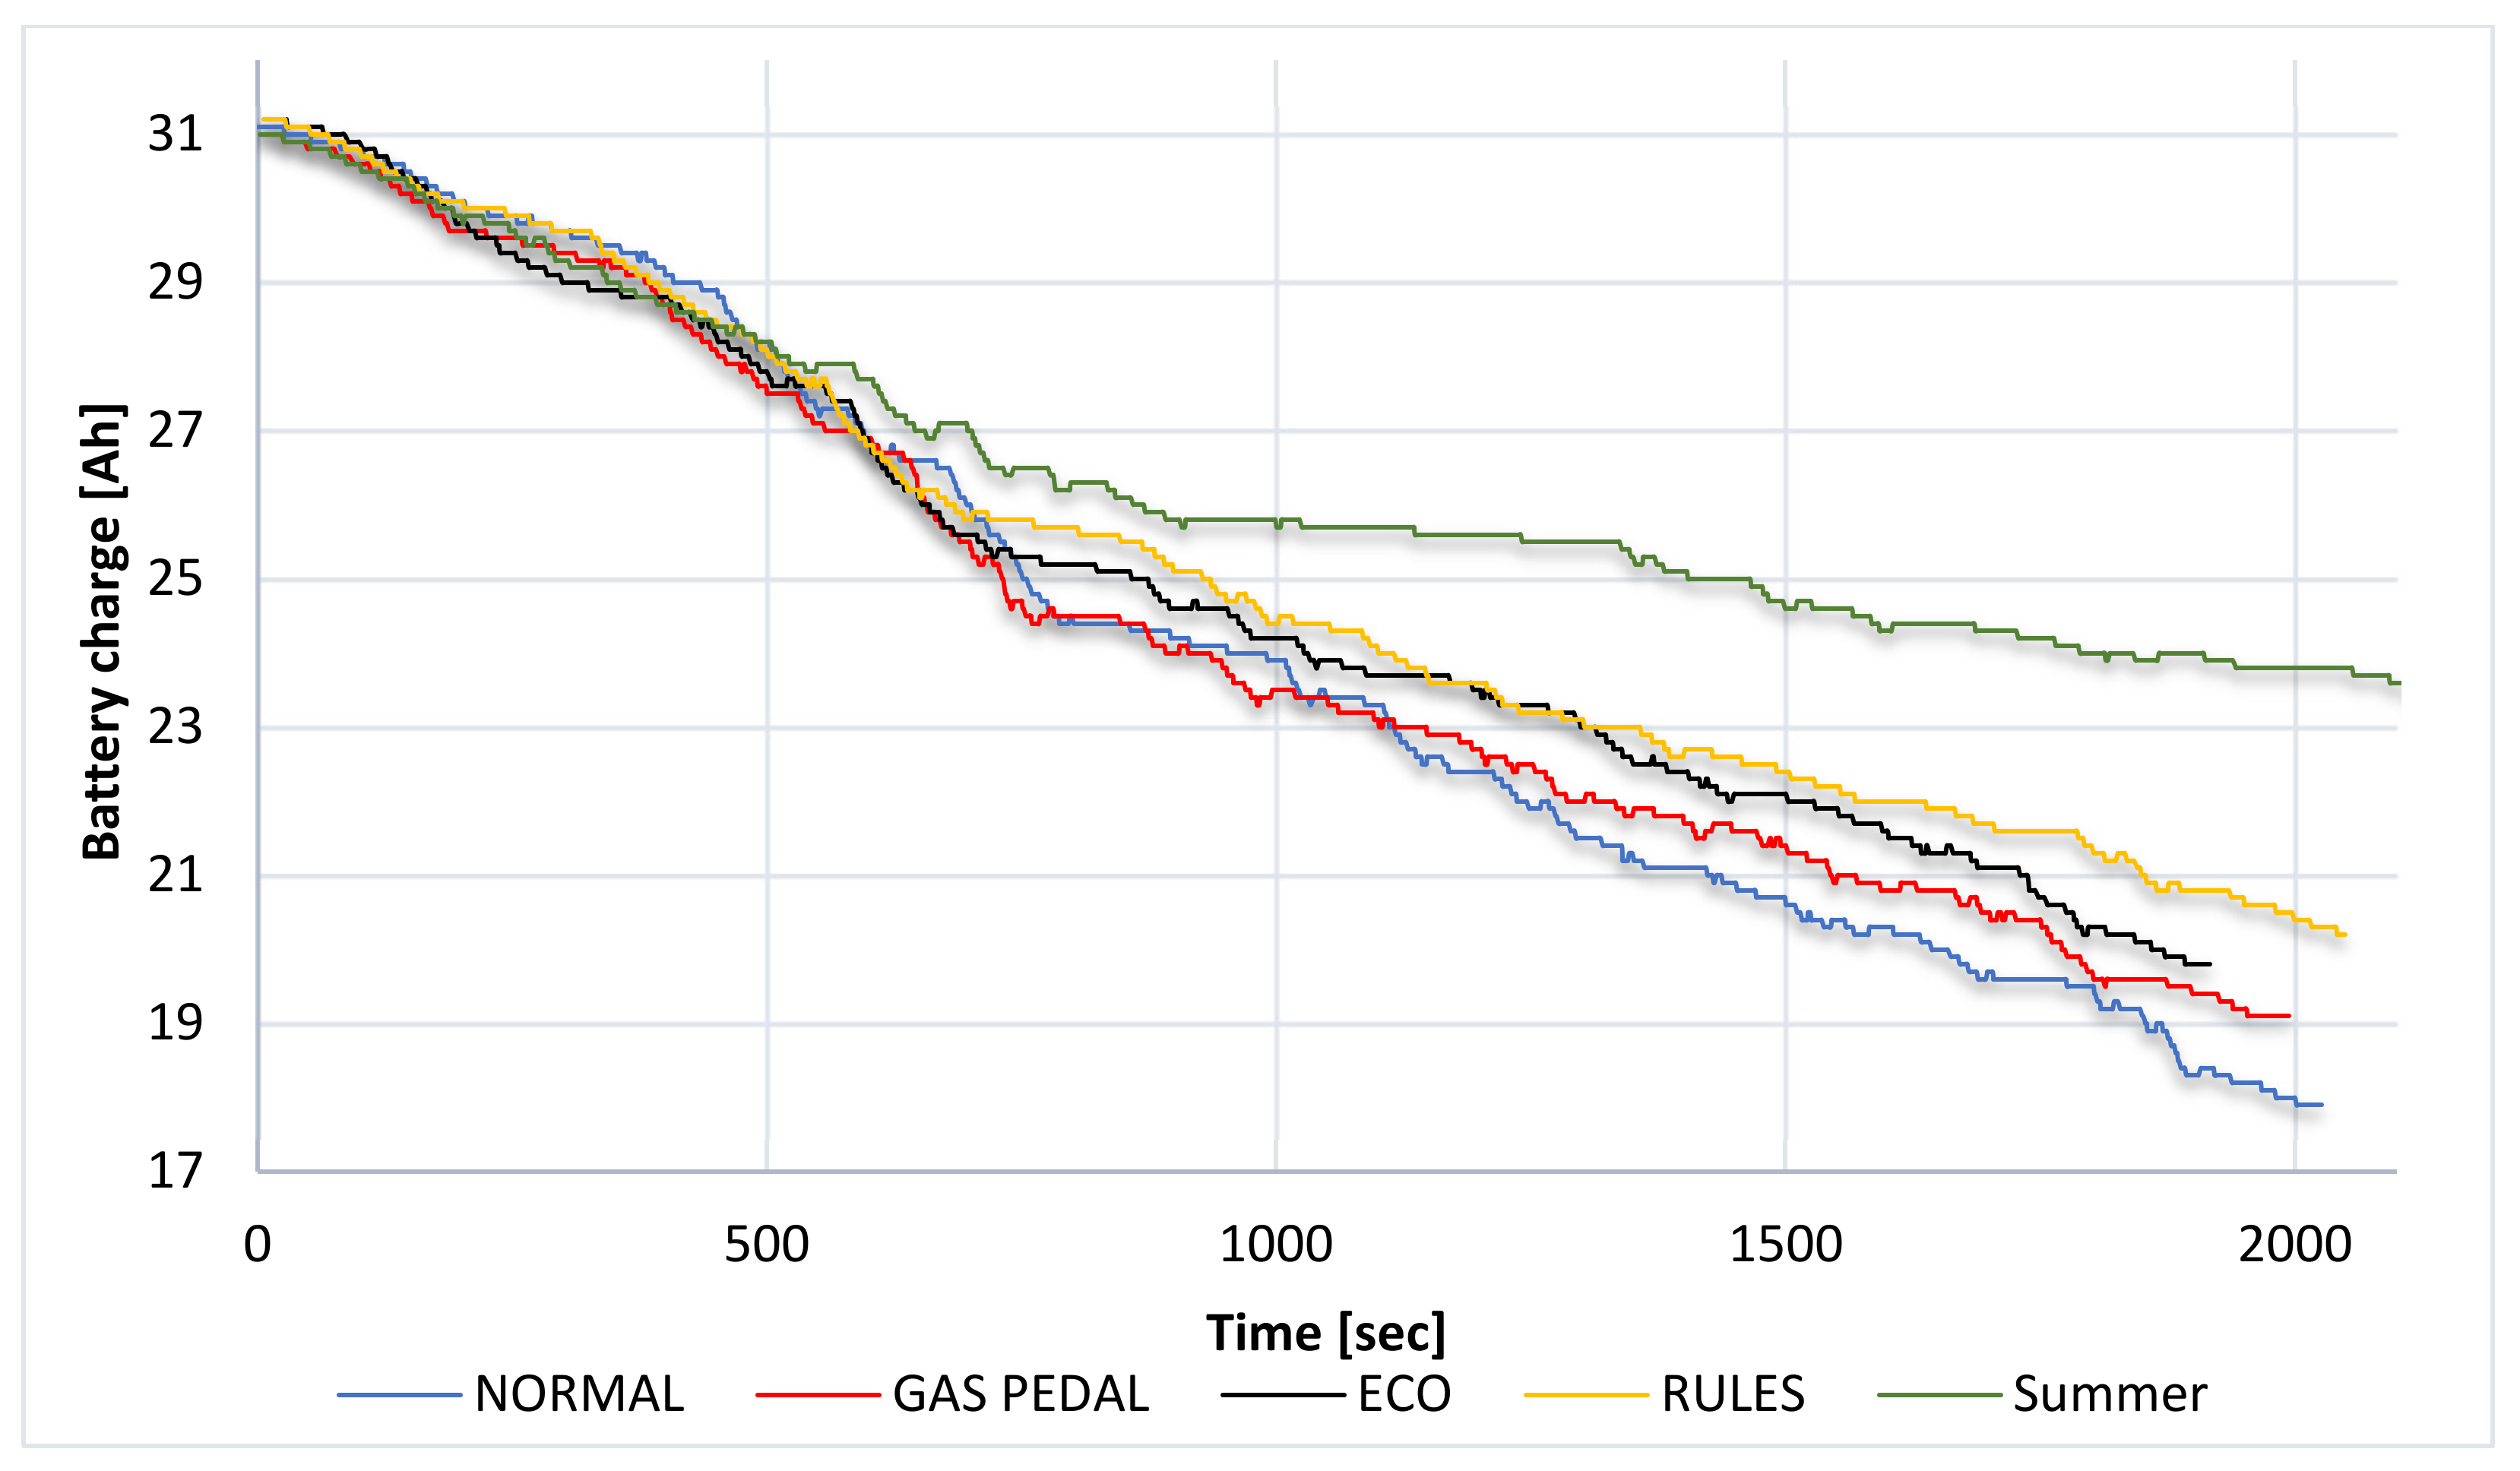
While examining the range of electric vehicles, an important parameter is the loss of the battery’s capacity after travelling over a certain distance. In the tests, the loss was between 10.8 Ah and 12.9 Ah. The decrease in battery capacity is shown in the example of Figure 4. During the runs, a part of the capacity was also recovered, and depending on the driving technique applied, it was between 1.2 Ah and 2.2 Ah. The lowest value of the consumed battery capacity was obtained for the “summer” mode. It was 7.9 Ah. In this mode, the recovery of electricity was similar to the “eco” mode and amounted to 1.5 Ah. Based on the road tests carried out, it can be concluded that the most effective energy recovery is represented by the “pedal gas” mode. Nevertheless, it did not guarantee the best results in terms of battery capacity loss, intensity of the braking process and fuel consumption by the internal combustion engine. Fuel consumption is the highest for the “normal” and “pedal gas” modes. Based on the obtained data, zero chemical energy consumption from fuel was obtained in the “summer” mode. For this mode, the lowest value of the average energy consumption during the test is also recorded. The value of this parameter is 18.0 kWh/100 km. Positive results were also obtained for the drive in the “summer” mode and the “rules” mode. The average value of energy consumption over time for this mode does not exceed 24.0 kWh/100 km. The above parameters show the ability to generate reusable energy. The average power recovered during regenerative braking was between 6.3 kW for driving in accordance with the regulations and 8.5 kW for the “normal” driving technique. The most appealing parameter and, at the same time, a measurable indicator for the use of a particular driving technique is the average energy consumption per 100 km. During the tests, the consumption varied from 24 kW/100 km to 28 kW/100 km. Based on the road tests carried out, it can be concluded that the average recuperative braking power is the highest for the “normal” mode. It amounts to 8.5 kW. For “rules” and “summer” modes, the average recuperative braking power ranged from 6.2 to 6.3 kW. The other modes are within the accepted range of maximum and minimum values. In connection with the adopted data, it can be concluded that the average power of regenerative braking does not always indicate energy gains and an increase in range. This is due to the fact that the greatest range was obtained for the “summer” and “rules” modes, despite the lowest braking energy recovery value.
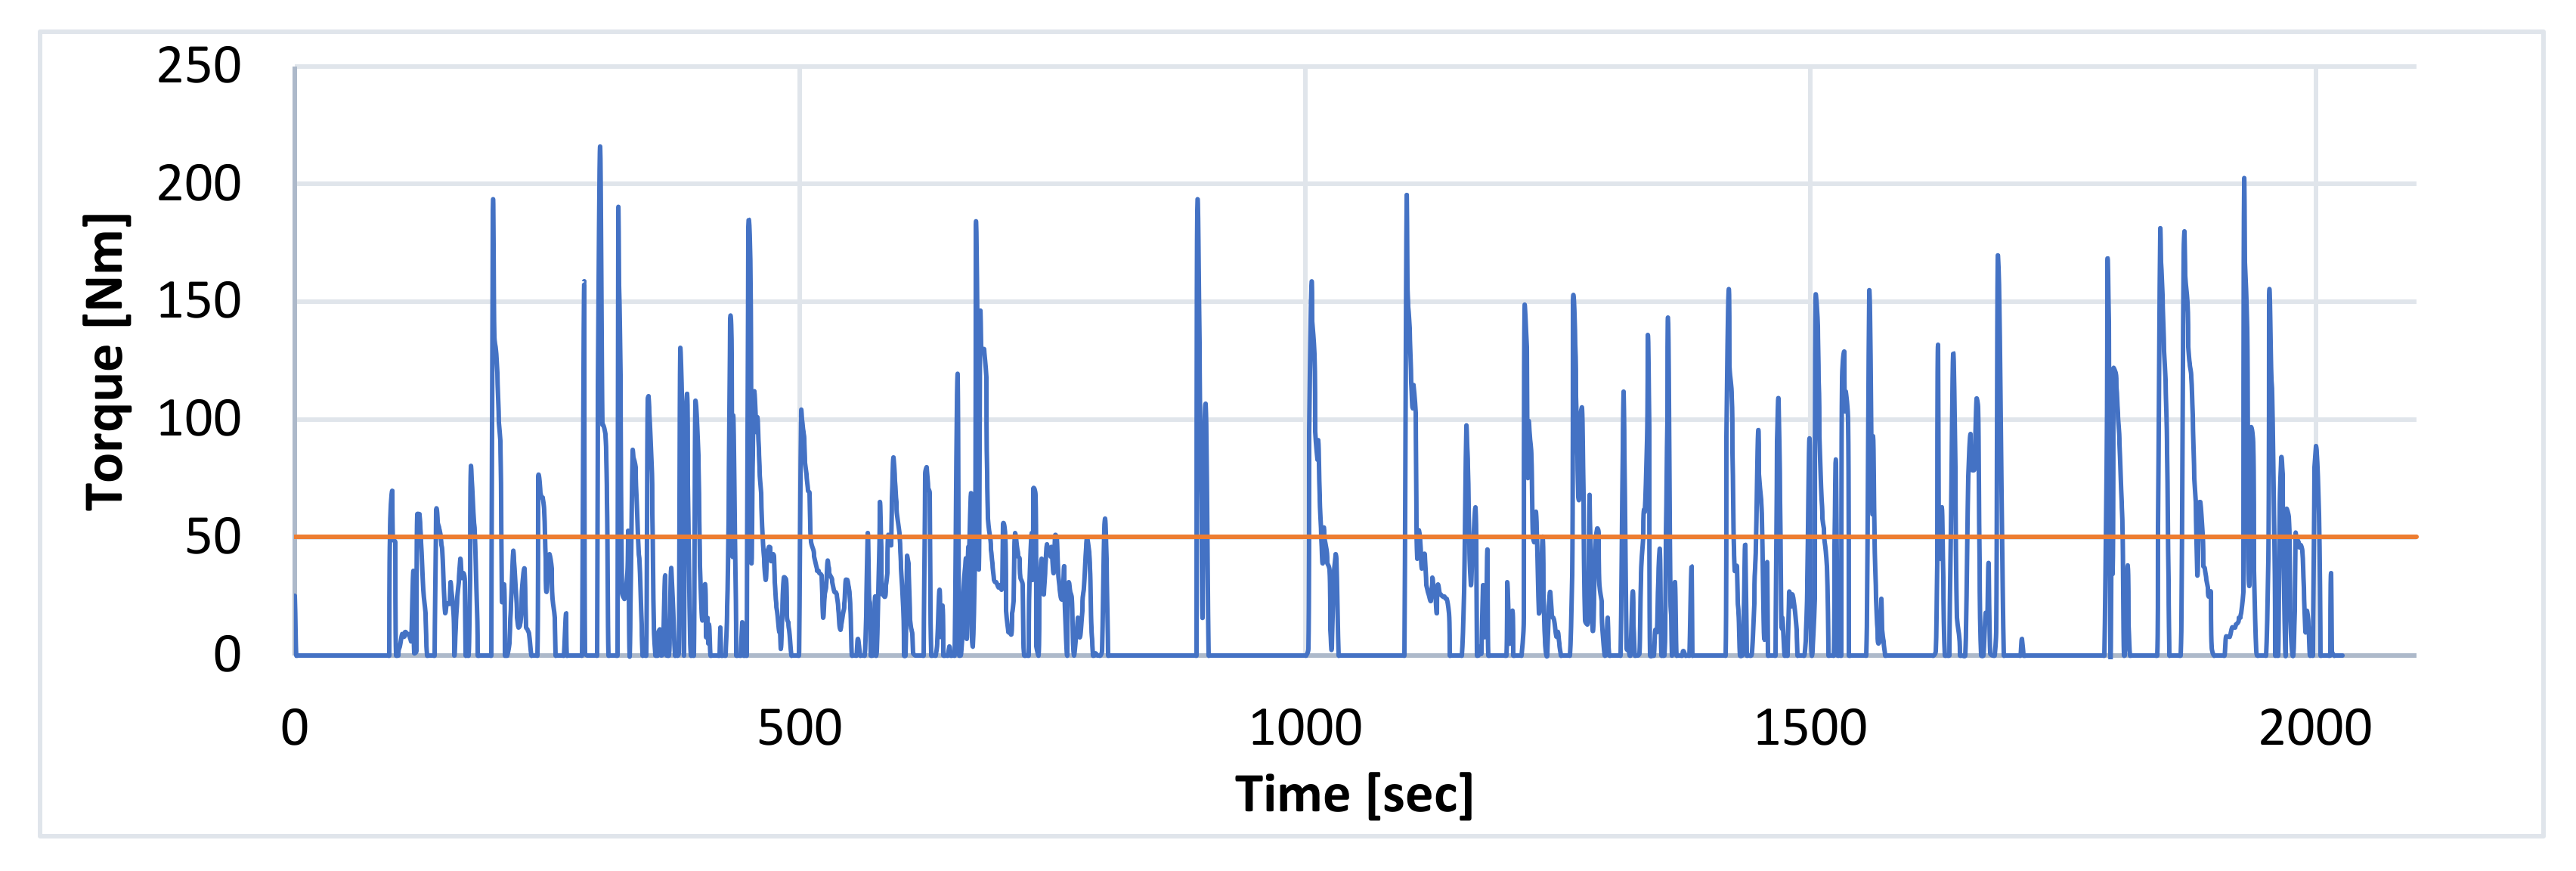
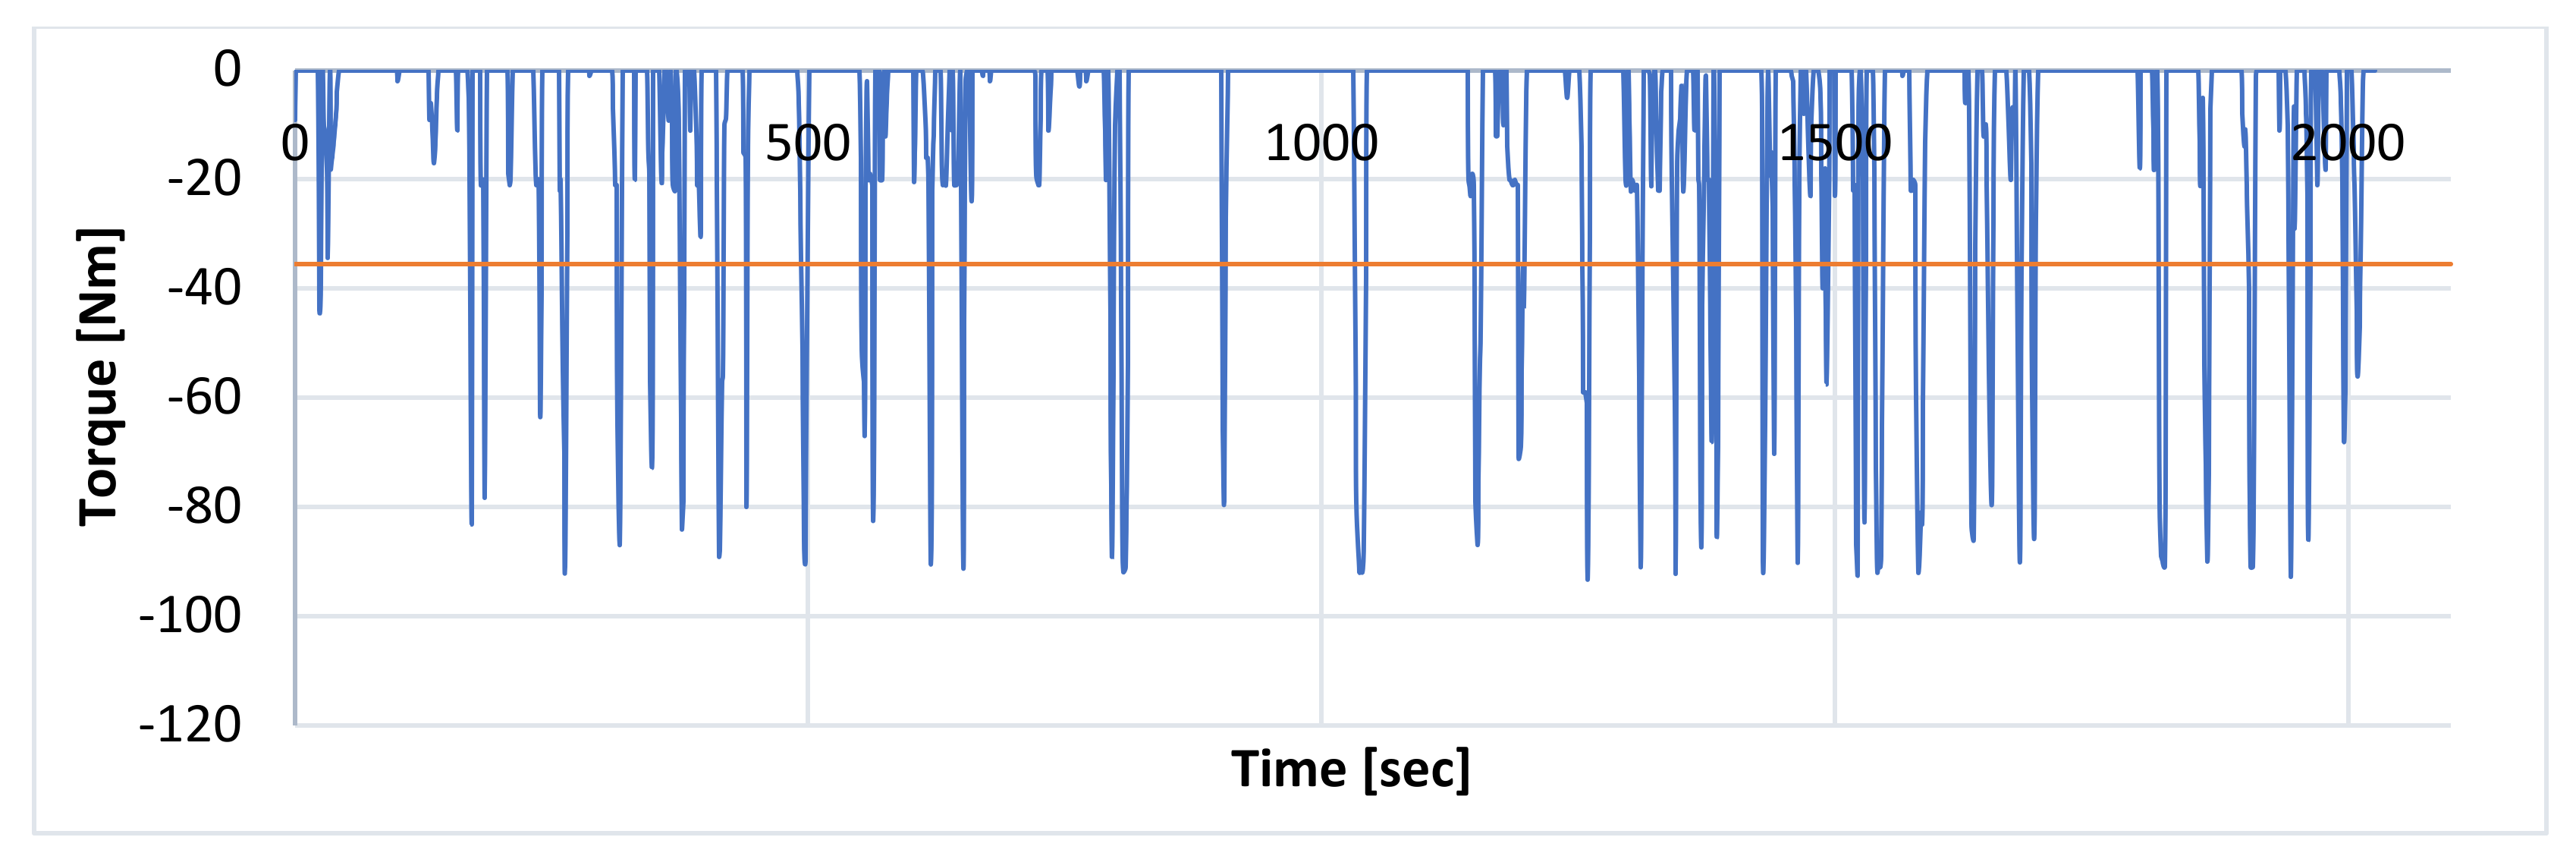
The observation of the powertrain during the test runs shows differences between the different driving techniques. The differences reach 20% between the extreme torque values generated by both engines in “normal” and “eco” drive modes, respectively, 51.9 Nm and 41.4 Nm. When braking with electric motors, braking torques were from −31.8 Nm (“Eco”) to 40.4 Nm (“pedal gas”). Examples of characteristics are shown in Figure 5 and Figure 6. For the “summer” mode, the results of the average driving torque were similar to the “rules” and “eco” modes.
When analyzing the energy consumption of the Mitsubishi Outlander Hybrid, the fuel consumption by the combustion engine must not be forgotten. Although due to a low ambient temperature, the combustion engine started to heat the coolant to a certain temperature, it used petrol as well. According to the manufacturer, when the ambient temperature falls below 5 °C, the control unit starts the engine in order to heat the coolant to 60 °C [37]. This is less energy-consuming than the use of an electric heater. Thus, fuel used during the tests varied from 0.7 L/100 km to 1.4 L/100 km, and it directly depended on the ambient temperature. During the tests, the combustion engine started to heat the liquid only. It is demonstrated by the recorded generator power values, which during all tests were equal to 0 kW. To highlight the differences and indicate energy savings from a driving technique, the values of the three parameters are collated in the table below. These parameters are the average values for all tests, i.e., the gain in the range as indicated by the on-board computer in km, remaining battery capacity in Ah after the test, and the difference in the vehicle power consumption in kW/100 km. In the “summer” mode, the failure to switch on the electric motor is registered. This is an interesting reference to the other driving modes. Assuming the above data, it can be concluded that the use of SUVs with a 4 × 4 drive in the summer period allows one to reduce fuel consumption to zero and significantly increase the range of the vehicle. This is mainly due to the lack of need to heat the liquid for heating the interior of the vehicle. The “summer” mode allows to present the realistically achievable maximum range for this type of vehicle. It is significantly larger than the other modes. By using the “rules” or “eco” driving technique in the “summer” mode, it will allow one to achieve significant effects in the form of energy benefits.
Valuable scientific information is the fact that resignation from the vehicle heating systems increases its range by 41.3%, and the energy consumption per 100 km decreases by 35.7%. This is especially true for the “summer” mode.
Table 5 shows the difference between the normal and the other driving techniques analyzed.
4. Conclusions
Plans for the development of electromobility in Poland have provided incentives to expand knowledge about low-carbon vehicles offered on the Polish market [38]. So far, research in this area has focused on technological issues (description of PHEV technology) or environmental aspects (comparison of CO2 emission levels) [39,40,41,42,43,44]. This study is a new economic approach on the use of PHEVs in urban traffic. It indicates which driving techniques and which vehicle systems the driver can use to reduce the vehicle’s energy consumption and therefore its operating costs. Data are based on a developed experimental system and information from users of class SUV PHEVs operated in the urban mode. The method used for measurement data conversion may be also used in other studies. The results show how systems fitted to the vehicle can be used to reduce the energy consumption. Approximate data from both types of tests indicate how the energy management system can be optimized and which limitations need to be introduced to achieve the maximum durability and efficiency of the main batteries [44,45,46,47]. The hypothesis of the work confirmed that the driving style is the main factor influencing the strategy of using the vehicle in the economic aspect. This criterion does not only depend on the environment in which the vehicle is moving. The driving style has energy for the essential functional aspects which determine the energy consumption of the accumulator and recuperative unit. This parameter is mainly decided by the user. In particular, it concerns the acceleration value and the time of the impact of aerodynamic drag. It is also reflected in the braking frequency and the efficiency of the energy recuperation system. In addition, the driving style affects the frequency of periodic and aperiodic faults, and this significantly reduces the profitability of using hybrid vehicles. Therefore, it can be assumed that taking into account these conditions and programming certain habits among users may contribute to a significant reduction in energy consumption.
On the basis of the conducted experimental studies, the following conclusions can be presented:
- The “eco” and “rules” driving modes are characterized by the lowest electricity consumption at low ambient temperatures with switched-on air conditioning systems.
- According to the data on electric energy feedback from braking, it is stated that not always a large share of this process translates into a significant increase in range, which can be seen on the basis of data from the “eco” and “rules” modes.
- Using the “rules” driving mode, one can achieve a reduction in energy consumption of 14.3% and an increase in the battery capacity for a given schedule by 16.3%. This allows one to increase the effective range in relation to the “normal” mode by 12.2%.
- Driving in the “pedal gas” mode is not a promising driving technique where energy savings are recommended, indirect but not very dynamic driving mode is the “eco” system, which allows for a 9.3% reduction in energy consumption compared to the “normal” mode. This mode allows one to keep driving dynamics more like in the “rules” mode.
- The “summer” mode turns out to be the most advantageous driving mode. It allows one to increase the range by over 41% and reduce the energy consumption by over 35% compared to the “normal” mode. The “summer” mode in combination with the “rules” mode allows one to achieve very good results in terms of increased energy consumption and loss of battery capacity for the same road journeys. Based on the data from the “summer” mode, it can be assumed that the ambient temperature, which was 21 °C, plays an important role in saving energy. In this operating temperature range, air conditioning systems are turned off and the combustion engine is not turned on. This allows one to maximize the range of the vehicle in electric mode and reduce the consumption of conventional fuel to zero.
- On the basis of the tests carried out, it can be said that the energy consumption of the vehicle is not largely influenced by the nature of the route, but by the style of driving the vehicle through the driver. This means that the effects of energy consumption are mainly influenced by the driver and the systems used by the manufacturer are only systems supporting the driver. It is the driver who decides how to increase the range of the vehicle using a given driving technique.
Author Contributions
Conceptualization, methodology, validation, formal analysis, investigation, writing original draft: P.W., J.K., W.D. and J.J.; visualization: P.W., J.K.; writing—review and editing, supervision: P.W., J.K., W.L.; project administration: J.K., P.W., W.L., W.D. and J.J. All authors have read and agreed to the published version of the manuscript.
Funding
This research is funded by University of Szczecin; Research Center for Management of Energy Sector, Institute of Management, Cukrowa Street 8, 71-004 Szczecin, Poland.
Institutional Review Board Statement
Not applicable.
Informed Consent Statement
Not applicable.
Data Availability Statement
Not applicable.
Conflicts of Interest
The authors declare no conflict of interest.
References
- Bubna, P.; Wiseman, M. Impact of light-weight design on manufacturing cost—A review of BMW i3 and Toyota Corolla Body Components; Technical Report; SAE Technical Paper. In Proceedings of the SAE World Congress and Exhibition, Detroit, MI, USA, 12–14 April 2016. [Google Scholar]
- Seyfried, P.; Taiss, E.J.M.; Calijorne, A.C.; Li, F.P.; Song, Q.F. Light weighting opportunities and material choice for commercial vehicle frame structures from a design point of view. Adv. Manuf. 2015, 3, 19–26. [Google Scholar] [CrossRef] [Green Version]
- Agarwal, A.K.; Srivastava, D.K.; Dhar, A.; Maurya, R.K.; Shukla, P.C.; Singh, A.P. Effect of fuel injection timing and pressure on combustion, emissions and performance characteristics of a single cylinder diesel engine. Fuel 2013, 111, 374–383. [Google Scholar] [CrossRef]
- Sajjad, H.; Masjuki, H.; Varman, M.; Kalam, M.; Arbab, M.; Imtenan, S.; Rahman, S.A. Engine combustion, performance and emission char-acteristics of gas to liquid (GTL) fuels and its blends with diesel and bio-diesel. Renew. Sustain. Energy Rev. 2014, 30, 961–986. [Google Scholar] [CrossRef] [Green Version]
- Kong, S.C.; Marriott, C.D.; Reitz, R.D.; Christensen, M. Modeling and experiments of hcci engine combustion using detailed chemical kinetics with multidimensional cfd; Technical Report; SAE Technical Paper. In Proceedings of the SAEWorld Congress, Detroit, MI, USA, 5–8 March 2001. [Google Scholar]
- Chen, L.; Zhang, J.; Li, Y.; Ye, Y. Mechanism analysis and evaluation methodology of regenerative braking contribution to energy efficiency improvement of electrified vehicles. Energy Convers. Manag. 2015, 92, 469–482. [Google Scholar]
- Koetse, M.J.; Hoen, A. Preferences for alternative fuel vehicles of company car drivers. Resour. Energy Econ. 2014, 37, 279–301. [Google Scholar] [CrossRef]
- Lee, S.; Speight, J.G.; Loyalka, S.K. Handbook of Alternative Fuel Technologies; CRC Press: Boca Raton, FL, USA, 2014. [Google Scholar]
- Hu, X.; Murgovski, N.; Johannesson, L.M.; Egardt, B. Comparison of three electrochemical energy buffers applied to a hybrid bus powertrain with simultaneous optimal sizing and energy management. IEEE Trans. Intell. Transp. Syst. 2014, 15, 1193–1205. [Google Scholar] [CrossRef]
- Lv, C.; Zhang, J.; Li, Y.; Yuan, Y. Directional-stability-aware brake blending control synthesis for over-actuated electric vehicles during straight-line deceleration. Mechatronics 2016, 38, 121–131. [Google Scholar] [CrossRef]
- Sockeel, N.; Shi, J.; Shahverdi, M.; Mazzola, M. Sensitivity analysis of the battery model for model predictive control implemented into a plug-in hybrid electric vehicle. In Proceedings of the 2017 IEEE Transportation Electrification Conference and Expo, Chicago, IL, USA, 22–24 June 2017; pp. 493–500. [Google Scholar]
- Zhang, J.; Lv, C.; Gou, J.; Kong, D. Cooperative control of regenerative braking and hydraulic braking of an electrified passenger car. Proc. Inst. Mech. Eng. Part D J. Automob. Eng. 2012, 226, 1289–1302. [Google Scholar] [CrossRef]
- Heutel, G.; Muehlegger, E. Consumer learning and hybrid vehicle adoption. Environ. Resour. Econ. 2015, 62, 125–161. [Google Scholar] [CrossRef] [Green Version]
- Shabbir, W.; Evangelou, S.A. Real-time control strategy to maximize hybrid electric vehicle powertrain efficiency. Appl. Energy 2014, 135, 512–522. [Google Scholar] [CrossRef]
- Škugor, B.; Deur, J.; Cipek, M.; Pavkovic, D. Design of a power-split hybrid electric vehicle control system utilizing a rule-based controller and an equivalent consumption minimization strategy. Proc. Inst. Mech. Eng. Part D J. Automob. Eng. 2014, 228, 631–648. [Google Scholar] [CrossRef]
- Zou, Y.; Hou, S.; Li, D.; Gao, W.; Hu, X.S. Optimal energy control strategy design for a hybrid electric vehicle. Discret. Dyn. Nat. Soc. 2013, 2013, 132064. [Google Scholar] [CrossRef]
- Li, Y.; Lu, X.; Kar, N.C. Rule-based control strategy with novel parameters optimization using NSGA-II for power-split PHEV operation cost minimization. IEEE Trans. Veh. Technol. 2014, 63, 3051–3061. [Google Scholar] [CrossRef]
- Sim, K.; Jeong, H.; Kim, D.R.; Lee, T.K.; Han, K.; Hwang, S.H. Control strategy with the slope of SOC trajectory for plug-in diesel hybrid electric vehicle with dual clutch transmission. In Proceedings of the 25th International Electric Vehicle Symposium and Exhibition (EVS28), Koyang, Korea, 3–6 May 2015. [Google Scholar]
- Lian, J.; Liu, S.; Li, L.; Liu, X.; Zhou, Y.; Yang, F.; Yuan, L. A mixed logical dynamical-model predictive control (MLD-MPC) energy management control strategy for plug-in hybrid electric vehicles (PHEVs). Energies 2017, 10, 74. [Google Scholar] [CrossRef]
- Berthold, F.; Ravey, A.; Blunier, B.; Bouquain, D.; Williamson, S.; Miraoui, A. Design and development of a smart control strategy for plug-in hybrid vehicles including vehicle-to-home functionality. IEEE Trans. Transp. Electr. 2015, 1, 168–177. [Google Scholar] [CrossRef]
- Tribioli, L.; Barbieri, M.; Capata, R.; Sciubba, E.; Jannelli, E.; Bella, G. A real time energy management strategy for plug-in hybrid electric vehicles based on optimal control theory. Energy Procedia 2014, 45, 949–958. [Google Scholar] [CrossRef]
- Millo, F.; Rolando, L.; Fuso, R. Real world operation of a complex plug-in hybrid electric vehicle: Analysis of its CO2 emissions and operating costs. Energies 2014, 7, 4554–4570. [Google Scholar] [CrossRef] [Green Version]
- Chen, Y.; Hu, K.; Zhao, J.; Li, G.; Johnson, J.; Zietsman, J. In-use energy and CO2 emissions impact of a plug-in hybrid and battery electric vehicle based on real-world driving. Int. J. Environ. Sci. Technol. 2018, 15, 1001–1008. [Google Scholar] [CrossRef]
- Lane, B.W.; Dumortier, J.; Carley, S.; Siddiki, S.; Clark-Sutton, K.; Graham, J.D. All plug-in electric vehicles are not the same: Predictors of preference for a plug-in hybrid versus a battery-electric vehicle. Transp. Res. Part D 2018, 65, 1–13. [Google Scholar] [CrossRef] [Green Version]
- Williams, B.; Martin, E.; Lipman, T.; Dammen, D. Plug-in-hybrid vehicle use, energy consumption, and greenhouse emissions: An analysis of household vehicle placements in Northern California. Energies 2011, 4, 435–457. [Google Scholar] [CrossRef] [Green Version]
- Karbowski, D.; Rousseau, A.; Pagerit, S.; Sharer, P. Plug-in vehicle control strategy: From global optimization to real time application. In Proceedings of the 22nd Electric Vehicle Symposium, Japan Automobile Research Institute, EVS22, Yokohama, Japan, 22–28 October 2006. [Google Scholar]
- Jefferson, C.M.; Barnard, R.H. Hybrid Vehicle Propulsion; WIT Press: Billerica, MA, USA, 2002. [Google Scholar]
- Kupiec, J.; Kupiec, A. Automotive Monthly for vehicle repairers and testers. Badanie Hybryd w SKP 2013, 9, 20–23. [Google Scholar]
- Fan, H.; Peng, J.; He, H. Rule-based plug-in hybrid school bus energy management control strategy simulation. In Proceedings of the 10th Asian Control Conference (ASCC), Kota Kinabalu, Malaysia, 31 May–3 June 2015; pp. 1–6. [Google Scholar]
- Shen, X.; Zhang, J.; Shen, T. Real-time scenario-based stochastic optimal energy management strategy for HEVs. In Proceedings of the 2016 European Control Conference (ECC), Ålborg, Denmark, 29 June–1 July 2016; pp. 631–636. [Google Scholar]
- Markey, J. Federal Test Procedure Review Project: Preliminary Technical Report; EPA 420-R-93–007; USA Environmental Protection Agency: Ann Arbor, MI, USA, 1993.
- Bast, H.; Delling, D.; Goldberg, A.; Muller-Hannemann, M.; Pajor, T.; Sanders, P.; Wagner, D.; Werneck, R.F. Route planning in transportation networks. In Algorithm Engineering; Springer: Berlin/Heidelberg, Germany, 2016; pp. 19–80. [Google Scholar]
- Letchner, J.M.; Krumm, J.C.; Horvitz, E.J. Collaborative Route Planning for Generating Personalized and Context-Sensitive Routing Recommendations. U.S. Patent 8,718,925, 6 May 2014. [Google Scholar]
- Kupiec, J.; Ślaski, G.; Pikosz, H. Parametry pracy układu hamulców samochodu osobowego w badaniach eksperymentalnych, czasopismo Autobusy. Tech. Eksploat. Syst. Transp. 2018, 12, 500–507. [Google Scholar]
- Ohde, B.; Ślaski, G.; Maciejewski, M. Statistical analysis of real-world urban driving cycles for modeling Energy consumption of electric vehicles. J. Mech. Transp. Eng. 2016, 68, 25–39. [Google Scholar] [CrossRef]
- Ślaski, G.; Ohde, B.; Pikosz, H. Modelowanie energochłonności eksploatacji samo-chodu elektrycznego w warunkach ruchu miejskiego dla potrzeb symulacji zużycia energii przez flotę taksówek. Logistyka 2014, 4, 2517–2526. [Google Scholar]
- Mitsubishi Outlander PHEV MY 2014, Owner’s Manual, Mitsubishi Motors Coroporation 2013. Available online: http://mmc-manuals.ru/manuals/outlander_iii/online/Service_Manual_2013/2014 (accessed on 12 December 2020).
- Drożdż, W.; Radziński, M.; Mathews, A. The role of DSOs in the development of reaching points for electric vechicles. In Electromobility as a Megatrend of Contemporary Economy, 1st ed.; Drożdż, W., Ed.; Polish Scientific Publishers PWN: Warsaw, Poland, 2021; pp. 27–33. [Google Scholar]
- Palkowski, K. Electric car and atmosphere protection. Ann. Set Environ. Prot. 2016, 18, 628–639. [Google Scholar]
- Kopczyński, A.; Krawczyk, P.; Lasocki, J. Parameters selection of extended-range electric vehicle supplied with alternative fuel. E3S Web Conf. 2018, 44, 00073. [Google Scholar] [CrossRef] [Green Version]
- Tucki, K.; Orynycz, O.; Swić, A.; Mitoraj-Wojtanek, M. The development of electromobility in Poland and EU states as a tool for management of CO2 emissions. Energies 2019, 12, 2942. [Google Scholar] [CrossRef] [Green Version]
- Tucki, K.; Orynycz, O.; Mitoraj-Wojtanek, M. Perspectives for mitigation of CO2 Emission due to development of electromobility in several countries. Energies 2020, 13, 4127. [Google Scholar] [CrossRef]
- Wróblewski, P.; Iskra, A. Problems of Reducing Friction Losses of a Piston-Ring-Cylinder Configuration in a Combustion Piston Engine with an Increased Isochoric Pressure Gain; SAE Technical Paper 2020-01-2227; SAE International USA. In Proceedings of the SAE Powertrains, Fuels & Lubricants Meeting, Krakow, Poland, 22–24 September 2020. [Google Scholar] [CrossRef]
- Wróblewski, P. The effect of the distribution of variable characteristics determining the asymmetry of the sealing rings sliding surfaces on the values of friction loss coefficients and other selected parameters of oil film, VII International Congress on Combustion Engines. Combust. Engines 2017, 171, 107–116. [Google Scholar] [CrossRef]
- Wróblewski, P. Technology for Obtaining Asymmetries of Stereometric Shapes of the Sealing Rings Sliding Surfaces for Selected Anti-Wear Coatings; SAE Technical Paper 2020-01-2229; SAE International USA. In Proceedings of the SAE Powertrains, Fuels & Lubricants Meeting, Krakow, Poland, 22–24 September 2020. [Google Scholar] [CrossRef]
- Wróblewski, P.; Drożdż, W.; Lewicki, W.; Dowejko, J. Total cost of ownership and its potential consequences for the development of the hydrogen fuel cell powered vehicle market in Poland. Energies 2021, 14, 2131. [Google Scholar] [CrossRef]
- Wróblewski, P.; Drożdż, W.; Lewicki, W.; Miązek, P. Methodology for assessing the impact of aperiodic phenomena on the energy balance of propulsion engines in vehicle electromobility systems for given areas. Energies 2021, 14, 2314. [Google Scholar] [CrossRef]
- Berckmans, G.; Messagie, M.; Smekens, J.; Omar, N.; Vanhaverbeke, L.; Van Mierlo, J. Cost projection of state of the art lithium-ion batteries for electric vehicles up to 2030. Energies 2017, 10, 1314. [Google Scholar] [CrossRef] [Green Version]
Figure 1.
Speed profile for the test run in traffic and the “Normal” mode.

Figure 2.
Speed profile for the test run “Rules”.

Figure 3.
Acceleration values in the “eco” mode with highlighted average values for braking and acceleration.
Figure 3.
Acceleration values in the “eco” mode with highlighted average values for braking and acceleration.

Figure 4.
Battery capacity changes in “eco” mode.

Figure 5.
Changes in the total driving torque with the average value marked for “eco” driving.

Figure 6.
Variation in the total braking torque generated by electric motors with the average value marked for “eco” driving.
Figure 6.
Variation in the total braking torque generated by electric motors with the average value marked for “eco” driving.


Table 1.
Mitsubishi Outlander PHEV powertrain operation modes [37].
Table 1.
Mitsubishi Outlander PHEV powertrain operation modes [37].
| EV Mode | Series Mode |
|---|---|
 |  |
| Paralel Mode | Regeneration Mode |
 |  |
Table 2.
Technical parameters of the vehicle intended for experimental research.
| Parameter | Value |
|---|---|
| Own weight | 1871 kg |
| Mass during tests | 2000 kg |
| Maximum load on the front axle | 1160 kg |
| Maximum load on the rear axle | 1255 kg |
| Internal combustion engine capacity | 1998 cm3 |
| Internal combustion engine power | 89 kW |
| Driving torque IC | 190 Nm |
| The power of the electric motor that drives the front axle | 60 kW |
| Drive torque of the electric motor driving the front axle | 137 Nm |
| The power of the electric motor driving the rear axle | 60 kW |
| The driving torque of the electric motor driving the rear axle | 197 Nm |
| Traction battery capacity | 40 Ah |
| Traction battery voltage | 300 V |
| Tires | 215/70 R16 |
Table 3.
Average test results. Green and yellow are used to mark maximum and minimum values, respectively.
Table 3.
Average test results. Green and yellow are used to mark maximum and minimum values, respectively.
| No | Parameter | Unit | Normal [σ] | Gas Pedal [σ] | Eco [σ] | Rules [σ] | Summer [σ] |
|---|---|---|---|---|---|---|---|
| 1 | Ambient temperature | °C | −0.7 [2.3] | 2.0 [1] | 1.7 [3.8] | 1.7 [1.2] | 21 [0] |
| 2 | Distance covered | km | 13.9 [0.1] | 13.9 [0.1] | 13,9 [0] | 13.9 [0] | 13.9 [0] |
| 3 | Travelling time | min:sec | 34:20 [01:23] | 35:18 [02:21] | 32:23 [02:18] | 34:42 [02:03] | 38:34 [01:01] |
| 4 | Stationary | % | 30.92 [1.4] | 28.6 [4.6] | 26.1 [5.6] | 24.6 [1.6] | 31.4 [3] |
Table 4.
Mean values from the test runs, green is used to mark maximum values and yellow to mark minimum values. Data for the road test. These values are calculated as approximate and predicted—based on the road tests carried out.
Table 4.
Mean values from the test runs, green is used to mark maximum values and yellow to mark minimum values. Data for the road test. These values are calculated as approximate and predicted—based on the road tests carried out.
| Data for the Road Test Mitsubishi Outlander PHEV | |||||||
|---|---|---|---|---|---|---|---|
| No. | Parameter | Unit | Normal [σ] | Gas Pedal [σ] | Eco [σ] | Rules [σ] | Summer [σ] |
| 1 | Average speed | km/h | 25.0 [0.3] | 24.4 [1.2] | 26.5 [1.5] | 24.3 [1.5] | 21.9 [0.1] |
| 2 | Top speed | km/h | 78 [2] | 74.3 [6.7] | 74 [3.5] | 66 [0] | 66 [0] |
| 3 | Glide time | % | 2.5 [0.5] | 2.9 [0.5] | 2.1 [0.4] | 2.4 [0.4] | 2.8 [0.4] |
| 4 | Average acceleration value | m/s2 | 0.75 [0.03] | 0.72 [0] | 0.65 [0.02] | 0.69 [0.04] | 0.70 [0.02] |
| 5 | Average deceleration on breaking | m/s2 | −0.83 [0.03] | −0.75 [0.09] | −0.72 [0.03] | −0.74 [0.03] | −0.73 [0.05] |
| 6 | Loss of range according to computer indications | km | 21.3 [1.2] | 20.7 [0.6] | 19.7 [0.6] | 18.7 [0.6] | 12.5 [0.7] |
| 7 | Used battery capacity | Ah | 12.9 [0.3] | 12.0 [0.1] | 11.6 [0.8] | 10.8 [0.7] | 7.9 [0.5] |
| 8 | Capacity recovered during the test | Ah | 1.8 [0.5] | 2.2 [0.3] | 1.5 [0.4] | 1.2 [0.3] | 1.5 [0.1] |
| 9 | Average EV energy consumption in test | kWh/100 km | 28.0 [0.9] | 26.3 [0.4] | 25.4 [1.8] | 24.0 [1.5] | 18.0 [1] |
| 10 | Petrol consumption by the internal combustion engine | L/100 km | 1.4 [0] | 1.4 [0] | 0.9 [0.7] | 0.7 [0.8] | 0 [0] |
| 11 | Average recovery braking power | kW | 8.5 [0.7] | 8.0 [1.2] | 7.2 [0.5] | 6.3 [0.3] | 6.2 [0.5] |
| 12 | Average drive torque | Nm | 51.9 [2.9] | 50.2 [2.3] | 41.4 [1.5] | 42.7 [1.5] | 41.79 [1.26] |
| 13 | Average braking torque of EV engines | Nm | −35.3 [1.2] | −40.4 [0.4] | −31.8 [1.4] | −34.9 [0.3] | −34.87 [2.11] |
Table 5.
Average values of the test run parameters in relation to the normal driving mode.
| No. | Parameter | Unit | Gas Pedal | Eco | Rules | Summer |
|---|---|---|---|---|---|---|
| 1 | Gain as indicated by the on-board computer | km | 0.6 (2.8%) | 1.6 (7.5%) | 2.6 (12.2%) | 8.8 (41.3%) |
| 2 | Remaining battery capacity | Ah | 0.9 (7%) | 1.5 (11.6%) | 2.1 (16.3%) | 5.0 (38.8%) |
| 3 | Reduction of average energy consumption | kW/100 km | 1.7 (6.1%) | 2.6 (9.3%) | 4.0 (14.3%) | 10.0 (35.7%) |
Publisher’s Note: MDPI stays neutral with regard to jurisdictional claims in published maps and institutional affiliations. |
© 2021 by the authors. Licensee MDPI, Basel, Switzerland. This article is an open access article distributed under the terms and conditions of the Creative Commons Attribution (CC BY) license (https://creativecommons.org/licenses/by/4.0/).
Share and Cite
MDPI and ACS Style
Wróblewski, P.; Kupiec, J.; Drożdż, W.; Lewicki, W.; Jaworski, J. The Economic Aspect of Using Different Plug-In Hybrid Driving Techniques in Urban Conditions. Energies 2021, 14, 3543. https://0-doi-org.brum.beds.ac.uk/10.3390/en14123543
AMA Style
Wróblewski P, Kupiec J, Drożdż W, Lewicki W, Jaworski J. The Economic Aspect of Using Different Plug-In Hybrid Driving Techniques in Urban Conditions. Energies. 2021; 14(12):3543. https://0-doi-org.brum.beds.ac.uk/10.3390/en14123543
Chicago/Turabian StyleWróblewski, Piotr, Jerzy Kupiec, Wojciech Drożdż, Wojciech Lewicki, and Jarosław Jaworski. 2021. "The Economic Aspect of Using Different Plug-In Hybrid Driving Techniques in Urban Conditions" Energies 14, no. 12: 3543. https://0-doi-org.brum.beds.ac.uk/10.3390/en14123543
Note that from the first issue of 2016, this journal uses article numbers instead of page numbers. See further details here.