
Effect of Mainstream Velocity on the Optimization of a Fan-Shaped Film-Cooling Hole on a Flat Plate


School of Aerospace and Mechanical Engineering, Korea Aerospace University, Goyang 10540, Korea
*
Author to whom correspondence should be addressed.
Energies 2021, 14(12), 3573; https://0-doi-org.brum.beds.ac.uk/10.3390/en14123573
Submission received: 3 May 2021
/
Revised: 7 June 2021
/
Accepted: 9 June 2021
/
Published: 16 June 2021
(This article belongs to the Special Issue Advances in Gas Turbine Performance, Heat Transfer and Aerodynamics)
Abstract
:In this study, the effect of mainstream velocity on the optimization of a fan-shaped hole on a flat plate was experimentally investigated. The experiment was conducted by changing the forward expansion angle (), lateral expansion angle (), and metering length ratio () of the film-cooling hole. A total of 13 cases extracted using the Box–Behnken method were considered to examine the effect of the shape parameters of the film-cooling hole under a 90 m/s mainstream velocity condition, and the results were compared with the results derived under a mainstream velocity of 20 m/s. One density ratio (DR = 2.0) and a blowing ratio (M) ranging from 1.0 to 2.5 were considered, and the pressure-sensitive paint (PSP) technique was applied for the film-cooling effectiveness (FCE). As a result of the experiment, the optimized hole showed a 49.3% improvement in the overall averaged FCE compared to the reference hole with DR = 2.0 and M = 2.0. As the blowing ratio increased, the hole exit area tended to increase, and this tendency was the same as that in the 20 m/s mainstream condition.
1. Introduction
Modern gas turbine engines have a tendency to incorporate continuously increasing turbine inlet temperatures to improve efficiency, which causes the gas turbine blades to be exposed to high thermal loads. Accordingly, film cooling, which is an external cooling method, has been widely used to protect the blades from the hot combustion gas [1,2]. Film cooling protects the blade surface by injecting coolant with relatively low temperatures compared to the high temperature combustion gas through a small hole on the blade surface [3].
The film-cooling effectiveness (FCE) is mainly affected by the mainstream conditions, the shape of the film-cooling hole, and the injection conditions of the coolant. Liess et al. [4] experimentally studied the effects of mainstream conditions, such as the mainstream velocity and boundary layer thickness, on the FCE. Singh et al. [5] experimentally studied FCE according to the blowing ratio (M) and density ratio (DR) for cylindrical holes with various hole lengths and injection angles using the infrared (IR) method. Cylindrical holes are advantageous in terms of manufacturing due to their simple shape, but the FCE of the cylindrical holes decreases significantly at higher blowing ratio conditions due to coolant lift-off [6].
Many researchers have endeavored to optimize the shape of the hole to increase the FCE. Kohli and Bogard [7] measured the flow and temperature fields at the exit of the hole and showed that the FCE was higher for a fan-shaped hole. In addition, Yu et al. [8] confirmed that the FCE of holes having both and was higher than the FCE of holes with only the . Gritsch et al. [9] confirmed that the discharge coefficient for a cylindrical hole was lower than the coefficient for a fan-shaped hole, and this trend was more pronounced at the low-pressure ratios.
Anderson et al. [10] experimentally studied the effects that the mainstream condition (e.g., Reynolds number, Mach number, and boundary layer thickness) had on the FCE of the fan-shaped hole. Haydt et al. [11] investigated the effects that the area ratio had on the FCE of the fan-shaped hole by changing the hole length with a constant forward expansion angle. Zhang et al. [12] installed a vortex generator at the exit of the fan-shaped hole to enhance the FCE, and they showed that the area-averaged FCE was enhanced by 25.5% at a blowing ratio of 2.0 compared to the fan-shaped hole without the vortex generator.
The optimization of the fan-shaped hole can be derived using the response surface methodology (RSM). RSM is a method of deriving an optimal response by modeling the curvature of the objective function. Using the regression equation derived through a regression analysis, it is possible not only to analyze the effect of each shape parameter on the objective function, but also to predict the optimal shape and the response value of the non-design point region [13]. Park et al. [14] derived an optimized fan-shaped hole by analyzing the effects of the , , and on the FCE with an injection angle () of 30°. They also showed that the optimized hole resulted in a 52.4% improvement in the overall averaged FCE compared to the reference hole.
In recent years, many researchers have also conducted computational studies to improve the FCE. Kim et al. [15] designed a converging–diverging film-cooling hole by combining a fan-shaped outlet with a convergent inlet. They showed that an increased FCE had been achieved by reducing the separation bubble size in the hole. Kim et al. [16] performed a computational analysis to investigate the FCE for four film-cooling hole shapes—the dumbbell, fan, crescent, and louver—and they showed that the dumbbell shape performed best. Seo et al. [17] investigated the effect of , , and on the FCE of the fan-shaped hole with . They applied the response surface methodology and the Kriging method to derive the optimized hole shapes, and they showed that the FCE of the optimized holes had improved by 4.5% and 7.5%, respectively, compared to the reference hole. Though there are many computational studies on the optimization of fan-shape holes, the accuracy of the computation analyses in film-cooling studies is still controversial, and it is difficult to find experimentally optimized results in the open domain.
In this study, following the study of a fan-shaped hole on a flat plate conducted by Park et al. [14], an experimental study was conducted under higher mainstream velocity conditions for the same hole shape to systematically construct a film-cooling performance database. In the experiment, the pressure-sensitive paint (PSP) technique was applied, and the optimized hole was derived with DR = 2.0 and M = 2.0. These conditions are similar to actual gas turbine operating conditions. The obtained results also were compared with those from the low-speed conditions of Park et al. [14].
2. Experimental Approach
2.1. Test Setup and Test Conditions
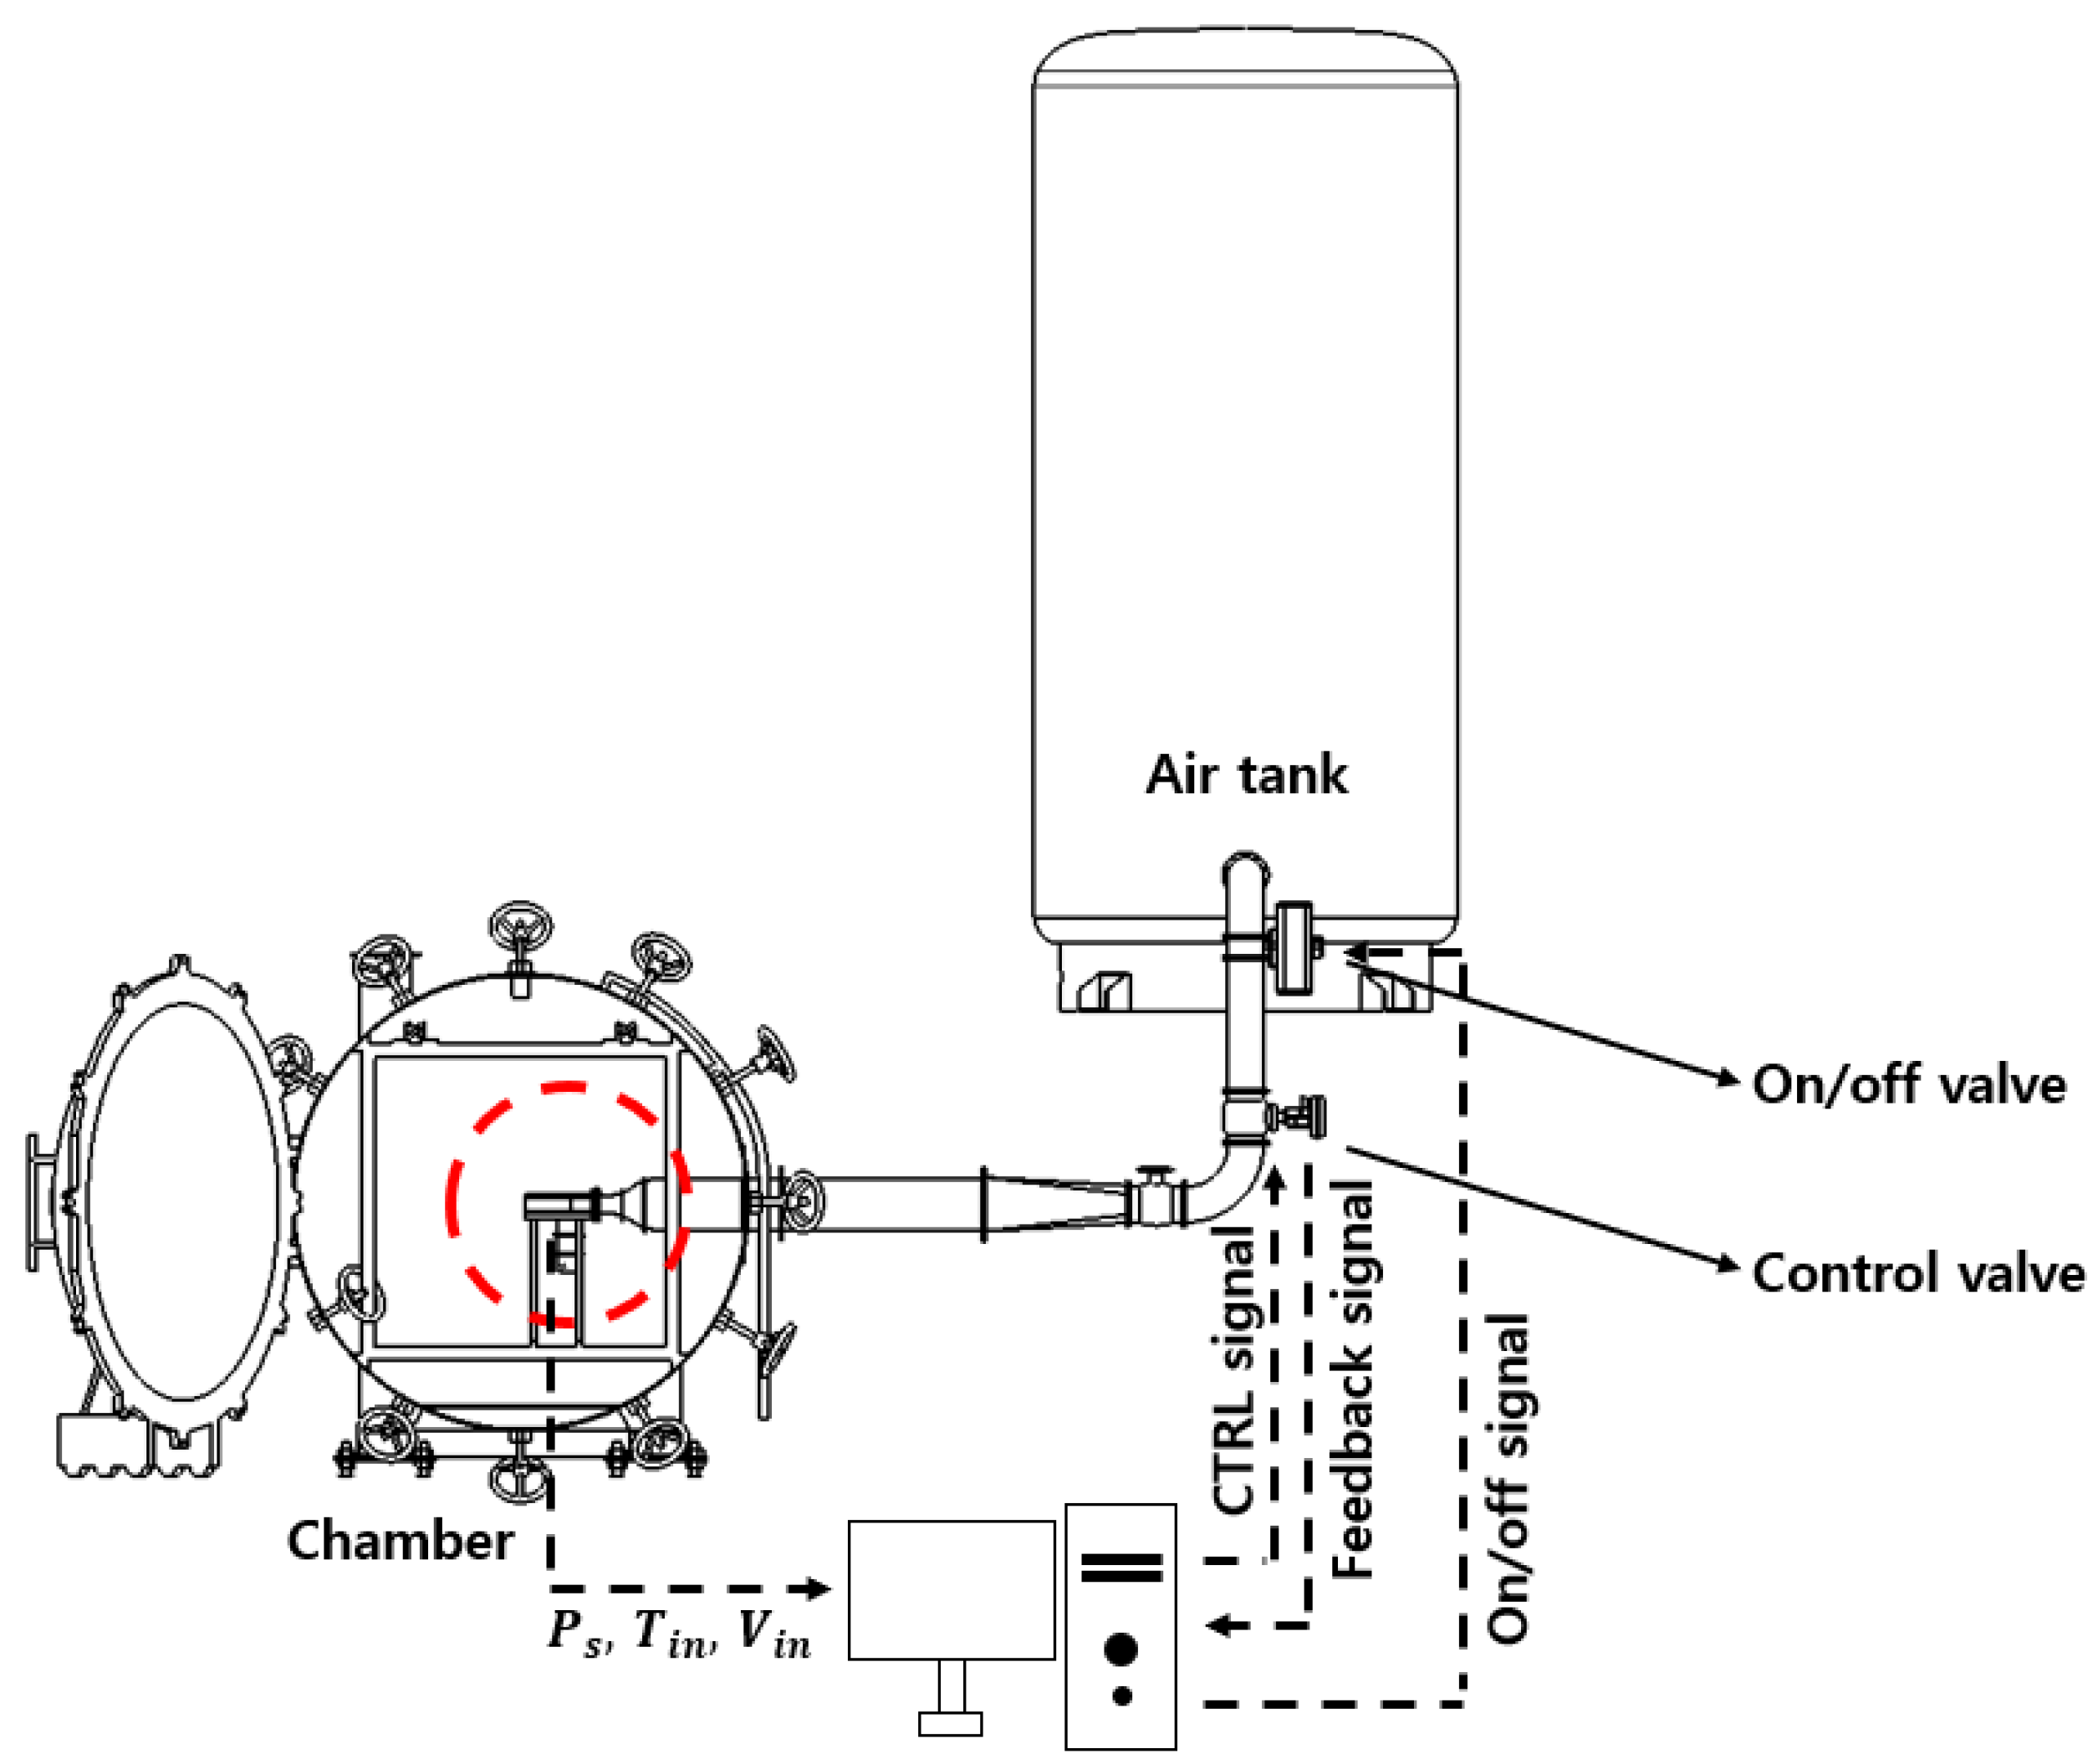
This study was carried out in a transonic turbine cascade test rig at Korea Aerospace University. The compressed air was supplied by two 30 hp compressors and stored in an air tank (30 , 8.5 bar, 2 EA) after passing through a dehumidifier. Figure 1 shows the overall experimental setup. There were three flow paths, and this study was conducted in the center flow path. The other two flow paths were equipped with electric heaters so that the supplied air could be heated up to of 180 °C and various heat transfer tests could be conducted. In addition, a bypass valve that received downstream pressure feedback was installed to prevent damage to the test section due to excessive pressure increases during the experiment.
Figure 2 shows the side views of the test rig and signal line for the control of the mainstream velocity. When the compressed air stored in the air tank entered the test section, the target velocity could be maintained by adjusting the control valve opening degree through PID control by receiving temperature and pressure information at the test section inlet. Figure 3 shows the air tank pressure, valve opening, and mainstream velocity during a typical experiment. After a test began, the pressure in the air tank would decrease, but adjustments to the control valve enabled the mainstream velocity to maintain the target velocity of 90 m/s for about 110 s. During the test duration period, the variation in the mainstream temperature was 1.5 °C and the effects of the temperature change on the measured film-cooling effectiveness was negligible.
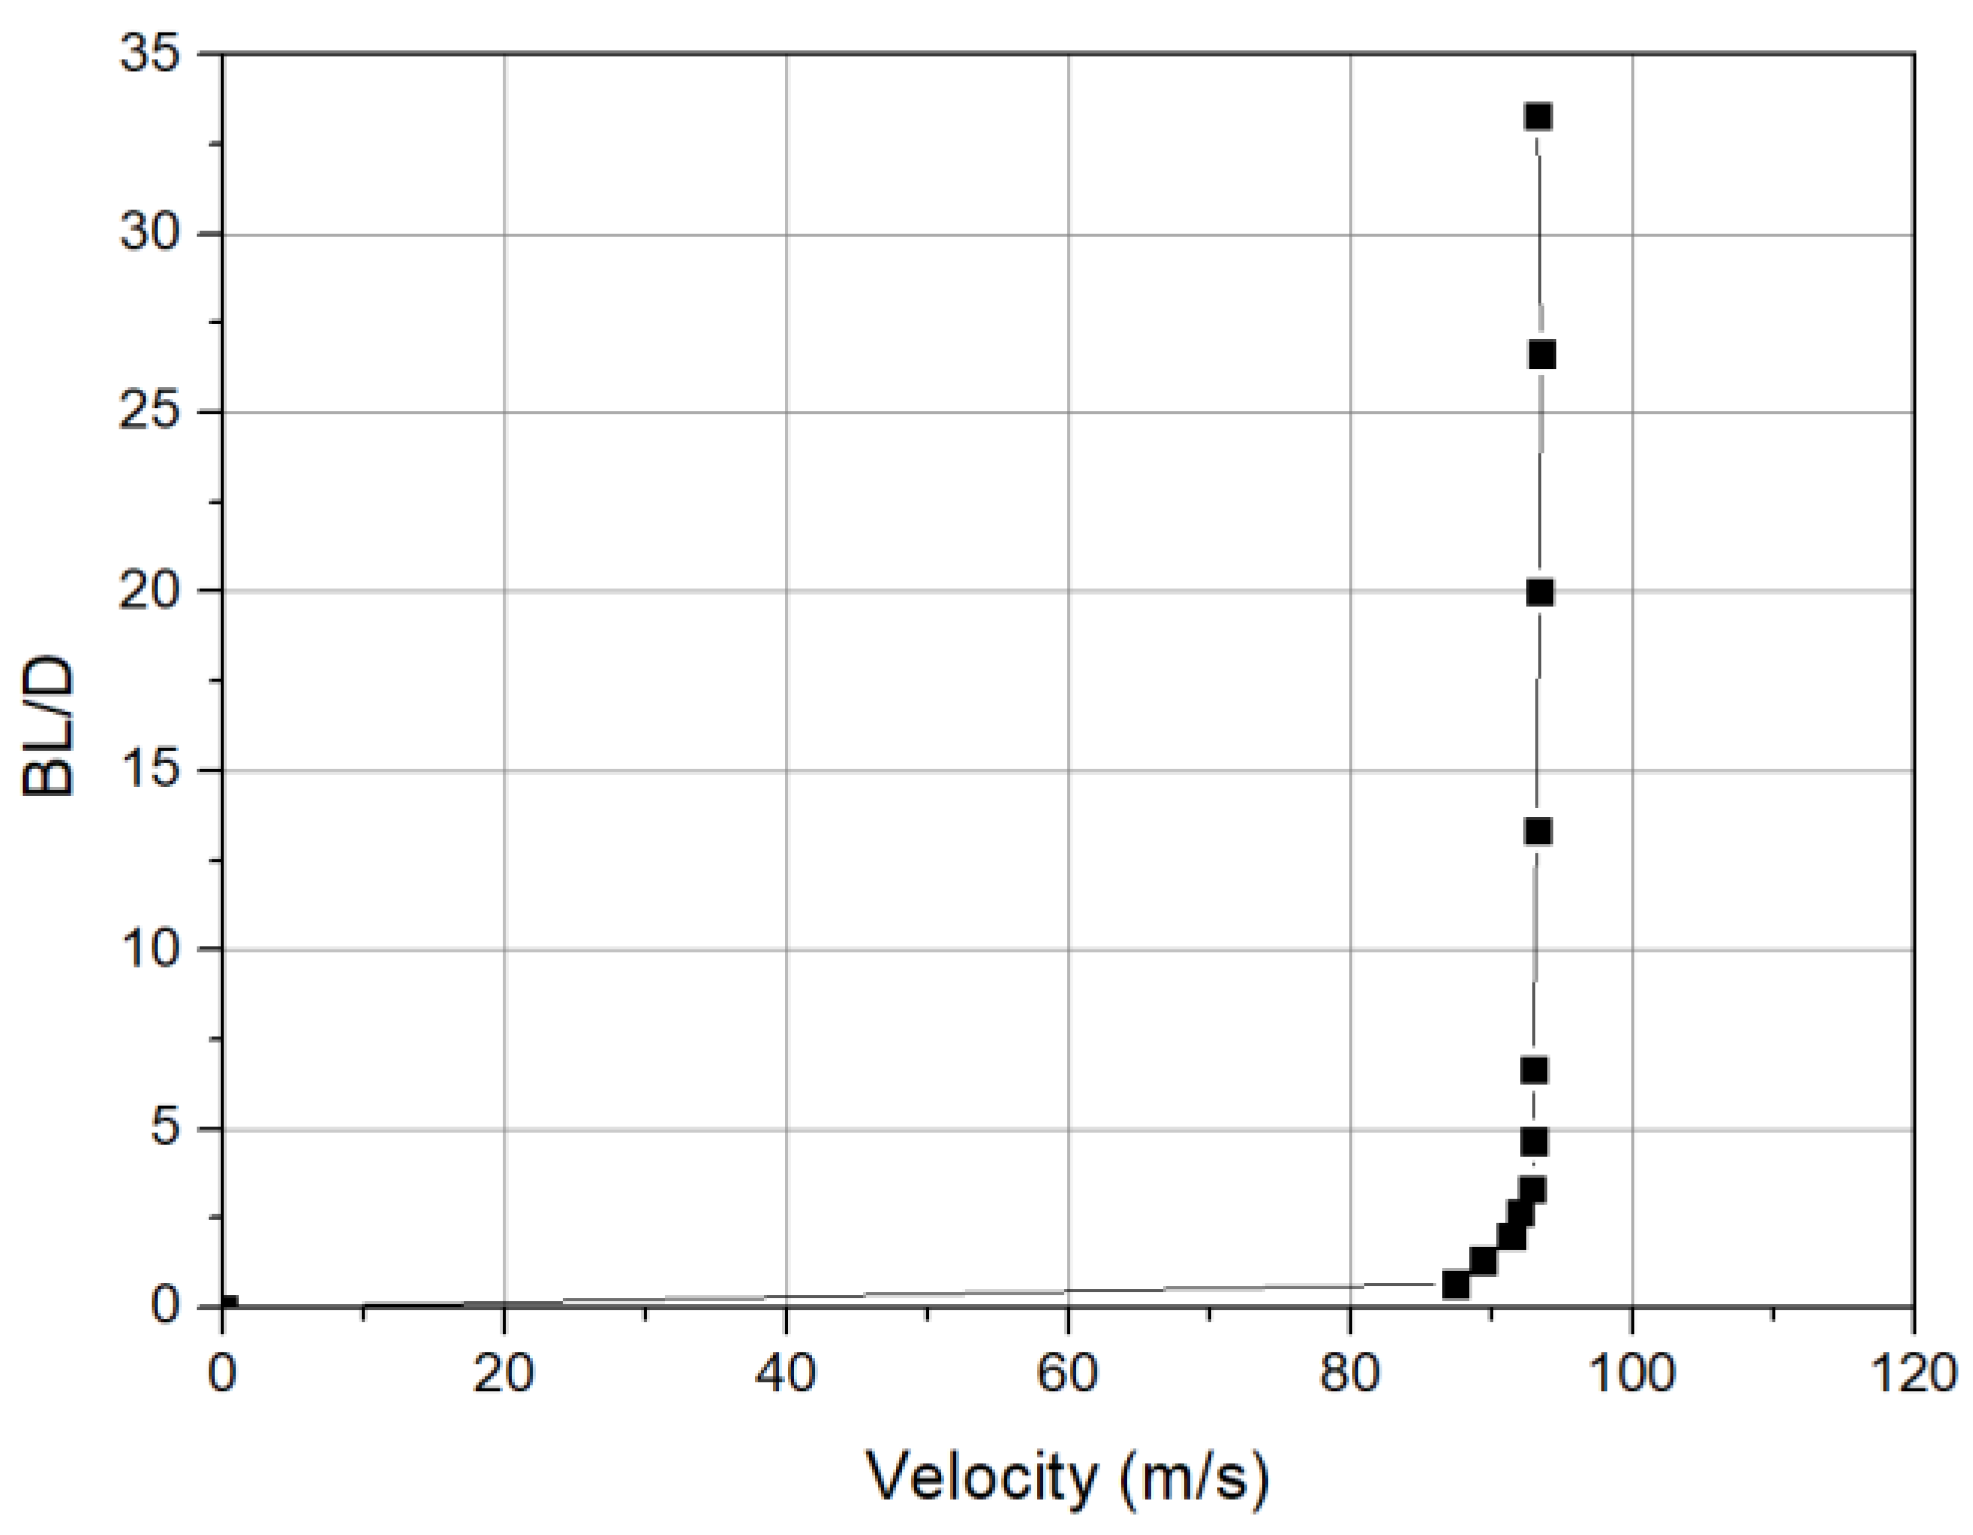
Figure 4 presents a schematic of the test section and test plate. The test plates with film-cooling holes were the same as those used in the low-speed condition tests by Park et al. [14]. The size of all test plates was 72 mm × 105 mm, and the thickness was 5 mm. The mainstream velocity was about 90 m/s, and the boundary layer thickness 20 mm upstream from the hole was 4 mm (about 2.7 D). The turbulence intensity and length scale were 8% and 8 mm (about 5.3 D), respectively. The distribution of the inlet velocity profile is shown in Figure 5. The Mach number based on the mainstream velocity and temperature was about 0.27. Coolant was supplied to the test section through a plenum chamber with two screen layers and a honeycomb layer. The coolant flow rate was controlled using a mass flow controller (MFA-2610A, OMEGA). The test plates used in the experiment were manufactured using a stereolithography (SLA) additive manufacturing method with a layer thickness of 0.05 mm.
For the FCE measurements, the PSP technique was applied. The PSP was coated on the test plates uniformly and an LED (2-inch air cooled LED, ISSI) was used to illuminate the test section. The emitting intensity of the PSP was measured using a CCD camera (PCO.1600, PCO).
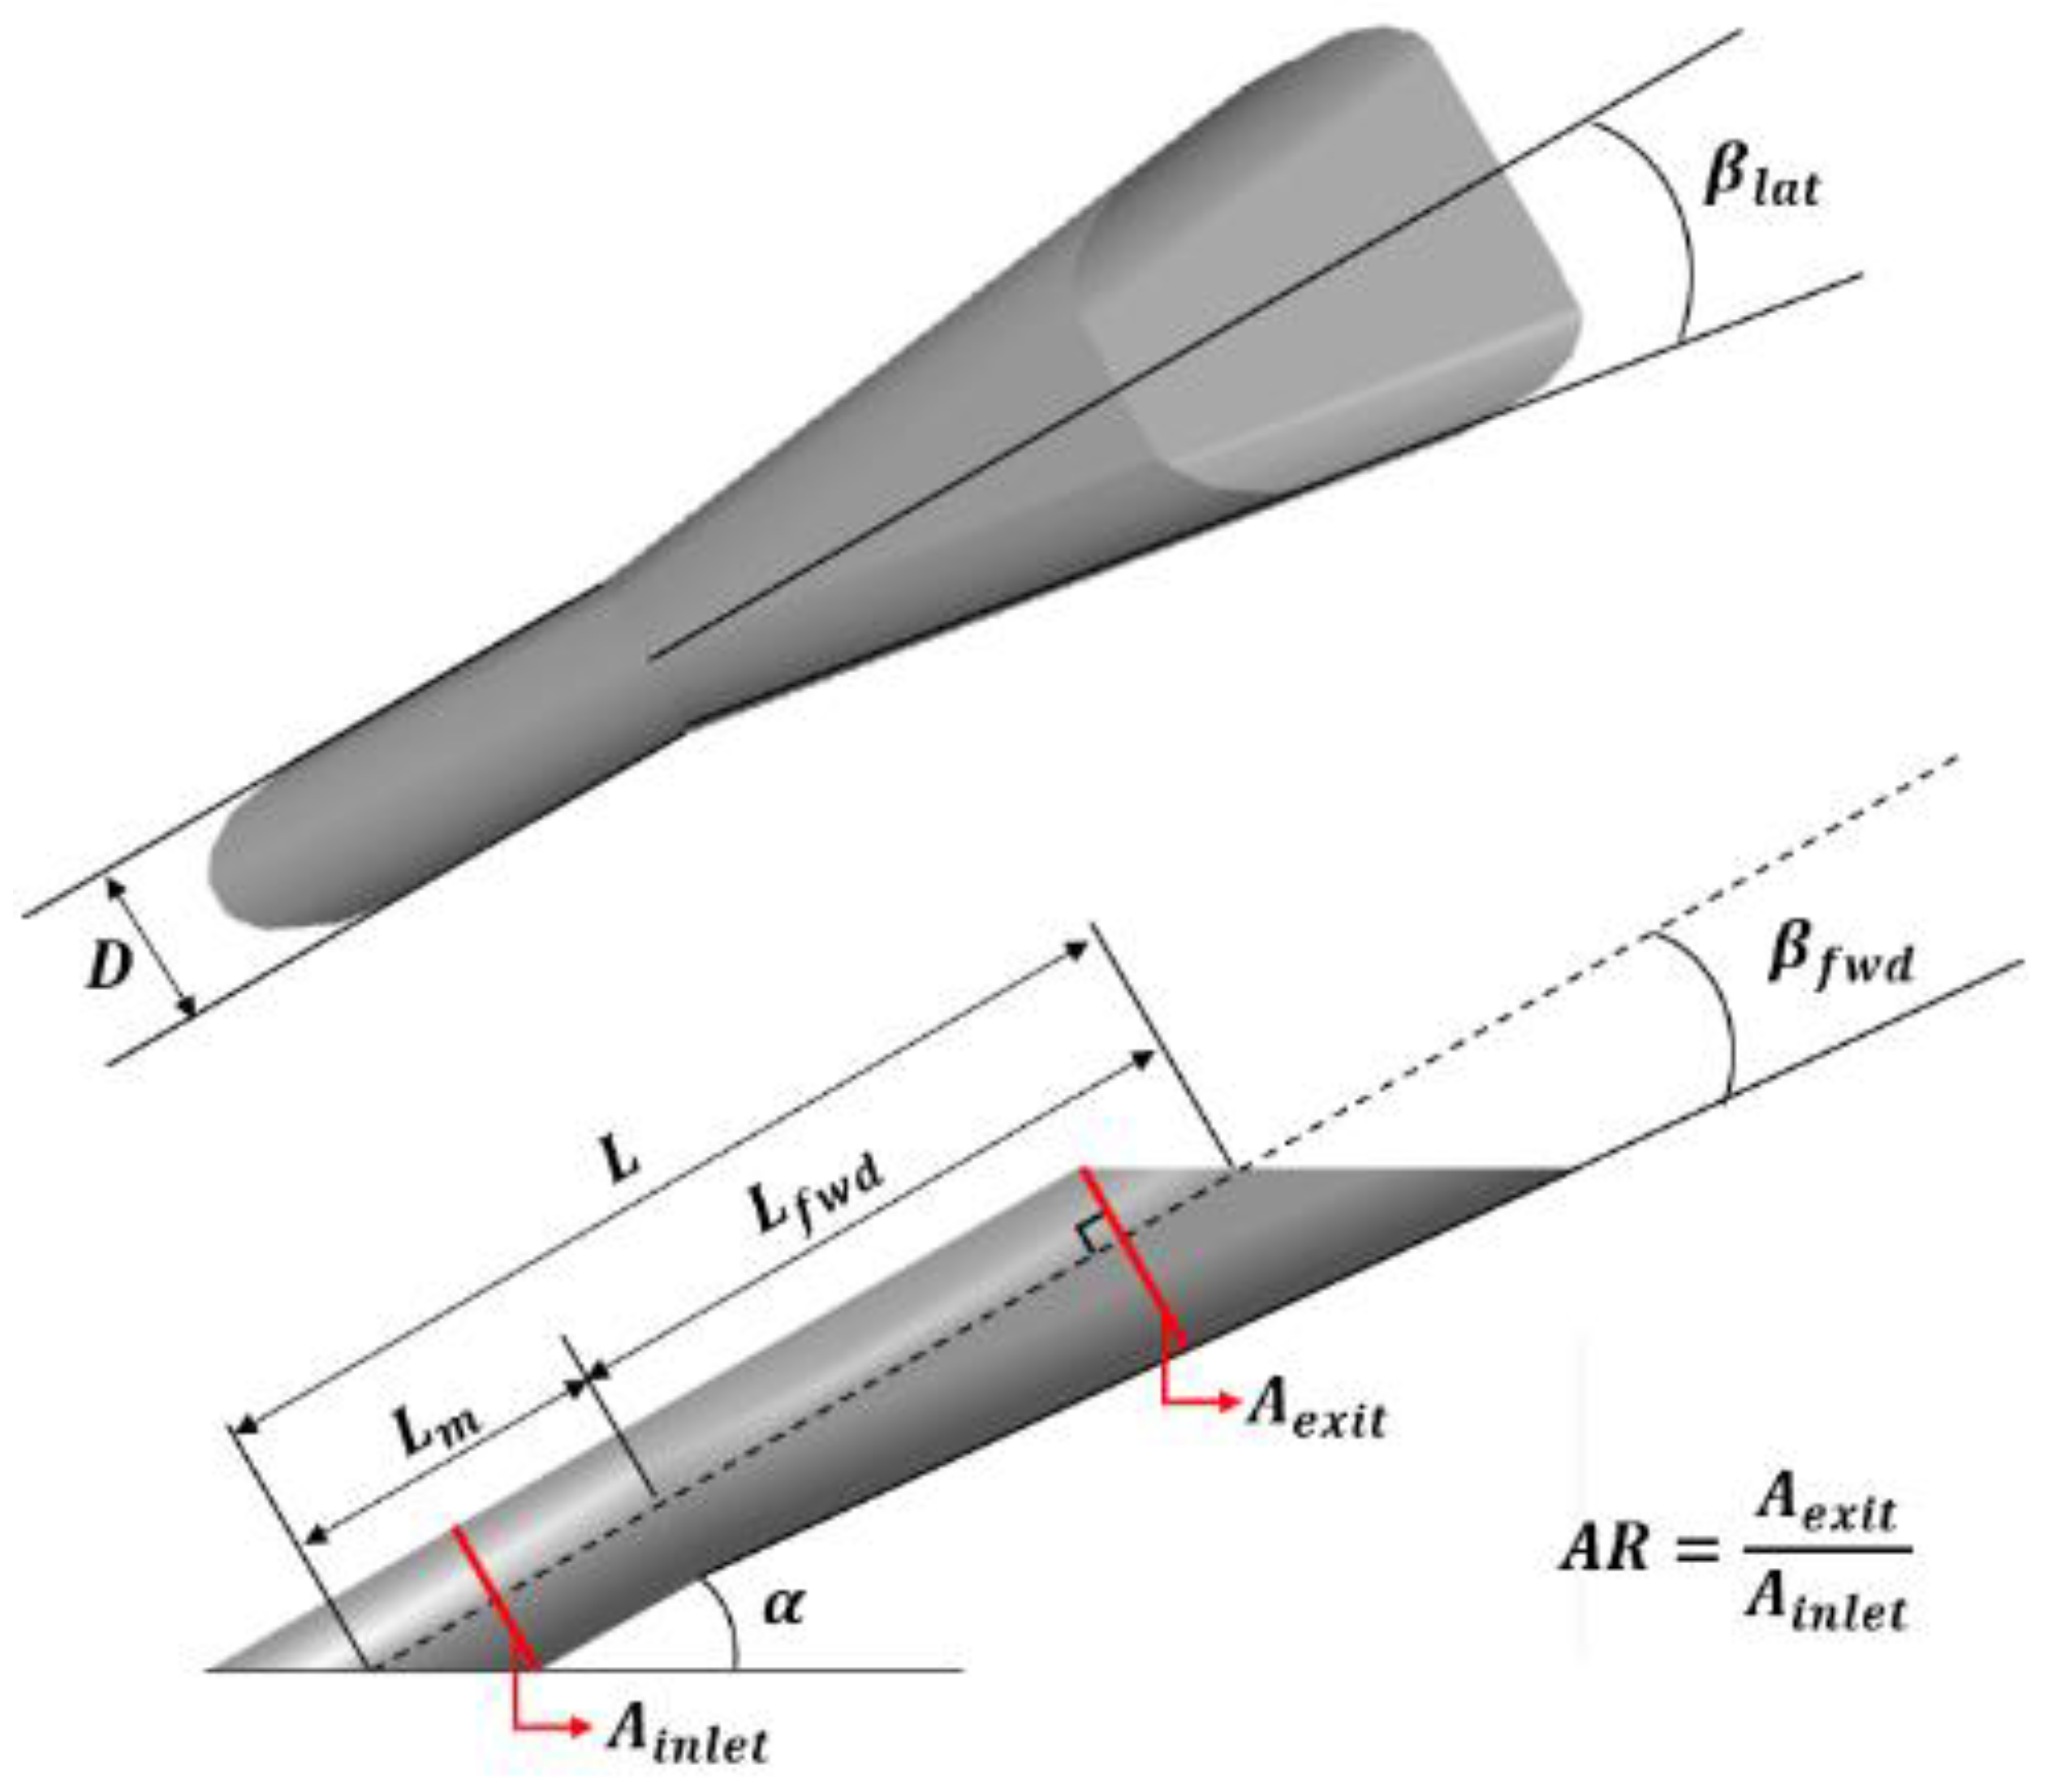
Figure 6 shows the shape parameters of a typical fan-shaped hole. The shape parameters include the , , , and . The shape parameters of the reference hole are , , and , and the hole is simply named 7-7-3 owing to the three parameters. The experimental cases were identical to the shape that Park et al. [14] tested under low-speed conditions, and the experimental cases derived by the Box–Behnken design method are shown in Table 1. The area ratio (AR) is defined by Equation (1).
2.2. Experimental Technique
In this study, FCE was measured through the PSP technique. In general, when PSP is irradiated by light with a short wavelength (about 400 nm), it emits long-wavelength light (>600 nm) and returns to a ground state. The intensity of the light emission depends on the partial pressure of the oxygen, and the FCE can be obtained by using the characteristics of PSP [18,19]. The uncertainty of the measured FCE was estimated as at and at .
In the experiment, a density ratio () = 2.0 was simulated using mixed gas (. The blowing ratio () was adjusted to 1.0, 1.5, 2.0, and 2.5 using a mass-flow controller (FMA-2610A, OMEGA). The density ratio and blowing ratio are defined by Equations (2) and (3), respectively.
The Reynolds number based on the hole diameter ranged between 14,000 and 34,000, depending on the blowing ratio. For the low-speed condition test carried out by Park et al. [14], the Reynolds number ranged from 3000 to 8000.
3. Results and Discussion
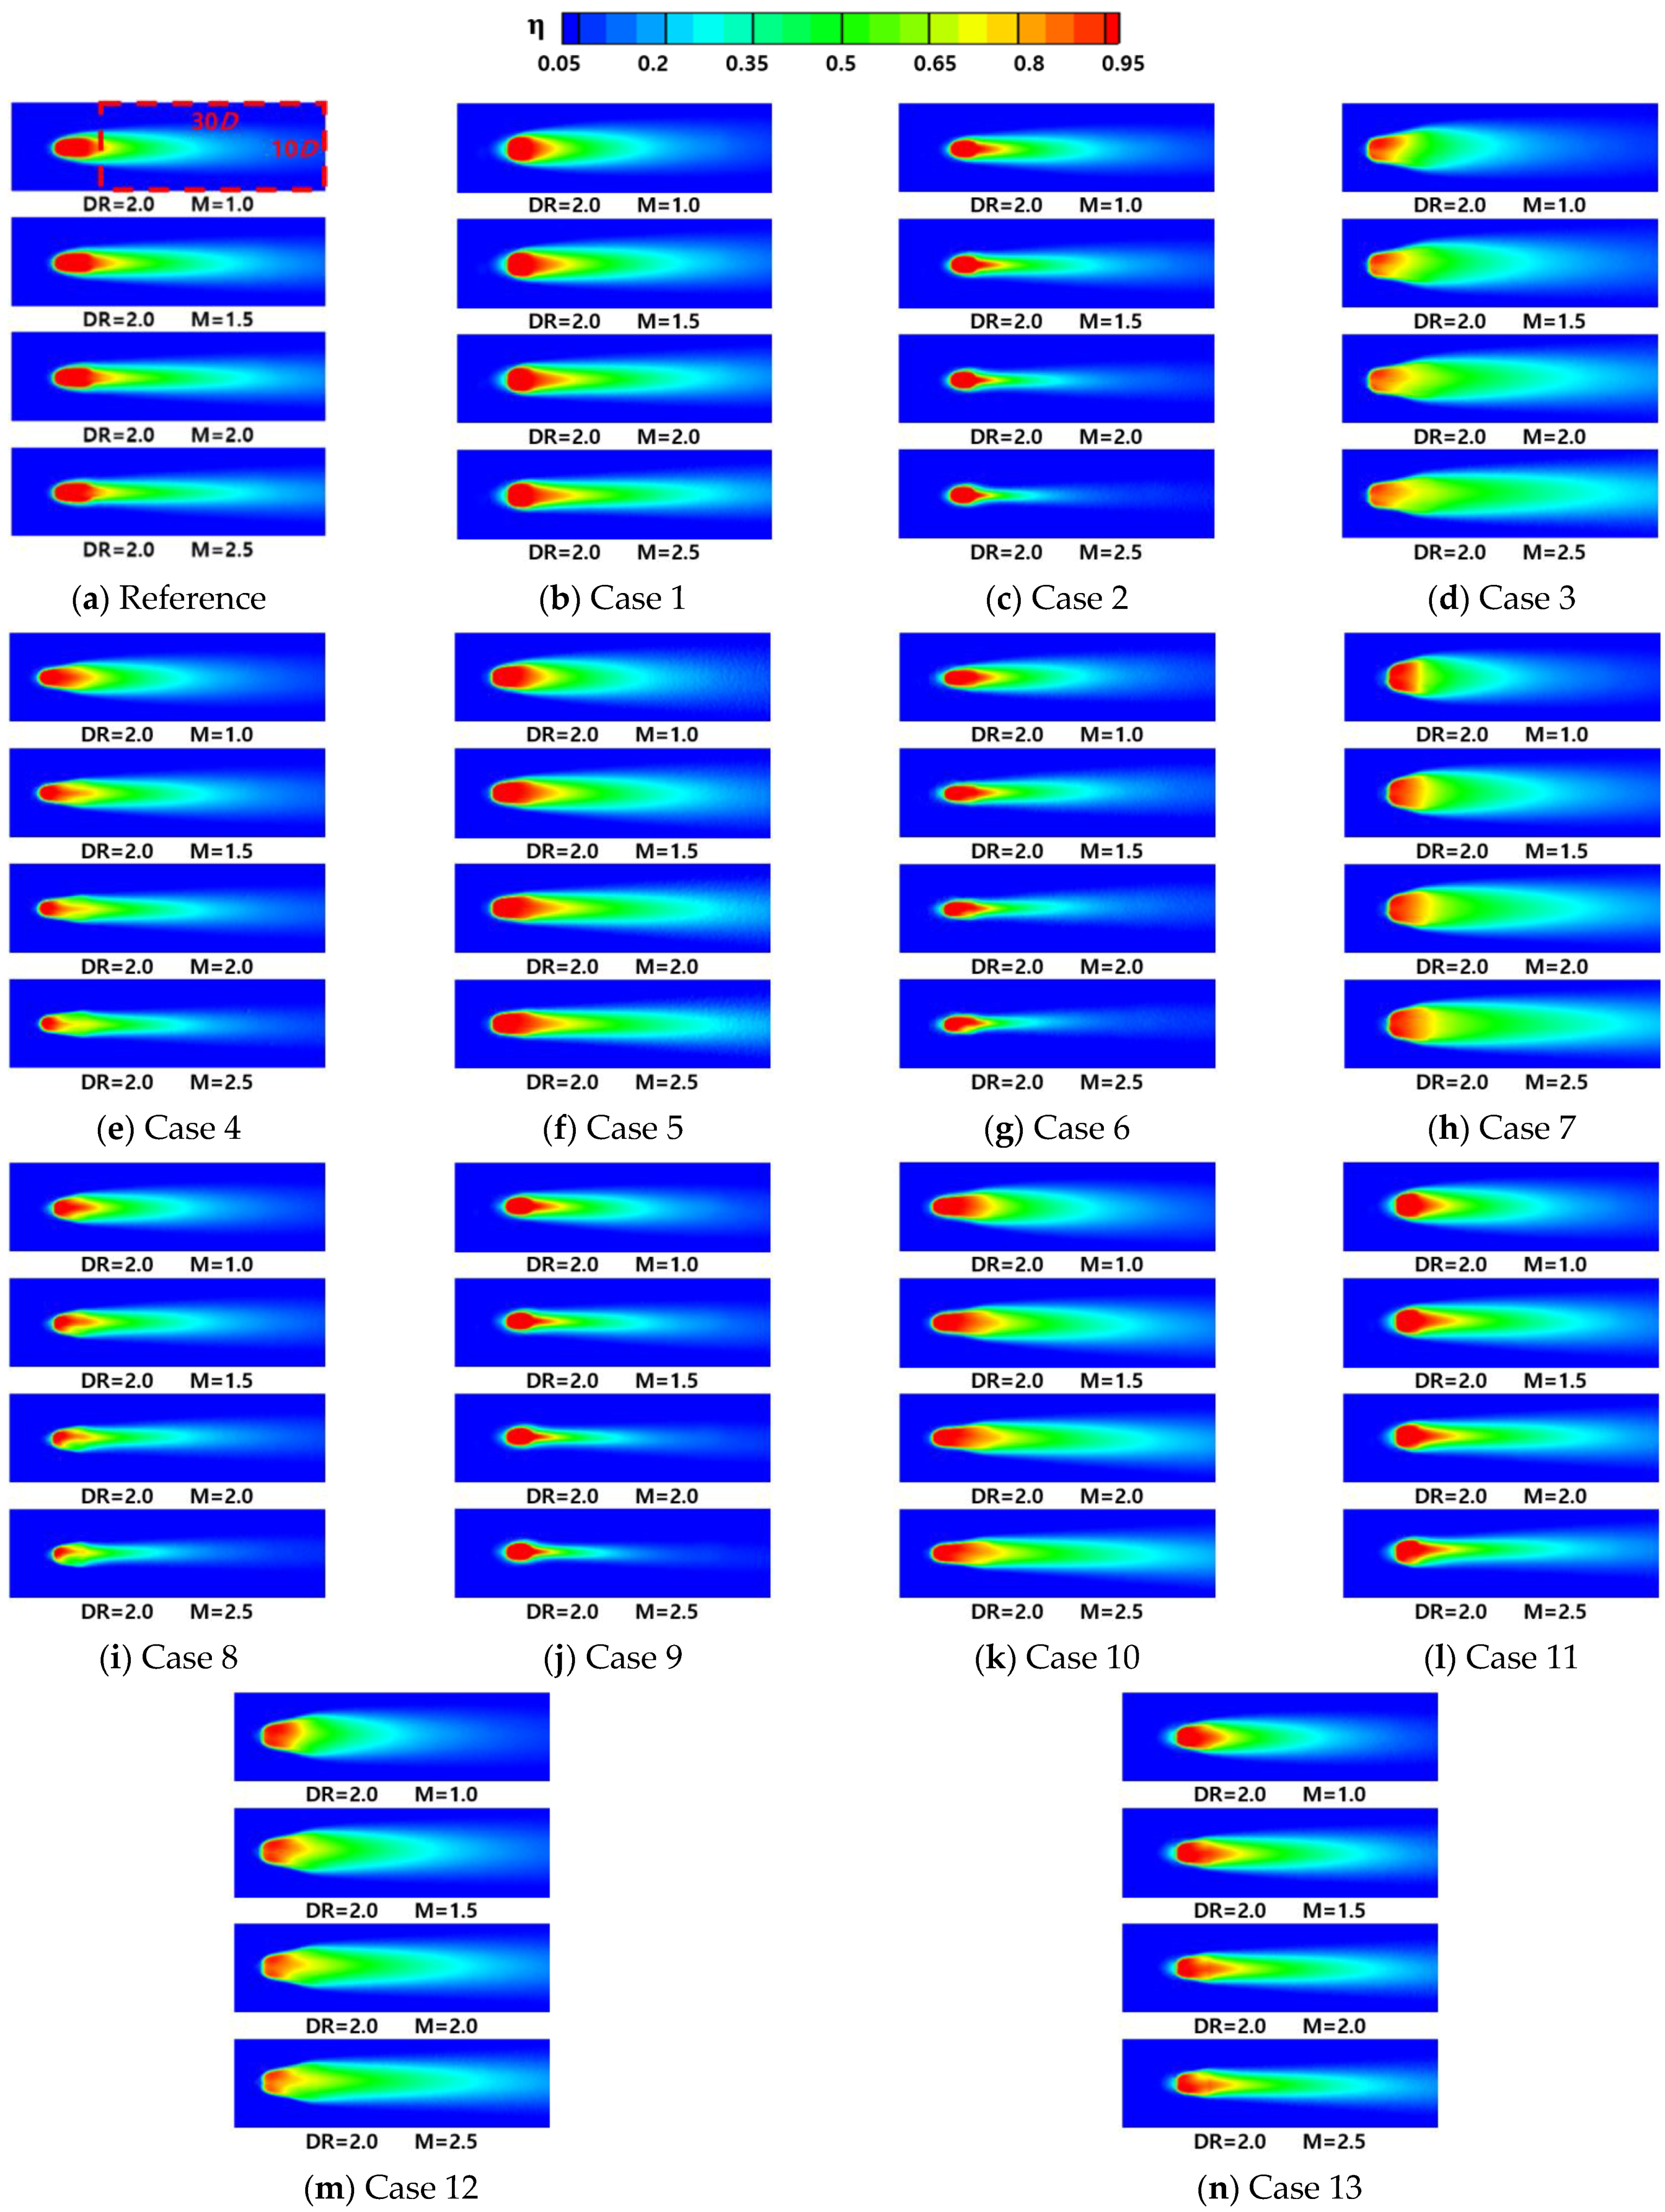
In this study, the effects of the shape parameters (, , and ) of the fan-shaped hole on the FCE with were studied under higher velocity conditions. In addition, the results of this experiment were compared with the experimental results under the low-speed conditions (= 20-m/s) by Park et al. [14]. Experiments were carried out under one density ratio and four blowing ratio conditions. Figure 7 presents the distribution of the FCE for all cases. For the optimization of the hole shape, an objective function was the overall averaged FCE and the overall averaged FCE was obtained in the area indicated by the red box in Figure 7a.
In Figure 7, it is observed that the effect of the blowing ratio on the FCE was not consistent for each hole. In the following section, the overall averaged FCE according to the hole shape was compared quantitatively.
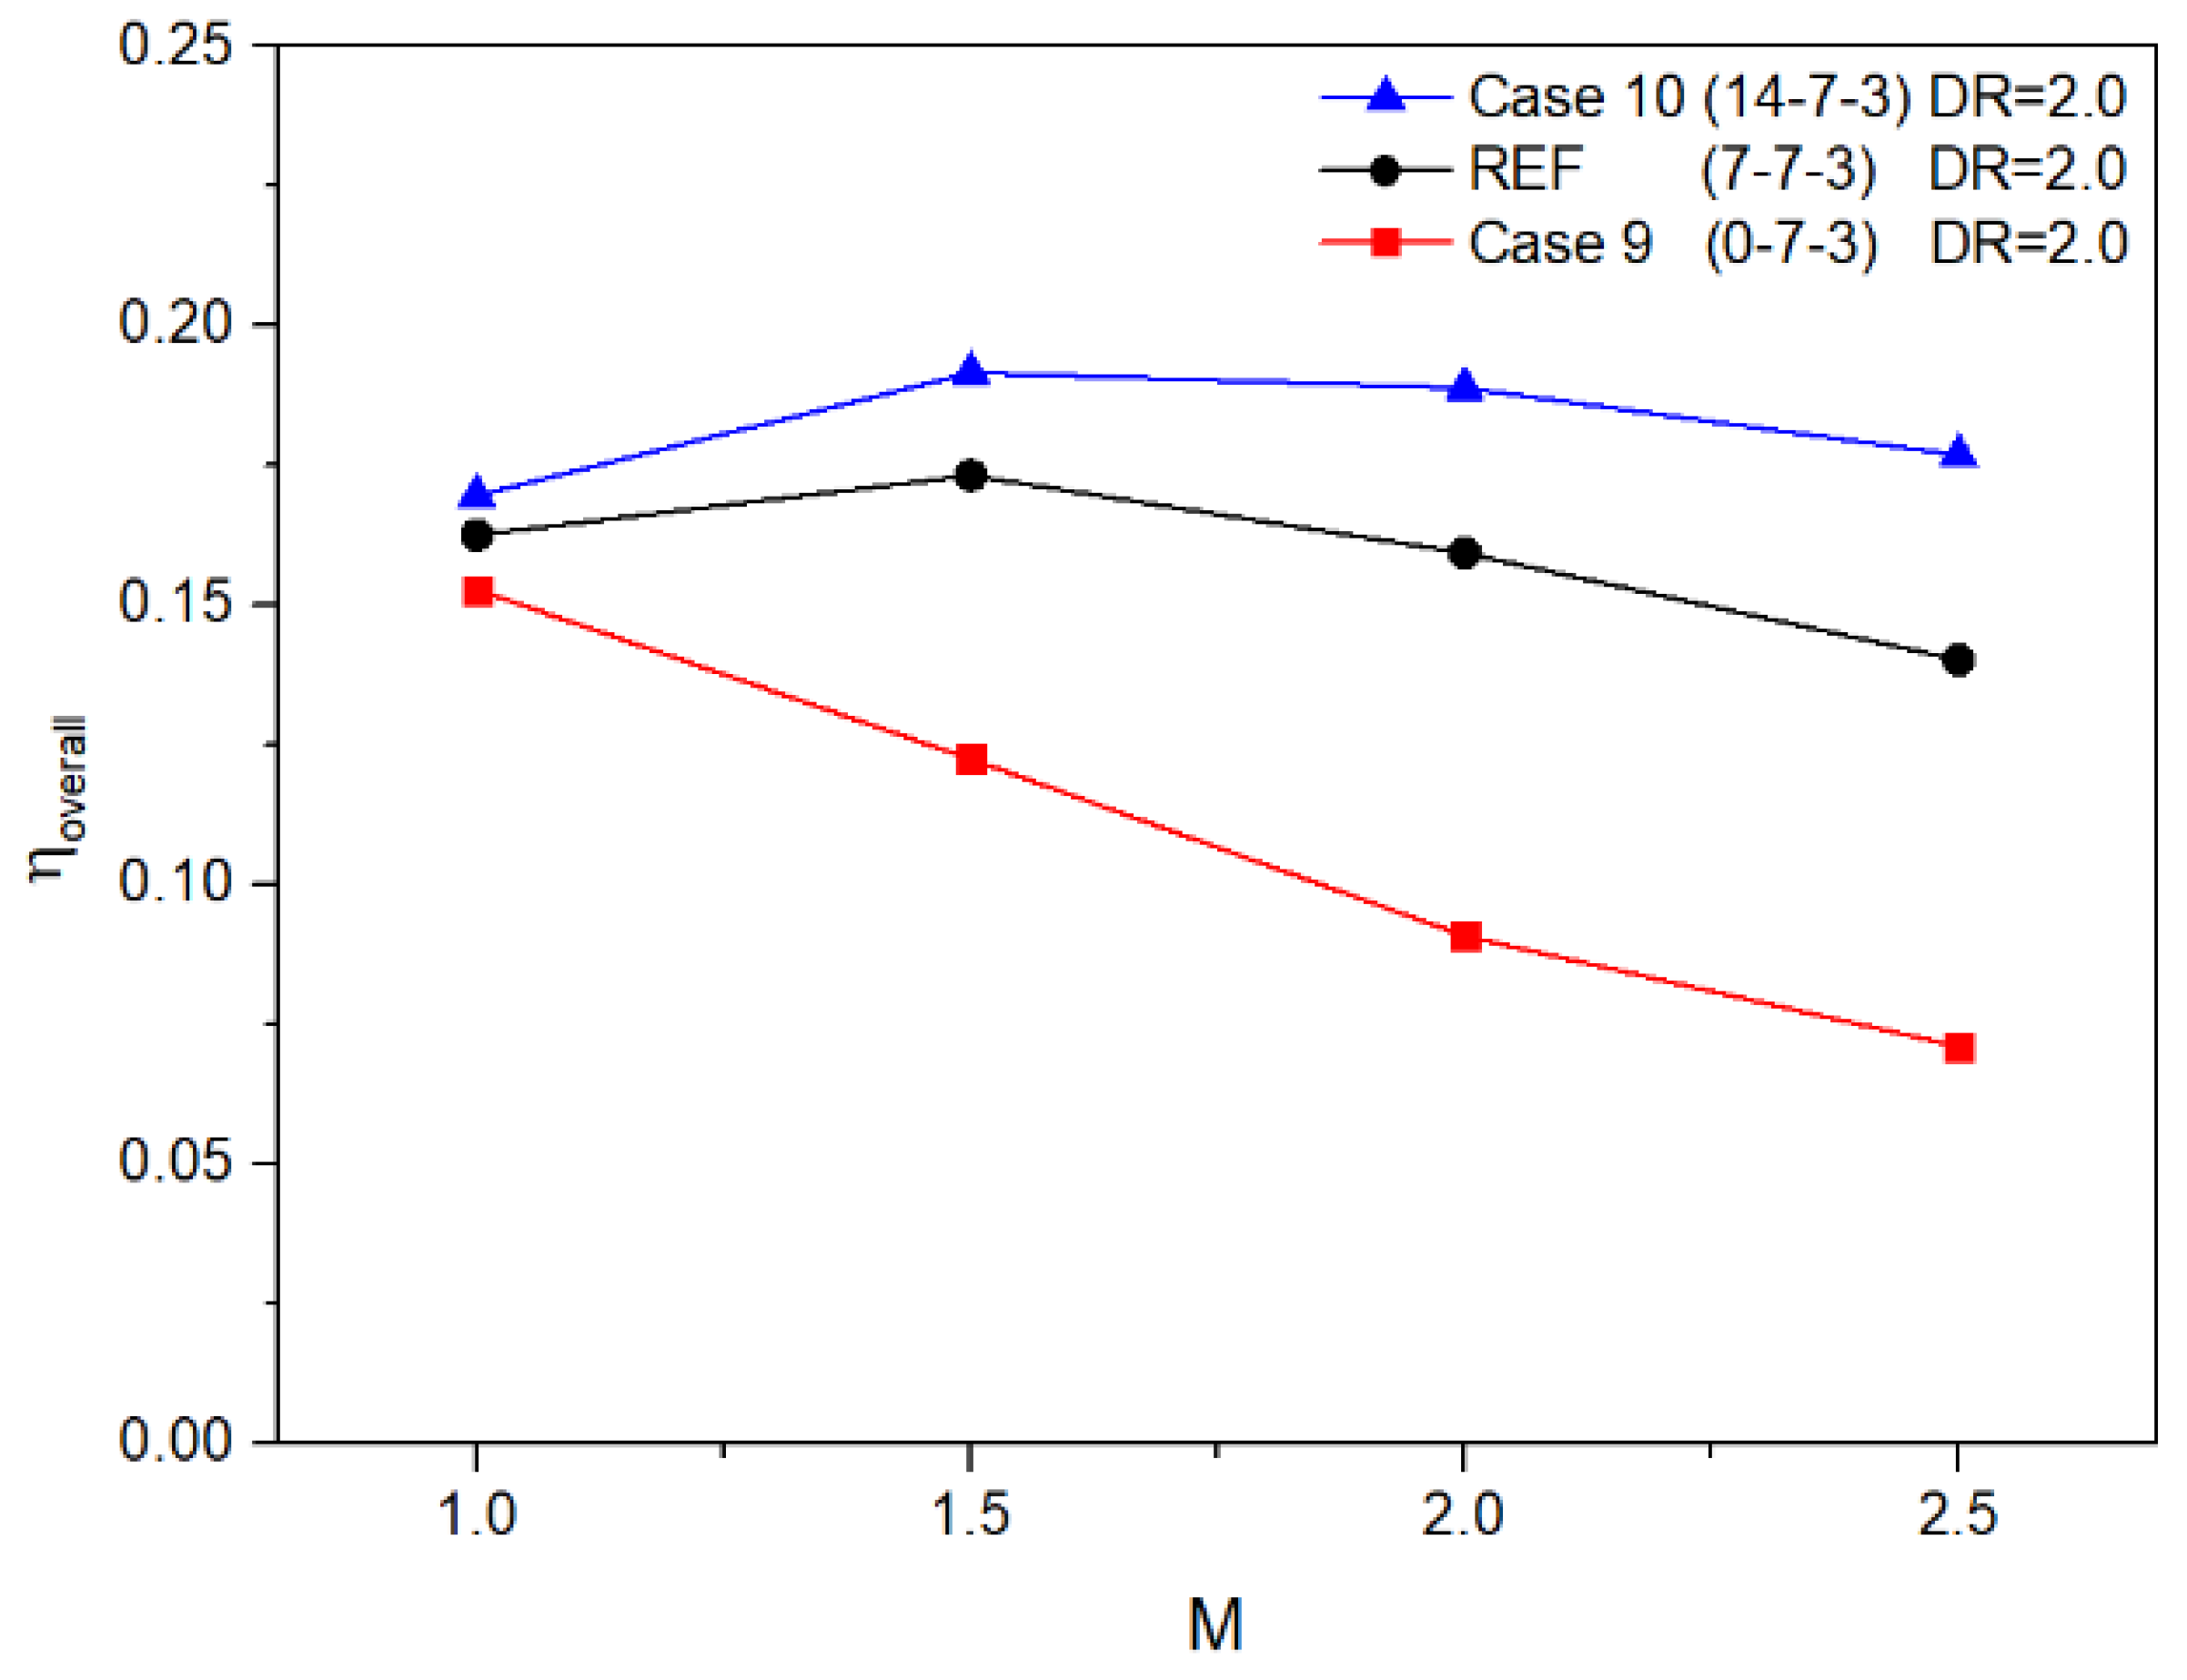
3.1. Effects of the Forward Expansion Angle
To investigate the effect of the on the FCE, Case 9, the reference, and Case 10, all of which have and , were compared. Figure 8 shows the overall averaged FCE for the X-7-3 cases, and the cases with higher showed higher FCE. This was caused by the increases in the hole exit area with the increase in the . The coolant injected from the hole with the larger exit area was able to cover a wider area and stay closer to the wall due to the lower momentum, which resulted in a higher FCE.
For all three cases, the FCE for Case 10 with the large was higher than the reference case and Case 9. For Case 9, which had a small exit area, the FCE decreased as the blowing ratio increased. This was caused by the coolant lift-off for the higher blowing ratio due to the increased coolant momentum at the hole exit. For the reference case and Case 10, the maximum effectiveness was observed at a blowing ratio of 1.5, and the FCE tended to decrease for the higher blowing ratio.
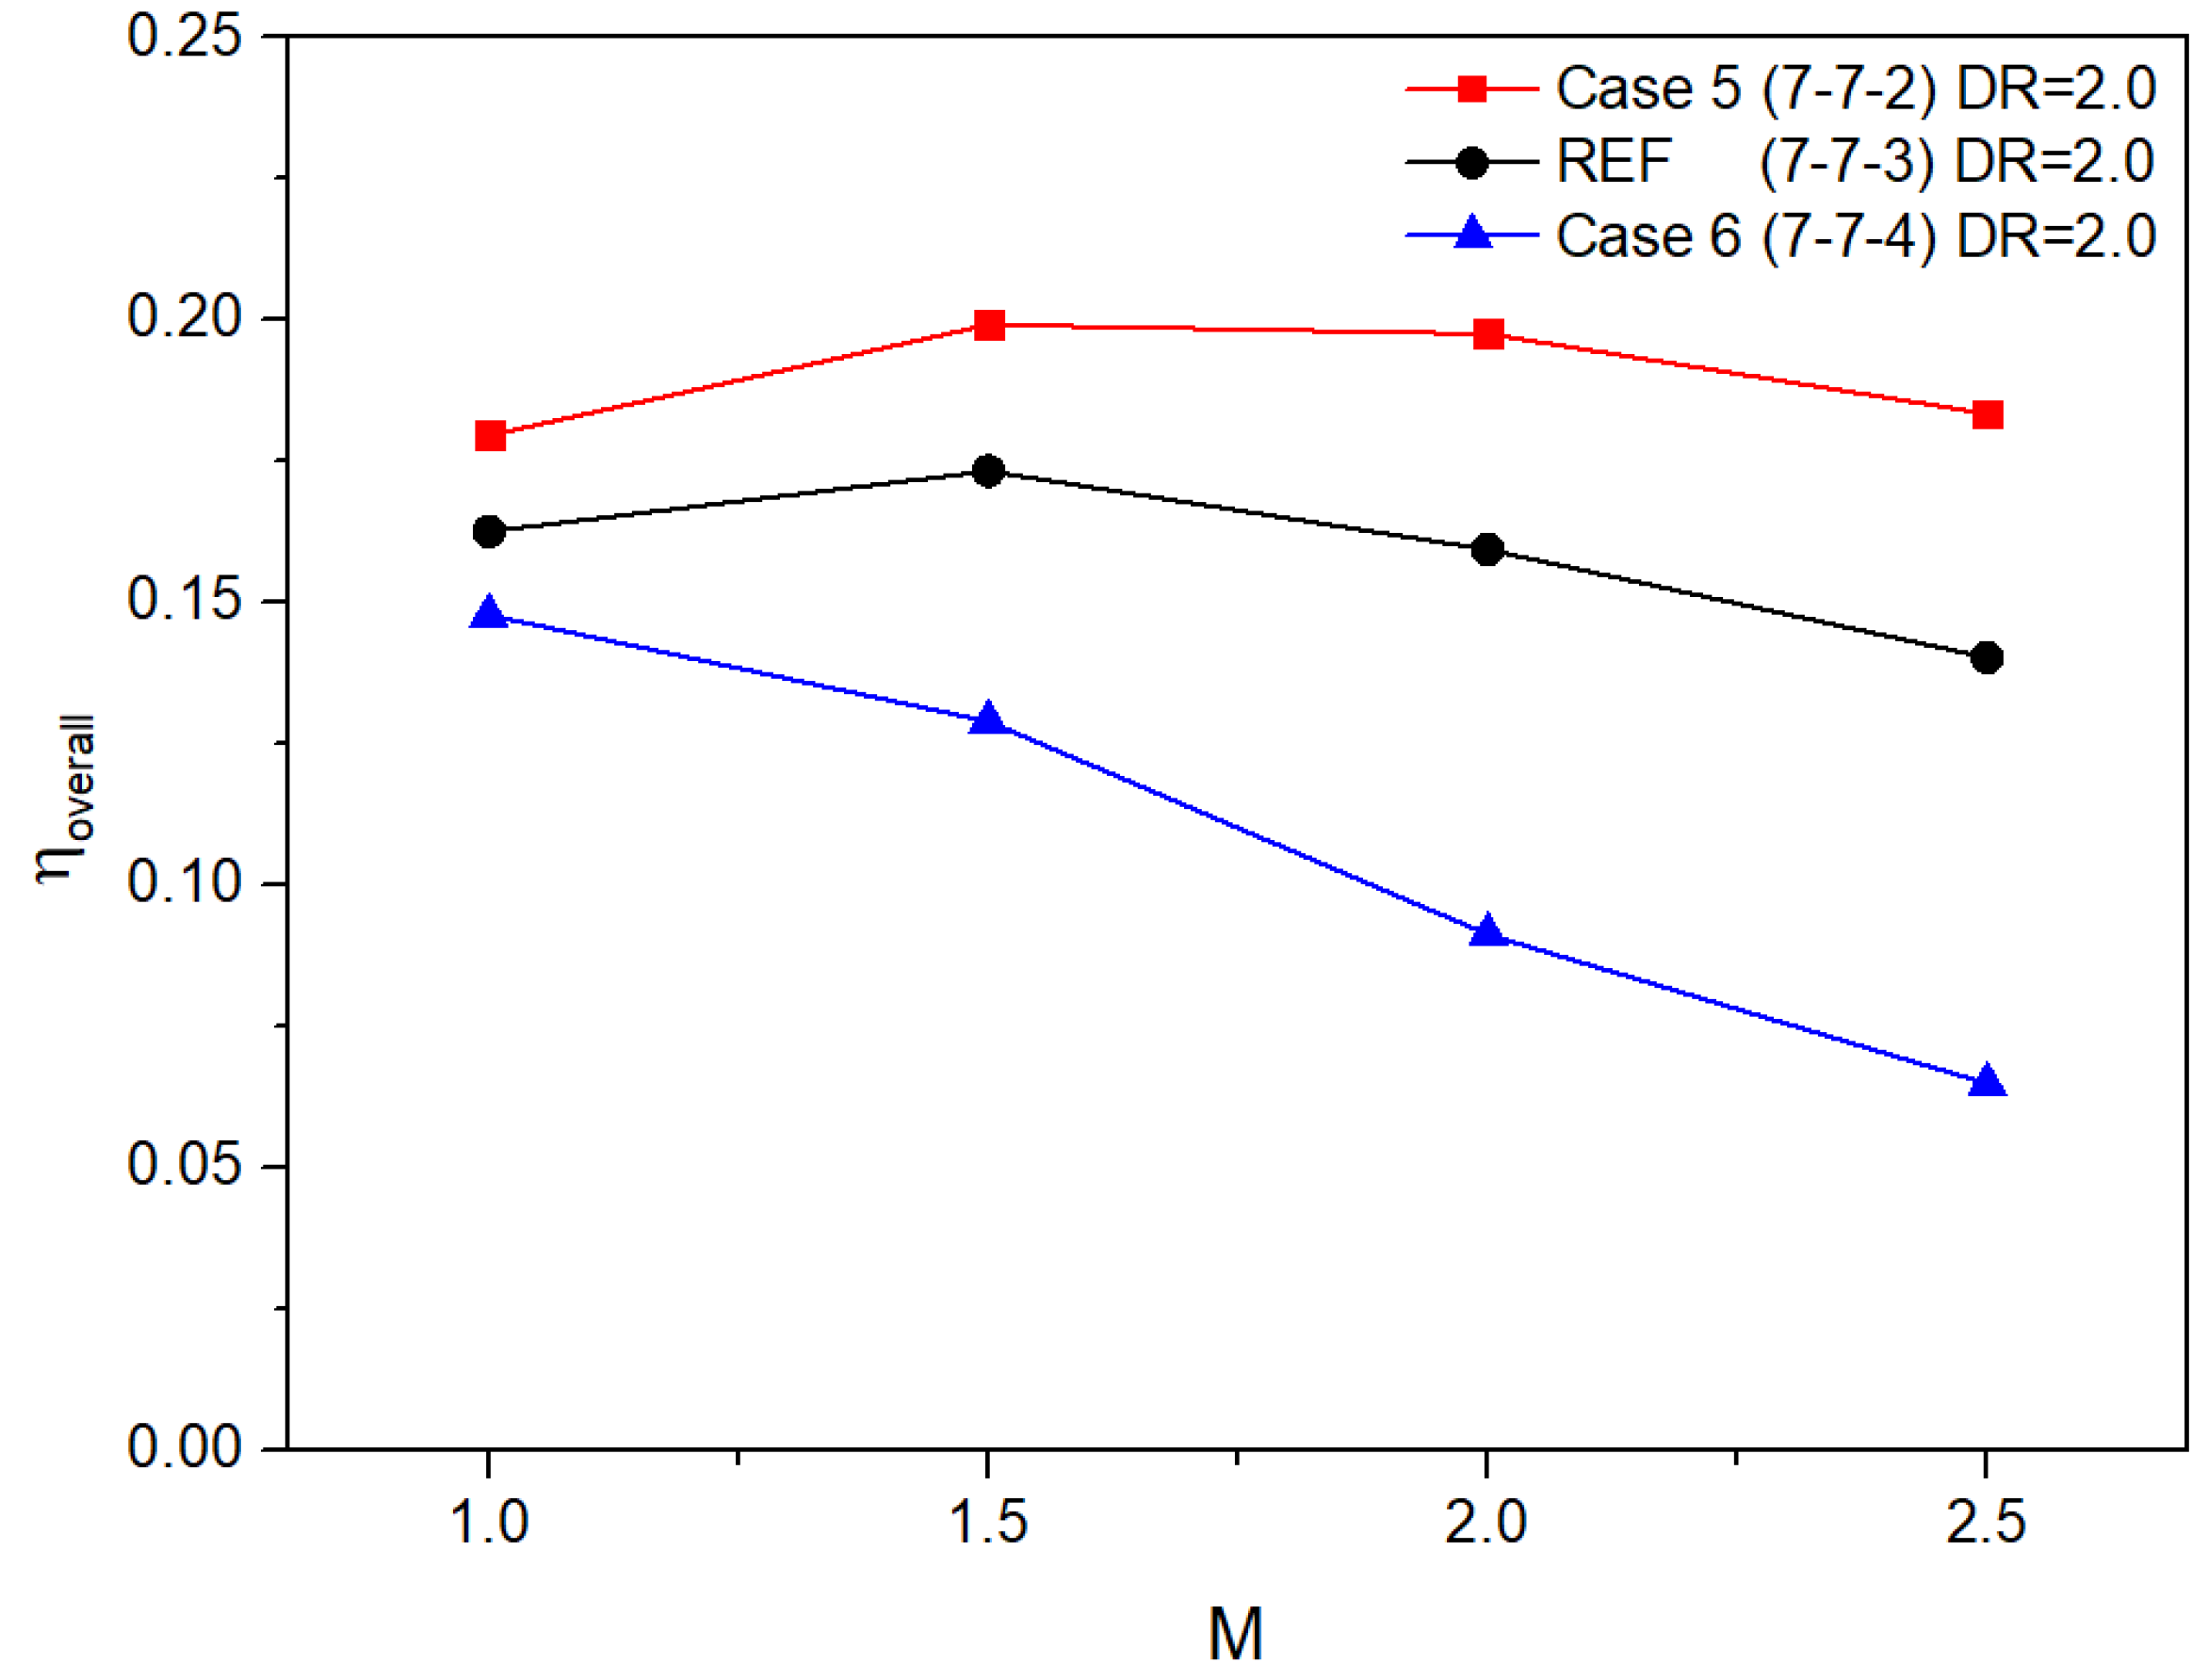
3.2. Effects of the Metering Length Ratio
Figure 9 shows the overall averaged FCE for the 7-7-X cases. Cases with the same and but different (Case 6, reference, and Case 5) were compared. The case with the shorter (Case 5) showed a higher FCE. This was caused by the increased hole exit area for the shorter case.
Again, the effect of the blowing ratio was inconsistent for the considered cases. For cases with a relatively larger (Cases 5 and 6), Case 6 showed a decreasing FCE as the blowing ratio increased, while the FCE for Case 5 reached its maximum at the blowing ratio of 1.5. For all cases, when the blowing ratio climbed too high, the FCE decreased due to the excessive coolant momentum.
3.3. Effects of the Lateral Expansion Angle
In Figure 10, the overall averaged film-cooling effectiveness for the cases with the same and but different (7-X-2, 0-X-3, 7-X-3, 14-X-3, and 7-X-4) were compared.
Comparing Case 5 and Case 7 in Figure 10a, the FCE of Case 7 with (larger hole exit area) was always high at all blowing ratios except for M = 1.0. In other combinations (0-X-3, 7-X-3, 14-X-3, and 7-X-4), cases with a large generally showed higher FCE, which was caused by the adequately distributed coolant for the larger hole exit area cases.
Case 7 has a relatively large exit area compared to the other cases in Figure 10, so the coolant momentum at the exit was small. Therefore, even when the blowing ratio increased, the FCE tended to increase. However, for Cases 6, 8, and 9, where the hole exit area was relatively small, the FCE tended to decrease as the blowing ratio increased. The effect of the hole exit area on the FCE is discussed in detail in Section 3.5.
3.4. Optimized Fan-Shaped Hole
The optimized hole shape was derived using the response surface methodology [12]. Table 2 shows the area averaged film-cooling effectiveness of 13 cases at DR = 2.0. Table 3 shows , , , AR, and the predicted FCE of the optimized hole. For all blowing ratios, the optimum value of appeared at the maximum value of 13 degrees, and showed the optimum value at the minimum value of 2. That means that for the given range of shape parameters, cases with a larger hole exit area resulted in a higher FCE. showed that the optimization angle also increased as the blowing ratio increased. Therefore, it could be concluded that, for a higher FCE, the hole exit area should be enlarged for a higher blowing ratio condition to reduce the coolant momentum at the hole exit.
Figure 11 shows the optimized hole for each blowing ratio = 90 m/s and DR = 2.0. The reference case (7-7-3) is also presented for comparison. As discussed above, the hole exit area became larger as the blowing ratio increased, to effectively reduce the coolant momentum at the hole exit. The same tendency was observed in the results of the low-speed condition in Figure 12 [14]. Furthermore, the hole shapes for both mainstream conditions were very similar, except for the M = 2.5 case. Therefore, for the given range of shape parameters, the low-speed experiment was able to provide similar results to that of the higher mainstream condition.
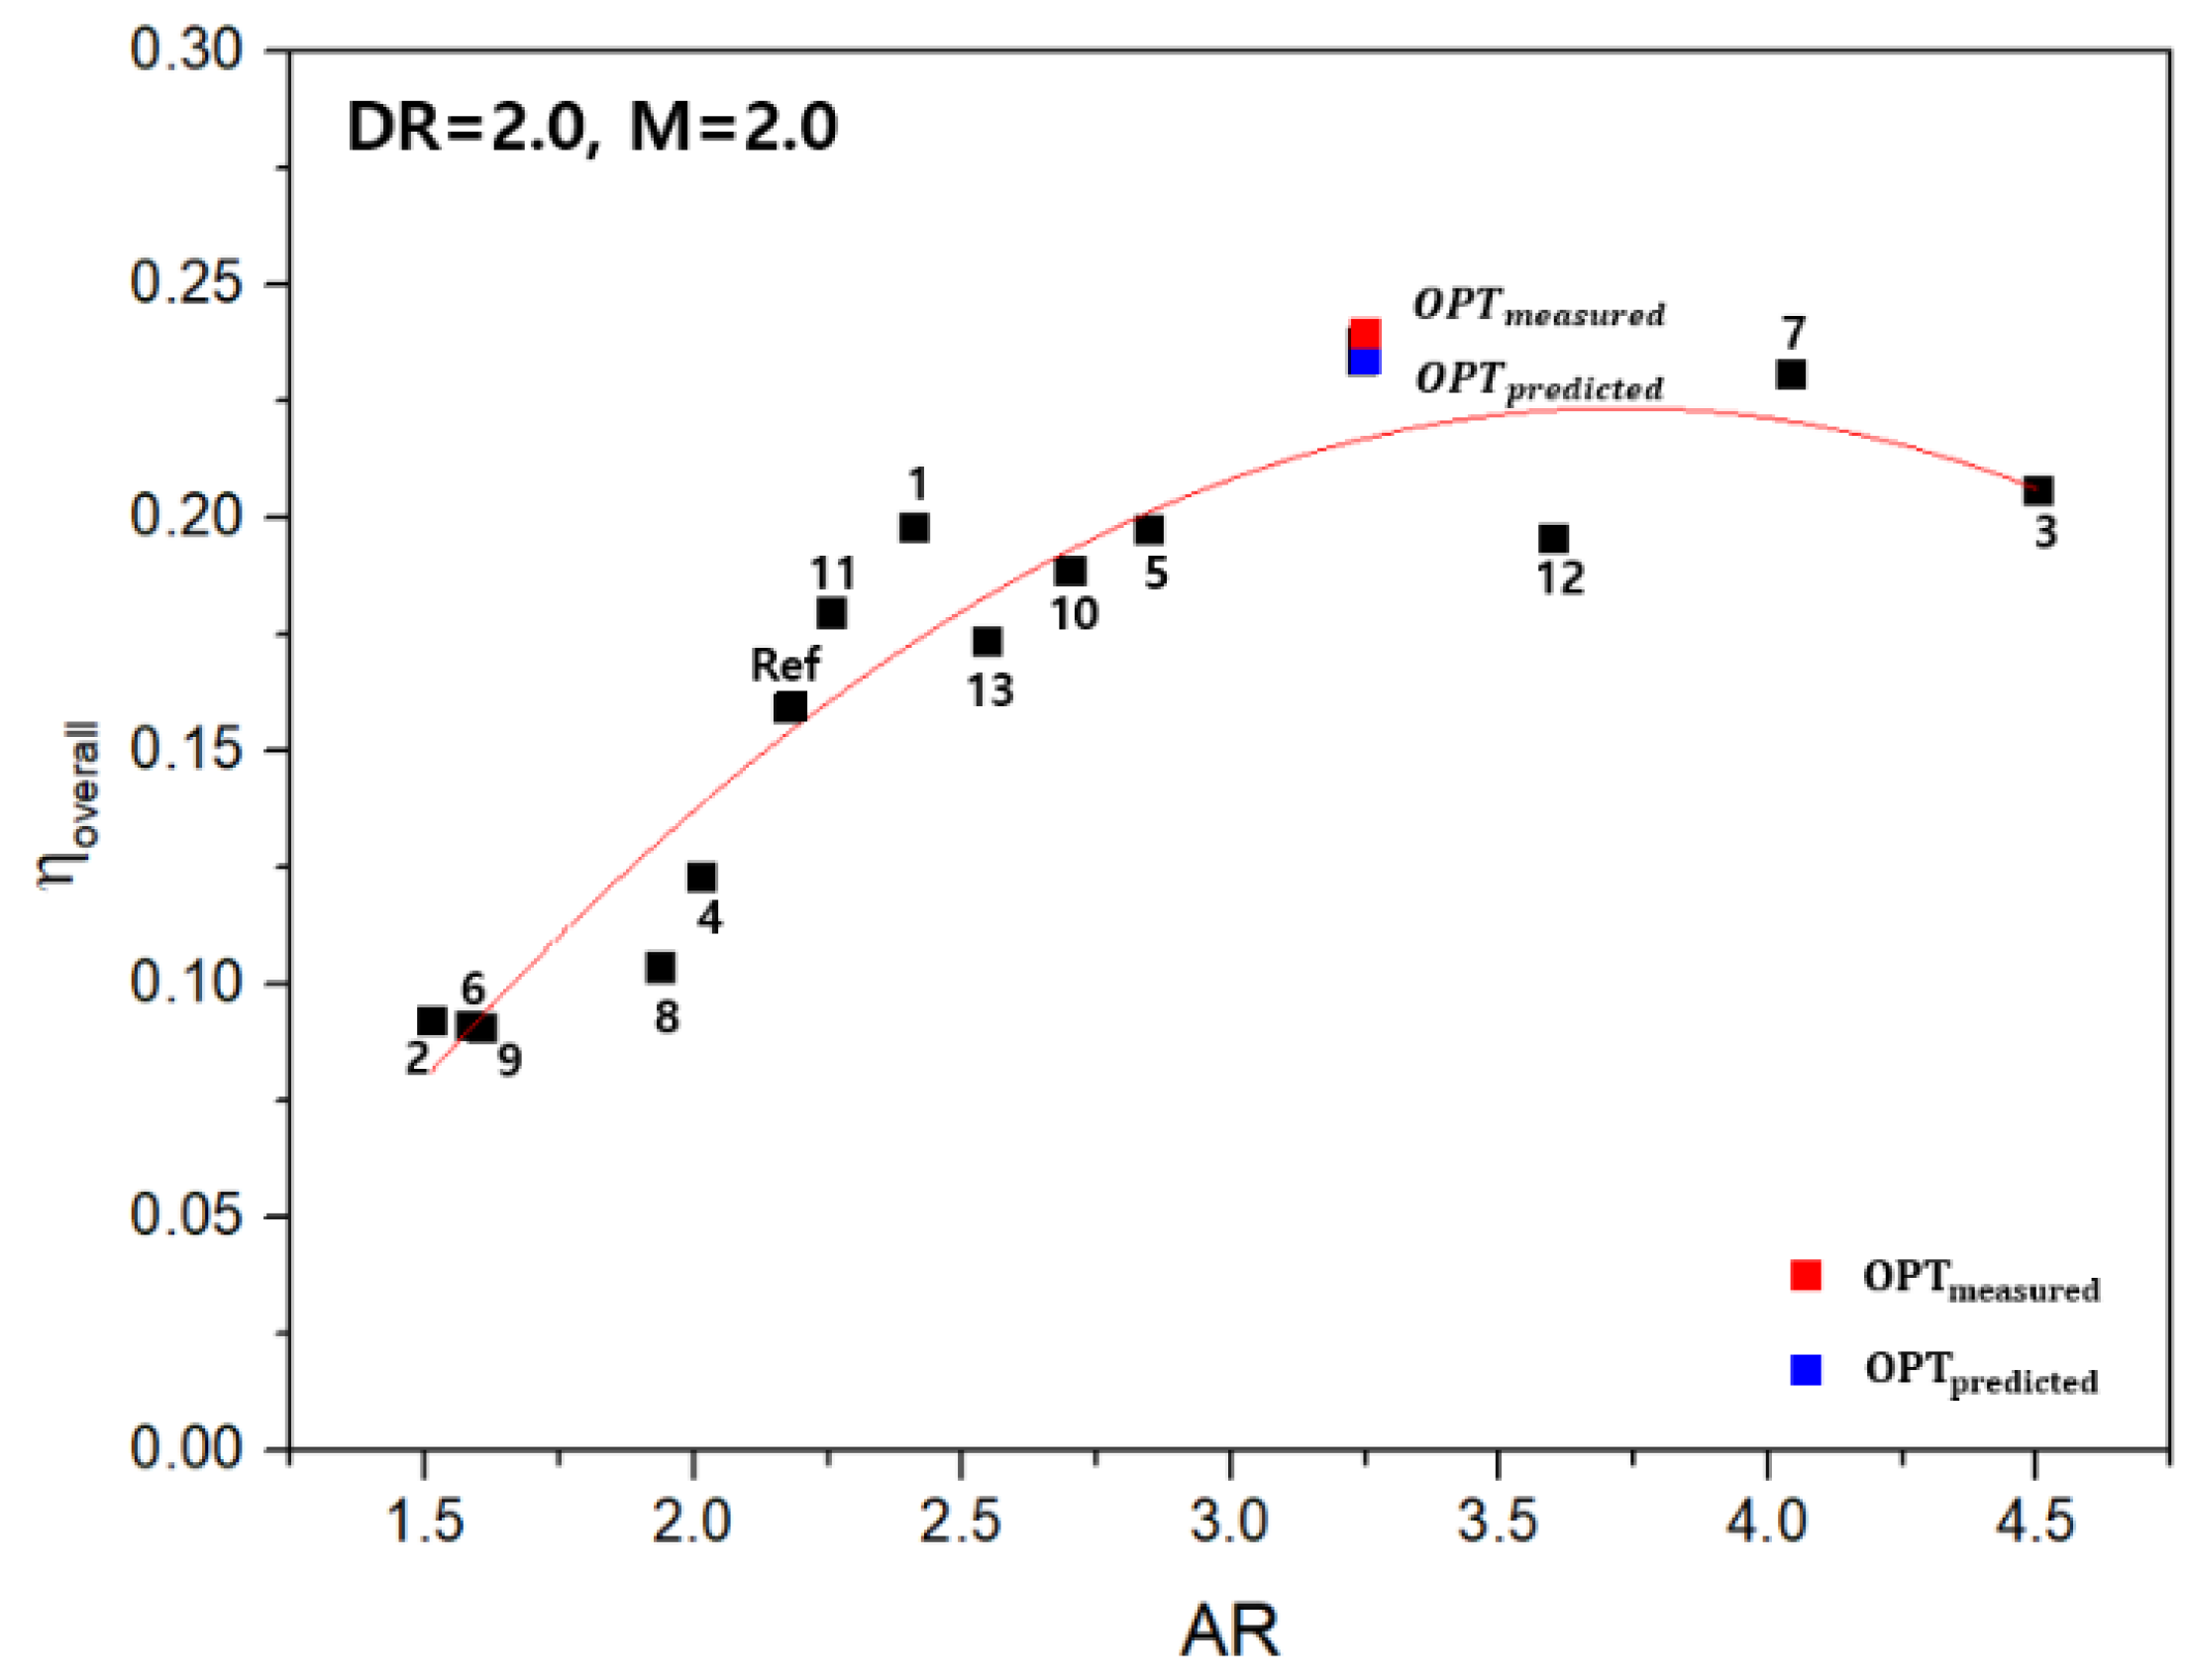
3.5. Effects of the Area Ratio
Figure 13 presents the overall averaged FCE for AR at DR = 2.0 and M = 2.0. The derived optimized hole at this condition was manufactured and tested to confirm the optimized results. The experimental results showed that the overall averaged FCE of the optimized hole was 0.2380, and the difference between the predicted value (0.2339) and the measured value was about 1.7%. In addition, this optimized hole showed a 49.3% improvement in the FCE compared to the reference hole under the same conditions.
Figure 13 clearly shows the effect of AR on the overall averaged FCE. The FCE increased as the AR increased up to AR = 3.5, and above AR = 3.5 the FCE tended to decrease due to the excessive coolant momentum. This was caused by the coolant lift-off for the higher blowing ratio due to the increased coolant momentum at the hole exit. The same tendency was observed in the low-speed results provided by Park et al. [14].
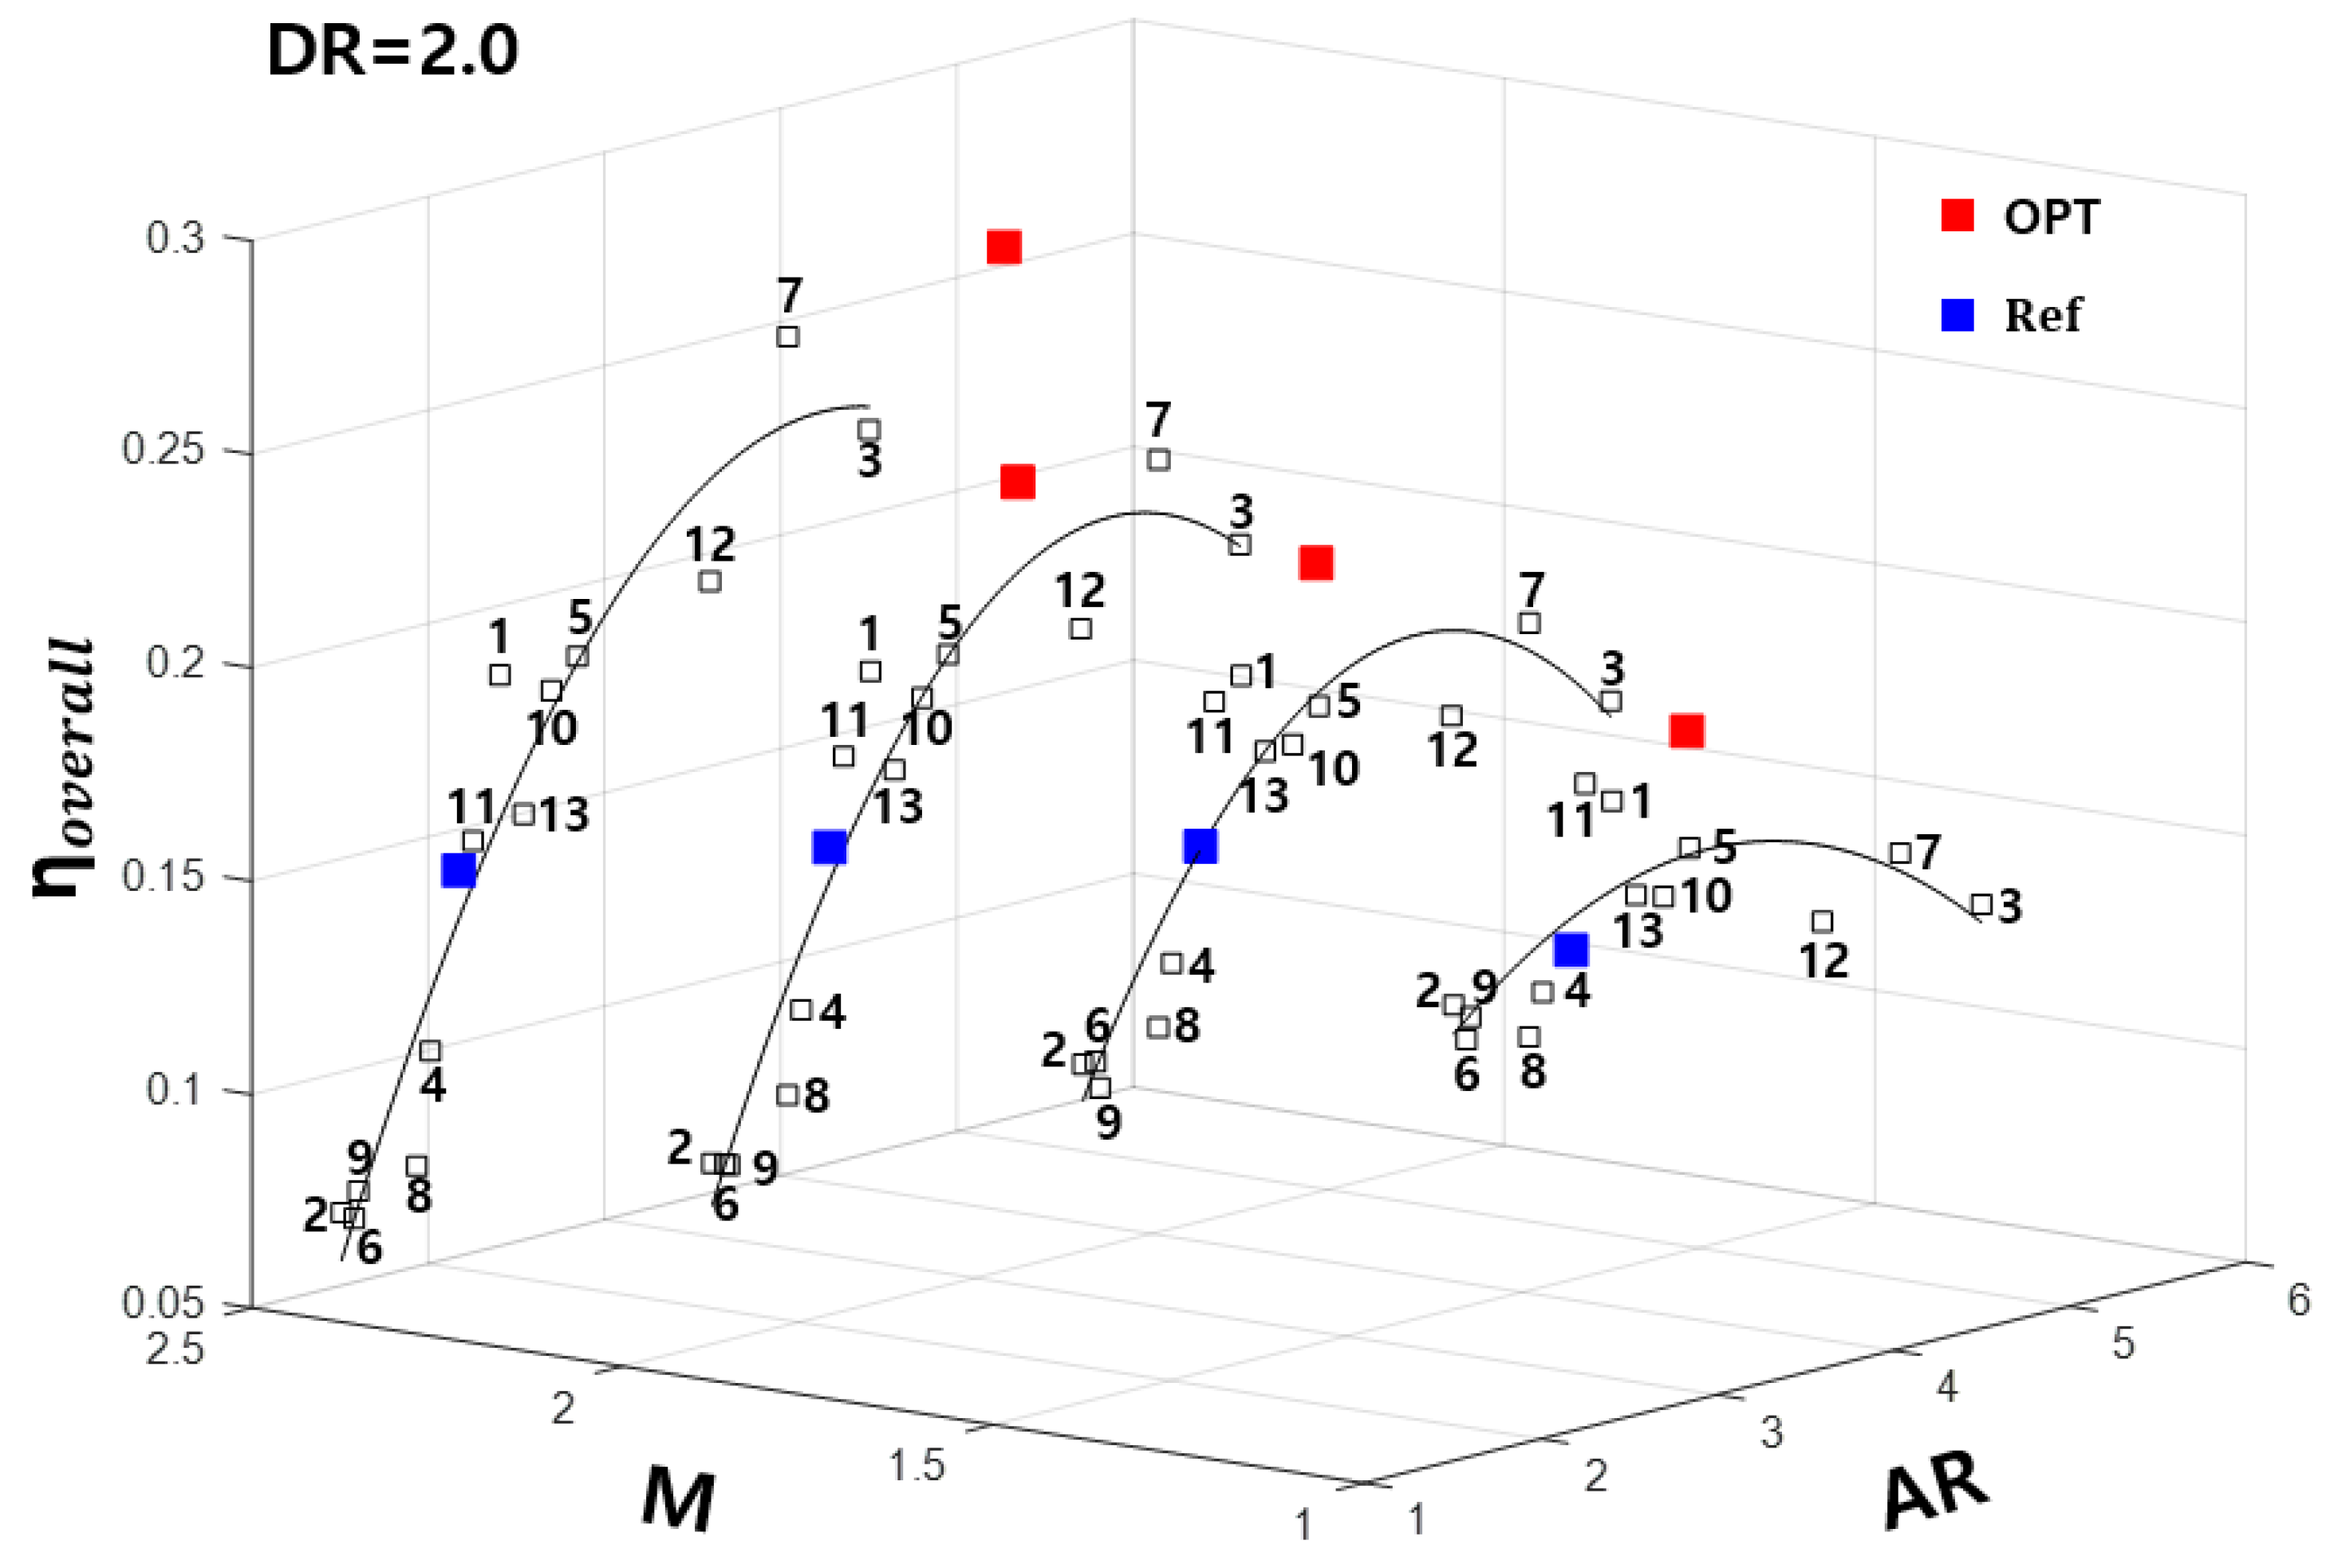
Figure 14 shows the overall averaged FCE for AR at DR = 2.0 and at all the considered blowing ratios. As mentioned, as the blowing ratio increased, the exit area of the optimized hole and the overall averaged FCE tended to increase.
In Figure 14, the cases can be grouped according to the relation between the blowing ratio and the FCE. For smaller area ratio (AR < 2.1) cases (Cases 2, 4, 6, 8, and 9), the overall averaged FCE increased as the blowing ratio increased, while for larger area ratio (AR > 3.5) cases (Cases 3, 7, and 2), the overall FCE decreased as the blowing ratio increased. For other cases (2.1 < AR < 2.9), the highest FCE was observed at M = 1.5. Therefore, for the fan-shaped hole with selected ranges of shape parameters, the overall FCE was greatly affected by AR as well as the blowing ratio.
Due to the limitations of the experimental technique, only the film-cooling effectiveness was measured, and the heat transfer coefficient could not be acquired. Therefore, attention should be paid to apply the current results to film-cooling hole design.
4. Conclusions
In this study, the effects of the shape parameters of the fan-shaped hole on the FCE were experimentally investigated. The test matrix was derived using the Box–Behnken method. The FCE was measured through the pressure-sensitive paint technique, and the test was conducted under the 90 m/s mainstream velocity condition. One density ratio of 2.0 was considered and the blowing ratio ranged between 1 and 2.5. The results also were compared with results obtained at the low mainstream velocity condition (20 m/s) used by Park et al. [14]. The conclusions are summarized as follows.
- The effect of the blowing ratio on the FCE was inconsistent for each hole shape, and this tendency was the same as that in the low-speed tests.
- For the optimized hole, the hole exit area tended to increase as the blowing ratio increased, and this trend was also the same as that in the low-speed condition results.
- Under the 2.0 density ratio condition, the overall FCE for cases with smaller area ratios (AR < 2.1) decreased as the blowing ratio increased. For the cases with larger area ratios (AR > 3.5), the opposite trend was observed.
- An optimized hole at the blowing ratio (M) of 2.0 and density ratio (DR) of 2.0 was manufactured and tested under the same conditions, and the difference between the measured and predicted FCE was about 1.7%. The optimized hole showed a 49.3% improvement in performance compared to the reference hole under the same conditions.
The current results have demonstrated that the film-cooling measurement at the low-speed condition showed a similar trend to that at the higher mainstream velocity. As a follow-up study, an experimental comparison between the flat plate tests at low-speed conditions and the cascade tests at the engine representing the Reynolds number or Mach number conditions is recommended.
Author Contributions
Conceptualization, S.I.L., J.Y.J. and J.S.K.; methodology, S.I.L. and J.Y.J.; software, S.I.L. and J.Y.J.; validation, S.I.L. and Y.J.S.; formal analysis, S.I.L. and Y.J.S.; investigation, S.I.L. and Y.J.S.; resources, J.S.K.; data curation, S.I.L. and Y.J.S.; writing—original draft preparation, S.I.L. and J.S.K.; writing—review and editing, S.I.L. and J.S.K.; visualization, S.I.L.; supervision, J.S.K.; project administration, J.S.K.; funding acquisition, J.S.K. All authors have read and agreed to the published version of the manuscript.
Funding
This work was supported by Ministry of Industry, Trade & Energy—Republic of Korea through the Aerospace Component Technology Development Program (Grant No. 10083654) and Korea Energy Technology Evaluation and Planning (Grant No. 20193310100050).
Institutional Review Board Statement
Not applicable.
Informed Consent Statement
Not applicable.
Data Availability Statement
Not applicable.
Conflicts of Interest
The authors declare no conflict of interest.
Nomenclature
| Area ratio = | ||
| Hole exit area | () | |
| Hole inlet area | () | |
| Boundary layer | () | |
| Hole diameter (=1.5 mm) | () | |
| Density ratio = | ||
| Hole length | () | |
| Forward expansion section length | () | |
| Metering section length | () | |
| Blowing ratio = | ||
| Inlet static pressure | () | |
| Air tank pressure | () | |
| Inlet temperature | (K) | |
| Thickness of the test plate | ||
| Coolant velocity | () | |
| Mainstream velocity | () | |
| Reference | ||
| Optimized | ||
| Inlet velocity | () | |
| Hole injection angle | () | |
| Forward expansion angle | () | |
| Lateral expansion angle | () | |
| Coolant density | () | |
| Mainstream density | () | |
| Film-cooling effectiveness | ||
| Overall averaged film-cooling effectiveness |
References
- Han, J.C.; Dutta, S.; Ekkad, S. Gas Turbine Heat Transfer and Cooling Technology; CRC Press: Boca Raton, FL, USA, 2012. [Google Scholar]
- Bogard, D.G.; Thole, K.A. Gas turbine film cooling. Propuls. Power 2006, 22, 249–270. [Google Scholar] [CrossRef] [Green Version]
- Goldstein, R.J.; Eckert, E.R.G.; Ramsey, J.W. Film cooling with injection through holes: Adiabatic wall temperatures downstream of a circular hole. J. Eng. Power 1968, 90, 384–393. [Google Scholar] [CrossRef]
- Liess, C. Experimental investigation of film cooling with ejection from a row of holes for the application to gas turbine blades. ASME J. Eng. Power 1975, 97, 21–27. [Google Scholar] [CrossRef]
- Singh, K.; Premachandran, B.; Ravi, M.R. Experimental assessment of film cooling performance of short cylindrical holes on a flat surface. Heat Mass Transf. 2016, 52, 2849–2862. [Google Scholar] [CrossRef]
- Yamawaki, S.; Maya, T.; Haven, B.A.; Yamagata, D.K.; Kurosaka, M.; Yamawaki, S.; Maya, T. Anti-kidney pair of vortices in shaped holes and their influence on film cooling effectiveness. In Proceedings of the ASME 1997 International Gas Turbine and Aeroengine Congress and Exhibition, Volume 3: Heat Transfer; Electric Power; Industrial and Cogeneration, Orlando, FL, USA, 2–5 June 1997. V003T09A007. [Google Scholar]
- Kohil, A.; Bogard, D.G. Effects of hole shape on film cooling with large angle injection. In Proceedings of the ASME 1999 International Gas Turbine and Aeroengine Congress and Exhibition, Volume 3: Heat Transfer; Electric Power; Industrial and Cogeneration, Indianapolis, IN, USA, 7–10 June 1999. V003T01A045. [Google Scholar]
- Lu, Y.; Dhungel, A.; Ekkad, S.V.; Bunker, R.S. Film cooling measurements for cratered cylindrical inclined holes. J. Turbomach. 2009, 131, 011005. [Google Scholar] [CrossRef]
- Gritsch, M.; Colban, W.; Schär, H.; Döbbeling, K. Effect of hole geometry on the thermal performance of fan-shaped film cooling holes. ASME Pap. 2005, 127, 718–725. [Google Scholar] [CrossRef]
- Anderson, J.B.; Wilkes, E.K.; McClintic, J.W.; Bogard, D.G. Effects of freestream Mach number, Reynolds number, and boundary layer thickness on film cooling effectiveness of shaped holes. In Proceedings of the ASME Turbo Expo 2016: Turbomachinery Technical Conference and Exposition, Volume 5C: Heat Transfer, Seoul, Korea, 13–17 June 2016. V05CT19A003. [Google Scholar]
- Haydt, S.; Lynch, S.; Lewis, S. The effect of area ratio change via increased hole length for shaped film cooling holes with constant expansion angles. J. Turbomach. 2018, 140, 140. [Google Scholar] [CrossRef] [Green Version]
- Zhang, C.; Wang, J.; Liu, X.; Song, L.; Li, J.; Feng, Z. Experimental and numerical study on the flat-plate film cooling enhancement using the vortex generator downstream for the fan-shaped hole configuration. J. Turbomach. 2020, 142, 031006. [Google Scholar] [CrossRef]
- Bezerra, M.A.; Santelli, R.E.; Oliveira, E.P.; Villar, L.S.; Escaleira, L.A. Response surface methodology (RSM) as a tool for optimization in analytical chemistry. Talanta 2008, 76, 965–977. [Google Scholar] [CrossRef] [PubMed]
- Park, S.H.; Kang, Y.J.; Seo, H.J.; Kwak, J.S.; Kang, Y.S. Experimental optimization of a fan-shaped film cooling hole with 30 degrees-injection angle and 6-hole length-to-diameter ratio. Int. J. Heat Mass Transf. 2019, 144, 118652. [Google Scholar] [CrossRef]
- Kim, J.H.; Kim, K.Y. Performance evaluation of a converging-diverging film-cooling hole. Int. J. Therm. Sci. 2019, 142, 295–304. [Google Scholar] [CrossRef]
- Kim, S.M.; Lee, K.D.; Kim, K.Y. A comparative analysis of various shaped film-cooling holes. Heat Mass Transf. 2012, 48, 1929–1939. [Google Scholar] [CrossRef]
- Seo, H.J.; Kang, Y.J.; Lee, H.C.; Kwak, J.S.; Park, J.S.; Lee, K.D. Optimization of the configuration of the laidback fan-shaped film cooling hole with a lateral expansion angle of 10 degrees. Appl. Therm. Eng. 2019, 153, 379–389. [Google Scholar] [CrossRef]
- Han, J.C.; Rallabandi, A. Turbine blade film cooling using PSP technique. Front. Heat Mass Transf. (FHMT) 2010, 1, 1. [Google Scholar] [CrossRef]
- Chen, A.F.; Li, S.J.; Han, J.C. Film cooling for cylindrical and fan-shaped holes using pressure-sensitive paint measurement technique. J. Thermophys. Heat Transf. 2015, 29, 775–784. [Google Scholar] [CrossRef]
Figure 1.
Transonic turbine cascade test rig.

Figure 2.
Schematic of the test rig.

Figure 3.
Velocity, pressure, temperature, and valve opening during the test.

Figure 4.
Schematic of the test section.

Figure 5.
Velocity profile 20 mm upstream from the film-cooling hole.

Figure 6.
Shape parameters of the fan-shaped hole.

Figure 7.
Distribution of the FCE.

Figure 8.
Overall averaged FCE for X-7-3 cases.

Figure 9.
Overall averaged FCE for 7-7-X cases.

Figure 10.
Overall averaged FCE for .


Figure 11.
Optimized holes at DR = 2.0 ().

Figure 12.
Optimized holes at DR = 2.0 () [14]. Reprint with permission from Elsevier (License number 5087330955198).
Figure 12.
Optimized holes at DR = 2.0 () [14]. Reprint with permission from Elsevier (License number 5087330955198).


Figure 13.
Overall averaged FCE for area ratio (M = 2.0).

Figure 14.
Overall averaged FCE for area ratio.


Table 1.
Fan-shaped holes dimensions [14]. Reprint with permission from Elsevier (License number 5087330955198).
Table 1.
Fan-shaped holes dimensions [14]. Reprint with permission from Elsevier (License number 5087330955198).
| Case No. | AR | |||
|---|---|---|---|---|
| Reference | 7 | 7 | 3 | 2.18 |
| Case 1 | 0 | 10 | 2 | 2.41 |
| Case 2 | 0 | 10 | 4 | 1.51 |
| Case 3 | 14 | 10 | 2 | 4.50 |
| Case 4 | 14 | 10 | 4 | 2.01 |
| Case 5 | 7 | 7 | 2 | 2.85 |
| Case 6 | 7 | 7 | 4 | 1.58 |
| Case 7 | 7 | 13 | 2 | 4.04 |
| Case 8 | 7 | 13 | 4 | 1.94 |
| Case 9 | 0 | 7 | 3 | 1.60 |
| Case 10 | 14 | 7 | 3 | 2.70 |
| Case 11 | 0 | 13 | 3 | 2.25 |
| Case 12 | 14 | 13 | 3 | 3.60 |
| Case 13 | 7 | 10 | 3 | 2.54 |
Table 2.
Overall averaged FCE for 13 cases (DR = 2.0).
| M = 1.0 | M = 1.5 | M = 2.0 | M = 2.5 | |
|---|---|---|---|---|
| Case 1 | 0.1952 | 0.2109 | 0.1982 | 0.1837 |
| Case 2 | 0.1567 | 0.1292 | 0.0923 | 0.0671 |
| Case 3 | 0.1493 | 0.1832 | 0.2062 | 0.2195 |
| Case 4 | 0.1545 | 0.1476 | 0.1230 | 0.0997 |
| Case 5 | 0.1797 | 0.1992 | 0.1976 | 0.1835 |
| Case 6 | 0.1479 | 0.1290 | 0.0913 | 0.0650 |
| Case 7 | 0.1661 | 0.2063 | 0.2309 | 0.2461 |
| Case 8 | 0.1448 | 0.1333 | 0.1038 | 0.0735 |
| Case 9 | 0.1529 | 0.1226 | 0.0909 | 0.0711 |
| Case 10 | 0.1698 | 0.1917 | 0.1890 | 0.1770 |
| Case 11 | 0.2008 | 0.2064 | 0.1798 | 0.1464 |
| Case 12 | 0.1546 | 0.1892 | 0.1958 | 0.1933 |
| Case 13 | 0.1718 | 0.1917 | 0.1738 | 0.1497 |
Table 3.
Values for the optimized holes (DR = 2.0).
| AR | |||||
|---|---|---|---|---|---|
| M = 1.0 | 2.8331 | 0.2072 | |||
| M = 1.5 | 2.8331 | 0.2329 | |||
| M = 2.0 | 3.2422 | 0.2339 | |||
| M = 2.5 | 5.2677 | 0.2544 |
Publisher’s Note: MDPI stays neutral with regard to jurisdictional claims in published maps and institutional affiliations. |
© 2021 by the authors. Licensee MDPI, Basel, Switzerland. This article is an open access article distributed under the terms and conditions of the Creative Commons Attribution (CC BY) license (https://creativecommons.org/licenses/by/4.0/).
Share and Cite
MDPI and ACS Style
Lee, S.I.; Jung, J.Y.; Song, Y.J.; Kwak, J.S. Effect of Mainstream Velocity on the Optimization of a Fan-Shaped Film-Cooling Hole on a Flat Plate. Energies 2021, 14, 3573. https://0-doi-org.brum.beds.ac.uk/10.3390/en14123573
AMA Style
Lee SI, Jung JY, Song YJ, Kwak JS. Effect of Mainstream Velocity on the Optimization of a Fan-Shaped Film-Cooling Hole on a Flat Plate. Energies. 2021; 14(12):3573. https://0-doi-org.brum.beds.ac.uk/10.3390/en14123573
Chicago/Turabian StyleLee, Soo In, Jin Young Jung, Yu Jin Song, and Jae Su Kwak. 2021. "Effect of Mainstream Velocity on the Optimization of a Fan-Shaped Film-Cooling Hole on a Flat Plate" Energies 14, no. 12: 3573. https://0-doi-org.brum.beds.ac.uk/10.3390/en14123573
Note that from the first issue of 2016, this journal uses article numbers instead of page numbers. See further details here.