
The Effect of Ceiling Heating and Mechanical Ventilation on Thermal Comfort

1
Department of Building Services and Process Engineering, Budapest University of Technology and Economics, 1111 Műegyetem rkp. 3-9, D122 Budapest, Hungary
2
Faculty of Engineering and Information Technology, University of Pécs, Boszorkány át 2,, 7624 Pécs, Hungary
*
Author to whom correspondence should be addressed.
Energies 2021, 14(12), 3712; https://0-doi-org.brum.beds.ac.uk/10.3390/en14123712
Submission received: 6 May 2021
/
Revised: 11 June 2021
/
Accepted: 15 June 2021
/
Published: 21 June 2021
(This article belongs to the Special Issue Energy Efficiency of the Buildings)
Abstract
:In the case of public buildings with ceiling heating and mechanical ventilation, radiant temperature asymmetry caused by the warm ceiling and draught occur simultaneously. The currently available literature does not offer an exhaustive description of the comfort conditions resulting from such a thermal environment. This research focuses on complementing the available knowledge, using instrumental measurements, as well as subject measurements carried out on 20 individuals. Relying on these measurements, the purpose of the research is to support the understanding of the combined mechanisms of action of the two local discomfort parameters. The main result of this research is that, if the predicted percentage dissatified is less than 6%, the radiant temperature asymmetry is in an interval of 5–15 °C, and the draught rate is 15% or 25%, the actual mean vote and the predicted mean vote values differ significantly, and the actual mean vote is always lower, with a few exceptions. In addition, the research highlights the changes of the actual mean vote caused by raising the draught rate from 15% to 25%, in the presence of radiant temperature asymmetry caused by warm ceilings.
1. Introduction
The energy-building-comfort system is a tightly connected unit which must be continuously and dynamically reassessed. Nowadays, rationalisation of the energy use is receiving more and more attention, a fact also proved by directives of great impact, such as the Energy performance of buildings directive [1]. The thermal conditions of the delimiting structures of the buildings are improving due to stricter energy regulations, thereby reducing the heating demand of buildings.
Due to the decreasing heating demands, low temperature space heating systems are becoming more and more popular [2]. In Germany, Austria and Denmark, 30% to 50% of the new buildings have surface heating, in Korea, a vast majority of residential buildings are heated by surface heating [3]. The radiant heating and cooling systems are gaining much popularity also due to high comfort, reduced energy consumption, a more quiet operation and space saving [4]. Many heat sources function more efficiently with surface tempering systems, this is also a reason why surface heating and cooling technologies are gaining more and more ground. [5]
When using surface tempering, the extent of the discomfort effect caused by the ceiling heating must be clarified. This is important because buildings are meant to provide first of all optimal comfort to human activity [6]. This makes it increasingly important to ensure ideal thermal comfort in closed spaces, apartments, offices and other public buildings [6,7].
On the other hand, it is crucial to provide fresh air in order to improve indoor air quality and health [7]. Furthermore, in spaces with mechanical ventilation it is highly important to deal with the draught rate caused by the ventilation system. The draught appears due to the movement of the air and causes local cooling of the body. The draught rate decreases with the increase of the air temperature [8] and the intensity of the turbulence also has an impact on the perception of the draught [9]. The importance of the draught is also underlined by Toftum [10].
Setting the ideal thermal comfort parameters for a public building is a statistical challenge, since in a given space, many people who have divergent preferences and perceive different thermal environments as ideal may work together.
The main challenge in establishing the optimal thermal environment is that the thermal comfort is a state which can be quantified by the measurement of other parameters and by applying a mathematical model to interpret the obtained results, or by using comfort surveys.
The discipline dealing with thermal comfort models is relatively new, one of the first articles in this filed was published in 1936 [11]. A further considerable result was MacPherson’s [12] article in which he stated that the thermal comfort depends on six parameters: the temperature of the air, the velocity of the air, the relative humidity of the air, the mean radiant temperature, the metabolic rate and the insulation of the clothing.
The biggest milestones of the thermal comfort research field are the results published by Fanger in 1970 [13], whereby he introduced a comfort index based on the so-called MacPherson parameters. This comfort model is known as the predicted mean vote (PMV) index and is still the most widely used thermal comfort index. It is complemented by the local discomfort factors [14]. This theory can be identified in many related standards as ISO 7730, ASHRAE 55. [15,16]
The state of the art regarding the local discomfort parameters is that the separate effect of these parameters is known, but in real life situation, the local discomfort factors occur together. A joint study of the cold wall and draught [17], as well as the cold wall and cold window [18] has already been carried out, and the effect of draught at different temperature parameters has also been studied [19].
However, the combined effect of the warm ceiling resulting from ceiling heating and the draught caused by ventilation is still a topic with incomplete literature. This is the main gap in the state of the art and it has high potential for further studies.
In order to eliminate the shortcomings in the literature concerning the combined effect of radiant temperature asymmetry and draught, we carried out instrumental measurements and human subject measurements, in an attempt to answer the following questions:
- -
- If PPD < 6%, radiant temperature asymmetry varies in an interval of 5–15 °C and draught rate is DR = 15% or DR = 25%, then are AMV and PMV values the same or are they significantly different?
- -
- If the value of the AMV is different, is it lower or higher than the PMV?
- -
- If the PMV value is constant, does the change in radiant temperature asymmetry relevantly influence the AMV value?
- -
- If the AMV changes with the radiant temperature asymmetry, to what extent does it change?
- -
- By increasing the draught rate from DR = 15% to DR = 25%: is the AMV value effected significantly?
Our goal was to provide an estimation of the the overall thermal sensation in buildings with ceiling heating and mechanical ventilation.
2. Methods
The purpose and the novelty of the research is the assessment of the comfort environments where the draught rate and radiant thermal asymmetry values are different, while the PMV value is constant and ideal.
In order to make sure that the desired radiant thermal asymmetry and the draught rate values were met while the PMV value was kept constant, we made instrumental measurements.
The AMV votes presented in this paper were given by the human subjects who were asked to assess the comfort environments. The provided votes were evaluated using two different mathematical methods to make sure that the conclusions drawn are mathematically correct.
The instrumental and human subject tests were carried out in the Macskásy Comfort Laboratory of the Budapest University of Technology and Economics.
The comfort chamber where the measurements took place has two heat sources, and the walls, floor and ceiling of the chamber can be separetly heated and cooled with a hydronic heating and cooling system, so the desired radiant thermal asymmetry and mean radiant temperature can be achieved. The temperature, relative humidity and flow rate of the inlet air is also controllable.
The specific dimensions of the comfort chamber are 4 m × 4 m × 3 m, so that the floor area of the chamber is 16 m2 and the height is 3 m. The comfort chamber has a hydronic system, the pipes run in a drywall system. The heating and cooling energy was provided by two heat pumps, the walls, ceiling and floor had different piping systems and pumps, so that the temperatures of different surfaces can be controlled separately. The fresh air supply of the comfort chamber is provided by a central air handling unit.
The measuring set up has a central data acquisition system, where every measured parameter is visualised and registered.
2.1. Methodology
Throughout the process of jointly measuring the local discomfort parameters, we studied the effect of the warm ceiling and draught parameter pairs on thermal comfort. The thermal environment was kept neutral according to the PMV model for the entire duration of the measurements. Thus, PPD was always below 6% at the center point of the measuring chamber.
It is highly important to set up and maintain stationary thermal conditions that remain unchanged over time. During the measurements, the value pairs of radiant temperature asymmetry and draught rate must be provided in such a manner as to keep the temperature and PPD constant throughout the entire experiment (a time span of 3 h). In order to keep the conditions thermally stationary, we also needed to consider the heat transfer of the lighting, of the warm ceiling and that of the participants. Furthermore, the heat dissipation of any walls which are colder than the indoor air must also be taken into account. The equilibrium equation (Equation (1)) is as follows:
As mentioned before, in order to guarantee the relevance of the human subject measurements, it was crucial to keep the heat environment ideal throughout the measurements. The radiant temperature asymmetry and the draught were also kept at the desired value. To do so, the following steps were required:
- -
- Determining the surface temperature of the delimiting surfaces—this step allows the desired radiant temperature asymmetry to be set;
- -
- Specifying the temperature of the inlet air—the temperature and the volume of the inlet air ensure the thermally stationary state of the measuring chamber; at the same time, both of them influence the forecast draught rate;
- -
- Fine-tuning of the the air flow in the measuring chamber, with the aim of identifying and maintaining the desired draught rate.
During the measurement process, the factors affecting thermal comfort were examined at four planes: ankle level (0.1 m), knee level (0.6 m), head height level of a sitting person (1.1 m) and head height level of a standing person (1.7 m).
Figure 3 shows a spatial representation of the energy fluxes and measuring points listed in Equation (1). Figure 4 and Figure 5 show a side-view and a top-view of the measurement points.
Table 1 represents the measured and calculated parameters and the measurement errors.
2.2. Human Subject Measurements
The human subject measurements were performed in the comfort chamber of the Budapest University of Technology and Economics, taking into account the methodology curently used in similar measurements.
When designing the measurement of general thermal comfort, we relied on the measurement methods of Arens et al. [20] and Huizenga et al. [21], who performed local and overall thermal sensation and comfort measurements in a comfort chamber. In determining the research method of temperature asymmetry, we made use of the methods of Wang et al. [22] and Fang et al. [23]. In researching gender differences, we considered the measurement methods and results of Schellen et al. [24] and Kalmar et al. [25].
In determining the precise length of the measurement occasions, we relied on the descriptive article of Boestra et al. [26] and on the research of Wyon [27]. The latter contains a complete description of the framework to be considered in human subject tests. For the evaluation of work performance we also used the methodology described by Zhang et al. [28] and Wim et al. [29], in addition to the previously mentioned literature.
The human subject measurements were preceded by instrumental measurements, during which some relevant parameters were measured and recorded at the spatial points described above. These were the spatial distribution of the following factors: air velocity, air temperature and air humidity, the mean radiant temperature, PMV, PPD, Tu and DR. 10 cases were examined, characterised by five radiant temperature asymmetries and two draught rates, as follows:
- -
- radiant temperature asymmetry: 5 °C, 7 °C, 10 °C 12 °C, 15 °C;
- -
- draught rate: 15% and 25%.
For each asymmetry and draught parameter pair, the following conditions were met: first of all, the PPD value remained below 6%; second of all, the radiant temperature asymmetry and the DR value showing the draught rate could be kept at the required value.
A total of 20 subjects participated in the human subject measurements, 10 men and 10 women, all of them healthy. They evaluated the 10 thermal comfort environments defined above. During the measurements, a thermal environment was constantly stable, due to the thermally stationary state of the measuring chamber.
Every measurement lasted for three hours; throughout their duration, the participants were exposed to only one thermal environment defined by one asymmetry and one draught rate at a time. These thermal settings followed in random order so that no upward and downward trends could be inferred.
The rate of the supply air was 290 m3/h, which is an air exchange rate high enough to ensure a good indoor air quality for the participants, since only one subject at a time was present in the comfort chamber and the air exchange rate was 6 1/h. Close attention was paid to the elimination of acoustic discomfort and to the provision of adequate visual comfort. Thus, the visual, acoustic and indoor air comfort environment of the subjects was not compromised during the measurements. The subjects did not leave the measuring chamber throughout the duration of a measurement. If this was nevertheless necessary, the data collected half an hour after returning to the chamber was not used in the subsequent statistical analysis.
One measurement session consisted of six repetitive measurement blocks. Each measurement block lasted for thirty minutes and consisted of free activity, measurement of work efficiency, and thermal comfort voting. The participants provided paper-based information, which was then analyzed through mathematical methods.
The human subject measurements lasted for 3 h and consisted of six repeated modules of 30 min each. Table 2 presents the boundary conditions of the human subject measurements.
2.3. Methodology of Evaluation
In evaluating the results, we examined the correlations between the thermal comfort votes given under different conditions. Throughout the study, we always compared two sets using two different mathematical approaches. On the one hand, we used the Welch test and, on the other hand, the Mann-Whitney exact test to evaluate the results. Due to the significant differences in the nature of these two methods, we considered it safe to accept a relation of dependency or independence between two sets of votes, if both methods led to the same result.
The Welch test is one of the parametric tests among the statistical hypothesis tests. The test examines whether the means of probability variables in two separate samples differ significantly from each other. The information obtained during the studies of human subjects was defined as probability variables, according to which the null hypothesis of the test is that the expected values of two probability variables are the same. During the test, the significance level was determined to be 0.05. The test statistics of the Welch test are shown in Equation (2) and the definition of the degree of freedom is shown in Equation (3) [30]:
The null hypothesis and alternative hypothesis in the case of the Welch test are the following:
- H0: sub>0: The expected values of X and Y random variable are equal;
- H1: The expected values of X and Y random variable are not equal [30].
Belonging to the nonparametric tests, the Mann-Whitney test operates with rankings of values. The null hypothesis of this test is that there is an equal probability (i.e., of 50%) that one randomly selected element of one of two populations will be larger than any element of another population. The Mann-Whitney test’s confidence interval was defined as 95%. The null hypothesis and alternative hypothesis in the case of the Mann-Whitney test is the following:
- H0: sub>0: F1 = F2;
- H1: F1≠F2. [31].
3. Results
The subjects participating in the measurements evaluated their thermal environment, therefore the AMV values were available. The results show the average of these AMV values for a given radiant temperature asymmetry and draught rate as follows:
- -
- AMV as a function of radiant temperature asymmetry, in women, DR = 15% draught rate;
- -
- AMV as a function of radiant temperature asymmetry, in men, with DR = 15% draught rate;
- -
- AMV as a function of radiant temperature asymmetry, for women and men, with DR = 15% draught rate;
- -
- AMV as a function of radiant temperature asymmetry, in women, DR = 25% draught rate;
- -
- AMV as a function of radiant temperature asymmetry, in men, DR = 25% draught rate;
- -
- AMV as a function of radiant temperature asymmetry, for women and men, with DR = 25% draught rate;
For a better illustration of the results, the thermal enviroment parameters and the votes gained from the human subject measurements were organized into figures. The figures also display the 0.95 confidence intervals, as well as the mean AMV values; these are defined in function of the radiant temperature asymmetry (presented as dots in the figures). Each dot on Figure 6 and Figure 7 represents the expected value of 60 measurements each (in case of women or men). The points on Figure 8 represent the predicted value of 120 cumulative measurements. The points on Figure 9 and Figure 10 also represent the expected value of 60 measurements, while points on Figure 11 represent the predicted value of 120 measurements. These also show the votes given by each subject at six different moments during the measurement sessions (at 30, 60, 90, 120, 150 and at 180 min). These votes are represented in the figures below.
Figure 6 shows the AMV in function of radiant thermal asymmetry taking into account only women’s votes at a draught rate of 15%. In the interval of 5–10 °C radiant thermal asymmetry the increase of the asymmetry caused an increase in AMV. In the interval of 10–15 °C the increase of the radiant thermal asymmetry does not affect the AMV values, as it remains constant.
Instead of an initial increase in AMV, as seen in the case of women, the AMV value for men is constant at a draught rate of 15%. In this case, a significant increase can be noticed in the range of 10–15 °C, the value of AMV reaches its maximum at a radiation temperature asymmetry of 15 °C. This is shown on Figure 7.
The characteristic experienced by men and women is superimposed—thus it can be stated that, at a draught of 15%, taking into account the votes of all subjects, the increase of the radiant thermal asymmetry causes a significant increase of the AMV. This phenomenon is shown in Figure 8.
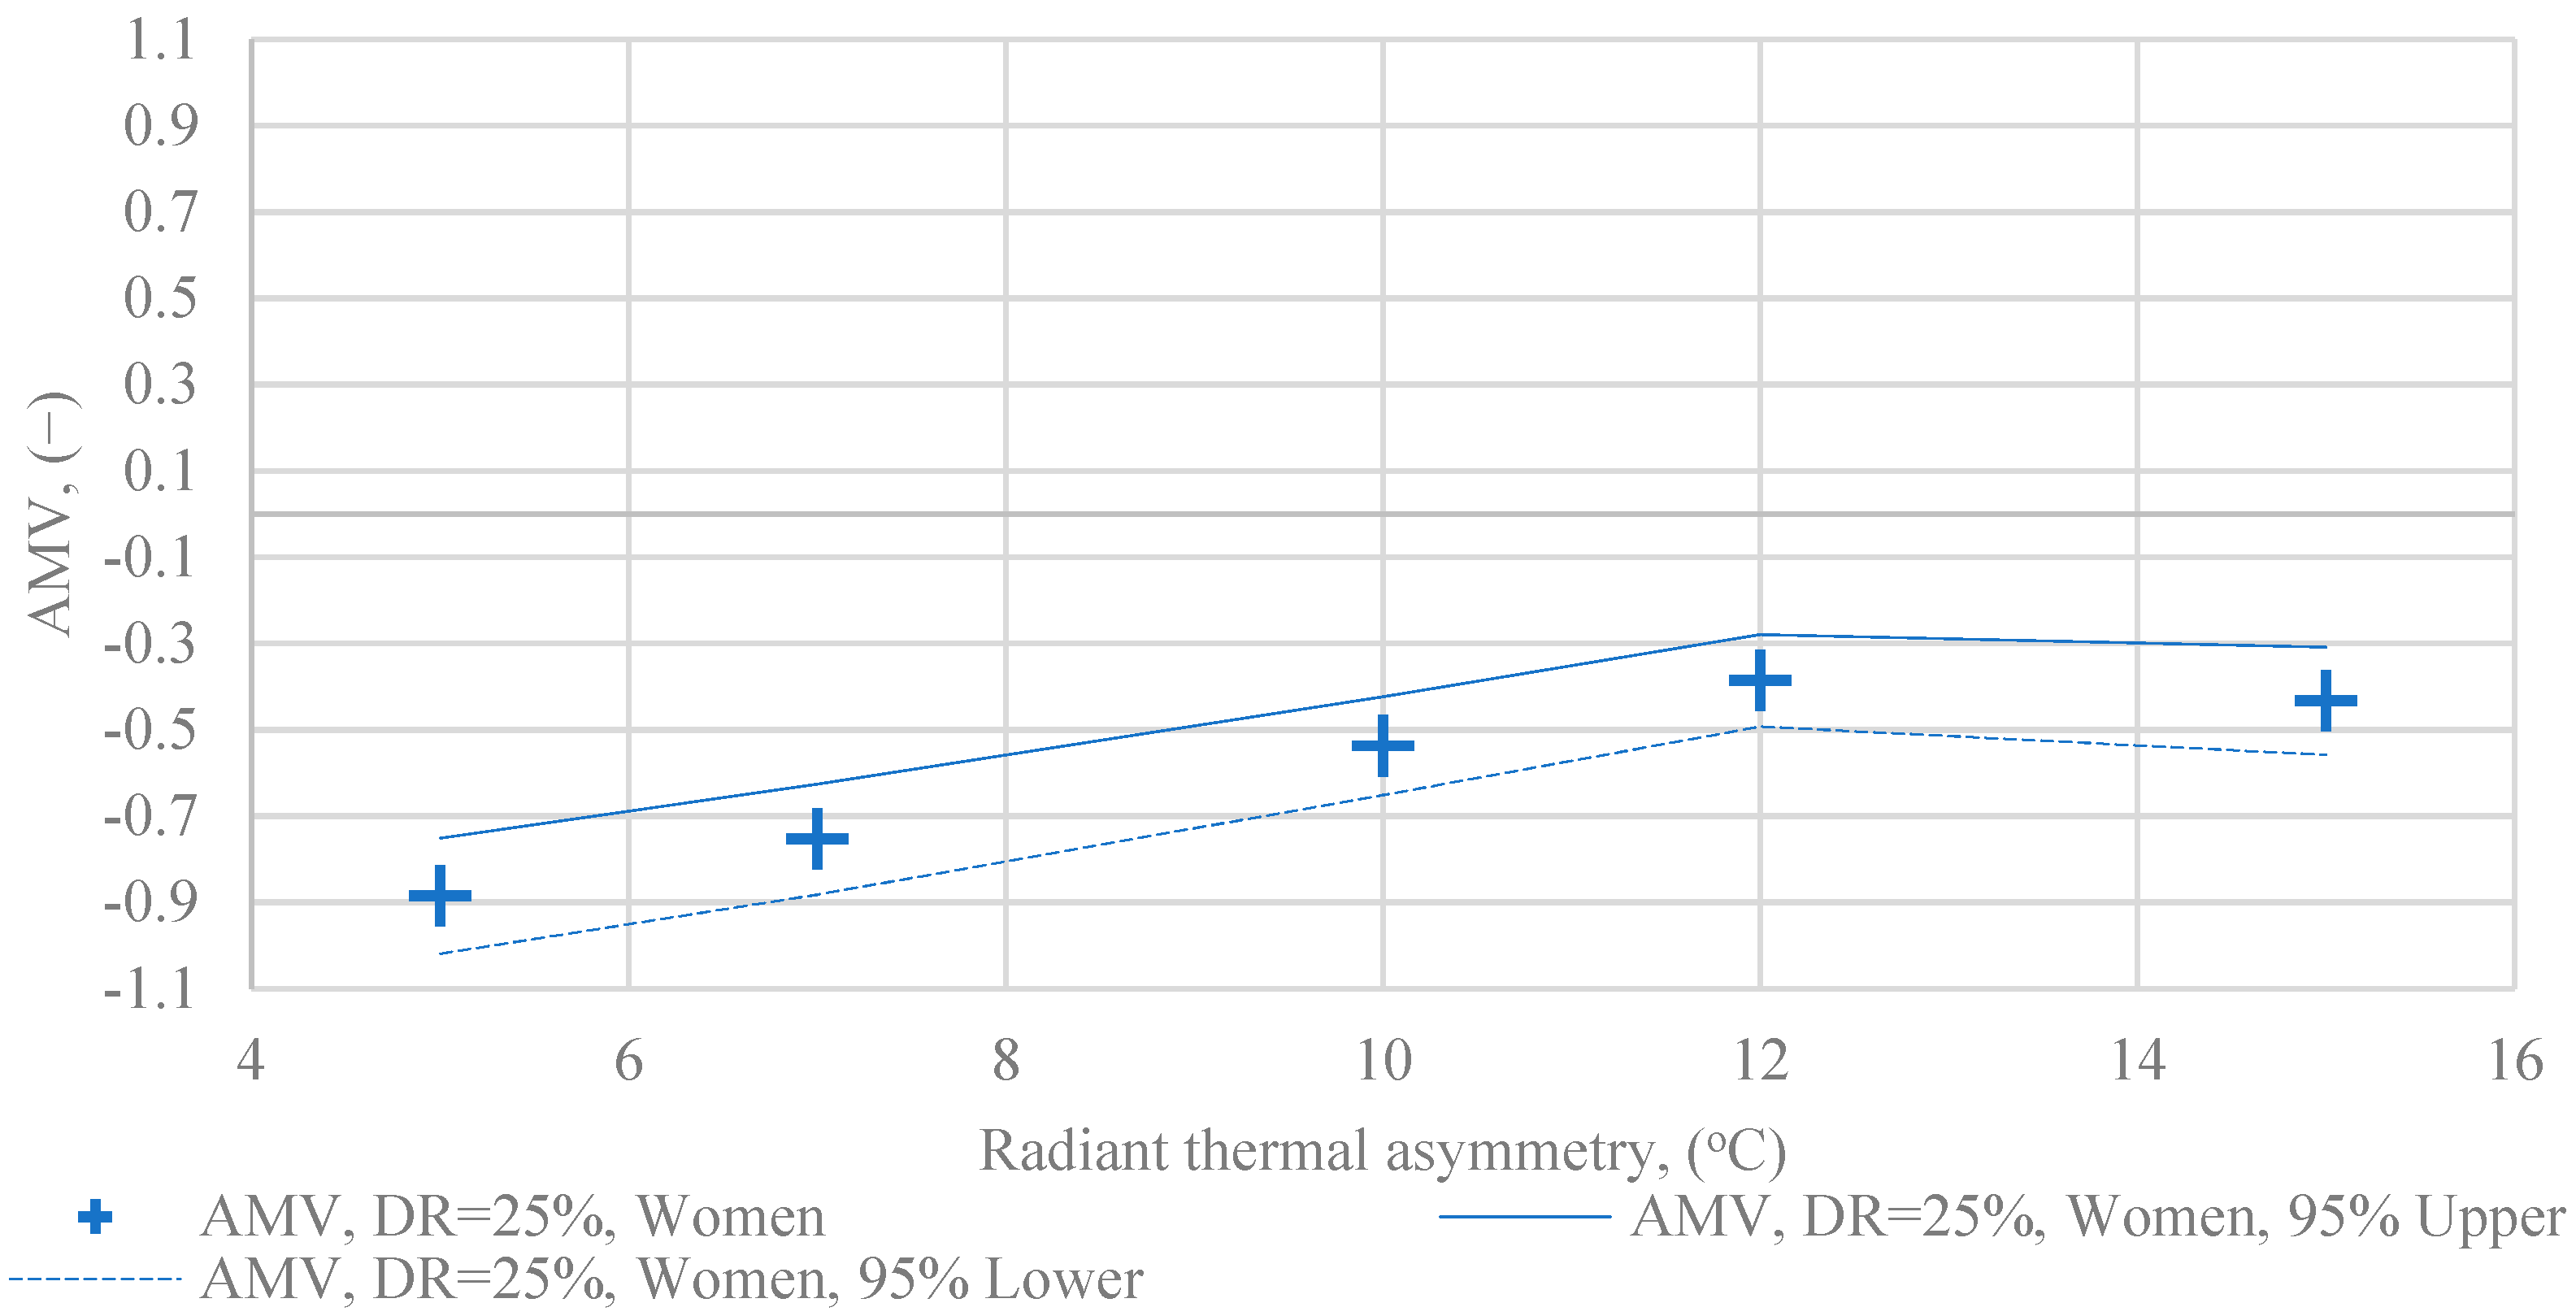
Figure 9, Figure 10 and Figure 11 show the AMV votes for women, men and all subjects at a 25% draught effect. Figure 9 shows that the trend observed at 15% draught also exists at 25% draught: in both cases, the AMV increases in the first part of the interval and then gets stabilized. In this case, however, the maximum value occurs with a higher radiation asymmetry and it results in a smaller absolute value.
For a draught rate of 25% the nature of the AMV votes of men is similar to the one seen at the draught rate of 15%: in both cases, there is an initial stagnation and then an increase in the range of 10–12 °C. Also in the case of men, there is a difference in the absolute value of AMV, as a lower AMV value is associated with a draught sensation of 25%. The phenomenon is shown in Figure 10.
Figure 11 shows the change of AMV as a function of radiant thermal asymmetry at 25% draught. Taking into account the votes of all human subjects, we can state that the value of AMV increases with the increase of the radiant thermal asymmetry, at a draught rate of 25%.
4. Discussion
4.1. Evaluation of the Results
In evaluating the results, we compared two examined data sets applying the Welch and Mann-Whitney methods, using the mathematical methods presented in Section 2.3. A statement was accepted if both methods gave the same result with at least 95% confidence. The results were examined and evaluated according to the following aspects:
- -
- the effect of the increase in draught on the AMV value in the interval between 5–15 °C;
- -
- a description of the differences between women’s and men’s votes;
- -
- change in AMV with increasing the radiant temperature asymmetry.
In the range of 5–10 °C radiant temperature asymmetry, by increasing the draught rate from DR 15% to 25%, the AMV value decreases significantly. In the 12–15 °C radiant temperature asymmetry range, increasing the draught rate has no significant effect on AMV, which could be identified using both the Welsh and Mann-Whitney test. These results are shown in Figure 12, which shows the mean of all votes and the lower and upper 95% confidence intervals.
Examining this phenomenon only in the case of female votes: in the 5–10 °C radiant temperature asymmetry interval the increase of the draught rate from DR 15% to 25% significantly reduces the AMV value, while in the 12–15 °C radiation asymmetry interval it has no effect on it. That is, in the case of female votes, the trend is the same as for all votes. These results are shown in Figure 13, showing the mean and confidence intervals for the female votes at 15% and 25% DR and 5, 7, 10, 12 and 15 °C radiant temperature asymmetry.
The evaluation of the male votes is shown on Figure 14, which shows results similar to Figure 13, only this time presenting the vote of the male subjects in the experiment. When using the Welch and Mann-Whitney tests together and comparing the results, it can be concluded that in the 5–10 °C radiant temperature asymmetry interval, increasing the draught rate from DR 15% to 25% has no significant effect on the AMV. In the interval of 12–15 °C, on the other hand, increasing the draught rate from 15% to 25% DR significantly reduces the value of AMV.
Figure 15 compares the votes of women and men, at a draught rate of DR = 15%. It can be stated that in the radiant temperature asymmetry interval of 5–15 °C, the AMV vote of men is higher in all cases.
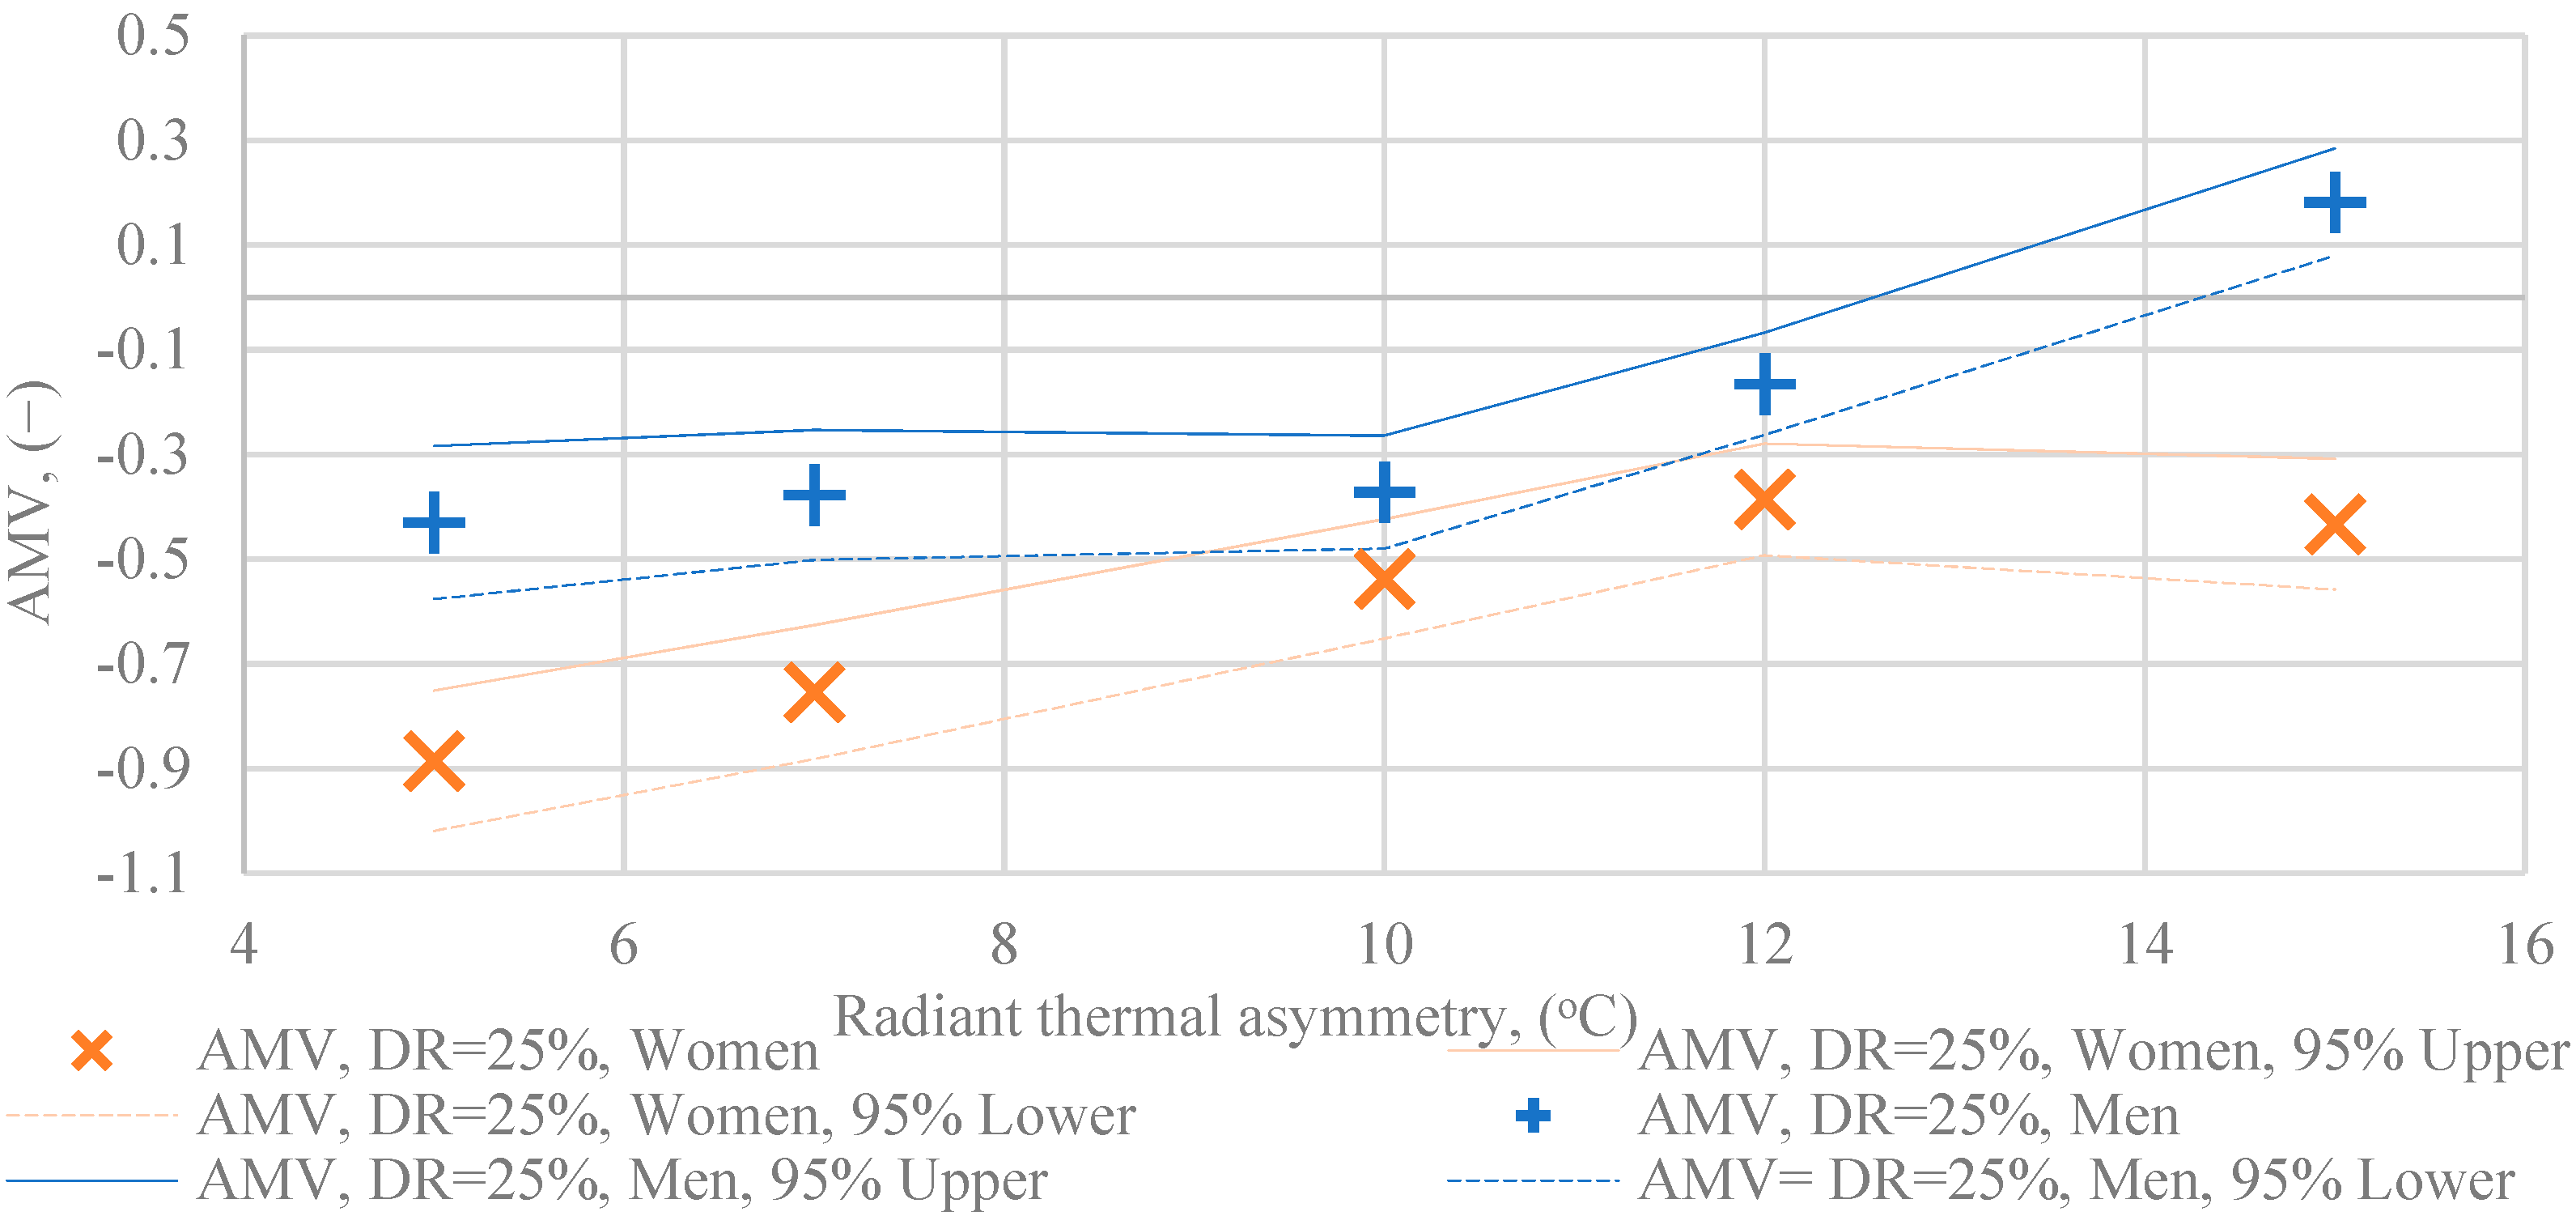
Similarly, for DR = 25% (Figure 16), the Welch and Mann-Whitney methods show a significant difference between the AMV votes of women and men. In this case, too, men´s votes are higher.
Examining the change in AMV votes with the change in radiant temperature asymmetry at different DR values, and the relationship between these AMV values, we come to the following conclusions:
- -
- in all cases, the value of the AMV differs significantly from the value of the PMV;
- -
- at DR = 15%, if all votes are taken into account: the AMV value surges alongside with the increase of the radiation temperature asymmetry, remaining below 0 for the whole interval;
- -
- at DR = 15%, considering women´s votes: the AMV value increases with increasing radiation temperature asymmetry, remaining below 0 for the entire interval;
- -
- at DR = 15%, considering the votes of men: the AMV value is constant in the range of 5–10 °C; then it increases, reaching a positive value at 15 °C asymmetry
- -
- the trends are similar also at a draught effect of DR = 25%.
4.2. Usability of the Results
The number of buildings with ceiling heating and mechanical ventilation is growing dynamically. Nevertheless, the combined effect of warm ceilings and draughts on thermal comfort and work efficiency has so far been unknown to both engineering practice and to the scientific world. In the course of our research, we kept in mind that the expected results, as well as their immediate applicability, are equally important for the professionals designing, implementing and operating building services systems, for real estate developers, employers, as well as comfort theory researchers.
The results presented in this article can be used for the estimation of the overall thermal comfort in buldings with ceiling heating and mechanical ventilation. Surely, the topic of the combined effect of warm ceilings and draught cannot be considered a complete and fully known research field. There are many additional research opportunities related to the combined effect of the aforementioned two discomfort paremeters—such as measuring its physiological effects. One outstanding way to do this is to measure the heart rate variance.
5. Conclusions
When considering buildings with ceiling heating and mechanical ventilation, it is particularly important to pay attention to the combined effect of the radiant temperature asymmetry caused by warm ceilings and draughts. The goal of this research was to eliminate the shortcomings related to the combined effect of these two discomfort factors. We reached the following main results:
- -
- if PPD < 6%, the radiant temperature asymmetry varies in the range of 5–15 °C and the draught is DR = 15% or DR = 25%, then the AMV and PMV values are significantly different;
- -
- the AMV value is lower in all cases, with the exception of male votes DR = 15%, AS = 12 and 15 °C, and DR = 25%, AS = 15 °C;
- -
- for an approximately constant PMV value, a change in radiant temperature asymmetry significantly affects the AMV value;
- -
- when considering the votes of all human subjects: increasing DR = 15% to DR = 25% has a significant effect on AMV;
- -
- there is a significant difference between the women’s and men’s AMV votes in both DR = 15% and DR = 25%.
Author Contributions
Conceptualization, B.A.-T. and L.K.; methodology, B.A.-T.; investigation, B.A.-T.; resources, data curation, B.A.-T. and Á.N.; writing—original draft preparation, B.A.-T. and Á.N.; writing—review and editing, B.A.-T.; visualization, B.A.-T.; supervision, B.A.-T.; project administration, B.A.-T.; funding acquisition, L.K. All authors have read and agreed to the published version of the manuscript.
Funding
This research was funded by the NRDI Fund (TKP2020 IES, Grant No. BME-IE-MISC) based on the charter of bolster issued by the NRDI Office under the auspices of the Ministry for Innovation and Technology and by the Hungarian National Research, Development and Innovation Office (OTKA Number 124777).
Institutional Review Board Statement
The study was conducted according to the guidelines of the Declaration of Helsinki, and approved by the Departments Ethics Committee.
Informed Consent Statement
Informed consent was obtained from all subjects involved in the study.
Data Availability Statement
Not Applicable.
Acknowledgments
The research reported in this paper and carried out at BME has been supported by the NRDI Fund (TKP2020 IES, Grant No. BME-IE-MISC) based on the charter of bolster issued by the NRDI Office under the auspices of the Ministry for Innovation and Technology. This work has been supported by the Hungarian National Research, Development and Innovation Office (OTKA Number 124777).
Conflicts of Interest
The authors declare no conflict of interest.
Abbreviations
| Symbol | Meaning | Dimension |
| AMV | Actual Mean Vote | - |
| DR | Draught rate | % |
| f | Degrees of freedom | - |
| F1 | Distribution function—first sample | - |
| F2 | Distribution function—second sample | - |
| H0 | Null hypothesis | - |
| H1 | Alternative hypothesis | - |
| m | First sample size | - |
| n | Second sample size | - |
| PMV | Predicted Mean Vote | - |
| PPD | Predicted Percentage of Dissatisfied | % |
| sx | Standard deviation of the first sample | Variable |
| sy | Standard deviation of the second sample | Variable |
| Tu | Turbulence intensity | % |
| Qair | Heat transfer from the chamber to the air | W |
| Qceiling | Heat transfer from the ceiling to the chamber | W |
| Qfloor | Heat transfer from the chamber to the floor | W |
| Qhuman | Heat transfer from the human to the chamber | W |
| Qlighting | Heat transfer from the lighting to the chamber | W |
| Qwalls | Heat transfer from the chamber to the walls | W |
| x | Mean value of the first sample | Variable |
| X | First random variable | Variable |
| y | Mean value of the second sample | Variable |
| Y | Second random variable | Variable |
References
- Energy Performance of Buildings Directive, 2002/91/EC. Available online: https://ec.europa.eu/energy/topics/energy-efficiency/energy-efficient-buildings/energy-performance-buildings-directive_en (accessed on 30 April 2021).
- Ren, J.; Zhu, L.; Wang, Y.; Wang, C.; Xiong, W. Very low temperature radiant heating/cooling indoor end system for efficient use of renewable energies. Sol. Energy 2010, 84, 1072–1083. [Google Scholar] [CrossRef]
- Olesen, B.W. Radiant heating in theory and practice. Ashrae J. 2008, 50, 16–22. [Google Scholar]
- Rhee, K.-N.; Kim, K.W. A 50 year review of basic and applied research in radiant heating and cooling systems for the built environment. Build. Environ. 2015, 91, 166–190. [Google Scholar] [CrossRef]
- Self, S.J.; Reddy, B.V.; Rosen, M. Geothermal heat pump system: Status review and comparison with other heating options. Appl. Energy 2013, 101, 341–348. [Google Scholar] [CrossRef]
- Wargocki, P.; Wyon, P.D. Ten questions concerning thermal and indoor air quality effects on the performance of office work and schoolwork. Build. Environ. 2003, 51, 234–241. [Google Scholar] [CrossRef] [Green Version]
- Wargocki, P.; Wyon, P.D. Providing better thermal and air quality conditions in school classrooms would be cost-effective. Build. Environ. 2013, 59, 581–589. [Google Scholar] [CrossRef]
- Fanger, P.O.; Christensen, N.K. Perception of draught in ventilated spaces. Ergonomics 2003, 2, 215–235. [Google Scholar] [CrossRef]
- Fanger, P.O.; Melinkov, A.; Hanzawa, H. Air turbulence and sensation of draught. Energy Build. 1988, 12, 21–39. [Google Scholar] [CrossRef]
- Toftum, J.; Nielsen, R. Draught sensitivity is influenced by general thermal sensation. Ind. Ergon. 1996, 18, 295–305. [Google Scholar] [CrossRef]
- Gagge, A. The linearity criterion as applied to partitional calorimetry. Am. J. Phisyol. 1936, 116, 656–668. [Google Scholar] [CrossRef]
- MacPherson, R. The assessment of the thermal environment. A review. Br. J. Ind. Med. 1962, 19, 115–164. [Google Scholar] [CrossRef]
- Fanger, P.O. Thermal Comfort; Danish Technical Press: Copenhagen, The Netherlands, 1970. [Google Scholar]
- Fanger, P.O.; Ipsen, G.; Langkilde, G.; Olesen, B.W.; Christensen, N.K.; Tanabe, S. Comfort limits for asymmetric radiation. Energy Build. 1985, 8, 225–236. [Google Scholar] [CrossRef]
- ISO 7730. Energonomics of the Thermal Environment—Analytical Determination and Interpretation of Thermal Comfort Using Calculation of the Pmv and Ppd Indices and Local Thermal Comfort Criteria; International Organization for Standardization: Geneva, Switzerland, 2005. [Google Scholar]
- ASHRAE Standard 55. Thermal Environment Conditions for Human Occupancy; ASHRAE: Atlanta, GA, USA, 2020. [Google Scholar]
- Bartal, I. Joint Impact of Cold Wall and Airflow. Ph.D. Thesis, Budapest University of Technology and Economics, Budapest, Hungary, 2012. [Google Scholar]
- Barna, E.; Bánhidi, L. Combined effect of two local discomfort parameters studied with a thermal manekin and human subjects. Energy Build. 2012, 112, 359–365. [Google Scholar]
- Toftum, J.; Nielsen, R. Impact of metabolic rate on human response to air movements during work in cool environments. Ind. Ergon. 1996, 18, 307–316. [Google Scholar] [CrossRef]
- Arens, E.; Zhang, H.; Huizenga, C. Partial- and whole-body thermal sensation and comfort—Part I: Uniform environmental conditions. J. Od Therm. Biol. 2006, 31, 53–59. [Google Scholar] [CrossRef] [Green Version]
- Huizenga, C.; Zhang, H.; Arens, E.; Wang, D. Skin and core temperature response to partial– and whole–body heating and cooling. J. Therm. Biol. 2004, 29, 549–558. [Google Scholar] [CrossRef] [Green Version]
- Wang, Z.; He, Y.; Hou, J.; Jiang, L. Human skin temperature and thermal response in asymmetrical cold radiation environments. Build. Environ. 2013, 67, 217–223. [Google Scholar] [CrossRef]
- Fang, Z.; Liu, H.; Li, B.; Tan, M.; Olaide, O. Experimental investigation on thermal comfort model between local thermal sensation and overall thermal sensation. Energy Build. 2018, 158, 1286–1295. [Google Scholar] [CrossRef] [Green Version]
- Schellen, L. The influence of local effects on thermal sensation under non-uniform environmental conditions—Gender differences in thermophysiology, thermal comfort and productivity during convective and radiant cooling. Physiol. Behav. 2012, 107, 252–261. [Google Scholar] [CrossRef] [PubMed]
- Kalmár, F.; Kalmár, T. Study of human response in conditions of surface heating, asymmetric radiation and variable air jet direction. Energy Build. 2018, 179, 133–143. [Google Scholar] [CrossRef]
- Boerstra, A.; Kulde, M.; Toftum, J. Comfort and performance impact of personal control over thermal environment in summer: Result from laboratory study. Build. Environ. 2015, 87, 315–326. [Google Scholar] [CrossRef]
- Wyon, D.P. Methodology for indoor environment research. Magy. Épületgépészet 2018, 181, 38–49. [Google Scholar]
- Zhang, F.; de Dear, R.; Hancock, P. Effects of moderate thermal environments on cognitive performance: A multidisciplinary review. Appl. Energy 2019, 236, 760–777. [Google Scholar] [CrossRef]
- Wim, Z.; Gert, B. Effect of thermal activated building systems in schools on thermal comfort in winter. Build. Environ. 2009, 11, 2308–2317. [Google Scholar]
- Fazekas, I. Bevezetés a Matematikai Statisztikába; Kossuth Egyetemi Kiadó: Debrecen, Hungary, 2000. [Google Scholar]
- Ketskeméty, L.; Izsó, L.; Könyves, T.E. Bevezetés az IBM SPSS Statisztikai programrendszerbe; Artéria Stúdió: Budapest, Hungary, 2001. [Google Scholar]
- Humphreys, M.; Nicol, F. The validity of ISO-PMV for predicting comfort votes in every-day thermal environments. Energy Build. 2002, 34, 667–684. [Google Scholar] [CrossRef]
Figure 1.
Comfort chamber.

Figure 2.
Heating and cooling hydronic system.

Figure 3.
Energy fluxes and measurement points.

Figure 4.
Measuring points: side-view.

Figure 5.
Measuring points: top-view.

Figure 6.
AMV as function of radiant thermal asymmetry, Women, DR = 15%.

Figure 7.
AMV as function of radiant thermal asymmetry, Men, DR = 15%.

Figure 8.
AMV as function of radiant thermal asymmetry, Women and Men, DR = 15%.

Figure 9.
AMV as function of radiant thermal asymmetry, Women, DR = 25%.

Figure 10.
AMV as function of radiant thermal asymmetry, Men, DR = 25%.

Figure 11.
AMV as function of radiant thermal asymmetry, Women and Men, DR = 25%.

Figure 12.
AMV as function of radiant thermal asymmetry, Women and Men, DR = 15% vs. 25%.

Figure 13.
AMV as function of radiant thermal asymmetry, Women, DR = 15% vs. DR = 25%.

Figure 14.
AMV as function of radiant thermal asymmetry, Men, DR = 15% vs. DR = 25%.

Figure 15.
AMV as function of radiant thermal asymmetry, Women vs. Men, DR = 15%.

Figure 16.
AMV as function of radiant thermal asymmetry, Women vs. Men, DR = 25%.


Table 1.
Measured and calculated parameters; measurement errors.
| Parameter | Measured/Calculated | Measurement Errors |
|---|---|---|
| Air and mean radiant temperature | Measured | 0.1 °C |
| Air velocity | Measured | 0.03 m/s + 0.04 Measured value |
| Relative humidity | Measured | 1.8%+ 0.007 Measured value |
| Thermal insulation of the clothing | Calculated | - |
| Metabolic rate | Calculated | - |
| Turbulence intensity | Calculated | - |
| DR | Calculated | - |
| PMV | Calculated | - |
| PPD | Calculated | - |
Table 2.
Boundaries of the human subject measurements.
| Boundaries | |
|---|---|
| 1 | Number of healthy subjects: 20—10 women and 10 men |
| 2 | Length of exposure: 180 min + acclimatisation prior to the measurements |
| 3 | Number of parameter groups: 10 (5 radiant thermal asyymetries and 2 draught rates) |
| 4 | During one measurement session, the subjects were exposed to only 1 thermal comfort environment |
| 5 | Only one subject at a time participates in the experiment |
| 6 | The occurrence of parameter groups is random |
| 7 | The thermal comfort chamber was thermally stationary during the entire measurement |
| 8 | Acoustic and visual disturbances were ruled out |
| 9 | Due to the high volume of air flow, the indoor air quality is ideal |
| 10 | The thermal insulation capacity of the clothing is 1 clo |
| 11 | Breakfast is mandatory, meals are adapted to the individual’s daily routine |
| 12 | Using the lavatory before starting the experiment is ideal |
| 13 | Water can be brought into the measuring chamber, all other food is forbidden |
Publisher’s Note: MDPI stays neutral with regard to jurisdictional claims in published maps and institutional affiliations. |
© 2021 by the authors. Licensee MDPI, Basel, Switzerland. This article is an open access article distributed under the terms and conditions of the Creative Commons Attribution (CC BY) license (https://creativecommons.org/licenses/by/4.0/).
Share and Cite
MDPI and ACS Style
András-Tövissi, B.; Kajtár, L.; Nyers, Á. The Effect of Ceiling Heating and Mechanical Ventilation on Thermal Comfort. Energies 2021, 14, 3712. https://0-doi-org.brum.beds.ac.uk/10.3390/en14123712
AMA Style
András-Tövissi B, Kajtár L, Nyers Á. The Effect of Ceiling Heating and Mechanical Ventilation on Thermal Comfort. Energies. 2021; 14(12):3712. https://0-doi-org.brum.beds.ac.uk/10.3390/en14123712
Chicago/Turabian StyleAndrás-Tövissi, Balázs, László Kajtár, and Árpád Nyers. 2021. "The Effect of Ceiling Heating and Mechanical Ventilation on Thermal Comfort" Energies 14, no. 12: 3712. https://0-doi-org.brum.beds.ac.uk/10.3390/en14123712
Note that from the first issue of 2016, this journal uses article numbers instead of page numbers. See further details here.