
Numerical Analysis of Melting Process in a Rectangular Enclosure with Different Fin Locations

1
Hubei Key Laboratory of Advanced Technology for Automotive Components, Wuhan University of Technology, Wuhan 430070, China
2
Hubei Collaborative Innovation Center for Automotive Components Technology, Wuhan University of Technology, Wuhan 430070, China
*
Author to whom correspondence should be addressed.
Energies 2021, 14(14), 4091; https://0-doi-org.brum.beds.ac.uk/10.3390/en14144091
Submission received: 3 June 2021
/
Revised: 27 June 2021
/
Accepted: 3 July 2021
/
Published: 6 July 2021
(This article belongs to the Special Issue Advanced Energy Storage for Green Buildings)
Abstract
:Latent thermal energy storage is regarded as an effective strategy to utilize solar energy and recover automotive waste heat. Based upon an enthalpy-porosity method, the influence characteristics and mechanism of fin location on phase change material melting behavior in vertical rectangular enclosures were explored numerically. The results show that as fin location increases, the melting time decreases before attaining the minimum at the fin location of 0.20 after which it increases and finally surpasses the no fin case, because (1) the influence range of fins for conduction is limited by the bottom surface when putting fins next to this surface, (2) the liquid flow resistance increases with moving fins up, and (3) mounting fins near the top surface accelerates melting at the upper part, facilitating thermal stratification formation and weakening natural convection. Nu is higher than the no fin case, i.e., Nu enhancement factor is a positive value, in the melting process for a lower fin location, while for other fin locations, a transition to a negative value takes place. The higher the fin location is, the earlier the transition that arises. Finally, a strategy of increasing the maximum liquid flow velocity is proposed to reinforce melting for cases with considerable natural convection.
1. Introduction
The solar energy received on the Earth’s surface is abundant, approximately 3000 times the power consumption in 2012 [1]; for a typical automobile, only 30% of the fuel energy is utilized and the majority is wasted in the form of heat [2]. As a result, solar energy utilization and automotive waste heat recovery are prevalent worldwide. The discontinuity of solar energy and waste heat in time and space, however, hinders the progress to a large extent; as a result, a concept of thermal energy storage has been proposed. Sharing the merits of charging and discharging heat at a nearly constant temperature, high storage density, and low volume change in phase change simultaneously, latent thermal energy storage (LTES) based on solid–liquid phase change materials (PCMs) has been applied extensively in comparison to other storage strategies such as sensible and that based upon solid–solid and liquid–gas PCMs [3,4,5,6]. With experiments, the performance of photovoltaic modules integrated with PCMs was evaluated by Li et al. [7]. It is found that with attaching a PCM layer, the temperature of photovoltaic modules was reduced by 23 °C and the output power was increased by 5.18%. Thalib et al. [8] conducted an experiment to investigate the performance of solar stills with a LTES unit. Compared with a conventional solar still, the water production was increased by 39.5%. A novel device, employing a LTES unit recovering engine coolant heat to preheat engines in cold-start and warm-up, was analyzed experimentally by Park et al. [9]. When using a LTES unit, the time heating engines to 70 °C was shortened by 13.7% and the fuel consumption was reduced by 18.4%. In view of this, numerous studies on PCMs or LTES have been performed in recent decades.
LTES units experience a melting process and solidification process to absorb and release heat; consequently, the charging and discharging rates are critical for practical applications. Because of the inherently low thermal conductivity of PCMs, generally less than 0.5 W/(m K), however, a low rate is encountered [10,11,12,13]. To cope with this issue, a strategy, filling metal foams, has been developed. Sardari et al. [14] found that the PCM thermal conductivity was improved considerably with filling copper foam, resulting in the reduction of the melting time by almost 85%. The study performed by Ghalambaz and Zhang [15] indicated that filling metal foam in PCMs enhanced the heat transfer capability of the heat sink, decreasing the hot surface temperature significantly. Cao et al. [16] pointed out that embedding copper foam improved the thermal performance, cutting down the melting time by 61.6%. The melting behavior of PCMs with the thermal conductivity enhancer of metal foam was tested and simulated by Iasiello et al. [17,18]. It was found that the metal foam affected the interface evolution; compared with the number of Pores Per Inch, the effect of porosity on melting process was more notable, the higher the porosity, the lower the melting time. Because of enhancing thermal conductivity and reducing volume or weight, a method, graded filling metal foam, has been put forward and drawn attention recently. Both Chen et al. [19] and Ghahremannezhad et al. [20] indicated that compared to the conventional uniform filling method, a higher PCM thermal performance and more uniform temperature distribution were presented by graded filling metal foam. Iasiello et al. [21] found that a 38% and 14% higher performance evaluation criterion were respectively exhibited when variable-porosity foams and variable-cell size foams were filled in comparison to uniform filling cases.
As a result of being cost-effective, efficient, and simple, another strategy, inserting fins, has been proposed and adopted extensively [22,23,24]. A review on this strategy is as follows. Experiments have been carried out to clarify the influence characteristics of fin parameters. The melting behavior in a vertical rectangular enclosure under different fin numbers was studied by Huang et al. [25]. The uniformity of the temperature distribution improved and melting time cut down as fin number increased, because of enhancing conduction. Similar results were obtained by Acır and Canlı [26] where the melting process in a horizontal rectangular enclosure was studied. With a visualization test rig, the evolutions of solid–liquid interface and temperature distribution inside a vertical rectangular enclosure were analyzed by Kamkari and Shokouhmand [27]. The movement of interface accelerated, and the melting rate enhanced with increasing fin number. Based on the same test rig, Kamkari and Groulx [28] found that with inclining enclosures from vertical to horizontal, the melting rate at the late stage enhanced, reducing the melting time significantly, from 210 min to 90 min for the case with three fins. Thus, a conclusion was made that enhancing melting rate at the late stage was an effective method to accelerate the melting process. Joneidi et al. [29] studied the transient melting process in a horizontal enclosure, where the solid–liquid interface was visualized. Contrary to vertical enclosures, the liquid flow was reinforced with a rise of fin number. To reduce the convective flow resistance associated with fins, a novel perforate fin was proposed and studied by Karami and Kamkari [30] for vertical shell and tube LTES units. It demonstrated that the use of perforate fins enhanced the melting rate, reducing the melting time by about 7%. The thermal performance of shell and tube LTES units with spiral fins was tested by Mehta et al. [23] which found that using spiral fins reduced the melting time significantly, by approximately 51.61% in maximum.
Apart from experiments, numerical simulations have been also performed. The thermal performance of a horizontal rectangular enclosure was evaluated by Fekadu and Assaye [31]. Due to enhancing heat conduction and suppressing convection simultaneously, increasing fin number was not always effective in reducing melting time and an optimum fin number of two was demonstrated. On the contrary, Elmaazouzi et al. [32] indicated that the melting time decreased with fin number. The melting process in a finned horizontal rectangular was analyzed by Abdi et al. [33]. The melting rate enhanced with increasing fin number. Oliveski et al. [34] evaluated the melting behavior in finned rectangular enclosures, which indicated that the melting time cut down with increasing fin length. The similar result was found by Mahood et al. [35] for horizontal shell and tube LTES units. Biwole et al. [36] studied the melting process in a vertical rectangular enclosure. Results showed that the influence of fin number on melting time and energy stored was more significant than fin length. The effect of fin geometry in a vertical rectangular enclosure was studied by Bouhal et al. [37]. Compared with rectangular fins, a uniform melting was presented for triangular fins. The study carried out by Hasnain et al. [38] pointed out that fin geometry affected the melting process of shell and tube LTES units significantly, with the melting time of double-branched fins 45.9% shorter than Y-oriented triple fins. Melting behavior in a vertical rectangular enclosure with different fin angles was simulated by Ji et al. [22]. With an increase of fin angle, the melting time decreased firstly before attaining the minimum at −15° after which it increased. Using the same model, Ji et al. [39] examined the effect of fin arrangement. With a constant fin length, a scheme, mounting the long fin in the lower part and short fin in the upper part, was proposed to enhance melting effectively. The thermal performance of shell and tube units with the novel quadruple-helical fin arrangement was evaluated by Zhang et al. [40]. The novel arrangement enhanced the melting rate, reducing the melting time by 31.0% in comparison to the conventional fin arrangement. Liu et al. [41] assessed the melting behavior of shell and tube LTES units with uneven tree-like fins. Compared to uniform tree-like fins, a uniform temperature distribution and faster melting rate were exhibited.
From previous studies, it is found that the use of fins extends the heat transfer path, enhancing conduction significantly. The liquid flow and then natural convection, however, may be suppressed by fins at the same time. The two opposite results indicate that the fin arrangement should be optimized to maximize its role. Besides, it is found that with adding fins, significant improvement in the melting rate is presented merely at the early stage and middle stage, while the improvement is quite limited or even negative at the last stage. For example, in terms of liquid fraction rising from 0.3 to 0.4, corresponding to the early stage, the time required is approximately 15 min for the no fin case and is reduced to 7 min when inserting 3 fins; while regarding to liquid fraction varying from 0.9 to 1.0, corresponding to the last stage, the time required is equal for both cases, approximately 45 min [27]. These two facts demonstrate the significance of uncovering the influence mechanism of fin parameters. Currently, several fin parameters such as number, length, geometry, angle and arrangement, have been researched and their mechanisms have been clarified. To the best knowledge of the authors, however, fins have been distributed evenly on the heated surface previously; another critical parameter, fin location, has been not analyzed and its mechanism has not been unraveled. As such, it is difficult to place fins in the most suitable location, leading to the result that the enhancement potential as to fins cannot be fully released. To fill the gap, by taking a commonly employed vertical rectangular enclosure as an object, the effect of fin location is investigated with an experimentally validated numerical model. To reveal the influence characteristics and mechanism, the instantaneous liquid fraction contours and velocity vectors, the evolution of liquid fraction and the variations of melting time, surface averaged Nusselt number, Nusselt number enhancement factor, and maximum liquid flow velocity are analyzed. Through the analysis, the optimized fin location is determined and a strategy to reinforce melting is proposed. The current study intends to offer advice to arrange fins, facilitating solar energy utilization and automotive waste heat recovery.
The paper is organized as follows. The model construction, including the physical model, mathematical model, independency tests, and model validation, is presented in Section 2. Section 3 presents the detailed results and discussion on the effect of fin location. The main conclusions are summarized in Section 4.
2. Model Construction
2.1. Physical Model
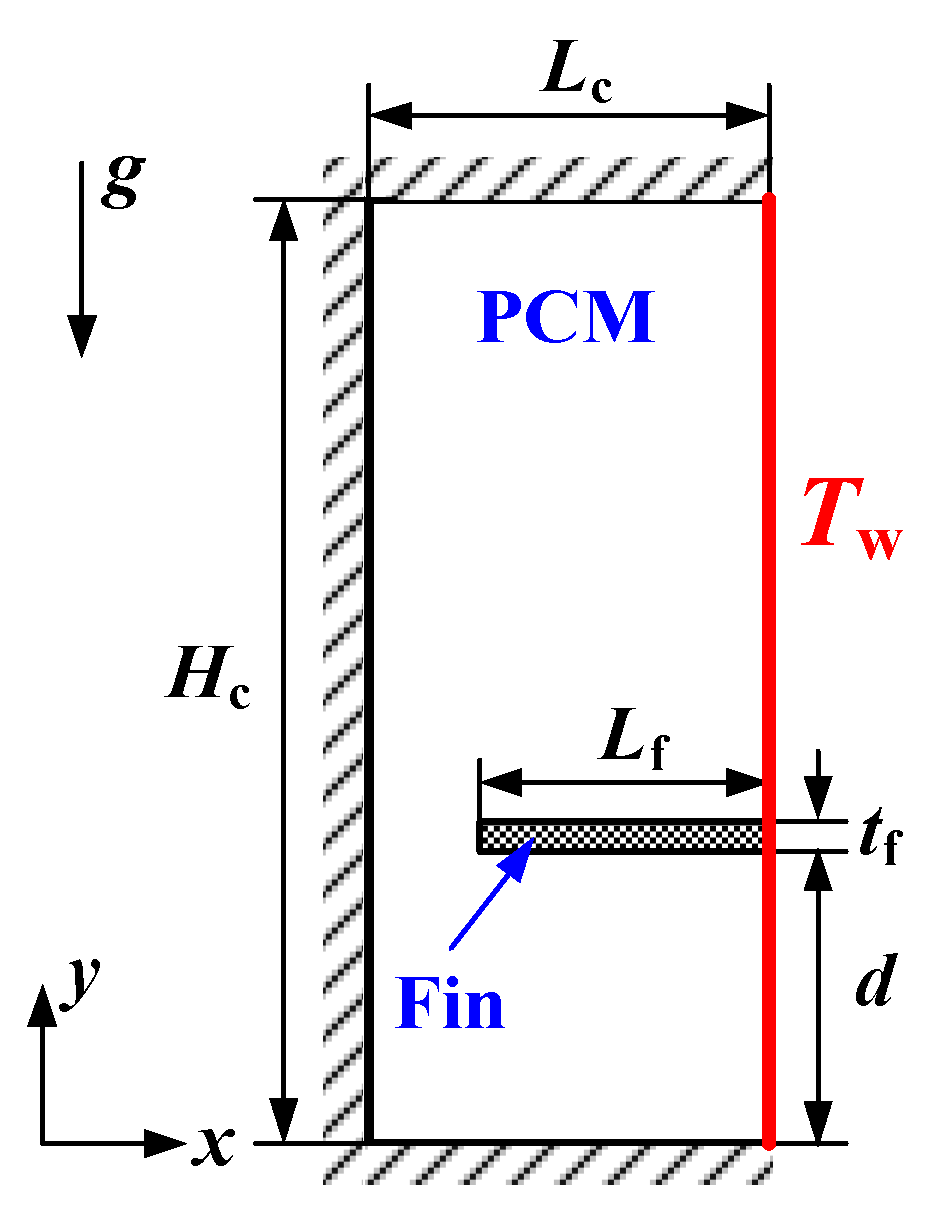
Similar to the experiment carried out by ref. [27], a 2D vertical rectangular enclosure with length, Lc, of 50 mm and height, Hc, of 120 mm is used, as shown in Figure 1. A horizontal fin with thickness, tf, of 3 mm and length, Lf, of 38 mm is mounted on the right hot surface. The distance between the lower surface of fin and the bottom surface of enclosure is denoted by d. A parameter, df, named as fin location, is employed to characterize the dimensionless location of fin. df varies from 0.05 to 0.95 in this study.
A constant temperature, Tw, is imposed on the right surface, while the adiabatic condition is used for other surfaces, as presented in Figure 1. Lauric acid and aluminum are respectively selected as the phase change medium and fin material, whose thermo-physical properties are shown in Table 1 and Table 2, respectively.
2.2. Mathematical Model
- The motion of liquid is viewed as a 2D, laminar and incompressible flow.
- Both PCM volume change and radiation are ignored.
- The thermo-physical properties of fin material and PCM are constant, except for PCM density, ρ, in the buoyancy force term of momentum equations where the Boussinesq approximation is used, i.e., ρ varies linearly with temperature, T, as presented by:where ρref and Tref are the reference density and reference temperature which are set as liquid density, ρl, and melting temperature, Tl [22,39].
An enthalpy-porosity method, without the need to trace the solid–liquid interface and suitable for PCMs with a constant melting temperature, is employed to model the melting process [22,24,33,39]. In this method, the whole computational domain is treated as a porous zone and the porosity of each cell is characterized by a parameter, liquid fraction, γ, which varies from 0 to 1. For the liquid phase and solid phase, γ = 1 and γ = 0 respectively. A source term, , defined by the Carman–Kozeny term and expressed in Equation (3), is added to the momentum equation to differentiate three regions: solid, mushy, and liquid [43].
where Amush is the mushy zone constant. ε is a small number, taking 10−3 to avoid the division by zero. The formula of γ is:
The governing equations including the continuity, momentum. and energy for this method are [22,33,39]:
where t, , g and p are the time, velocity vector, gravitational acceleration. and pressure, respectively. H is the enthalpy, equal to the sum of latent enthalpy, ΔH, and sensible enthalpy, hs:
where href is the reference enthalpy at Tref. Only the heat conduction is taken into account for fins. The corresponding governing equation is:
The boundary condition and initial condition are as follows.
- Boundary condition:
- Initial condition:
ANSYS Fluent 15.0 is employed to solve the governing equations. For pressure–velocity coupling, the SIMPLE scheme is adopted. Apart from time and pressure which are discretized by the first order implicit scheme and PRESTO! scheme, respectively, other derivatives are discretized by the second order upward scheme. The thresholds of residuals are set as 10−3 for velocity and momentum and 10−6 for energy. The computation continues until the PCM melts completely, i.e., γ = 1.
2.3. Independence Tests
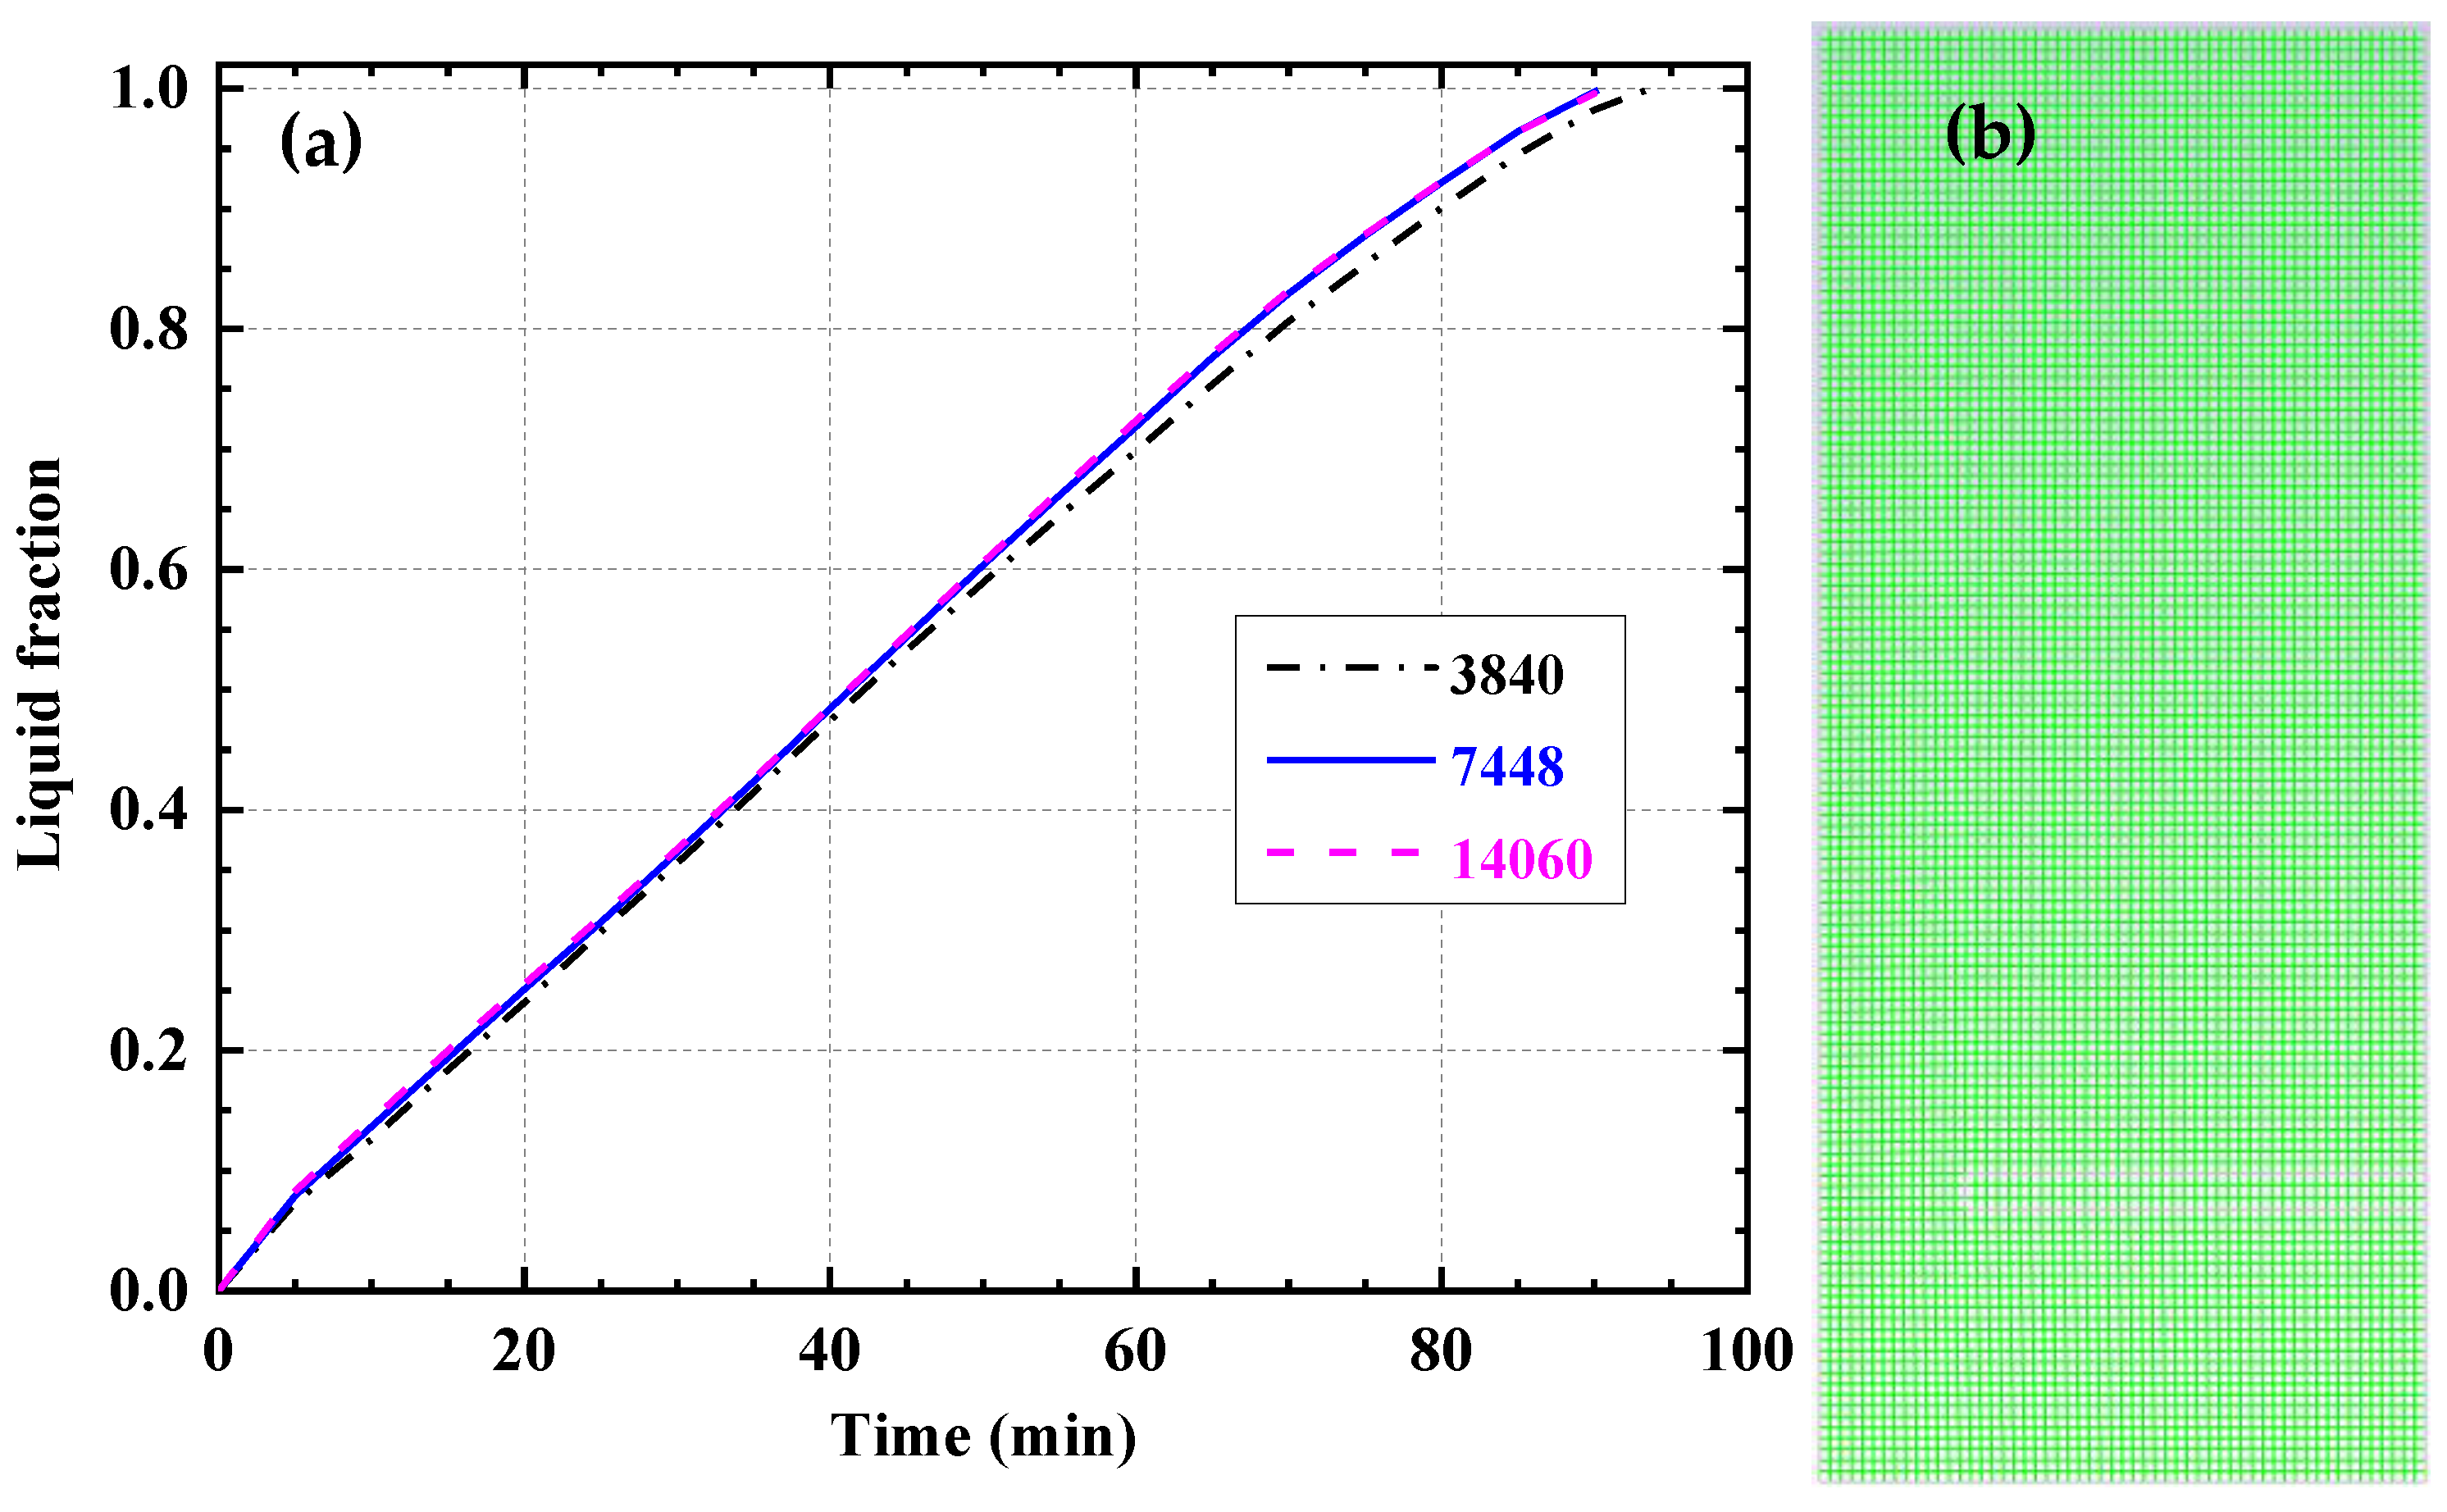
The grid independence test is carried out to eliminate the effect of grid number. The test result in terms of γ for df = 0.20 is presented in Figure 2a, where the grids with 3840, 7448 and 14,060 quadrilateral cells are examined. As the cell number increases, the deviation between adjacent grids reduces. For the compromise of computation cost and accuracy, the grid with 7448 cells is picked up. Similar tests are performed for other df and no fin cases, and the grids with 7448 quadrilateral cells are also selected. Figure 2b shows the schematic view of the grid which shares high quality with the maximum aspect ratio of 1.55 and minimum orthogonal quality of 0.9997.
Besides, in order to remove the effect of time step, Δt, the time step independence test is conducted. Three Δt of 0.05 s, 0.1 s and 0.2 s are tested and the variations of γ are compared. It is found that the deviation among three Δt are quite small, with the maximum less than 0.5%. However, for Δt = 0.2 s, the number of iterations in one time step was greater than Δt = 0.05 s and 0.1 s, and the residual of velocities may not reduce to the convergence criterion of 10−3 in some of time steps. As a result, Δt = 0.1 s is picked up for the better convergence and low computation cost [44].
2.4. Model Validation
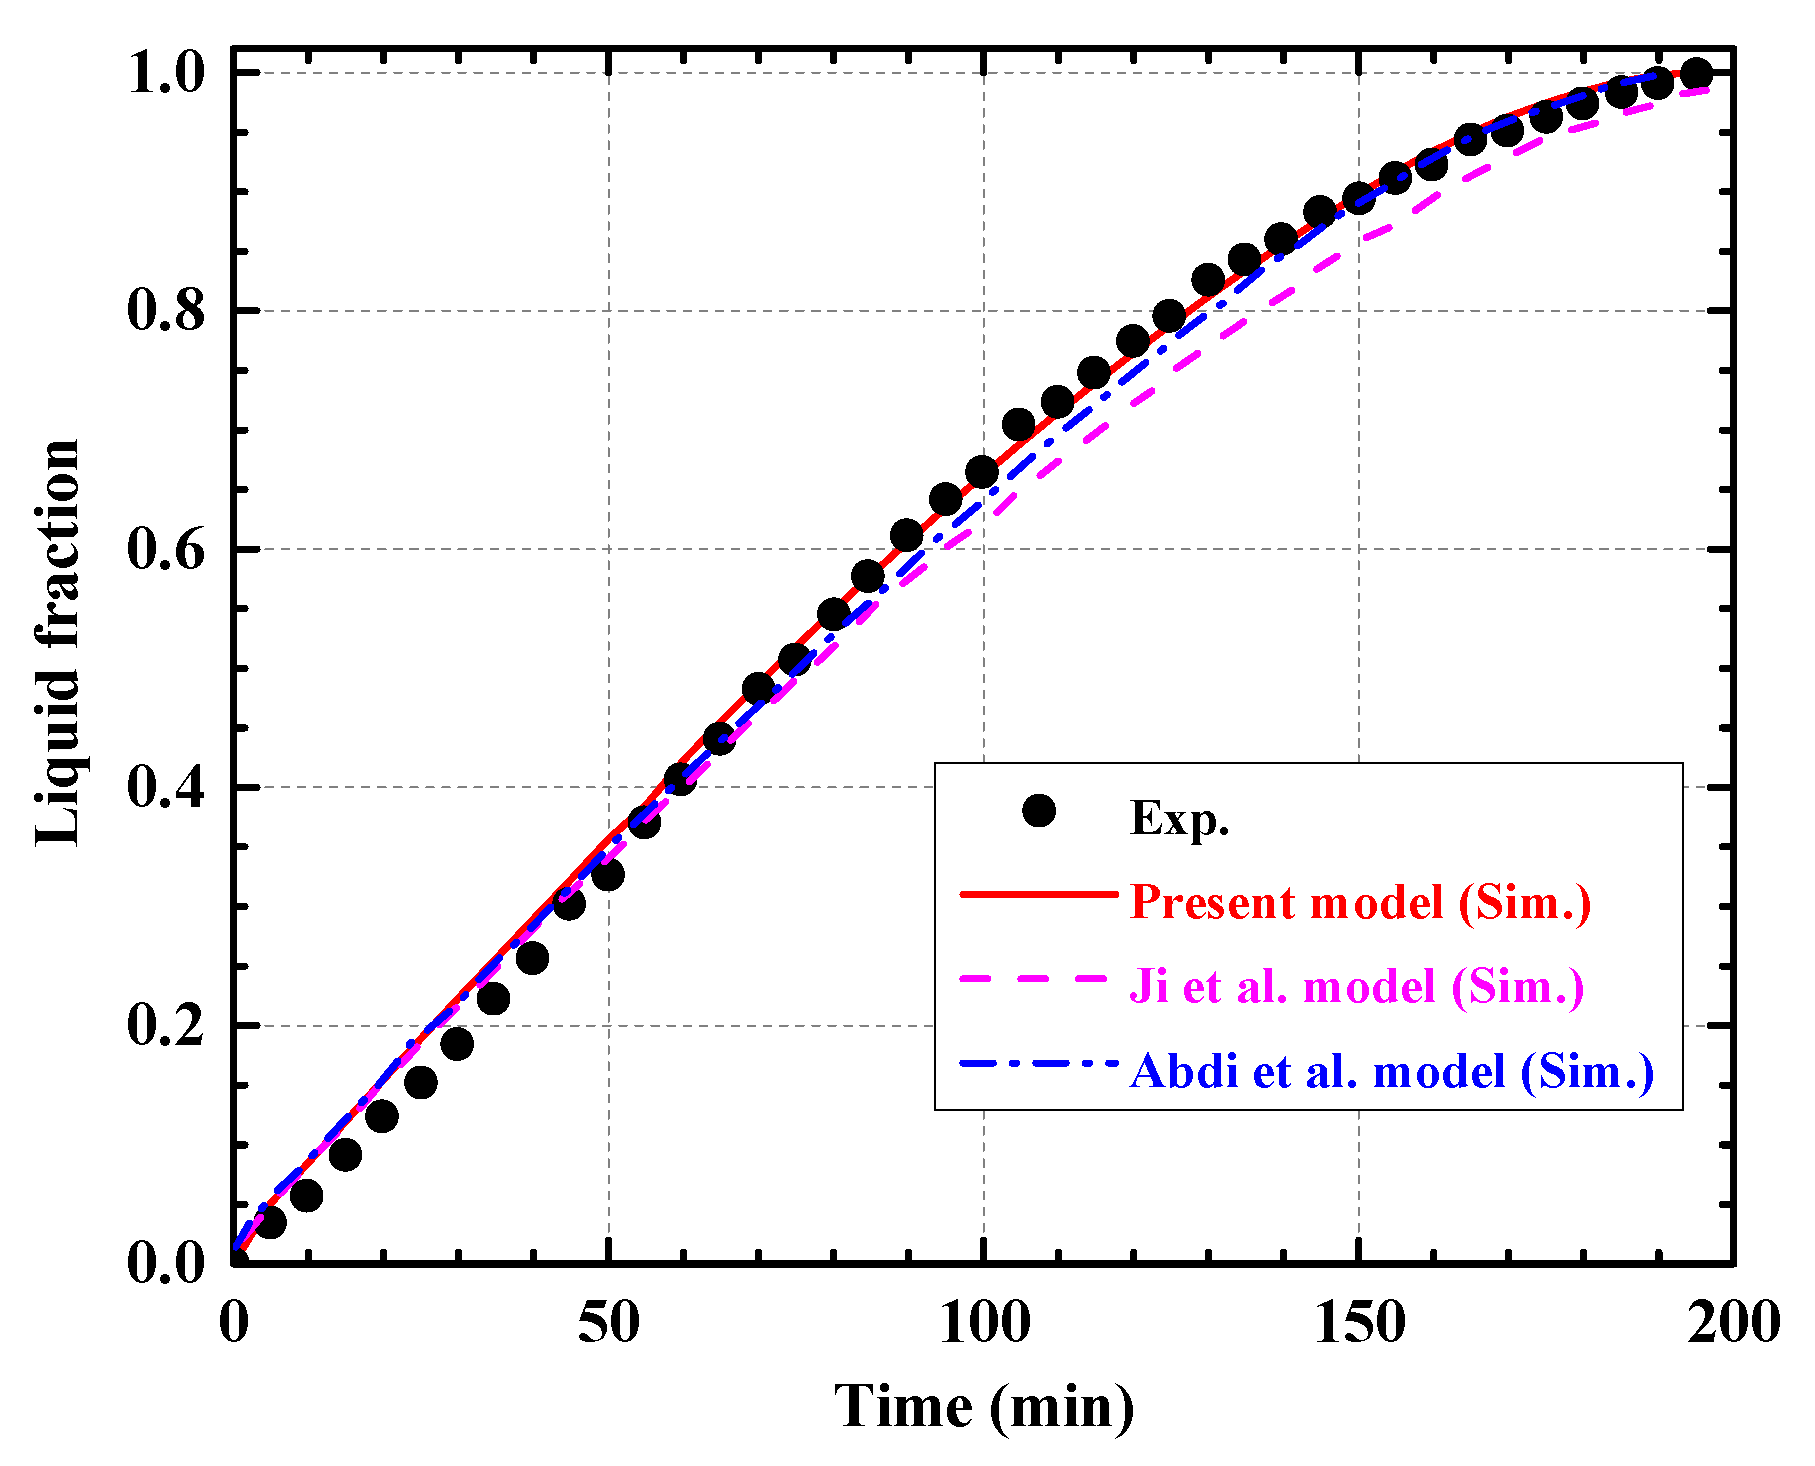
The result obtained by the present model for the no fin scheme is compared to the experiment conducted by Kamkari et al. [45] and the simulations performed by Ji et al. [22] and Abdi et al. [33], as shown in Figure 3. At the beginning, all simulation models agree well with each other, but predict melting process slightly faster than experiments. This is reasonable since the elevation process of the right surface temperature, Tw, from the initial value, T0, of 25 °C to the target value of 70 °C, occupying approximately 4 min, is not considered in the simulation. In the middle and late stages, as in the Abdi et al. model, the present model matches well with experiments. A difference is presented between the present model and Ji et al. model, because of the adopted Amush, 106 for the present model and 105 for the Ji et al. model.
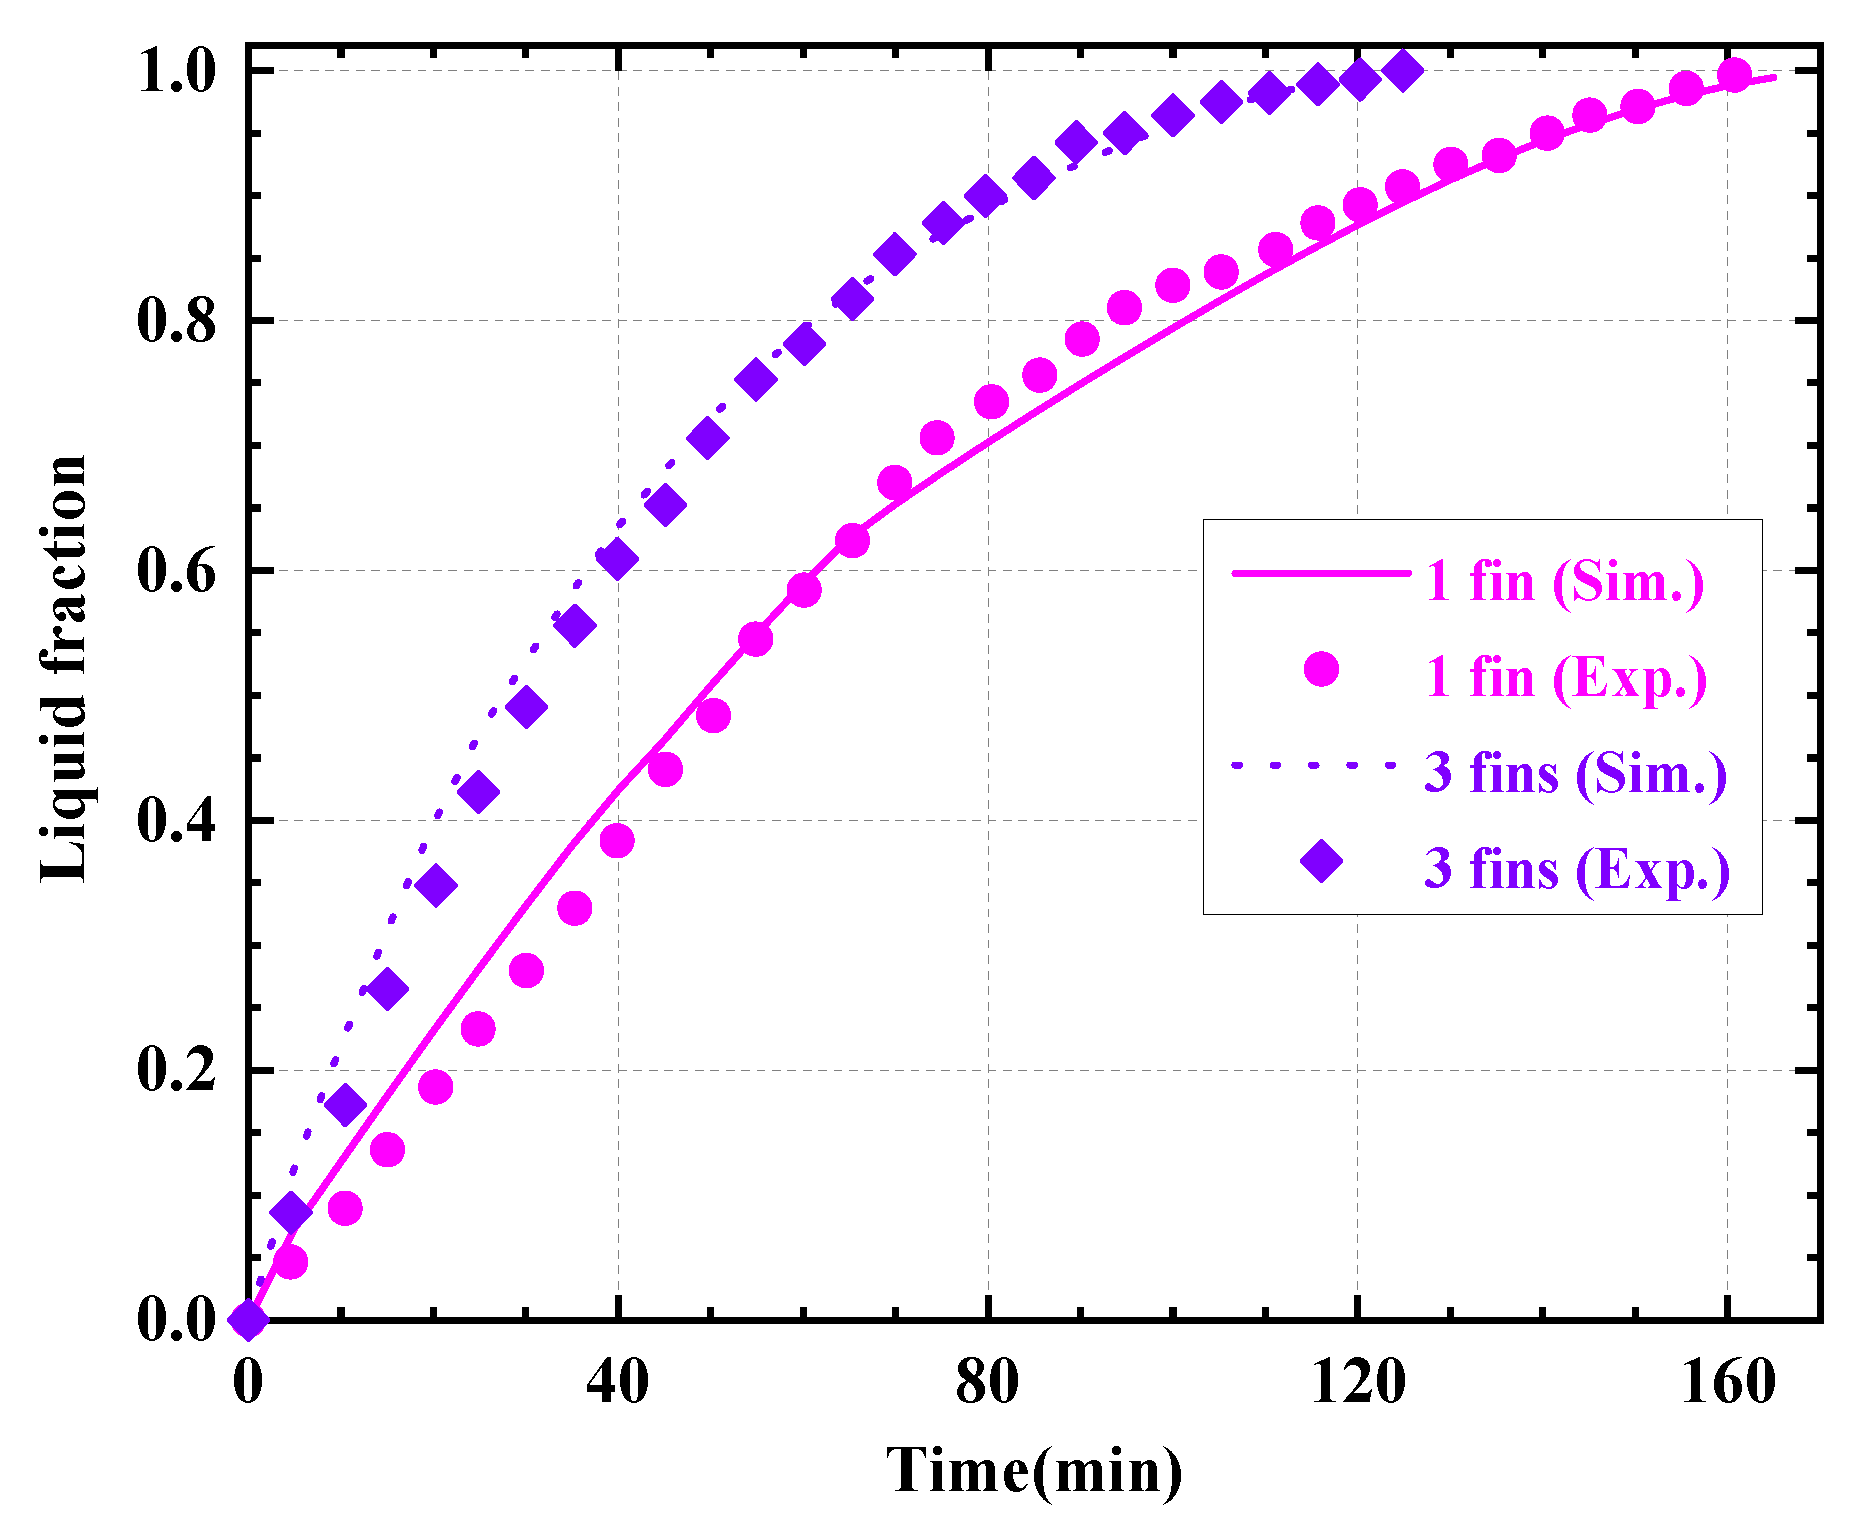
Besides, the present model is validated with the experiment performed by Kamkari and Shokouhmand [27] for the 1 fin case and 3 fins case. The validation results are shown in Figure 4. As the same reason to the no fin scheme, ignoring the temperature rising process of the right surface, the present model predicts melting process slightly faster at the beginning. In the middle and late stages, a good agreement between the present model and experiment is found.
3. Results and Discussion
3.1. Patterns of Melting
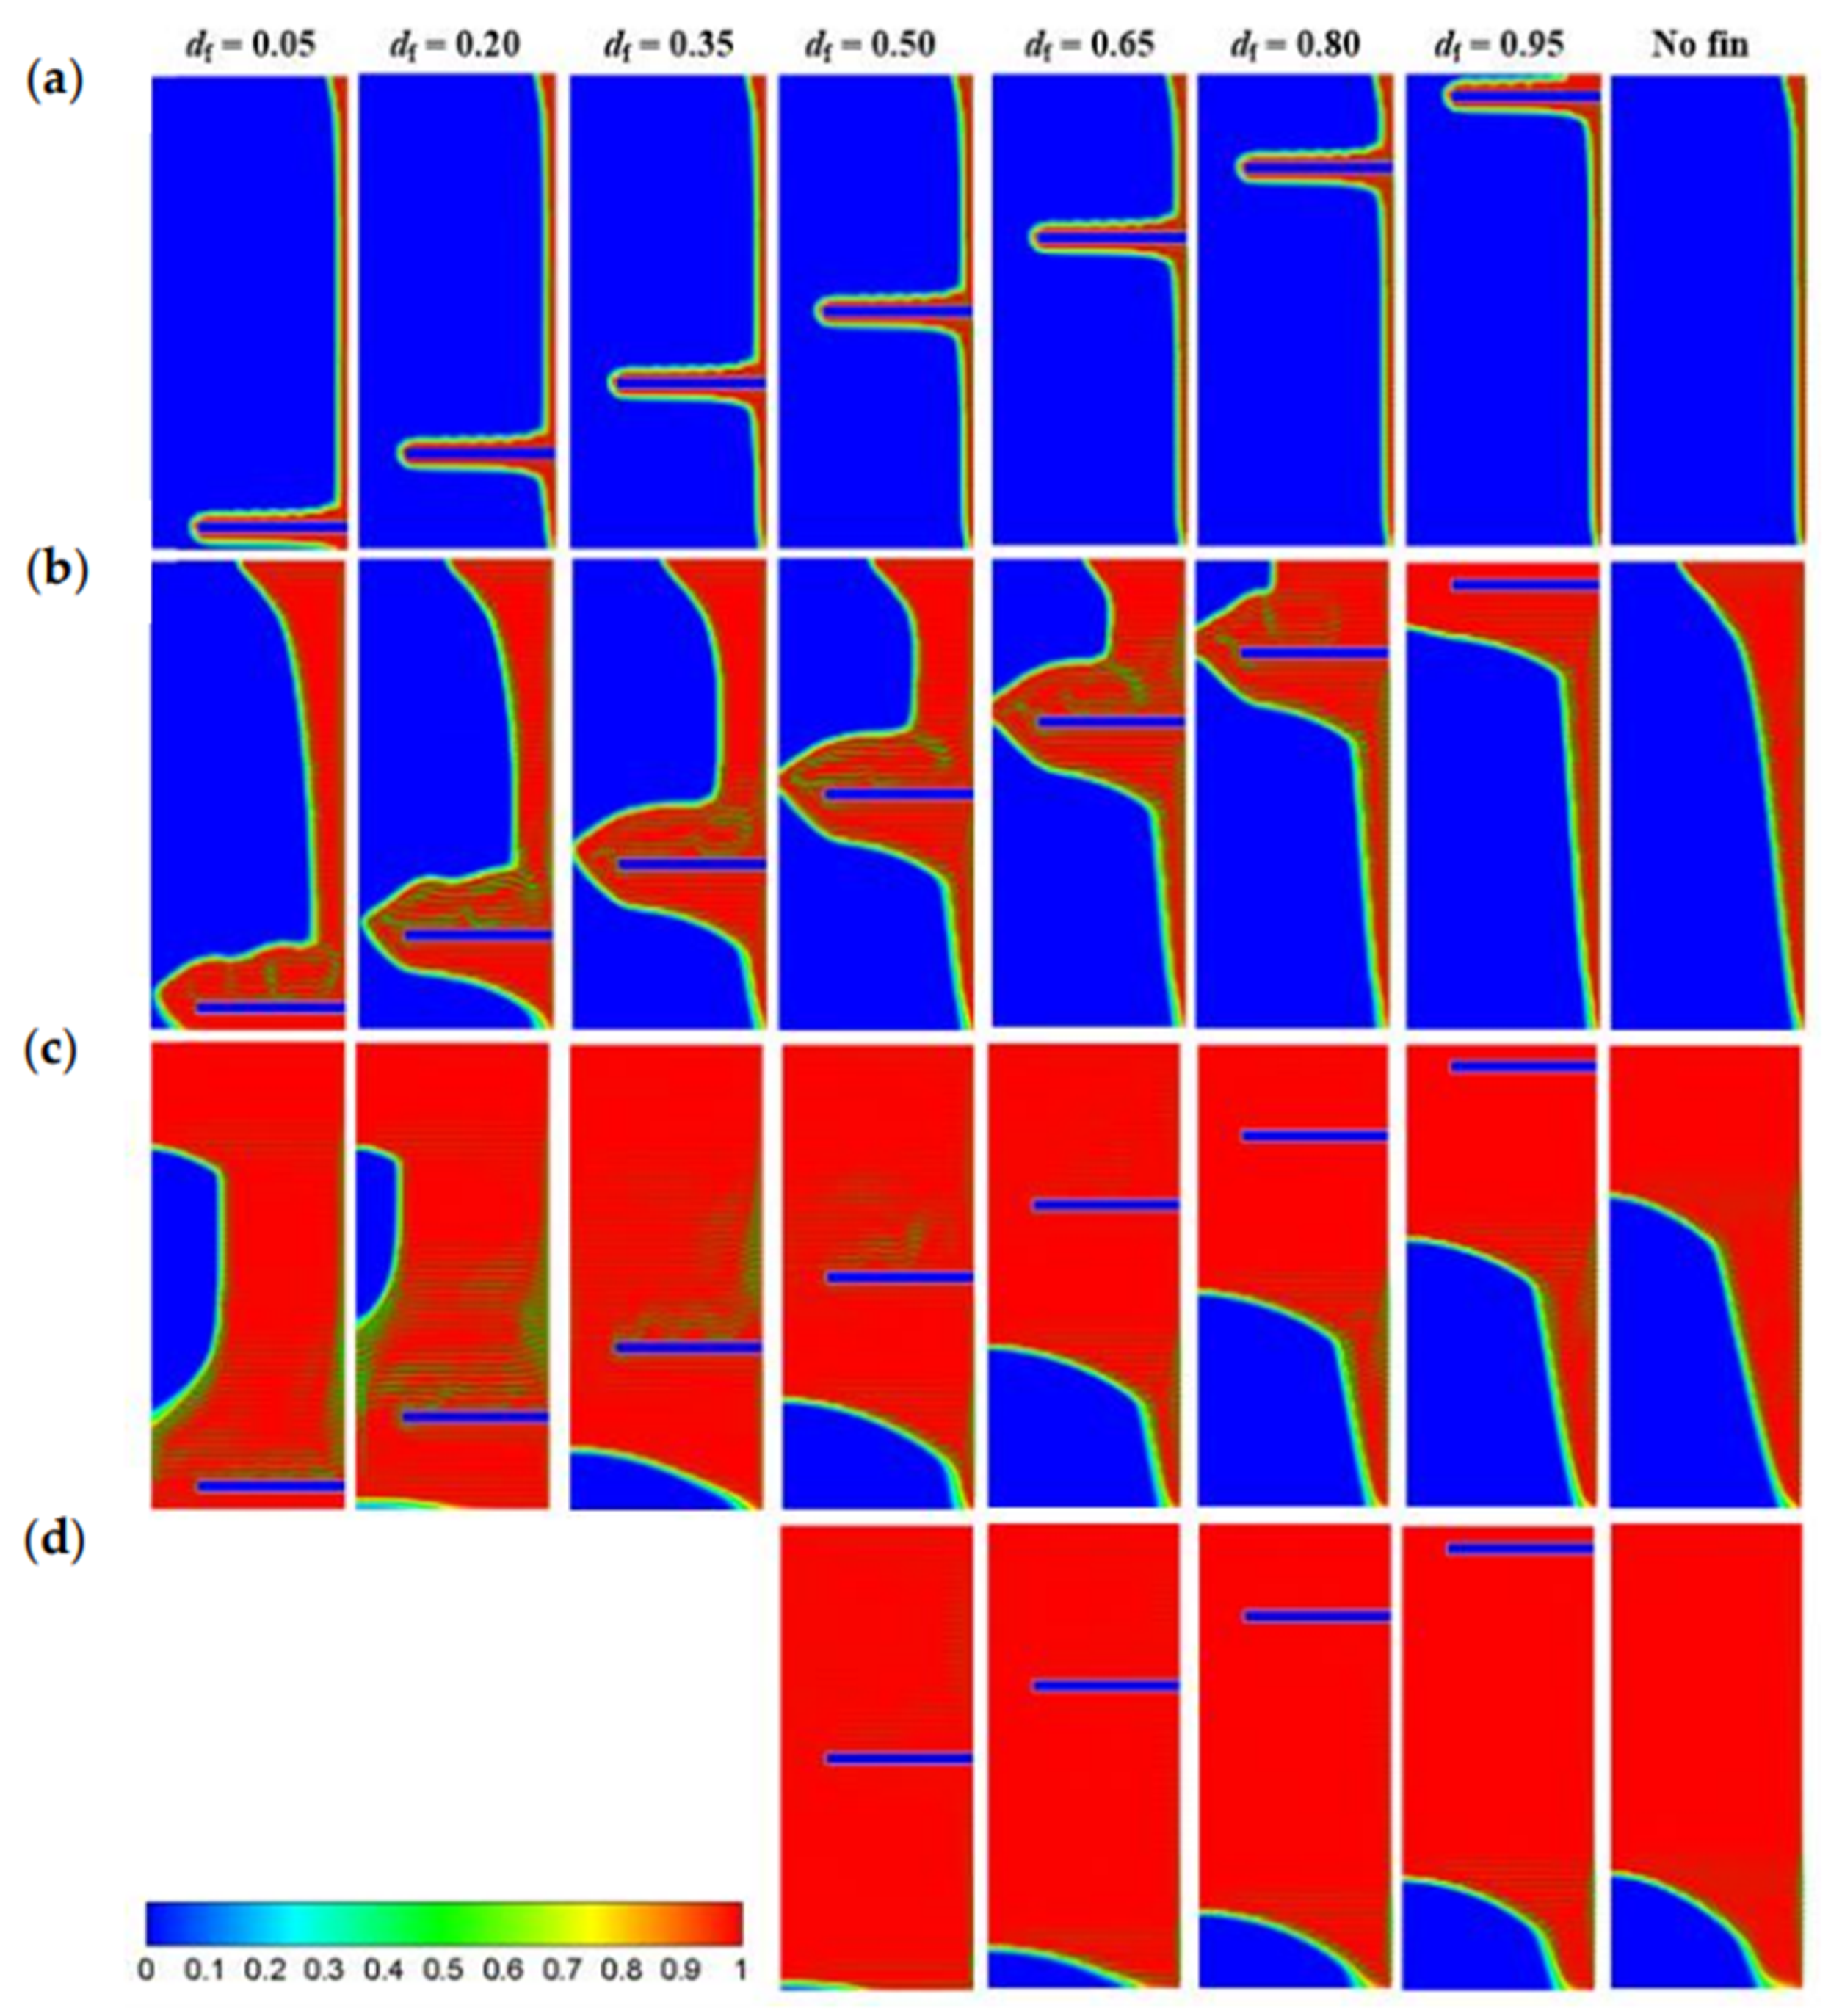
Instantaneous liquid fraction contours and velocity vectors for different fin locations, df, and no fin case at the flow time, t, of 300 s, 1800 s, 4800 s, and 8400 s are presented in Figure 5. Velocity vectors with high resolution are also provided in the Supplementary Materials. The images of df = 0.05, 0.20 and 0.35 at t = 8400 s are not provided because the melting time, tm, of them is less than 8400 s.
Figure 5a shows that the melting originates from the place near the hot surface (including the vertical right surface and horizontal fin surfaces) at t = 300 s when the solid–liquid interface is almost parallel to the hot surface, implying that the conduction dominates the heat transfer. The interface right above the fin is slightly uneven, because of generating thermal plumes. Besides, the melting region is approximately equal for all df and notably larger than the no fin case, which indicates that the effect of df is insignificant and heat conduction is enhanced significantly by the fin at the beginning.
As shown in Figure 5b, as t increases to 1800 s, the liquid region expands, the interface deforms, no longer parallel to the hot surface, and several vortexes form above the fin. It is indicated that the natural convection is developed and cannot be ignored. For df = 0.05, the lower area nearly melts totally and considerable portion of solid phase melts at the upper part with the interface shape similar to the no fin case. The behavior reverses for df = 0.95 where the upper part melts completely and only a small region at the lower part, less than the no fin case, becomes liquid. The result signifies that the effect of df becomes important at t = 1800 s.
Further increasing t to 4800 s, as shown in Figure 5c, the liquid region continues to enlarge. For df = 0.05, the solid phase is located at the middle part of the left surface. The primary position of the unmelted region for df = 0.20 is the same to df = 0.05, apart from the tiny region at the left corner. For other df, however, the solid phase is mainly located at the lower left of the enclosure and the size enlarges with moving the fin up. Besides, for df = 0.35 and 0.50, the convection flow characterized by velocity vectors forms over the fin but does not accelerate melting process because of the impedance of the fin. Due to the solid phase is above the fin, however, this flow is not blocked for df = 0.05 and 0.20. Compared to df = 0.05, the unmelted region is much smaller for df = 0.20, as a result of the higher strength of vortexes. On account of the stable thermal stratification, this flow is rather weak or even not formed for df = 0.65–0.95. The analyses imply that the dominated heat transfer mode is different for different df, which is natural convection for df = 0.05 and 0.20 and may transform to heat conduction for df = 0.35–0.95.
As melting goes on to t = 8400 s shown in Figure 5d, PCM melts completely for df = 0.05–0.35. While for other cases, the melting just enters the late stage and the unmelted portion is still located at the lower left corner, just with smaller size than t = 4800 s. Besides, an abnormal phenomenon is found that the unmelted region for df = 0.95 is slightly larger than the no fin case. It implies that the fin location affects the melting behavior notably and inserting fins is not always effective. The reason for this is that the thermal stratification forms more easily at the upper part for df = 0.95, as a result of which the intensity of natural convection near the interface is slightly lower when comparing to the no fin case.
3.2. Melting Time, tm
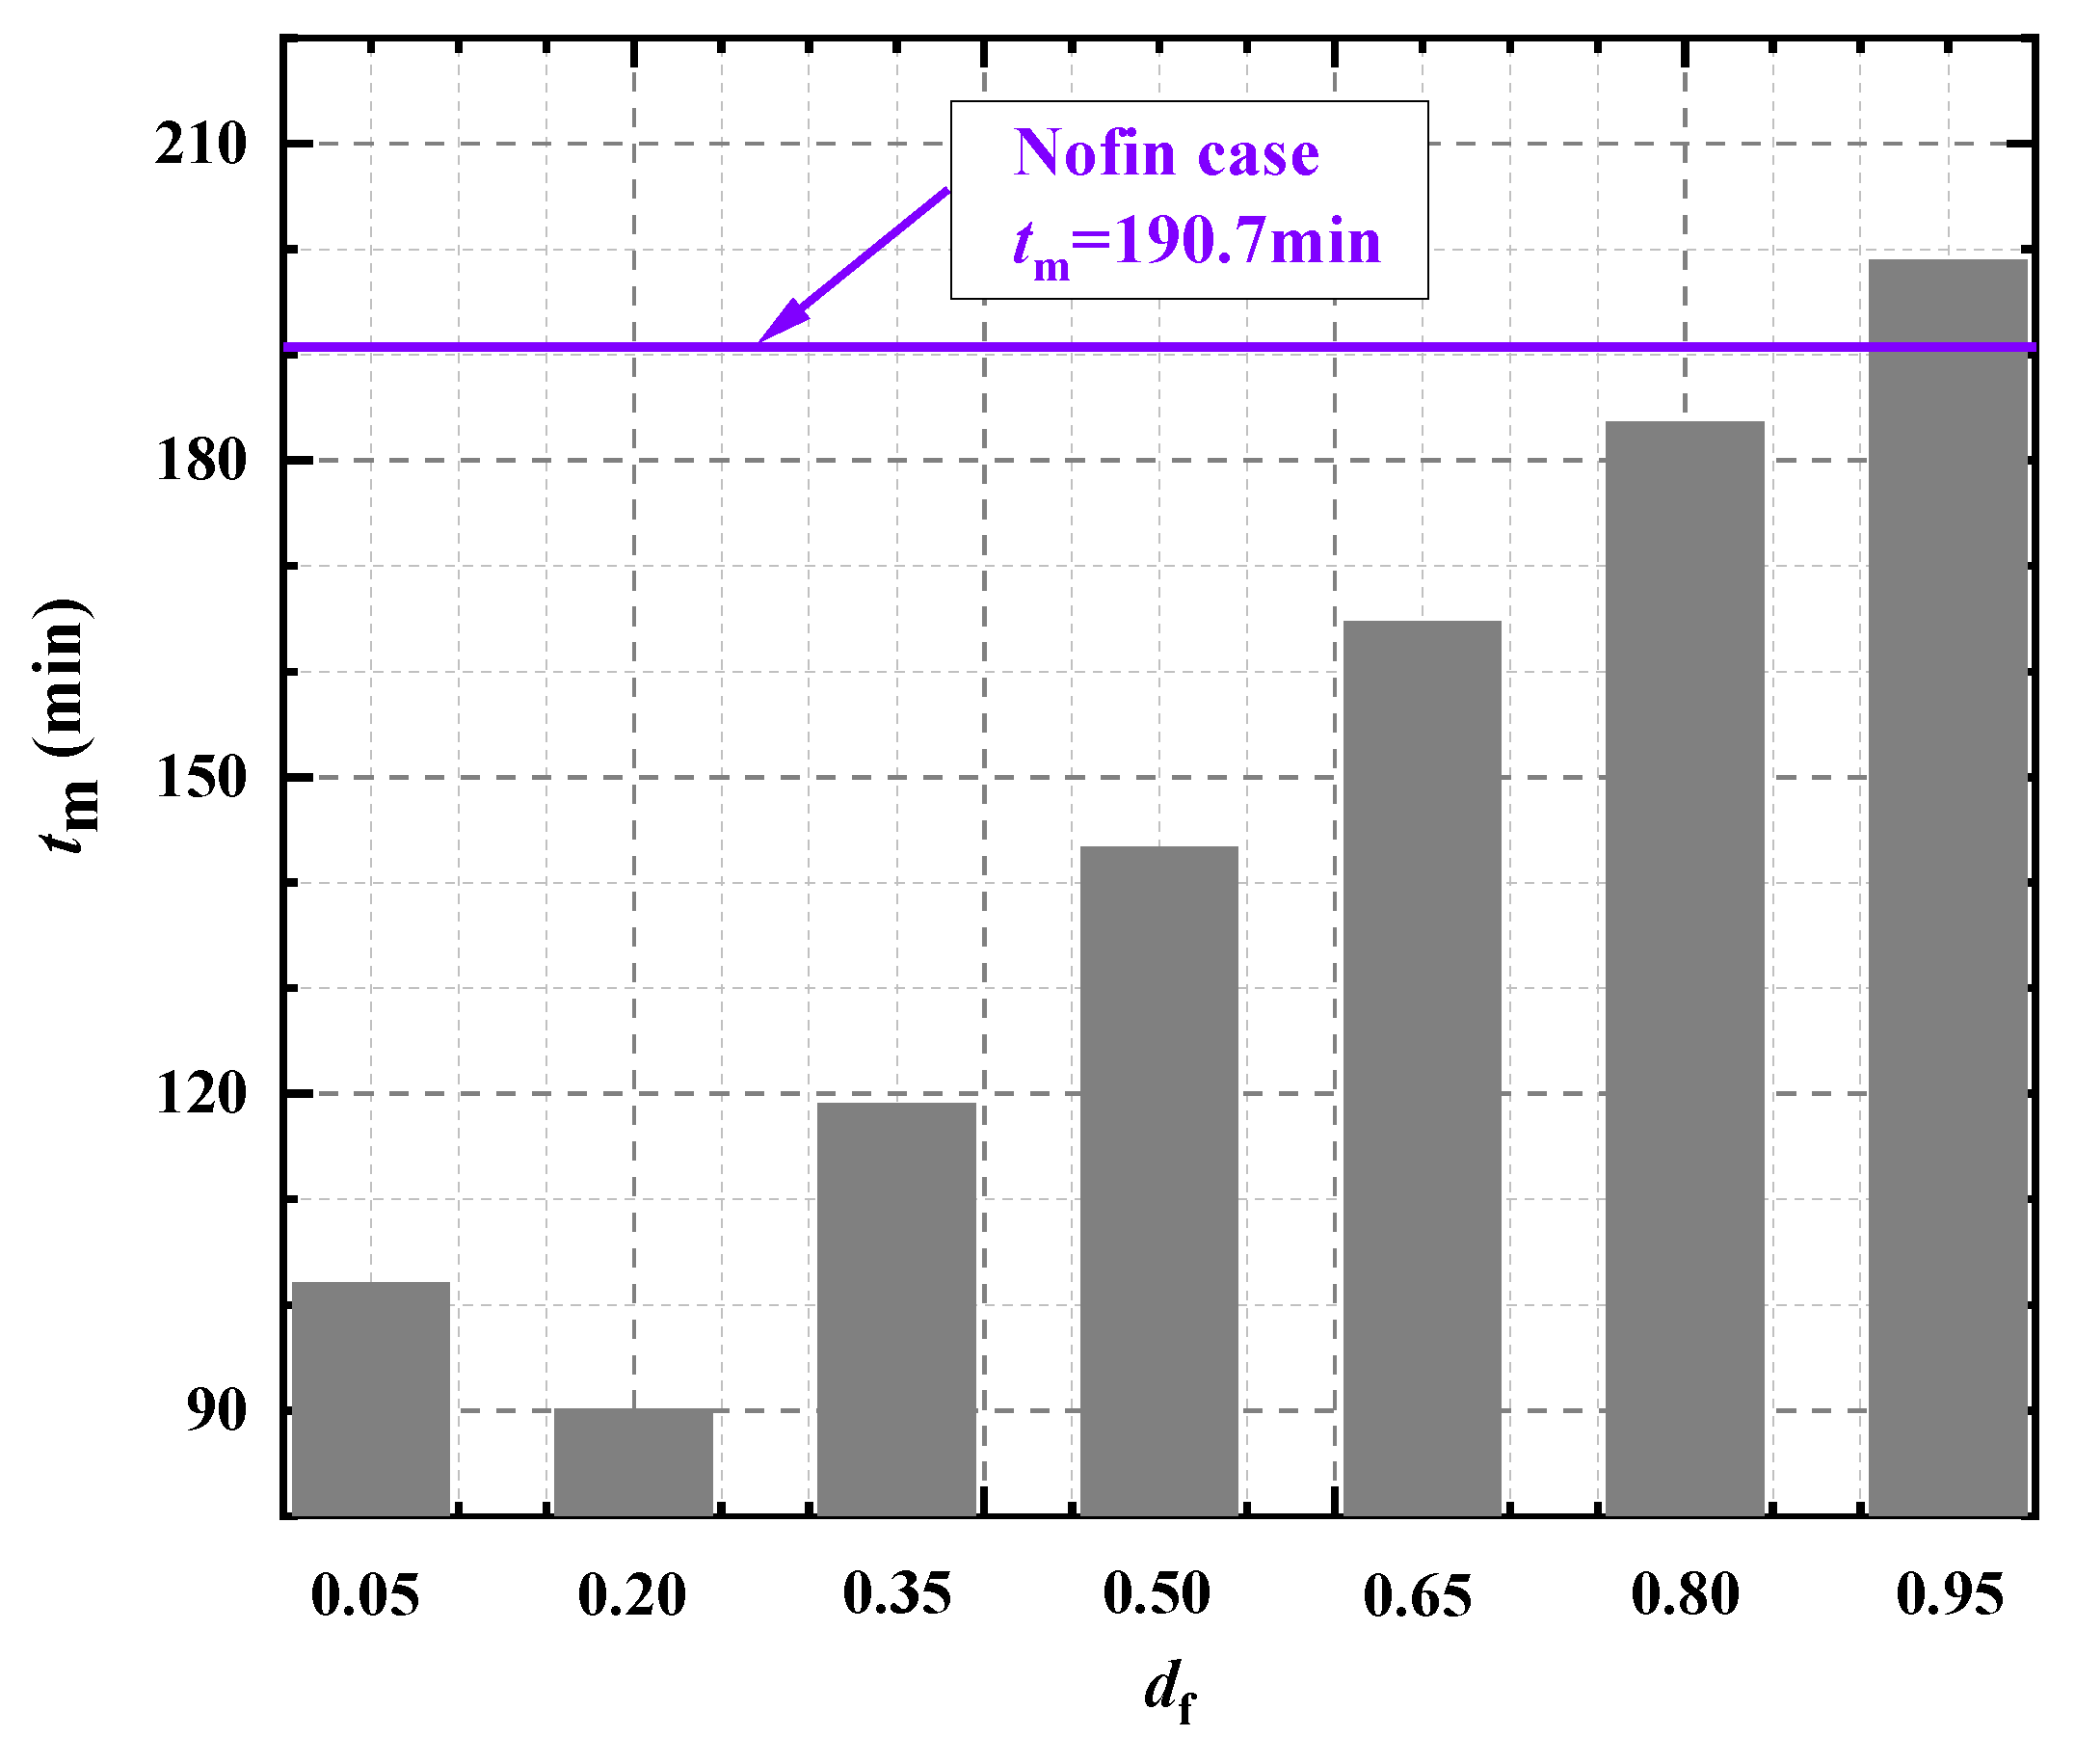
The variation of tm with df is shown in Figure 6. As df increases, tm decreases before attaining the minimum at df = 0.20 after which it increases. Compared to the no fin case of 190.7 min, melting is enhanced significantly with tm halved for df = 0.20. Besides, an interesting result is found that for df = 0.95, a scheme mounting fins closing to the top surface, tm is longer than the no fin case, which is unexpected and never reported by previous studies to the best knowledge of authors. The results demonstrate that the influence of df is notable, and fins should be arranged properly in practical applications.
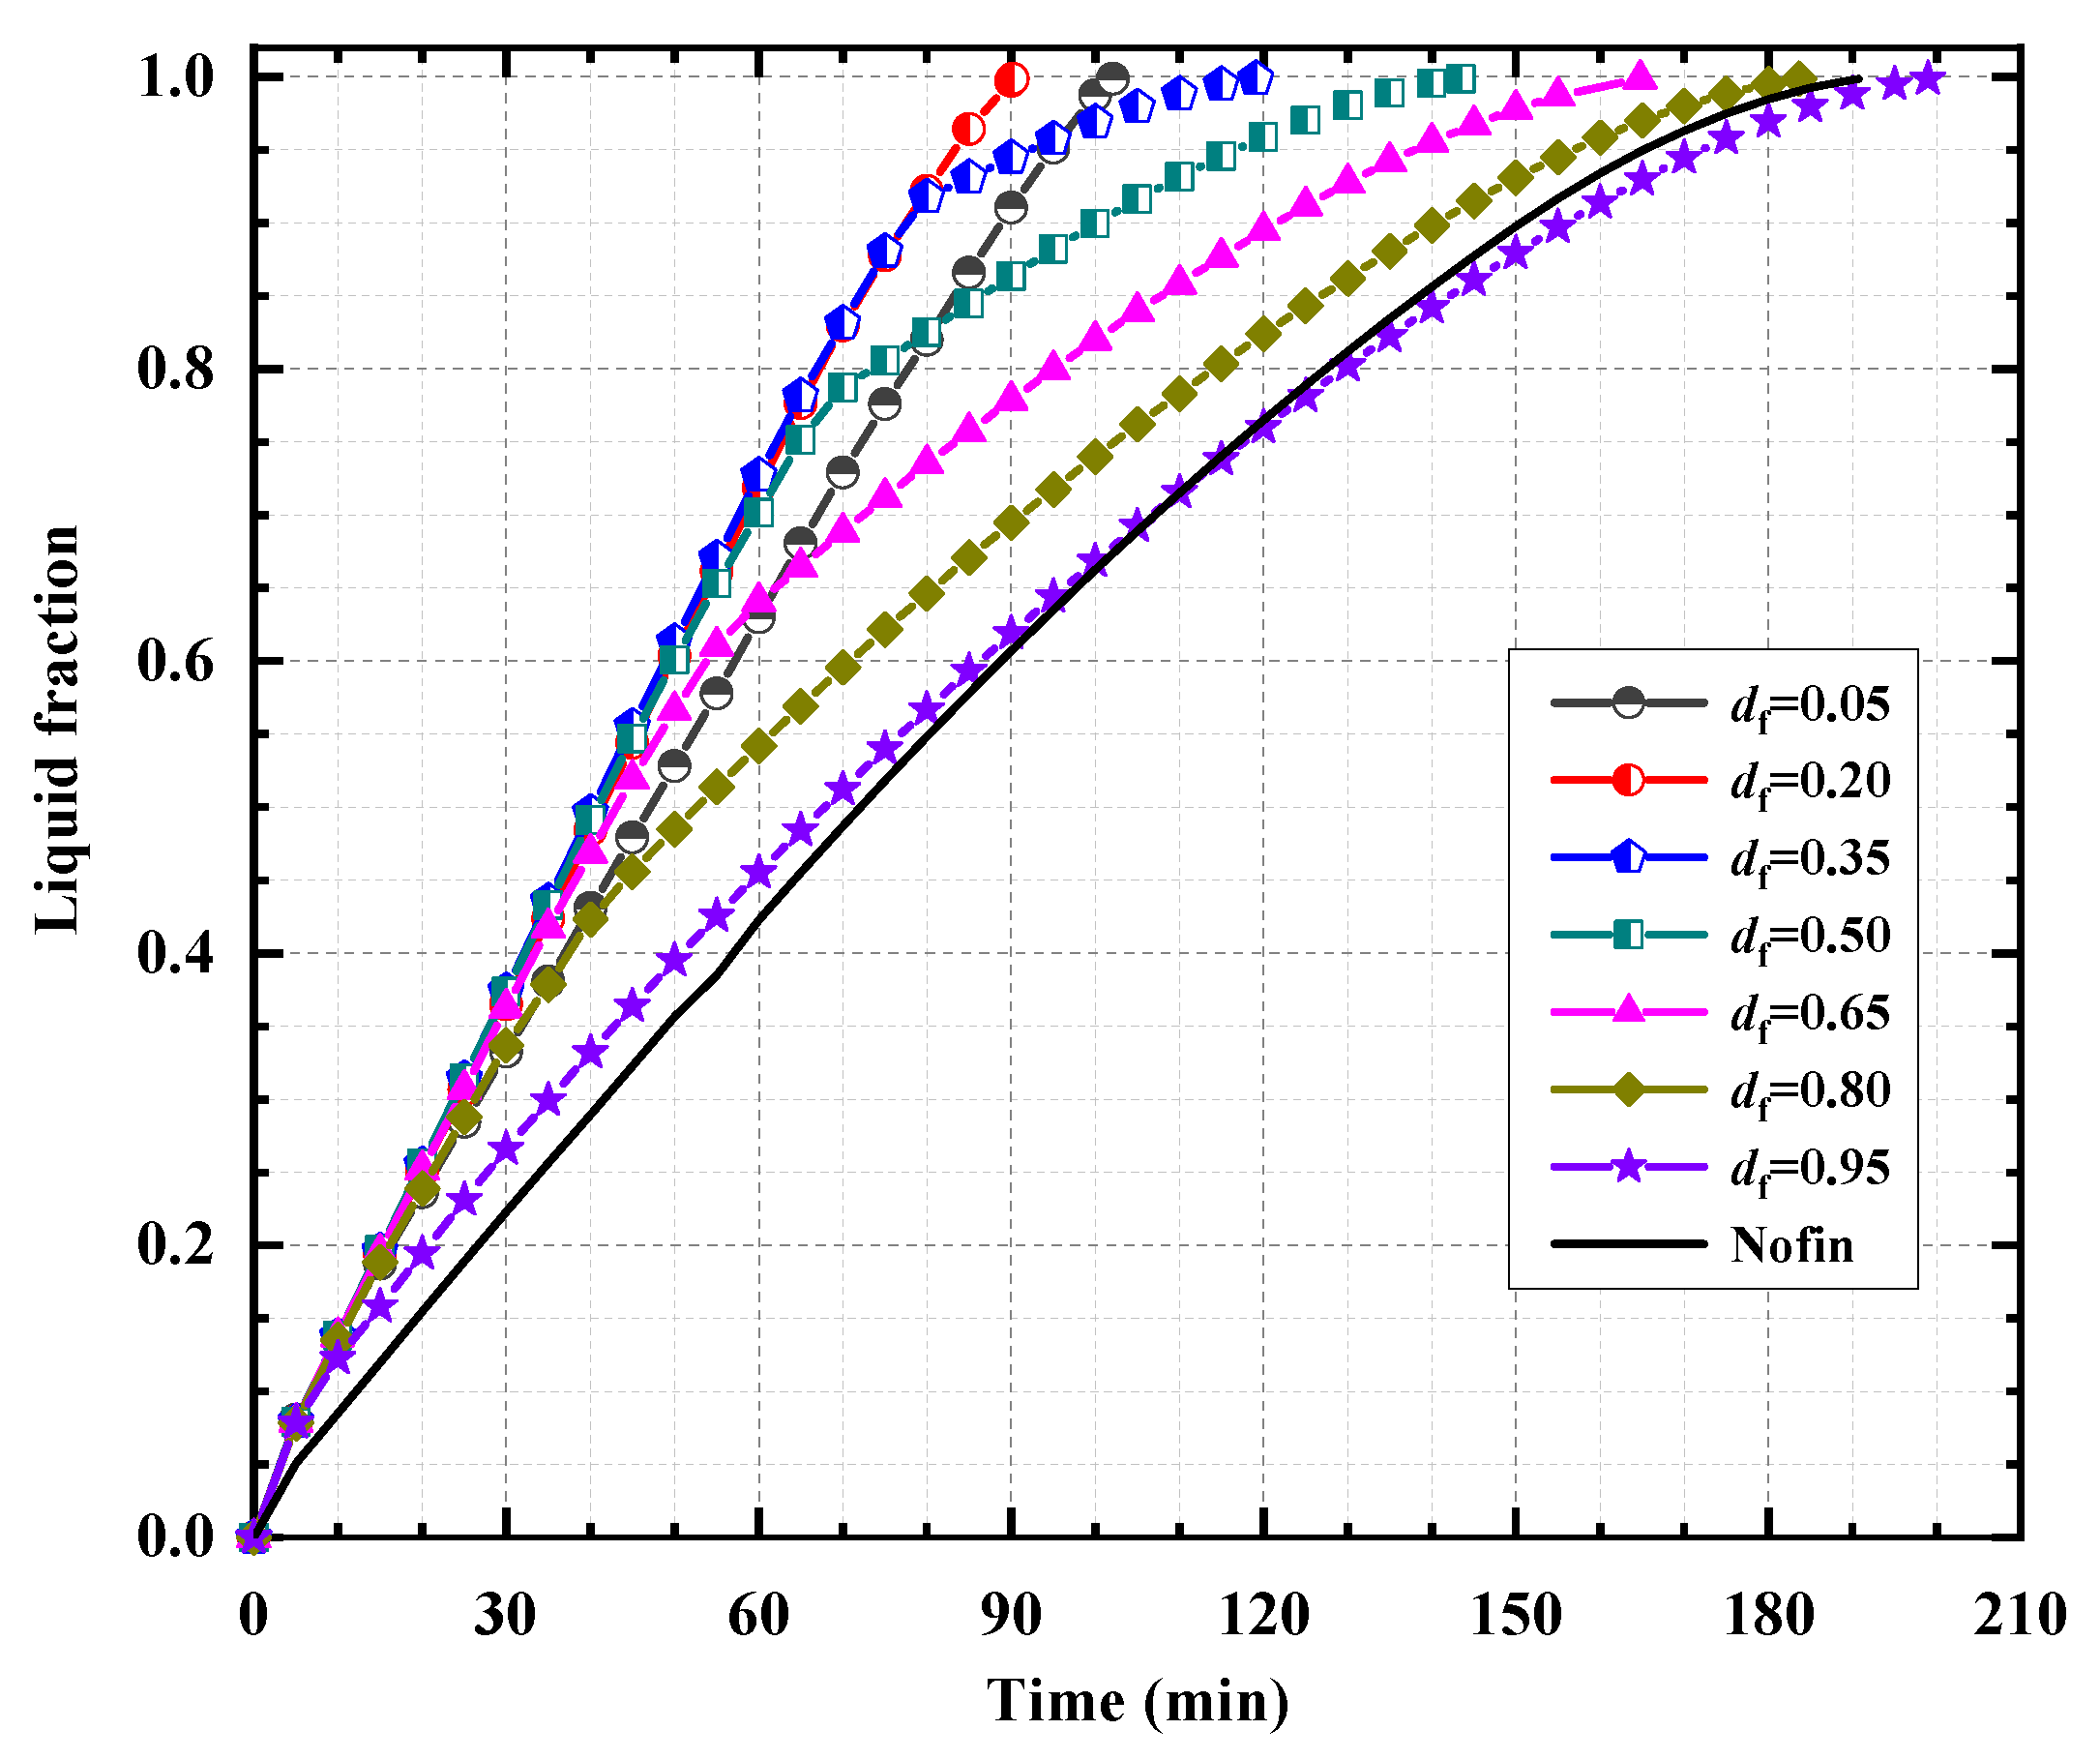
- For a lower γ (less than 10%), inserting fins is effective to enhance melting; the effect of df is insignificant because the conduction dominates the heat transfer.
- For df = 0.05 and 0.20, the melting rate, quite higher than the no fin case, approximately remains the same with rising γ. It is because the fin mounted at a lower place does not hinder the liquid flow. On account of that the influence range of fins as to heat conduction is limited by the bottom surface for df = 0.05 in comparison to df = 0.20, tm (df = 0.05) > tm (df = 0.20).
- For df = 0.35–0.80, as γ increases, the melting rate decreases to a value lower than the no fin case at a time. Depending on df, the larger the df is, the lower the time is, i.e., the earlier the transition arises. For instance, the transition time is 80 min for df = 0.35 and reduces to 55 min for df = 0.65. This behavior is expected since the mounted fin impedes the liquid flow and the higher it is put, the earlier the impedance takes place. Besides, the thermal stratification region enlarges with moving the fin up, as a result of which tm (df = 0.35) < tm (df = 0.50) < tm (df = 0.65) < tm (df = 0.80).
- For df = 0.95, the liquid flow intensity weakens considerably, because of forming thermal stratification at the upper part, even though the flow resistance as to fins is rather limited. Thus, the transition of melting rate ahead of df = 0.80 is presented and the melting process is longer than the no fin case.
From the results presented in Figure 5, Figure 6 and Figure 7, it is recommended to place the fin at a lower position but with a certain distance away from the bottom surface. Besides, fins should not be mounted closely, i.e., a certain space between fins should be reserved if more than one fin is employed.
3.3. Surface Averaged Nusselt Number Nu
In order to characterize the heat transfer rate and figure out the influence mechanism of df, the surface averaged Nusselt number, Nu, is used [39]:
where h is the average heat transfer coefficient, Q is the heat flux through the right surface, and Aw is the heat transfer area.
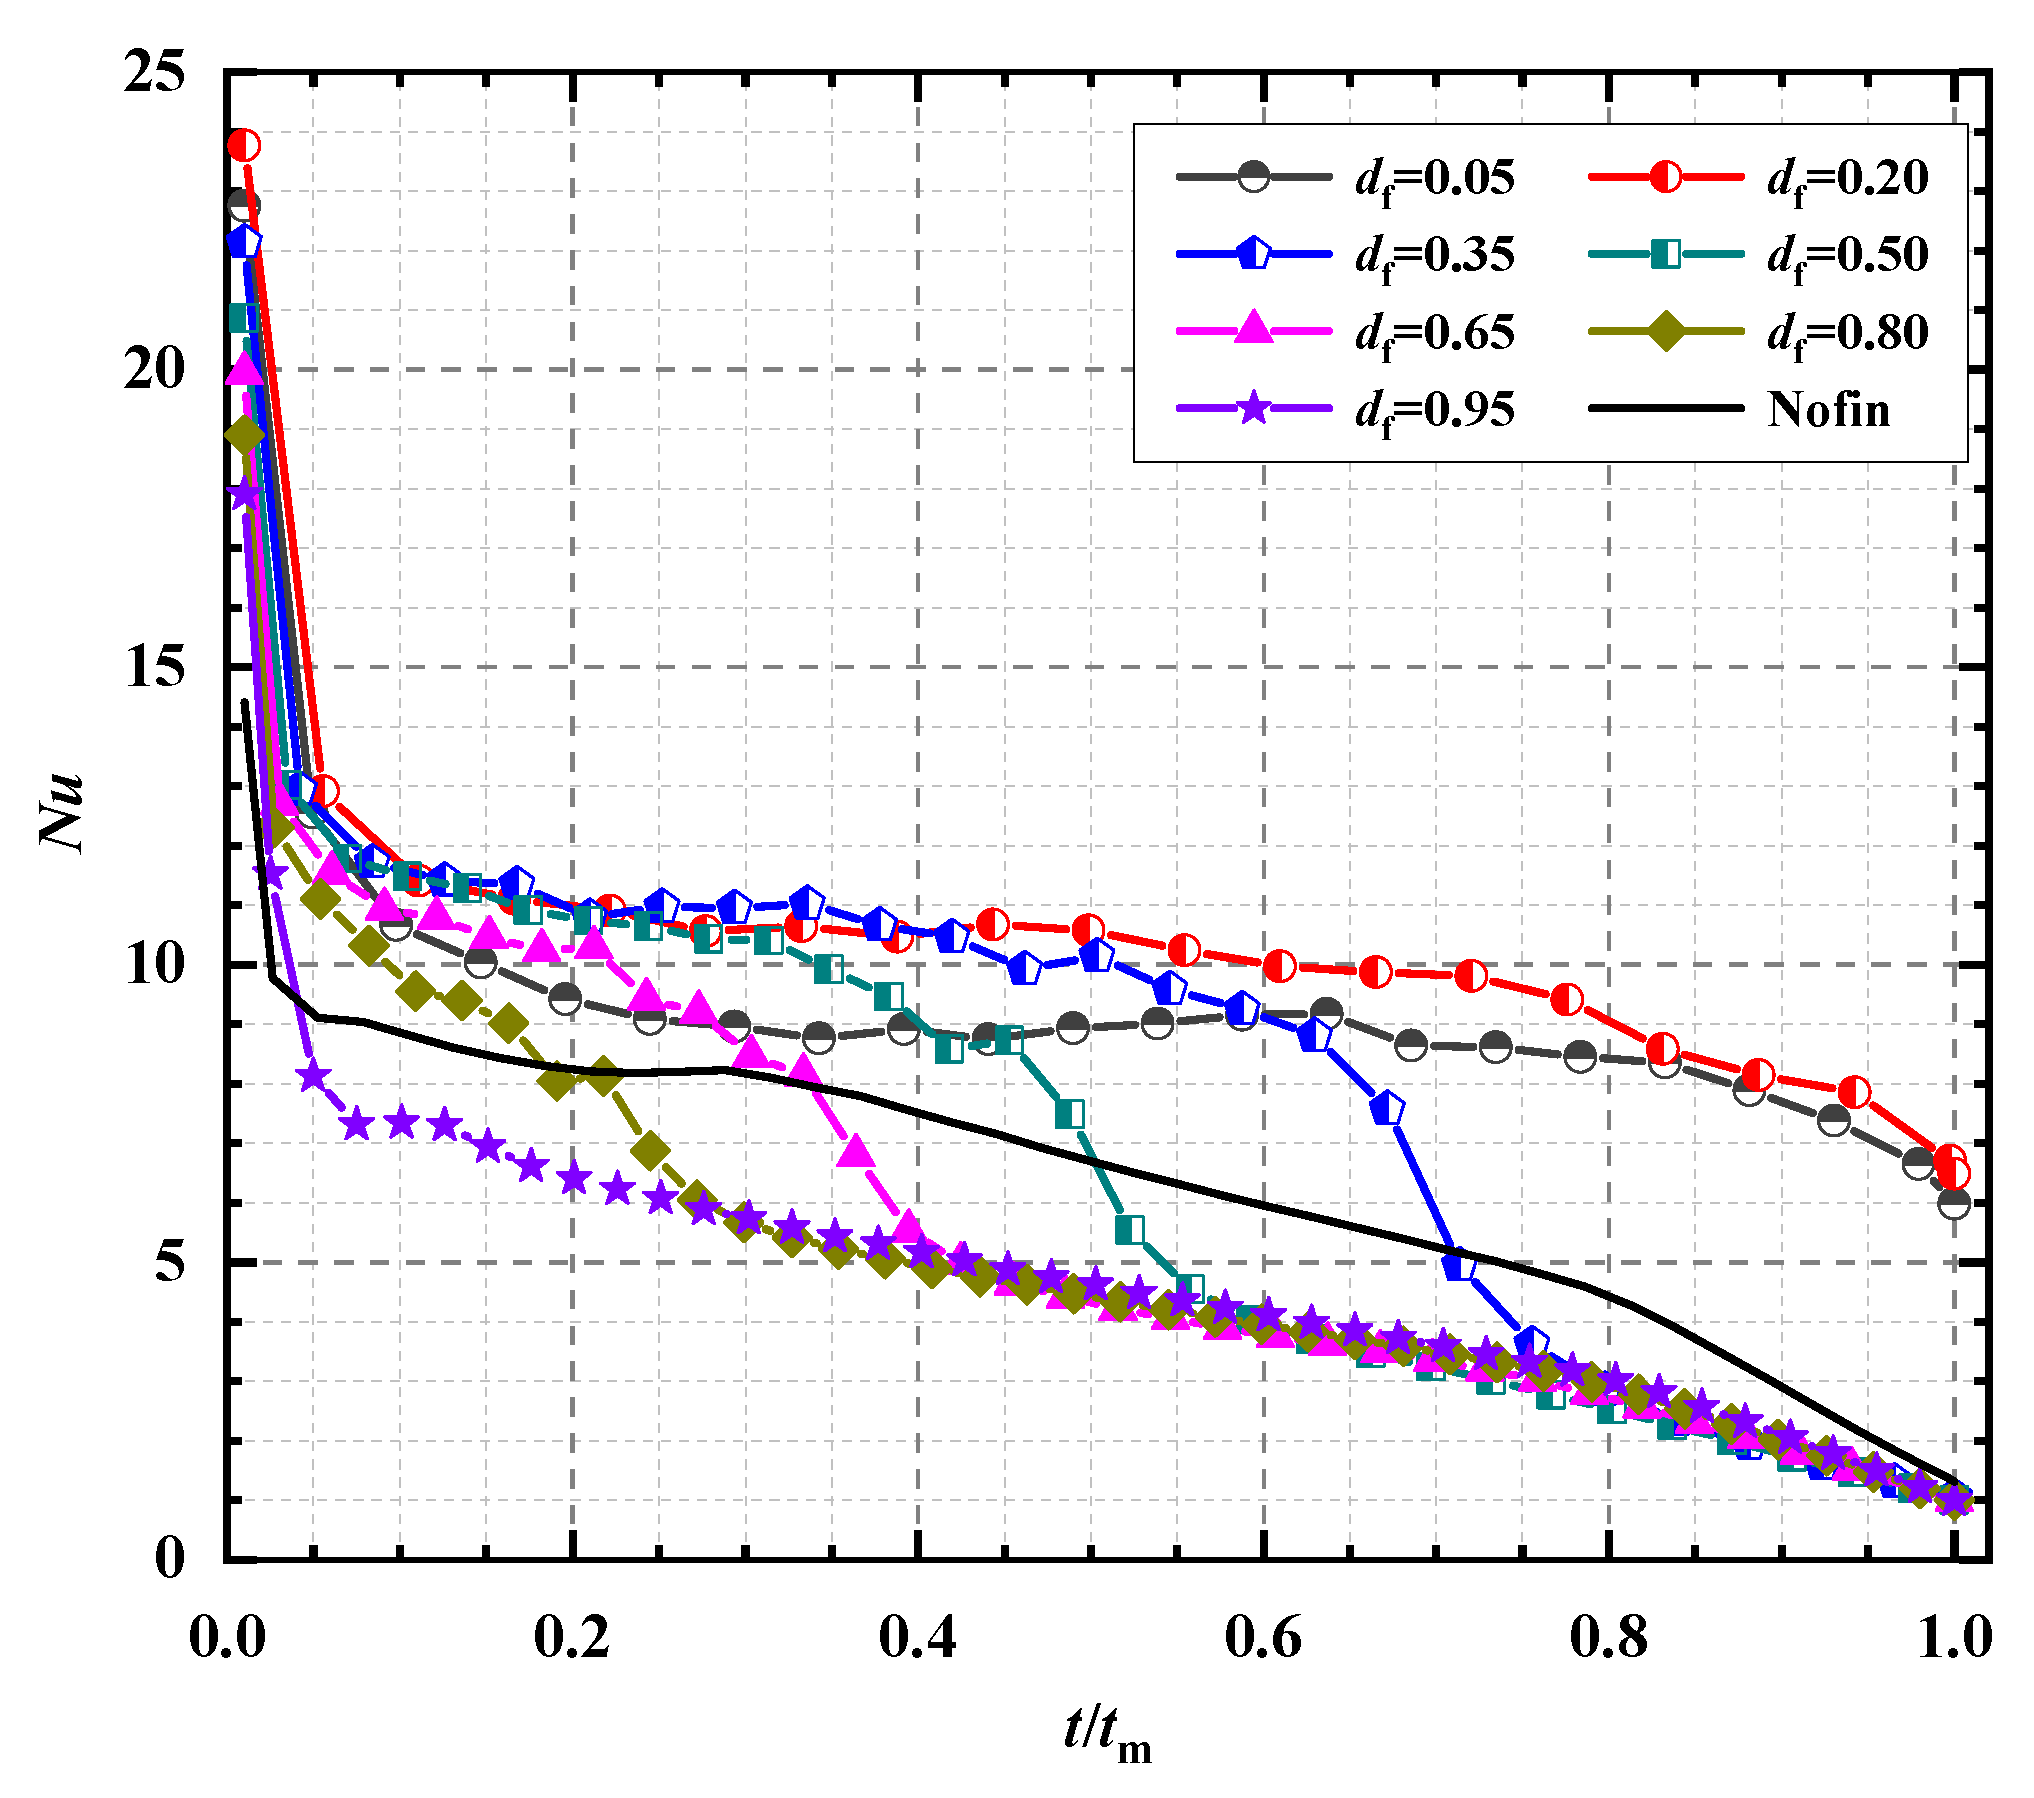
The variation of Nu with normalized time, t/tm, for different df and no fin case is shown in Figure 8. In general, Nu decreases with t/tm because of the increase of thermal resistance between the hot surface and interface with PCM melting. According to the decline rate of Nu, the melting process can be divided into four regimes for df = 0.35–0.80, which, in sequence, are heat conduction regime, strong convection regime, convection blockage regime, and weak convection regime. While for other df and no fin case, however, dividing the process into three regimes (without regime 3, convection blockage regime) may be more reasonable. Taking df = 0.50 as an example, the heat transfer characteristics of these regimes are as follows:
Regime 1: heat conduction regime; Nu decreases sharply from its maximum. At this regime, heat conduction dominates the heat transfer. The conductive resistance of the liquid layer increases from a rather small value, as a result of which Nu decreases sharply as melting goes on.
Regime 2: strong convection regime; Nu decreases in a slower rate, significantly lower than the Regime 1. The liquid fraction increases, and the liquid layer becomes thicker, leading to increasing conductive resistance continuity. Due to the transformation of the dominated heat transfer mode from conduction to natural convection, however, the increase of conductive resistance can be partially offset. As a result, Nu decreases far more slowly than the Regime 1. Besides, because of producing the recirculation of Rayleigh–Benard convection above the fin, as shown in Figure 5b, a fluctuation arises for Nu [27,34,45].
Regime 3: convection blockage regime; Nu decreases. Due to the fin impedance, the convection flow reduces in a large extent, as shown in Figure 5c, even though enough liquid is produced. Consequently, the dominated heat transfer mode is shifted from natural convection to conduction and the decline rate of Nu increases anew.
Regime 4: weak convection regime; Nu decreases in a rate slightly higher than the Regime 2 and far less than the Regime 1 and Regime 3. As shown in Figure 5d, only the PCM located at the lower left corner remains unmelted. Compared to the Regime 3, the liquid flow resistance associated with fins is rather limited or even disappears because a large distance is presented between the interface and hot surface. On account of the formation of thermal stratification over the interface, however, the liquid flow intensity is less than the Regime 2. As a consequence, the decline rate of Nu is far below the Regime 1 and the Regime 3 but greater than the Regime 2.
Due to the fact that the formation of convection flow is only moderately affected or even accelerated by the fin mounted near the bottom surface or top surface, the Regime 3 is not experienced by df = 0.05, 0.20 and 0.95, similar to the no fin case [39]. When moving the fin up, the liquid flow resistance enlarges, and the thermal stratification is formed more readily. Hence, both the transition t/tm from the Regime 2 to the Regime 3 and from the Regime 3 to the Regime 4 decrease, as shown in Figure 8. Figure 8 also shows that the transition t/tm from the Regime 1 to the Regime 2 is approximately the same for all df, indicating that the effect of df is limited at the early stage.
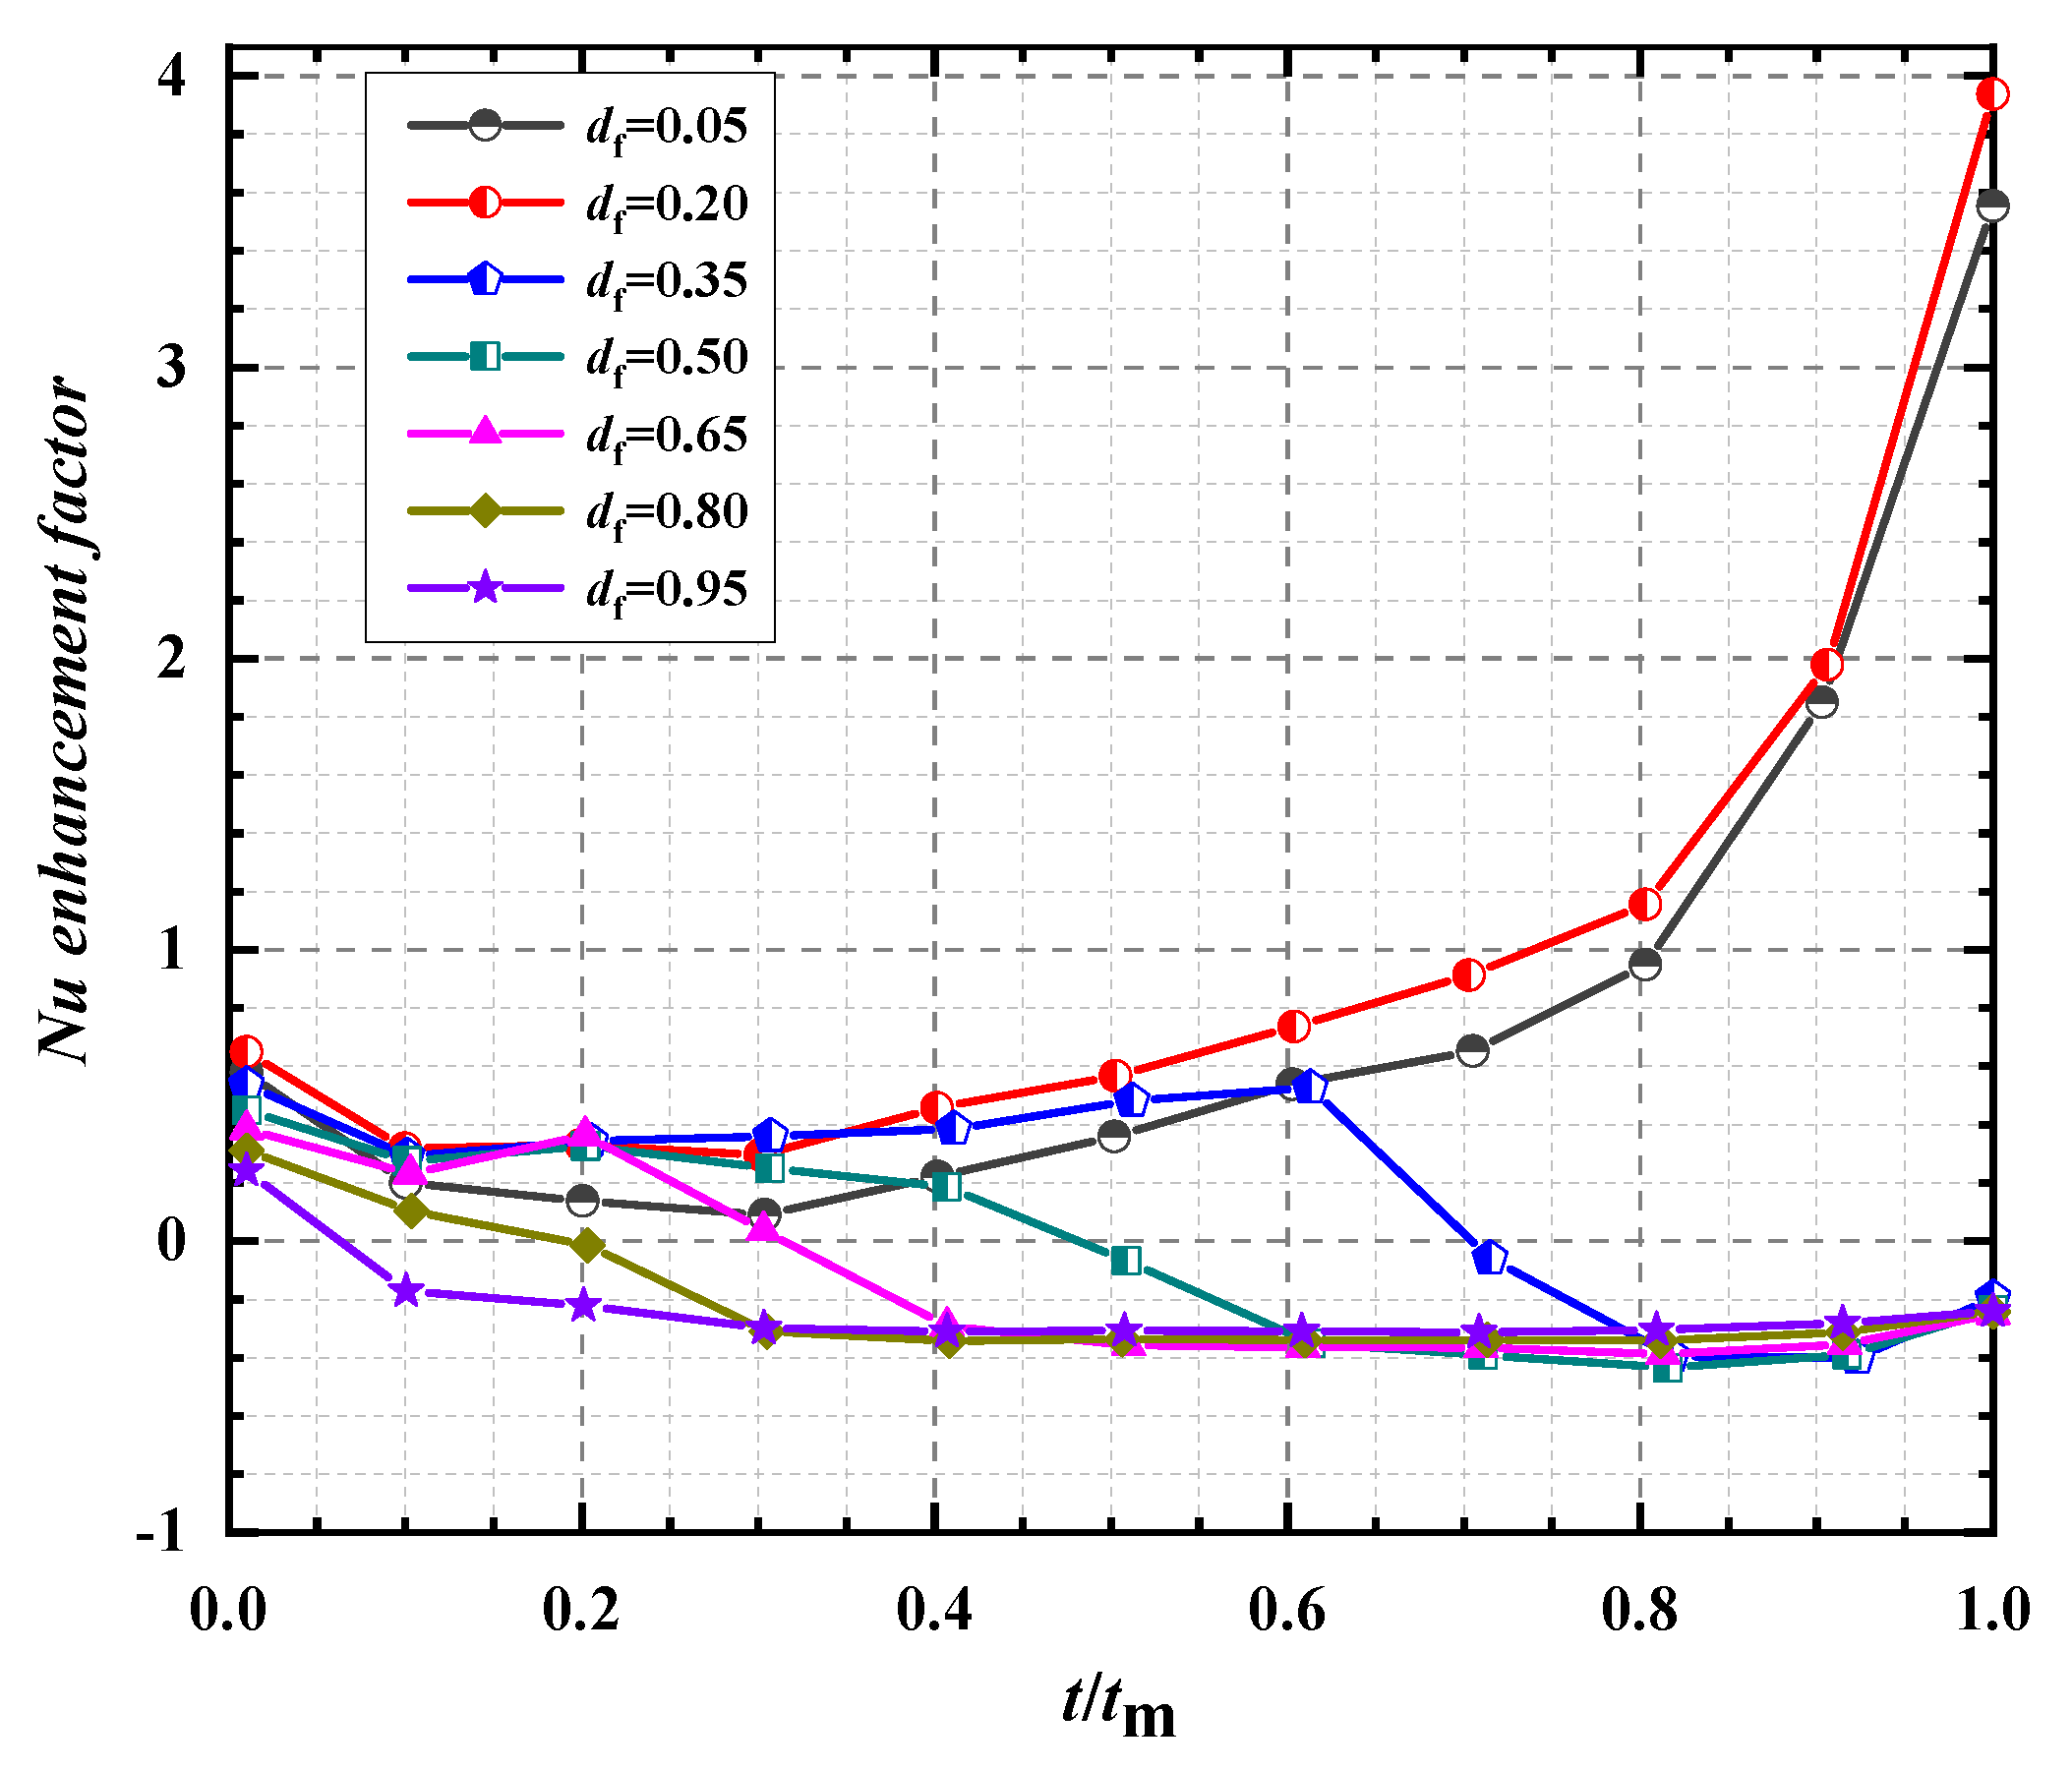
A parameter, Nu enhancement factor, εNu, defined by Equation (12), is introduced to identify the effect of df in depth.
where Nu (df) is the Nu with the fin location, df. Nu (no fin) is taken from the no fin case for a reference value. The variation of εNu with t/tm for different df is shown in Figure 9 and the analyses are as follows:
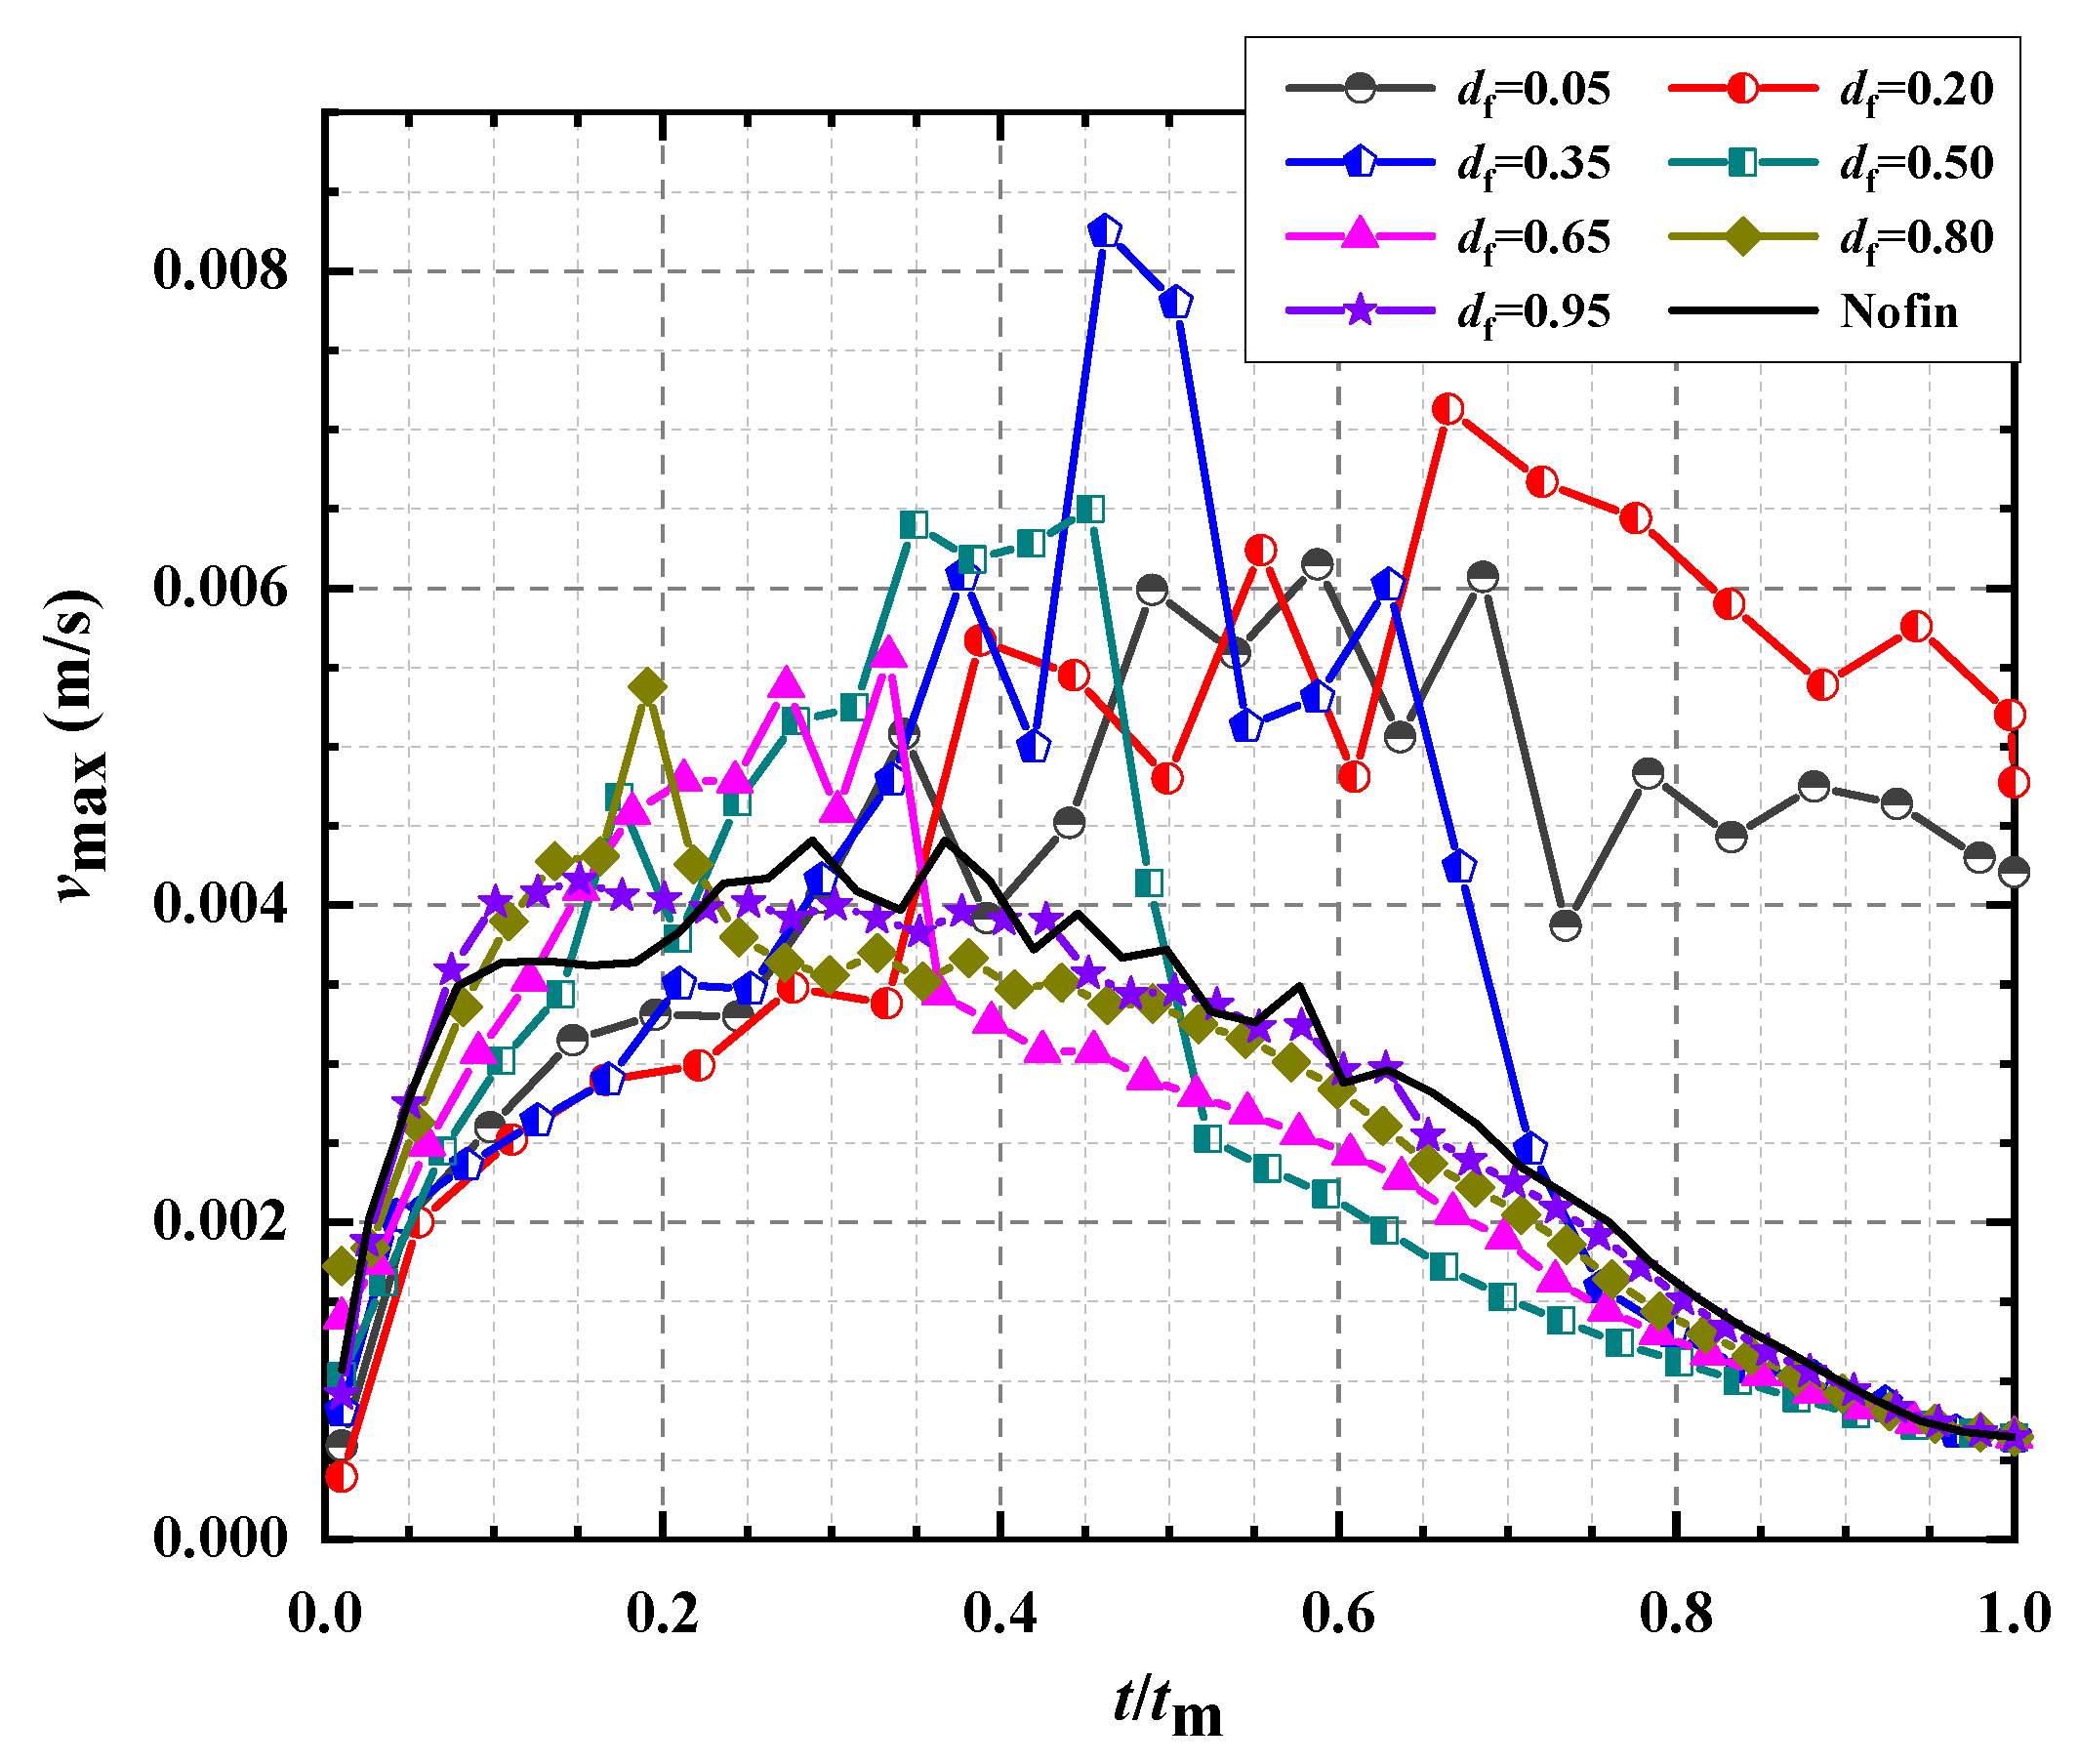
- εNu increases with t/tm in the whole melting process for df = 0.05 and 0.20. It is expected since mounting fin at a lower position enhances conduction at the beginning and facilitates natural convection at the middle and late stages; besides, the melting in the left corner is reinforced by the lower fin significantly, which is extensively regarded as a factor prolonging melting process seriously [28,46]. A testimony that facilitates natural convection is provided by Figure 10 which shows the variation of the maximum liquid flow velocity, vmax, with t/tm. For t/tm > 0.30, the difference between vmax (df) and vmax (no fin) enlarges notably with t/tm, precisely corresponding to the sharp increase of εNu.
- While for df = 0.35–0.80, the transition from εNu > 0 to εNu < 0 arises. That is, the heat transfer is not strengthened all the time. It is because the conduction is improved notably at the early stage or the early and middle stages, depending on df, but after that natural convection is reduced significantly due to the increase of liquid flow resistance as to fins and the formation of thermal stratification. The impedance of fins is verified by the variation of vmax shown in Figure 10. The comparison between Figure 10 and Figure 9 shows that the transition time from vmax (df) > vmax (no fin) to vmax (df) < vmax (no fin) is approximately equal to the transition time from εNu > 0 to εNu < 0.
- As liquid contours of the no fin case shown (Figure 5), the melting is originally much faster at the upper part in comparison to the lower part. As a result, the improvement of mounting fins near the top surface is not obvious and only limited to the very early stage. Besides, mounting fins near the top surface improves the temperature distribution nearby, facilitating the formation of thermal stratification and weakening the convection flow. Hence, on the one hand, εNu > 0 only arises at t/tm < 0.025 and εNu < 0 is presented at the rest of time for df = 0.95; on the other hand, the influence mechanism is different for df = 0.35–0.80 and df = 0.95, even though they share the same trend. As the same to df = 0.05–0.80, the variation of εNu is quite similar to the difference between vmax (df) and vmax (no fin).
The analyses indicate that vmax can be employed as an indicator to characterize the influence of df. The higher the vmax is, the larger the εNu is and the quicker the melting experiences. Thus, a strategy, boosting vmax, is proposed to reinforce melting, which includes promoting liquid flow and/or inhibiting thermal stratification formation. On account of that the liquid flow resistance is rather limited and the formation of thermal stratification is suppressed, the vmax then εNu and melting process is improved significantly for df = 0.05 and 0.20. As a result, it is recommended to mount fins at a lower place for vertical enclosures.
The strategy is also appropriate to other fin parameters such as fin angle and fin length. To enhance melting, the fin inclining an angle of 15° downward was proposed by Ji et al. [22], because of a small liquid flow resistance and constructing thermal stratification much slower than upward and horizontal fins. Similarly, to suppress the thermal stratification formation and reduce the liquid flow resistance, a scheme, mounting short fin at the upper part and long fin at the lower part, was proposed by Ji et al. [39]. Certainly, this strategy would not be suitable for the case where natural convection can be ignored. For instance, an experiment conducted by Huang et al. [25] indicated that with increasing fin number, the melting accelerates because of enhancing the conduction significantly, even though the liquid flow resistance is increased simultaneously. Besides, Andrea and Manuela [47] found that with inserting metal foams, natural convection weakens considerably due to the increase of viscosity, while the PCM thermal conductivity then conduction improves notably, resulting in a shorter melting process.
4. Conclusions
Taking a vertical rectangular enclosure as an object, the influence characteristics and mechanism of fin location, df, on melting behavior were studied numerically. The comparison with the no fin case was conducted. The main conclusions are as follows.
(1) For df = 0.05 and 0.20, conduction is improved at the beginning and natural convection is enhanced at the middle and late stages, resulting in halving tm when comparing to the no fin case; however since the function area of fins is limited by the bottom surface for df = 0.05, tm (df = 0.05) > tm (df = 0.20). While for df = 0.35–0.80, with an increase of df, the effectiveness of inserting fins reduces primarily because of increasing the liquid flow resistance. Besides, tm (df = 0.95) > tm (no fin) due to the fact that mounting fins in a place next to the top surface accelerates melting at the upper part, facilitating thermal stratification formation, which was never reported in the literature.
(2) Based upon the decline rate of Nu, the melting process can be divided into four regimes, heat conduction regime, strong convection regime, convection blockage regime, and weak convection regime for df = 0.35–0.80. While for df = 0.05, 0.20 and 0.95, similar to the no fin case, dividing the process into three regimes is more reasonable.
(3) The Nu is higher than the no fin case, i.e., εNu > 0, in the whole melting process for df = 0.05 and 0.20, while for other df, the transition from εNu > 0 to εNu < 0 arises and the higher the fin is put, the earlier the transition takes place.
(4) The symbol of the difference between vmax (df) and vmax (no fin) is nearly the same as εNu. To reinforce melting, a strategy is thus proposed that boosts the vmax for the case that natural convection cannot be neglected.
Supplementary Materials
The following are available online at https://0-www-mdpi-com.brum.beds.ac.uk/article/10.3390/en14144091/s1, Figure S1 High quality image of velocity vectors for different df and no-fin case at the flow time of 300 s, 1800 s, 4800 s, and 8400 s.
Author Contributions
Conceptualization, Z.-G.S.; methodology, B.H. and X.L.; software, B.H.; validation, B.H. and L.-L.T.; formal analysis, B.H. and Z.-G.S.; investigation, B.H.; resources, Q.-H.Y. and Z.-G.S.; data curation, B.H.; writing—original draft preparation, B.H. and Z.-G.S.; writing—review and editing, L.-L.T., X.L., and Q.-H.Y.; visualization, L.-L.T. and X.L.; supervision, Z.-G.S.; project administration, Z.-G.S.; funding acquisition, Z.-G.S. All authors have read and agreed to the published version of the manuscript.
Funding
This research was funded by the Fundamental Research Funds for the Central Universities, grant number 2018IVA059 and the 111 project, grant number B17034.
Institutional Review Board Statement
Not applicable.
Informed Consent Statement
Not applicable.
Data Availability Statement
Not applicable.
Conflicts of Interest
The authors declare no conflict of interest.
Nomenclature
| Amush | mushy zone constant, kg/(m3·s) |
| Aw | heat transfer area, m2 |
| cp | specific heat capacity, J/(kg·K) |
| d | distance between the lower surface of fin and the bottom surface of enclosure, m |
| df | fin location, d/H |
| g | gravitational acceleration, m/s2 |
| h | heat transfer coefficient, W/(m2·K) |
| hs | sensible enthalpy, J/kg |
| H | enthalpy, J/kg |
| Hc | height of rectangular enclosure, m |
| ΔH | latent enthalpy, J/kg |
| Lc | length of rectangular enclosure, m |
| Lf | length of fin, m |
| Lh | latent heat, J/kg |
| Nu | Nusselt number |
| p | pressure, Pa |
| Q | heat flux, W |
| t | time, s |
| tf | thickness of fin, m |
| tm | melting time, s |
| T | temperature, °C |
| T0 | initial temperature, °C |
| Tw | surface temperature, °C |
| u | velocity, m/s |
| vmax | maximum liquid flow velocity, m/s |
| Greek symbols | |
| β | Thermal expansion coefficient, 1/K |
| γ | liquid fraction |
| λ | thermal conductivity, W/(m·K) |
| ε | small number |
| εNu | Nu enhancement factor |
| ρ | density, kg/m3 |
| Subscripts | |
| fin | fin |
| l | liquid |
| PCM | PCM |
| ref | reference |
| s | solid |
Abbreviations
| LTES | latent thermal energy storage |
| PCM | phase change material |
References
- Hosenuzzaman, M.; Rahim, N.A.; Selvaraj, J.; Hasanuzzaman, M.; Malek, A.B.; Nahar, A. Global prospects, progress, policies, and environmental impact of solar photovoltaic power generation. Renew. Sust. Energ. Rev. 2015, 41, 284–297. [Google Scholar] [CrossRef]
- Shen, Z.G.; Tian, L.L.; Liu, X. Automotive exhaust thermoelectric generators: Current status, challenges and future prospects. Energy Convers. Manag. 2019, 195, 1138–1173. [Google Scholar] [CrossRef]
- Lin, Y.; Alva, G.; Fang, G. Review on thermal performances and applications of thermal energy storage systems with inorganic phase change materials. Energy 2018, 165, 685–708. [Google Scholar] [CrossRef]
- Wang, F.; Cao, J.; Ling, Z.; Zhang, Z.; Fang, X. Experimental and simulative investigations on a phase change material nano-emulsion-based liquid cooling thermal management system for a lithium-ion battery pack. Energy 2020, 207, 118215. [Google Scholar] [CrossRef]
- Gholamibozanjani, G.; Farid, M. A critical review on the control strategies applied to PCM-enhanced buildings. Energies 2021, 14, 1929. [Google Scholar] [CrossRef]
- Leang, E.; Tittelein, P.; Zalewski, L.; Lassue, S. Impact of a composite trombe wall incorporating phase change materials on the thermal behavior of an individual house with low energy consumption. Energies 2020, 13, 4872. [Google Scholar] [CrossRef]
- Li, Z.; Ma, T.; Zhao, J.; Song, A.; Cheng, Y. Experimental study and performance analysis on solar photovoltaic panel integrated with phase change material. Energy 2019, 178, 471–486. [Google Scholar] [CrossRef]
- Thalib, M.M.; Manokar, A.M.; Essa, F.A.; Vasimalai, N.; Sathyamurthy, R.; Garcia Marquez, F.P. Comparative study of tubular solar stills with phase change material and nano-enhanced phase change material. Energies 2020, 13, 3989. [Google Scholar] [CrossRef]
- Park, S.; Woo, S.; Shon, J.; Lee, K. Experimental study on heat storage system using phase-change material in a diesel engine. Energy 2017, 119, 1108–1118. [Google Scholar] [CrossRef]
- Tao, Y.B.; He, Y.L. A review of phase change material and performance enhancement method for latent heat storage system. Renew. Sustain. Energy Rev. 2018, 93, 245–259. [Google Scholar] [CrossRef]
- Shen, Z.G.; Chen, S.; Liu, X.; Chen, B. A review on thermal management performance enhancement of phase change materials for vehicle lithium-ion batteries. Renew. Sustain. Energy Rev. 2021, 148, 111301. [Google Scholar] [CrossRef]
- Zhang, S.; Feng, D.; Shi, L.; Wang, L.; Jin, Y.; Tian, L.; Li, Z.; Wang, G.; Zhao, L.; Yan, Y. A review of phase change heat transfer in shape-stabilized phase change materials (ss-PCMs) based on porous supports for thermal energy storage. Renew. Sustain. Energy Rev. 2021, 135, 110127. [Google Scholar] [CrossRef]
- Peng, H.; Zhang, D.; Ling, X.; Li, Y.; Wang, Y.; Yu, Q.; She, X.; Li, Y.; Ding, Y. n-Alkanes phase change materials and their microencapsulation for thermal energy storage: A critical review. Energy Fuels 2018, 32, 7262–7293. [Google Scholar] [CrossRef]
- Sardari, P.T.; Mohammed, H.I.; Giddings, D.; Walker, G.S.; Gillott, M.; Grant, D. Numerical study of a multiple-segment metal foam-PCM latent heat storage unit: Effect of porosity, pore density and location of heat source. Energy 2019, 189, 116108. [Google Scholar] [CrossRef]
- Ghalambaz, M.; Zhang, J. Conjugate solid-liquid phase change heat transfer in heat sink filled with phase change material-metal foam. Int. J. Heat Mass Transf. 2020, 146, 118832. [Google Scholar] [CrossRef]
- Gao, Y.; Liu, F.; Wang, J.; Ye, W.; Meng, X. Influence of the copper foam shape on thermal performance of phase-change material. J. Energy Storage 2021, 36, 102416. [Google Scholar] [CrossRef]
- Iasiello, M.; Mameli, M.; Filippeschi, S.; Bianco, N. Metal foam/PCM melting evolution analysis: Orientation and morphology effects. Appl. Therm. Eng. 2021, 187, 116572. [Google Scholar] [CrossRef]
- Iasiello, M.; Mameli, M.; Filippeschi, S.; Bianco, N. Simulations of paraffine melting inside metal foams at different gravity levels with preliminary experimental validation. J. Phys. Conf. Ser. 2020, 1599, 012008. [Google Scholar] [CrossRef]
- Chen, X.; Xia, X.; Sun, C.; Wang, F.; Liu, R. Performance evaluation of a double-pipe heat exchanger with uniform and graded metal foams. Heat Mass Transf. 2020, 6, 291–302. [Google Scholar] [CrossRef]
- Ghahremannezhad, A.; Xu, H.; Salimpour, M.R.; Wang, P.; Vafai, K. Thermal performance analysis of phase change materials (PCMs) embedded in gradient porous metal foams. Appl. Therm. Eng. 2020, 179, 115731. [Google Scholar] [CrossRef]
- Iasiello, M.; Bianco, N.; Chiu, W.K.; Naso, V. The effects of variable porosity and cell size on the thermal performance of functionally-graded foams. Int. J. Therm. Sci. 2021, 160, 106696. [Google Scholar] [CrossRef]
- Ji, C.; Qin, Z.; Low, Z.; Dubey, S.; Choo, F.H.; Duan, F. Non-uniform heat transfer suppression to enhance PCM melting by angled fins. Appl. Therm. Eng. 2018, 129, 269–279. [Google Scholar] [CrossRef]
- Mehta, D.S.; Vaghela, B.; Rathod, M.K.; Banerjee, J. Heat transfer enhancement using spiral fins in different orientations of latent heat storage unit. Int. J. Therm. Sci. 2021, 169, 107060. [Google Scholar] [CrossRef]
- Cao, X.; Yuan, Y.; Xiang, B.; Sun, L.; Zhang, X. Numerical investigation on optimal number of longitudinal fins in horizontal annular phase change unit at different wall temperatures. Energy Build. 2018, 158, 384–392. [Google Scholar] [CrossRef]
- Huang, M.J.; Eames, P.C.; Norton, B.; Hewitt, N.J. Natural convection in an internally finned phase change material heat sink for the thermal management of photovoltaics. Sol. Energy Mater. Sol. Cells 2011, 95, 1598–1603. [Google Scholar] [CrossRef] [Green Version]
- Acır, A.; Emin Canlı, M. Investigation of fin application effects on melting time in a latent thermal energy storage system with phase change material (PCM). Appl. Therm. Eng. 2018, 144, 1071–1080. [Google Scholar] [CrossRef]
- Kamkari, B.; Shokouhmand, H. Experimental investigation of phase change material melting in rectangular enclosures with horizontal partial fins. Int. J. Heat Mass Transf. 2014, 78, 839–851. [Google Scholar] [CrossRef]
- Kamkari, B.; Groulx, D. Experimental investigation of melting behaviour of phase change material in finned rectangular enclosures under different inclination angles. Exp. Therm. Fluid Sci. 2018, 97, 94–108. [Google Scholar] [CrossRef]
- Joneidi, M.H.; Rahimi, M.; Pakrouh, R.; Bahrampoury, R. Experimental analysis of Transient melting process in a horizontal cavity with different configurations of fins. Renew. Energy 2020, 145, 2451–2462. [Google Scholar] [CrossRef]
- Karami, R.; Kamkari, B. Experimental investigation of the effect of perforated fins on thermal performance enhancement of vertical shell and tube latent heat energy storage systems. Energy Convers. Manag. 2020, 210, 112679. [Google Scholar] [CrossRef]
- Fekadu, B.; Assaye, M. Enhancement of phase change materials melting performance in a rectangular enclosure under different inclination angle of fins. Case Stud. Therm. Eng. 2021, 25, 100968. [Google Scholar] [CrossRef]
- Elmaazouzi, Z.; El Alami, M.; Gounni, A.; Bennouna, E.G. Thermal energy storage with phase change materials: Application on coaxial heat exchanger with fins. Mater. Today Proc. 2020, 27, 3095–3100. [Google Scholar] [CrossRef]
- Abdi, A.; Martin, V.; Chiu, J.N. Numerical investigation of melting in a cavity with vertically oriented fins. Appl. Energy 2019, 235, 1027–1040. [Google Scholar] [CrossRef]
- De Césaro Oliveski, R.; Becker, F.; Rocha, L.A.; Biserni, C.; Eberhardt, G.E. Design of fin structures for phase change material (PCM) melting process in rectangular cavities. J. Energy Storage 2021, 35, 102337. [Google Scholar] [CrossRef]
- Mahood, H.B.; Mahdi, M.S.; Monjezi, A.A.; Khadom, A.A.; Campbell, A.N. Numerical investigation on the effect of fin design on the melting of phase change material in a horizontal shell and tube thermal energy storage. J. Energy Storage 2020, 29, 101331. [Google Scholar] [CrossRef]
- Biwole, P.H.; Groulx, D.; Souayfane, F.; Chiu, T. Influence of fin size and distribution on solid-liquid phase change in a rectangular enclosure. Int. J. Therm. Sci. 2018, 124, 433–446. [Google Scholar] [CrossRef]
- Bouhal, T.; Meghari, Z.; El Rhafiki, T.; Kousksou, T.; Jamil, A.; Ghoulam, E.B. Parametric CFD analysis and impact of PCM intrinsic parameters on melting process inside enclosure integrating fins: Solar building applications. J. Build. Eng. 2018, 20, 634–646. [Google Scholar] [CrossRef]
- ul Hasnain, F.; Irfan, M.; Khan, M.M.; Khan, L.A.; Ahmed, H.F. Melting performance enhancement of a phase change material using branched fins and nanoparticles for energy storage applications. J. Energy Storage 2021, 38, 102513. [Google Scholar] [CrossRef]
- Ji, C.; Qin, Z.; Dubey, S.; Choo, F.H.; Duan, F. Simulation on PCM melting enhancement with double-fin length arrangements in a rectangular enclosure induced by natural convection. Int. J. Heat Mass Transf. 2018, 127, 255–265. [Google Scholar] [CrossRef]
- Zhang, S.; Pu, L.; Xu, L.; Liu, R.; Li, Y. Melting performance analysis of phase change materials in different finned thermal energy storage. Appl. Therm. Eng. 2020, 176, 115425. [Google Scholar] [CrossRef]
- Liu, X.; Huang, Y.; Zhang, X.; Zhang, C.; Zhou, B. Investigation on charging enhancement of a latent thermal energy storage device with uneven tree-like fins. Appl. Therm. Eng. 2020, 179, 115749. [Google Scholar] [CrossRef]
- Shokouhmand, H.; Kamkari, B. Experimental investigation on melting heat transfer characteristics of lauric acid in a rectangular thermal storage unit. Exp. Therm. Fluid Sci. 2013, 50, 201–212. [Google Scholar] [CrossRef]
- Kok, B. Examining effects of special heat transfer fins designed for the melting process of PCM and Nano-PCM. Appl. Therm. Eng. 2020, 170, 114989. [Google Scholar] [CrossRef]
- Tian, L.L.; Liu, X.; Chen, S.; Shen, Z.G. Effect of fin material on PCM melting in a rectangular enclosure. Appl. Therm. Eng. 2020, 167, 114764. [Google Scholar] [CrossRef]
- Kamkari, B.; Shokouhmand, H.; Bruno, F. Experimental investigation of the effect of inclination angle on convection-driven melting of phase change material in a rectangular enclosure. Int. J. Heat Mass Transf. 2014, 72, 186–200. [Google Scholar] [CrossRef]
- Joneidi, M.H.; Hosseini, M.J.; Ranjbar, A.A.; Bahrampoury, R. Experimental investigation of phase change in a cavity for varying heat flux and inclination angles. Exp. Therm. Fluid Sci. 2017, 88, 594–607. [Google Scholar] [CrossRef]
- Diani, A.; Campanale, M. Transient melting of paraffin waxes embedded in aluminum foams: Experimental results and modeling. Int. J. Therm. Sci. 2019, 144, 119–128. [Google Scholar] [CrossRef]
Figure 1.
Configuration of a PCM enclosure.

Figure 2.
(a) Grid independency test results. (b) Schematic view of the used grid.

Figure 3.
Comparisons among the experiment carried out by Kamkari et al. [45], the present model, Ji et al. model [22] and Abdi et al. model [33] for no fin case.

Figure 4.
Validation with the experiment conducted by Kamkari and Shokouhmand [27] for 1 fin case and 3 fins case.
Figure 4.
Validation with the experiment conducted by Kamkari and Shokouhmand [27] for 1 fin case and 3 fins case.

Figure 5.
Instantaneous liquid fraction contours and velocity vectors for different df and no-fin case at (a) t = 300 s, (b) t = 1800 s, (c) t = 4800 s, and (d) t = 8400 s.
Figure 5.
Instantaneous liquid fraction contours and velocity vectors for different df and no-fin case at (a) t = 300 s, (b) t = 1800 s, (c) t = 4800 s, and (d) t = 8400 s.

Figure 6.
tm, for different df and no fin case.

Figure 7.
Evolution of γ with time for different df and no fin case.

Figure 8.
Variation of Nu with normalized, t/tm, for different df and no fin case.

Figure 9.
Variation of εNu with t/tm for different df.

Figure 10.
Variation of vmax with t/tm for different df and no fin case.


| Property | Symbol | Value |
|---|---|---|
| Melting temperature | Tl (°C) | 48.2 |
| Solidification temperature | Ts (°C) | 43.5 |
| Latent heat | Lh (kJ/kg) | 187.21 |
| Specific heat capacity of solid | cp,s (kJ/(kg·K)) | 2.18 |
| Specific heat capacity of liquid | cp,l (kJ/(kg·K)) | 2.39 |
| Density of solid | ρs (kg/m3) | 940 |
| Density of liquid | ρl (kg/m3) | 885 |
| Thermal conductivity of solid | λs (W/(m·K)) | 0.16 |
| Thermal conductivity of liquid | λl (W/(m·K)) | 0.14 |
| Thermal expansion coefficient | β (1/K) | 0.0008 |
Table 2.
Thermo-physical properties of aluminum [27].
Table 2.
Thermo-physical properties of aluminum [27].
| Property | Symbol | Value |
|---|---|---|
| Specific heat capacity | cp,fin (kJ/(kg·K)) | 0.871 |
| Thermal conductivity | λfin (W/(m·K)) | 130 |
| Density | Ρfin (kg/m3) | 2179 |
Publisher’s Note: MDPI stays neutral with regard to jurisdictional claims in published maps and institutional affiliations. |
© 2021 by the authors. Licensee MDPI, Basel, Switzerland. This article is an open access article distributed under the terms and conditions of the Creative Commons Attribution (CC BY) license (https://creativecommons.org/licenses/by/4.0/).
Share and Cite
MDPI and ACS Style
Huang, B.; Tian, L.-L.; Yu, Q.-H.; Liu, X.; Shen, Z.-G. Numerical Analysis of Melting Process in a Rectangular Enclosure with Different Fin Locations. Energies 2021, 14, 4091. https://0-doi-org.brum.beds.ac.uk/10.3390/en14144091
AMA Style
Huang B, Tian L-L, Yu Q-H, Liu X, Shen Z-G. Numerical Analysis of Melting Process in a Rectangular Enclosure with Different Fin Locations. Energies. 2021; 14(14):4091. https://0-doi-org.brum.beds.ac.uk/10.3390/en14144091
Chicago/Turabian StyleHuang, Bin, Lin-Li Tian, Qing-Hua Yu, Xun Liu, and Zu-Guo Shen. 2021. "Numerical Analysis of Melting Process in a Rectangular Enclosure with Different Fin Locations" Energies 14, no. 14: 4091. https://0-doi-org.brum.beds.ac.uk/10.3390/en14144091
Note that from the first issue of 2016, this journal uses article numbers instead of page numbers. See further details here.