Article

Solar Power: Stellar Profit or Astronomic Cost? A Case Study of Photovoltaic Installations under Poland’s National Prosumer Policy in 2016–2020

1
Faculty of Production and Power Engineering, University of Agriculture in Krakow, ul. Balicka 116B, 30-149 Kraków, Poland
2
Faculty of Agriculture and Economics, University of Agriculture in Krakow, al. Mickiewicza 21, 31-121 Kraków, Poland
3
Department of Economics and Enterprise Organization, Cracow University of Economics, ul. Rakowicka 27, 31-510 Krakow, Poland
4
Department of Applications of Mathematics in Economics, Faculty of Management, AGH University of Science and Technology, 30-067 Krakow, Poland
5
Higher School of Economics and Computer Science in Krakow, Filipa 17, 31-510 Kraków, Poland
*
Author to whom correspondence should be addressed.
Submission received: 28 May 2021 / Revised: 5 July 2021 / Accepted: 9 July 2021 / Published: 13 July 2021

Abstract

:
In Poland, the development of photovoltaic (PV) installations is an important element in the development of the Renewable Energy Sources (RES) sector and supports the prosumer power industry. The purpose of the article is to present a case study of the PROSUMENT program. It analyzes the data available to date on the development of the PV market in Poland. Apart from the costs of installing the PV systems, the article analyzes the profitability of investment for different micro-power installation capacities. A calculation for micro-power installations subsidized under the PROSUMENT program for various PV capacities is presented, along with the actual amount of the subsidy. The adopted calculation methodology is a comparative verification analysis of the investment cost estimate for a for the two studied PV facilities, i.e., Micro-power installation 1 and Micro-power installation 2. The building’s annual energy demand was adopted at the same level for both examples, with fixed active energy and distribution fees. The study includes a cost estimate for installing the PV systems and the profitability of the investments for various micro-power installation capacities. The analysis of the subsidy under the PROSUMENT program demonstrated that, in the analyzed period of 2016–2020, the best results were achieved by investments with a capacity of 10 kWp. In terms of the net subsidy value, the best results ranged between 27.20 and 19.10% of the total investment costs. Development of the Polish prosumer power market requires building public awareness of prosumer power production as an opportunity for the growth of the Polish economy.

1. Introduction

The European Union’s Energy Strategy recognizes citizens as prosumers [1,2]. When the European Parliament adopted the Clean Energy Package, a path of the prosumer collective organization was created [1,2,3]. As prosumers, citizens become active participants in energy markets through energy production as well as self-consumption [4,5,6,7]. A review of the literature shows that the prosumerism of renewable energy is a well-known concept [8,9,10,11,12,13]. In the early days of electrification, local communities took the initiative of and responsibility for creating proprietary power grids [14,15,16,17,18]. Often these communities formed local cooperatives, some of which are still active today, e.g., in Italy and Spain [19,20,21,22,23,24]. Prosumerism can make a significant contribution to the effective decarbonization of European economies, but it can also promote energy justice and new forms of democracy, opening up participation and ownership for many individuals [25,26]. Popularization and dissemination of renewable energy can also mean new roles and opportunities for citizens [27], who act as energy producers and consumers [28], or prosumers [6]. Renewable energy prosumers can be active citizens, willing to participate in energy markets [28], who act together in organized structures, e.g., power communities. In anticipating the emergence of the information age, renewable energy, biotechnology, and an increasingly post-industrial society, Toffler [29,30,31] emphasized the notion of “prosumer development”, characterized by a collapse of rigid definitions of “producer” and “consumer” forged during the industrial revolution. Although the definitions are under discussion [32,33], renewable energy prosumers are defined as entities that both produce and consume renewable energy and actively modulate their demand [34].
The distributed energy generation model includes the production of prosumer energy, assuming that the producer and recipient of energy are the same entity. In Poland, the adoption of the Act on Renewable Energy Sources of 20 February 2015 [35] (Act on RES) accelerated the development of local distributed energy and opened new opportunities for individual investors wanting to build renewable energy installations, as an alternative to large power plants [36,37,38,39]. Under the act [35], a renewable energy prosumer is considered an end recipient producing power exclusively from RES, for their own needs, using a micro-power installation. For the end recipient, who is not a household power recipient, this must not be the predominant economic activity, as defined in art. 40 sec. 2 of the Act of 29 June 1995, on Public Statistics [40]. A micro-power installation is formally understood as a RES installation with a total installed capacity of no more than 40 kW, connected to a power grid with a rated voltage of less than 110 kV, or with a total thermal power of no more than 120 kW. The distributed energy generation model also includes the concept of a business prosumer [41,42,43,44]. Schopfer et al. [45] note that technological advances and the declining cost of photovoltaic (PV) systems and batteries are key drivers of consumer and prosumer change in many countries [46,47].
The instrument that popularized the idea of distributed energy production in Poland was the PROSUMENT program. It was launched by the National Fund for Environmental Protection and Water Management in 2016–2020. The program aims “to support dispersed renewable energy sources” as “a subsidy line for the purchase and installation of micro-power RES installations”. By financing micro- or small RES installations, the program is also to reduce or eliminate CO2 emissions due to power or heat production for individuals, as well as housing communities or cooperatives. The program promotes new RES technologies and prosumerism (raising investment and environmental awareness), as well as influences the development of the market for equipment suppliers and installers, which increases employment in this sector. The subsidy included the purchase and installation of new micro- and small PS systems for the production of power or heat for single- and multi-family residential buildings. The program also included the replacement of existing installations with more efficient and environmentally friendly models. Program beneficiaries can be natural persons, housing cooperatives, housing communities, and local government units.
The aim of the paper is to evaluate the economic efficiency of the PROSUMENT program: the cost of installing PV systems, as well as the profitability of the investment for different micro-power installation capacities. A calculation for micro-power installations subsidized under the PROSUMENT program for different PV capacities is presented with the actual subsidy amount. The data come from micro-power installations mounted on the roof of a private house in Ostrowiec Świętokrzyski (Świętokrzyskie Province). The amount of energy produced in each quarter in the last three years i.e., 2018–2020, is provided (in kWh).
The structure of the manuscript is as follows: the condition of the Polish PV market, the prospects of its development, the methodology of the research, the comparison of the efficiency of different micro-power installation capacities according to the requirements of the PROSUMENT program, and the case study of a private residential building.

2. The Potential of Photovoltaics in Poland

In Poland, the results of research on the growing potential of PV were presented by Jurasz et al. [34], based on a case study of Wroclaw, the capital of the Dolnośląskie Province in south-west Poland, with a population of approx. 650,000. Wroclaw’s annual electricity consumption slightly exceeds 2.2 TWh, with industry accounting for 46% of the demand, and households for 31%. Jurasz et al. [48] report that the city could install up to 850 MW of PV panels on roofs, which could potentially reduce energy-related emissions by approx. 30%, and at the same time increase the city’s power self-sufficiency. While energy storage in batteries slightly improves both autarkic and environmental indicators, the relationship between potential PV production and the energy load makes batteries of little use (mainly in summer) and economically unjustified.
According to an amendment to the Act on Renewal Resources of 22 June 2016, PV investors are divided into entrepreneurs and prosumers. The prosumer produces energy only from RES using micro-power installations for their own needs, not related to their business activity. The power of a prosumer power installation cannot exceed 40 kW. Therefore, a prosumer cannot be a person who erects a PV installation on their office building, but on a private one. If this installation produces energy for business needs, not exceeding the permitted capacity of 40 kW, the owner can sell the surplus to the grid. The possible price is equal to the average price of “black” energy (i.e., from solid fuels) in a commercial market [49,50].

2.1. Social Aspects of RES in Poland

Social aspects of renewable energy development in Poland were described by Kowalska-Pyzalska [51]. The author emphasized that if the Polish government wanted to increase the share of RES in the power system, the contribution and acceptance of individual consumers should not be underestimated. To overcome the lack of knowledge on the development of renewable energy, social and educational campaigns and training are needed. Stable legal regulations and clear market rules are also important. Consumers are cost-sensitive, so to accelerate RES deployment and increase adoption rates, subsidy systems should be clear and procedures easy to understand. Kowalska-Pyzalska [51] pointed out that since consumers care about mutual support and opinion exchange, pilot programs with elements of gamification, or neighbor partnerships, can increase the effectiveness of the RES policy. The EU’s energy strategy and environmental policy aims to achieve a sustainable, low-carbon, and environmentally friendly economy by reducing global warming and increasing energy production from RES. In Poland, RES energy production triggers relatively high investment costs; therefore, according to Gnatowska et al. [52], it requires introducing appropriate support mechanisms and regulations. Since joining the European Union in 2004, Poland had both the opportunity and obligation to develop RES. From that moment on, the Polish PV installation market began to grow slowly. Until 2010, few PV installations were used mainly for research and scientific purposes, as initially mainly companies and enterprises were interested in such systems. Too-high installation costs discouraged the average citizen from installing such a solution. The introduction of provisions regulating the use of PV energy into Polish law, including the method of accounting for the produced energy and EU funding, opened an opportunity for the citizen—the prosumer.

2.2. Development of the PV Market in Poland

More dynamic development of the PV market in Poland has been observed since 2013. According to IEO [53], by 2013, 225 companies operated in the PV sector in Poland. Out of approx. 200 distributors of PV modules and accessories, approx. 77% of them offered end-to-end construction of PV micro-power plants. By 2015, the number of registered PV companies operating in Poland increased to 382. The dynamic growth of the PV industry yielded a new group: training and consulting providers, who contributed to the even and dynamic development of the private PV installation sector. The individual clients could now plan their investment in the smallest details and simulate the most profitable solutions [54,55,56,57,58,59].
According to IEO [46], the main type of services provided by an average company is the sale (93.5) and installation of solar panels (84%). A large number of companies also provide design and consulting services (77% and 68.3%, respectively), and the post-warranty service providers are the least numerous (36%). In 2016, the installed capacity was significantly affected by companies (auto-producers) that use proprietary power sources up to 200 kW for their own needs and possibly sell the surplus to the grid. Some of these investments were implemented without public support, and others were based on various provisions of the RES Act [59]. Although the capacity of micro-power installations is approx. 20 MW, which constitutes 20% of the energy generated in them, the share of business in this type of installations is small, only 7%. Such a large power generated in the business sector results from the fact that entrepreneurs build larger installations than private investors. In the private sector, over 90% of all micro-power installations have a capacity of up to 10 kW, while over 60% of installations in the enterprise sector have a capacity of over 10 kW.
The average cost of a PV system (survey data) depends on its capacity. The most expensive are the systems with the lowest capacity. Its price reaches approx. EUR 1785.71 (EUR 1 = PLN 4) net due to the lack of mainstream availability of such installations. With the increase in the capacity of the micro-power installation, the price per kW drops to approx. EUR 1071.43 for 1 MW of the system [58]. The research also provided information on the costs of individual PV system components. PV cell modules are the most expensive; depending on the capacity, they constitute from 41% (for systems with the lowest power of 1 kW) to 59% of the total price of 1 MW systems. The remaining price includes, e.g., an inverter, the supporting structure, and the assembly cost (the price decreases with the system capacity) [56].
Connecting the installation to the power grid allows the prosumer to use the grid as power storage. Storage of energy, which is produced but not immediately used, allows using it in the event of a power shortage (e.g., power production stoppage at night, or in winter). The seller makes settlements based on a comprehensive contract, according to the principles laid out by law, based on the differences between the amount of energy produced and that which is received from the grid. The law provides a 15-year warranty on the discount for prosumer micro-power installations. The billing system is as follows:
  • 1 to 0.8—for power generated in micro-power installations with a total installed capacity of under 10 kW;
  • 1 to 0.7—for power generated in a micro-power installation with a total installed capacity between 10 and 40 kW.
This means that for installations with a capacity of up to 10 kW, the prosumer has the right to collect 80% of the supplied energy free of charge. For installations between 10 and 40 kW, the prosumer can collect only 70% of the supplied energy free of charge.
According to Polish law, the prosumer is billed on an annual basis, regardless of the settlement period adopted in the comprehensive contract. This allowed the surplus of produced energy from the summer period introduced into the grid to be collected in the winter because both belong to the same settlement period. Therefore, the prosumer does not have to bear the costs of distribution and transmission of the balanced energy.
The discount system described above mobilizes prosumers to use all the produced energy for their own needs. Considering the settlement coefficients, the best solution from the prosumer point of view is to use all the produced energy in real-time in their household and not return it to the grid. Currently, only approx. 11% of the power produced in Poland by PV systems is utilized. To use the produced energy as efficiently as possible, energy management in the household must first be reconsidered, and demand management must be adapted.
For the prosumer, the grid as “storage” is a more energy- and cost-efficient solution than traditional energy accumulators. Storing power in traditional batteries generates greater losses and requires control of the battery charge status. It should also be noted that the prosumer does not bear the costs of using the grid as a warehouse, and the power plant gains excess energy that remains in the grid [60,61,62,63,64].

2.3. The Prospects of PV Development in Poland

In 2017, the International Energy Agency (IEA) announced that photovoltaics was the world’s fastest-growing RES. As in most countries in the world, the largest amounts of power in Poland are generated from fossil fuels. They are the main source of pollution and the greatest threat to the environment. The countries such as India, China, and the United States are making the greatest progress in the development of photovoltaics. According to IEA estimates, they will have been responsible for two-thirds of the global growth of PV installations by 2022. To a large extent, these are huge PV farms that are located in China. Moreover, over 60% of the production of PV panels takes place in China. In India, the cost of generating 1 kWh is less than 3 cents. This is very important as the price is a very good driver of development, and the climatic conditions of the country also favor the installed PV capacity.
The Polish government also contributed to the development of photovoltaics. With the Act on RES, which specified the method of billing for the generated energy and concessions for prosumers, a large number of people appeared who installed PV installations of different capacities in their households [65,66,67].
One of the ways to support the development of PV micro-power installations (and more) is the PROSUMENT program, offering a preferential subsidy for the purchase and installation of a micro-power RES installation to support the prosumer investments in households. The anticipated value of the program for 2014–2022 is EUR 190,476,190.48. The program can be participated in by natural persons, communities, and housing cooperatives as well as local government units [68].
Beneficiaries of the PROSUMENT program should take into account the long settlement period, which prolongs the installation process (it can exceed 12 months).
In the years 2017–2020, local government projects under the Regional Operational Programs in individual provinces are also of great importance for the development of PV micro-power installations in Poland [69].
The constant amendments to the RES Act make any attempts to estimate the impact of micro-power installations on the Polish energy market very difficult to estimate. According to the National Development Plan for RES Micro-Power Installations, by 2030 [70,71], the number of micro-power installations by 2030 is to exceed 1.8 million, with a total electricity capacity of 16 GWe, most of which would be prosumer PV installations.

3. Materials and Methods

In designing the discussed research, the comparative analysis and case study methods were used. The comparative analysis is most often used in the study of size and financial relationships, and is often called the financial comparative study [72]. Młynarski [73] defines comparative analysis as an analysis based on the comparison of distinguished characteristics of objects.
Regarding the case study method, Yin [74] recommends it to determine answers to exploratory questions, i.e., “how” and “why” a phenomenon occurs. This type of scientific study focuses more on a deep understanding of the phenomenon than on the analysis of variables. Using the case study method, therefore, allows discovering that which the results of a quantitative study can only suggest. Compared to other research methods, the case study offers the widest range of techniques and tools for obtaining and analyzing data. Data sources can include observations, interviews, company documents, press articles, surveys, and databases from various institutions. There are also no methodological limitations as to how the data should be analyzed. The scientific nature of the case study method is evidenced by objectivized, rational, organized, systematic, and structured proceedings aimed at ensuring the reliability of conclusions. The most important principle is the triangulation method, understood as obtaining data from several independent sources [75].
The adopted methodology is to enable the calculation of the amount of energy that needs to be purchased from the supplier when the discount is exhausted. It also presents guidelines for the billing system defined for the PROSUMENT program carried out in Poland. The adopted assumptions enable making identical calculations for different types of micro-power installations, with cost simulations beneficial for a given solution. To understand better the prosumer discount system, a preliminary investment cost of a PV system can be calculated. Below are the assumptions for further calculations for two PV micro-power installations with different capacities, 9 and 15 kWp, the most popular micro-installation sizes in Poland [60].
As presented in Table 1, the annual energy demand of the studied buildings was identical, i.e., 15,000 kWh. Moreover, in both cases, the charges for active energy and distribution fees were fixed (0.08 EUR/kWh and 0.06 EUR/kWh, respectively).
The insolation was adopted at 900 to 1150 kWh/m2/year, which is the European average and relates to all Polish provinces (according to the Typical Meteorological Year) [61]. Moreover, the level of power production adopted for the research was 1 kWp per 1 year (1052 kWh is the above-average value) [64], and the current energy consumption was adopted at 60%. Both studied installations differ in the rate of the discount. This is related to the capacity of the micro-power installations, as determined by law.
The PROSUMENT program is aimed at individual customers who will produce power for their own needs. The program applies to investments in micro-power installations and theoretically allows for a 40% return on investment costs. PROSUMENT includes:
  • a subsidy of up to 40% of eligible PV installation costs in 2016, at the maximum amount of EUR 23.809.52
  • a subsidy in the years 2017–2020 of up to 30% of eligible PV installation costs
  • a low-interest loan (1% per annum) for 15 years (for 100% of eligible costs)
  • the eligible cost for the PV installation is EUR 7000 for each 1 kWp installed, up to 5 kWp, and EUR 1428.57 for installations over 5 kWp
  • the subsidy is granted only at branches of the BOŚ Bank.
Due to the limited pool of funds allocated to this program by the National Fund for Environmental Protection and Water Management (NFOŚiGW), the chances of obtaining funding are limited. Moreover, this program only theoretically allows a 40% or 30% subsidy because:
  • the tax on the subsidy amount is 19%
  • the co-financing has a loan margin of 3%
  • additional costs related to co-financing, e.g., preparation of project documentation that meets the program requirements (EUR 202.38), and of documentation for the bank (EUR 107.14)
  • the costs of securing the loan, the amount of subsidy on the mortgage, and the insurance reduce the actual level of funding by several percentage points
Table 2 and Table 3 show the actual level of subsidy received when applying for a subsidy to a RES micro-power PV installation investment.
The analysis concerns the installation power up to 10 kWp. The installation capacities of 3, 5, 8, and 10 kWp are typical PV capacities on offer, but they include the ranges of eligible costs provided for in the PROSUMENT program. As described above, the specified amount for installations of 3 and 5 kWp is EUR 1666.67 per 1 kWp of eligible costs, and for installations of 8 and 10 kWp, the amount is EUR 1428.57 per 1 kWp. In the PROSUMENT program, which was planned for 2016, the amount of co-financing was set at 40%, and in 2017–2020 at 30%. When calculating the exact amount available within the subsidy grant, it is worth taking into account the additional costs. Each subsidy value is gross, subject to a 19% income tax. Moreover, there are costs of the project itself, the cost of creating documentation for the bank, and the bank’s commission. The difference between all these costs and the value of the subsidy gives the actual amount of funding that can be obtained with the assumed capacity of the installation.

4. Discussion and Conclusions

4.1. Micro-Power Installation 1 and Micro-Power Microinstallation 2

Upon calculating, the data for Micro-power installation 1 and Micro-power installation 2 were compiled. This allows determining the differences that resulted in the appropriate discounts.
Upon comparing the obtained data, it can be observed that the annual power consumption in the building and the current annual consumption are identical. According to the presented Table 4, the annual production of a PV installation was calculated as the quotient of its capacity and the amount of power produced by 1 kWp annually. This calculation allowed an estimate of the value of energy fed into the grid annually. Upon comparing both micro-power installations, it can be seen that the amount of power fed into the grid is much higher in Micro-power installation 2. Such a large difference is caused by the different sizes of the two installations. The annual power consumption discount can be calculated from the quotient of the power fed into the grid and the micro-power installation discount expressed as a percentage. The value of the discount is determined by the Act of 1 July 2016 on RES. The purchase of energy after the end of the annual discount is calculated by subtracting the difference in annual power consumption in the building from the sum of the annual energy consumption discount and the current annual power consumption. Based on the data in the table above, the value of the refund for the power produced annually is calculated. The calculations are presented in Table 5.
Prior to the installation of a PV micro-installation, the annual power bill was calculated as the quotient of the building’s annual power demand from a given micro-power installation and the sum of the active energy fee and the distribution fee. Annual fixed fees were added to the obtained result, i.e., 47.62 EUR in both examples. The annual power and distribution bill in the first year after the PV installation was launched was calculated using the quotient of the energy purchased after the annual discount has been exhausted, and the sum of the active energy fee and the distribution fee. The savings in the first year are the difference between the annual power bill prior to the launch of the PV installation and the total annual power and distribution bill in the first year after the launch of the PV installation, including the remaining annual charges not covered by the discount system after the launch of the PV installation.
Upon comparing the costs of Micro-power installation 1 and Micro-power installation 2, it can be seen that the annual costs prior to the launch of the PV installation and the remaining fees are identical. The remaining values vary greatly from one installation to the other. This is due to the size of the analyzed micro-power installations. Upon analyzing these data, it is possible to conclude how important it is to select the right PV installation for the building’s energy needs.

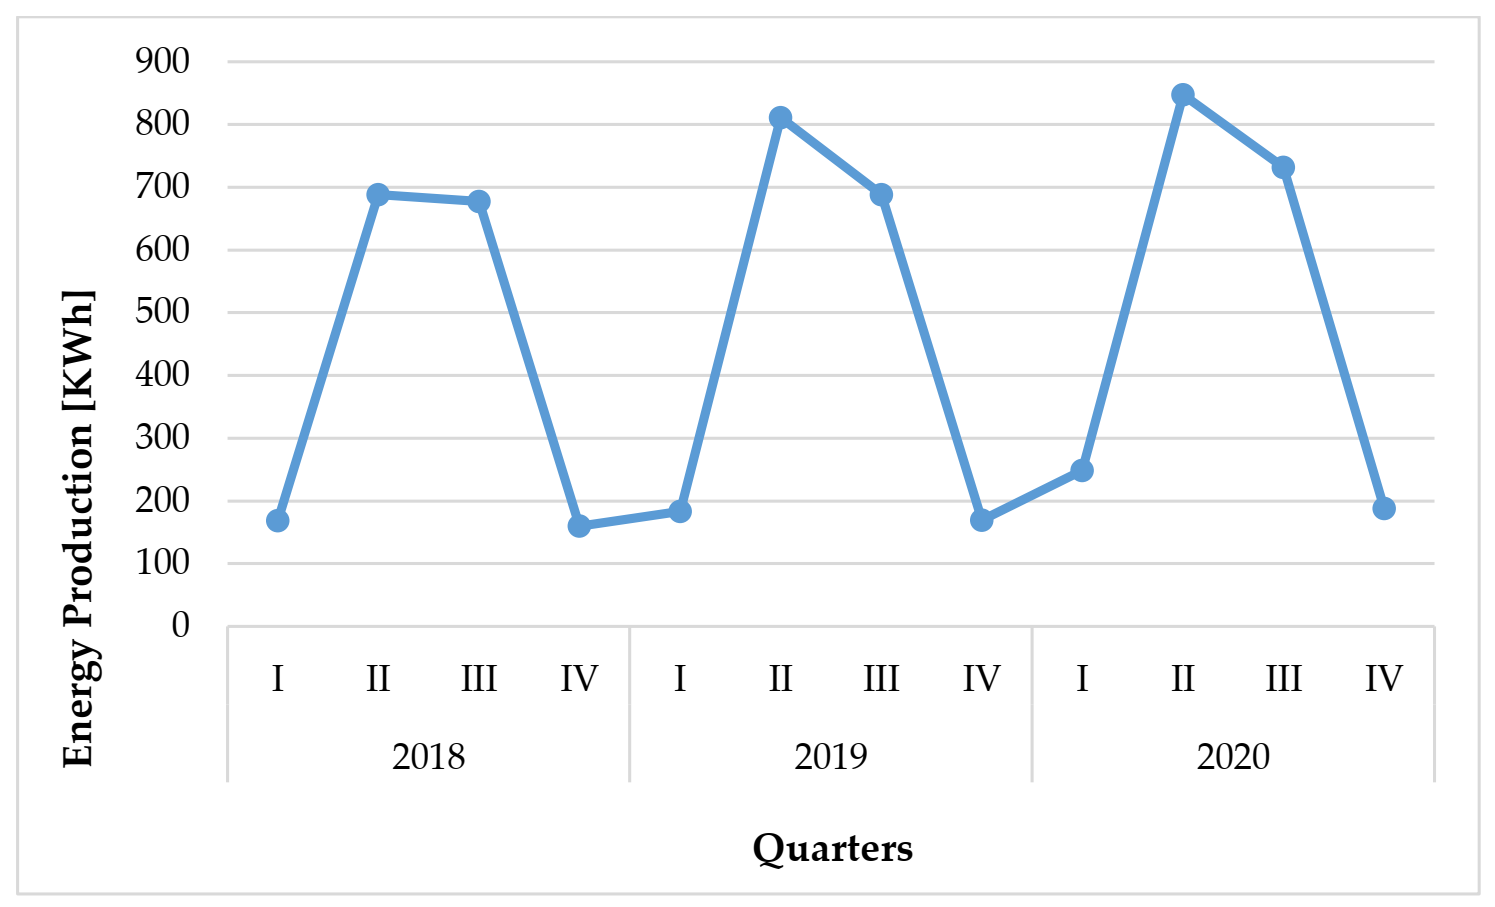
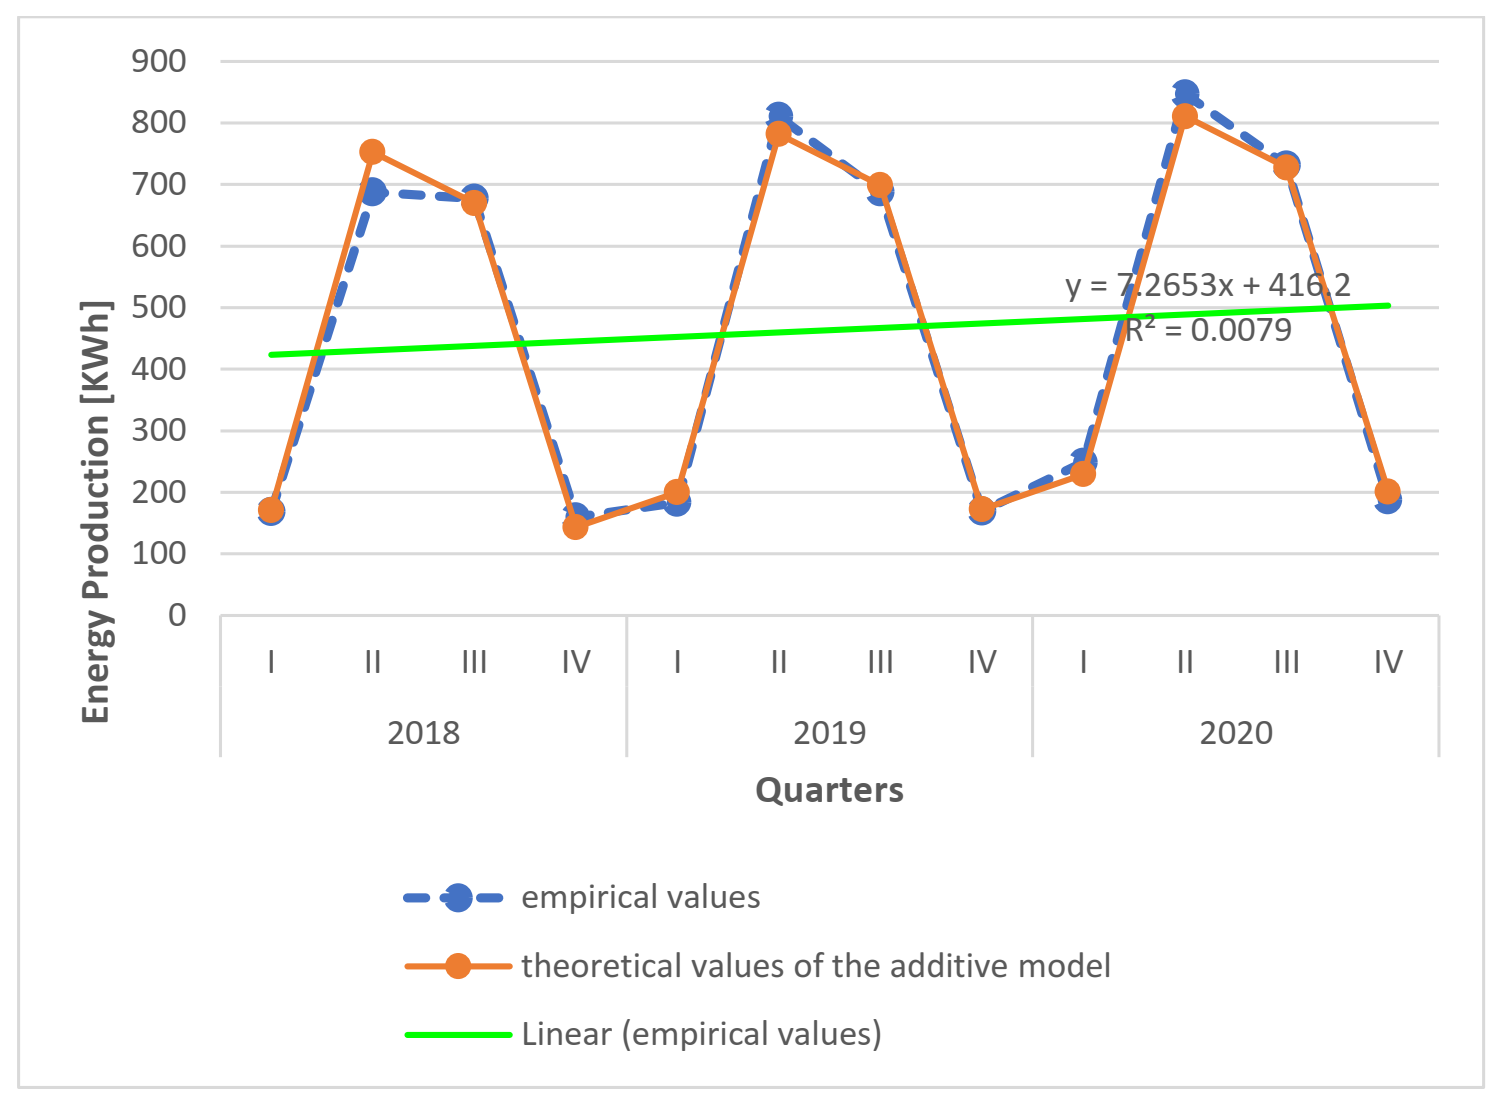
4.2. Forecasting PV Energy Production—A Case Study

The research object was a 5.28 kWp PV installation, which is an exemplary implementation of the PROSUMENT program. The data come from the installation mounted on the roof of a private house in Ostrowiec Świętokrzyski (Świętokrzyskie Province) and includes the amount of energy produced (in kWh) in individual quarters in the last three years, i.e., 2018–2020. Figure 1 presents a graphical illustration of the quarterly production of electricity in the analyzed period.
Figure 1 demonstrates that PV energy production is subject to quarterly seasonal variations, with certain regularities. In the second and third quarters, energy production is significantly higher than in the remaining quarters of the analyzed years. The aim of the analysis was to quantify the magnitude of seasonal variations for the purpose of forecasting, taking these factors into account. Since the fluctuations seem to be constant in individual periods, an additive model of seasonal fluctuations was adopted for further analysis.
In the first stage of the analysis, the time series was unified using the analytical method of matching a linear regression. The parameters of the estimated linear regression demonstrate that in the examined time period, from quarter to quarter, the production of PV energy increased on average by 7.26 KWh. It also showcases that in the quarter preceding the study, i.e., in the fourth quarter of 2017, the studied household theoretically produced 416.2 KWh of electricity.
The next stage of the study consisted of unmatching the time series from the trend to determine the raw seasonality indexes for the quarters. They, in turn, were correlated to obtain the pure seasonality indexes.
Seasonality indexes are periodic fluctuation indexes calculated from the empirical values of a time series and a smoothed series either analytically (trend function) or mechanically (e.g., moving averages). For this purpose, the terms of the empirical series are divided (in a multiplicative model) or subtracted (in an additive model) from the corresponding terms of the smoothed series. The resulting values contain periodic (seasonal) and random fluctuations. Random fluctuations can be eliminated from the seasonality indexes by calculating raw seasonal fluctuation indexes. The raw seasonality indexes determine how much higher or lower the level of the phenomenon is than it would be if there were no cyclical fluctuations and if the development followed a trend.
The sum of the raw seasonality indexes should be equal to the number of adopted phases, e.g., 4 for quarters, 12 for months, etc. (for the multiplicative model), or 0 (for the additive model). It means that seasonality indexes are free from random fluctuations. However, this is rarely the case, and so the raw seasonality indexes must be divided by the appropriate adjustment factor and then adjusted. For the multiplicative model, the adjustment consists of dividing the raw seasonality index by the adjustment factor. For the additive model, the adjustment factor must be subtracted from the raw seasonality index. This will result in pure seasonality indexes.
Unmatching the time series from the trend is:
-
for the multiplicative model: dividing the expressions of the empirical series by the corresponding expressions of the smoothed series;
-
for the additive model: subtracting the expressions of the empirical series from the corresponding expressions of the smoothed series.
The obtained values include period (seasonal) and random fluctuations. The calculated pure seasonality indexes are presented in Figure 2.
As demonstrated in Figure 2, due to the seasonality, the energy production of the studied household in 2018–2020 was on average lower by 252.22 KWh in each of the first quarters. On the other hand, it was higher by 322.22 KWh on average in each of the second quarters, and higher by 231.88 KWh on average in each of the third quarters. In each of the fourth quarters, it was lower by 301.88 KWh on average than the result of the trend function.
In the next stage of the analysis, the corrected theoretical values of the linear trend function for the considered additive model were determined. The theoretical values of the linear trend are adjusted by multiplying the theoretical level of the phenomenon in each period by the appropriate pure seasonality index for that period. In this way, the theoretical level of the phenomenon is obtained, which takes account of seasonal fluctuations. This somewhat improved the match with the empirical data, as presented in Figure 3.
The empirical data were smoothed using the analytical method, i.e., the linear trend function was determined using the least squares method.
Based on such a modified model, future values of PV energy production can be forecast with greater accuracy. For the studied household, a forecast was obtained for the following quarters of the year 2021, as presented in Figure 4.
Please note that due to the insufficient amount of observations, the quality of the obtained model may not be satisfactory. The standard deviation of the residual of the time series model was determined as follows:
S u = t = 1 n y t y ^ t 2 n 2
where:
y t —empirical observations
y ^ t —theoretical observations obtained from the model with seasonality
n—no. of observations
This is evidenced by the value of the standard deviation of the residual component that includes seasonality, which is 27.7 KWh. This means that the actual PV energy production in the studied household differs from the theoretical production based on the time series model by ±27.7 KWh on average.
Next, the average forecast error was calculated:
D y T P   = S u 1 + 1 n + T t ¯ 2 t = 1 n t t ¯ 2
where:
n—no. of observations
S u —standard deviation of residual
y T P —forecast value for the variable y t in time T
The forecasts presented in Figure 4 are also subject to errors, which are respectively:
D y 13 P = 32.7   (error of ± 12.7%);
D y 14 P = 33.9 (error of ± 4%);
D y 15 P = 35.1 (error ± 4.6%);
D y 16 P = 36.5 (error of ± 15.8%).
With fairly high energy production, a forecast error of about 4% is still acceptable for quarters II and III. However, for quarters I and IV, i.e., for the autumn-winter season when PV energy production is much lower than in other seasons, a forecast error of ca. 12–16% can prove problematic.

5. Conclusions

When comparing the costs of the Micro-power installation 1 and the Micro-power installation 2, it can be observed that the annual costs and other charges are initially identical. Other values vary considerably depending on the installation. This is due to their respective size. By analyzing these data, it can be concluded that it is important to choose a micro-power installation that is suitable for the energy needs of a RES-powered building. The analysis of the level of subsidy under the PROSUMENT program demonstrated that in the analyzed period of 2016–2020, the best results were achieved by investments with a capacity of 10 kWp. In terms of the net subsidy value, the best results were obtained in the range between 27.20 and 19.10% of the total investment costs.
The conducted study will be the foundation for further simulation studies of renewable energy subsidies in the Polish economy. All in all, a micro-power installation is one of the ways to move away from dependency on external power suppliers [76]. As a rapidly growing energy sector, it is the best answer to the constant increase in energy fees. Fluctuating fees on the one hand, and standardized legal regulations on the other, encourage a greater concern of the public regarding energy management in their own households. Current subsidy programs supporting renewable micro-power installations in Poland encourage the installation of PV panels. The PROSUMENT program offers a favorable subsidy and cost refund for a PV installation investment. The program is available to natural persons, housing communities and cooperatives, as well as local governments. However, please note that an applicant to the PROSUMENT program must first of all be creditworthy, and to be aware of the additional costs, e.g., 19% income tax, which reduces the level of actual subsidy. In 2016, the reduction level was from 40% to 32.4%, and in the years 2017–2020, from 30% to 24.3%. Please note that the percentage value of the subsidy is not dependent on the size of the installation. Moreover, the credit insurance is an additional expense for the beneficiary. However, the above-mentioned additional costs of the PROSUMENT program cannot diminish the fact that its introduction it is one of the ways to support conscious energy management in Poland and has had a genuine impact on the development of the national PV market.
Connecting a home micro-power installation to the power grid makes one a prosumer—a power consumer of who is also a power producer at the same time. In the current discount system, such people are billed according to the size of their installation. According to the new legislation, owners of installations up to 10 kW are eligible for a 1:0.8 discount, while owners of installations from 10 to 50 kW—for a 1:0.7 discount. This means that an individual supplier, who has a micro-installation up to 10 kW, which sends 1000 kWh to the grid, receives 800 kWh, while the owner of a 10 to 40 kW micro-installation, which sends 1000 kWh, receives 700 kWh. The owner sends the surplus electricity generated by the installation back to the grid and receives it back when the panels are not working, e.g., at night. The surplus electricity from the micro-installation is stored by the national grid.
This solution increases the profitability of PV installations, because the surplus electricity produced in the summer can be used in a period with lower or no production, e.g., in winter or at night. In this way, a PV installation powers the house at all times, all year round. However, each time the prosumer must make a calculation taking into account several variables such as insolation level or location of the facility. In terms of managerial implications, the results of the analysis can prove beneficial for policy makers in developing strategies for the effective promotion of financial instruments supporting prosumer power production in Poland [77,78,79,80,81]. For the “green energy” business to be sustainable, prosumers’ efforts to participate actively in the energy market need to be supported systemically. This requires formulating effective economic, social, and marketing policies and strategies that motivate consumers to be active power producers. Recognizing the value of prosumerism allows Polish policy makers and managers to create policies and strategies that are appropriate for the national market.
At this point, the authors would like to point out the limitations of their research. The presented analysis is an example of a possible operation of installations from the PROSUMENT program. In subsequent research work, the analysis will be broadened and extended by empirical data from the beneficiaries of the PROSUMENT program.

Author Contributions

Conceptualization, J.S., M.N., Z.G.-S., M.S.; methodology, M.K., A.S.-S., Z.G.-S., T.B., M.S., G.M.; software, J.S., M.N.; validation, A.S.-S., Z.G.-S., M.S.; formal analysis, T.B., M.K., J.S.; resources, Z.G.-S., A.S.-S., M.K., T.B., M.S.; writing—original draft preparation, M.N., J.S., M.K., Z.G.-S., A.S.-S., M.S., G.M.; visualization, Z.G.-S., A.S.-S., M.K. All authors have read and agreed to the published version of the manuscript.

Funding

This publication was financed by a subsidy granted to the University of Agriculture in Krakow. This publication was financed by a subsidy granted to the Cracow University of Economics (6/ZZE/2021/POT). The publication was financed by a subsidy for the Faculty of Management of AGH University for the maintenance and development of research potential.

Data Availability Statement

Not applicable.

Conflicts of Interest

The authors declare no conflict of interest.

References

  1. European Commission. Energy Union Package. Communication from the Commission to the European Parliament, the Council, the European Economic and Social Committee, the Commitee of the Regions and the European Investment Bank, A Framework Strategy for a Resilient Energy Union with a Forward-Looking Climate Change Policy; European Commission: Brussels, Belgium, 2015. [Google Scholar]
  2. European Commission. Clean Energy for All Europeans; European Commission: Luxembourg, 2019. [Google Scholar] [CrossRef]
  3. European Commission. Clean energy for All Europeans Package Completed: Good for Consumers, Good for Growth and Jobs, and Good for the Planet; European Commission: Brussels, Belgium, 2019. [Google Scholar]
  4. Available online: https://ec.europa.eu/info/news/clean-energy-all-europeans-package-completed-good-consumers-good-growth-and-jobs-and-good-planet-2019-may-22_en (accessed on 15 May 2021).
  5. Bhatti, M. From consumers to prosumers: Housing for a sustainable future. Hous. Stud. 1993, 8, 98–108. [Google Scholar] [CrossRef]
  6. Brange, L.; Englund, J.; Lauenburg, P. Prosumers in district heating networks—A Swedish case study. Appl. Energy 2016, 164, 492–500. [Google Scholar] [CrossRef]
  7. Butenko, A. User-Centered Innovation in EU Energy Law: Market Access for Electricity Prosumers in the Proposed Electricity Directive. Available online: https://0-www-ogel-org.brum.beds.ac.uk/article.asp?key=3732 (accessed on 15 May 2021).
  8. Wittmayer, J.M.; Avelino, F.; Pel, B.; Camposc, I. Contributing to sustainable and just energy systems? The mainstreaming of renewable energy prosumerism within and across institutional logics. Energy Policy 2020, 112053. [Google Scholar] [CrossRef]
  9. Lavrijssen, S.; Carrillo Parra, A. Radical Prosumer Innovations in the Electricity Sector and the Impact on Prosumer Regulation. Sustainability 2017, 9, 1207. [Google Scholar] [CrossRef] [Green Version]
  10. Toporek, M.; Campos, I.S. Assessment of Existing EU-Wide and Member State-Specific Regulatory and Policy Frameworks of RES Prosumers (Deliverable N°3.1); ClientEarth: Brussels, Belgium, 2019; p. 128. [Google Scholar]
  11. Horstink, L.; Luz, G.P.; Soares, M.; Ng, K. Review and Characterisation of Collective Renewable Energy Prosumer Initiatives; University of Porto: Porto, Portugal, 2019; p. 156. [Google Scholar]
  12. Butenko, A. User-Centered Innovation and Regulatory Framework: Energy Prosumers’ Market. Access in EU Regulation; Social Science Research Network: Rochester, NY, USA, 2016. [Google Scholar]
  13. Parag, Y.; Sovacool, B.K. Electricity market design for the prosumer era. Nat. Energy 2016, 1, 16032. [Google Scholar] [CrossRef]
  14. European Energy Consumers’ Rights. Publications Office of the European Union. 2015. Available online: https://publications.europa.eu/en/publication-detail/-/publication/d2eb27f5-b084-454c-adeb-1a2d7f477f91/language-en/format-PDF/source-102002971 (accessed on 28 June 2021).
  15. Horstink, L.; Wittmayer, J.M.; Ng, K.; Luz, G.P.; Marín-González, E.; Gährs, S.; Campos, I.; Holstenkamp, L.; Oxenaar, S.; Brown, D. Collective Renewable Energy Prosumers and the Promises of the Energy Union: Taking Stock. Energies 2020, 13, 421. [Google Scholar] [CrossRef] [Green Version]
  16. Brown, G.; Hall, S.; Davis, M.E. What is prosumerism for? Exploring the normative dimensions of decentralised energy transitions. Energy Res. Soc. Sci. 2020, 66, 101475. [Google Scholar] [CrossRef]
  17. Riveros, J.Z.; Kubli, M.; Ulli-Beer, S. Prosumer communities as strategic allies for electric utilities: Exploring future decentralization trends in Switzerland. Energy Res. Soc. Sci. 2019, 57, 101219. [Google Scholar] [CrossRef]
  18. Judson, E.; Fitch-Roy, O.; Pownall, T.; Bray, R.; Poulter, H.; Soutar, I.; Lowes, R.; Connor, P.M.; Britton, J.; Woodman, B.; et al. The centre cannot (always) hold: Examining pathways towards energy system decentralisation. Renew. Sustain. Energy Rev. 2020, 118, 109499. [Google Scholar] [CrossRef]
  19. Electricity ‘Prosumers’. Available online: https://www.europarl.europa.eu/RegData/etudes/BRIE/2016/593518/EPRS_BRI(2016)593518_EN.pdf (accessed on 28 June 2021).
  20. Campos, I.; Pontes Luz, G.; Marín-González, E.; Gährs, S.; Hall, S.; Holstenkamp, L. Regulatory challenges and opportunities for collective renewable energy prosumers in the EU. Energy Policy 2019, 138, 111212. [Google Scholar] [CrossRef]
  21. Capellán-Pérez, I.; Campos-Celador, Á.; Terés-Zubiaga, J. Renewable Energy Cooperatives as an instrument towards the energy transition in Spain. Energy Pol. 2018, 123, 215–229. [Google Scholar] [CrossRef]
  22. Yildiz, Ö.; Rommel, J.; Debor, S.; Holstenkamp, L.; Mey, F.; Müller, J.R.; Radtke, J.; Rognli, J. Renewable energy cooperatives as gatekeepers or facilitators? Recent developments in Germany and a multidisciplinary research agenda. Energy Res. Soc. Sci. 2015, 6, 59–73. [Google Scholar] [CrossRef]
  23. PV-Prosumers4Grid. Available online: https://cordis.europa.eu/project/id/764786 (accessed on 28 June 2021).
  24. Prosumers for the Energy Union. Available online: https://proseu.eu/ (accessed on 28 June 2021).
  25. Leal-Arcas, R.; Lesniewska, F.; Proedrou, F. Prosumers as New Energy Actors. In Africa-EU Renewable Energy Research and Innovation Symposium; Mpholo, M., Steuerwald, D., Kukeera, T., Eds.; Springer: Cham, Switzerland, 2018. [Google Scholar]
  26. Becker, S.; Kunze, C.; Vancea, M. Community energy and social entrepreneurship: Addressing purpose, organisation and embeddedness of renewable energy projects. J. Clean. Prod. 2017, 147, 25–36. [Google Scholar] [CrossRef]
  27. Gródek-Szostak, Z.; Suder, M.; Kusa, R.; Szeląg-Sikora, A.; Duda, J.; Niemiec, M. Renewable Energy Promotion Instruments Used by Innovation Brokers in a Technology Transfer Network. Case Study of the Enterprise Europe Network. Energies 2020, 13, 5752. [Google Scholar] [CrossRef]
  28. Hisschemöller, M.; Sioziou, I. Boundary organisations for resource mobilisation: Enhancing citizens’ involvement in the Dutch energy transition. Environ. Pol. 2013, 22, 792–810. [Google Scholar] [CrossRef]
  29. Kalkbrenner, B.J.; Roosen, J. Citizens’ willingness to participate in local renewable energy projects: The role of community and trust in Germany. Energy Res. Soc. Sci. 2016, 13, 60–70. [Google Scholar] [CrossRef]
  30. Toffler, A. The Third Wave; Bantam Books: New York, NY, USA, 1980. [Google Scholar]
  31. Bell, D. The Coming of Post-Industrial Society: A Venture in Social Forecasting; Heinemann: Portsmouth, NH, USA, 1974. [Google Scholar]
  32. Castells, M. The Information age: Economy, Society and Culture; Blackwell: Oxford, UK, 1997; Volume 3, p. 1998. [Google Scholar]
  33. Inderberg, T.H.J.; Tews, K.; Turner, B. Power from the People? Comparing Prosuming Conditions for Germany, the UK and Norway; Fridtjof Nansen Institute: Lysaker, Norway, 2016. [Google Scholar]
  34. Haddadian, G.; Khalili, N.; Khodayar, M.; Shahidehpour, M. Optimal scheduling of distributed battery storage for enhancing the security and the economics of electric power systems with emission constraints. Electr. Pow. Syst. Res. 2015, 124, 152–159. [Google Scholar] [CrossRef]
  35. Giotitsas, C.H.; Pazaitis, A.; Kostakis, V. A peer-to-peer approach to energy production. Technol. Soc. 2015, 42, 28–38. [Google Scholar] [CrossRef]
  36. The Act of February 20, 2015 on Renewable Energy Sources. Unified text L.J. of 2015, Item 478, as Amended (Ustawa z 20 Lutego 2015 r. o Odnawialnych Źródłach Energii). Available online: http://isap.sejm.gov.pl/isap.nsf/DocDetails.xsp?id=wdu20150000478 (accessed on 15 May 2021).
  37. Nawrot, Ł. Renewable energy sources as a new research area in tourism. Poznań Univ. Econ. Rev. 2013, 4, 67–82. [Google Scholar]
  38. Kasperowicz, R.; Pinczyński, M.; Kumar Tiwari, A.; Nawrot, Ł. Reengineering of electricity market monitoring. Econ. Sociol. 2017, 10, 175–188. [Google Scholar] [CrossRef] [Green Version]
  39. Vojtovic, S.; Stundziene, A.; Kontautiene, R. The Impact of Socio-Economic Indicators on Sustainable Consumption of Domestic Electricity in Lithuania. Sustainability 2018, 10, 162. [Google Scholar] [CrossRef] [Green Version]
  40. Tvaronavičienė, M.; Gatautis, R. Peculiarities of income distribution in selected countries. Econ. Sociol. 2017, 10, 113–123. [Google Scholar] [CrossRef] [Green Version]
  41. Act of June 29, 1995 on Public Statistics, Journal of Laws of 2019, Items 649, 730 and 2294 (Dz. U. z 2019 r. poz. 649, 730 i 2294). Available online: http://isap.sejm.gov.pl/isap.nsf/DocDetails.xsp?id=WDU20190000649 (accessed on 15 May 2021).
  42. Cupiał, M.; Szeląg-Sikora, A.; Niemiec, M. Optimisation of the machinery park with the use of OTR-7 software in context of sustainable agriculture. Agric. Agric. Sci. Procedia 2015, 7, 64–69. [Google Scholar] [CrossRef] [Green Version]
  43. Szeląg-Sikora, A.; Niemiec, M.; Sikora, J.; Chowaniak, M. Possibilities of Designating Swards of Grasses and Small-Seed Legumes From Selected Organic Farms in Poland for Feed. In Proceedings of the IX International Scientific Symposium Farm Machinery and Processes Management in Sustainable Agriculture, Lublin, Poland, 22–24 November 2017; pp. 365–370. [Google Scholar]
  44. Kocira, S.; Kuboń, M.; Sporysz, M. Impact of information on organic product packagings on the consumers decision concerning their purchase. In Proceedings of the 17th International Multidisciplinary Scientific GeoConference SGEM, Albena, Bulgaria, 27–29 November 2017; Volume 17, pp. 499–506. [Google Scholar]
  45. Szeląg-Sikora, A.; Sikora, J.; Niemiec, M.; Gródek-Szostak, Z.; Kapusta-Duch, J.; Kuboń, M.; Komorowska, M.; Karcz, J. Impact of Integrated and Conventional Plant Production on Selected Soil Parameters in Carrot Production. Sustainability 2019, 11, 5612. [Google Scholar] [CrossRef] [Green Version]
  46. Schopfer, S.; Tiefenbeck, V.; Staake, T. Economic assessment of photovoltaic battery systems based on household load profiles. Appl. Energy 2018, 223, 229–248. [Google Scholar] [CrossRef]
  47. Müller, J.; Trutnevyte, E. Spatial projections of solar PV installations at subnational level: Accuracy testing of regression models. Appl. Energy 2020, 265, 114747. [Google Scholar] [CrossRef]
  48. Thormeyer, C.; Sasse, J.-P.; Trutnevyte, E. Spatially-explicit models should consider real-world diffusion of renewable electricity: Solar PV example in Switzerland. Renew. Energy 2020, 145, 363–374. [Google Scholar] [CrossRef]
  49. Jurasz, J.; Dąbek, P.B.; Campanab, P.E. Can a city reach energy self-sufficiency by means of rooftop photovoltaics? Case study from Poland. J. Clean. Prod. 2020, 245, 118813. [Google Scholar] [CrossRef]
  50. Ram, M.; Bogdanov, D.; Aghahosseini, A.; Oyewo, A.S.; Gulagi, M.; Child, H.J.; Fell, J.; Breyer, C. Global Energy System Based on 100% Renewable Energy—Power A. Sector; Lappeenranta University of Technology and Energy Watch Group: Lappeenranta, Berlin, 2017. [Google Scholar]
  51. Ram, M.; Bogdanov, D.; Aghahosseini, A.; Gulagi, A.; Oyewo, A.S.; Child, M.; Caldera, U.; Sadovskaia, K.; Farfan, J.; Barbosa, L.; et al. Global Energy System based on 100% Renewable Energy—Power, Heat, Transport and Desalination Sectors; Lappeenranta University of Technology and Energy Watch Group: Lappeenranta, Finland; Berlin, Germany, 2019. [Google Scholar]
  52. Kowalska-Pyzalska, A. An Empirical Analysis of Green Electricity Adoption among Residential Consumers in Poland. Sustainability 2018, 10, 2281. [Google Scholar] [CrossRef] [Green Version]
  53. Gnatowska, R.; Moryń-Kucharczyk, E. Current status of wind energy policy in Poland. Renew. Energy 2019, 135, 232–237. [Google Scholar] [CrossRef]
  54. Bolesta, J.; Rosołek, K.; Więcka, A. Photovoltaic Market in Poland. A Summary of the Year 2013; Instytut Energetyki Odnawialnej: Warsaw, Poland, 2014. [Google Scholar]
  55. Bukowski, M.; Śniegocki, A. Made in Europe. Polityka Przemysłowa Wobec Wyzwań XXI Wieku; Wise Europa: Warsaw, Poland, 2017. [Google Scholar]
  56. Popczyk, J. Prosumer energy and its place in the energy sector. Czysta Energy 2014, 5, 20–24. [Google Scholar]
  57. Power Transmission and Distribution Report for 2015; The Polish Society for Transmission and Distribution of Electricity: Poznan, Poland, 2015; p. 47.
  58. Power Transmission and Distribution Report for 2016; Polish Society for Transmission and Distribution of Electricity: Poznan, Poland, 2016; p. 29.
  59. Instytutu Energetyki Odnawialnej. Rynek Fotowoltaiki w Polsce; Instytutu Energetyki Odnawialnej: Warszawa, Poland, 2019. [Google Scholar]
  60. Resch, G.; Ortner, A.; Welisch, M.; Busch, S.; Liebmann, L.; Totschnig, G. Policy Dialogue on the Assessment and Convergence of RES Policy in EU Member States; Technical Report; DIACORE: Karnataka, India, 2016. [Google Scholar]
  61. IEO, Rynek Fotowoltaiki w Polsce. 2017. Available online: https://www.cire.pl/pliki/2/2017/raportpv_2017_final_18_05_2017.pdf (accessed on 15 May 2021).
  62. Olczak, P.; Kryzia, D.; Matuszewska, D.; Kuta, M. “My Electricity” Program Effectiveness Supporting the Development of PV Installation in Poland. Energies 2021, 14, 231. [Google Scholar] [CrossRef]
  63. Schmidt, O.; Hawkes, A.; Gambhir, A.; Staffell, I. The future cost of electrical energy storage based on experience rates. Nat. Energy 2017, 6, 17110. [Google Scholar] [CrossRef]
  64. Strupeit, L.; Palm, A. Overcoming barriers to renewable energy diffusion: Business models for customer-sited solar photovoltaics in Japan, Germany and the United States. J. Clean. Prod. 2017, 123, 124–136. [Google Scholar] [CrossRef]
  65. Igliński, B.; Iglińska, A.; Cichosz, M.; Kujawski, W.; Buczkowski, R. Renewable energy production in the Łódzkie Voivodeship. The PEST analysis of the RES in the voivodeship and in Poland. Renew. Sustain. Energy Rev. 2016, 58, 737–750. [Google Scholar] [CrossRef]
  66. Stadler, A.; Cardoso, G.; Mashayekh, S.; Forget, T.; De Forest, N.; Agarwal, A.; Schönbein, A. Value streams in microgrids: A literature review. Appl. Energy 2016, 162, 980–989. [Google Scholar] [CrossRef] [Green Version]
  67. Available online: https://zielona-energia.cire.pl/pliki/2/MientusKrzysztof.pdf (accessed on 9 February 2021).
  68. Wiśniewski, G. The role of FiT in the development of prosumer energy (Rola FiT w rozwoju energetyki prosumenckiej). Czysta Energia 2015, 8, 22–26. [Google Scholar]
  69. Available online: nfosigw.gov.pl (accessed on 9 February 2021).
  70. Stowarzyszenie Branży Fotowoltaicznej Polska PV. Available online: https://www.teraz-srodowisko.pl/media/pdf/aktualnosci/2208-Raport-rozwoj-PV.pdf (accessed on 9 February 2021).
  71. Krajowy Plan Rozwoju Mikroinstalacji Odnawialnych Źródeł Energii do Roku 2030. Available online: https://ieo.pl/pl/raporty/53-krajowy-plan-rozwoju-mikroinstalacji-oze-do-roku-2030-ieo-dla-wne/file (accessed on 9 February 2021).
  72. Grębosz-Krawczyk, M.; Zakrzewska-Bielawska, A.; Glinka, B.; Glińska-Neweś, A. Why Do Consumers Choose Photovoltaic Panels? Identification of the Factors Influencing Consumers’ Choice Behavior regarding Photovoltaic Panel Installations. Energies 2021, 14, 2674. [Google Scholar] [CrossRef]
  73. Penc, J. Leksykon Biznesu; Placet: Warsaw, Poland, 1997; pp. 23–24. [Google Scholar]
  74. Młynarski, S. Leksykon Marketingu; PWE: Warsaw, Poland, 1998. [Google Scholar]
  75. Yin, R. Case Study Research: Design and Methods; Sage: Thousand Oaks, CA, USA, 2009. [Google Scholar]
  76. Glaser, B.; Barney, G. The Grounded Theory Perspective: Conceptualization Contrasted with Description; Sociology Press: Mill Valley, CA, USA, 2001. [Google Scholar]
  77. Child, M.; Bogdanov, D.; Aghahosseini, A.; Breyer, C. The role of energy prosumers in the transition of the Finnish energy system towards 100% renewable energy by 2050. Futures 2020, 124, 102644. [Google Scholar] [CrossRef]
  78. Gródek-Szostak, Z.; Suder, M.; Kusa, R.; Sikora, J.; Niemiec, M. Effectiveness of Instruments Supporting Inter-Organizational Cooperation in the RES Market in Europe. Case Study of Enterprise Europe Network. Energies 2020, 13, 6443. [Google Scholar] [CrossRef]
  79. Ponce, P.; Oliveira, C.; Álvarez, V.; del Río-Rama, M.D.L.C. The Liberalization of the Internal Energy Market in the European Union: Evidence of Its Influence on Reducing Environmental Pollution. Energies 2020, 13, 6116. [Google Scholar] [CrossRef]
  80. Chowaniak, M.; Gródek-Szostak, Z.; Kotulewicz-Wisińska, K.; Luc, M.; Suder, M.; Szeląg-Sikora, A. The RES in the Countries of the Commonwealth of Independent States: Potential and Production from 2015 to 2019. Energies 2021, 14, 1856. [Google Scholar] [CrossRef]
  81. Sun, H.; Edziah, B.K.; Song, X.; Kporsu, A.K.; Taghizadeh-Hesary, F. Estimating Persistent and Transient Energy Efficiency in Belt and Road Countries: A Stochastic Frontier Analysis. Energies 2020, 13, 3837. [Google Scholar] [CrossRef]
Figure 1. Quarterly PV energy production from 2018 to 2020 of a private house in Ostrowiec Świętokrzyski.
Energies 14 04233 g001
Figure 2. Seasonality indexes—PV energy production in a private house located in Ostrowiec Świętokrzyski in the years 2018–2020.
Energies 14 04233 g002
Figure 3. Quarterly PV energy production in a private house located in Ostrowiec Świetokrzyski in the years 2018–2020 (empirical series, analytically unified series, and the series of theoretical values of the additive model).
Energies 14 04233 g003
Figure 4. Quarterly forecast of PV energy production in 2021 for a private house located in Ostrowiec Świętokrzyski.
Energies 14 04233 g004
Table 1. Comparison of economic assumptions for Micro-power installation 1 and Micro-power installation 2.
ParameterMicro-Power Installation 1Micro-Power Installation 2
ValueUnitValueUnit
Capacity of the micro-power installation9kWp15kWp
Amount of power produced by 1kWp per year1052kWh1052kWh
Active energy fee (gross)0.08EUR/kWh0.08EUR/kWh
Distribution fee (gross)0.06EUR/kWh0.06EUR/kWh
Annual fixed fees47.62EUR/year47.62EUR/year
Building’s annual power demand for the power from PV installations15,000kWh15,000kWh
Current energy consumption60%60%
Discount in the micro-power installation80%70%
kWh—unit of work, energy, and heat; the amount of energy that a 1000 W (1kW) device consumes within 1 h. kWp—kW peak, peak capacity, maximum capacity.
Table 2. A comparison of the costs of launching 3, 5, 8, and 10 kWp capacity installations within the PROSUMER 2016 project.
PROSUMER 2016
Installation Size3 kWp5 kWp8 kWp10 kWp
Eligible costs (EUR)5000.008333.3311,428.5714,285.71
100.00%100.00%100.00%100.00%
Gross subsidy20003333.334571.435714.29
40%40%40%40%
19% income tax380633.33868.571085.71
7.60%7.60%7.60%7.60%
Project cost200200205.71200
4%2.40%1.80%1.40%
Documentation for the bank100108.33102.86114.29
2.%1.30%0.90%0.80%
Bank’s commission150250342.86428.57
3%3%3%3%
Net subsidy11702141.673051.433885.71
23.40%25.70%26.70%27.20%
Table 3. A comparison of the costs of launching 3, 5, 8, and 10 kWp capacity installations within the PROSUMER 2017–2020 project.
PROSUMER 2017–2020
Installation Size3 kWp5 kWp 8 kWp 10 kWp
Eligible costs (EUR)21,00035,00048,00060,000
100.00%100.00%100.00%100.00%
Gross subsidy630010,50014,40018,000
30%30%30%30%
19% income tax1197199527363420
5.70%5.70%5.70%5.70%
Project cost840840864840
4.00%2.40%1.80%1.40%
Documentation for the bank420455432480
2%1.30%0.90%0.80%
Bank’s commission630105014401800
3.00%3.00%3.00%3.00%
Net subsidy32136160892811,460
15.30%17.60%18.60%19.10%
Table 4. Datasheet for Micro-power installation 1 and 2.
Micro-Power Installation 1Micro-Power Installation 2
Discount 1 to 0.8Discount 1 to 0.7
NameEnergy kWhEnergy kWh
Energy consumption in the building/year15,00015,000
Energy production by the PV system/year946815,780
Current energy consumption/year90009000
Energy returned to the grid/year4686780
Discount for energy return/year3744746
Energy purchase after the discount has expired/year56261254
Table 5. Calculations of the reimbursement value for energy spent within one year.
Costs
Micro-Power Installation 1 Discount from 1 to 0.8Micro-Power Installation 2 Discount from 1 to 0.7
NameQuantity
EUR
Quantity
EUR
Annual power bill prior to installation of the PV micro-power installation 2226.192226.19
Annual energy and distribution bill in the first year after installation of the PV micro-power installation817.14182.14
Other annual charges not covered by the discount system after the assembly of the PV micro-power installation47.6247.62
Savings in the first year1361.431996.43
Source: Authors ‘own study.
Publisher’s Note: MDPI stays neutral with regard to jurisdictional claims in published maps and institutional affiliations.

