
Estimation of Carbon Footprint of Residential Building in Warm Humid Climate of India through BIM

 , ,
, ,  , and
, and 
Abstract
:1. Introduction
1.1. Background
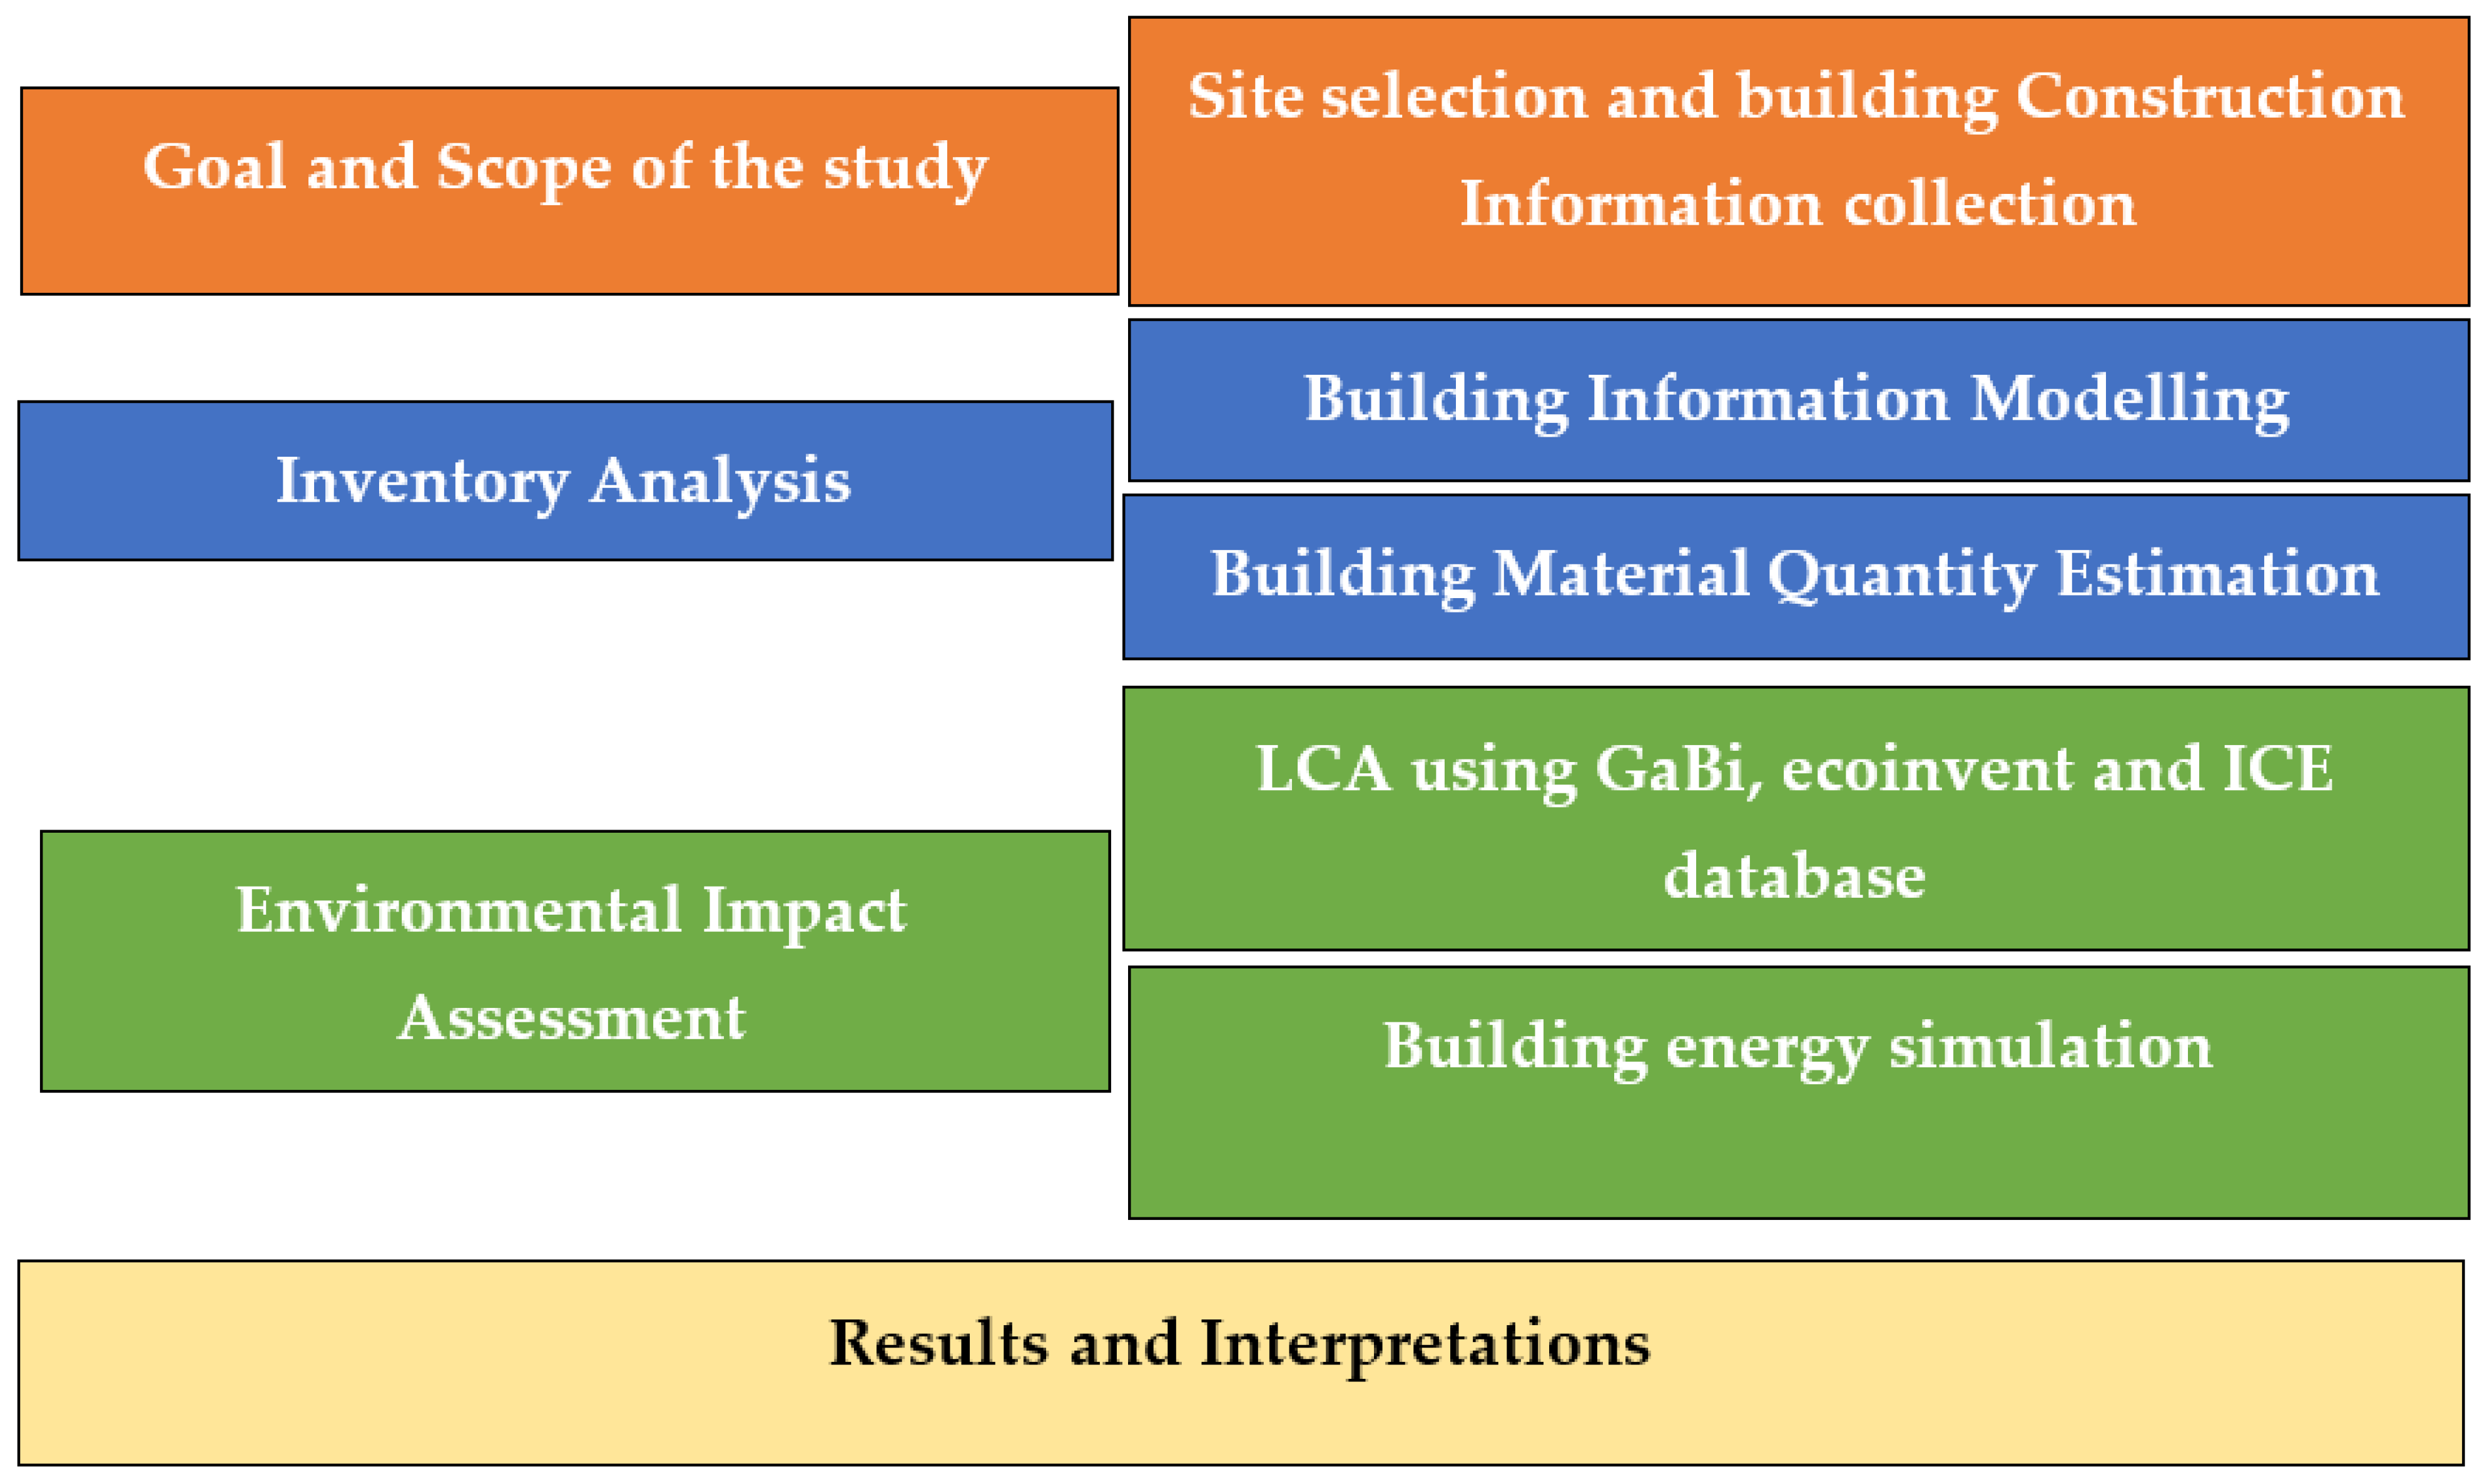
- Scope definition and objective;
- Analysis of inventory;
- Environmental impact assessment;
- Results and interpretations.
1.2. Motivation
2. Review of Literature
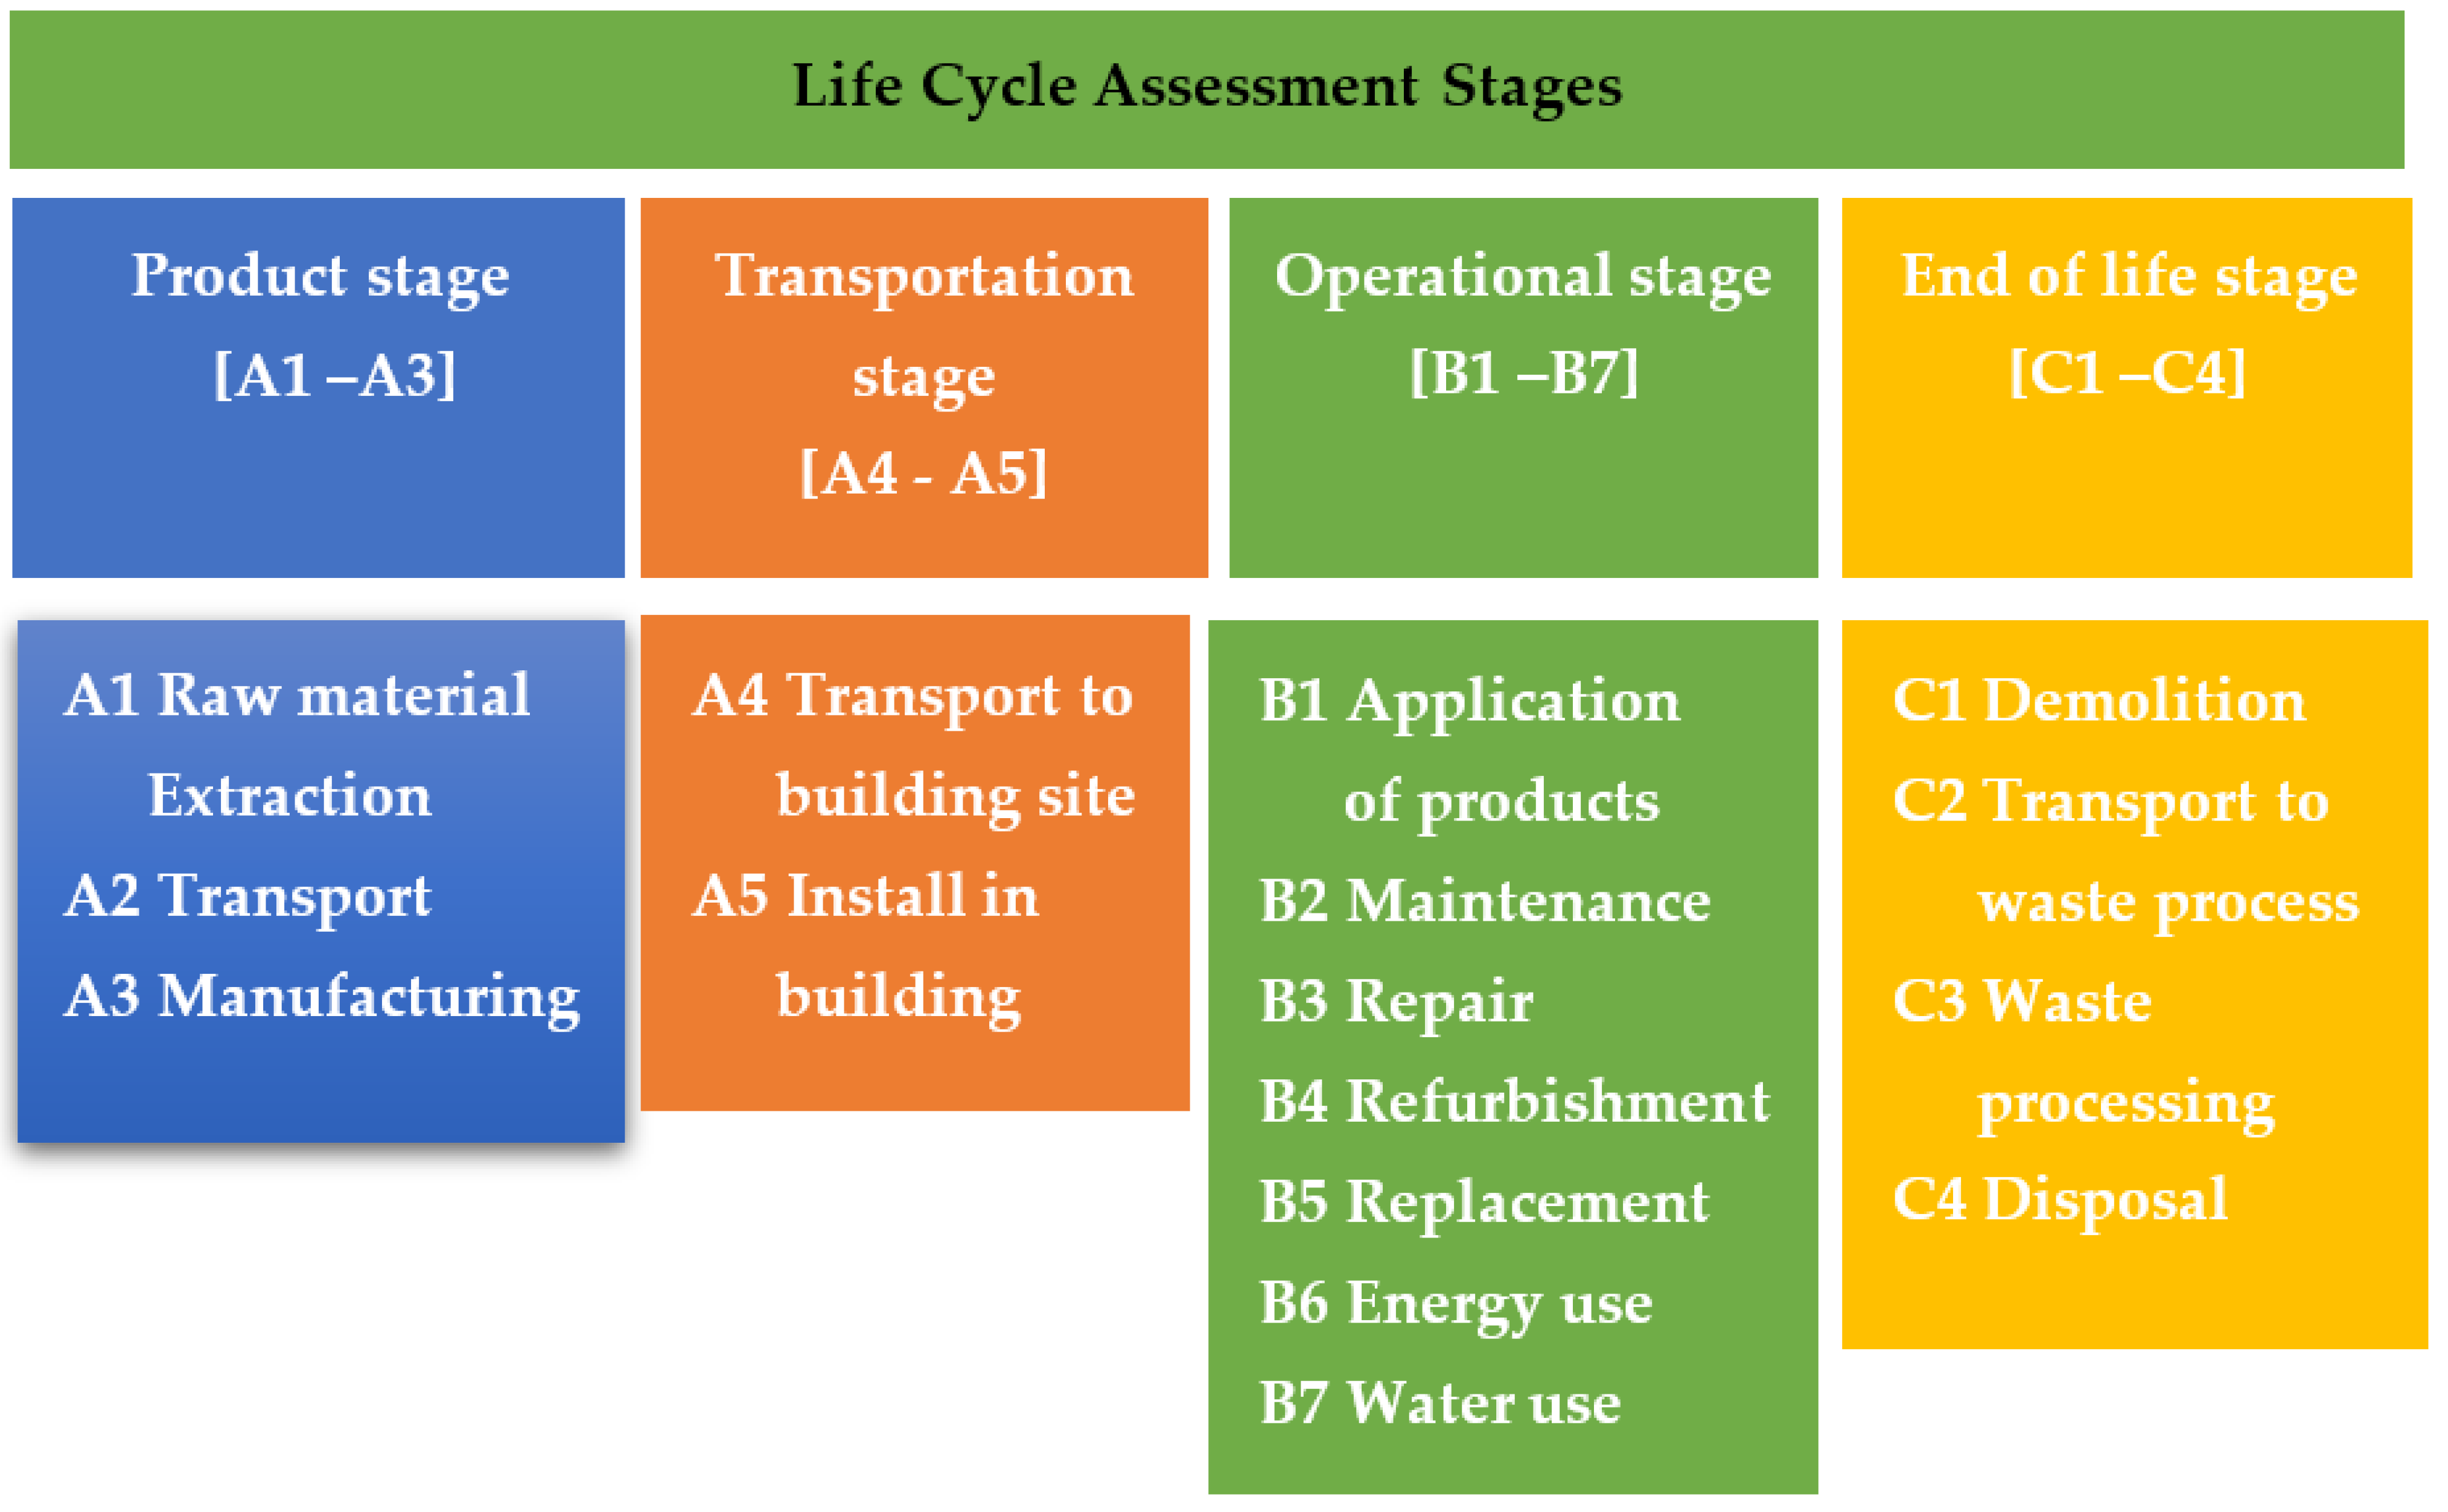
2.1. LCA Phases and Building Application
2.2. LCA Databases
2.3. LCA of Construction Materials
2.4. BIM-LCA Integration
2.5. Research Gap
- Evaluation of carbon emissions with four main contributing construction materials.
- Evaluation of carbon emissions at every stage of the building life cycle with different databases using soft tools interconnected with BIM and with manual calculations.
- Comparing the results of BIM-LCA and manual computations for conventional RCC residential buildings constructed in warm and humid climatic condition of India with a different lifecycle inventory database.
3. Methodologies
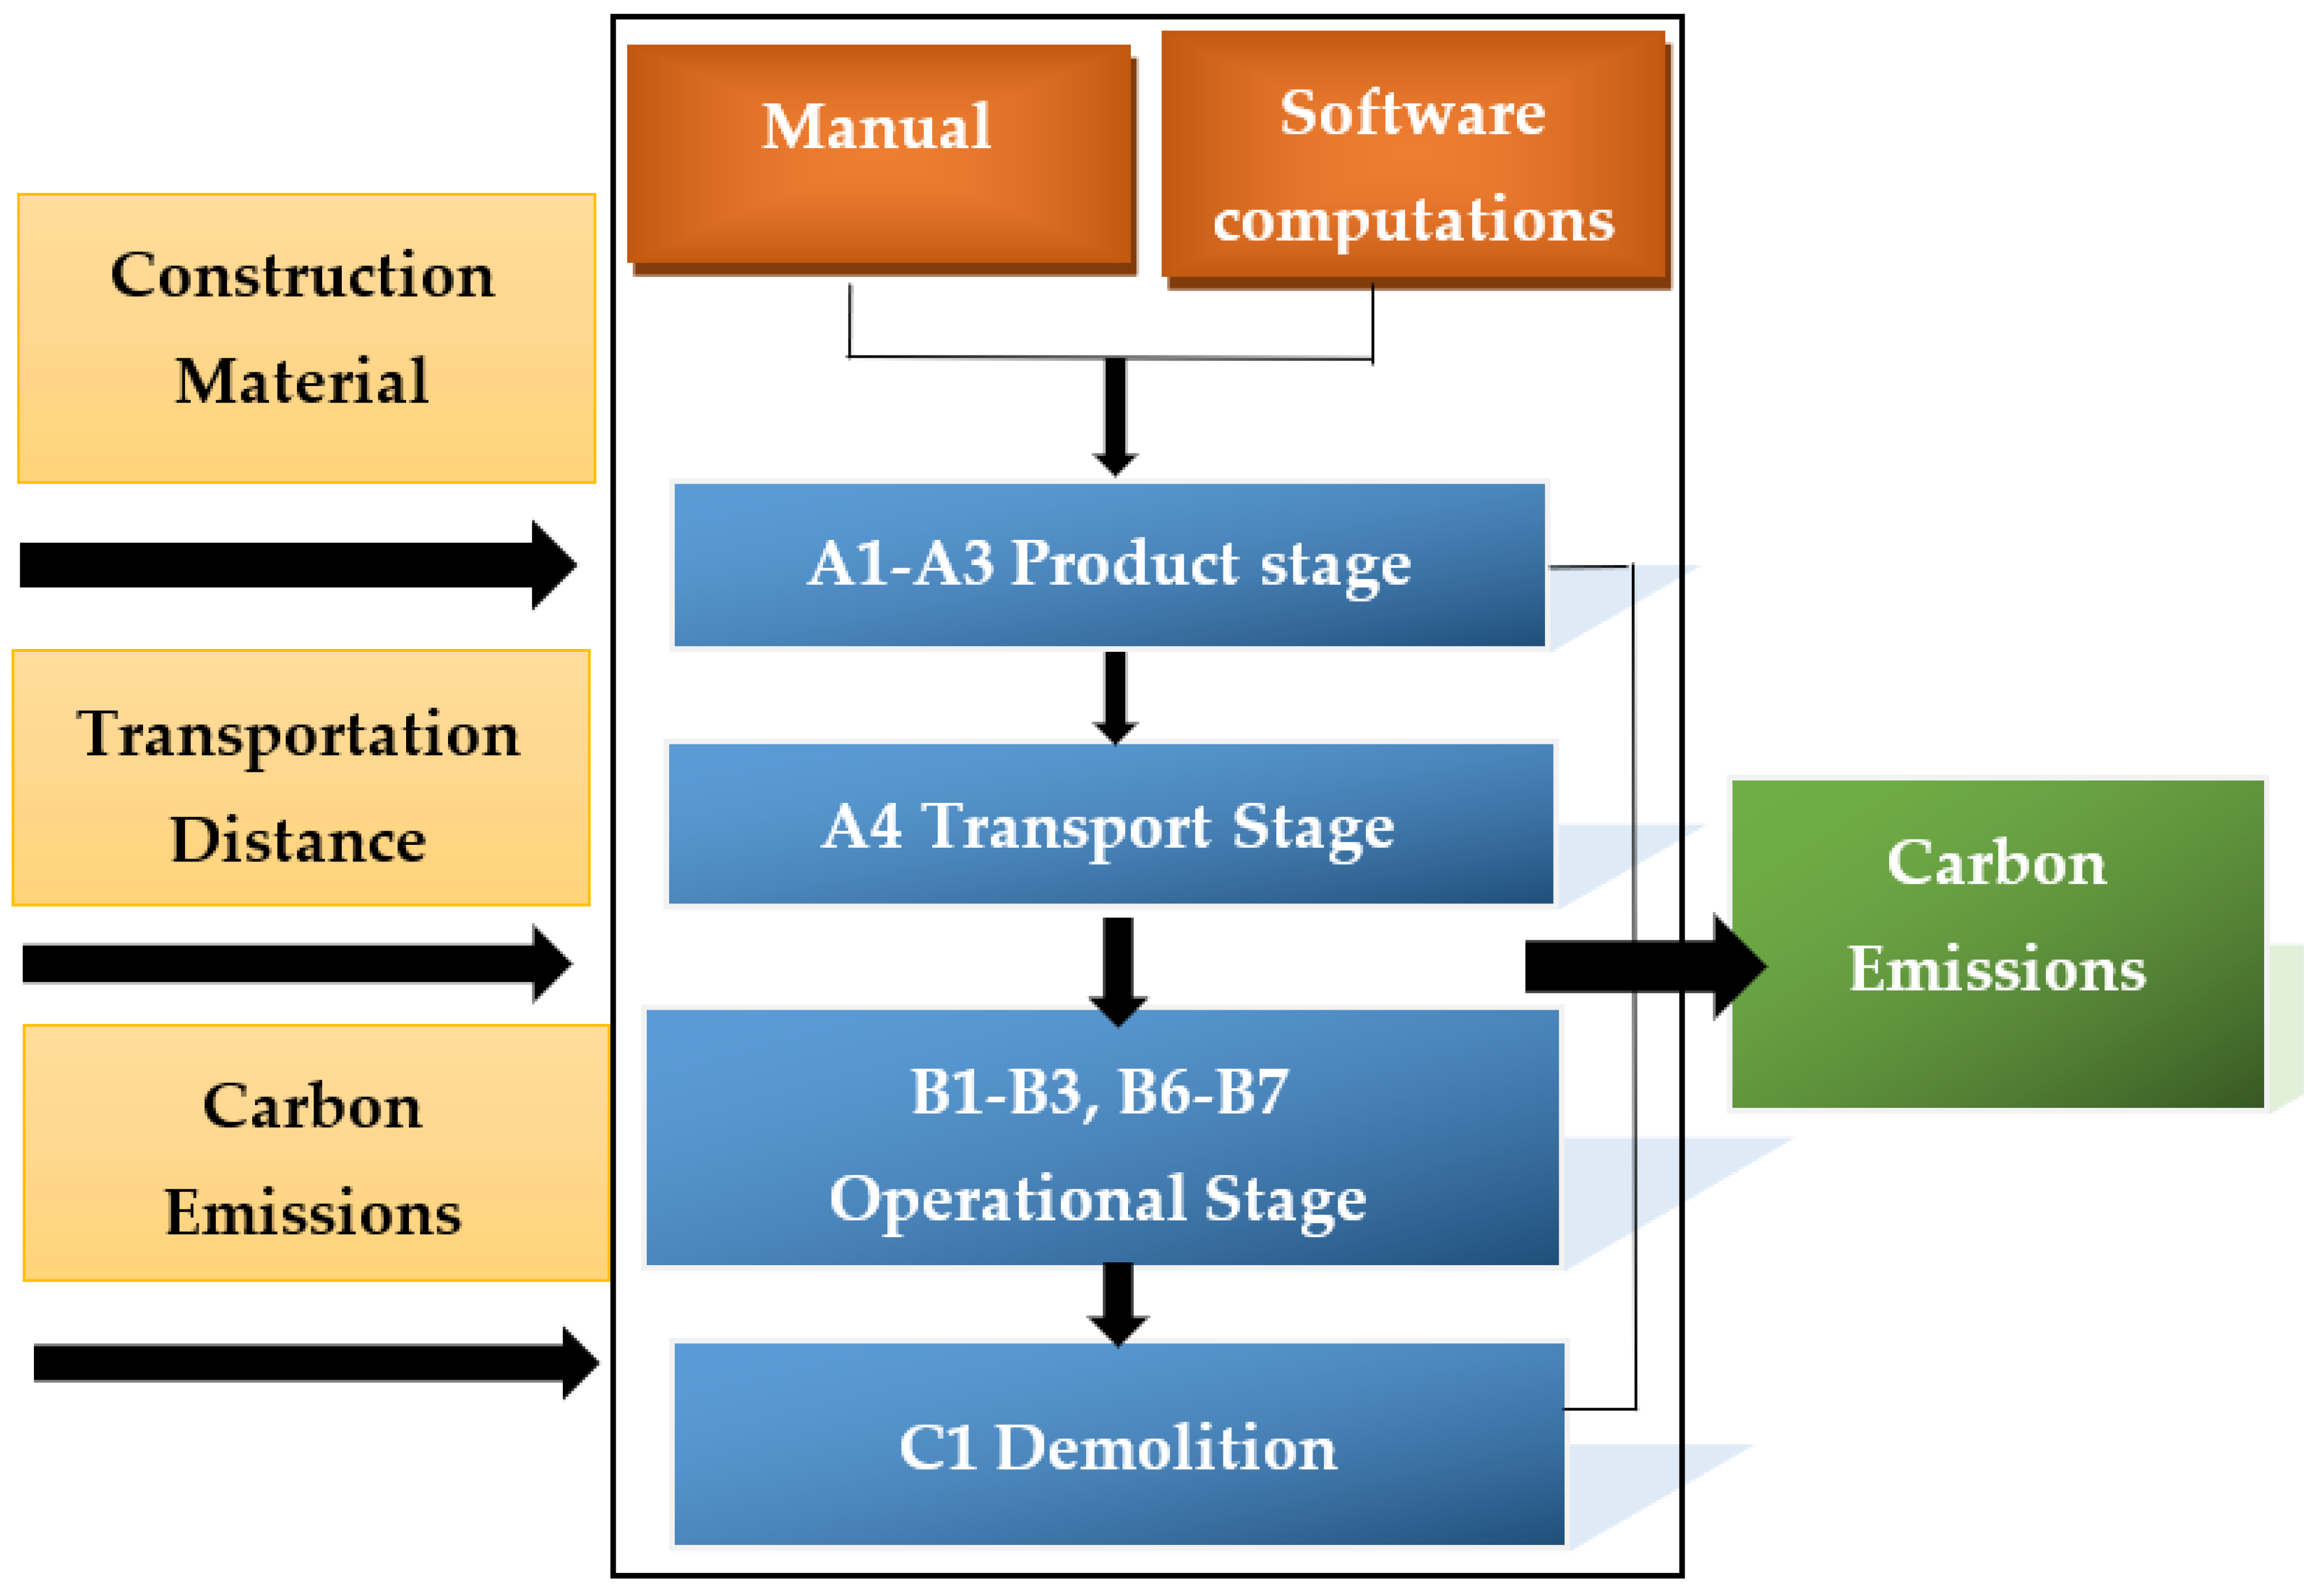
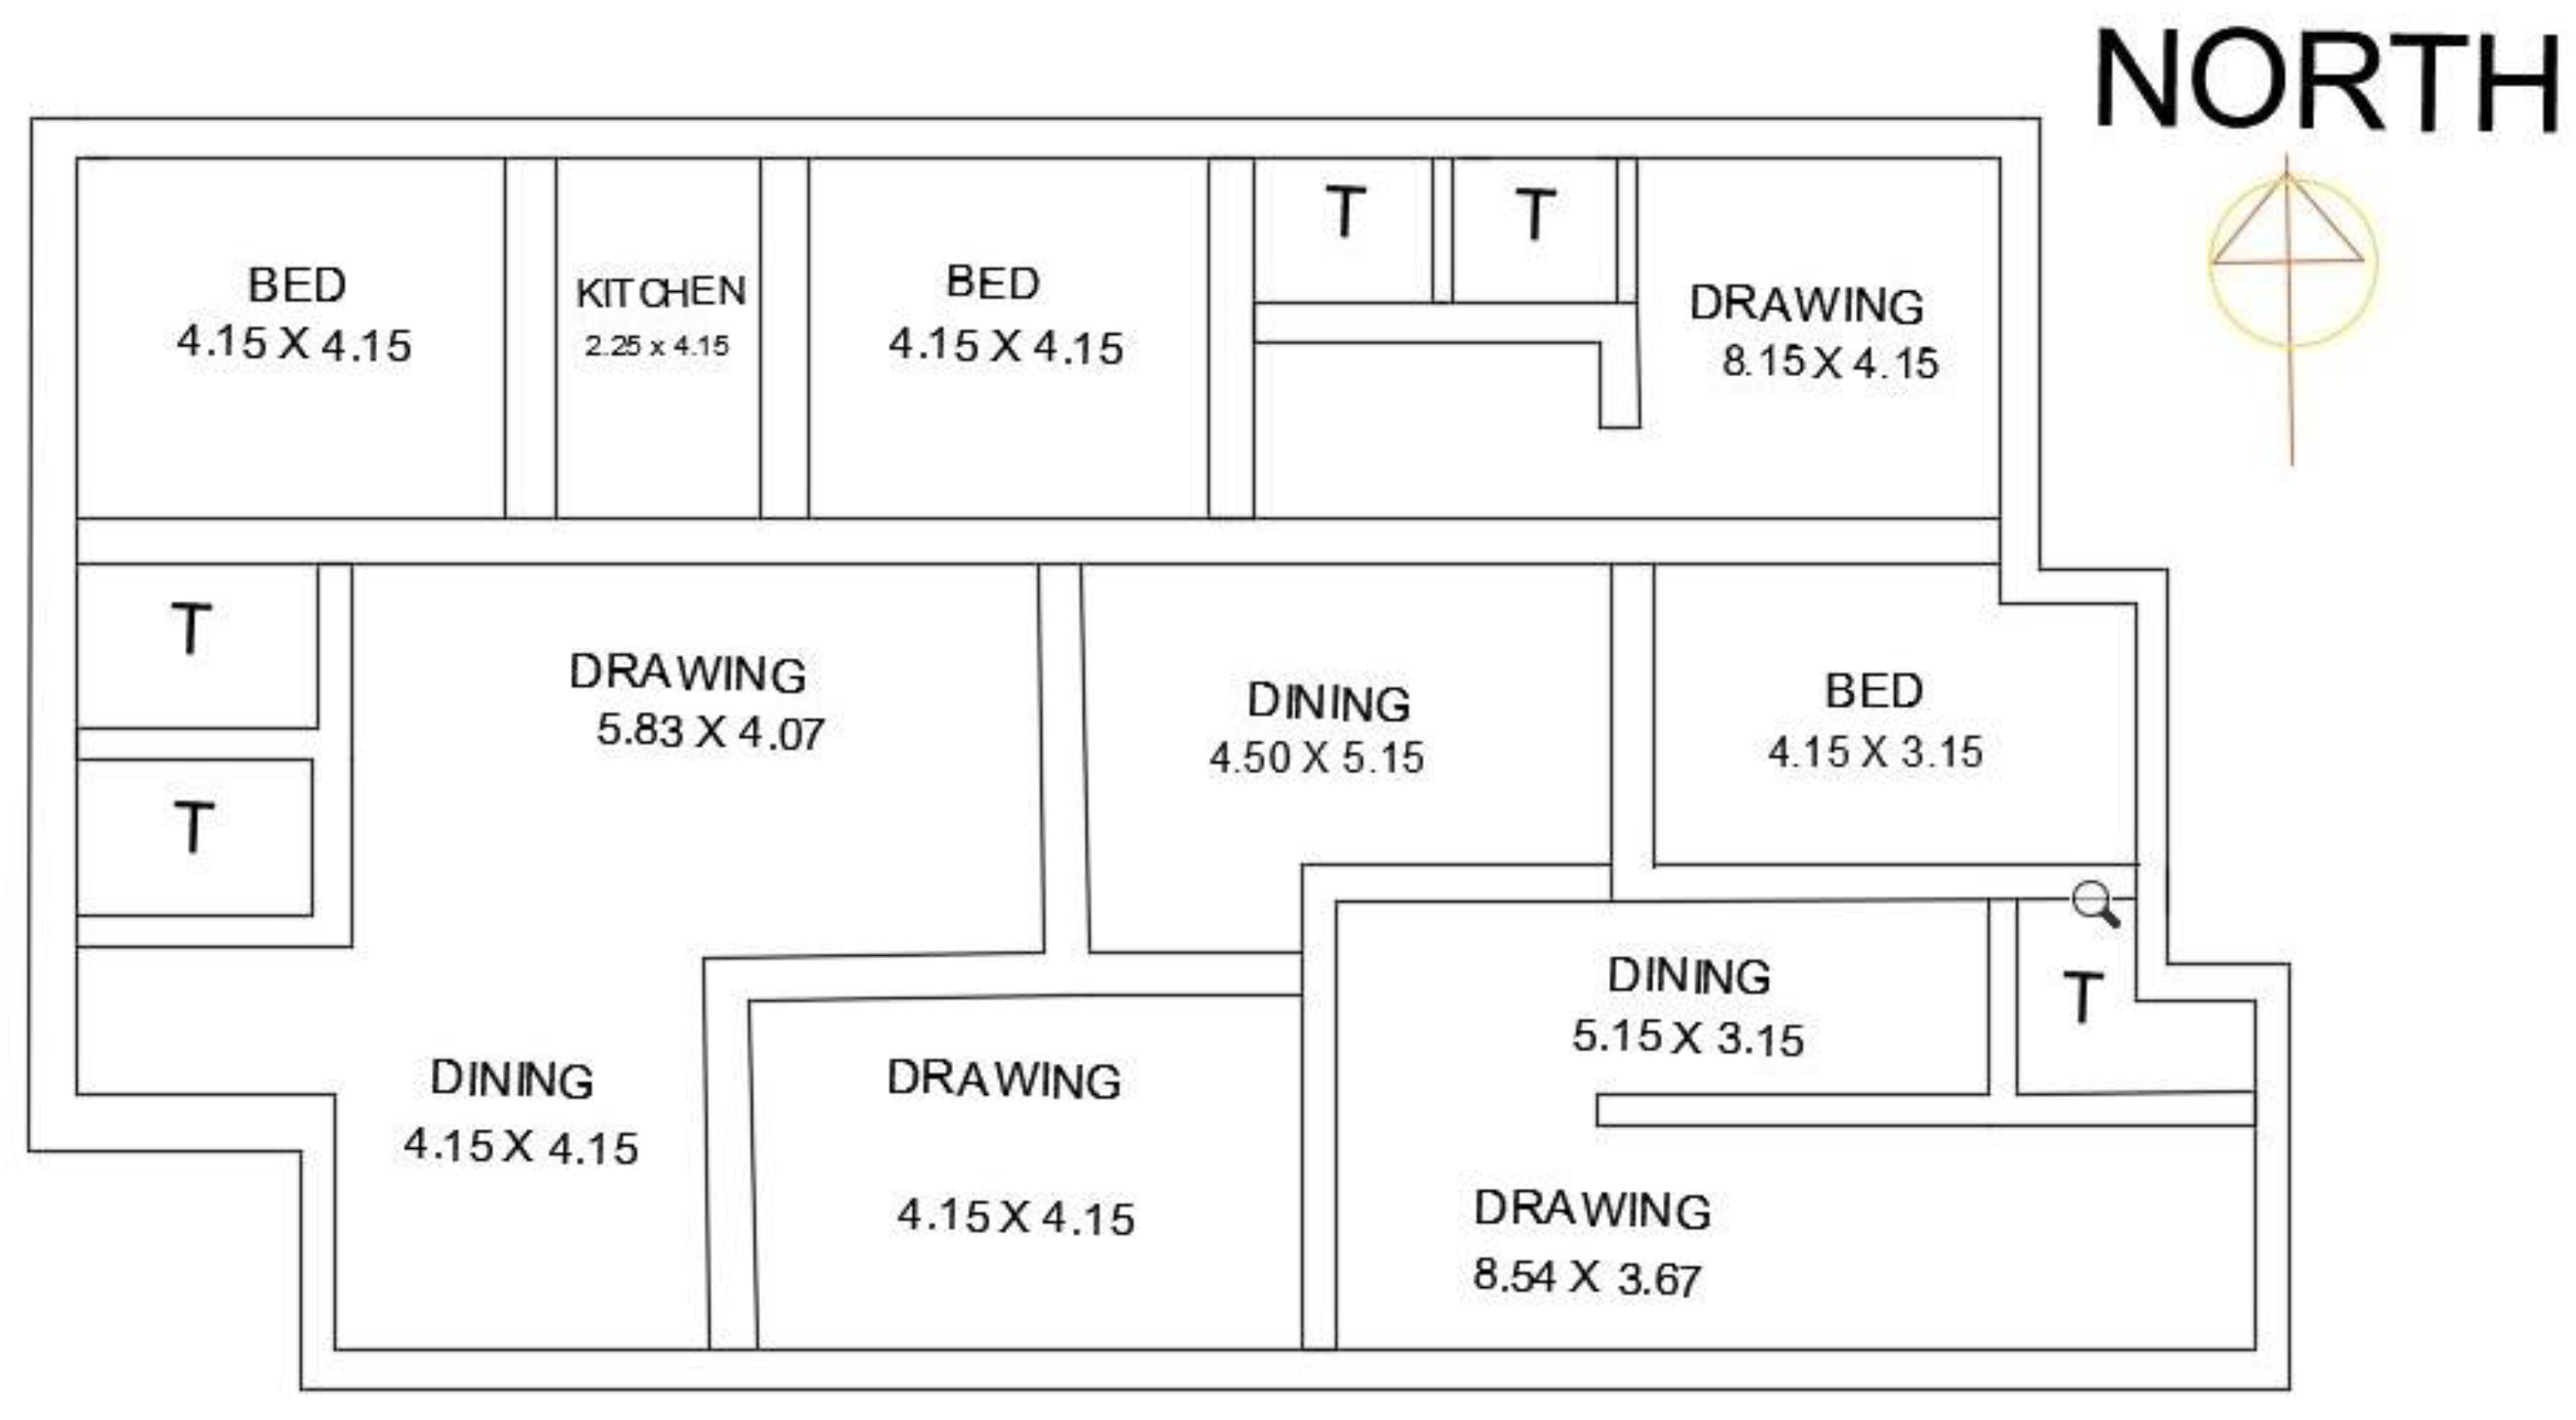
3.1. System Boundaries and Functional Unit
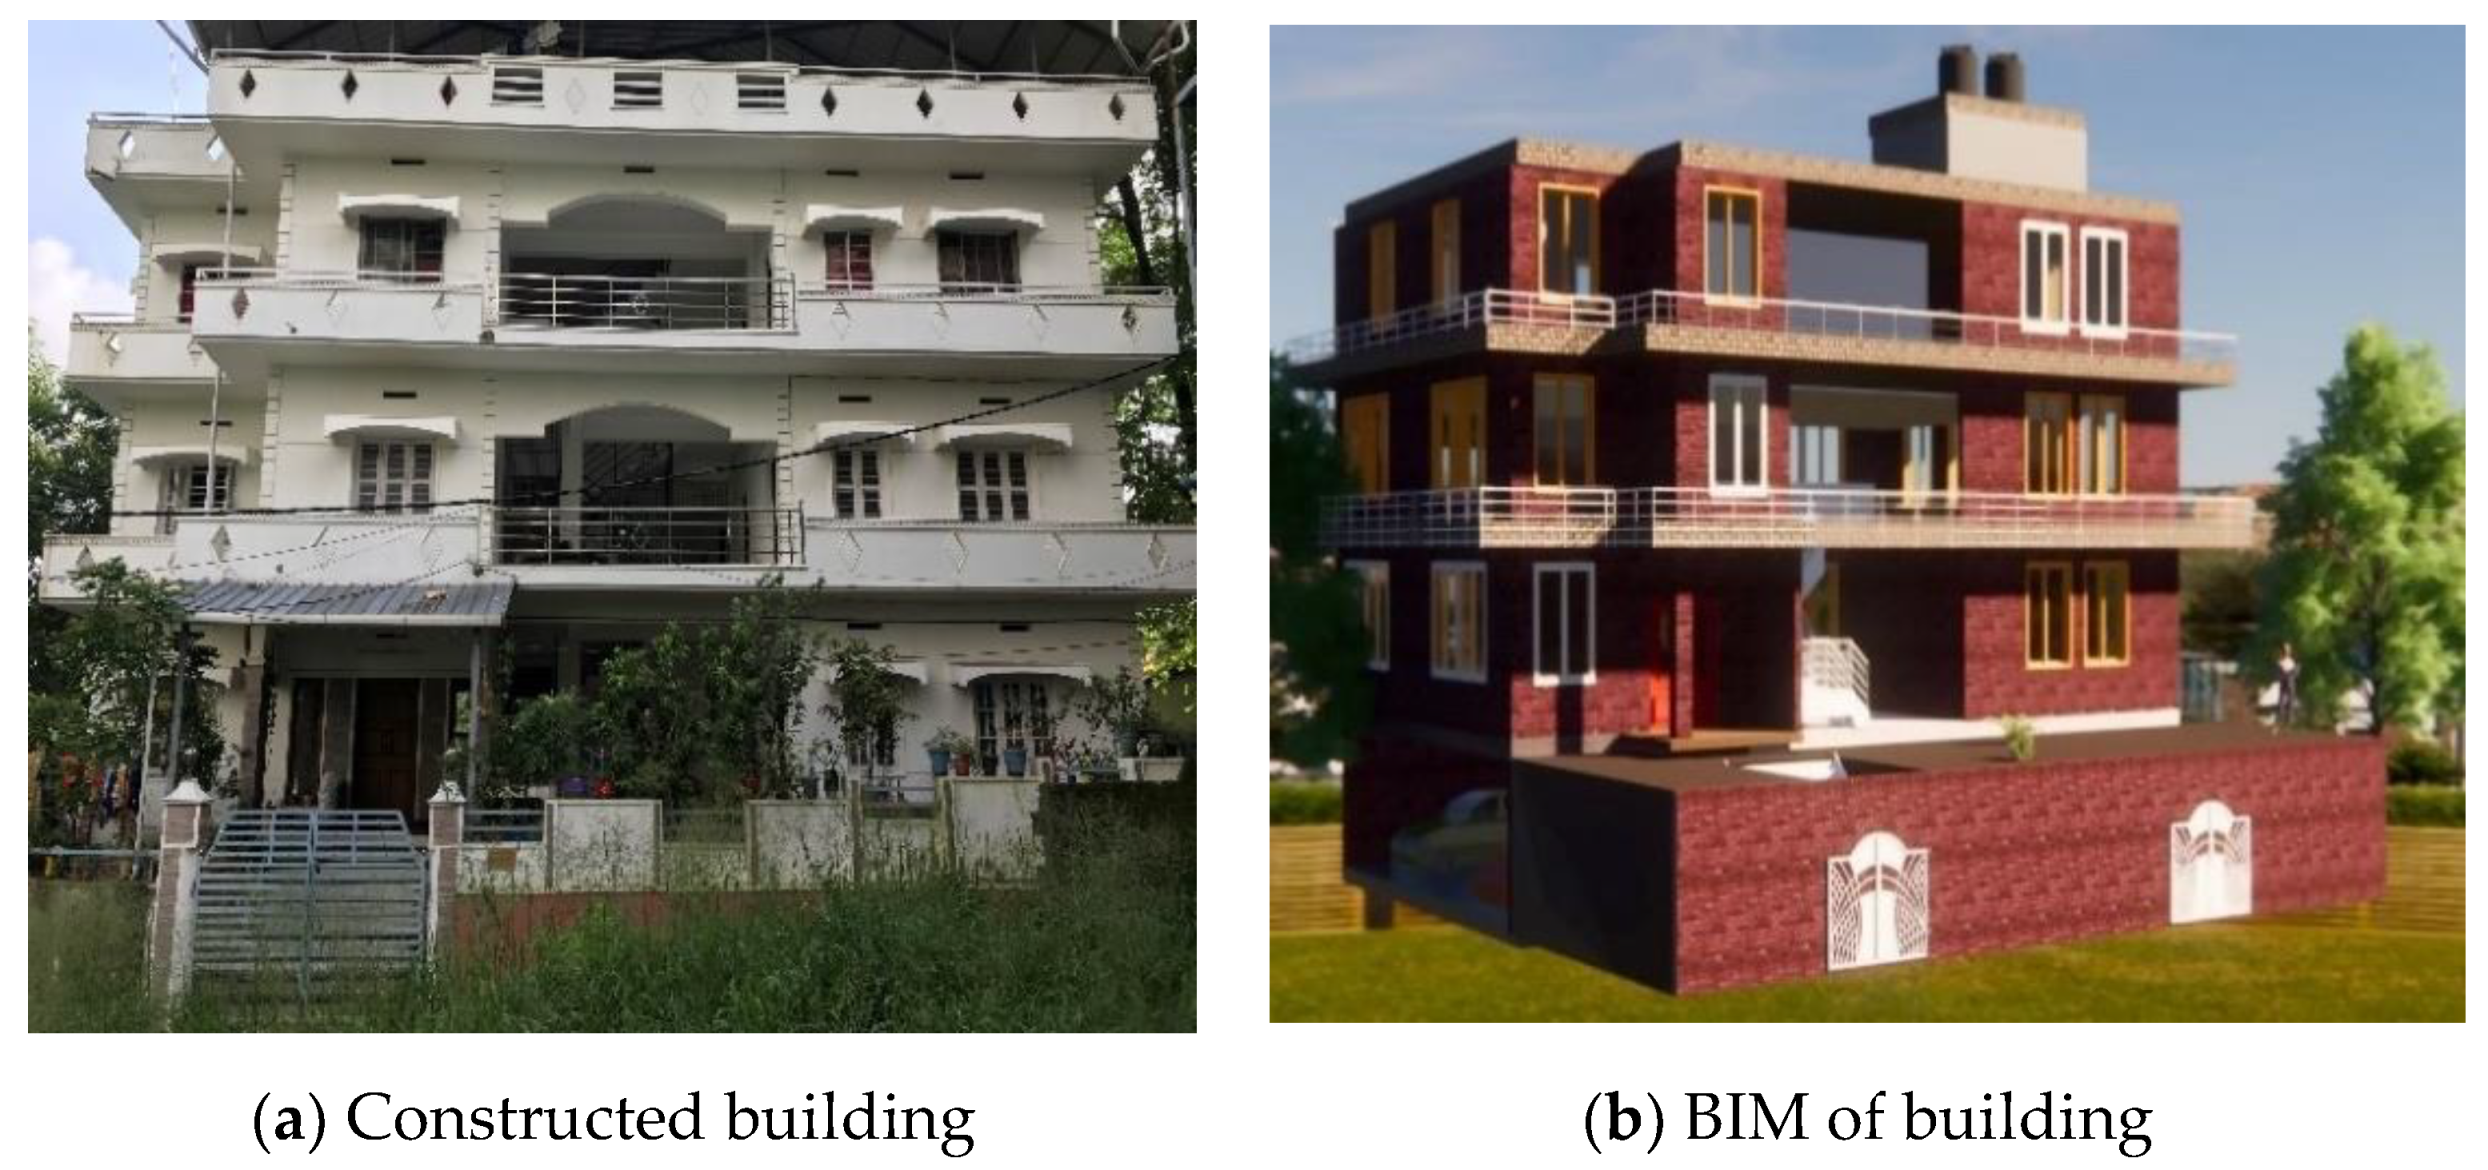
3.2. Building Information Modelling
3.3. Life-Cycle Database and Assessment of Building
3.4. Calculation of Life Cycle Assessment
3.4.1. Construction Stage
3.4.2. Transportation Stage
3.4.3. Operational Stage
3.4.4. Destruction Stage
3.5. LCA Through Manual Calcluations
3.6. LCA Using Software
4. Results of Carbon Emissions
4.1. LCA Results for Manual Computations
4.1.1. Construction Stage
4.1.2. Transportation Stage
4.1.3. Operational Stage
4.1.4. Destruction Stage
4.1.5. Total Carbon Emissions
4.2. Life Cycle Assessment Results for Software Tools
5. Conclusions
Author Contributions
Funding
Institutional Review Board Statement
Informed Consent Statement
Conflicts of Interest
References
- Wu, H.J.; Yuan, Z.W.; Zhang, L.; Bi, J. Life cycle energy consumption and CO2 emission of an office building in China. Int. J. Life Cycle Assess. 2012, 17, 105–118. [Google Scholar] [CrossRef]
- Lu, K.; Jiang, X.; Tam, V.W.Y.; Li, M.; Wang, H.; Xia, B.; Chen, Q. Development of a carbon emissions analysis framework using building information modeling and life cycle assessment for the construction of hospital projects. Sustainability 2019, 11, 6274. [Google Scholar] [CrossRef] [Green Version]
- Hollberg, A.; Genova, G.; Habert, G. Evaluation of BIM-based LCA results for building design. Autom. Constr. 2021, 109, 102972. [Google Scholar] [CrossRef]
- Peng, C.; Wu, X. Case study of carbon emissions from a building’s life cycle based on BIM and Ecotect. Adv. Mater. Sci. Eng. 2015, 2015, 1–15. [Google Scholar] [CrossRef] [Green Version]
- Chau, C.K.; Leung, T.M.; Ng, W.Y. A review on life cycle assessment, life cycle energy assessment and life cycle carbon emissions assessment on buildings. Appl. Energy 2015, 143, 395–413. [Google Scholar] [CrossRef]
- Jayasinghe, A.; Orr, J.; Ibell, T.; Boshoff, W.P. Minimizing Embodied Carbon in Reinforced Concrete Beams. Eng. Struct 2021, 242, 112590. [Google Scholar] [CrossRef]
- International Energy Agency. Net Zero by 2050: A Roadmap for the Global Energy Sector. OECD. 2021. Available online: https://www.iea.org/reports/net-zero-by-2050. (accessed on 1 July 2021).
- Brent, A.C.; Petrick, W. Environmental impact assessment during project execution phases: Towards a stage-gate project management model for the raw materials processing industry of the energy sector. Impact Assess. Proj. Apprais. 2007, 25, 111–122. [Google Scholar] [CrossRef]
- Life Cycle Assessment Best Practices of International Organization for Standardization ISO 14040 Ser. Available online: https://www.apec.org/Publications/2004/02/Life-Cycle-Assessment-Best-Practices-of-International-Organization-for-Standardization-ISO-14040-Ser (accessed on 4 July 2021).
- Yalcinkaya, M.; Singh, V. Patterns and trends in Building Information Modeling (BIM) research: A Latent Semantic Analysis. Autom. Constr. 2015, 59, 68–80. [Google Scholar] [CrossRef]
- Hu, M. Building impact assessment—A combined life cycle assessment and multi-criteria decision analysis framework. Resour. Conserv. Recycl. 2019, 150, 104410. [Google Scholar] [CrossRef]
- Cheng, B.; Li, J.; Tam, V.W.Y.; Yang, M.; Chen, D. A BIM-LCA approach for estimating the greenhouse gas emissions of large-scale public buildings: A case study. Sustainability 2021, 12, 685. [Google Scholar] [CrossRef] [Green Version]
- Xu, X.; Mumford, T.; Zou, P.X.W. Life-cycle building information modelling (BIM) engaged framework for improving building energy performance. Energy Build. 2021, 231, 110496. [Google Scholar] [CrossRef]
- Pauer, E.; Wohner, B.; Tacker, M. The Influence of Database Selection on Environmental Impact Results. Life Cycle Assessment of Packaging Using GaBi, Ecoinvent 3.6, and the Environmental Footprint Database. Sustainability 2020, 12, 9948. [Google Scholar] [CrossRef]
- Emami, N.; Heinonen, J.; Marteinsson, B.; Säynäjoki, A.; Junnonen, J.-M.; Laine, J.; Junnila, S. A life cycle assessment of two residential buildings using two different LCA database-software combinations: Recognizing uniformities and inconsistencies. Buildings 2019, 9, 20. [Google Scholar] [CrossRef] [Green Version]
- Analyses of the Life Cycles and Social Costs of CO2 Emissions of Sin-gle-Family Residential Buildings: A Case Study in Poland. Sustainability 2021, 13, 6164. [CrossRef]
- Khasreen, M.; Banfill, P.F.; Menzies, G. Life-cycle assessment and the environmental impact of buildings: A review. Sustainability 2009, 1, 674–701. [Google Scholar] [CrossRef]
- Nwodo, M.N.; Anumba, C.J. A review of life cycle assessment of buildings using a systematic approach. Build. Environ. 2019, 162, 106290. [Google Scholar] [CrossRef]
- Asif, M.; Muneer, T.; Kelley, R. Life cycle assessment: A case study of a dwelling home in Scotland. Build. Environ. 2007, 42, 1391–1394. [Google Scholar] [CrossRef]
- Flower, D.J.M.; Sanjayan, J.G. Green house gas emissions due to concrete manufacture. Int. J. Life Cycle Assess. 2007, 12, 282–288. [Google Scholar] [CrossRef]
- Junnila, S.; Horvath, A. Life-cycle environmental effects of an office building. J. Infrastruct. Syst. 2003, 9, 157–166. [Google Scholar] [CrossRef]
- Oduyemi, O.; Okoroh, M. Building performance modelling for sustainable building design. Int. J. Sustain. Built Environ. 2016, 5, 461–469. [Google Scholar] [CrossRef] [Green Version]
- Panteli, C.; Kylili, A.; Fokaides, P.A. Building information modelling applications in smart buildings: From design to commissioning and beyond A critical review. J. Clean. Prod. 2020, 265, 121766. [Google Scholar] [CrossRef]
- Newsroom. BIM in Europe: The ECSO Report. 10 September 2019. Available online: https://biblus.accasoftware.com/en/bim-in-europe-the-ecso-report/ (accessed on 5 July 2021).
- Tillman, A.-M.; Ekvall, T.; Baumann, H.; Rydberg, T. Choice of system boundaries in life cycle assessment. J. Clean. Prod. 1994, 2, 21–29. [Google Scholar] [CrossRef] [Green Version]
- Embodied Carbon—The Inventory of Carbon and Energy (ICE) (BG 10/2011). Available online: https://www.bsria.com/uk/product/dDJAnX/embodied_carbon_the_inventory_of_carbon_and_energy_ice_bg_102011_a15d25e1/ (accessed on 4 July 2021).
- Databases. Available online: https://gabi.sphera.com/databases (accessed on 4 July 2021).
- BlueMouse GmbH. Ecoinvent Version 3. Available online: http://ecoinvent.org/database (accessed on 4 July 2021).
- Xue, Z.; Liu, H.; Zhang, Q.; Wang, J.; Fan, J.; Zhou, X. The impact assessment of campus buildings based on a life cycle assessment–life cycle cost integrated model. Sustainability 2019, 12, 294. [Google Scholar] [CrossRef] [Green Version]
- European Standards. CSN EN 15804+A2—Sustainability of Construction Works—Environmental Product declarations—Core Rules for the Product Category of Construction Products. Available online: https://www.en-standard.eu/csn-en-15804-a2-sustainability-of-construction-works-environmental-product-declarations-core-rules-for-the-product-category-of-construction-products/ (accessed on 6 July 2021).
- Dara, C.; Hachem-Vermette, C. Evaluation of low-impact modular housing using energy optimization and life cycle analysis. Energy Ecol. Environ. 2019, 4, 286–299. [Google Scholar] [CrossRef]
- Gelowitz, M.D.C.; McArthur, J.J. Comparison of type III environmental product declarations for construction products: Material sourcing and harmonization evaluation. J. Clean. Prod. 2017, 157, 125–133. [Google Scholar] [CrossRef]


| Building Material | Quantity (Wmp) (kg) |
|---|---|
| Cement | 69,160.0 |
| Concrete blocks | 106,315.2 |
| Ceramic tiles | 10,308.2 |
| Burnt clay brick | 64,800.0 |
| Vehicles Used | Load Carrying Capacity (kg) | Fuel Efficiency (km/lit) |
|---|---|---|
| LDV (Ashok Leyland dost strong) | 1250 | 8.58 |
| MDV (Eicher Pro 2095XP) | 8102 | 4.46 |
| Building Material (Vehicle Used) | Quantity (Wmp )(kg) | Number of Trips | Distance Travelled for to and fro Trip from Factory for Single Trip (km) | Total Distance (km) |
|---|---|---|---|---|
| Cement (LDV) | 69,160.0 | 55 | 26.7 | 1468.5 |
| Concrete blocks (MDV) | 106,315.2 | 13 | 25.0 | 325.0 |
| Ceramic tiles (LDV) | 10,308.2 | 8 | 20.5 | 164.0 |
| Burnt clay brick (MDV) | 64,800.0 | 8 | 23.6 | 188.8 |
| Building Material (Vehicle Used) | Total Distance (km) | Fuel Efficiency (km/lit) | Fuel Consumption (lit) |
|---|---|---|---|
| Cement (LDV) | 1468.5 | 8.58 | 171.15 |
| Concrete blocks (MDV) | 325.0 | 3.59 | 90.50 |
| Ceramic tiles (LDV) | 164.0 | 8.58 | 19.11 |
| Burnt clay brick (MDV) | 188.8 | 4.46 | 42.33 |
| Electricity Consumption for Two Months (kWh) | |||||||||||||
|---|---|---|---|---|---|---|---|---|---|---|---|---|---|
| Floors | Jan | Feb | Mar | Apr | May | Jun | July | Aug | Sept | Oct | Nov | Dec | Total |
| Ground floor | 440 | 567 | 548 | 446 | 317 | 421 | 2739 | ||||||
| First floor | 320 | 521 | 518 | 298 | 136 | 354 | 2147 | ||||||
| Second floor | 360 | 522 | 505 | 276 | 326 | 365 | 2354 | ||||||
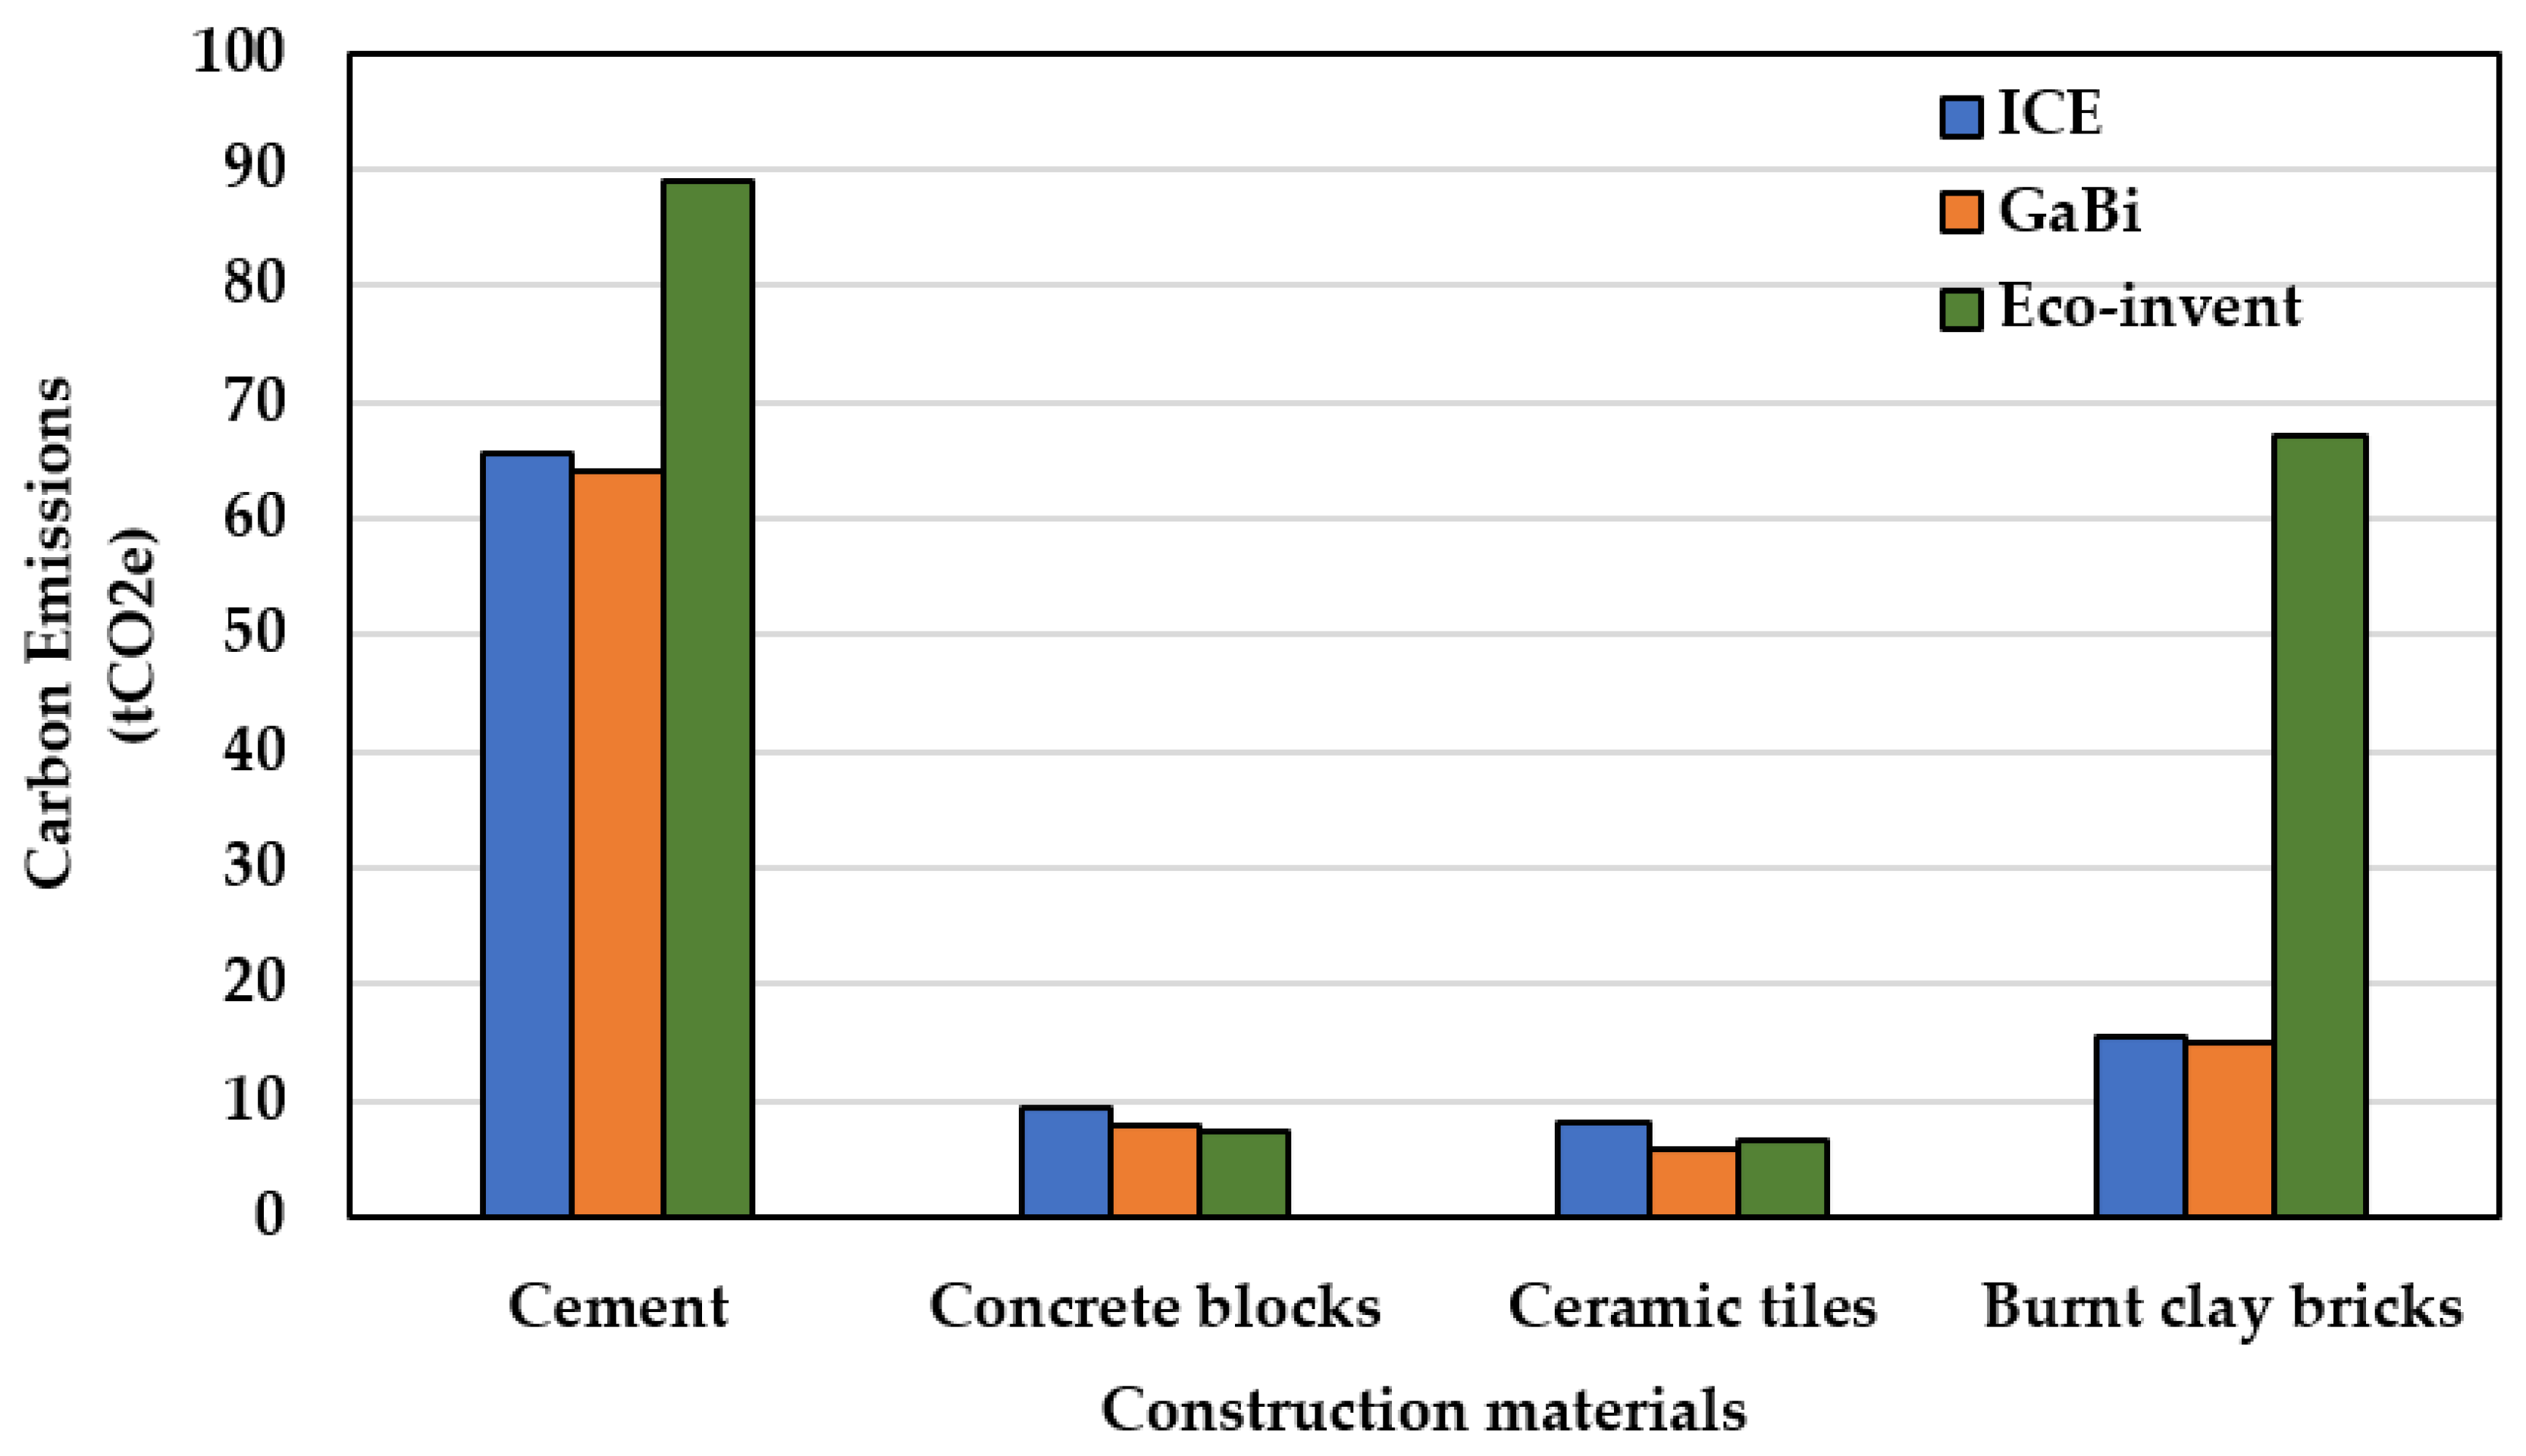
| Materials | GaBi | Ecoinvent |
|---|---|---|
| Cement | 0.85 | 0.94 |
| Concrete blocks | 0.0611 | 0.0686 |
| Ceramic tiles | 0.46 | 0.27 |
| Burnt clay bricks | 0.19 | 0.19 |
| Materials | Quantity (Wmp)(kg) | CEC (Smp) (kg CO2e/kg) | Carbon Emissions (Ucon) (kg CO2e) |
|---|---|---|---|
| Cement | 69,160.0 | 0.95 | 65,702.0 |
| Concrete blocks | 106,315.2 | 0.088 | 9355.7 |
| Ceramic tiles | 10,308.2 | 0.78 | 8040.4 |
| Burnt clay bricks | 64,800.0 | 0.24 | 15,552.0 |
| Life Cycle Stages | Result Category | Carbon Emissions (kgCO2e) | |
|---|---|---|---|
| GaBi | Ecoinvent | ||
| Materialization stage | Construction materials | 92,698.9 | 170,207.9 |
| Transportation stage | Transportation to site | 59,639.7 | 59,429.5 |
| Operational stage | Energy use | 1,441,762.7 | 1,441,762.7 |
| Demolition stage | Deconstruction | 4305.9 | 3171.3 |
| Total carbon emissions in kgCO2e | 1,598,407.2 | 1,674,571.4 | |
| Carbonemissions in tCO2e | 1598.4 | 1674.6 | |
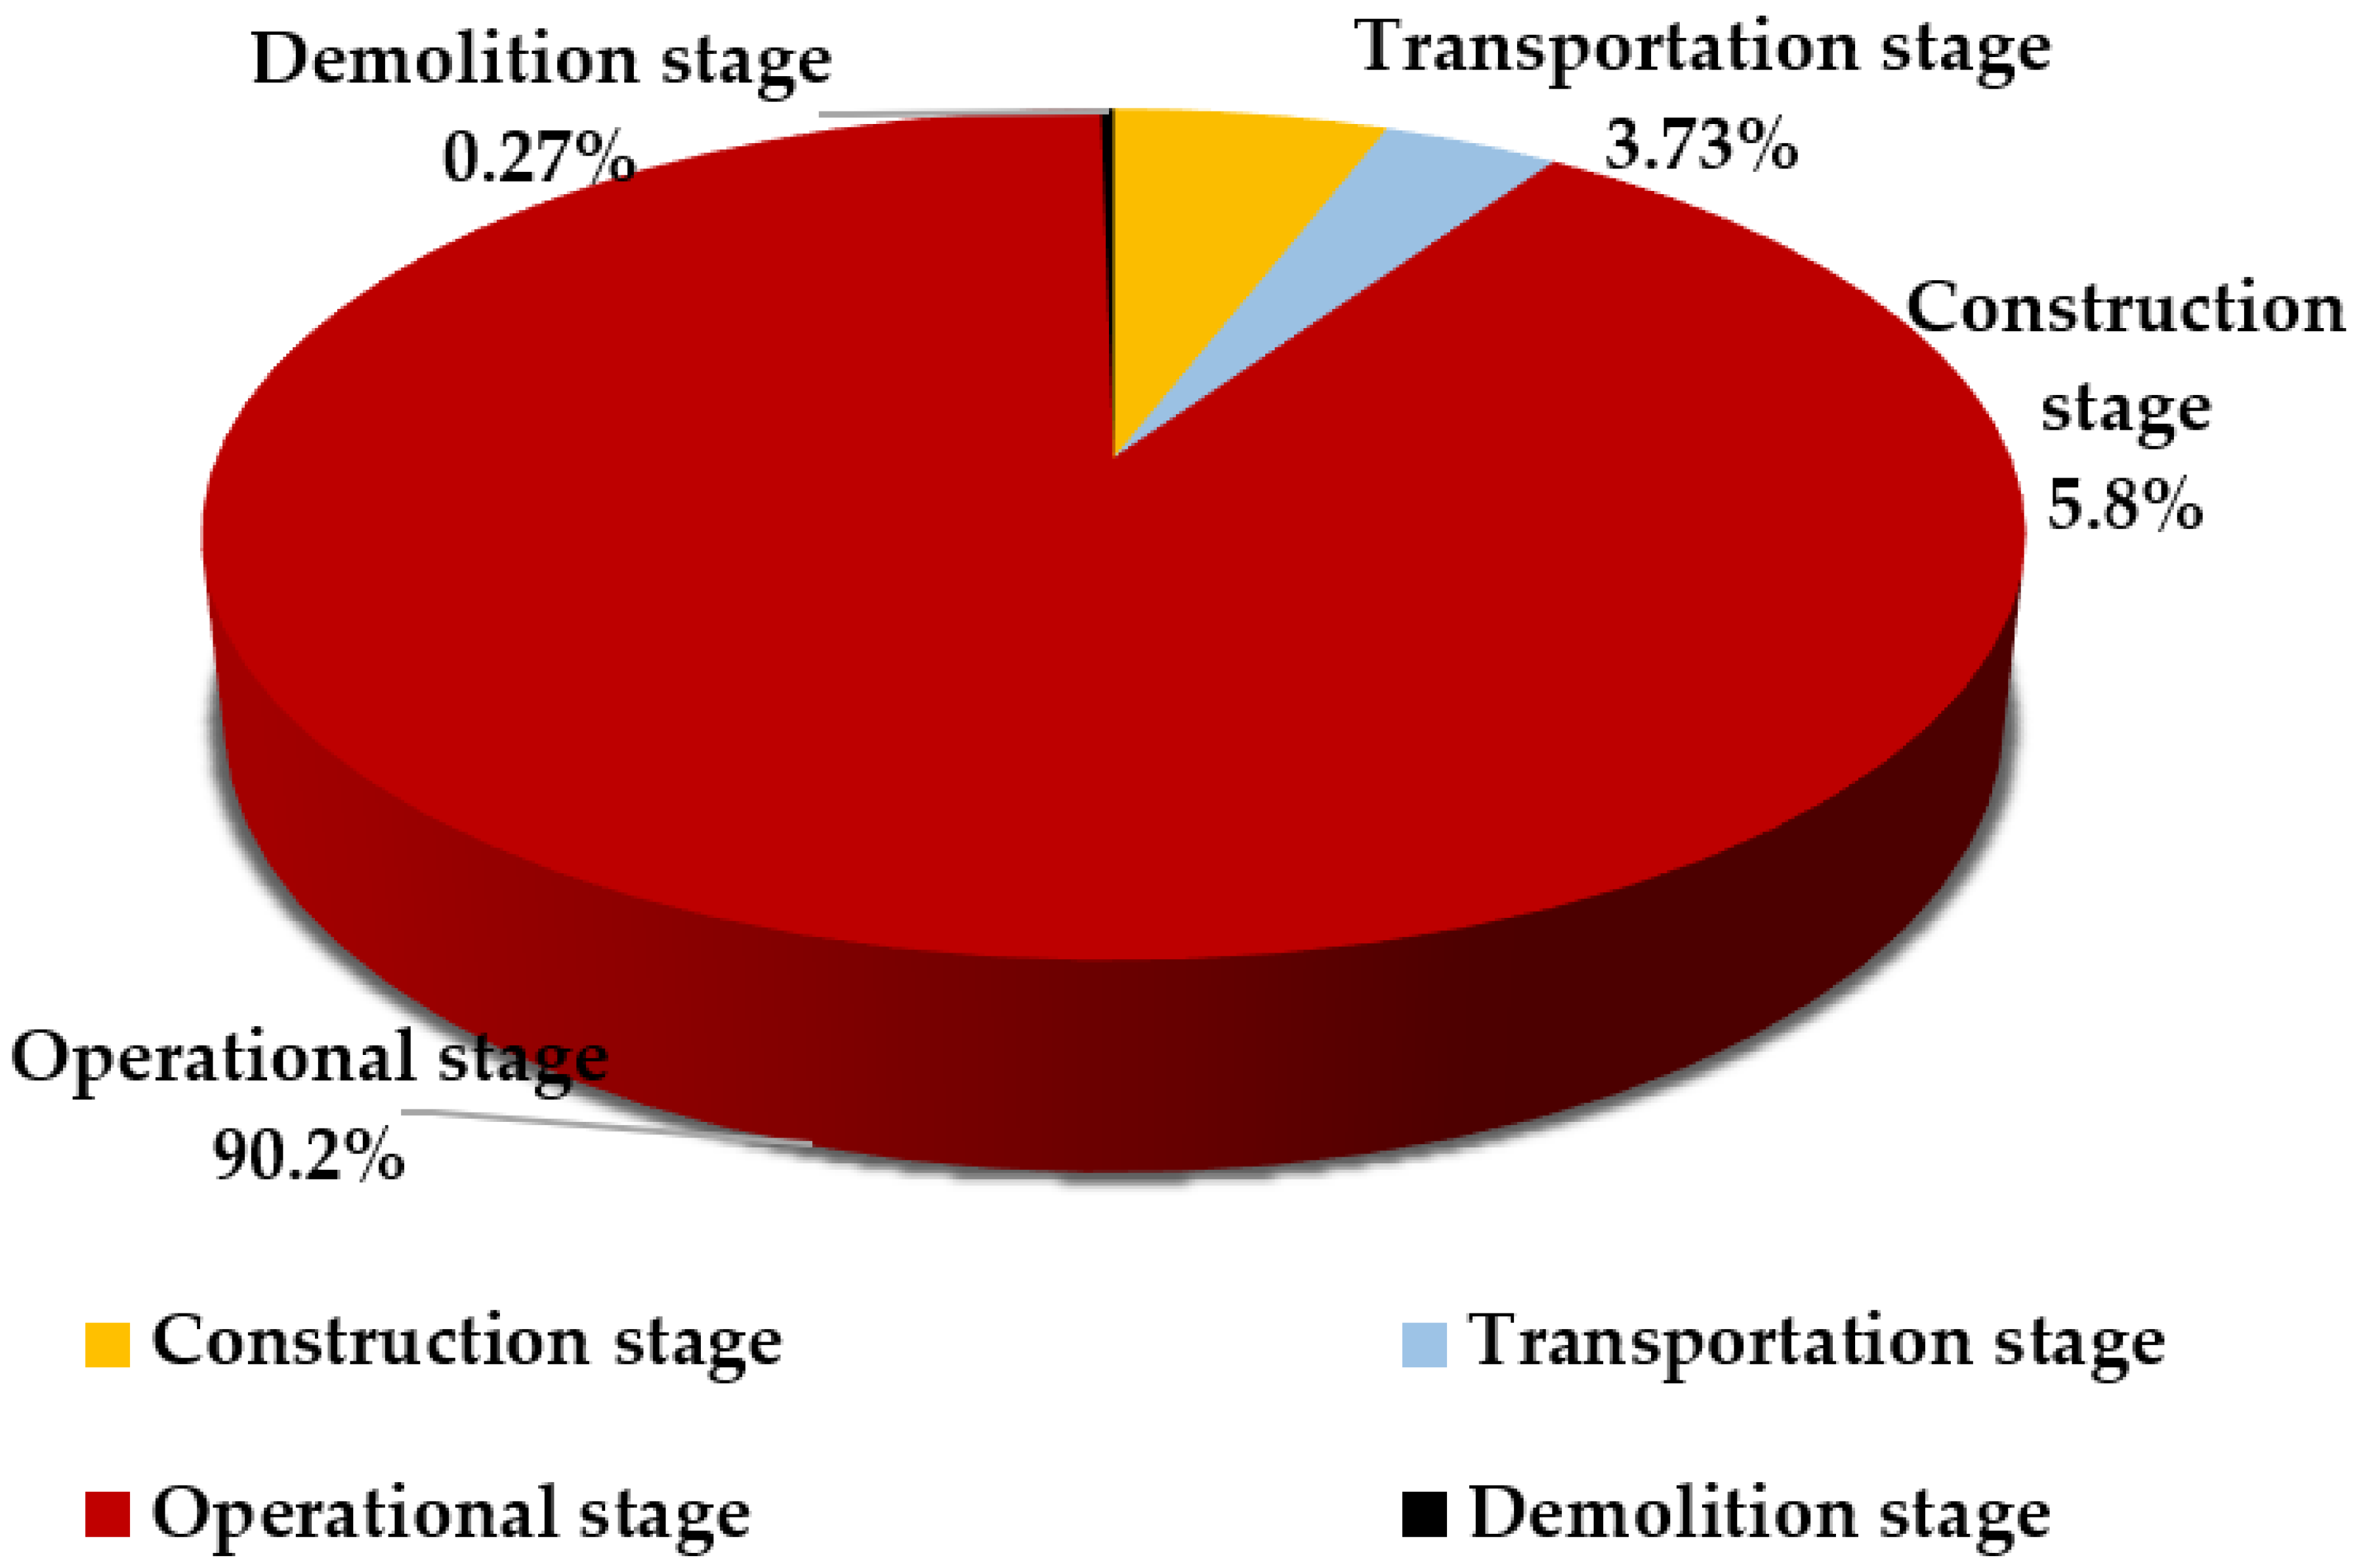
| Life Cycle Stage | ICE | GaBi | Ecoinvent |
|---|---|---|---|
| Construction stage | 14.95 | 5.80 | 10.16 |
| Transportation stage | 0.13 | 3.73 | 3.55 |
| Operational stage | 83.42 | 90.20 | 86.10 |
| Demolition stage | 1.50 | 0.27 | 0.19 |
| Total | 100 | 100 | 100 |
| Life Cycle Database | Carbon Emissions (CE) (tCO2e/m2) | Relative Difference |
|---|---|---|
| GaBi | 2.20 | 0 |
| ICE | 0.916 | −58.3 |
| Ecoinvent | 2.30 | +4.5 |
Publisher’s Note: MDPI stays neutral with regard to jurisdictional claims in published maps and institutional affiliations. |
© 2021 by the authors. Licensee MDPI, Basel, Switzerland. This article is an open access article distributed under the terms and conditions of the Creative Commons Attribution (CC BY) license (https://creativecommons.org/licenses/by/4.0/).
Share and Cite
Kurian, R.; Kulkarni, K.S.; Ramani, P.V.; Meena, C.S.; Kumar, A.; Cozzolino, R. Estimation of Carbon Footprint of Residential Building in Warm Humid Climate of India through BIM. Energies 2021, 14, 4237. https://0-doi-org.brum.beds.ac.uk/10.3390/en14144237
Kurian R, Kulkarni KS, Ramani PV, Meena CS, Kumar A, Cozzolino R. Estimation of Carbon Footprint of Residential Building in Warm Humid Climate of India through BIM. Energies. 2021; 14(14):4237. https://0-doi-org.brum.beds.ac.uk/10.3390/en14144237
Chicago/Turabian StyleKurian, Rosaliya, Kishor Sitaram Kulkarni, Prasanna Venkatesan Ramani, Chandan Swaroop Meena, Ashok Kumar, and Raffaello Cozzolino. 2021. "Estimation of Carbon Footprint of Residential Building in Warm Humid Climate of India through BIM" Energies 14, no. 14: 4237. https://0-doi-org.brum.beds.ac.uk/10.3390/en14144237