
Study on Mineral Compositions of Direct Carbonated Steel Slag by QXRD, TG, FTIR, and XPS


1
School of Civil and Resource Engineering, University of Science and Technology Beijing, Beijing 100083, China
2
Key Laboratory of Resource-Oriented Treatment of Industrial Pollutants, Beijing 100083, China
*
Author to whom correspondence should be addressed.
Energies 2021, 14(15), 4489; https://0-doi-org.brum.beds.ac.uk/10.3390/en14154489
Submission received: 1 July 2021
/
Revised: 15 July 2021
/
Accepted: 19 July 2021
/
Published: 24 July 2021
(This article belongs to the Special Issue Advances in CO2 Mitigation in Energy and the Environment)
Abstract
:Steel slag CO2 sequestration helps mitigate global warming and decrease the stockpile of steel slag (SS). Through orthogonal design tests and single-factor tests, this paper evaluated the effects of the water/solid mass ratio (w/s), gypsum ratio (G/SS), molding pressure, and curing duration on uniaxial compressive strength (UCS) and CO2 uptake of the compacts. The results indicated that high w/s enhanced both strength and CO2 capture ability. The proper addition of gypsum helps promote UCS increase and CO2 uptake of steel slag. In addition, increasing the molding pressure can significantly improve UCS without reducing CO2 uptake. The optimum conditions in the study were a w/s of 0.20, G/SS of 1/16, and molding pressure of 27 MPa, under which conditions 1 d UCS and CO2 uptake were 55.30 MPa and 12.36%, respectively. Microanalyses showed that gypsum activates mainly mayenite in steel slag. An increase in water addition also increased the hydration and carbonation products greatly, and the strengthened molding pressure had a significant densification effect on micro-pore structures. The study gives guidance in the application of steel slag in CO2 capture and manufacturing green construction material.
1. Introduction
Carbon dioxide emissions contribute to global warming in ways that cannot be ignored. Feasible carbon capture and storage (CCS) technologies mainly include geological, ocean, biological, and mineral sequestration [1], among which mineral sequestration is considered the safest method. It sequesters carbon dioxide from emission sources, such as steel companies and power stations, with Ca- or Mg-bearing minerals to form thermodynamically stable carbonates [2,3,4].
Industrial solid wastes, including blast-furnace slag [5], coal fly ash [6,7], and steel slag [8,9,10,11,12,13,14], were chosen to be suitable CCS feedstock because of their low cost, high carbon reactivity, and wide availability. Blast-furnace slag and coal fly ash are well studied and utilized as supplementary cement materials, enhancing cement performance. On a related note, only 29.5% of steel slag is used in China [15]. Most of it is stockpiled, occupying land resources and polluting the environment [16,17]. A total of 1.8 billion tons of steel slag was stockpiled until 2018 in China, with 110 million tons generated each year. As the world’s largest emitter of carbon dioxide and the largest steel producer, China has promised to become carbon neutral before 2060. Using steel slag to capture CO2 is one of the most feasible ways of dealing with steel slag and CO2 emission at a low cost.
The chemical composition of steel slag includes mainly CaO, 45–60%; SiO2, 10–15%; Al2O3, 1–5%; Fe2O3, 3–9%; MgO, 3–13%; FeO, 7–20%; and P2O5, 1–4% [17]. The main minerals in steel slag include tricalcium silicate (C3S), dicalcium silicate (C2S), RO phase (a continuous solid solution formed by MgO, FeO, and MnO), f-CaO, f-MgO, calcium ferrite, and calcium aluminoferrite. Minerals such as C2S and C3S are hydraulic components, making steel slag a potential supplement in the cement and concrete industry. However, f-CaO, f-MgO, and the relatively low-hydration-activity RO phase cause expansion after hydration reactions. In addition, the addition of steel slag in cement usually results in strength degradation because of low hydration activity [18,19,20].
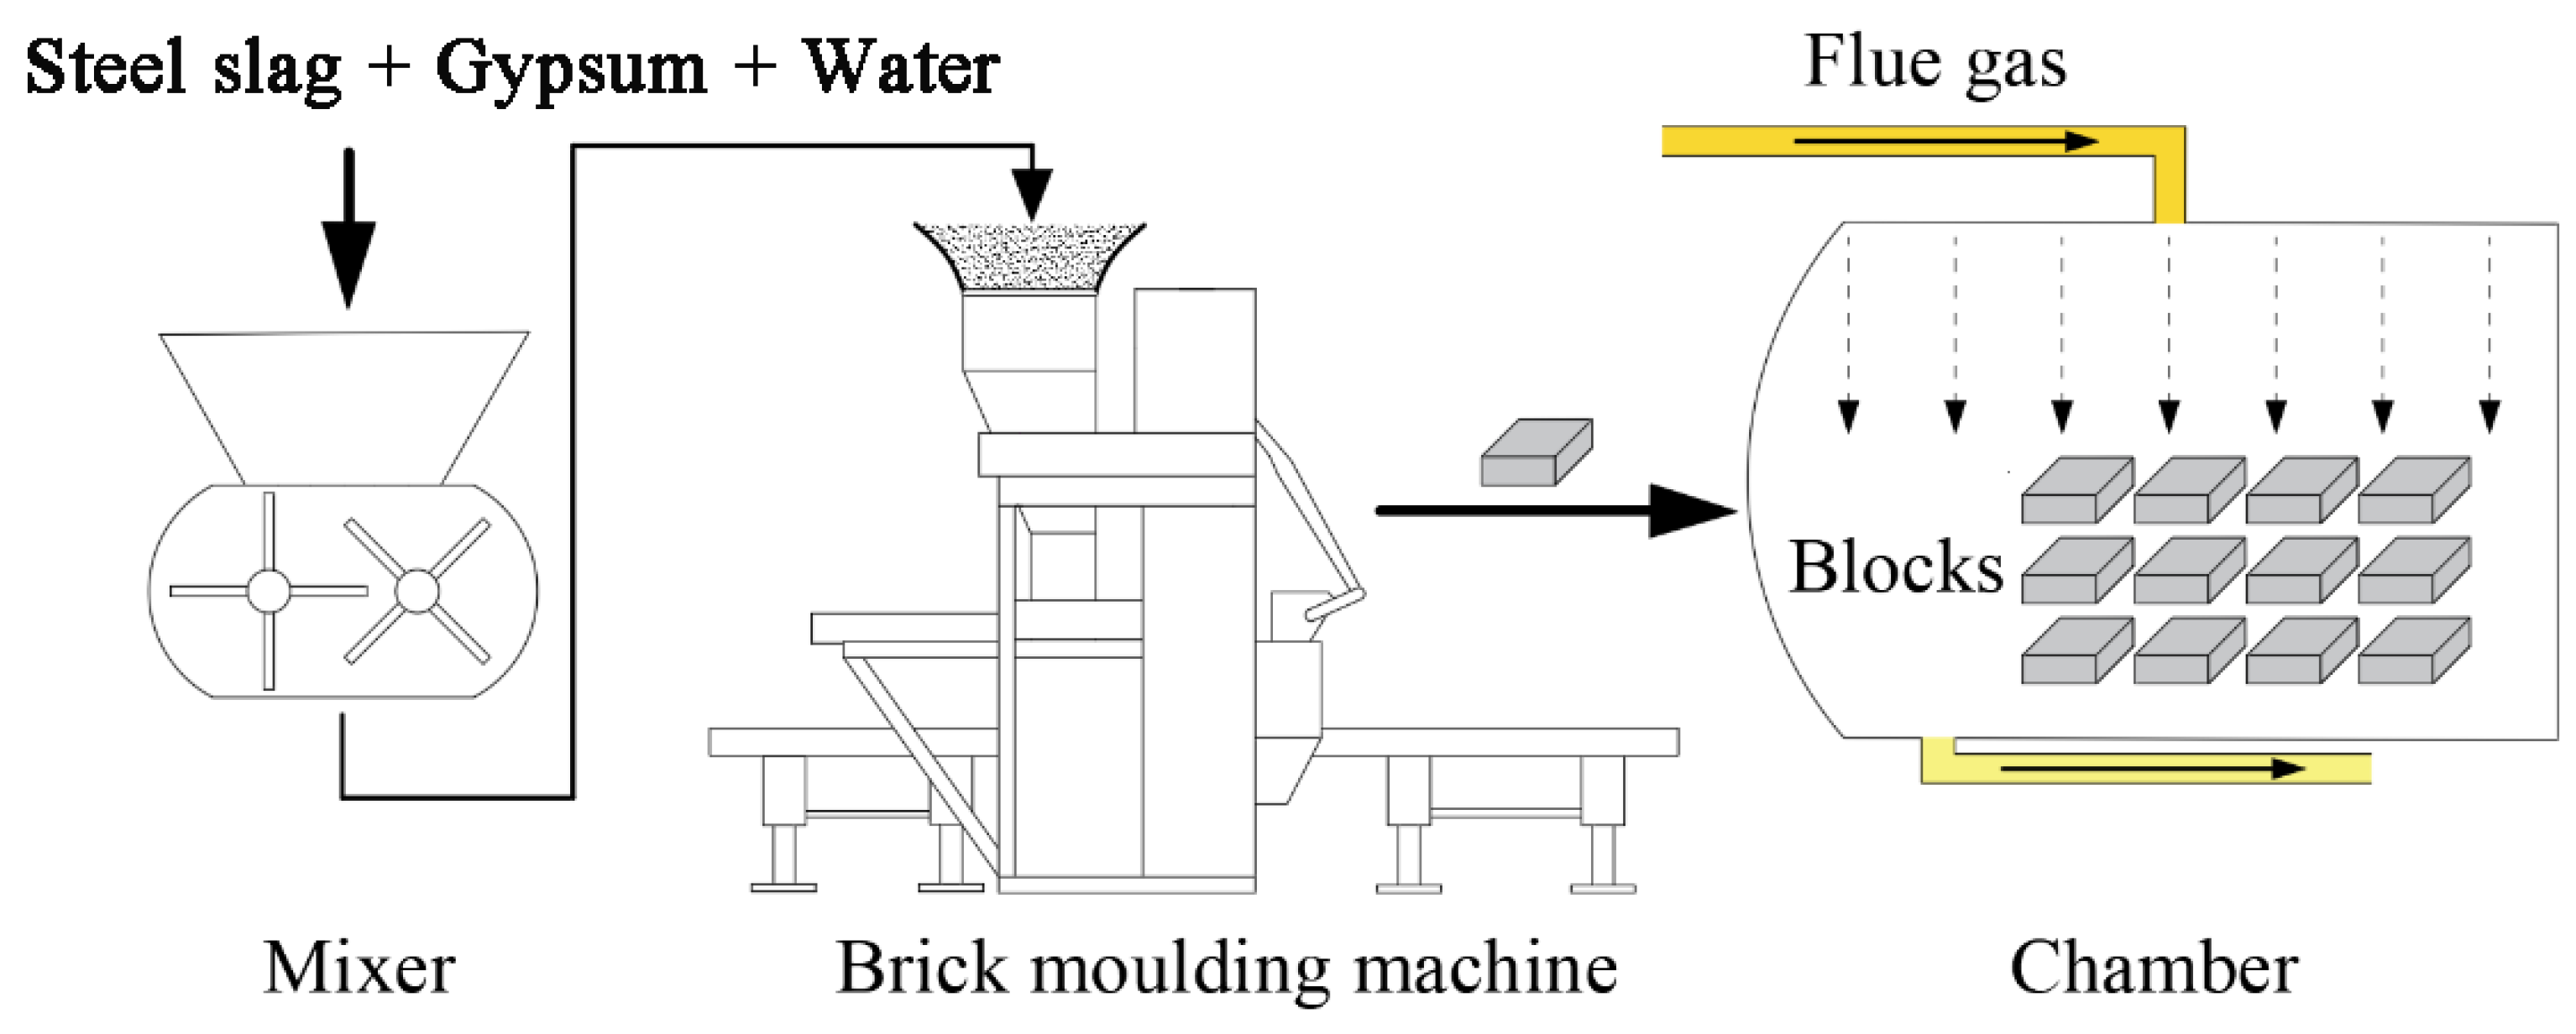
Carbonation is considered an effective way to solve these problems. Steel slag has a significantly high carbon reactivity because of its high alkalinity caused by oxides. Liu et al. [21] found that carbonated steel slag can even enhance the mechanical properties of cementitious materials. Furthermore, through carbonation, the volume stability was improved considerably, as the carbonate minerals formed were thermodynamically stable [22,23,24]. Besides supplementing steel slag in cement, some researchers focused on their carbonation for building materials such as bricks or blocks to optimize their use. Before carbonation, fresh samples are mostly molded into specific shapes. The shaping methods include precasting and press shaping. The former molding method proceeds using the cementitious properties of steel slag. The latter method mainly uses a molding machine to press the samples into specific shapes for carbonation curing, as shown in Figure 1.
For the second shaping method, three main factors influence the samples’ mechanical and CO2 capture performance: the raw material (steel slag types and activator), water/solid mass ratio (w/s), and molding pressure. In China, 70% of the steel slag produced is converter slag, the type we chose for this study. Gypsum is reportedly an effective activator for the hydration reaction of steel slag. Thus, this study also aims to determine the optimal amount of gypsum to be added to steel slag carbonation samples. To study factors such as the activator amount, w/s, and molding pressure on the samples, orthogonal experiments and single-factor experiments were performed to achieve optimized parameters. Microstructural analyses, such as Fourier transform infrared (FTIR) spectroscopy, thermogravimetric analysis (TGA), mercury intrusion porosimetry (MIP), and X-ray photoelectron spectroscopy (XPS), were conducted to obtain the associated mechanisms.
Gypsum could be used as an activator for steel slag hydration and carbonation in this study. To the best of our knowledge, proportion-optimization design for the gypsum-activated steel slag carbonation samples has been rarely studied. This study optimized the proportion for blocks through orthogonal experimental design and range analyses, giving us information about how w/s, gypsum amount, and molding pressure impacted the strength and CO2 capture capacity of the samples, providing guidance for industrial practical application. In addition, the single-factor experiments and the corresponding microanalysis methods helped to explore the chemical and microstructural properties of samples, as well as the reaction mechanisms. QXRD, especially, can clearly show the amount changes of minerals in carbonated samples under the influence of carbonation duration, w/s, and molding pressure. MIP can clearly show the pore structure in carbonated samples. The results of the paper offer reliable guidance for the efficient preparation of gypsum-activated steel slag carbonate blocks.
2. Materials and Methods
2.1. Raw Materials
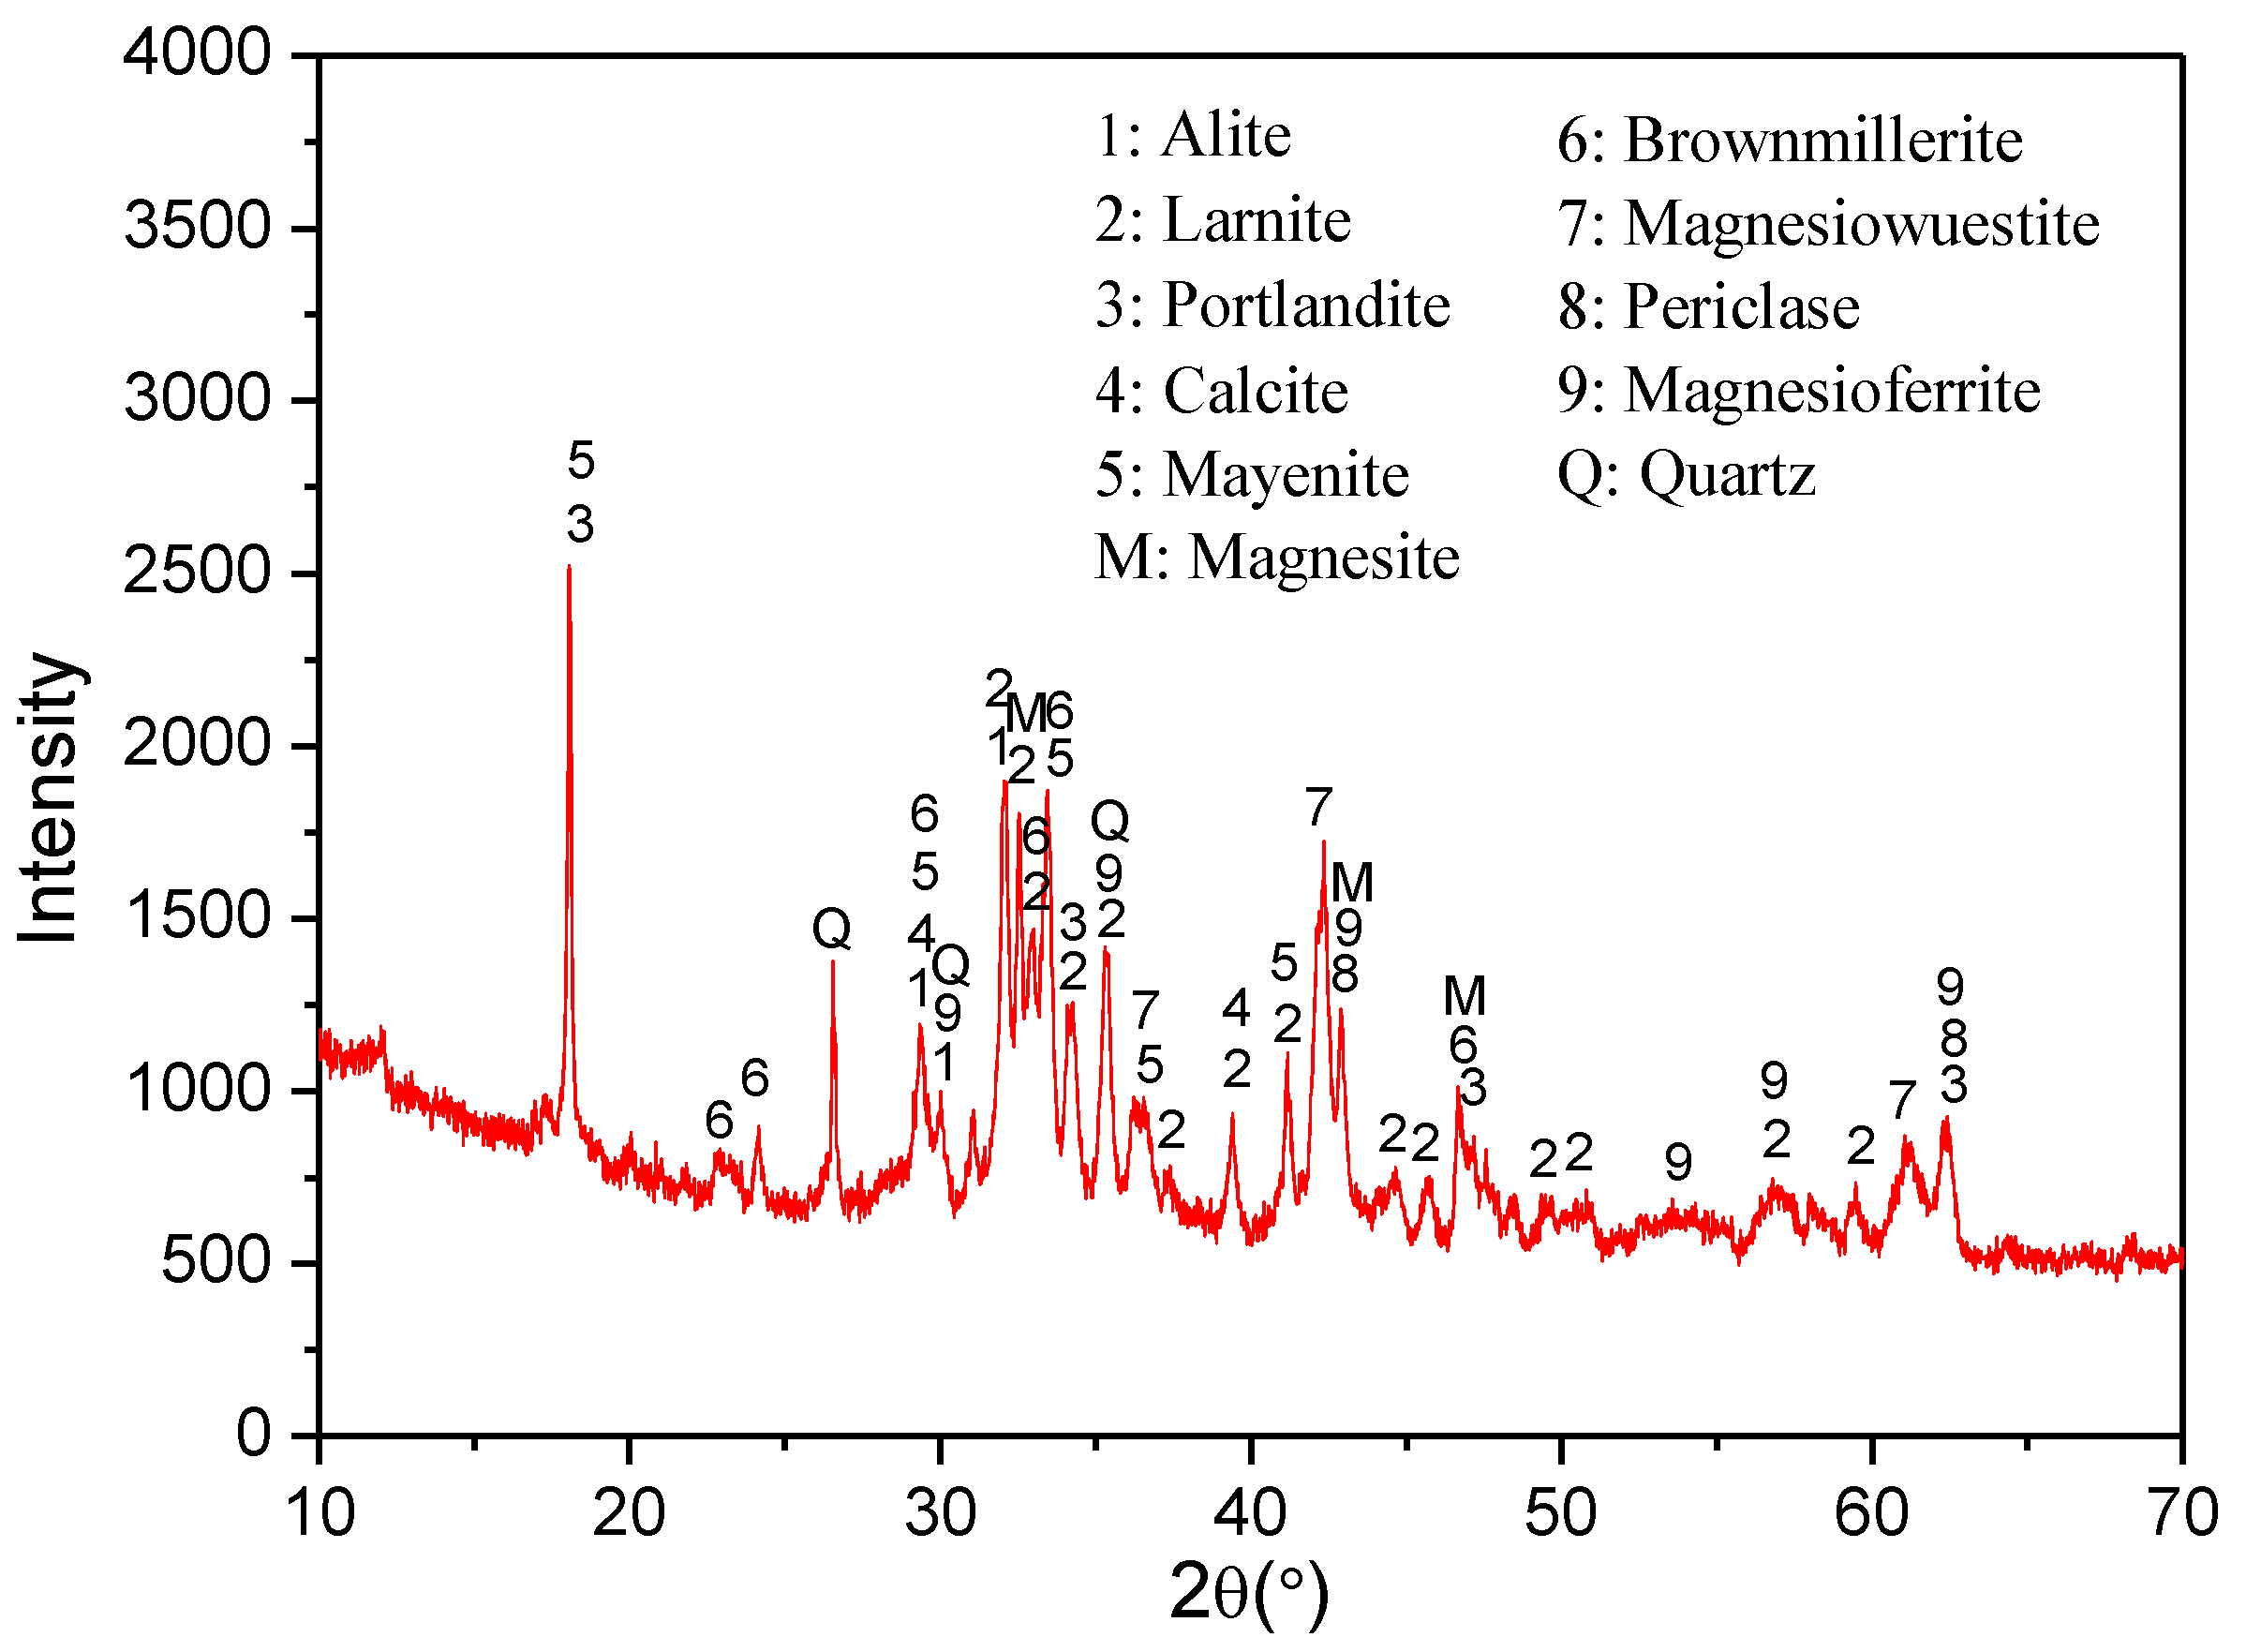
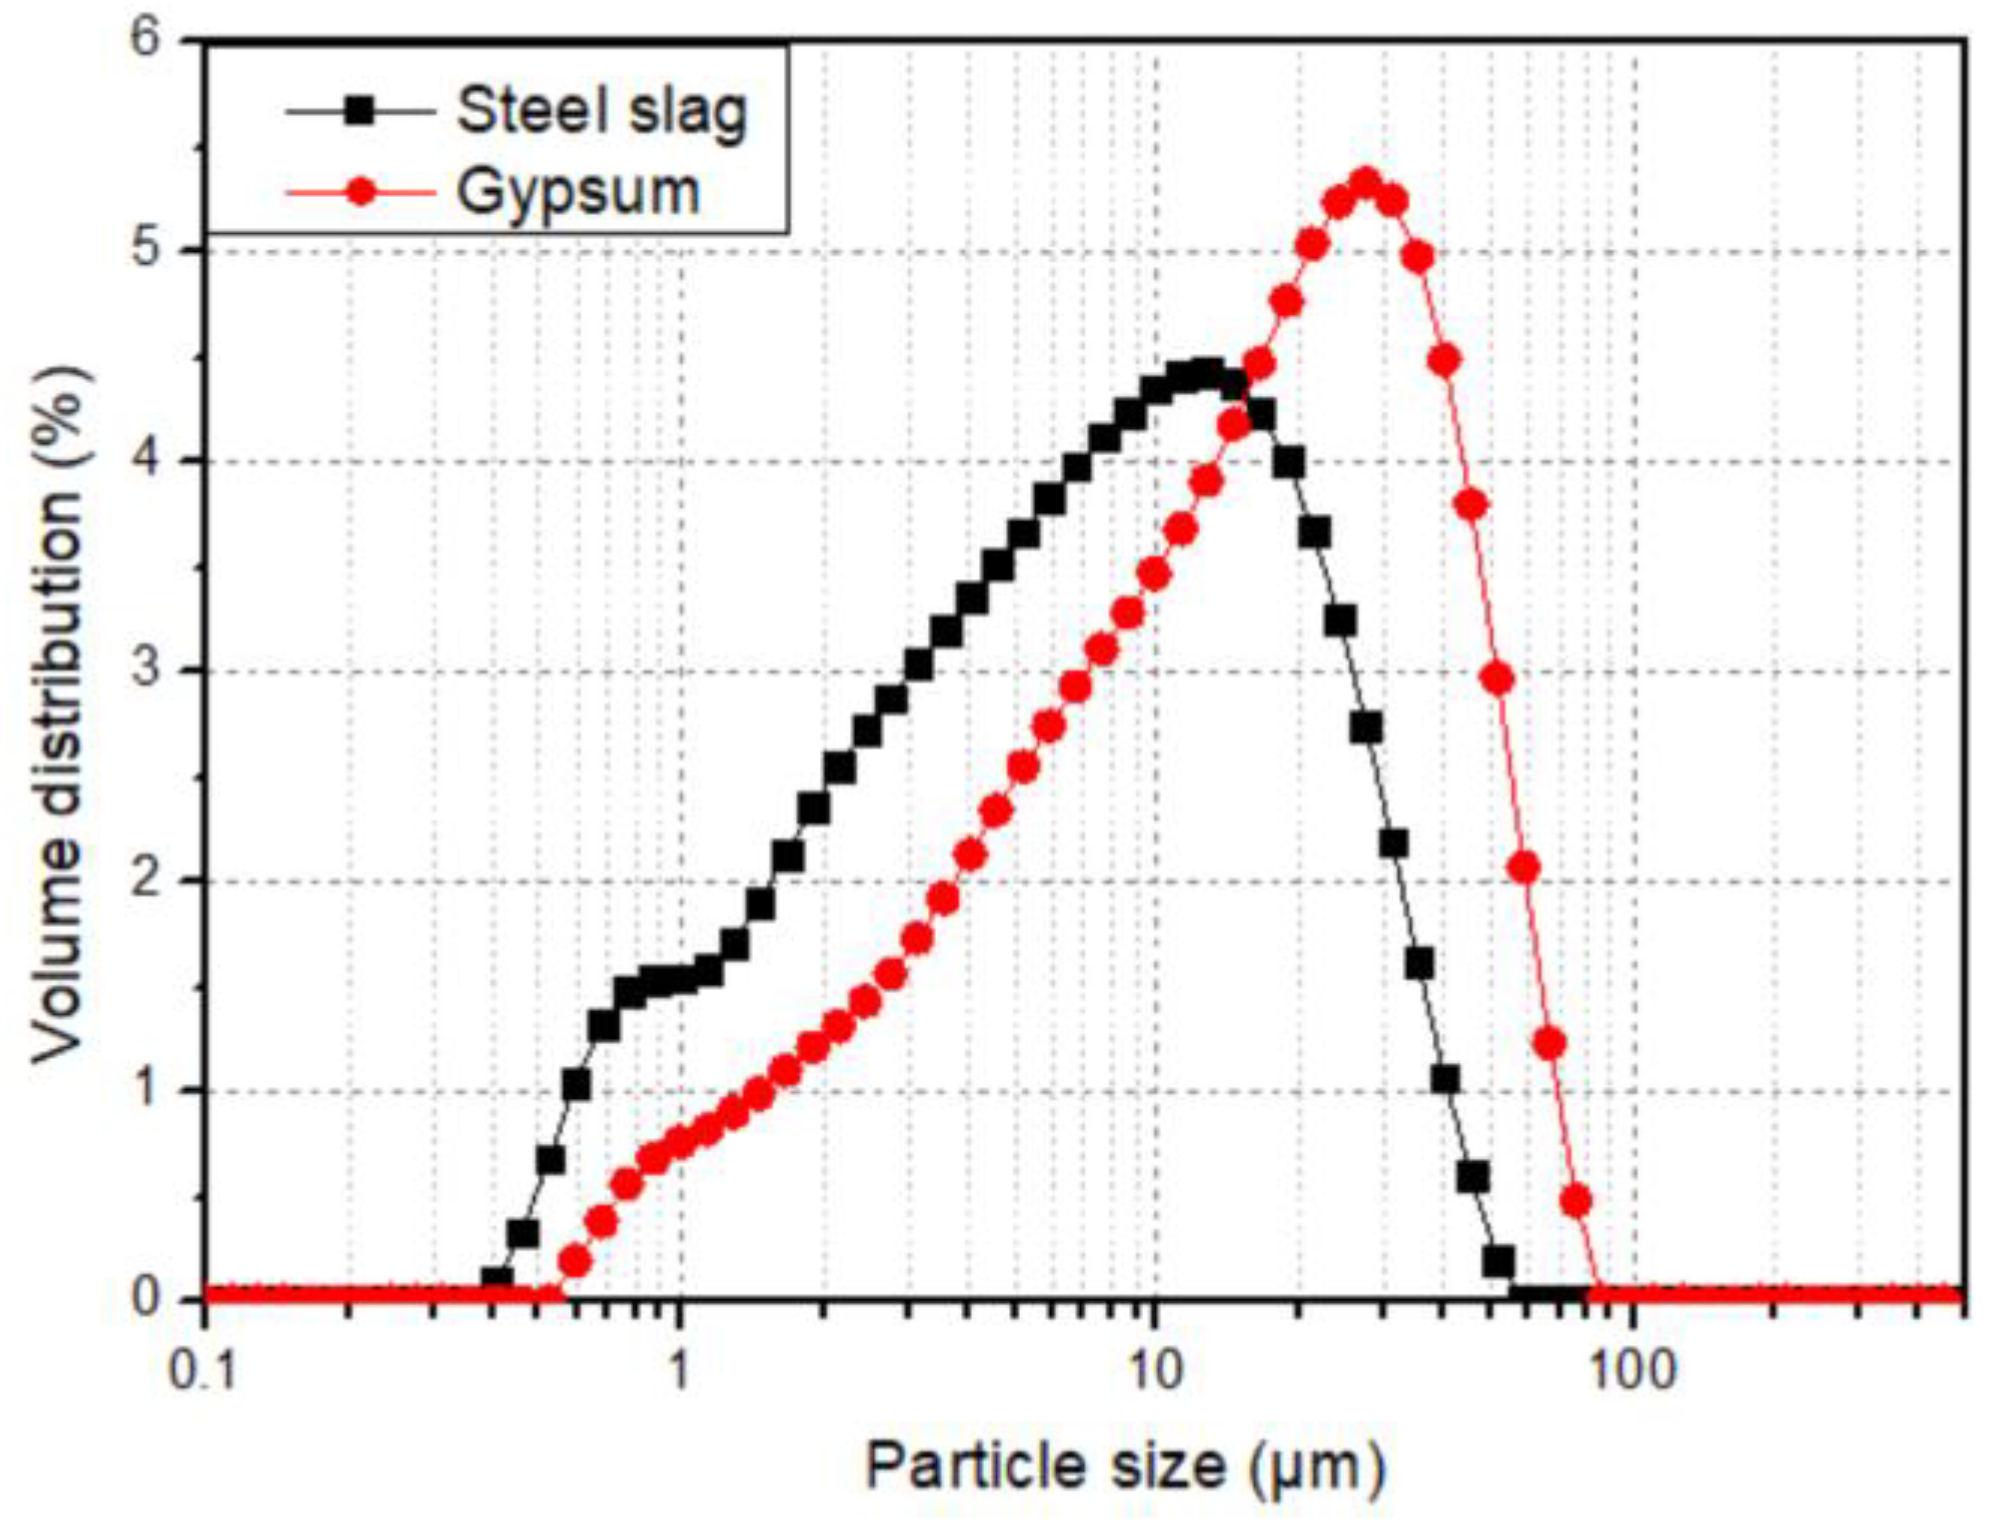
The steel slag used in this study, with a specific surface area of 460 m2/kg, was from Anshan Iron and Steel Co., Ltd. (Anshan, China). The desulfurization gypsum was from Jintaicheng Environmental Resources Co., Ltd. (Hebei, China). The composition of gypsum was broadly CaSO4·2H2O. X-ray fluorescence and carbon/sulfur analyses were conducted on the steel slag and gypsum to obtain their chemical compositions. The samples’ mineral compositions were characterized using an X-ray diffractometer (Rigaku UltimaIV) with CuKα radiation. Furthermore, quantitative X-ray diffraction (QXRD) analysis was conducted by Rietveld refinement using Highscore Plus software (with QXRD Rietveld method results shown in Figure S1 in Supplementary Material). Table 1 and Figure 2 show the chemical and mineral compositions of the raw materials, respectively. The main crystalline phases of the steel slag are larnite, alite, RO phase (magnesiowuestite in Table 1), brownmillerite, mayenite, and portlandite. Figure 3 shows the particle-size distributions of the steel slag powder and gypsum.
2.2. Experimental Program and Test Methods
A paste mixer was used to mix and stir the steel slag powder, gypsum, and water for 2 min after they were weighed according to the experimental proportion (Table 2). The mixture was then weighed (8.00 g) and compacted into a cylindrical stainless steel mold 20 mm in diameter under a certain molding pressure for 1 min. The compacts were then demolded and immediately placed into a carbonation chamber (20 ± 3 °C; 70 ± 2% relative humidity; 20 ± 3 vol % CO2 concentration).
Uniaxial compressive strength (UCS) tests and carbon content tests on samples at different ages (1, 3, 14, and 28 days) were conducted. The UCS at each curing age was determined by calculating the mean value of three tests. The carbon contents of samples were measured using a EMIA-820 V carbon/sulfur combustion analyzer (Horiba). If the CO2 uptake of the sample is x%, then according to the principle of carbon conservation, the following equation can be obtained:
where mbc is the weight of the compact before carbonation (8.00 g here); mdc is the weight of the dried carbonated compact (g); CO2initial is the CO2 content of the compact before carbonation, obtained using ωss × CO2ss; ωss is the steel slag content in the initial sample (wt %); and CO2final is the CO2 content of the dried carbonated compact.
Equation (1) can be rearranged to obtain the equation:
The mass percentage of CO2 absorbed by the steel slag (i.e., the CO2 uptake of the steel slag) was calculated to evaluate the effect of gypsum on the carbon sequestration capacity of steel slag:
QXRD, TG–DTG, FTIR, MIP, and XPS were conducted to analyze the reaction mechanisms and microstructures of the samples. The XRD and QXRD analyses were conducted using the method described in Section 2.1. Note that the QXRD results are only for the crystalline components. The TG–DTG test was conducted using a NETZSCH STA 449F3 at 50 to 1200 °C with a heating rate of 10 °C/min. A NEXUS670 FTIR infrared spectrometer was operated for FTIR analysis, with a 400 to 4000 cm−1 wave number and a resolution of 3 cm−1. The equipment used for XPS analysis was a Thermo Scientific Escalab 250 Xi. A Shirley background was assumed in all cases. Spectra were calibrated using the adventitious hydrocarbon peak at 284.8 eV binding energy (BE) [21]. MIP analysis (Autopore IV 9500, Micromeritics) was conducted to determine the pore-size distributions of the samples.
2.3. Orthogonal Experimental Design
The L9 (33) table was adopted in this test design. The three levels for the three factors were as follows: 1:5 (A1), 1:8 (A2), and 1:10 (A3) for the w/s ratio; 1:16 (B1), 1:4 (B2), and 1:2 (B3) for the mass ratio of gypsum and steel slag (G/SS); and 3 MPa (C1), 6 MPa (C2), and 9 MPa (C3) for the molding strength. The experimental scheme is shown in Table 3. The influences of the w/s, G/SS, and molding strength on the uniaxial compressive strength (UCS) and CO2 uptake were analyzed using this approach.
3. Results and Discussion
3.1. Orthogonal Experimental Results
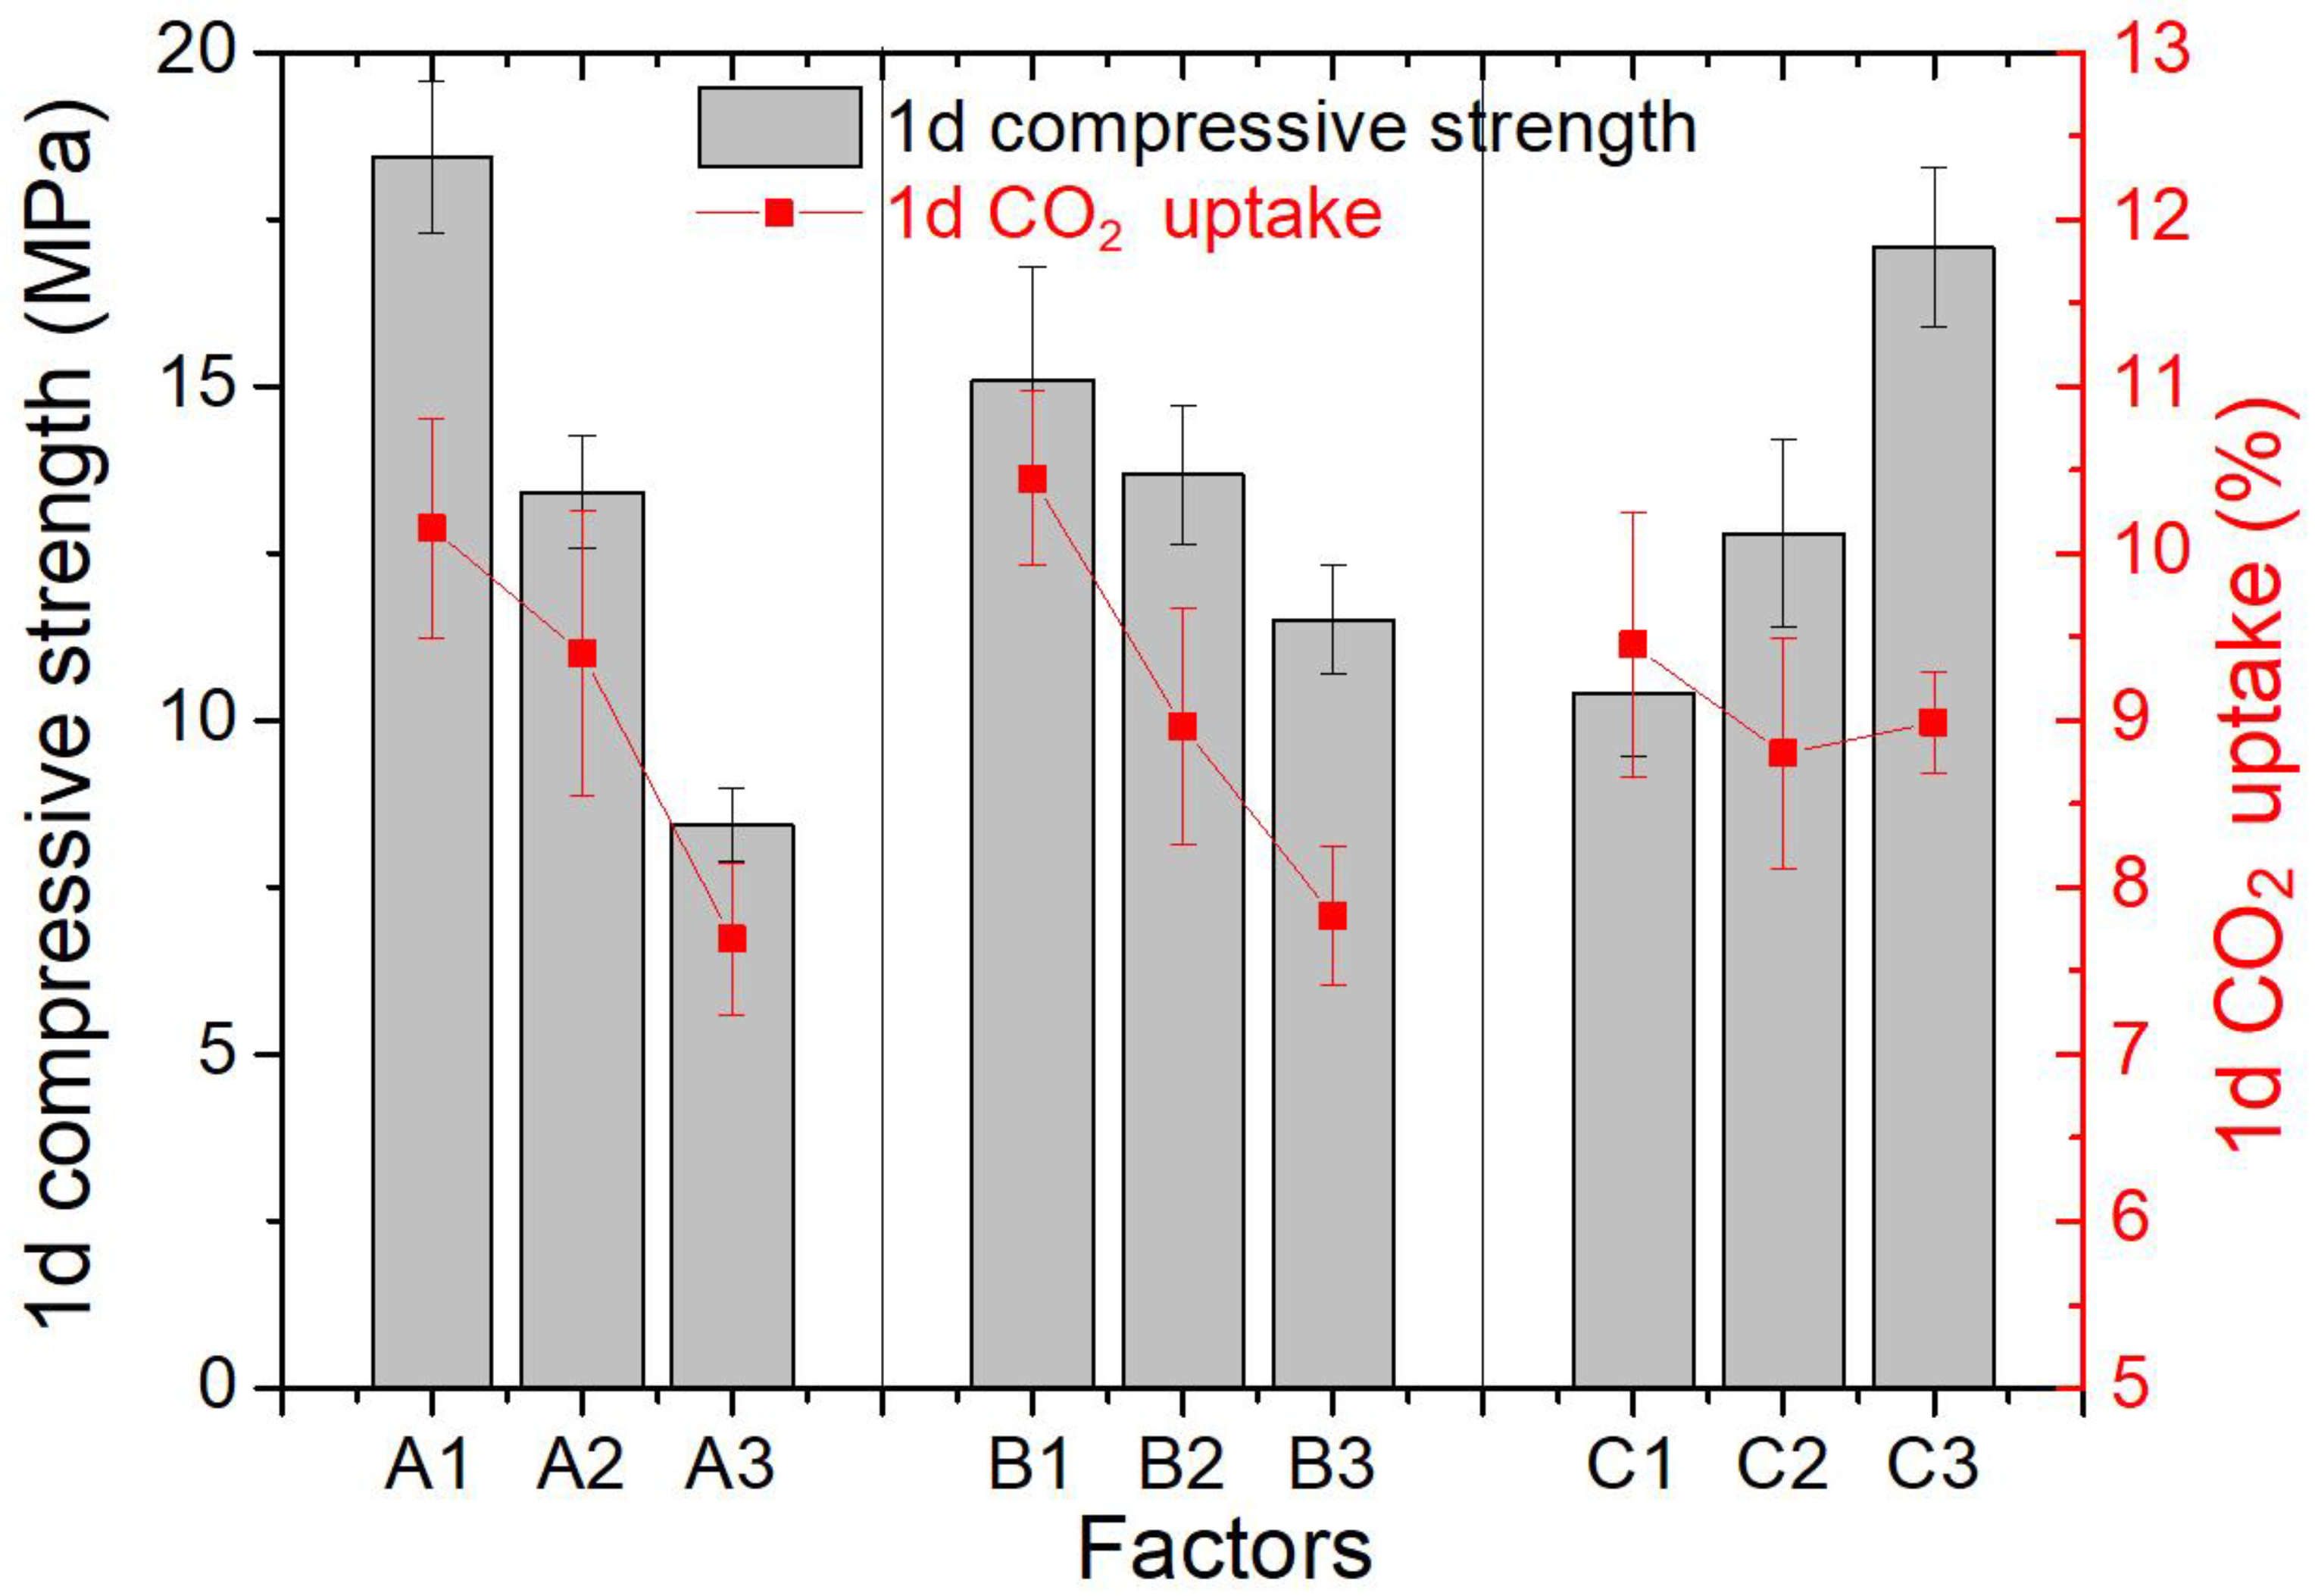
The effect curve of three factors on 1 d compressive strength and 1 d CO2 uptake capacity were shown in Figure 4. The 1-day UCS values ranged from 4.87 to 19.36 MPa. The mean value of K () for different factors was at different levels in the range analysis. The best values for the three factors are as follows: the w/s value was 1:5 (A1), G/SS was 1:16 (B1), and the molding pressure was 9 MPa (C3). Meanwhile, Rj demonstrates the significance of the factor’s influence. A larger Rj value means that the factor has a more significant impact on the UCS. In Figure 4, the decreasing order RA > RC > RB indicates that the level of significance of the factors was as follows: w/s (9.99) > molding pressure (6.67) > G/SS (3.59).
The 1-day CO2 uptake values ranged from 6.19% to 11.93%. Figure 4 shows that the best values for the three factors were as follows: the w/s value was 1:5(A1), G/SS was 1:16 (B1), and the molding pressure was 3 MPa (C1). In Figure 4, the decreasing order RB > RA > RC indicates that the level of significance of the factors was as follows: G/SS (2.62) > w/s (2.46) > molding pressure (0.41).
Table 3 shows that the CO2 uptake increased with the curing time, whereas the UCS value increased gradually until 14 days, after which the strength of some samples decreased. These results are attributed mainly to microstructure breaks due to excessive carbonation, which was also discussed by Wang [9]. Table 3 shows that the gaps between 14 d and 28 d strength sometimes were huge, so measurement error was not enough to explain the large strength drop during this period. The drop in strength could be attributed to microstructure breaks due to excessive carbonation. In other words, the formed hydration products, such as C-S-H gels and ettringite, could be consumed during the carbonation process, doing harm to strength development, especially in later stages. Table 3 indicates that strength degradation was the worst in samples with high w/s, proper amount of gypsum, and low molding pressure. The three above conditions all led to a high amount of hydration product and a loose pore structure. The UCS result indicated that the optimum curing duration was 14 days. Therefore, range analyses of UCS and CO2 uptake after short-term (1 day) and optimum (14 days) curing were conducted.
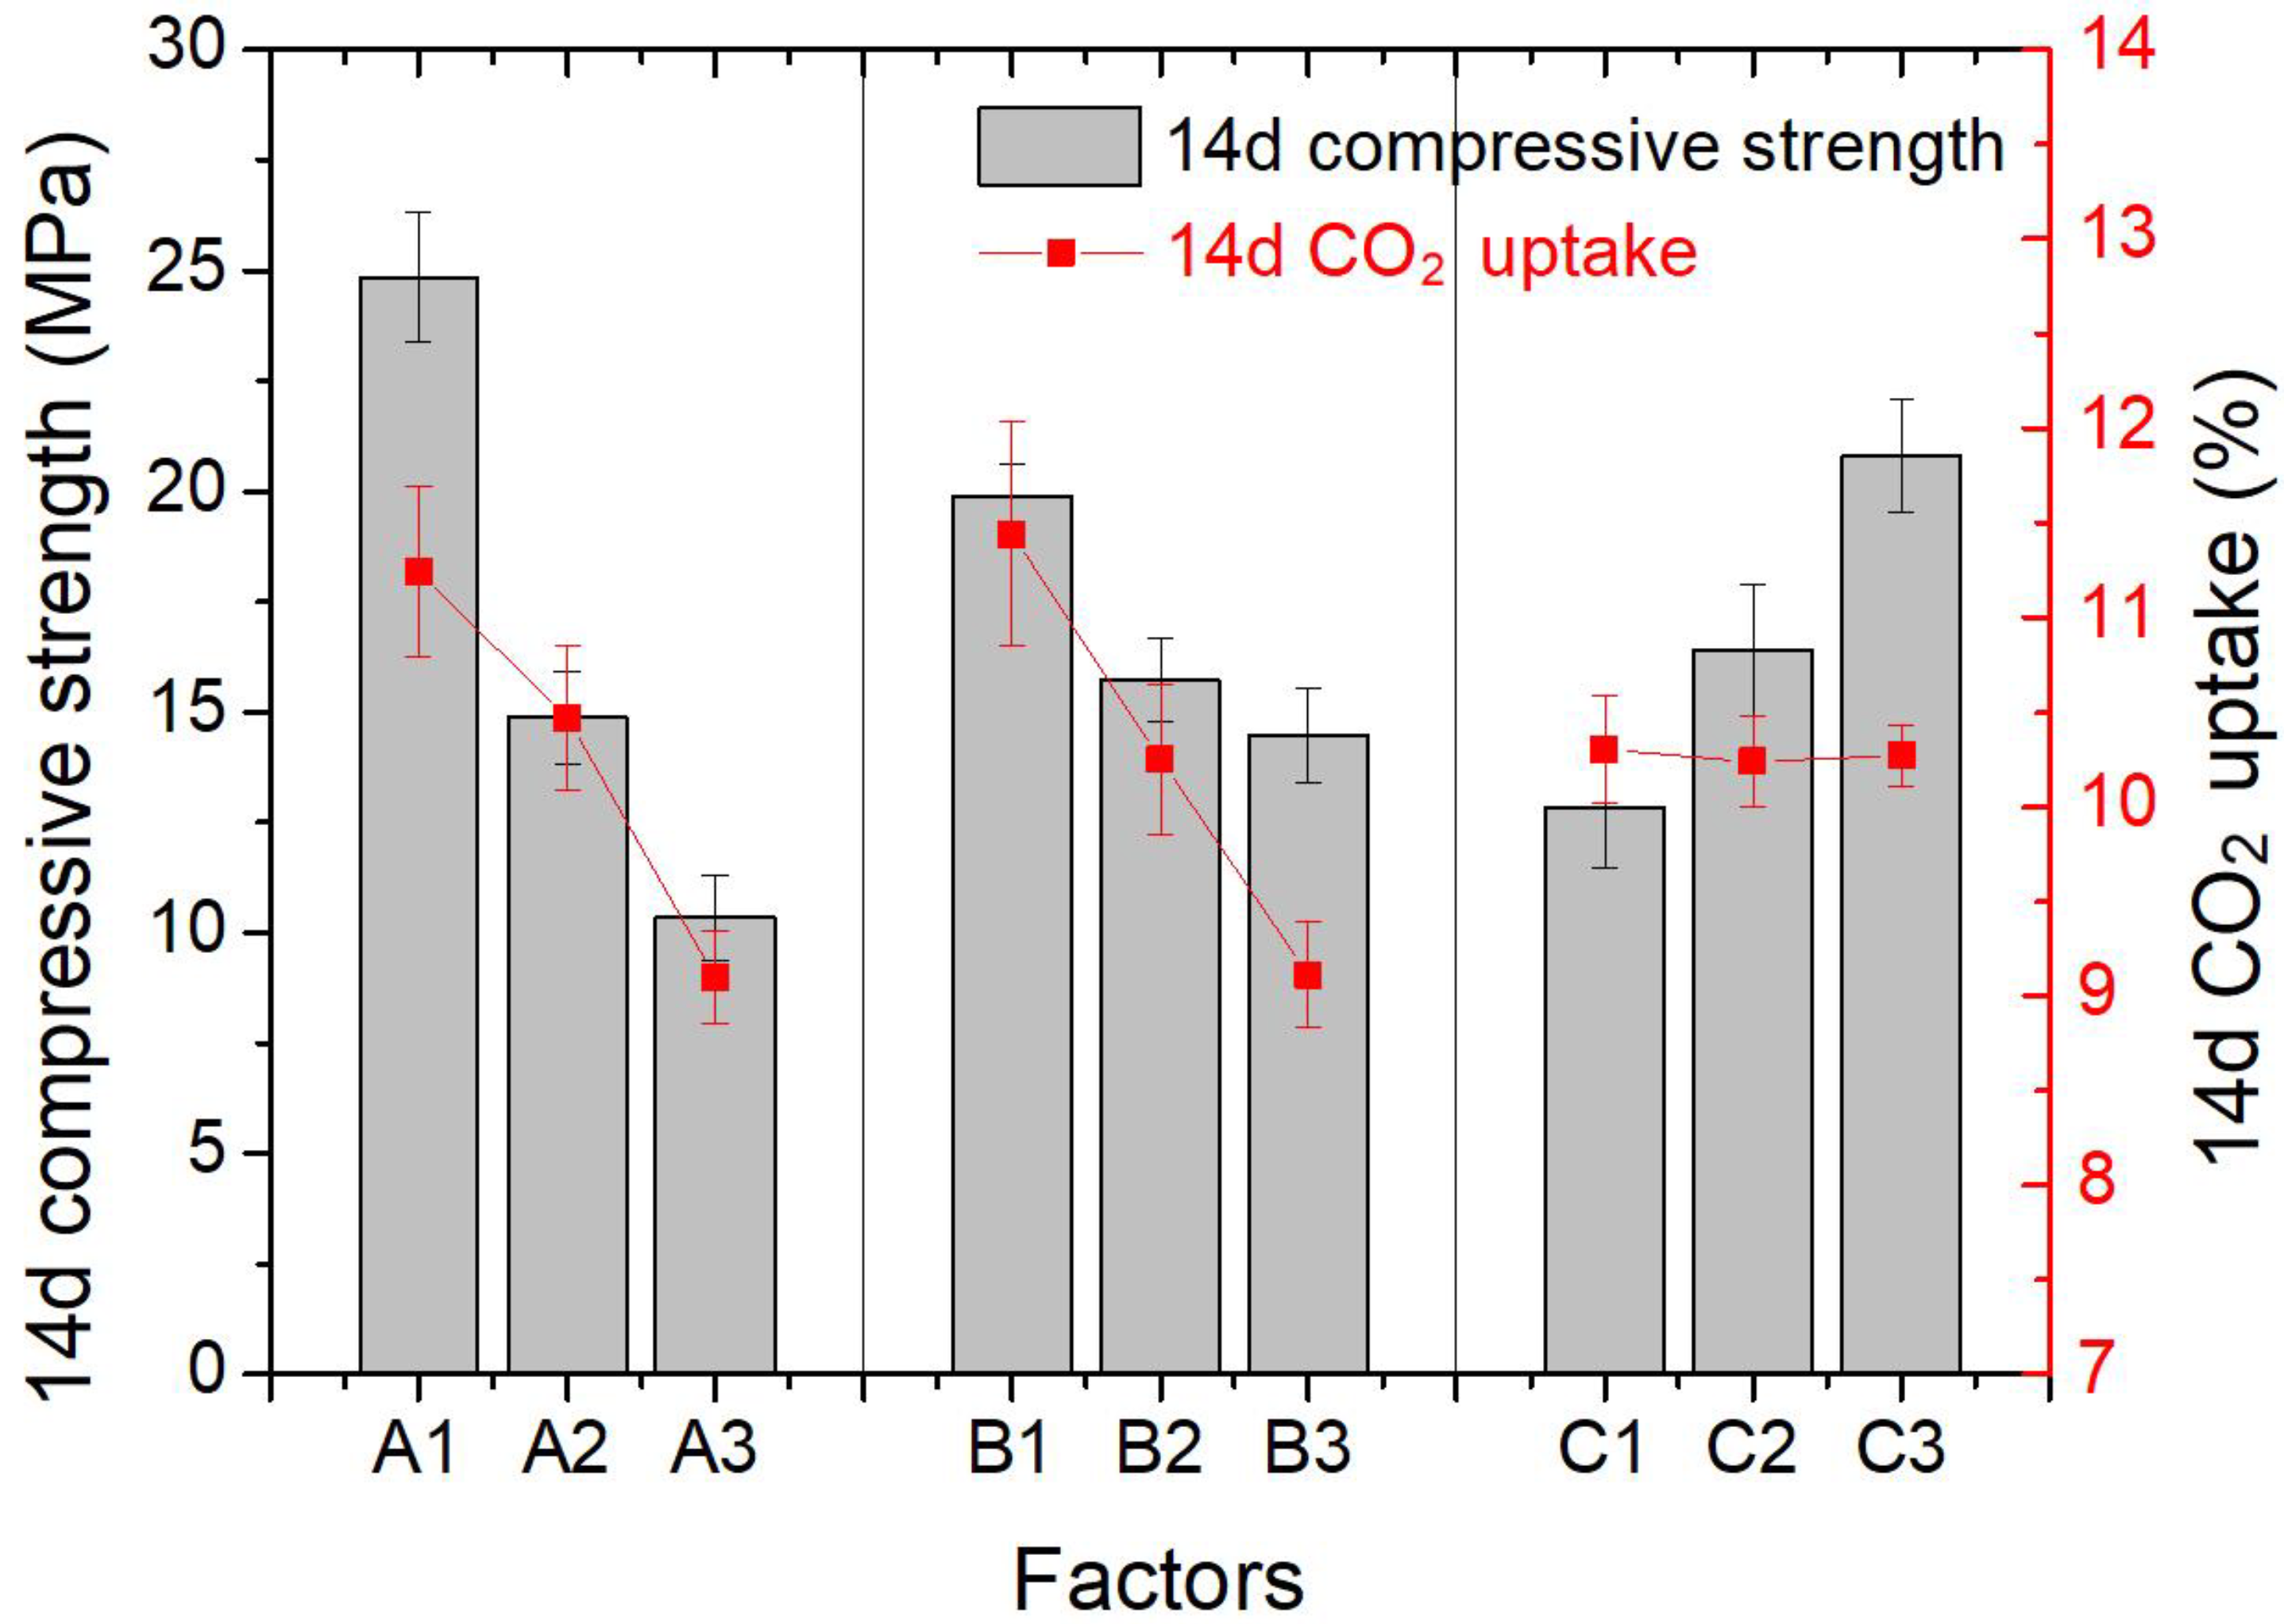
Figure 5 shows the effect curve of three factors on 14 d compressive strength and 14 d CO2 uptake capacity. The 14-day UCS values ranged from 5.70 to 26.94 MPa. The best values for the three factors were as follows: the w/s value was 1:5 (A1), G/SS was 1:16 (B1), and the molding pressure was 9 MPa (C3), which was closely in line with the 1 d compressive strength results. In Figure 5, the decreasing order RA > RC > RB indicated that the level of significance of the factors was as follows: w/s (14.51) > molding pressure (7.98) > G/SS (5.40).
The 14-day CO2 uptake values ranged from 8.09% to 12.62%. The best values for the three factors were as follows: the w/s value was 1:5 (A1), G/SS was 1:16 (B1), and the molding pressure was 3 MPa (C1). The decreasing order RB > RA > RC indicated that the level of significance of the factors was as follows: G/SS (2.33) > w/s (2.14) > molding pressure (0.06).
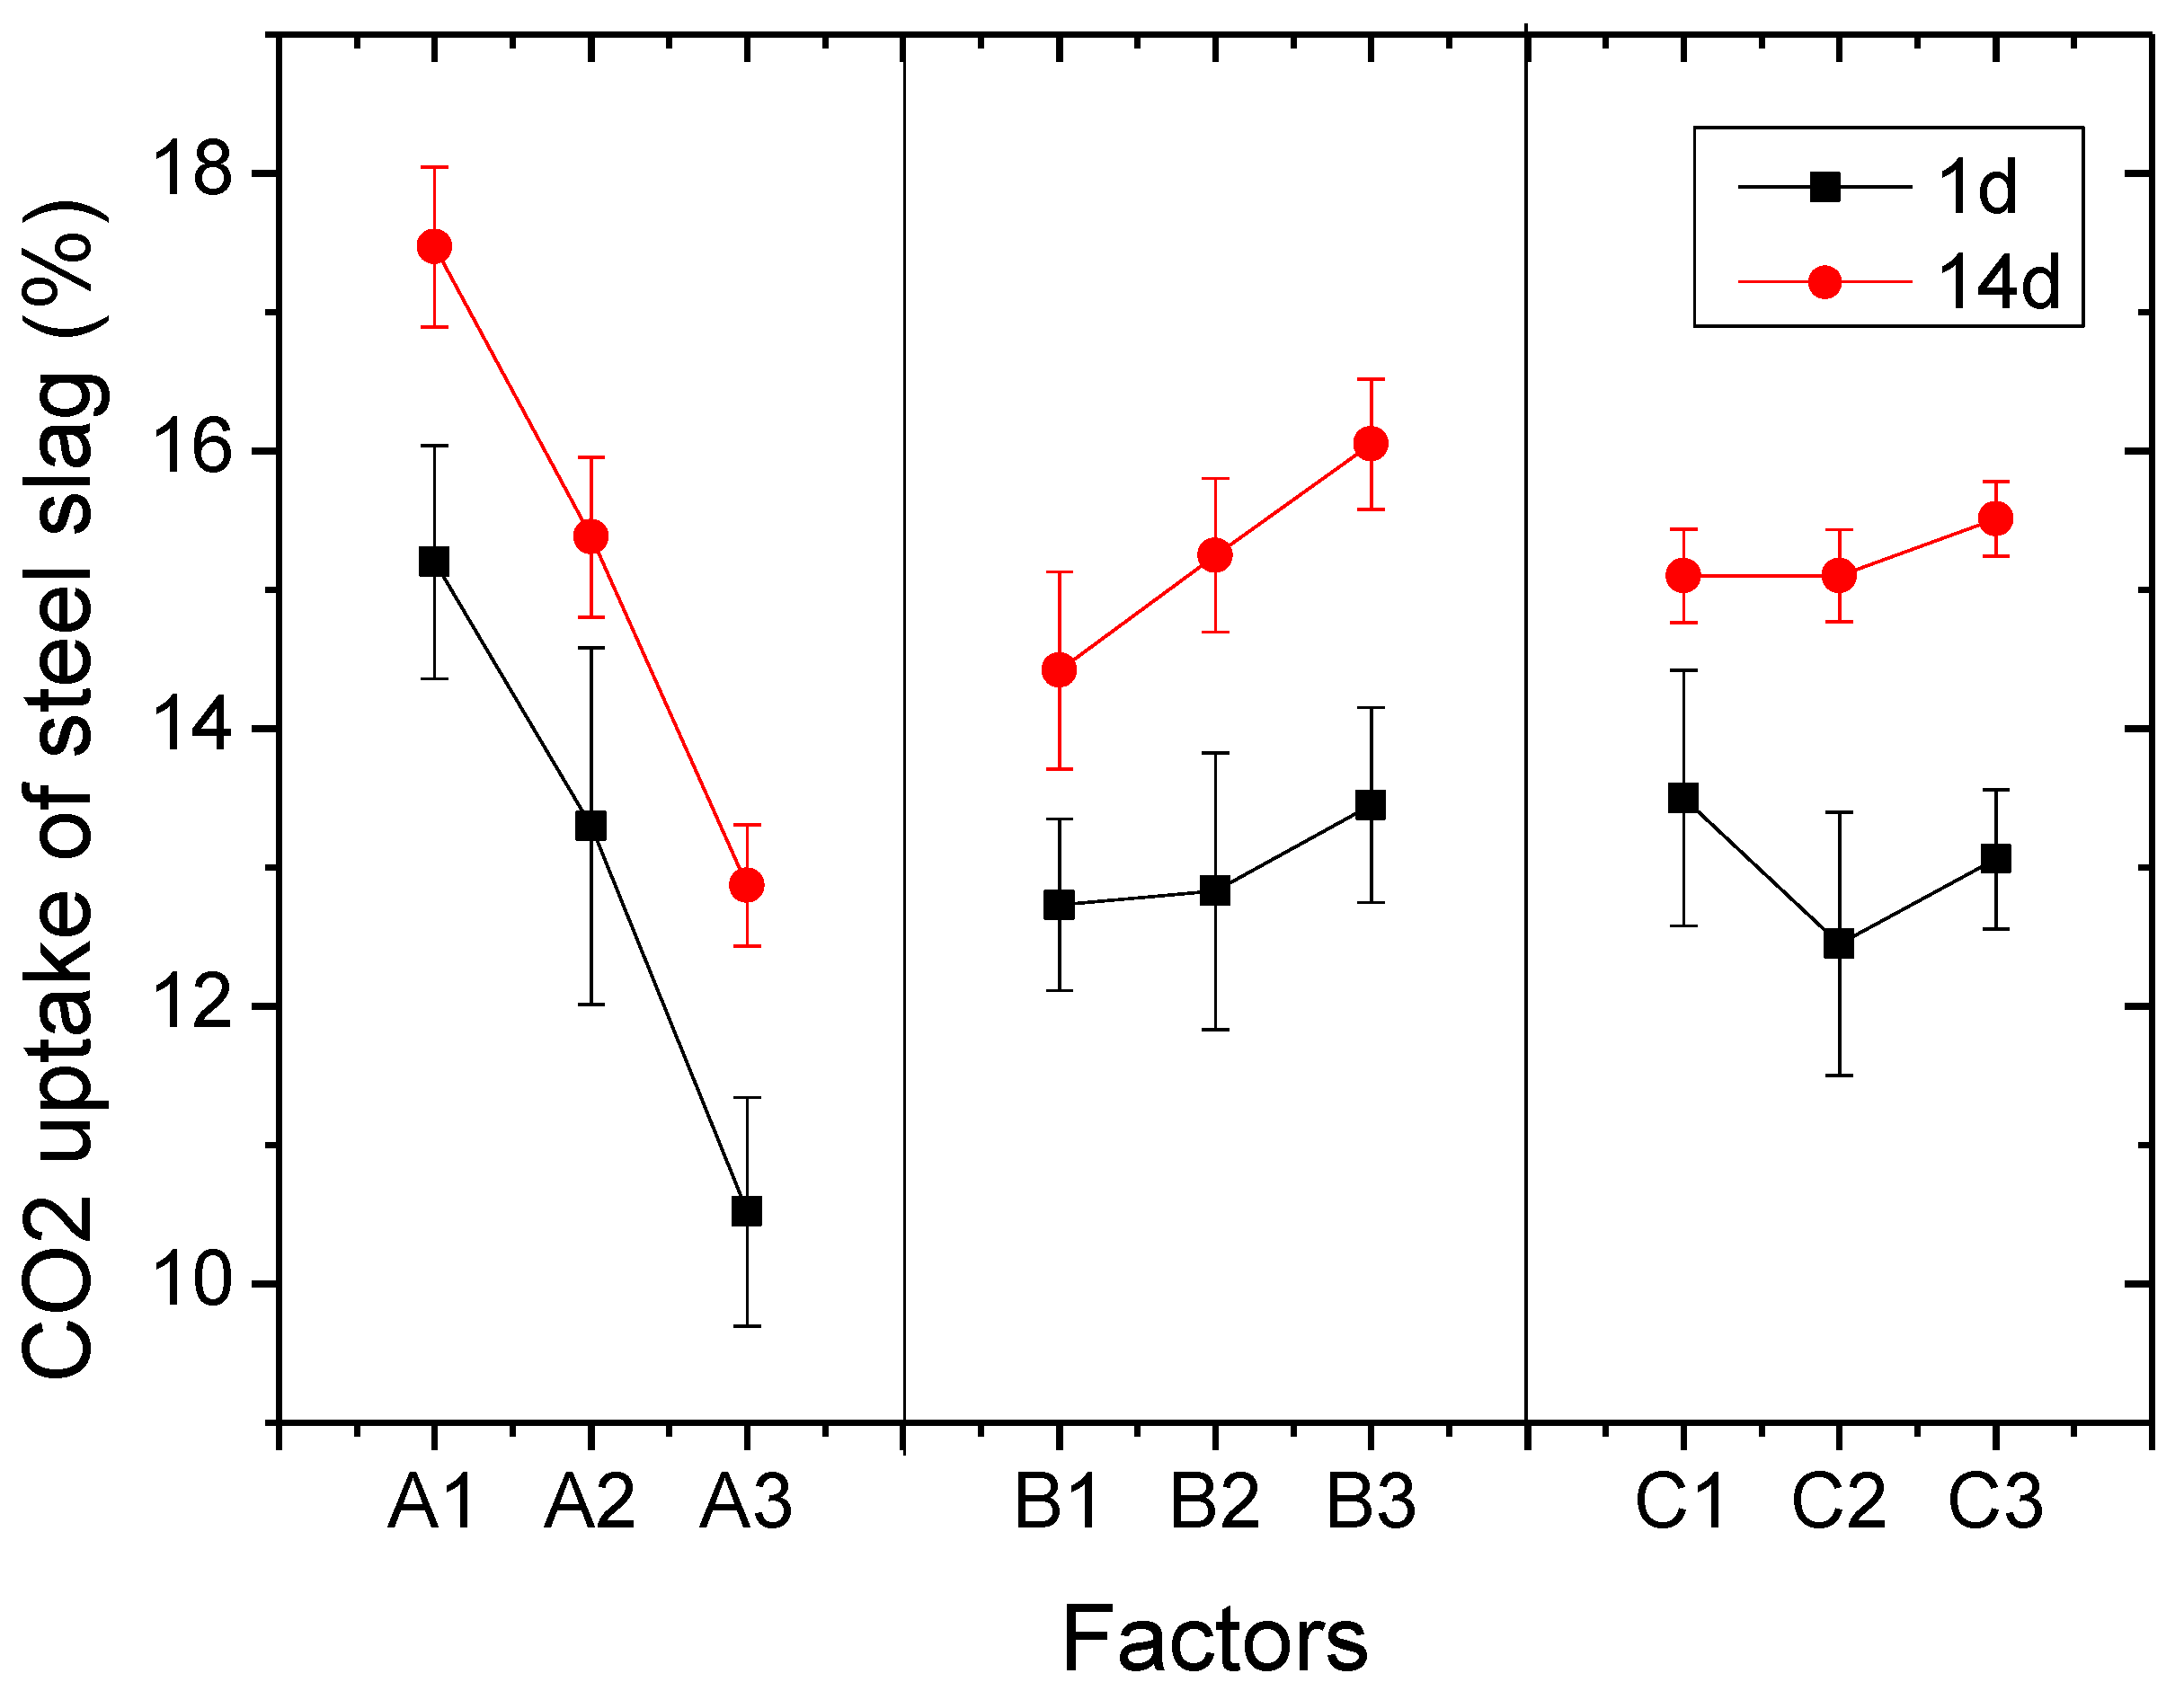
Figure 6 shows the effect curve of three factors on 1 d and 14 d CO2 uptake of steel slag. The 1-day CO2 uptake of steel slag values ranged from 10.21% to 15.57%. The best values for the three factors were as follows: the w/s value was 1:5 (A1), G/SS was 1:2 (B3), and the molding pressure was 3 MPa (C1). The decreasing order RA > RC > RB indicated that the level of significance of the factors was as follows: w/s (4.68) > molding pressure (1.04) > G/SS (0.72).
The 14-day CO2 uptake of steel slag values ranged from 12.03% to 18.85%. The best values for the three factors were as follows: the w/s value was 1:5 (A1), G/SS was 1:2 (B3), and the molding pressure was 9 MPa (C3). The decreasing order RA > RB > RC indicated that the level of significance of the factors was as follows: w/s (4.60) > G/SS (1.63) > molding pressure (0.41).
From the range analyses results, w/s had a significant effect on both UCS and CO2 uptake values. The molding pressure impacted UCS greatly, but had very little influence on CO2 uptake. G/SS has the least impact on UCS, but affected CO2 uptake of steel slag greatly.
3.2. Effect of Gypsum Content
From the orthogonal experiment results, when G/SS was 1:16, the compressive strength reached the highest values. The higher the gypsum content, the lower the strength and the CO2 uptake. However, regarding the CO2 uptake of steel slag (i.e., the capture ability of steel slag rather than that of the block), gypsum promoted their CO2 sequestration ability. The authors analyzed the effect of gypsum on steel slag carbonation previously [9], and found that gypsum acted as a catalyst as an aspect of CO2 capture. The main function of gypsum is to stimulate the activity of calcium aluminum minerals, such as mayenite (C12A7), to initiate a hydration reaction to form ettringite (C3A·3CaSO4·32H2O), which is carbonated easily to produce monocarboaluminate (C3A·CaCO3·11H2O) and gypsum. The ettringite formed at the beginning of curing helps to intertwine with C-S-H gels and enhance the strength. This is why a small amount of gypsum is required to reach optimum strength.
The hydration and carbonation mechanism of main minerals in steel slag can be explained by the following chemical reactions:
C2S + H2O → C-S-H + Ca(OH)2
C3S + H2O → C-S-H + Ca(OH)2
Ca(OH)2 + CO2 → CaCO3 + H2O
MgO + CO2 → MgCO3
C-S-H + CO2 → CaCO3 + SiO2·xH2O
C12A7 + CaSO4·2H2O + Ca(OH)2 + H2O → C3A·3CaSO4·32H2O
C3A·3CaSO4·32H2O + CO2 → CaCO3 + CaSO4·2H2O + Al(OH)3 + H2O
C3A·3CaSO4·32H2O + CaCO3 → C3A·CaCO3·11H2O + CaSO4·2H2O + H2O
3.3. Effect of Molding Pressure and Curing Durations
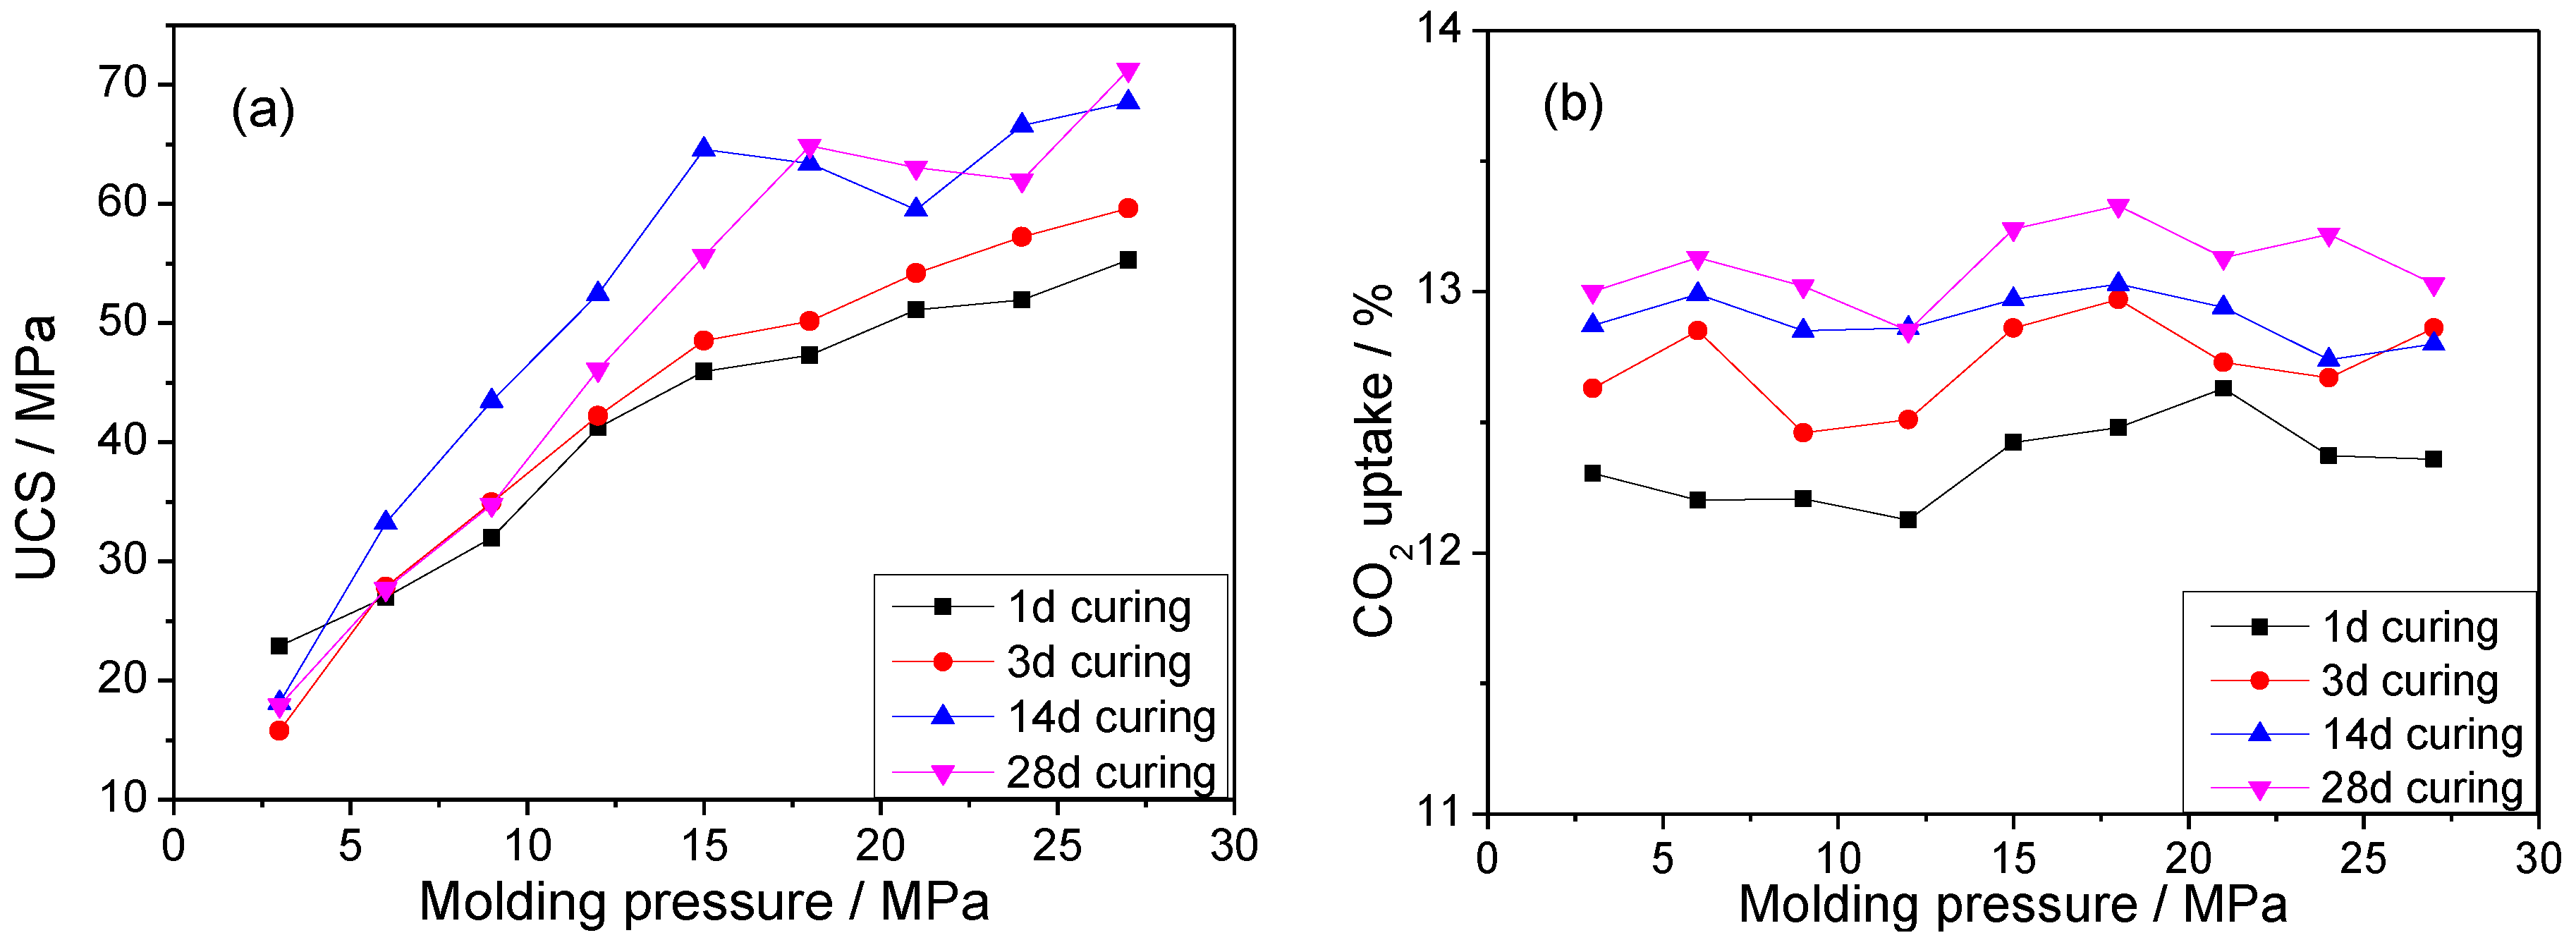
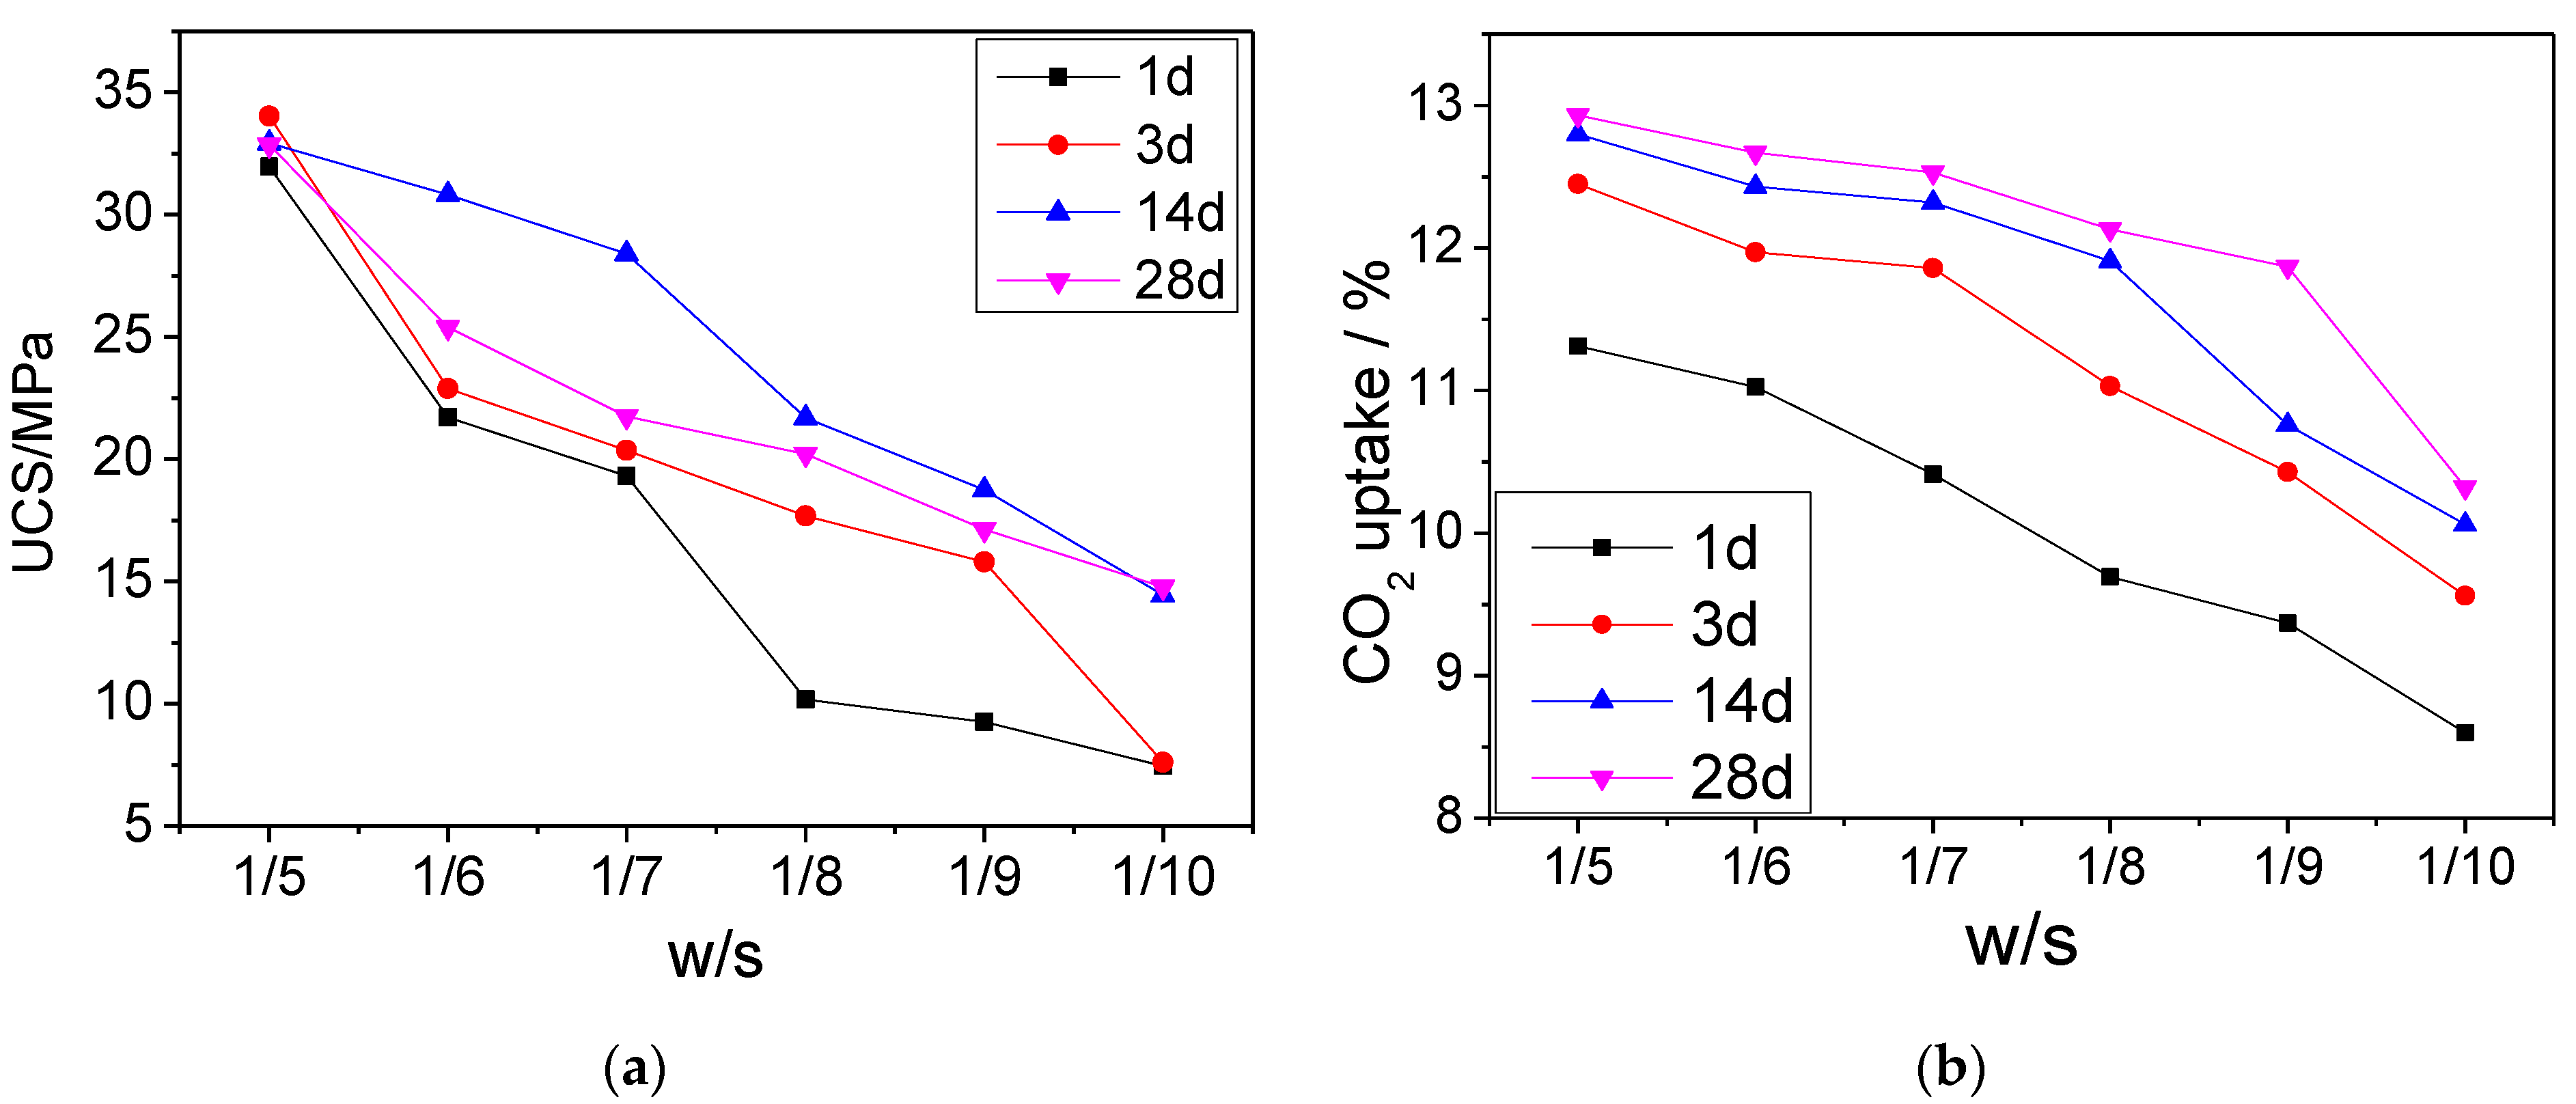
To determine the effect of molding pressure on the UCS and CO2 uptake of specimens, G/SS (1:16) and w/s (1:5) were controlled, but the molding pressure was varied from 3 to 27 MPa. The results are shown in Figure 7a,b. As seen in Figure 7a, UCS increased stably with increased molding pressure. From 1 to 14 days of curing, the UCS increased for most of the samples. In contrast, from 14 to 28 days of curing, the UCS of some samples, especially those with high molding pressure, dropped to some extent. This result was in agreement with the UCS result in the orthogonal experiment (Table 3). What we need to notice is that the increase from 1 to 28 days was not significant. This means that in some circumstances, to save time, 1 day of carbonation curing is enough. For samples with a 27 MPa molding pressure, the UCS was around 55 MPa after 1 day of carbonation curing. This strength is ideal in high-strength construction materials.
The CO2 uptake of the samples cured for 1 day did not show a clear change with molding pressure. This result proves that high molding pressure (i.e., high density and low pore volume in the microstructure) almost did not block CO2 from transferring from the air into the block’s core. In the experiment, when the molding pressure was 27 MPa or greater, water began squeezing out of the block, which meant that water saturation reached 100% at this point.
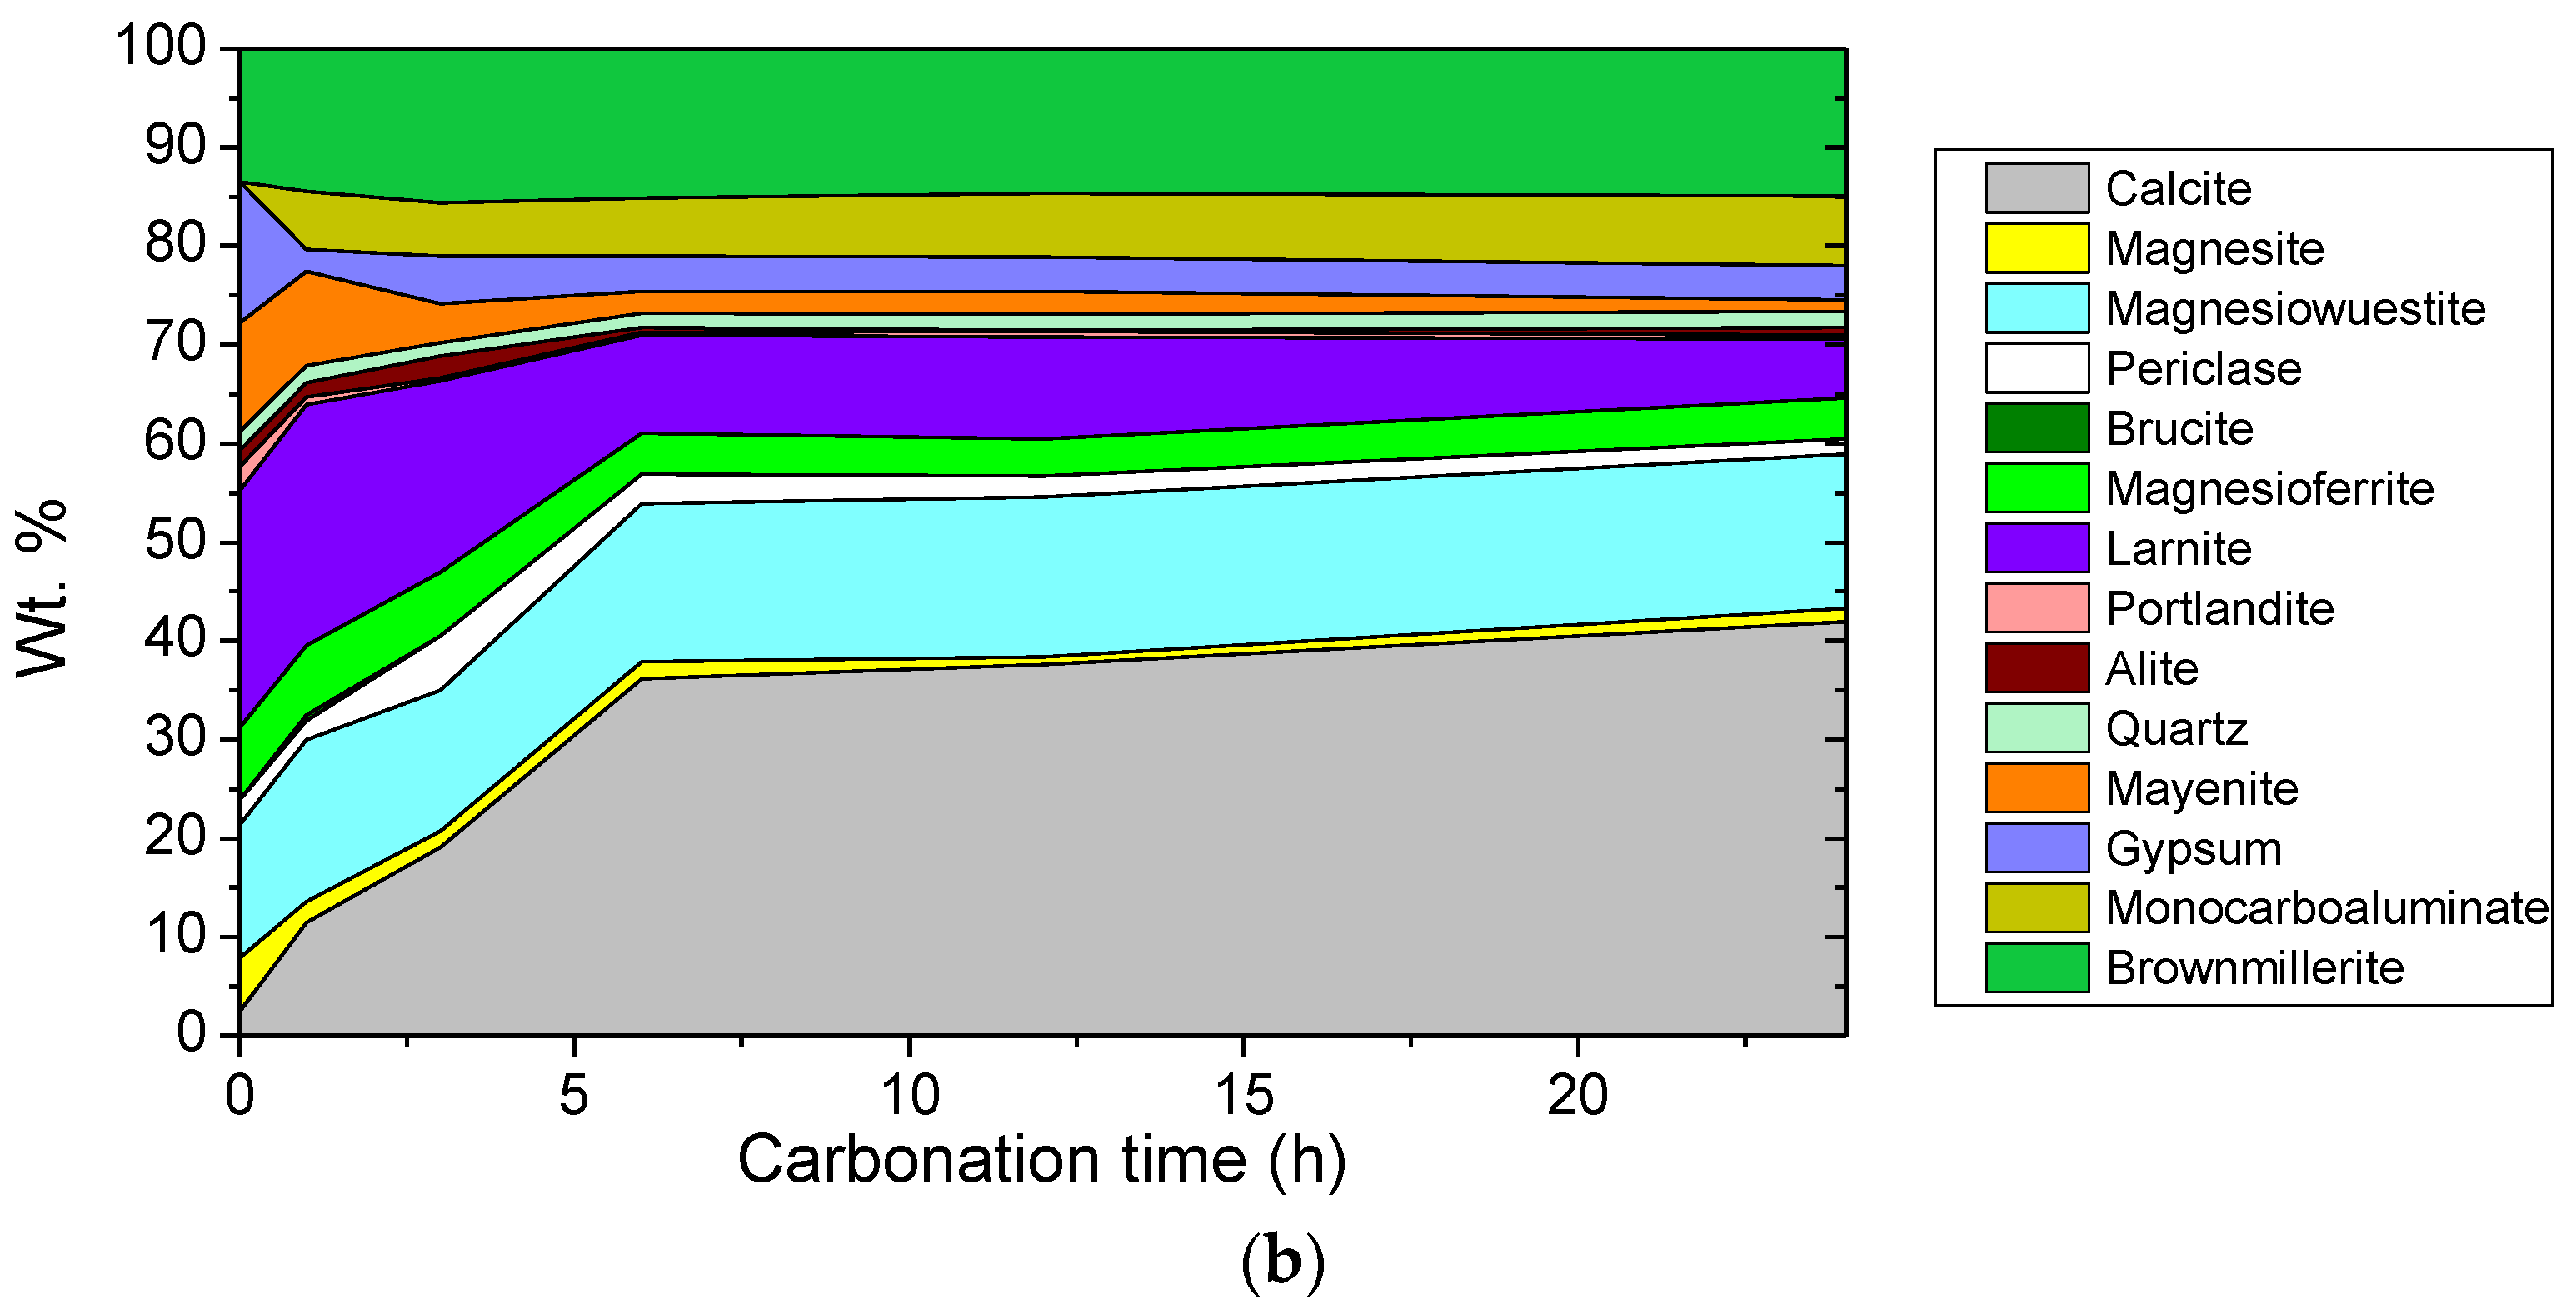
Since 1 d carbonation curing almost reached the plateau, effects of short-term curing time on UCS and CO2 uptake of 27 MPa molding pressure samples were investigated, with results shown in Figure 8a. It is clear that UCS increased gradually with curing time, while CO2 uptake increased significantly before 6 h curing, after which point the value almost remained stable. Semi-QXRD results in Figure 8b also show that the amount of the main carbonation product calcite in samples increased with time before 6 h, and the value almost plateaued after 6 h, which was in line with the CO2 uptake results. Figure 8b also shows a fall in the amount of larnite, mayenite, portlandite, alite, and gypsum, proving their high carbonation activity, while brownmillerite, magnesiferrite, and magnesiowuestite remained stable in the mass percentage, corresponding to their low reactivity. Larnite, the main carbonation feedstock, still existed after 24 h of carbonation curing. This might be attributed to the participation of carbonates at the surface of the calcium silicate particles, blocking the CO2 diffusion. The QXRD Rietveld method results with different carbonation durations are shown in Figure S2. The R-values for the Rietveld ranged from 5.00 to 5.30, indicating high reliability of the results.
3.3.1. FTIR Analyses on Samples with Different Molding Pressures and Curing Durations
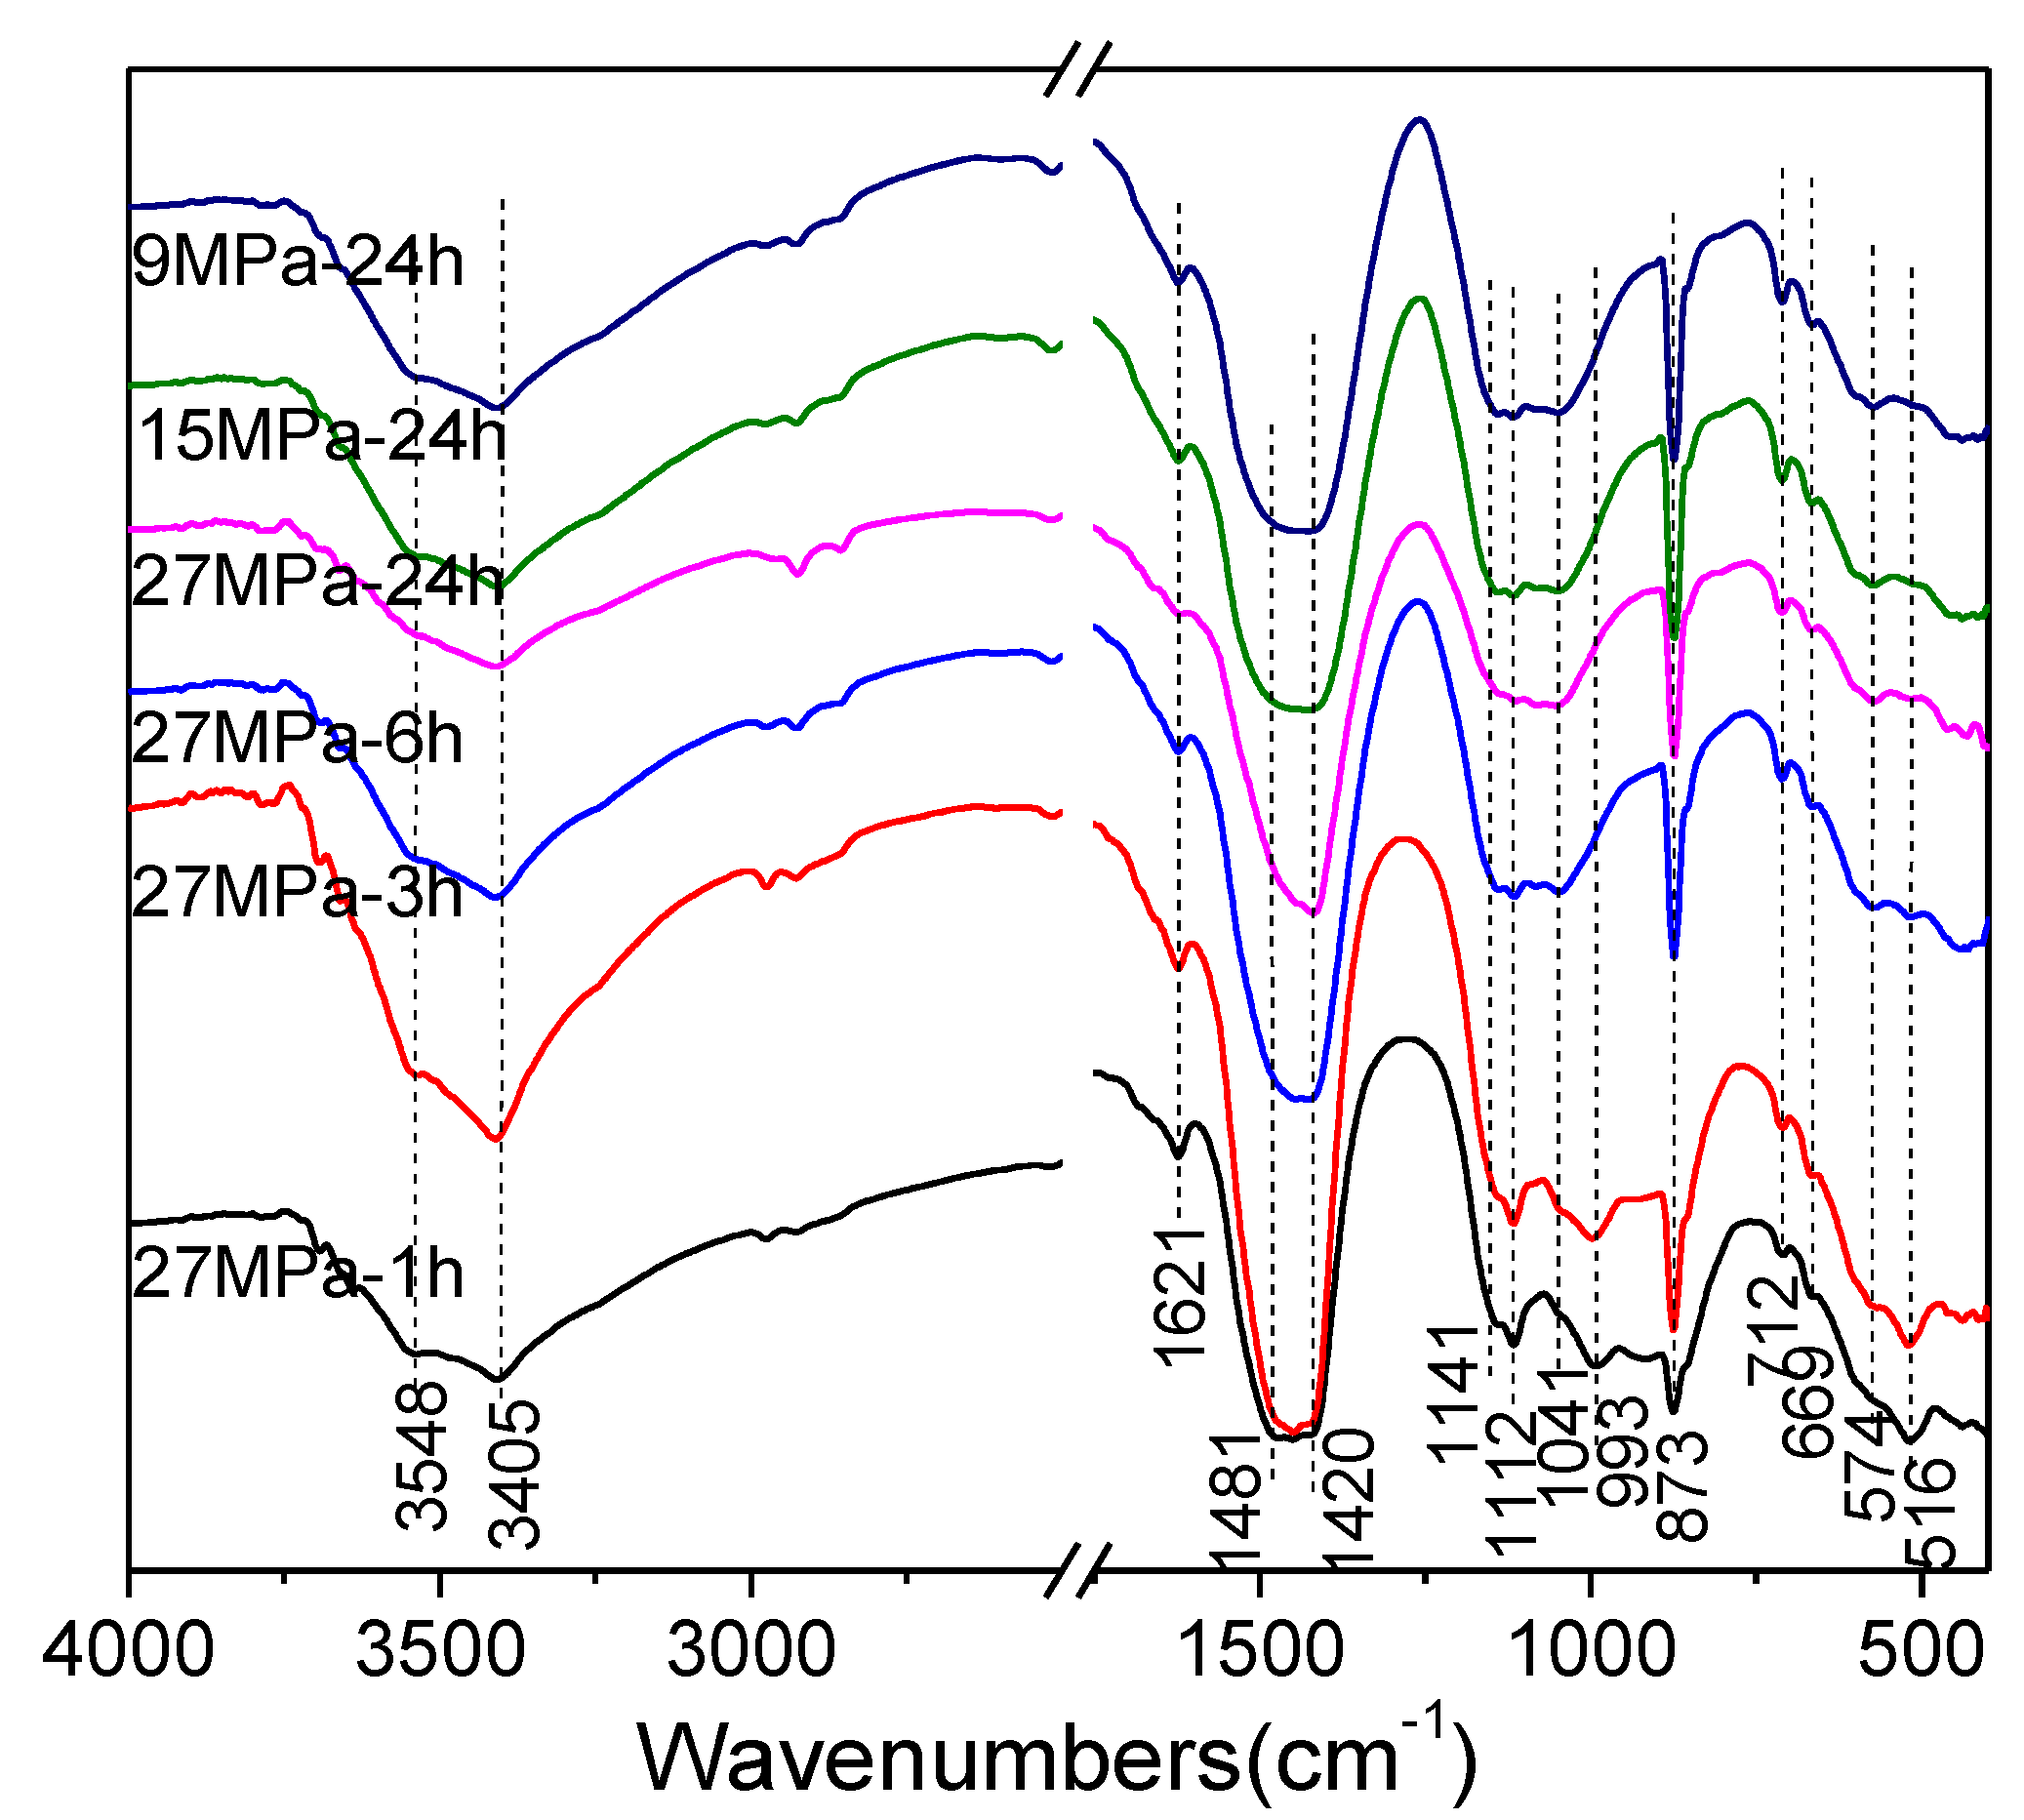
Figure 9 shows the FTIR analyses of samples with different molding pressures and curing times. From the figure, no clear differences were found between the samples with different molding pressures carbonated for 24 h. This indicated that molding pressure had little influence on carbonation.
The absorption bands from 3405 to 3548 cm−1 were the stretching vibration bands of O–H in water molecules, and the 1621 cm−1 band was due to the bending vibration of it. The appearance of the broad stretching band resulted from the existence of hydrogen bonds with a wide range of strengths [9]. The intensity of the O–H bond absorption bands was higher in low-molding-pressure samples, indicating that high molding pressure may lead to fewer hydration products in this system. This is because when the molding pressure was 27 MPa, some of the water was squeezed out, which reduced the amount of water for hydration. For the 27 MPa molding pressure samples under different curing times, the sample cured for 3 h had the highest amount of hydration products. This was because some of the hydration products were carbonated in the later stages.
The “shoulder” at 3548 cm−1 may correspond to the water molecules in the gypsum [25]. The 1420–1480 cm−1 bands were the symmetric stretching vibration bands of C–O. The peaks at 873 and 712 cm−1 were due to the bending vibration of CO32−. It can be seen that samples with different molding pressures had almost the same intensity in this range of curves. This indicated that the molding pressure had little effect on the formation of carbonized products, which was in line with the CO2 uptake results. Furthermore, Figure 9 shows that the amount of carbonation products formed increased gradually with curing time before 6 h curing, while the amounts almost remained unchanged after 6 h.
The 900 to 1200 cm−1 bands were from the asymmetric stretching vibration of Si–O [26]. Particularly, the 993 and 516 cm−1 peaks were the asymmetric stretching and bending vibration peaks of Si–O–Si in the C-S-H gel, respectively. In addition, the out-of-plane skeletal vibration of the Si–O bond contributed to the broad bands at around 516 cm−1. It is seen clearly that these characteristic peaks appeared only in 1 h and 3 h samples. When the samples were carbonated for a long duration (6 h or more), the peaks of the C-S-H gel almost disappeared. These results agreed with the fact that C-S-H gels have high carbon reactivity, which means that they are prone to carbonation reactions. For samples with curing times of 6 h or longer, the peaks at 993 and 516 cm−1 disappeared, whereas an absorption band at 1041 cm−1 appeared. This was because of the formation of silica-like products and an increase in the polymerization degree [27].
The 1112 and 1141 cm−1 peaks were characteristic of SO42− [25].
3.3.2. TG–DTG Analyses of Samples with Different Molding Pressures and Curing Durations
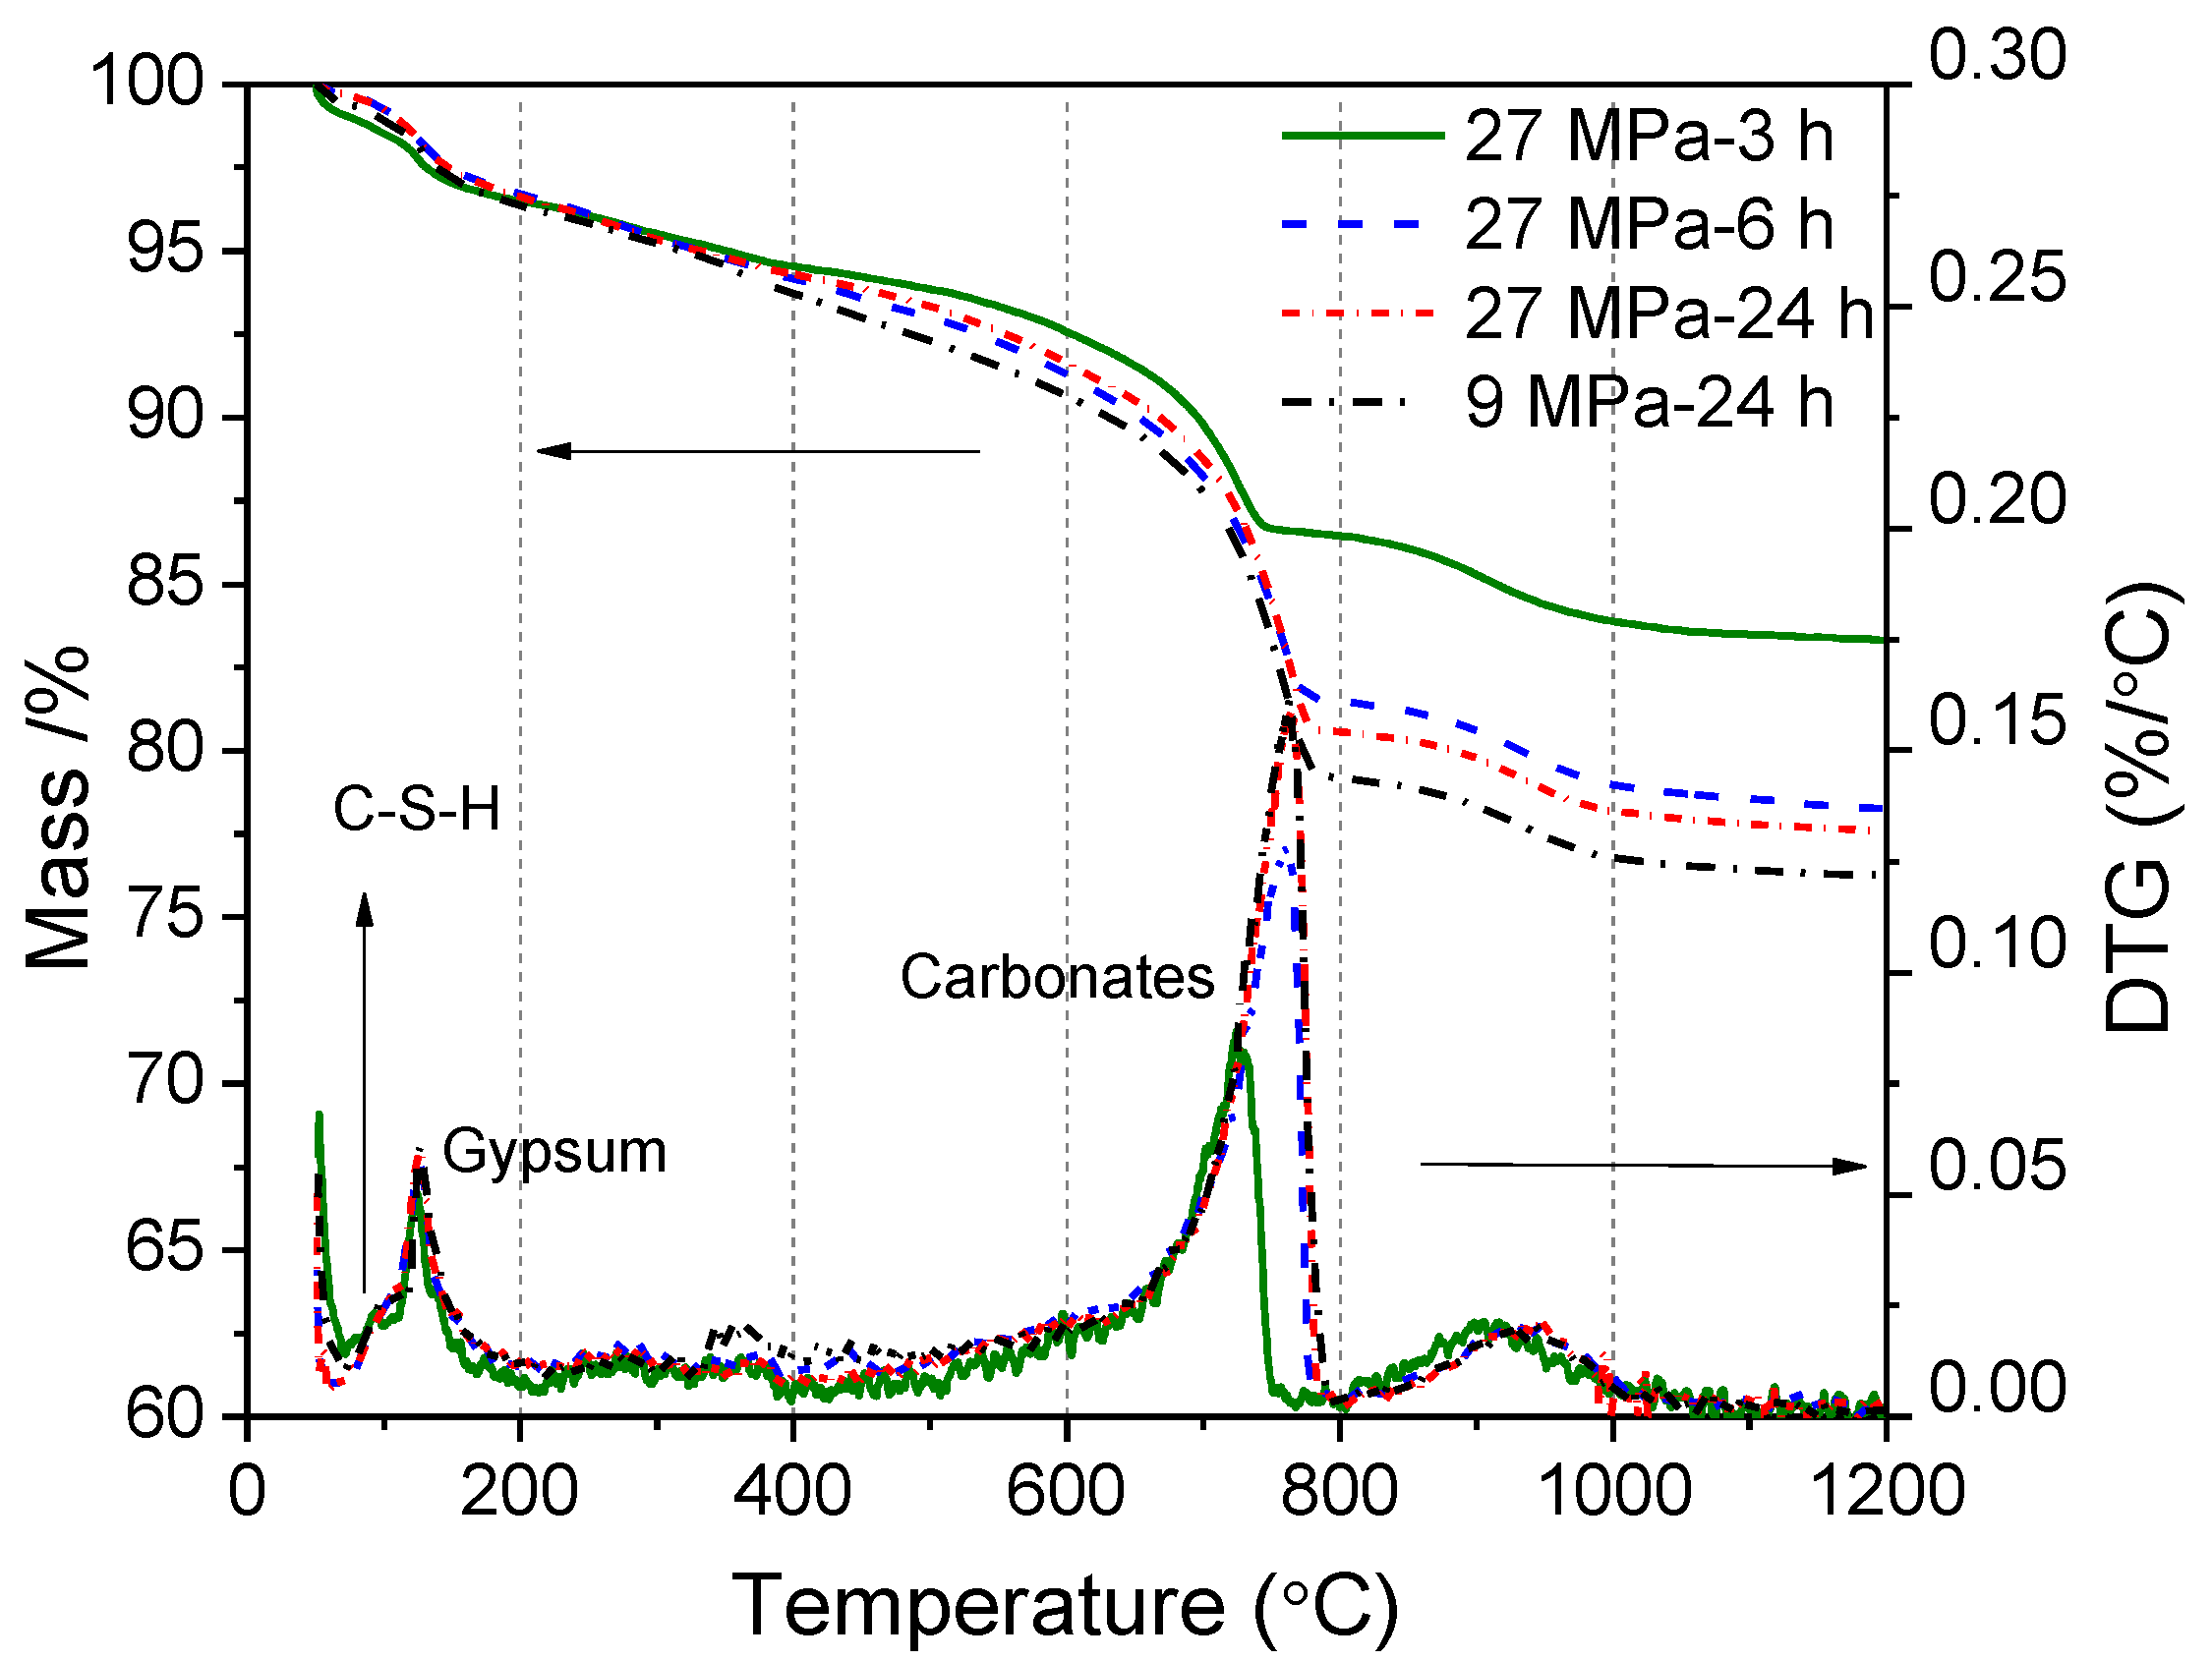
Thermogravimetry–derivative thermogravimetry (TG–DTG) analyses of samples with different molding pressures and curing times are shown in Figure 10. From the TG curves, the mass loss of S5 was greater than that of S12. The figure also shows that the difference between S5 and S12 was mainly in the range of 300–500 °C, where S5 had subtle mass loss peaks, whereas S12 did not. At this temperature, the C-S-H gel began to decompose. From 3 to 24 h of carbonation curing, mass loss increased with curing time. The mass-loss peak in the range of 500–800 °C corresponded to the decarbonation of carbonates. The intensity of the peaks increased with curing time, indicating a continuing process of carbonation reaction. The mass loss around 100 °C was attributed to water loss of hydration products, such as the C-S-H gel. From the DTG curves in Figure 10, 9 MPa-24 h and 27 MPa-24 h had similar amounts of hydration products, and these amounts were greater than those of samples with shorter curing times.
3.3.3. Pore-Size Distribution Analyses of Samples with Different Molding Pressures
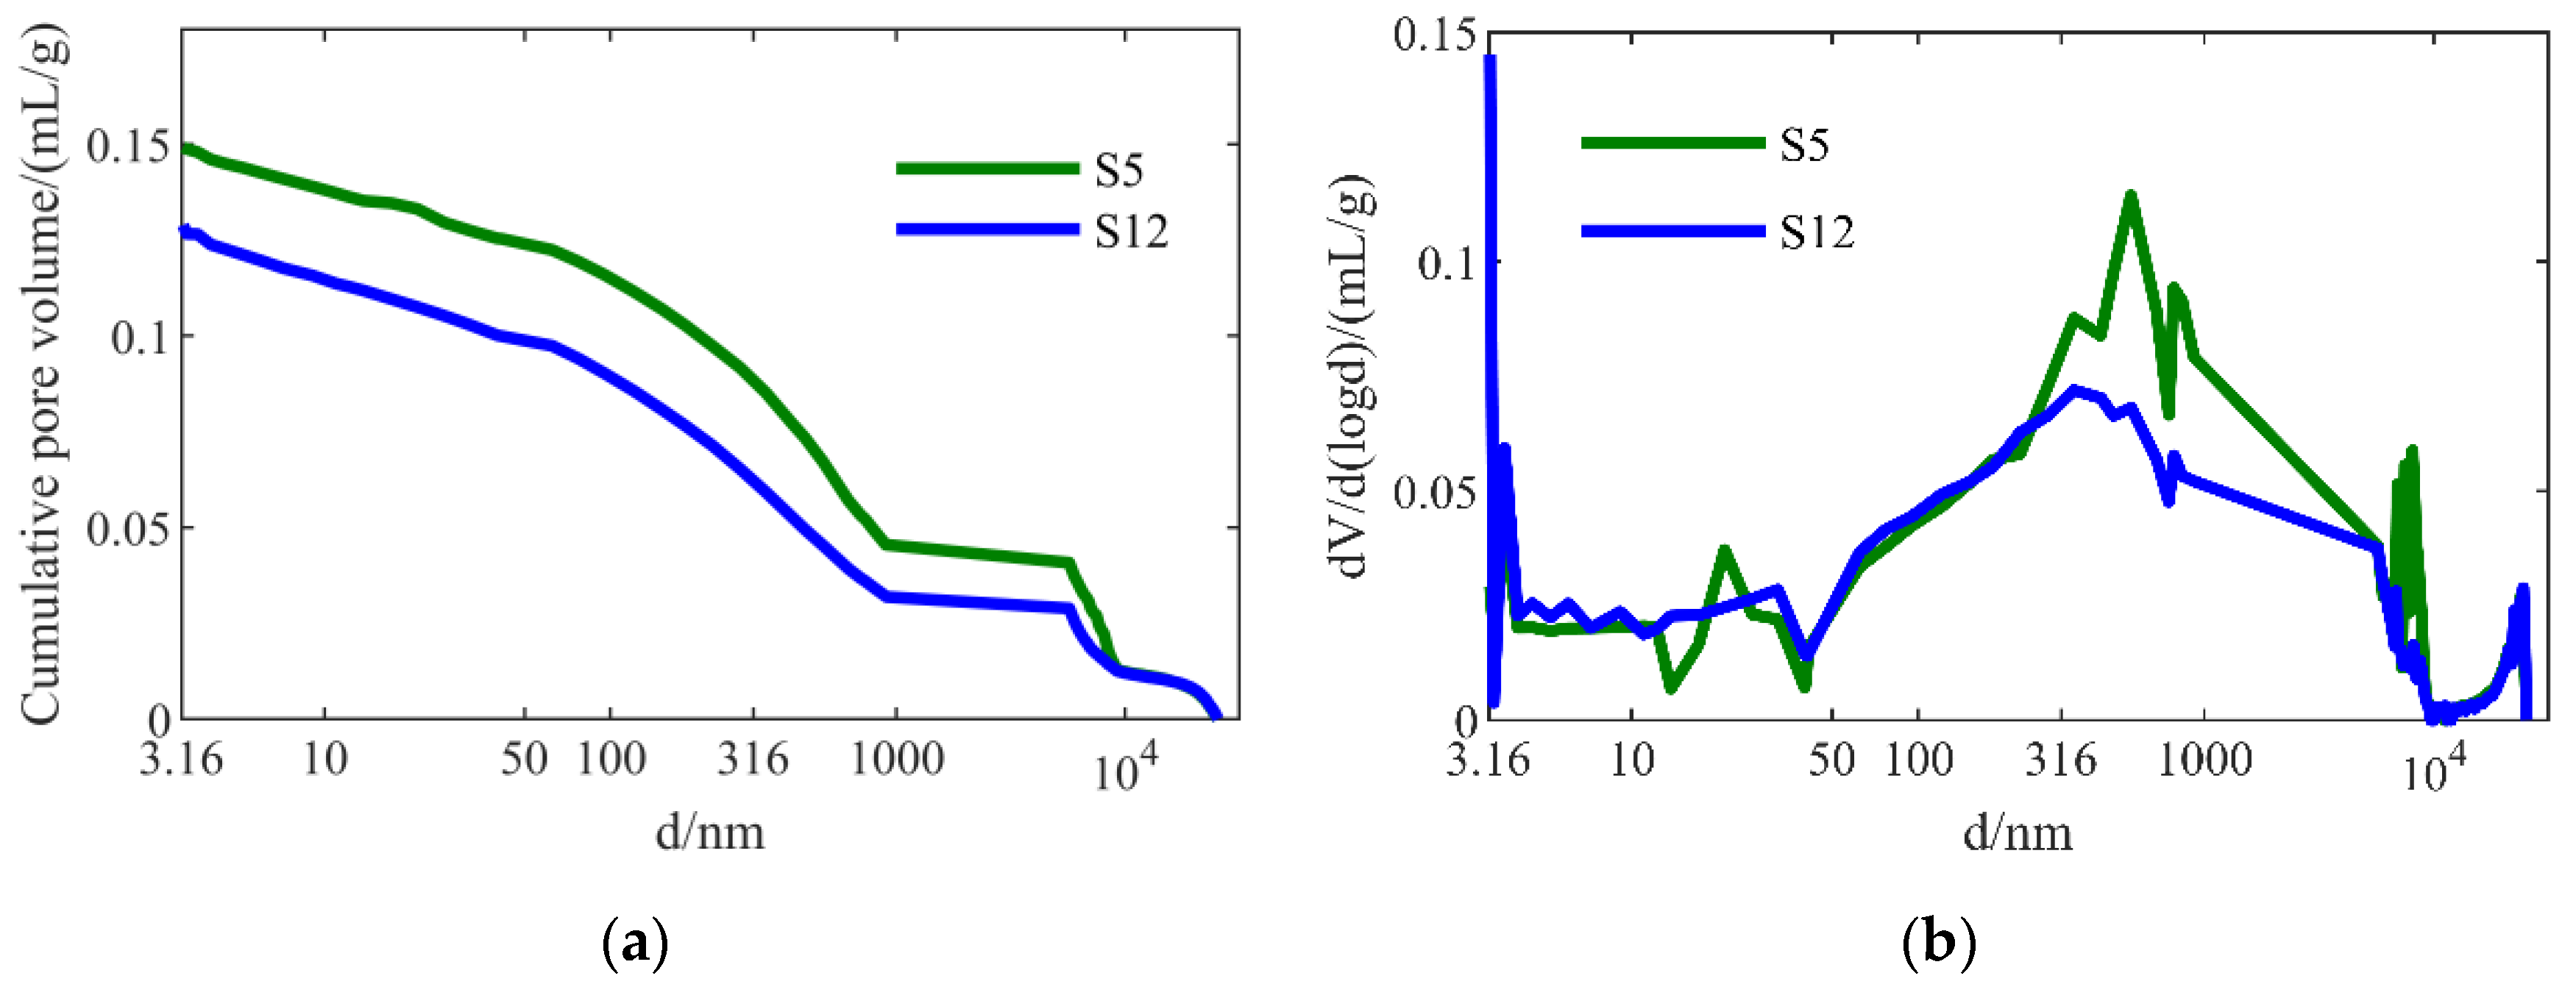
The cumulative pore volume curves and pore-size distribution curves of samples with 9 MPa and 27 MPa molding pressure after 1 day of carbonation curing are shown in Figure 11. The curves prove clearly that samples with higher molding pressure had less pore volume. It is easy to understand that higher molding pressures led to denser structures. As shown in Figure 11b, S12 had more pores smaller than 10 nm and fewer pores between 316 and 10,000 nm. Larger pores are harmful to strength. The 27 MPa molding pressure sample corresponded to not only a lower pore volume, but also smaller pores, which is why it had a higher compressive strength.
3.4. Effects of w/s
3.4.1. Effects of w/s on UCS and CO2 Uptake
An experiment was conducted to investigate the effects of w/s on the strength and CO2 uptake of samples. In this experiment, G/SS and molding pressure were controlled at 1:16 and 9 MPa, respectively. The results are shown in Figure 12. Samples with a higher amount of water (w/s) tended to have higher UCS and higher CO2 uptake. Therefore, the addition of water promoted not only strength enhancement, but also the carbonation reaction process. We also concluded that compared with molding strength, w/s seemed to have a greater effect on the UCS and CO2 uptake. The contribution of water had two aspects. On the one hand, water takes part in chemical reactions. When CO2 transfers into the water, it dissolves into CO32− or HCO3− so that carbonation can occur easily. Water is also a necessary component for hydration reactions. Larnite and alite in steel slag have weak carbon reactivity, but hydration products such as the C-S-H gel and portlandite are carbonated easily. On the other hand, water is an important medium in this system. It promotes the diffusion of ions such as Ca2+, OH−, and CO32−.
3.4.2. Semi-Quantitive XRD Analyses of Samples with Different w/s Values
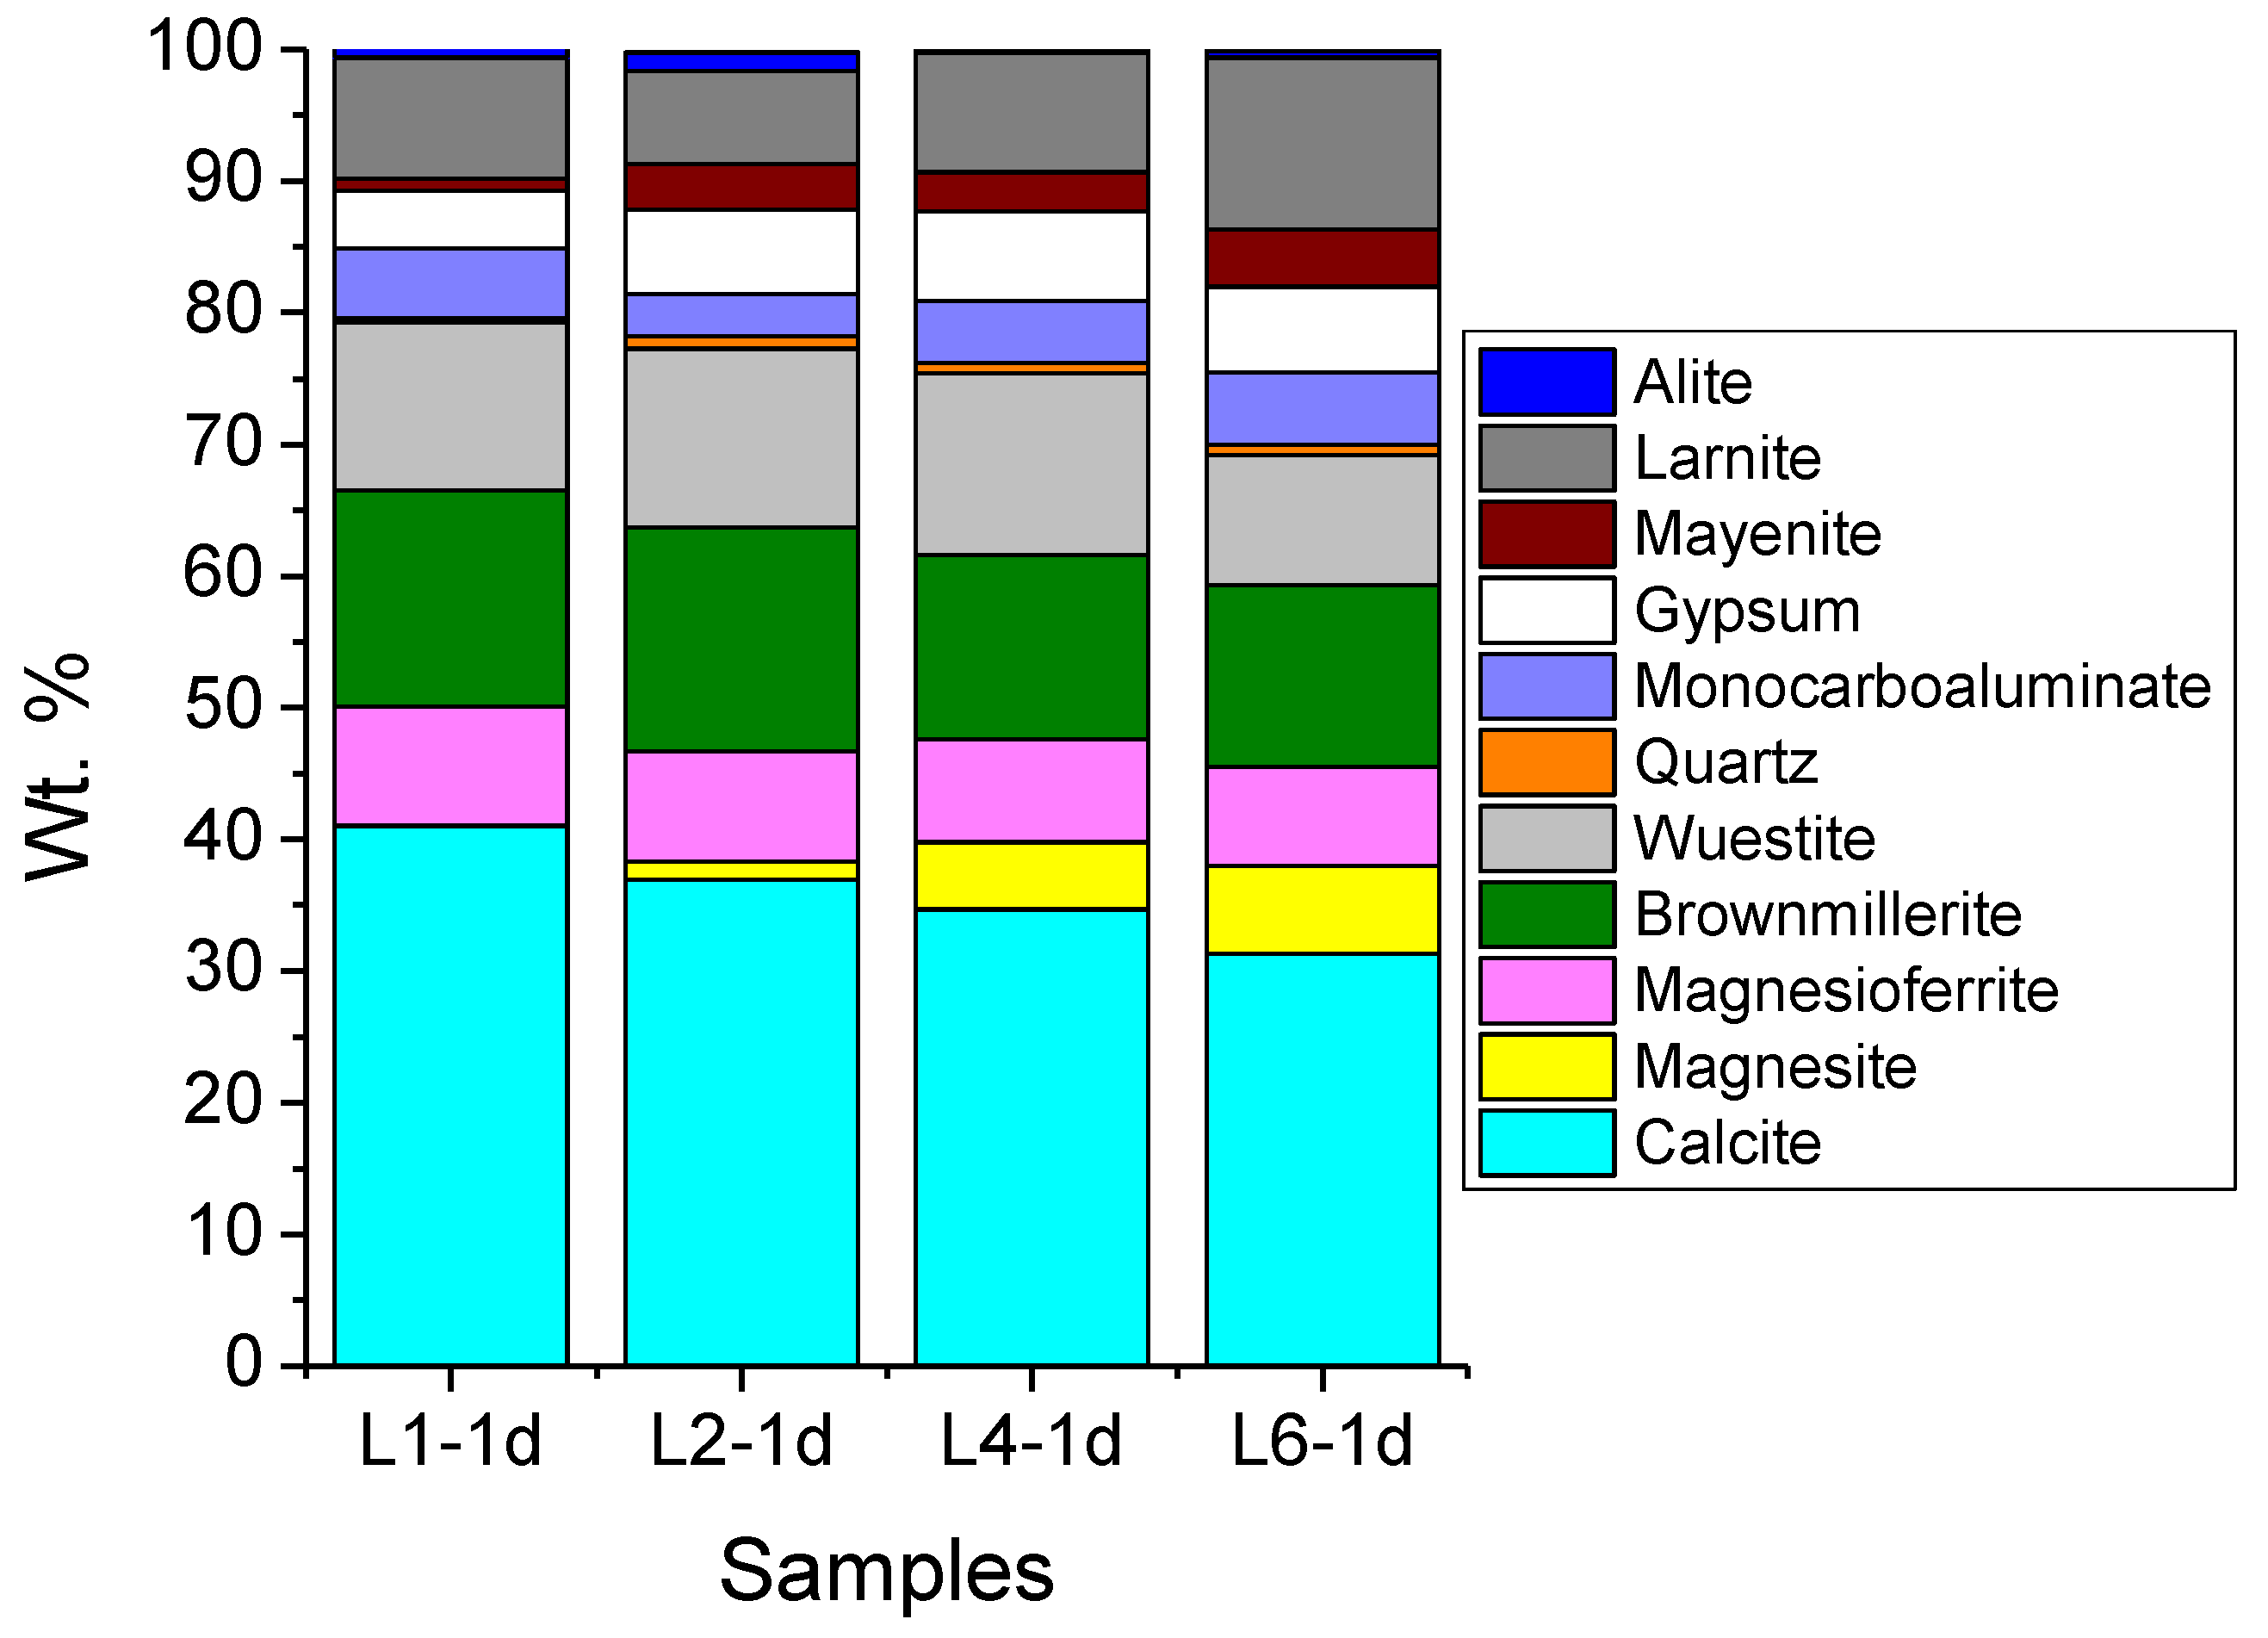
The results of the QXRD Rietveld method for samples with different w/s ratios are shown in Figure S3. The semi-QXRD analyses results given in Figure 13 showed that with an increasing w/s, there was a clear increase in calcite amount and a clear decrease in larnite, mayenite, and gypsum amounts. The DTG curves showed a similar temperature range of mass loss, proving that under different w/s, the samples’ hydration and carbonation products were generally similar. However, the amounts of the products changed with different w/s. Higher w/s corresponded to higher amounts of carbonates such as calcite and monocarboaluminate. It also corresponded to less amounts of larnite, mayenite, and gypsum, in general. The QXRD clearly proved that water played an important role in the carbonation of steel slag.
3.4.3. TG–DTG Analyses of Samples with Different w/s Values
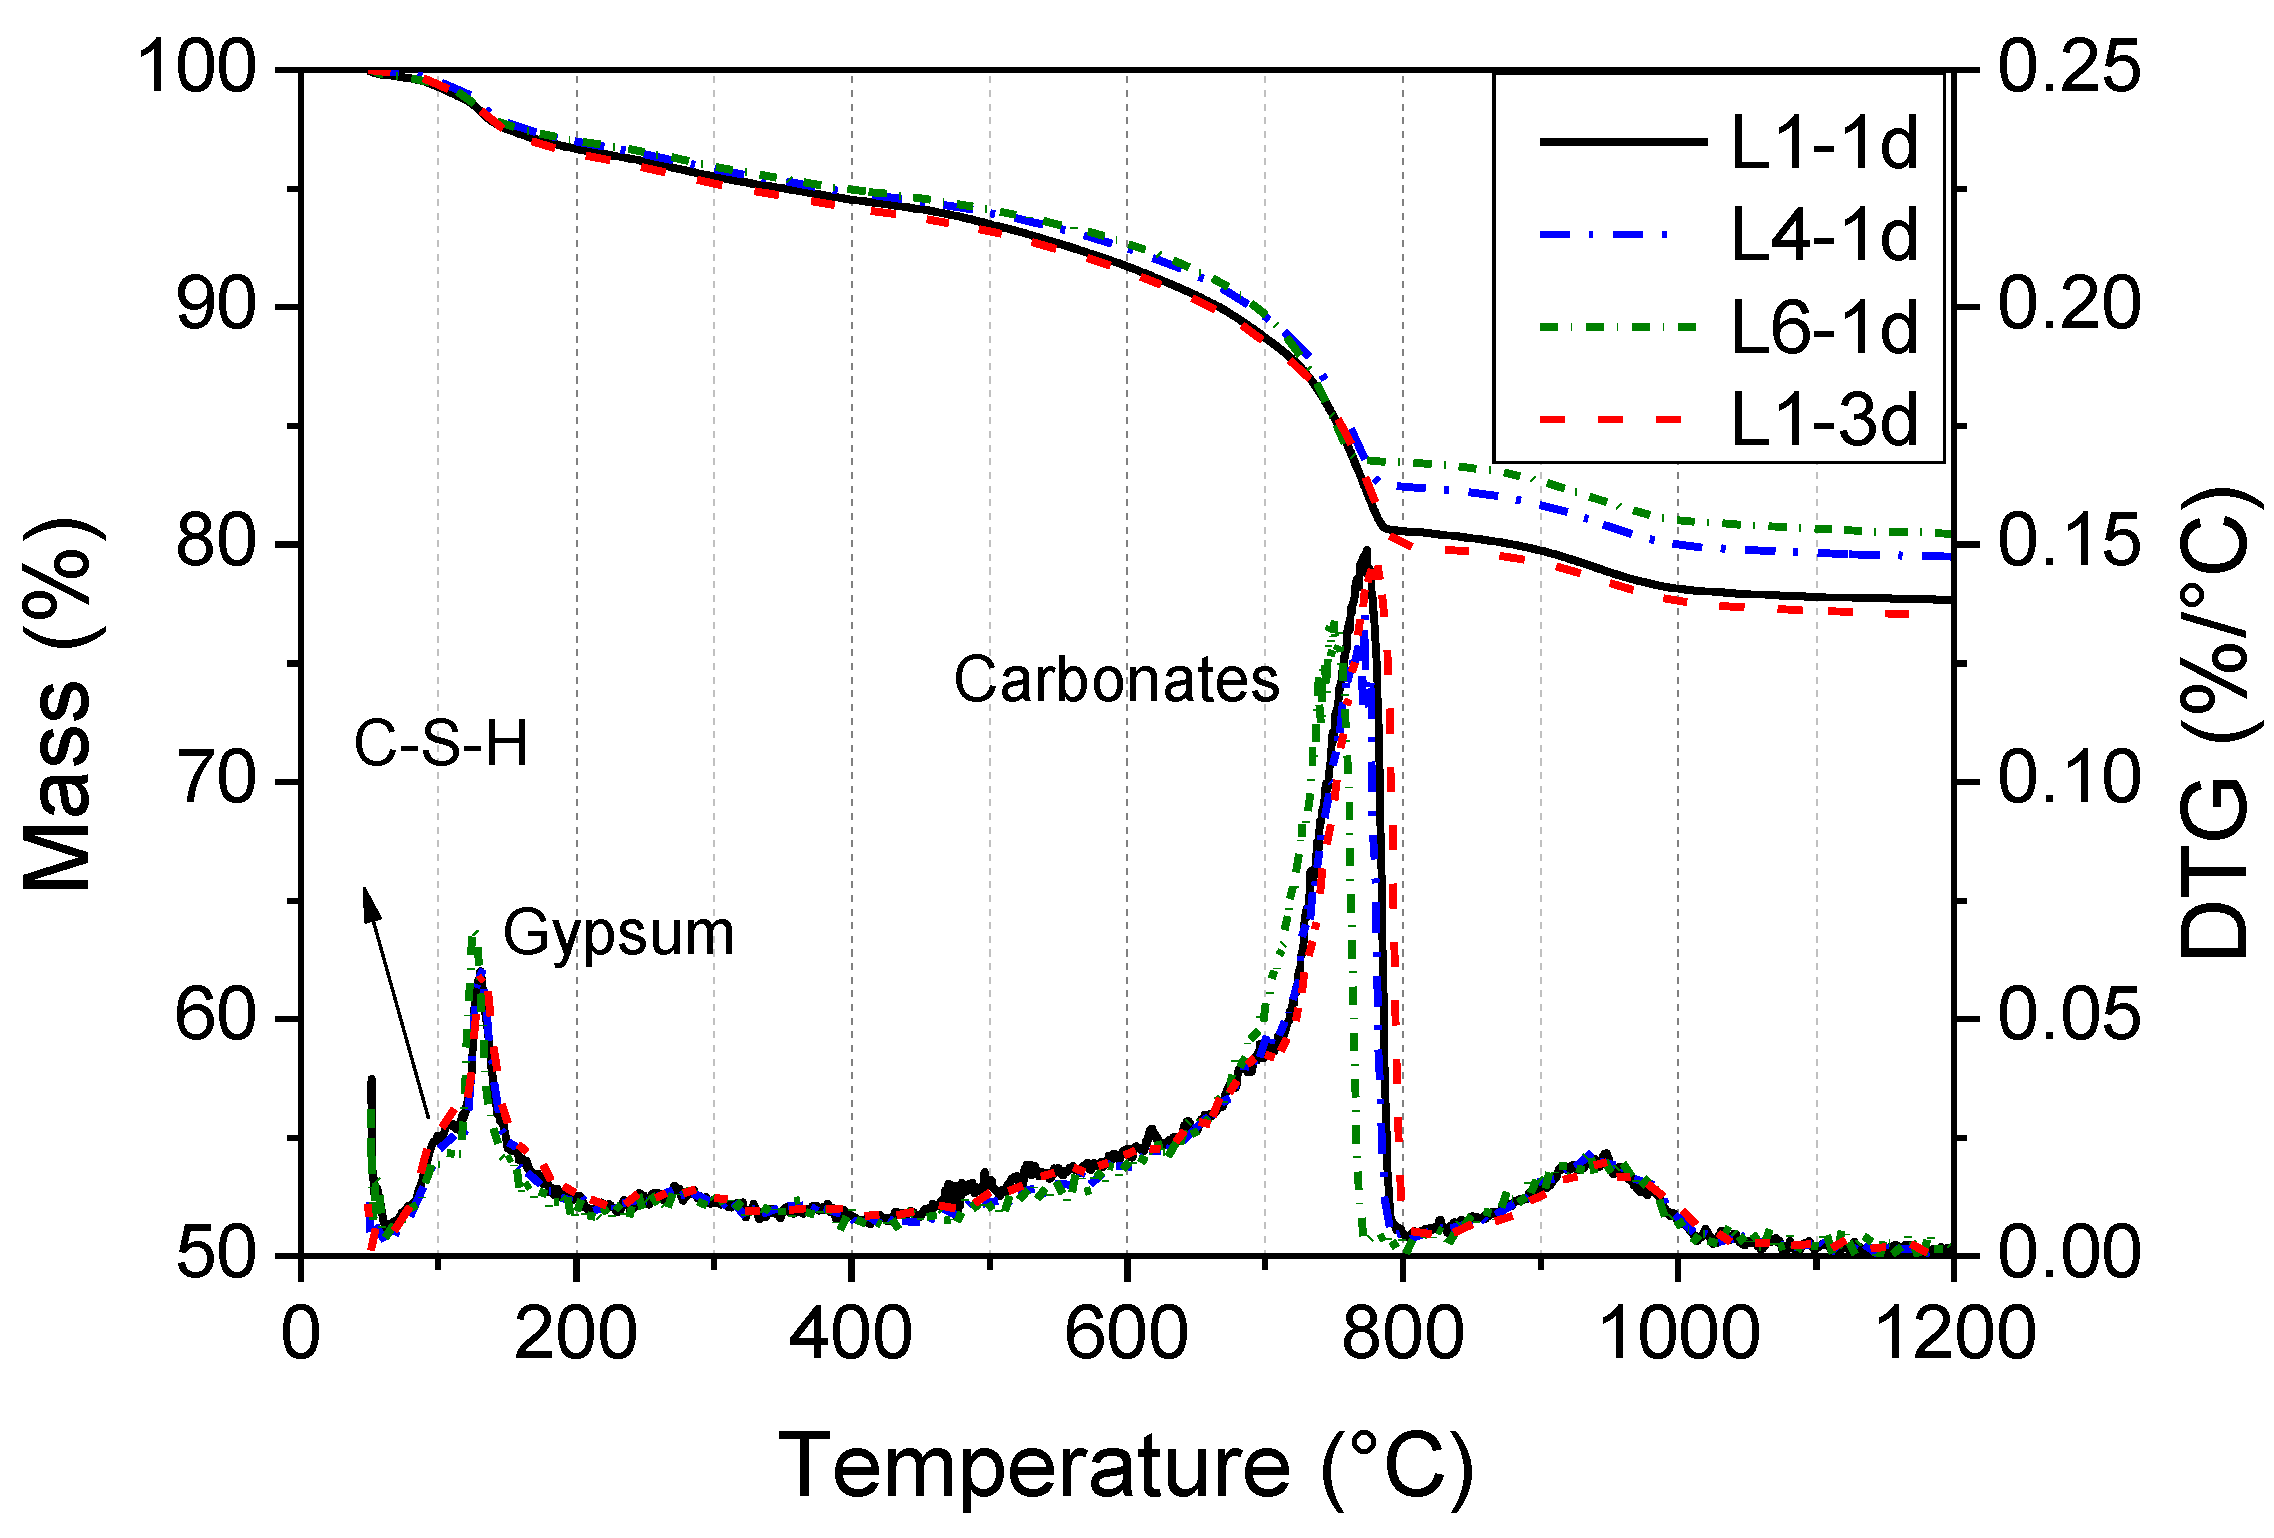
The results of the TG–DTG analyses in Figure 14 show the tendency of more mass loss with increased w/s. The DTG curves show a similar temperature range of mass loss, proving that the samples’ hydration and carbonation products with different w/s were generally similar. The L6-1 d sample, which had the least water, also had the least mass loss at around 100 °C, where the C-S-H gel lost water. For L1-1 d and L1-3 d, more mass loss was seen at this temperature range. This proves that water promoted hydration reactions. Gypsum decomposes at 120 °C. L6-1 d had the most mass loss at this temperature, which means that the reaction extent of gypsum was lower than those of other samples, which had more water in the matrix. From 500 °C to 800 °C, the carbonate decomposition intensity had a trend similar to that of hydration products. Therefore, the TG results prove the role of water in promoting hydration and carbonation—the UCS and CO2 uptake of the samples were promoted with the addition of water.
3.4.4. XPS Analyses of Samples with Different w/s Ratios
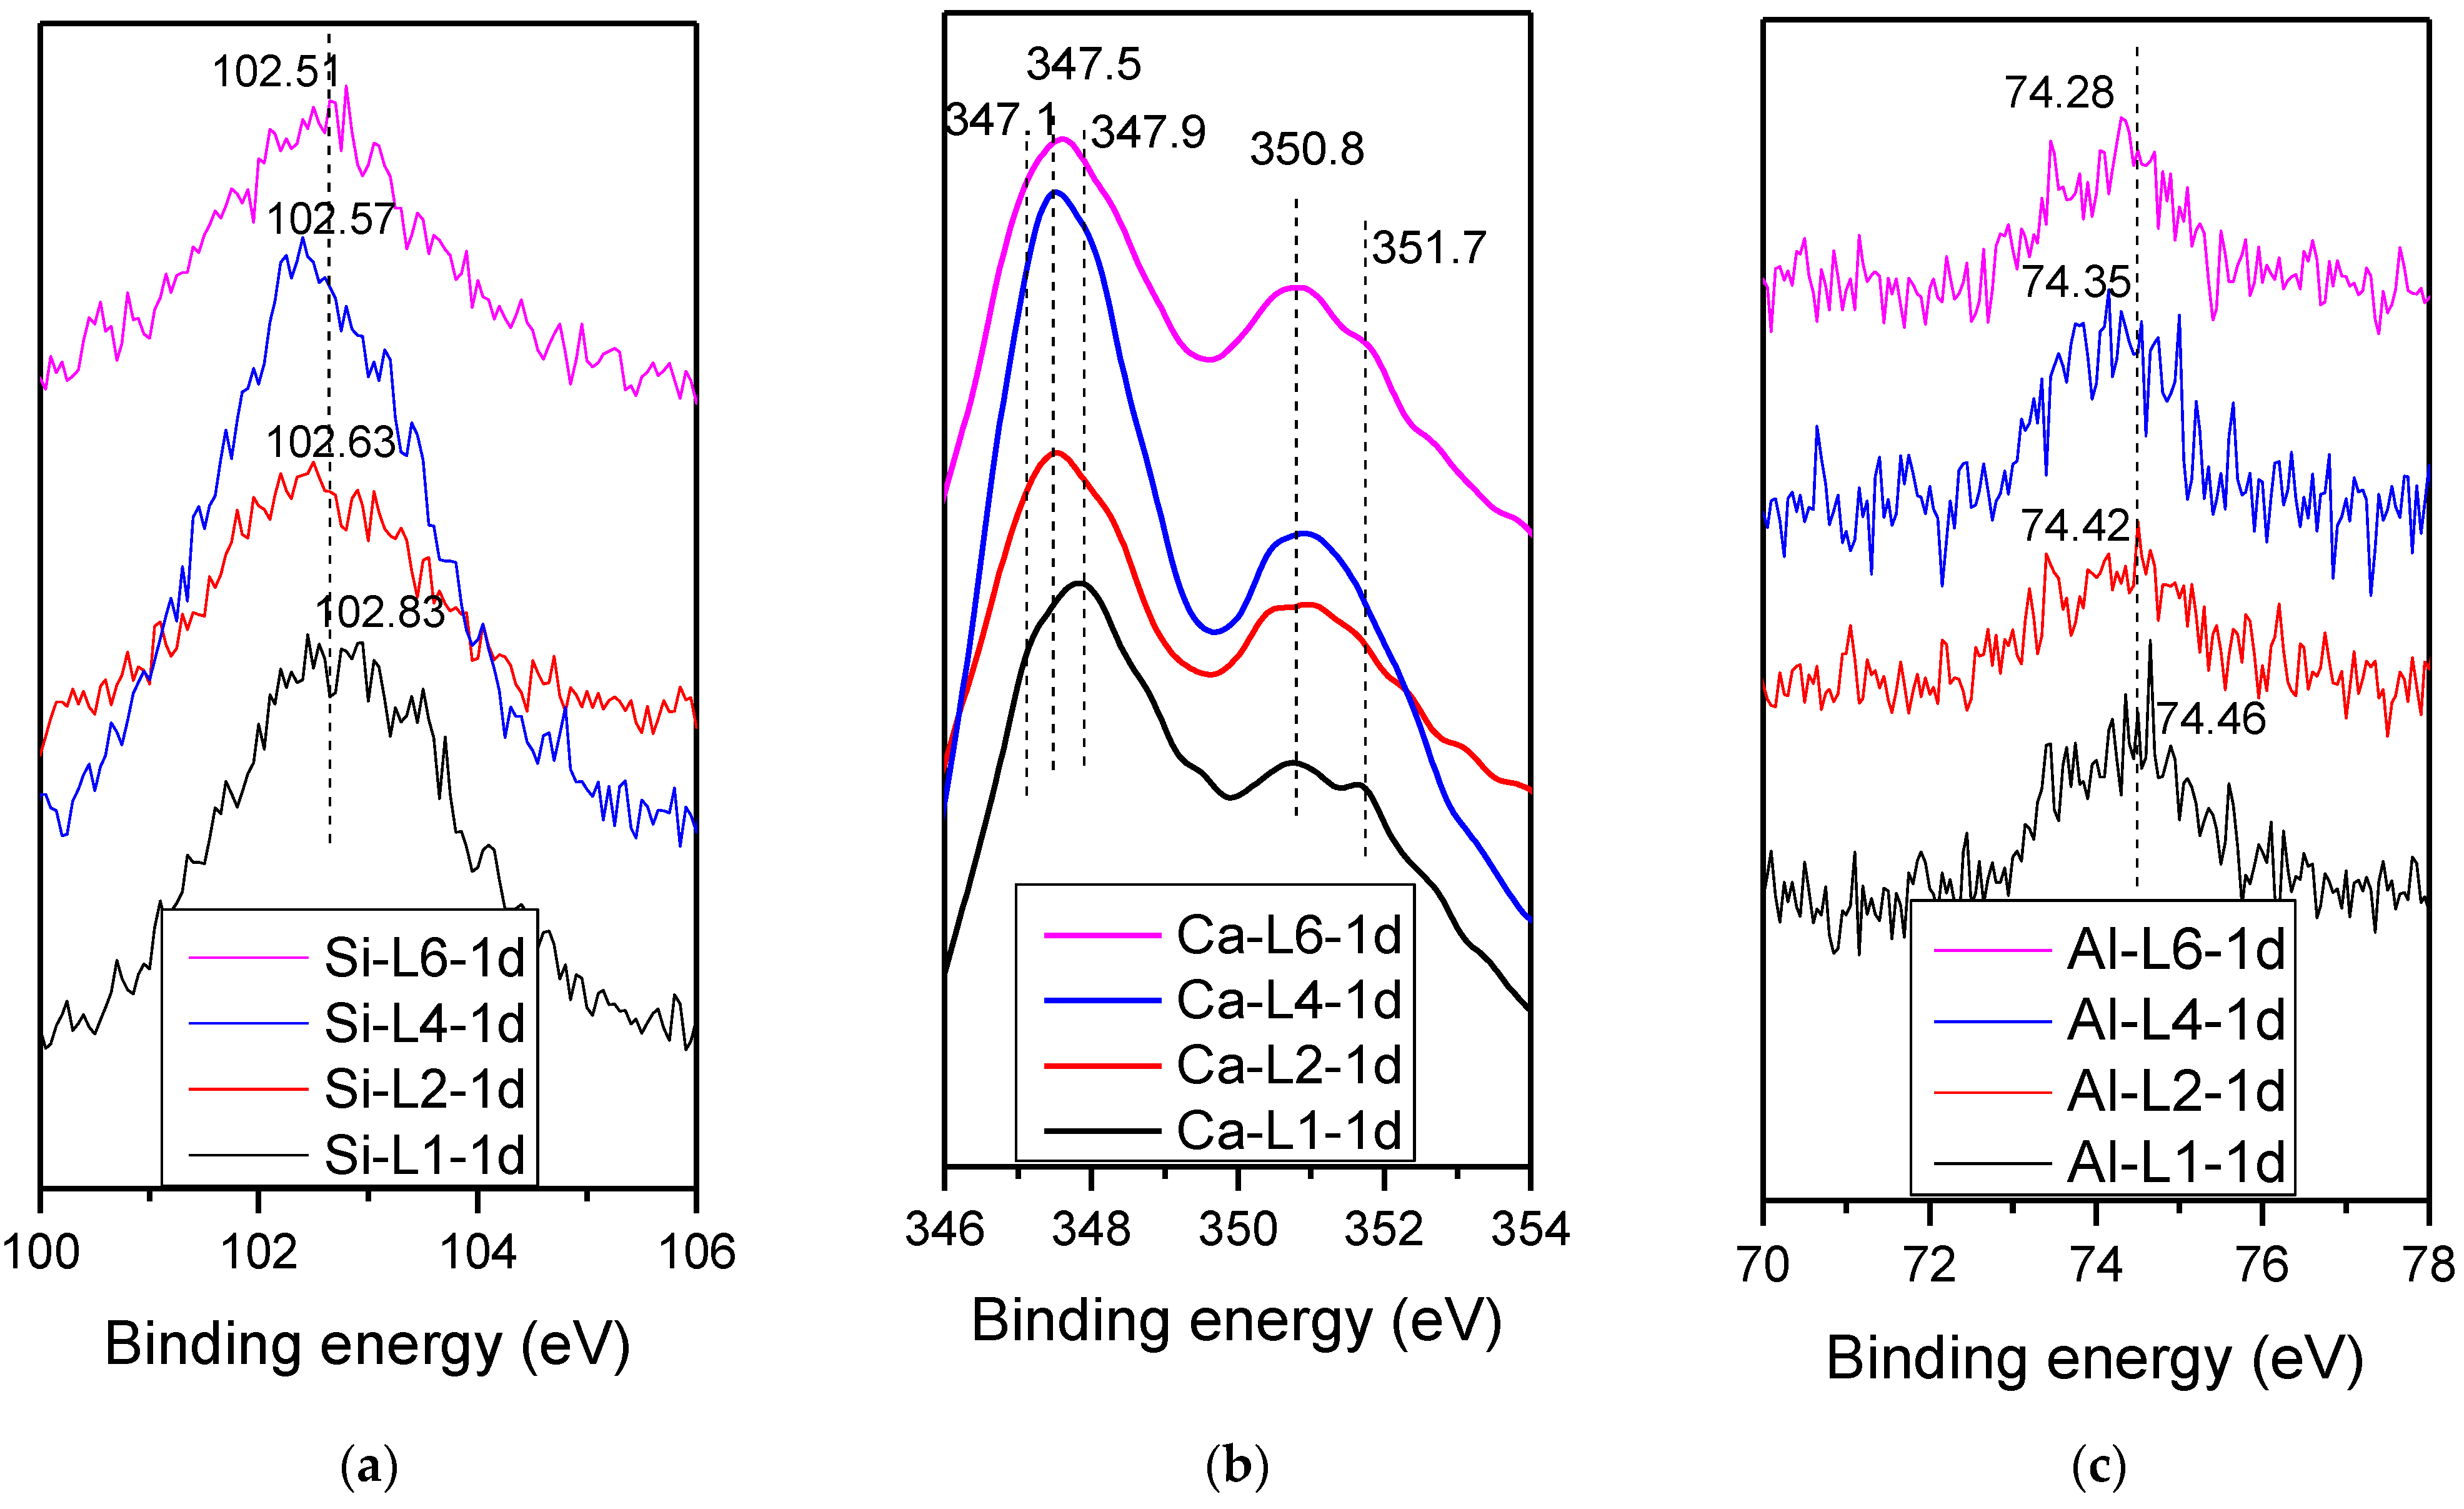
Figure 15 shows the XPS test results for samples L1, L2, L4, and L6 at the age of 1 day. The main forms of silicon in steel slag were C2S and C3S. According to Black et al. [28], the Si 2p binding energy peaks for C2S and C3S were 100.80 and 100.57 eV, respectively. Si 2p binding energy is related to the silicate tetrahedral polymerization extent [29,30,31]. Black et al. [29] also reported that Si 2p binding energies showed a strong negative correlation with C/S in the C-S-H phases. Carbonation of C-S-H resulted in a decreased C/S and thus an increased Si 2p binding energy. The curves in Figure 12a indicate that the Si 2p binding energy had increased after 1 day of carbonation curing. This may be because dicalcium silicate and tricalcium silicate are nesosilicate minerals and have low Si 2p binding energies, whereas the Si 2p binding energies of carbonate products, such as low Ca/Si C-S-H gel or silica gels, are higher because of the loss of nonbridging oxygen atoms during hydration and carbonation.
It is clear that the sample with the higher w/s value had a higher Si 2p binding energy, indicating that water promoted the hydration and carbonation of silicate minerals. Water plays a vital role in the following two aspects. First, it acts as a hydration reactant. Water is the most essential component in hydration reactions. Hydration products such as C-S-H gels and ettringite are prone to carbonation reaction, so water also promotes carbonation reactions. Second, water acts as a transport medium. The dissolved Ca2+, OH−, and CO32− are transported via water, accelerating hydration and carbonation reactions and carbonate product precipitation.
Figure 15b shows the Ca 2p3/2 binding energy of the samples. It was previously determined that the Ca 2p3/2 binding energies of dicalcium silicate (C2S) and tricalcium silicate (C3S) in the raw material were 346.87 and 346.55 eV, respectively [28]. Previous studies also showed that the Ca 2p3/2 binding energy of gypsum was 347.70 eV [32], and that of Ca/Al-LDH was 347.5 eV [33]. The Ca2p3/2 binding energy for an OPC dry clinker sample was observed to be about 347.1 eV. For CaO, Ca(OH)2, and CaCO3, the Ca2p3/2 peak was around 347.0 eV [34].
It can be seen from Figure 15b that the Ca 2p3/2 binding energy of all the carbonated samples surpassed 347 eV. From L1 to L6, the w/s decreased, and the peaks at 347.9 and 347.1 eV increased. This may be attributed to the increasing amounts of ettringite, C-S-H gels, calcite, and monocarboaluminate during the curing period with the increasing addition of water.
Figure 15c shows the Al 2p binding energy results for samples L1 to L6. In steel slag, C12A7 and C3A were the most important sources of aluminum. From Dubina’s study [35], the binding energy of alumina (73.47 eV) was typical for AlO4 tetrahedra. C-A-H phases and the monocarboaluminate had an Al 2p binding energy of around 74.30 eV. From Figure 15c, the Al 2p binding energy increased with w/s, indicating that more hydration and carbonation products were formed when more water was added. This result was consistent with the carbon content and TG–DTG results.
4. Conclusions
To determine the carbonation potential of steel slag, through orthogonal design tests and single-factor tests, this paper evaluated the effects of the water/solid mass ratio (w/s), gypsum ratio (G/SS), and molding pressure on uniaxial compressive strength (UCS) and CO2 uptake of the compacts.
From the range analyses results, w/s had a significant effect on both UCS and CO2 uptake values. The molding pressure impacted UCS greatly, but had very little influence on CO2 uptake. G/SS had the least impact on UCS, but improved the CO2 uptake of steel slag greatly. The optimum conditions in the study were a w/s of 0.20, G/SS of 1/16, and molding pressure of 27 MPa, under which conditions 1 d UCS and CO2 uptake were 55.30 MPa and 12.36%, respectively.
In our study, CO2 uptake of steel slag in the optimal proportion was 16.32%. So, per Mt of steel slag can capture 0.1632 Mt CO2. The steel slag from the Anshan Iron and Steel Co. plant is a kind of typical BOF slag in China, which accounts for 70% of the steel slag in China. The stockpiled amount of steel slag in China is around 1800 Mt. Therefore, the amount of CO2 that can be captured by this method is 293.76 Mt in China, which is a huge amount and can contribute to mitigating the greenhouse effect to a great extent. In addition, the high-strength construction materials could substitute cement. For every ton of cement produced, 0.78 tons of CO2 is emitted. So, the technique could save 1800 Mt cement and decrease CO2 emissions by 1404 Mt.
The gypsum single-factor experiment indicated that gypsum acted as a catalyst for calcium aluminate during the hydration and carbonation process of steel slag.
Increasing curing duration helped to improve both UCS and CO2 uptake at less than 14 d, while excessive carbonation could do harm to the strength development. Samples at 1 d curing age had 70~100% UCS compared to that of 14 d, and 85~100% CO2 uptake compared to that of 14 d. To save time and energy, 1 d curing, and even 6 h curing, is long enough for the samples. An increase in water addition significantly enhanced the UCS and CO2 uptake. Increasing w/s from 0.1 to 0.2 could contribute to an increase in UCS from 7.45 MPa to 31.97 MPa, and an increase in CO2 uptake from 8.59% to 11.31%, increased by 329% and 32%, respectively. From micro-analyses, hydration and carbonation processes were significantly improved when enough water was provided. Water played an indispensable role in the hydration reactions. It also promoted the diffusion of ions such as Ca2+, OH−, and CO32−.
Strengthening molding pressure from 3 MPa to 27MPa led to an increased UCS from 22.90 MPa to 55.30 MPa, with no obvious effects on CO2 uptake value. Although the strengthened molding pressure almost did not impact the amounts of hydration and carbonation products in compacts, it had a significant densification effect on micro-pore structures from MIP results. Increasing molding pressure was an effective way to enhance UCS.
From the analyses, the labile minerals in steel slag included larnite, alite, mayenite, portlandite, and periclase. If all of above-mentioned minerals were carbonated, from the raw material analyses (especially QXRD), theoretical CO2 uptake of steel slag should be 25.25%. However, the highest value we found in this study was 18.85%, only 74.65% of the theoretical value. The difference between practical and theoretical results could be attributed to the prohibited CO2 diffusion by the formed carbonates on the outside of the particles. Actually, some pure material carbonation research has reported that it is very difficult for the minerals to be completely carbonated. Wang and Chang [36] investigated carbonation of β-C2S, Ca(OH)2, and C4AF, finding that the carbonation degree of the minerals were 52%, 87%, and 25%, respectively. Zhao [37] explored carbonation degree of γ-C2S through biomineralization, with around 30% γ-C2S left in the carbonated samples. Zhang [38] studied the carbonation reactivity of C3S and β-C2S, finding a conversion rate of 65% and 70%, respectively. The most plentiful carbonation product in their studies was calcite, with some existence of aragonite, vaterite, and monocarboaluminate. The results in this study were consistent with their studies. Wang and Chang [36] revealed that the carbonation degree was not only controlled by the dissolution properties of minerals, but also influenced by the distribution of CaCO3, which was similar to the above explanation regarding the blocking effects of carbonates on CO2 diffusion.
Supplementary Materials
The following are available online at https://0-www-mdpi-com.brum.beds.ac.uk/article/10.3390/en14154489/s1, Figure S1: QXRD analysis result of steel slag, Figure S2: QXRD analysis results of steel slag after (a) 1 h, (b) 3 h, (c) 6 h, (d)12 h, and (e) 24 h carbonation. (molding pressure: 27 MPa, G/SS: 1/16, w/s: 0.2), Figure S3: QXRD analysis results of steel slag with different w/s ratio of (a) 1/5, (b) 1/6, (c) 1/8, and (d) 1/10. (molding pressure: 9 MPa, G/SS: 1/16, carbonation duration: 1d).
Author Contributions
Conceptualization, methodology, formal analysis, writing—original draft, X.W.; supervision, resources, project administration, W.N.; writing—review and editing, project administration, validation, S.Z.; writing—review and editing, project administration, validation, J.L.; funding acquisition, K.L. All authors have read and agreed to the published version of the manuscript.
Funding
This research was funded by the National Key Research and Development Program of China (2018YFC1900603), the China Scholarship Council (No. 201906460050), and the National Natural Science Foundation of China (52004021).
Institutional Review Board Statement
Not applicable.
Informed Consent Statement
Not applicable.
Data Availability Statement
The data that support the findings of this study are available from the corresponding author upon reasonable request.
Acknowledgments
We especially want to thank Mei Zhang for the support in carbon content measurement.
Conflicts of Interest
The authors declare no conflict of interest. The funders have no role in the design of the study; in the collection, analyses, or interpretation of data; in the writing of the manuscript; or in the decision to publish the result.
References
- Ren, S.; Aldahri, T.; Liu, W.; Liang, B. CO2 mineral sequestration by using blast furnace slag: From batch to continuous experiments. Energy 2021, 214, 118975. [Google Scholar] [CrossRef]
- Wu, H.; Jayne, R.S.; Bodnar, R.J.; Pollyea, R.M. Simulation of CO2 mineral trapping and permeability alteration in fractured basalt: Implications for geologic carbon sequestration in mafic reservoirs. Int. J. Greenh. Gas Control 2021, 109, 103383. [Google Scholar] [CrossRef]
- Zhang, W.; Zhang, F.; Ma, L.; Ning, P.; Yang, J.; Wei, Y. An efficient methodology to use hydrolysate of phosphogypsum decomposition products for CO2 mineral sequestration and calcium carbonate production. J. Clean. Prod. 2020, 259, 120826. [Google Scholar] [CrossRef]
- Wang, B.; Pan, Z.; Cheng, H.; Zhang, Z.; Cheng, F. A review of carbon dioxide sequestration by mineral carbonation of industrial byproduct gypsum. J. Clean. Prod. 2021, 302, 126930. [Google Scholar] [CrossRef]
- Xiong, Y.; Aldahri, T.; Liu, W.; Chu, G.; Zhang, G.; Luo, D.; Yue, H.; Liang, B.; Li, C. Simultaneous preparation of TiO2 and ammonium alum, and microporous SiO2 during the mineral carbonation of titanium-bearing blast furnace slag. Chin. J. Chem. Eng. 2020, 28, 2256–2266. [Google Scholar] [CrossRef]
- Monasterio-Guillot, L.; Alvarez-Lloret, P.; Ibañez-Velasco, A.; Fernandez-Martinez, A.; Ruiz-Agudo, E.; Rodriguez-Navarro, C. CO2 sequestration and simultaneous zeolite production by carbonation of coal fly ash: Impact on the trapping of toxic elements. J. CO2 Util. 2020, 40, 101263. [Google Scholar] [CrossRef]
- Gupta, S.; Kashani, A.; Mahmood, A.H.; Han, T. Carbon sequestration in cementitious composites using biochar and fly ash–Effect on mechanical and durability properties. Constr. Build. Mater. 2021, 291, 123363. [Google Scholar] [CrossRef]
- Chen, Z.; Li, R.; Zheng, X.; Liu, J. Carbon sequestration of steel slag and carbonation for activating RO phase. Cem. Concr. Res. 2021, 139, 106271. [Google Scholar] [CrossRef]
- Wang, X.; Ni, W.; Li, J.; Zhang, S.; Hitch, M.; Pascual, R. Carbonation of steel slag and gypsum for building materials and associated reaction mechanisms. Cem. Concr. Res. 2019, 125, 105893. [Google Scholar] [CrossRef]
- Li, L.; Jiang, Y.; Pan, S.Y.; Ling, T.C. Comparative life cycle assessment to maximize CO2 sequestration of steel slag products. Constr. Build. Mater. 2021, 298, 123876. [Google Scholar] [CrossRef]
- Zhong, X.; Li, L.; Jiang, Y.; Ling, T.-C. Elucidating the dominant and interaction effects of temperature, CO2 pressure and carbonation time in carbonating steel slag blocks. Constr. Build. Mater. 2021, 302, 124158. [Google Scholar] [CrossRef]
- Jiang, Y.; Ling, T.C. Production of artificial aggregates from steel-making slag: Influences of accelerated carbonation during granulation and/or post-curing. J. CO2 Util. 2020, 36, 135–144. [Google Scholar] [CrossRef]
- Hou, G.; Yan, Z.; Sun, J.; Naguib, H.M.; Lu, B.; Zhang, Z. Microstructure and mechanical properties of CO2-cured steel slag brick in pilot-scale. Constr. Build. Mater. 2021, 271, 121581. [Google Scholar] [CrossRef]
- Wang, Q.; Yan, P. Hydration properties of basic oxygen furnace steel slag. Constr. Build. Mater. 2010, 24, 1134–1140. [Google Scholar] [CrossRef]
- Brand, A.S.; Roesler, J.R. Interfacial transition zone of cement composites with steel furnace slag aggregates. Build. Cem. Concr. Compos. 2018, 86, 117–129. [Google Scholar] [CrossRef]
- Wang, L.; Sarkar, B.; Sonne, C.; Ok, Y.S.; Tsang, D.C.W. Soil and geologic formations as antidotes for CO2 sequestration? Soil Use Manag. 2020, 36, 355–357. [Google Scholar] [CrossRef]
- Said, A.; Laukkanen, T.; Järvinen, M. Pilot-scale experimental work on carbon dioxide sequestration using steelmaking slag. Appl. Energy 2016. [Google Scholar] [CrossRef]
- Liu, J.; Lin, C.; Liu, T.; Han, L.; Shen, X.; Li, C.; Lu, A. An eco-friendly permeable brick with excellent permeability and high strength derived from steel slag wastes. Int. J. Appl. Ceram. Technol. 2020, 17, 584–597. [Google Scholar] [CrossRef]
- Fang, Y.; Su, W.; Zhang, Y.; Zhang, M.; Ding, X.; Wang, Q. Effect of accelerated precarbonation on hydration activity and volume stability of steel slag as a supplementary cementitious material. J. Therm. Anal. Calorim. 2021, 1–11. [Google Scholar] [CrossRef]
- Sun, J.; Zhang, Z.; Zhuang, S.; He, W. Hydration properties and microstructure characteristics of alkali–activated steel slag. Constr. Build. Mater. 2020, 241, 118141. [Google Scholar] [CrossRef]
- Liu, Q.; Liu, J.; Qi, L. Effects of temperature and carbonation curing on the mechanical properties of steel slag-cement binding materials. Constr. Build. Mater. 2016, 124, 999–1006. [Google Scholar] [CrossRef]
- Qian, C.; Yi, H.; Du, W. Bacteria fixing CO2 to enhance the volume stability of ground steel slag powder as a component of cement-based materials aiming at clean production. J. Clean. Prod. 2021, 314, 127821. [Google Scholar] [CrossRef]
- Song, Q.; Guo, M.-Z.; Wang, L.; Ling, T.-C. Use of steel slag as sustainable construction materials: A review of accelerated carbonation treatment. Resour. Conserv. Recycl. 2021, 173, 105740. [Google Scholar] [CrossRef]
- Liu, Z.; Zhang, D.W.; Li, L.; Wang, J.X.; Shao, N.N.; Wang, D.M. Microstructure and phase evolution of alkali-activated steel slag during early age. Constr. Build. Mater. 2019, 204, 158–165. [Google Scholar] [CrossRef]
- Hussein, A.M.; Madkour, F.S.; Afifi, H.M.; Abdel-Ghani, M.; Abd Elfatah, M. Comprehensive study of an ancient Egyptian foot case cartonnage using Raman, ESEM-EDS, XRD and FTIR. Vib. Spectrosc. 2020, 106, 102987. [Google Scholar] [CrossRef]
- Chen, H.; Chen, Z.; Zhao, G.; Zhang, Z.; Xu, C.; Liu, Y.; Chen, J.; Zhuang, L.; Haya, T.; Wang, X. Enhanced adsorption of U(VI) and 241Am(III) from wastewater using Ca/Al layered double hydroxide@ carbon nanotube composites. J. Hazard. Mater. 2018, 347, 67–77. [Google Scholar] [CrossRef]
- Ahmad, S.Z.N.; Hamdan, R.; Al-Gheethi, A.; Alkhadher, S.; Othman, N. Removal of phosphate from wastewater by steel slag with high calcium oxide column filter system; efficiencies and mechanisms study. J. Chem. Technol. Biotechnol. 2020, 95, 3232–3240. [Google Scholar] [CrossRef]
- Black, L.; Garbev, K.; Beuchle, G.; Stemmermann, P.; Schild, D. X-ray photoelectron spectroscopic investigation of nanocrystalline calcium silicate hydrates synthesised by reactive milling. Cem. Concr. Res. 2006, 36, 1023–1031. [Google Scholar] [CrossRef]
- Black, L.; Garbev, K.; Stemmermann, P.; Hallam, K.R.; Allen, G.C. Characterisation of crystalline C-S-H phases by X-ray photoelectron spectroscopy. Cem. Concr. Res. 2003, 33, 899–911. [Google Scholar] [CrossRef]
- Black, L.; Breen, C.; Yarwood, J.; Garbev, K.; Stemmermann, P.; Gasharova, B. Structural features of C-S-H(I) and its carbonation in air-A Raman spectroscopic study. Part II: Carbonated phases. J. Am. Ceram. Soc. 2007, 90, 908–917. [Google Scholar] [CrossRef]
- Black, L.; Stumm, A.; Garbev, K.; Stemmermann, P.; Hallam, K.R.; Allen, G.C. X-ray photoelectron spectroscopy of the cement clinker phases tricalcium silicate and β-dicalcium silicate. Cem. Concr. Res. 2003, 33, 1561–1565. [Google Scholar] [CrossRef]
- Zeng, Q.; Luo, M.; Pang, X.; Li, L.; Li, K. Surface fractal dimension: An indicator to characterize the microstructure of cement-based porous materials. Appl. Surf. Sci. 2013, 282, 302–307. [Google Scholar] [CrossRef]
- García Lodeiro, I.; Macphee, D.E.; Palomo, A.; Fernández-Jiménez, A. Effect of alkalis on fresh C-S-H gels. FTIR analysis. Cem. Concr. Res. 2009, 39, 147–153. [Google Scholar] [CrossRef]
- Pane, I.; Hansen, W. Investigation of blended cement hydration by isothermal calorimetry and thermal analysis. Cem. Concr. Res. 2005, 35, 1155–1164. [Google Scholar] [CrossRef]
- La Russa, M.F.; Fermo, P.; Comite, V.; Belfiore, C.M.; Barca, D.; Cerioni, A.; De Santis, M.; Barbagallo, L.F.; Ricca, M.; Ruffolo, S.A. The Oceanus statue of the Fontana di Trevi (Rome): The analysis of black crust as a tool to investigate the urban air pollution and its impact on the stone degradation. Sci. Total Environ. 2017, 593, 297–309. [Google Scholar] [CrossRef] [PubMed]
- Wang, D.; Chang, J. Comparison on accelerated carbonation of β-C2S, Ca(OH)2, and C4AF: Reaction degree, multi-properties, and products. Constr. Build. Mater. 2019, 224, 336–347. [Google Scholar] [CrossRef]
- Zhao, S.; Liu, Z.; Wang, F. Carbonation reactivity enhancement of γ-C2S through biomineralization. J. CO2 Util. 2020, 39, 101183. [Google Scholar] [CrossRef]
- Zhang, X.; Qian, C.; Yi, H.; Ma, Z. Study on carbonation reactivity of silicates in steel slag accelerated by Bacillus mucilaginosus. Constr. Build. Mater. 2021, 292, 123433. [Google Scholar] [CrossRef]
Figure 1.
Press-shaping methods and subsequent carbonation curing of steel slag.

Figure 2.
X-ray diffraction pattern for the steel slag.

Figure 3.
Particle-size distributions of the steel slag powder and gypsum.

Figure 4.
The effect curve of three factors on 1 d compressive strength and 1 d CO2 uptake capacity.
Figure 4.
The effect curve of three factors on 1 d compressive strength and 1 d CO2 uptake capacity.

Figure 5.
The effect curve of three factors on 14 d compressive strength and 14 d CO2 uptake capacity.
Figure 5.
The effect curve of three factors on 14 d compressive strength and 14 d CO2 uptake capacity.

Figure 6.
The effect curve of three factors on 1 d and 14 d CO2 uptake of steel slag.

Figure 7.
(a) UCS and (b) CO2 uptake results of samples with different molding pressures.

Figure 8.
UCS and CO2 uptake results (a) and semi-QXRD analyses results (b) of 27 MPa molding pressure samples with different curing times.
Figure 8.
UCS and CO2 uptake results (a) and semi-QXRD analyses results (b) of 27 MPa molding pressure samples with different curing times.


Figure 9.
FTIR analyses of the samples with different molding pressures and curing times.

Figure 10.
TG–DTG analyses of samples with different molding pressures and curing times.

Figure 11.
(a) Cumulative pore volume and (b) Pore-size distribution of blocks with different molding pressures (S5, 9 MPa; S12, 27 MPa) after 1-day curing.
Figure 11.
(a) Cumulative pore volume and (b) Pore-size distribution of blocks with different molding pressures (S5, 9 MPa; S12, 27 MPa) after 1-day curing.

Figure 12.
(a) UCS and (b) CO2 uptake results for samples with different w/s values.

Figure 13.
Semi-quantitive XRD analyses of samples with different w/s values at 1 d. (L1: 1/5, L2: 1/6, L4: 1/8, L6: 1/10).
Figure 13.
Semi-quantitive XRD analyses of samples with different w/s values at 1 d. (L1: 1/5, L2: 1/6, L4: 1/8, L6: 1/10).

Figure 14.
TG–DTG analyses of samples with different w/s values and curing times (L1, 1:5; L4, 1:8; L6, 1:10).
Figure 14.
TG–DTG analyses of samples with different w/s values and curing times (L1, 1:5; L4, 1:8; L6, 1:10).

Figure 15.
XPS analyses of samples with different w/s values at the age of 1 day: (a) Si 2p; (b) Ca 2p; (c) Al 2p.
Figure 15.
XPS analyses of samples with different w/s values at the age of 1 day: (a) Si 2p; (b) Ca 2p; (c) Al 2p.


Table 1.
Chemical compositions of the steel slag and gypsum (wt %).
| Chemical Composition | Steel Slag | Gypsum | Components | Chemical Formula | Steel Slag |
|---|---|---|---|---|---|
| CaO | 44.78 | 48.06 | Larnite | Ca2SiO4 | 27.9 |
| Al2O3 | 5.70 | 1.18 | Alite | Ca3SiO5 | 1.9 |
| SiO2 | 15.28 | 2.95 | Mayenite | Ca12Al14O33 | 12.8 |
| Fe2O3 | 22.43 | 0.58 | Portlandite | Ca(OH)2 | 2.9 |
| SO3 | 0.30 | 43.57 | Calcite | CaCO3 | 2.9 |
| MgO | 7.04 | 1.48 | Quartz | SiO2 | 2.2 |
| MnO | 1.93 | 1.18 | Magnesiowuestite | (Fe, Mg, Mn)O | 15.7 |
| P2O5 | 1.00 | 0.03 | Magnesioferrite | (Fe, Mg)2O3 | 8.5 |
| TiO2 | 0.86 | 0.39 | Brownmillerite | Ca2Fe2O5 | 15.7 |
| V2O5 | 0.20 | -- | Magnesite | MgCO3 | 6.3 |
| Cr2O3 | 0.17 | -- | Periclase | MgO | 3.0 |
| Others | 0.28 | 0.58 | |||
| Total C | 0.865 | 0.737 |
Table 2.
Orthogonal experiment proportions.
| Experiment No. | w/s (A) | G/SS (B) | Molding Pressure (MPa) (C) | Gypsum (%) | SS (%) | Water (%) |
|---|---|---|---|---|---|---|
| 1 | 1:5(A1) | 1:16(B1) | 3(C1) | 4.9 | 78.43 | 16.67 |
| 2 | 1:5(A1) | 1:4(B2) | 6(C2) | 16.67 | 66.67 | 16.67 |
| 3 | 1:5(A1) | 1:2(B3) | 9(C3) | 27.78 | 55.55 | 16.67 |
| 4 | 1:8(A2) | 1:16(B1) | 6(C2) | 5.23 | 83.66 | 11.11 |
| 5 | 1:8(A2) | 1:4(B2) | 9(C3) | 17.78 | 71.11 | 11.11 |
| 6 | 1:8(A2) | 1:2(B3) | 3(C1) | 29.63 | 59.26 | 11.11 |
| 7 | 1:10(A3) | 1:16(B1) | 9(C3) | 5.35 | 85.56 | 9.09 |
| 8 | 1:10(A3) | 1:4(B2) | 3(C1) | 18.18 | 72.73 | 9.09 |
| 9 | 1:10(A3) | 1:2(B3) | 6(C2) | 30.3 | 60.61 | 9.09 |
Table 3.
Orthogonal experimental results of CO2 uptake and UCS tests.
| Testing Number | CO2 Uptake (%) | CO2 Uptake of Steel Slag (%) | UCS (MPa) | |||||||||
|---|---|---|---|---|---|---|---|---|---|---|---|---|
| 1 d | 3 d | 14 d | 28 d | 1 d | 3 d | 14 d | 28 d | 1 d | 3 d | 14 d | 28 d | |
| 1 | 11.93 | 11.72 | 12.62 | 12.95 | 15.21 | 14.94 | 16.09 | 16.51 | 18.20 | 17.90 | 25.19 | 15.16 |
| 2 | 9.87 | 10.38 | 10.98 | 11.36 | 14.80 | 15.57 | 16.47 | 17.04 | 17.72 | 19.49 | 22.42 | 15.96 |
| 3 | 8.65 | 9.36 | 10.12 | 10.47 | 15.57 | 16.85 | 18.22 | 18.85 | 19.36 | 15.70 | 26.94 | 22.80 |
| 4 | 10.33 | 10.07 | 11.65 | 12.32 | 12.35 | 12.04 | 13.93 | 14.73 | 13.66 | 10.73 | 17.96 | 13.47 |
| 5 | 9.23 | 9.93 | 10.63 | 11.14 | 12.98 | 13.96 | 14.95 | 15.67 | 18.44 | 23.31 | 19.03 | 21.40 |
| 6 | 8.64 | 8.70 | 9.12 | 9.34 | 14.58 | 14.68 | 15.39 | 15.76 | 8.17 | 8.09 | 7.61 | 8.28 |
| 7 | 9.10 | 9.66 | 10.05 | 10.29 | 10.64 | 11.29 | 11.75 | 12.03 | 13.44 | 8.22 | 16.46 | 17.55 |
| 8 | 7.78 | 8.66 | 9.16 | 9.48 | 10.70 | 11.91 | 12.59 | 13.03 | 4.87 | 5.92 | 5.70 | 4.55 |
| 9 | 6.19 | 8.22 | 8.09 | 8.21 | 10.21 | 13.56 | 13.35 | 13.55 | 7.01 | 8.66 | 8.85 | 12.52 |
Publisher’s Note: MDPI stays neutral with regard to jurisdictional claims in published maps and institutional affiliations. |
© 2021 by the authors. Licensee MDPI, Basel, Switzerland. This article is an open access article distributed under the terms and conditions of the Creative Commons Attribution (CC BY) license (https://creativecommons.org/licenses/by/4.0/).
Share and Cite
MDPI and ACS Style
Wang, X.; Ni, W.; Li, J.; Zhang, S.; Li, K. Study on Mineral Compositions of Direct Carbonated Steel Slag by QXRD, TG, FTIR, and XPS. Energies 2021, 14, 4489. https://0-doi-org.brum.beds.ac.uk/10.3390/en14154489
AMA Style
Wang X, Ni W, Li J, Zhang S, Li K. Study on Mineral Compositions of Direct Carbonated Steel Slag by QXRD, TG, FTIR, and XPS. Energies. 2021; 14(15):4489. https://0-doi-org.brum.beds.ac.uk/10.3390/en14154489
Chicago/Turabian StyleWang, Xue, Wen Ni, Jiajie Li, Siqi Zhang, and Keqing Li. 2021. "Study on Mineral Compositions of Direct Carbonated Steel Slag by QXRD, TG, FTIR, and XPS" Energies 14, no. 15: 4489. https://0-doi-org.brum.beds.ac.uk/10.3390/en14154489
Note that from the first issue of 2016, this journal uses article numbers instead of page numbers. See further details here.