
The Impact of Economic, Energy, and Environmental Factors on the Development of the Hydrogen Economy


Mineral and Energy Economy Research Institute, Polish Academy of Sciences, 31-261 Cracow, Poland
*
Author to whom correspondence should be addressed.
Energies 2021, 14(16), 4811; https://0-doi-org.brum.beds.ac.uk/10.3390/en14164811
Submission received: 8 July 2021
/
Revised: 1 August 2021
/
Accepted: 4 August 2021
/
Published: 7 August 2021
(This article belongs to the Topic Hydrogen Energy Technologies)
Abstract
:This article attempts to model interdependencies between socio-economic, energy, and environmental factors with selected data characterizing the development of the hydrogen economy. The study applies Spearman’s correlation and a linear regression model to estimate the influence of gross domestic product, population, final energy consumption, renewable energy, and CO2 emission on chosen hydrogen indicators—production, patents, energy technology research, development, and demonstration budgets. The study was conducted in nine countries selected for their actions towards a hydrogen economy based on analyses of national strategies, policies, research and development programs, and roadmaps. The results confirm the statistically significant impact of the chosen indicators, which are the drivers for the development of the hydrogen economy from 2008 to 2018. Moreover, the empirical results show that different characteristics in each country contribute to the development of the hydrogen economy vision.

1. Introduction
In recent years, hydrogen production and fuel cell technologies have attracted the attention of the authorities in many countries. Moreover, the number of research studies related to these technologies increases significantly every year. Such technologies are perceived as breakthrough solutions with the potential to become clean and sustainable energy carriers [1]. Hence, many countries include the possibility of supporting the development of hydrogen and fuel cell vehicle production (along with the necessary infrastructure) in their energy policy scenarios for the coming years. These policies are connected to the national net-zero emissions target declarations in European [2,3,4,5,6,7] and Asian [8,9,10] countries, as well as the USA [11] and Australia [12], among others. Hydrogen is predicted to play a significant role in the energy transformation of global economies [13].
The demand for hydrogen is mainly linked to oil refining and chemical industries [14,15]. Despite the limited consumption of hydrogen in other sectors of the economy, it has significant potential in the power industry through its use in fuel cells. Currently, most hydrogen applications are focused on generator cooling and hydrogen burning in boilers or CHP units onsite. In transport, hydrogen can be used as a fuel, both directly (fuel cells, internal combustion engines) or indirectly (complex synthetic fuels) [16].
Various technologies are involved in hydrogen production [17,18]. Hydrogen can be produced by electrolysis using nuclear or renewable electricity (green hydrogen). The proportion of hydrogen produced from renewable energy is still insignificant, mainly due to cost. Hydrogen can also be produced using fossil fuels, e.g., hard or lignite coal and natural gas, with CO2 emissions reduced via carbon capture storage (blue hydrogen). Fossil fuels are still the main source of fuel for hydrogen production (natural gas, approximately 75%; coal, approximately 23%) [18]. Hydrogen production is also possible without using the CCS method of Steam Methane Reforming (SMR) or the gasification method (grey or brown hydrogen). The pyrolysis process of methane is an alternative production method (turquoise hydrogen).
The development of hydrogen energy is currently related to the search for ways to implement economic production of green hydrogen by reducing the cost of large-scale production [1,19]. Moreover, the implementation of hydrogen technology is particularly important in transport since a continuous increase in road traffic is expected [20]. Transport is predicted to be the main target for the application of hydrogen energy in the near future [21].
The implementation of new hydrogen energy technologies depends, inter alia, on the state of the economy of individual countries and the long-term goals and scenarios included in their national strategies, policies, research and development (R&D) programs, and roadmaps [14,22]. The processes of decarbonization of the economy and energy transformation are also associated with many socio-economic, environmental, and legal factors [23,24]. Most of the studies of the hydrogen economy involve prognostic analyses. Such analyses consider the production and demand for hydrogen together with the development of fuel cell vehicles and the accompanying infrastructure.
Current policies for a hydrogen economy based on a Romanian example were described by Iordache et al. [25]. They referred to energy (energy dependency, RES, net import of electricity, combined heat and power electricity production), transport (road density, roads fuel consumption, motor vehicles), and environmental indicators (CO2 emissions). Xu et al. [26] studied the influence of factors such as CO2 emissions, per capita income, the scale of the labor input, the added value in the industry, and European governmental mechanisms for the production of renewable energy based on hydrogen. National economic variables have been found to have a positive impact on hydrogen-based renewable energy. The number and type of patents in selected countries were used as tools to map the development of the hydrogen economy by Sinigaglia et al. [27]. In terms of technological progress, Japan and the United States were found to be the most advanced. The level of application of hydrogen technologies in selected economies for 2008 was analyzed by Leben and Hočevar (2008) [28]. They used correlations of national development indicators (gross domestic product, public expenditure on education, R&D expenditure, number of researchers, science and technology doctorates, general patents, greenhouse gas emissions, total final energy consumption) together with a group of hydrogen indicators (number of hydrogen refueling stations, fuel cell vehicles, and hydrogen production). The study supported the hypothesis that the implementation of hydrogen technologies was dependent on selected national development indicators.
In addition, the analysis of environmental (CO2 emissions) and economic (GDP, oil prices) factors in relation to renewable energy sources was applied by Sadorsky [29], showing a significant impact of emissions and GDP on the consumption of renewable energy. Similar conclusions were reported by Wang et al. [30], describing the significant impact of GDP on RES consumption. Marques and Fuinhas [31] showed that market dependencies such as fossil fuel prices and incomes were not significant for the development of RES at the turn of the 20th and 21st centuries. Mendonça et al. [32] demonstrated the positive impact of GDP and population on CO2 emissions and renewable energy production as a way to reduce emissions.
This research attempts to correlate the following factors:
- socio-economic (gross domestic product, population)
- energy (gross final energy consumption including transport and industry, the share of renewable energy of primary energy supply)
- environmental (total CO2 emissions including transport and industry emissions)
- hydrogen (volume of hydrogen production, the number of patents for hydrogen production and fuel cells, research, development, and demonstration subsidies for energy technology).
Using Spearman’s correlation and a linear regression approach, the relationship between indicators was examined in this research. These methods were previously used in various studies related to the analysis of environmental, economic, and energy factors in the areas of renewable energy. Directly in the field of the hydrogen economy, Spearman’s method for national development and hydrogen was used by Leben and Hočevar [28]. Spearman’s rank correlation was also used by Durmuşoğlu et al. [33] to visualize the factors that influence environmental performance. The correlations were sought for the variables of GDP, CO2 emissions, and renewable energy consumption as well as for environmental, energy, and economic indexes. Spearman’s correlation was also used to search for indicators covering the economy, society, and the environment to present the level of sustainable development [34]. The linear regression approach was applied by Asumadu-Sarkodie and Owusu [35], showing a positive correlation between CO2 emissions, energy use, GDP, and population. Menz and Vachon [36] discussed the contribution of various policies and systems in US states to the development of wind energy. For this purpose, they used linear regression equations.
In this article the comparison was made for the following nine countries: China, the United States, Japan, the Republic of Korea, the Netherlands, France, the United Kingdom, Germany, Australia. These countries were selected because of their commitment to implementation of hydrogen strategies and overall progress towards a hydrogen economy (see Section 1.1). Time-series data from 2008 to 2018 were analyzed.
Multiple factors, such as socio-economic, energy, and environmental ones, strongly influence the development of the countries with zero-emission policies. Because of that, there is a need to distinguish which specific indicators affect the development of the hydrogen economy in order to create better and more effective strategies in the coming years. The presented methodology, as well as multidimensional factors, will confirm the hypothesis:
“There is a correlation between selected economic, energy, and environmental indicators and the development of the hydrogen economy in countries involved in the implementation of hydrogen technologies”.
This study adds value to the extant literature in two novel ways. The first is the analysis of the possibilities for the development of hydrogen technologies and modeling interdependencies between chosen indicators. This is considered by monitoring the number of subsidies and the number of patents dedicated to these solutions, as well as observations of the hydrogen market in the country (through the volume of hydrogen production and consumption) concerning a selected group of indicators essential to strategic policy creation. Secondly, the study improves the global debate on the steps taken so far to evolve the low-carbon economy and the energy transition associated with the vision of the future of hydrogen.
1.1. Hydrogen Strategy in Chosen Countries
Hydrogen is a crucial factor in most strategies employed by 75 countries to achieve net-zero greenhouse gas emissions. By the beginning of 2021, over 30 countries had created hydrogen roadmaps or strategies at a national level. An additional six are currently drafting their strategies. Among the countries analyzed, four have hydrogen strategies and the rest have hydrogen roadmaps (Figure 1). The main focus of these policies is transport and industry.
The United States is the world leader in stocks of FCEVs, with approximately one in three FCEVs on USA roads. The USA is closely followed by China, Japan, Korea [37], Germany, and France [38]. The situation in China and Korea is particularly dynamic, with new sales climbing from a few units in 2017 to almost 4400 in China and 4100 in Korea, in 2019. The global forecast is for 4.5 million FCEVs by 2030 [37].
In 2019, there were 470 hydrogen refueling stations in the world. Compared to 2018, there was a significant increase in their number by over 20%. Most of these stations are located in Japan (113). Germany has 81, the United States has 64, and China has 61 [37]. The number of FCEVs is projected to continue to increase, e.g., in China to one million by 2030 [39], in Korea, to 800,000 by 2030 [8], in the Netherlands to 15,000 by 2030 [5], in France to 22,500 by 2028 [40], and in Japan to 800,000 by 2030 [9].
Much attention has also been given to buses, trains, inland and coastal navigation, car fleets, and airplanes. For example, the EU indicated that around 45,000 fuel cell trucks and buses could be put on the road by 2030. Fuel cell trains could also replace approximately 570 diesel trains by 2030 [41]. The French National Railway Company has already taken the first step in this direction by ordering 15 hydrogen trains [40]. Japan and China are also developing hydrogen railway technology [42].
Germany will allocate EUR 0.6 billion for the purchase of buses with an alternative drive system as part of the H2 Mobility program [43]. Japan plans to purchase 1200 hydrogen buses by 2030 [9]. Since air traffic will continue to run on liquid fuel, it makes sense to require suppliers to use electric jet fuel, the production of which uses green hydrogen. In the interest of an ambitious market ramp-up, a 2% minimum for 2030 is being discussed [2].
The priorities of hydrogen strategies also include the need to decarbonize construction, industry (e.g., steel, chemical), and the power system. Korea is already a leader in hydrogen-based micro-CHP plants (mCHP) in new buildings. It is predicted that by 2030, there will be 20,000 mCHP in buildings, consuming 150,000 tons of hydrogen per year. In addition, as much as 3.5 GW of power generated from hydrogen fuel cells will be installed [8]. Japan forecasts that there will be 5.3 million stationary fuel cells in households by 2030 [9].
In the EU, clusters can play a major role in helping countries in the decarbonizing industry. Their goal is to facilitate cooperation and help create an energy-saving industry, e.g., the Rotterdam cluster [3]. In the Netherlands, the chemical industry can play an important role in capturing and utilizing carbon dioxide with green hydrogen. In Germany, attention is focused on the steel industry. Planned investments will focus on alternative processes, i.e., hydrogen injection into blast furnaces and direct hydrogen reduction in dedicated installations. Such solutions are also promoted by Posco, the dominant steel producer in South Korea [44].
Another priority for hydrogen strategies is the power system. For example, Japan is promoting the installation of gas supply systems to store surplus electricity from renewable energy as part of the Fukushima demonstration project [9].
Certain international initiatives should also be mentioned. In Germany, the coalition committee’s package for the future provides EUR 2.0 billion to intensify international cooperation in the field of hydrogen at all levels [2]. Globally, there are 228 hydrogen projects across the value chain which result from the assumed strategic goals [38]. Europe is the global leader in the number of proposed hydrogen projects, with Australia, Japan, and Korea. China and the USA are following as additional hubs [45]. Over half of the announced projects (55%) are located in Europe [38]. One of the most active EU member states in expanding hydrogen technologies is Germany [2].
If all projects are successful, the total investment will exceed USD 300 billion in hydrogen spending by 2030 [38]. Particular attention is given to R&D projects. Several countries are developing ambitious research programs as part of their national hydrogen strategy (e.g., Australia, South Korea, and several EU member states) [46]. In 2019, significant funding was allocated to these projects by Japan (USD 281.7 million), the USA (USD 120 million), and Germany (USD 50.7 million) according to an IEA estimation [47]. Germany has launched a research campaign called ‘Hydrogen Technologies 2030’. Its key elements are technologies dedicated to the transport sector, steel and chemical industries, the green hydrogen production industry, technologies for export, and the creation of a new research network.
Patents are the result of many R&D projects in this field. In 2019, significant progress was made in the filing of patents for hydrogen technologies and fuel cells: China (1493), Japan (682), and Korea (444) [48]. These three countries account for over 55% of all global fuel cell patents and over 65% of all hydrogen-related patents. EU countries have only issued around 16% of all patents. Among the European countries analyzed, Germany filed the most patents (136 in 2019) [48].
Growing demand for hydrogen in various sectors will depend on innovative solutions to increase hydrogen production. In Europe, Germany is the largest producer of hydrogen with an estimated annual volume of over 2.4 billion m3 in 2019. The second-largest producer is the Netherlands (2.1 billion m3) [37]. However, China ranks first in the world in the production of hydrogen (4.3 billion m3), which accounts for 18% of the total world production [49]. Second in the world is the USA (2.6 billion m3). These countries produce hydrogen from fossil fuels (natural gas, oil, coal), and to a much lesser extent, via electrolysis. Replacing them with renewable energy sources is a priority.
Australia, California, and the United Kingdom have great potential in the development of renewable energy. However, Germany aims to become the lead supplier of green hydrogen technology to the global market [40]. Geoscience Australia estimates that, based on the quality of its wind, solar, and water resources alone, about 11% (872,000 km2) may be highly suitable for hydrogen production [12]. However, the United Kingdom has one of the largest offshore wind farm markets in the world. The state of California in the USA has large resources of renewable energy (31.7% of the energy mix in 2019 [50], 50% in 2030 [51]). It should also be mentioned that Japan has built a hydrogen plant in Namie, Fukushima, to implement full-scale power-to-gas technology. The facility, called Fukushima Hydrogen Energy Research Field (FH2R), uses a 20 MW solar power plant on a 180,000 m2 site along with grid energy to electrolyze water in a renewable 10 MW hydrogen production unit, the world’s largest [52]. Australia is also planning a project on a similar scale as part of the ARENA program [42].
The development of hydrogen technologies contributes to the establishment of international partnerships by various countries, increasing the prospects of creating a hydrogen economy. The example of such cooperation is The International Partnership for Hydrogen and Fuel Cells in the Economy (IPHE). The intergovernmental organization was created to facilitate the transition to clean energy and mobility systems based on hydrogen technologies. Apart from the analyzed and described countries (China, the United States, Japan, Republic of Korea, the Netherlands, France, the United Kingdom, Germany, Australia), the members of this organization also include Chile, Italy, Austria, Brazil, Costa Rica, Iceland, Canada, India, and European Commission [53]. All member states are obliged to accelerate the development of hydrogen technologies, which directly increases the prospects for the development of the hydrogen economy in these countries. It is visible among others by dominating the global market in terms of the distribution of fuel cell vehicles and the number of hydrogen refueling stations [54].
The contribution of individual countries to the development of the hydrogen economy is also visible through the global collaboration The Hydrogen Valley Platform founded by the Fuel Cells and Hydrogen Joint [55]. The platform collects flagship hydrogen projects. Currently, 36 Hydrogen Valleys in 19 countries are described. In addition to the aforementioned countries, Denmark, French Guiana, Portugal, Romania, Slovakia, Spain, and Thailand stand out in terms of planned investments in hydrogen technology.
The foundations for the creation of hydrogen economies and societies in African countries are established thanks to the pancontinental association The Africa Hydrogen Partnership. Particular efforts in this direction are visible in Morocco (partnership with Germany to develop the first green hydrogen plant in Africa) and in the Republic of South Africa (expanding knowledge and innovation in hydrogen technology via the Hydrogen South Africa—HySA initiative) [56].
2. Data and Methodology
2.1. Indicators
The study correlates selected economic, energy, and environmental indicators along with a group of specific factors connected with the development of the hydrogen economy.
2.1.1. Hydrogen Indicators (HyInd)
The group of hydrogen indicators consisted of hydrogen production volume (HPV, in billion m3), the number of patents (PAT, numbers of patents), and energy RD&D budget (RDD, in USD million) in the hydrogen production and fuel cells category. Additionally, data for hydrogen consumption were also compiled (HCV, in billion m3).
The hydrogen production and consumption data could be used to monitor trends in the hydrogen market at national levels. They could also be used to illustrate hydrogen use. The hydrogen volume indicator is the estimated amount of hydrogen produced in a particular market and refers to production in physical terms. The data come from the AI-powered statistical database for market analysis, IndexBox. They are shown after raw and mirror information is combined, and after performing IB AI algorithms to eliminate any anomalies and to complete missing data [57]. To a large extent, the data for hydrogen consumption overlap with production volumes due to the current use of hydrogen and the complexity of hydrogen storage and distribution [17]. Most hydrogen is produced and consumed on-site [58,59]. For this reason, only production data were used in the correlation analysis and modeling.
The process of developing new methods of production and application of hydrogen is associated with its potential funding. Government subsidies support research and development, and further technological changes relevant to the industry, energy, and transport sectors. The allocated subsidies reflect an assessment of the state’s efforts to increase competitiveness in a given technology and are important in accelerating the implementation of hydrogen technology [60]. Collective data on RD&D budgets (for hydrogen and fuel cell technology in particular) were used. Collective data were used firstly because different countries use different methodologies to allocate subsidies and secondly because the data are incomplete for several years. These data are compiled by the International Energy Agency (IEA) and include central or federal government budgets and expenditures by state-owned companies. The database reflects the expenditure allocated to basic and applied research, experimental development programs, and energy-related and fundamental research programs in selected countries [45]. The statistics are available only for IEA member countries.
A good indicator of the level of innovation is the number of patents filed [61]. This enables the preferred directions of technological progress for a given country to be determined [62,63]. Patents are considered to be key in accelerating the development of the hydrogen economy [27]. The number of patents per country per year (from 2014 to 2018) in the hydrogen production and fuel cells category according to an established classification system (the Cooperative Patent Classification—CPC) were obtained from the Fuel Cells and Hydrogen Observatory (FCHO) as extracted from the PatBase database [48].
2.1.2. Economic, Energy, and Environmental Indicators
The following significant national indicators were identified:
- economic (gross domestic product—GPD, in USD trillion)
- energy (total final energy consumption—TFC, including transport TFC_T and industry TFC_I, in Mtoe; proportion of primary energy supply that is renewable—RES, in %)
- environmental (total carbon dioxide emissions—CO2, including transport CO2_T and industry emissions CO2_I, in Mt).
The population (POP, in mln) of the country was also taken into account.
Population and GDP are the variables used in the vast majority of the studies related to the environment and energy [26,28,32,64]. GDP is a synthetic and objective measure of economic performance, but it is essential to policy creation [65]. For comparison, data normalization in terms of gross domestic product and population was also used, eliminating the influence of the size of the countries concerned. GDP data were obtained from the Organization for Economic Cooperation and Development (OECD) database. Population statistics were compiled by the World Bank.
Carbon dioxide emissions contribute to climate change and environmental degradation. Currently, hydrogen is produced from fossil fuels, with significant CO2 emissions. Since the 1930s, the vision of a hydrogen economy has been associated with the reduction of emissions [66]. Reducing carbon emissions across the economy is essential to achieve carbon neutrality. The impact of greenhouse gases in the context of a hydrogen economy has been considered by various authors [25,26,28]. The reduction in CO2 emissions is an indicator of the level of decarbonization of a given country. This may contribute to supporting hydrogen technologies.
TFC data help to estimate the environmental impact of energy use. The indicator can be used to monitor and evaluate the success of key policies that have been designed to influence energy consumption and energy efficiency [67]. A significant relationship exists between energy consumption and economic growth in the long term [68,69]. In addition, economic growth drives energy consumption in the end-use sectors of transport and industry. The share of the industry and transport sectors in the total final energy consumption in the selected countries is significant. The statistics reports and database compiled by the IEA were used to provide data for carbon dioxide emissions and total final energy consumption [70,71].
The last factor is renewable energy defined as the proportion of the total primary energy supply that is renewable. The source of the RES indicator was the OECD. The RES indicator illustrates the commitment of a given country to search for clean and ecological energy sources as an effective solution to increasing energy production, taking into account environmental constraints (e.g., greenhouse emissions). Access to clean, modern, and more efficient energy in all countries is also important in the context of sustainable development [72], while the use of renewable energy sources in the hydrogen production process is defined as the long-term goal of a developed hydrogen economy [73]. Interest in green hydrogen production solutions facilitates the development of renewable energy technologies on a large scale [13]. Countries with a large share of RES with the possibility of further renewable-cost reduction, have the potential to develop a clean hydrogen economy [1].
2.2. Methods
The analysis involved two stages. First, Spearman’s correlation was used, the second, one-parameter and multi-parameter linear regression models (ordinary least squares method) were used. The basis for choosing Spearman’s correlation is that it is more general using than the Pearson correlation (which is only for a linear relationship). Additionally, Spearman’s correlation is more resistant to outliers in trials than the Pearson correlation. Spearman’s method was used in many articles concerning the area of renewable energy [28,33,34,74,75,76,77,78,79].
2.2.1. Spearman’s Correlation
Spearman’s correlation was used to investigate the relationship between the two selected parameters, one from each of the hydrogen indicator groups and one from the economic, energy, and environmental indicator groups—Equation (1).
where:
x—parameter
y—parameter
R(x) and R(y)—ranks of the x and y variables
and —mean ranks
n—total number of observations
i—number of observations
2.2.2. The Linear Regression Models
In the second part of the calculation, the regression tool from the RStudio and Analysis ToolPak (MS Excel) was used to perform a linear regression analysis using the least squares method. This enables analysis of the influence of independent variables on the dependent variable. To select parameters potentially best suited to the parameters closely related to the hydrogen economy, a single-parameter regression model was built. A linear regression model has also been used many times in the energy area, for example, in [35,36,80,81,82,83,84].
Linear regression Equation (2) is as follows:
where:
- c1, c2—regression coefficients, values depend on the country and parameters used in the calculations, including their values
- cn—country
- years of analysis: from 2008 to 2018
- DI—data input (raw values in Supplementary Data, Table S1)
- DO—data output (raw values in Supplementary Data, Table S1)
The purpose of the analysis of various parameters is to maximize the value of the linear regression coefficient R2 depending on the country and y0, xd0. For each parameter, the c1 and c2 coefficients were calculated.
An example of the application of Formula (3) is presented below:
where:
JPN—Japan
GDP—Gross Domestic Product as parameter
GDPi—GDP value in year i
Next, a parametric regression model was built to select a pair of parameters potentially best suited to the parameters closely related to the hydrogen economy (hydrogen production and share of technology energy research, development, and demonstration (RDD) budget).
Overall multiple (two-parameter) linear regression Equation (4):
where:
c1, c2, c3—regression coefficients; values depend on the country and parameters used in the calculations, including their values
cn—country
i—years of analysis: from 2008 to 2018
DI—data input (raw values in Supplementary Data, Table S1)
DO—data output (raw values in Supplementary Data, Table S1)
Analyzed combinations in terms of DO and DI:
The purpose of the analysis of the combination of different pairs of parameters is to maximize the value of the linear regression coefficient of determination R2 depending on the country and selected cn, y0, xd1, xd2. For each selected combination, the following coefficients were calculated: c1, c2, and c3 (using the least squares method).
An example of the application of Formula (5) is presented below:
where:
JPN—Japan
GDP—Gross Domestic Product as parameter
GDPi—GDP value in year i
3. Results and Discussion
3.1. Spearman’s Correlation
The study aimed to determine whether there is a correlation between the variables (HPV, RDD, PAT) and the indices (POP, GDP, TFC, TFC_T, TFC_I, RES, CO2, CO2_T, CO2_I) and to see which variables influence hydrogen indicators. The study used Spearman’s correlation test for nine countries.
In Spearman’s correlations of the matrices, it is clear that correlations occur in all the analyzed dependencies (Figure 2 and Figure 3; Supplementary Data, Figures S1–S18). The reason for their association strength is different. The following thresholds were adopted in the analyses [85]: very strong (the correlation coefficient ≥0.80), strong (the correlation coefficient ≥0.60; <0.80), moderate (the correlation coefficient ≥0.40; <0.60), weak (the correlation coefficient ≥0.20; <0.40), and very weak (the correlation coefficient >0.0; <0.20). The relationships between the two variables can be positive or negative.
In 2008 (Figure 2), HPV was most strongly correlated with POP (0.60). The remaining correlation values are at a similar level in the range (0.45–0.57). These are moderate dependencies. In the case of RDD, the strongest correlation is seen for TFC_I, and CO2_I (0.90). The other correlations are also stronger compared to the relationship between the chosen indicators and HPV.
In 2018 (Figure 3), HPV was most strongly correlated with TFC_I and CO2_I (0.65). The relationship between HPV and POP remained at the same level.
The very strong correlations in 2018 for RDD were maintained with TFC_I and CO2_I (0.90), as well as with TFC (0.88). Patents are most significantly correlated with CO2 (0.98). Significant relationships are also seen for the PAT relationship with TFC_I, CO2_I, TFC, GDP, and POP.
The research has shown that throughout the period analyzed (2008–2018) in addition to a correlation with economic indicators, HPV also strongly correlates with environmental and energy indicators (Supplementary Data, Figures S1–S18). The strongest correlations ≥0.90 are seen in three non-European countries. HPV-CO2 correlations, including in transport (CO2_T) and industry (CO2_I) sectors, lead to the conclusion that to achieve environmental sustainability, hydrogen production is a key factor and cannot be ignored. At the same time, hydrogen should be produced using renewable energy sources and should be completely free of CO2 emissions. It was also observed that there is a correlation regarding HPV-TFC including TFC_I and TFC_T. There are very strong correlations in all Asian countries, the United Kingdom, and Australia. In addition, it is strong in the Netherlands, Germany, and the United States. This is evidence that the production of hydrogen not only has an environmental impact but is also oriented to final energy consumption (Supplementary Data, Figures S1–S18). Secondly, most of the correlations between RDD and the selected indicators were very strong or moderate negative correlations. The same is true for the correlation between patents (which are often the result of research and development works) and the analyzed indicators. Among the very strong and strong correlations (≥0.60), negative correlations for RDD occur with final energy consumption (KOR, UK,), CO2 emission (KOR, UK, JPN), and renewable energy sources (KOR, FRA, USA). Patents strongly correlate with CO2_T (KOR, GER, AUS), RES (USA, AUS), and TFC (USA, AUS). It might be suggested that public funding is still very important, however, the level of funding in some countries is declining and the share of private funding is increasing to achieve a sustainable environment.
Attention should be given to the increase in hydrogen production, where many strong correlations with selected indicators have been demonstrated. This may be a major factor in achieving environmental goals that will accelerate the process of decarbonization of the economies of sustainable countries. However, in order to achieve this, hydrogen must be produced from renewable energy sources.
3.2. Regression Models
A total of 92 × 3 parameter combinations for HPV were analyzed, and separately, a total of 92 × 3 parameter combinations for RDD were also analyzed. Table 1 shows the results for HPV in the form of pairs for which the mean R2 values were the highest. Similarly, the RDD results are shown in Table 2.
In two-parameter linear regression, the highest value of the mean R2 was achieved for HPV and the following parameter pair: TFC_T/GDP and CO2_T/GDP. In the category of countries, the highest value of R2 for this pair of parameters was seen for China and the USA, and the lowest value was seen for France (0.664).
In two-parameter linear regression, the highest value of the mean R2 was achieved for RDD and the following parameter pair: POP/GDP and RES. In the category of countries, the highest value of R2 for this pair of parameters applies to the USA and France, and the lowest value was seen for the United Kingdom (0.501). However, for the second pair (bold pair) in Table 2, the minimum value is four percentage points higher than for the first pair, therefore the following pair of parameters were used to present the results: RES and CO2_T/GDP. In this case, the maximum value of the R2 coefficient is also observed for the USA and France, and the lowest for Germany (0.544).
The results for the values of the c1, c2, c3 coefficients for the chosen pairs from Table 1 and Table 2 are presented in Table 3.
For all countries except South Korea, an increase in energy consumption in transport has a positive effect on hydrogen production. However, for all countries except the Netherlands and the UK, CO2 emissions from transport had a negative influence on hydrogen production. In the USA, Japan, the Netherlands, and Australia, the positive effect of renewable energy sources is reflected in the proportion of hydrogen and fuel cells included in the energy technology budget. With the exception of the UK, Germany, and Australia, subsidies decrease as a result of the negative impact of CO2 emissions.
Despite the good fit of the model to empirical data (according to the mean coefficient of determination in the above approach), the p-value is too high. For this reason, it was decided to calculate the best-fit regression model for each country. The results are presented in Table 4 and show the highest R2 coefficients for one-parametric regression, with a p-value < 0.05. The multiple regression models presented show that different characteristics in each country influence the level of hydrogen production or RD&D budget (Table 4; Supplementary Data, Table S2).
For three countries, the HPV regression analysis gives the highest coefficient of determination (R2) for POP, whilst for two of the countries, it is a GDP indicator. For the data observed in NLD and FRA, no regression equation with an appropriate degree of significance was determined. In the case of two-parameter regression, the minimum R2 value equals 0.89. However, similar to univariate regression for NLD and FRA, the results were not statistically significant.
In the univariate regression for the explanatory variable RDD, the dependencies on CO2 and CO2_T showed the greatest R2 factor with a p-value < 0.05. For NLD the p-value achieved is too high. For other countries, the coefficient of determination was reached at the level of 0.36 (for JPN) and 0.86 (for FRA).
In the case of two-parameter regression, the minimum fit factor was 0.62 for JPN, and the highest was achieved for the GDP/POP and TFC/POP model for the USA. Causal relationships were established between the dependent and explanatory variables, which indicates that most of the variables can be used to predict each other.
In the case of China, industrial CO2 emissions positively affected the level of hydrogen production. The main hydrogen production process in the industry, i.e., steam methane reforming, has a significant carbon footprint. The high level of CO2 emissions (almost 7 kg CO2/kg of H2), comes from fuel consumption and the process reactions [86,87]. According to Soltani et al. [86], it is estimated that about 3% of global industrial CO2 emissions come from this process. In China, on average 33% of CO2 emissions came from this process over the period analyzed. The indicator of total CO2 emissions from all sectors is less significant but has a negative impact on hydrogen production.
The final energy consumption in the USA industry sector has a positive influence on hydrogen production. In 2018, record-breaking energy consumption was observed in the end-user sector (industry) in the USA. In recent years, fluctuations have been noticeable, inter alia, with the Great Recession in 2008 and a gradual return to average energy consumption levels seen before 2008. The increasing energy demand in the growing USA economy is not compatible with the ambitions for climate [88]. Today, 95% of hydrogen in the USA is produced via endothermic processes involving natural gas reforming, more specifically steam reforming. As heat must be supplied for the production of hydrogen, energy consumption in these processes and related industrial sectors is increasing. Simultaneously, the production of hydrogen is negatively correlated with CO2 emissions in industry. The main drawback of hydrogen production processes is the fact that carbon dioxide is released into the atmosphere. Carbon dioxide capture and sequestration (CCS), as well as the modernization of systems for capturing CO2 from large industrial SMR installations [89,90,91], will significantly reduce emissions in the industrial sector. The reduction of emissions from the SMR in the future together with the development of other green methods of hydrogen production, is compatible with the climate neutrality goal.
Further analysis found that the GDP had a significant negative effect on the USA RD&D budget for hydrogen technologies. Currently, energy efficiency and renewables are the top priorities in the energy technology RD&D budget (according to the IEA). This is in contrast with the decreasing total RD&D spending on hydrogen and fuel cells. Solutions involving cheap and effective energy sources are required. It should be noted that expenditure on fossil fuel technologies is still nearly five times greater than that spent on hydrogen technologies (USD 581.4 million in 2018). In 2019, it was estimated that hydrogen and fuel cell research was allocated only 1.5% of energy technology RD&D budgets. Despite the constantly growing budget for energy technologies and the increase in gross domestic spending on R&D [92] current subsidies for hydrogen technologies negatively correlate with GDP growth. However, there are plans for significant investment in these solutions in the coming years.
As energy consumption in Japan increases, the level of hydrogen production also increases. However, CO2 emissions have a negative effect on hydrogen production. Japan has set a goal to reduce current hydrogen production emissions by 60% by 2030. Net-zero CO2 emissions across the production-to-final-use hydrogen cycle should be achieved in the long term [93]. Emissions from the hydrogen production process will be reduced further thanks to CO2 capture and storage technologies. The impact of total energy consumption is related to the fact that hydrogen is an energy carrier. It must be produced from another substance before it can be used as a source of energy or fuel. In Japan, the development of the supply chain and the diversification of uses (mobility, electric energy production, industry, and the housing sector), mean that hydrogen will become a key energy source.
This study also found that the total energy consumption in Japan negatively correlates with the number of subsidies allocated to hydrogen technologies. In contrast, CO2 emissions from transport positively correlate with the RD&D budget for hydrogen technologies. Japan has identified hydrogen as the solution to the problem of clean energy for transport. Fuel cell vehicles are recognized as one of the key drivers of the hydrogen economy, especially in the future of transport where green hydrogen could completely replace traditional fossil fuels. As with other new developments, making hydrogen fuel cell technology as efficient and profitable as possible requires investment. Moreover, Japanese automakers Toyota, Nissan, and Honda are global leaders in the development of fuel cell vehicles. In addition, they work with Air Liquide to strengthen the national refueling network [94]. The potential of hydrogen to create emission-free transport, industry, and energy generation is recognized, which will initiate a new phase of growing economy in Japan [95].
The population growth in Korea has had a positive impact on hydrogen production. The population increase is correlated with the need to meet the current energy demand. The total energy consumption in industry also has a positive effect on hydrogen production, but to a lesser extent. In Korea, several interrelations can be identified between the production of hydrogen and energy consumption in industry. Firstly, most of the hydrogen produced is still intended as feedstock for petrochemical plants [96]. In the future, hydrogen could play a significant role as a cleaner feedstock for chemicals [44]. It is predicted that hydrogen will play a significant role in transforming the energy power system. Korea, a hydrogen frontrunner, has set leadership priorities not only with respect to fuel cell cars, but also in the field of large-scale stationary fuel cells for power generation. Driven by population growth together with economic growth and industrial competition, hydrogen will play a particular role in contributing to the total final energy consumption.
Moreover, with energy consumption in the Korean industry allowing for the impact of GDP, an increase in RD&D subsidies for hydrogen and fuel cells can be seen. In contrast, total energy consumption by all sectors has a smaller but negative impact on subsidies for hydrogen technologies. South Korea is known for its innovative prowess. The hydrogen industry was worth USD 12.54 billion in 2020 according to the Korea Energy Economics Institute [97]. The hydrogen economy is seen as a key contributor to economic growth (USD 38.54 billion) as well as providing many thousands of new jobs (420,000 jobs) by 2040. It is estimated that hydrogen could account for 5% of the projected energy consumption in 2040, provided that roadmap targets are met [44]. South Korea plans to strengthen its energy base in all sectors. The effect that energy consumption in industry has on the number of subsidies for hydrogen technology is taken into consideration and is the most significant factor in the regression model presented here.
In the Netherlands, total energy consumption has a significantly positive impact on the energy technology budget in the hydrogen technologies category. The share of RES in the total primary energy supply is less important since the value of subsidies decreases as it grows. Research work in the field of energy efficiency is carried out in a multidirectional and multifaceted manner. In the last two years of the period under consideration, a significant increase in expenditure on hydrogen and fuel cells can be seen. The share of the budget increased almost 38 times from 2016 to 2018 (USD 0.344 million in 2016, USD 13.225 million in 2018). However, subsidies for the development of RES were even higher and in 2018 the share of the renewables budget was over eight times higher than the expenditure on hydrogen. Research expenditure on hydrogen technologies is justified by the need to increase energy efficiency. The amount of energy obtained from the combustion of hydrogen (about 118 MJ/kg at 298 K) is much higher than that obtained from gasoline (about 44 MJ/kg) [98]. Hydrogen energy is converted directly into electricity with high efficiency and low power losses. Hence, industry sees potential for adopting hydrogen as an energy source for heating. Currently, the production of hydrogen in the industry is estimated to be 180 PJ per year. The industrial hydrogen system has a significant impact on the energy system in the Netherlands [99].
The proportion of the French energy technology budget allocated to hydrogen and fuel cells is negatively affected by increases in renewable energy sources, and to a lesser extent, by CO2 emissions in transport. The main goal of hydrogen production in the French strategy is to decarbonize industrial processes, for which the demand for hydrogen is currently the highest [6]. To produce carbon-neutral hydrogen, access to clean energy is essential. Due to the additional power demand and the departure from nuclear energy, renewable energy sources are being used. The decrease in the overall share of RES in the primary energy supply may increase RD&D expenditure, not only on renewables, but also on the development of hydrogen technologies.
Further analysis found that the increase in the proportion of renewable energy sources in the UK has a negative effect on hydrogen production, whilst the population growth is positively correlated with the amount of hydrogen generated. Currently, renewable energy sources account for less than 5% of hydrogen production. However, this situation is forecast to change in the future [100]. A decrease in CO2 emissions in transport positively influences the subsidies for hydrogen technologies. Simultaneously, with increasing total energy consumption, the RD&D budget for hydrogen and fuel cells increases. Currently, the level of carbon-free hydrogen production is insignificant. However, since over a third of industrial energy consumption is for high-temperature processes [4], the UK government needs to provide subsidies over the next decade to make hydrogen technology the low-emission energy solution ideal for generating this type of energy.
In Germany, the production of hydrogen is positively related to total CO2 emissions. However, the growth in CO2 emissions from transport is negatively related to the amount of hydrogen generated. Whilst transport emissions account for a significant proportion of total emissions, fossil fuels remain the main source. Germany has a very large industrial sector, consuming vast amounts of energy. Demand for hydrogen is expected to remain particularly noticeable in industry, while its growth in transport will be driven by a smaller-scale market growth impulse until 2030. The long-term goal of the German economy is for a gradual increase in the use of hydrogen in transport, especially green hydrogen; this will result in a decrease in CO2 emissions in this sector. However, it should be noted that the hydrogen strategy has to start with blue hydrogen (produced from natural gas with CO2 emission), due to insufficient volumes of green hydrogen in the near future [2]. The environmental policy focused on hydrogen technologies and cooperation of the government with individual sectors of the economy is necessary for the aspect of eliminating barriers to the hydrogen economy. In Germany, such challenges are visible, among others, in the transport sector, e.g., high costs of production and purchase of FCEVs, their limited availability and the lack of modern German models, low development of refuelling network infrastructure, and their profitability [101].
The last finding of this research was that the industrial CO2 emissions in Australia are positively correlated with hydrogen production, whilst total CO2 emissions have a negative and less significant influence on the level of hydrogen generated. Industry accounts for a significant proportion of hydrogen production compared with the volumes dedicated to other sectors. This is reflected in the lower impact of total CO2 emissions compared to industrial emissions. Mineral refining, chemical production, and steel manufacturing are currently emission-intensive industries in the Australian economy [12]. The use of hydrogen may allow low-carbon products to be obtained in these sectors. Australia has a great potential to produce low-emission hydrogen thanks to the opportunity of using large coal and natural gas resources in combination with the use of carbon capture and storage technologies. The possibility of producing clean hydrogen is also noticeable due to the intensely increasing share of renewable sources such as solar and wind in energy generation.
4. Conclusions
The growth rate of all socio-economic and environmental variables changes over time. There are numerous reasons for these fluctuations. The coming years will be decisive with respect to decarbonization, energy transformation, and the development of the hydrogen ecosystem.
The future of hydrogen will not only have environmental, energy, and economic dimensions, but will also be a cross-cutting topic with far-reaching consequences for foreign policy, security of supply, and geo-economic cooperation. Hydrogen is expected to play a key role in a future climate-neutral economy enabling emission-free transport and energy storage as well as energy-saving industry. All analyzed countries recognize the important role of hydrogen in their national energy and climate plans up to 2030. However, they still need instructions on what economic, social, and environmental factors are conducive to the development of hydrogen.
The USA, China, Japan, South Korea, the Netherlands, France, the United Kingdom, Germany, and Australia are all strongly committed to decarbonization of the economy. National strategies, roadmaps, financial support, and targets for hydrogen have generated unprecedented momentum for the hydrogen industry. All activities will require continuation in the form of new partnerships and the creation of hydrogen communities.
The posed hypothesis There is a correlation between selected economic, energy, and environmental indicators and the development of the hydrogen economy in countries involved in the implementation of hydrogen technologies was proved by the presented dependencies. As this article shows, several factors influence the hydrogen economy. Five key indicators have been identified: population, GDP, CO2 emissions (including CO2 from industry and transport), RES, and TFC (including industrial and transport sectors). These should be considered when modeling and analyzing the future role of hydrogen. Hydrogen production volumes, the share of RD&D budget, and the number of patents filed were selected as indicators of selected aspects of the hydrogen economy.
The hydrogen and fuel cells category is a small proportion of the total RD&D budget (1.5–16%). However, hydrogen RD&D is growing in most countries. In 2018, growth was positive in all countries except Korea and France. In contrast, the dynamics of hydrogen production are negative. Only in selected years are the dynamics positive for a few countries. The exception is China, where the dynamics of hydrogen production are positive throughout the 2008–2019 period.
The multiple regression models and correlations presented here show that, to a great extent, the different characteristics in each country contribute to the development of the vision of the hydrogen economy. The increase in the share of renewable energy sources in a given country can significantly contribute to strengthening the country’s future hydrogen production market, whilst at the same time limiting the harmful impact of CO2 emissions. Hydrogen production, driven by an increasing population and economic growth, will play a crucial role in contributing to total final energy consumption. The amount of energy obtained from hydrogen is much higher than that from fossil fuels and can be efficiently converted directly into electricity.
Important synergies exist between hydrogen production and CO2 emissions. Hydrogen, as an energy carrier, must be produced from another substance. Unfortunately, this still tends to involve fossil fuels. Reducing emissions along the entire value chain of hydrogen technologies may be achieved in the distant future. However, today, in certain industrial sectors such as steelmaking, blue hydrogen could be used to reduce carbon emissions. It is necessary to properly target environmental policies in order to reward low-emission and zero-emission technologies and hence the fuels produced in these processes.
The proportion of the energy technology RD&D budget allocated to hydrogen and fuel cells is strongly linked to CO2 emissions. Fuel cells are a promising technology and compare favorably with internal combustion engine technology. Subsidies for hydrogen technologies are necessary to develop energy-efficient solutions in many sectors of the economy. Subsidies are influenced by total energy consumption.
It can be seen that the research variables affect a selected group of hydrogen indicators. This study contributes to the further development of the hydrogen economy. The analysis could be extended using additional indicators, e.g., the size and value of hydrogen imports and exports.
Supplementary Materials
The following are available online at https://0-www-mdpi-com.brum.beds.ac.uk/article/10.3390/en14164811/s1, Figures S1–S18: Matrices for analyzed countries (Figure S1 Matrix for China part1, Figure S2 Matrix for China part2, Figure S3 Matrix for South Korea part1, Figure S4 Matrix for South Korea part2, Figure S5 Matrix for the United Kingdom part1, Figure S6 Matrix for the United Kingdom part2, Figure S7 Matrix for Germany part1, Figure S8 Matrix for Germany part2, Figure S9 Matrix for France part1, Figure S10 Matrix for France part2, Figure S11 Matrix for Japan part1, Figure S12 Matrix for Japan part2, Figure S13 Matrix for the USA part1, Figure S14 Matrix for the USA part2, Figure S15 Matrix for the Netherlands part1, Figure S16 Matrix for the Netherlands part2, Figure S17 Matrix for the Australia part1, Figure S18 Matrix for Australia part2, Table S1: Raw data for statistical analysis, Table S2: Multiple regression models in chosen countries.
Author Contributions
Conceptualization, J.C. and R.K.; methodology, P.O.; formal analysis, J.C. and P.O; validation, J.C, R.K. and P.O.; investigation, J.C., R.K. and P.O.; resources, J.C., R.K. and P.O.; writing—original draft preparation, J.C., R.K. and P.O.; writing—review and editing, J.C., R.K. and P.O.; visualization, J.C. and P.O.; project administration, J.C. and R.K.; funding acquisition, J.C., R.K. and P.O. All authors have read and agreed to the published version of the manuscript.
Funding
The research was funded within the frame of statutory works of the Mineral and Energy Economy Research Institute, Polish Academy of Sciences.
Institutional Review Board Statement
Not applicable.
Informed Consent Statement
Not applicable.
Data Availability Statement
Not applicable.
Conflicts of Interest
The authors declare no conflict of interest.
Abbreviations
| CHP | cogeneration or combined heat and power |
| CCS | carbon capture storage |
| FCEV | fuel cell electric vehicles |
| HPV | hydrogen production volume |
| PAT | number of patents |
| RDD | energy RD&D in the hydrogen production and fuel cells category |
| HCV | hydrogen consumption |
| GPD | gross domestic product |
| TFC | total final energy consumption |
| TFC_T | total final energy consumption in transport |
| TFC_I | total final energy consumption in industry |
| RES | share of renewable energy of primary energy supply |
| CO2 | total carbon dioxide emissions |
| CO2_T | total carbon dioxide emissions in transport |
| CO2_I | total carbon dioxide emissions in industry |
| POP | population |
| CHN | China |
| USA | United States |
| JPN | Japan |
| KOR | Republic of Korea |
| NLD | Netherlands |
| FRA | France |
| UK | United Kingdom |
| GER | Germany |
| AUS | Australia |
References
- IRENA. Green Hydrogen Cost Reduction: Scaling Up Electrolysers to Meet the 1.5 °C Climate Goal; International Renewable Energy Agency: Abu Dhabi, United Arab Emirates, 2020; ISBN 9789292602956. [Google Scholar]
- Federal Ministry for Economic Affairs and Energy the National Hydrogen Strategy 2020. Available online: https://www.bmwi.de/Redaktion/EN/Publikationen/Energie/the-national-hydrogen-strategy.pdf?__blob=publicationFile&v=6 (accessed on 10 January 2021).
- Visman, B. Roadmaps to a Hydrogen Future in the Netherlands by 2050. Available online: https://www.semanticscholar.org/paper/Roadmaps-to-a-hydrogen-future-in-the-Netherlands-by-Visman/cdba1a8591613944d5b406c307d98b218e418fe2 (accessed on 10 January 2021).
- HM Government Industrial Decarbonisation Strategy. Available online: https://assets.publishing.service.gov.uk/government/uploads/system/uploads/attachment_data/file/970229/Industrial_Decarbonisation_Strategy_March_2021.pdf (accessed on 2 February 2021).
- Ministry of Economic Affairs and Climate Policy Netherlands Government Strategy on Hydrogen. Available online: https://www.government.nl/documents/publications/2020/04/06/government-strategy-on-hydrogen (accessed on 10 January 2021).
- Ministère de la Transition Écologique Stratégie Nationale Pour Le Développement de l’hydrogène Décarboné En France. Available online: https://www.economie.gouv.fr/plan-de-relance/profils/entreprises/strategie-nationale-developpement-hydrogene-decarbone-appels-projets-territoriaux (accessed on 1 February 2021).
- HM Government Energy Department Powering Our Net Zero Future. Energy White Paper. Available online: https://assets.publishing.service.gov.uk/government/uploads/system/uploads/attachment_data/file/945899/201216_BEIS_EWP_Command_Paper_Accessible.pdf (accessed on 20 January 2021).
- Study Task Force Hydrogen Roadmap Korea. A Vision, Roadmap and Recommendation to Develop Korea’s Hydrogen Economy. Available online: http://www.h2eva.org (accessed on 3 February 2021).
- Hydrogen and Fuel Cell Strategy Council the Strategic Road Map for Hydrogen and Fuel Cells. Industry-Academia-Government Action Planto Realize a “Hydrogen Society”. Available online: https://www.meti.go.jp/english/press/2019/pdf/0312_002b.pdf (accessed on 2 February 2021).
- China Hydrogen Alliance. White Paper on Hydrogen Energy and Fuel Cell Industry in China; China Hydrogen Alliance: Beijing, China, 2019. [Google Scholar]
- FCHEA Road Map to a US Hydrogen Economy. Reducing Emissions and Driving Growth across the Nation. Available online: https://www.fchea.org/us-hydrogen-study (accessed on 2 February 2021).
- COAG Energy Council Hydrogen Working Group Australia’s National Hydrogen Strategy. Available online: https://www.industry.gov.au/sites/default/files/2019-11/australias-national-hydrogen-strategy.pdf (accessed on 2 February 2021).
- Li, L.; Lin, J.; Wu, N.; Xie, S.; Meng, C.; Zheng, Y.; Wang, X.; Zhao, Y. Review and Outlook on the International Renewable Energy Development. Energy Built Environ. 2020. [Google Scholar] [CrossRef]
- IEA The Future of Hydrogen. Available online: https://www.iea.org/reports/the-future-of-hydrogen (accessed on 2 February 2021).
- Jovan, D.J.; Dolanc, G. Can Green Hydrogen Production Be Economically Viable under Current Market Conditions. Energies 2020, 13, 6599. [Google Scholar] [CrossRef]
- FCHO Hydrogen Molecule Market. Available online: https://www.fchobservatory.eu/reports (accessed on 2 August 2021).
- NRC. NAE Transportation, Distribution, and Storage of Hydrogen. In The Hydrogen Economy: Opportunities, Costs, Barriers, and R&D Needs; National Research Council and National Academy of Engineering, Ed.; The National Academies Press: Washington, DC, USA, 2004. [Google Scholar]
- Umbach, F.; Pfeiffer, J. Germany and the EU’s Hydrogen Strategies in Perspective—The Need for Sober Analyses. Perisc. Occas. Anal. Br. Ser. 2020, 2020, 1–12. [Google Scholar]
- O’Brien, J.E.; Hartvigsen, J.L.; Boardman, R.D.; Hartvigsen, J.J.; Larsen, D.; Elangovan, S. A 25 KW High Temperature Electrolysis Facility for Flexible Hydrogen Production and System Integration Studies. Int. J. Hydrogen Energy 2020, 45, 15796–15804. [Google Scholar] [CrossRef]
- Hydrogen Europe Papers: Hydrogen Europe’s Position Paper on the Sustainable and Smart Mobility Strategy. Available online: https://www.hydrogeneurope.eu/wp-content/uploads/2021/04/Hydrogen-Europe_SSMS_Paper-compressed.pdf (accessed on 2 February 2021).
- Meng, X.; Gu, A.; Wu, X.; Zhou, L.; Zhou, J.; Liu, B.; Mao, Z. Status Quo of China Hydrogen Strategy in the Field of Transportation and International Comparisons. Int. J. Hydrogen Energy 2020, in press. [Google Scholar] [CrossRef]
- Hydrogen Europe Factsheets & Infographics: Market and Industry Ambitions. Available online: https://hydrogeneurope.eu/publications-0 (accessed on 2 February 2021).
- Singh, H.V.; Bocca, R.; Gomez, P.; Dahlke, S.; Bazilian, M. The Energy Transitions Index: An Analytic Framework for Understanding the Evolving Global Energy System. Energy Strateg. Rev. 2019, 26, 100382. [Google Scholar] [CrossRef]
- World Economic Forum Fostering Effective Energy Transition 2019 Edition Insight Report. Available online: http://www3.weforum.org/docs/WEF_Fostering_Effective_Energy_Transition_2019.pdf (accessed on 12 January 2021).
- Iordache, I.; Gheorghe, A.V.; Iordache, M. Towards a Hydrogen Economy in Romania: Statistics, Technical and Scientific General Aspects. Int. J. Hydrogen Energy 2013, 38, 12231–12240. [Google Scholar] [CrossRef]
- Xu, R.; Chou, L.C.; Zhang, W.H. The Effect of CO2 Emissions and Economic Performance on Hydrogen-Based Renewable Production in 35 European Countries. Int. J. Hydrogen Energy 2019, 44, 29418–29425. [Google Scholar] [CrossRef]
- Sinigaglia, T.; Freitag, T.E.; Kreimeier, F.; Martins, M.E.S. Use of Patents as a Tool to Map the Technological Development Involving the Hydrogen Economy. World Pat. Inf. 2019, 56, 1–8. [Google Scholar] [CrossRef]
- Leben, J.; Hočevar, S. Correlation between National Development Indicators and the Implementation of a Hydrogen Economy in Slovenia. Int. J. Hydrogen Energy 2012, 37, 5468–5480. [Google Scholar] [CrossRef]
- Sadorsky, P. Renewable Energy Consumption, CO2 Emissions and Oil Prices in the G7 Countries. Energy Econ. 2009, 31, 456–462. [Google Scholar] [CrossRef]
- Wang, B.; Mi, Z.; Nistor, I.; Yuan, X.C. How Does Hydrogen-Based Renewable Energy Change with Economic Development? Empirical Evidence from 32 Countries. Int. J. Hydrogen Energy 2018, 43, 11629–11638. [Google Scholar] [CrossRef] [Green Version]
- Marques, A.C.; Fuinhas, J.A. Drivers Promoting Renewable Energy: A Dynamic Panel Approach. Renew. Sustain. Energy Rev. 2011, 15, 1601–1608. [Google Scholar] [CrossRef]
- de Souza Mendonça, A.K.; de Andrade Conradi Barni, G.; Moro, M.F.; Bornia, A.C.; Kupek, E.; Fernandes, L. Hierarchical Modeling of the 50 Largest Economies to Verify the Impact of GDP, Population and Renewable Energy Generation in CO2 Emissions. Sustain. Prod. Consum. 2020, 22, 58–67. [Google Scholar] [CrossRef]
- Durmuşoğlu, B.; Selam, A.A.; Fırat, S.Ü.O. A Comparative Study on the Relations among Sustainability Focused Indexes with REC, CO2, and GDP. Am. Sci. Res. J. Eng. Technol. Sci. 2017, 34, 81–94. [Google Scholar]
- Frugoli, P.A.; Almeida, C.M.V.B.; Agostinho, F.; Giannetti, B.F.; Huisingh, D. Can Measures of Well-Being and Progress Help Societies to Achieve Sustainable Development? J. Clean. Prod. 2015, 90, 370–380. [Google Scholar] [CrossRef]
- Asumadu-Sarkodie, S.; Owusu, P.A. Recent Evidence of the Relationship between Carbon Dioxide Emissions, Energy Use, GDP, and Population in Ghana: A Linear Regression Approach. Energy Sources Part B Econ. Plan. Policy 2017, 12, 495–503. [Google Scholar] [CrossRef]
- Menz, F.C.; Vachon, S. The Effectiveness of Different Policy Regimes for Promoting Wind Power: Experiences from the States. Energy Policy 2006, 34, 1786–1796. [Google Scholar] [CrossRef]
- IEA Hydrogen. IEA, Paris. Available online: https://www.iea.org/reports/hydrogen (accessed on 10 January 2021).
- The Hydrogen Council and McKinsey & Company Hydrogen Insights a Perspective on Hydrogen Investment, Market Development and Cost Competitiveness. Available online: www.hydrogencouncil.com (accessed on 14 January 2021).
- SAE China Hydrogen Fuel Cell Vehicle Technology Roadmap. Available online: http://www.sae-china.org (accessed on 2 February 2021).
- Fuel Cells and Hydrogen 2 Joint Undertaking Opportunities for Hydrogen Energy Technologies Considering the National Energy & Climate Plans. Available online: https://www.fch.europa.eu/publications/opportunities-hydrogen-energy-technologies-considering-national-energy-climate-plans (accessed on 2 February 2021).
- FCH. Hydrogen Roadmap Europe; Fuel Cells and Hydrogen: Brussels, Belgium, 2019; ISBN 9789292463328. [Google Scholar]
- PwC Embracing Clean Hydrogen for Australia How the Journey towards Decarbonisation Can Be Fuelled by Hydrogen. Available online: https://www.pwc.com.au/infrastructure/embracing-clean-hydrogen-for-australia-270320.pdf (accessed on 12 January 2021).
- H2 MOBILITY. We Are Building the Filling Station Network of the Future. H2 MOBILITY Deutschland GmbH & Co KG. Available online: https://h2.live/en/h2mobility (accessed on 2 March 2021).
- Stangarone, T. South Korean Efforts to Transition to a Hydrogen Economy. Clean Technol. Environ. Policy 2020. [Google Scholar] [CrossRef]
- IEA Hydrogen Projects Database. Available online: https://www.iea.org/reports/hydrogen-projects-database (accessed on 2 February 2021).
- EC. Communication from the Commission to the European Parliament, the Council, the European Economic and Social Committee and the Committee of the Regions. A Hydrogen Strategy for a Climate-Neutral Europe; European Commission: Brussels, Belgium, 2020. [Google Scholar]
- IEA Energy Technology RD&D Budgets 2020. Database. Available online: https://www.iea.org/reports/energy-technology-rdd-budgets-2020 (accessed on 2 February 2021).
- FCHO Total Patent Registrations. Available online: https://www.fchobservatory.eu/observatory/patents (accessed on 8 February 2021).
- Tu, K.J. Prospects of a Hydrogen Economy with Chinese Characteristics. Études de l’Ifri, 21 October 2020; p. 62. [Google Scholar]
- The California Energy Commission Total System Electric Generation. Available online: https://www.energy.ca.gov/data-reports/energy-almanac/california-electricity-data/2019-total-system-electric-generation (accessed on 1 May 2021).
- The California Air Resources Board California’s 2030 Climate Commitment Renewable Resources for Half of the State’s Electricity by 2030. Available online: https://ww3.arb.ca.gov/html/fact_sheets/2030_renewables.pdf (accessed on 3 April 2021).
- Hydrogen Power & Clean Energy Community a Consortium in the Country Has Launched the Fukushima Hydrogen Energy Research Field. Available online: https://www.hydrogenfuelnews.com/japan-opens-the-largest-hydrogen-production-unit-on-the-globe/8539553/ (accessed on 30 March 2021).
- IPHE International Partnership for Hydrogen and Fuel Cells in the Economy—Partners. Available online: https://www.iphe.net/partners (accessed on 30 July 2021).
- Samsun, R.C.; Antoni, L.; Rex, M. Mobile Fuel Cell Application: Tracking Market Trends. In Advanced Fuel Cells Technology; Collaboration Programme by International Energy Agency: Paris, France, 2020. [Google Scholar]
- FCH Hydrogen Valleys. Available online: https://www.h2v.eu/about-us (accessed on 30 July 2021).
- Clifford Chance Focus on Hydrogen: A New Energy Frontier for Africa. Available online: https://www.cliffordchance.com/briefings/2021/01/focus-on-hydrogen--a-new-energy-frontier-for-africa.html (accessed on 30 July 2021).
- IndexBox Hydrogen Data. Available online: https://app.indexbox.io/meta#p_cov (accessed on 2 January 2021).
- Abe, I. Statistics on Hydrogen Production and Consumption. In Energy Carriers and Conversion Systems. Encyclopedia of Life Support Systems; Ohta, T., Nejat Veziroglu, T., Eds.; Developed under the Auspices of the UNESCO; Eolss Publishers: Paris, France, 2008; pp. 131–135. [Google Scholar]
- IRENA Hydrogen: A Renewable Energy Perspective. Available online: https://irena.org/publications/2019/Sep/Hydrogen-A-renewable-energy-perspective (accessed on 12 January 2021).
- Van Benthem, A.A.; Kramer, G.J.; Ramer, R. An Options Approach to Investment in a Hydrogen Infrastructure. Energy Policy 2006, 34, 2949–2963. [Google Scholar] [CrossRef]
- Granstrand, O. Innovation and intellectual property rights. In The Oxford Handbook of Innovation; Fagerberg, J., Mowery, D.C., Nelson, R.R., Eds.; Oxford University Press: Oxford, UK, 2005. [Google Scholar]
- Moreira, R.; De Carvalho, F.M.S.; Bergamaschi, V.S.; Politano, R. Patentes Depositadas em Âmbito Nacional Como Indicador de Desenvolvimento Das Tecnologias de Produção de Hidrogênio. Quim. Nova 2013, 36, 748–751. [Google Scholar] [CrossRef] [Green Version]
- Raghupathi, V.; Raghupathi, W. Innovation at Country-Level: Association between Economic Development and Patents. J. Innov. Entrep. 2017, 6, 4. [Google Scholar] [CrossRef] [Green Version]
- Lin, B.; Raza, M.Y. Analysis of Energy Related CO2 Emissions in Pakistan. J. Clean. Prod. 2019, 219, 981–993. [Google Scholar] [CrossRef]
- Fraumeni, B. Gross Domestic Product: Are Other Measures Needed? IZA World Labor 2017, 368, 1–11. [Google Scholar] [CrossRef] [Green Version]
- Turner, J.A. Sustainable Hydrogen Production. Science 2004, 305, 972–974. [Google Scholar] [CrossRef]
- UNECE G-1: Final Energy Consumption. Available online: https://unece.org/DAM/env/europe/monitoring/Indicators/G-1-en-final.pdf (accessed on 8 February 2021).
- Esen, Ö.; Bayrak, M. Does More Energy Consumption Support Economic Growth in Net Energy-Importing Countries? J. Econ. Financ. Adm. Sci. 2017, 22, 75–98. [Google Scholar] [CrossRef]
- Mukhtarov, S.; Mikayilov, J.I.; Ismayilov, V. The Relationship between Electricity Consumption and Economic Growth: Evidence from Azerbaijan. Int. J. Energy Econ. Policy 2020, 7, 32–38. [Google Scholar]
- IEA CO2 Emissions from Fuel Combustion. Database. Available online: https://www.iea.org/data-and-statistics (accessed on 2 February 2021).
- IEA Total Final Consumption (TFC) by Sector. World Energy Balances 2020. Database. Available online: https://www.iea.org/data-and-statistics/data-product/world-energy-balances (accessed on 2 February 2021).
- United Nations the Sustainable Development Goals. Available online: https://sdgs.un.org/goals/goal7 (accessed on 15 January 2021).
- Turner, J.A. A Realizable Renewable Energy Future. Science 1999, 285, 687–689. [Google Scholar] [CrossRef] [Green Version]
- Yadav, A.; Kumar, N. Solar Resource Estimation Based on Correlation Matrix Response for Indian Geographical Cities. Int. J. Renew. Energy Res. 2016, 6, 695–701. [Google Scholar]
- Jurasz, J.; Canales, F.A.; Kies, A.; Guezgouz, M.; Beluco, A. A Review on the Complementarity of Renewable Energy Sources: Concept, Metrics, Application and Future Research Directions. Sol. Energy 2020, 195, 703–724. [Google Scholar] [CrossRef]
- Liczmańska-Kopcewicz, K.; Pypłacz, P.; Wiśniewska, A. Resonance of Investments in Renewable Energy Sources in Industrial Enterprises in the Food Industry. Energies 2020, 13, 4285. [Google Scholar] [CrossRef]
- Mehedintu, A.; Sterpu, M.; Soava, G. Estimation and Forecasts for the Share of Renewable Energy Consumption in Final Energy Consumption by 2020 in the European Union. Sustainability 2018, 10, 1515. [Google Scholar] [CrossRef] [Green Version]
- Kryzia, D.; Olczak, P.; Wrona, J.; Kopacz, M.; Kryzia, K.; Galica, D. Dampening Variations in Wind Power Generation Through Geographical Diversification. In Proceedings of the IOP Conference Series: Earth and Environmental Science, Krakow, Poland, 14–17 November 2019; Volume 214. [Google Scholar]
- Cader, J.; Olczak, P.; Koneczna, R. Regional Dependencies of Interest in the “My Electricity” Photovoltaic Subsidy Program in Poland. Energy Policy J. 2021, 24, 97–116. [Google Scholar] [CrossRef]
- El Kafazi, I.; Bannari, R.; Abouabdellah, A.; Aboutafail, M.O.; Guerrero, J.M. Energy Production: A Comparison of Forecasting Methods Using the Polynomial Curve Fitting and Linear Regression. In Proceedings of the 2017 International Renewable and Sustainable Energy Conference (IRSEC), Tangier, Morocco, 4–7 December 2017; IEEE: Piscataway, NJ, USA, 2017; pp. 1–5. [Google Scholar]
- Mohammed, A.; Alshibani, A.; Alshamrani, O.; Hassanain, M. A Regression-Based Model for Estimating the Energy Consumption of School Facilities in Saudi Arabia. Energy Build. 2021, 237, 110809. [Google Scholar] [CrossRef]
- Ferreira, Â.P.; Ramos, J.G.; Fernandes, P.O. A Linear Regression Pattern for Electricity Price Forecasting in the Iberian Electricity Market. Rev. Fac. Ing. Univ. Antioq. 2019, 117–127. [Google Scholar] [CrossRef] [Green Version]
- Olczak, P.; Olek, M.; Matuszewska, D.; Dyczko, A.; Mania, T. Monofacial and Bifacial Micro PV Installation as Element of Energy Transition—The Case of Poland. Energies 2021, 14, 499. [Google Scholar] [CrossRef]
- Olczak, P.; Kryzia, D.; Matuszewska, D.; Kuta, M. “My Electricity” Program Effectiveness Supporting the Development of PV Installation in Poland. Energies 2021, 14, 231. [Google Scholar] [CrossRef]
- Statstutor Spearman’s Correlation. Available online: https://www.statstutor.ac.uk/resources/uploaded/spearmans.pdf (accessed on 30 July 2021).
- Soltani, R.; Rosen, M.A.; Dincer, I. Assessment of CO2 Capture Options from Various Points in Steam Methane Reforming for Hydrogen Production. Int. J. Hydrogen Energy 2014, 39, 20266–20275. [Google Scholar] [CrossRef]
- da Costa Labanca, A.R. Carbon Black and Hydrogen Production Process Analysis. Int. J. Hydrogen Energy 2020, 45, 25698–25707. [Google Scholar] [CrossRef]
- Energy Information Administration Today in Energy. Available online: https://www.eia.gov/todayinenergy/detail.php?id=39092 (accessed on 2 October 2020).
- Foundation for Research and Technology Hellas Final Report Summary—HY2SEPS-2 Project (Hybrid Membrane-Pressure Swing Adsorption (PSA) Hydrogen Purification Systems). Available online: https://cordis.europa.eu/project/id/278538/pl (accessed on 12 January 2021).
- CACHET Carbon Dioxide Capture and Hydrogen Production from Gaseous Fuels. Available online: https://cordis.europa.eu/project/id/19972 (accessed on 3 February 2021).
- Busse, A.; Power, G.; MacMurray, J. Demonstration of Carbon Capture and Sequestration of Steam Methane Reforming Process Gas Used for Large-Scale Hydrogen Production; Air Products and Chemicals, Inc.: Allentown, PA, USA, 2018. [Google Scholar]
- OECD Gross Domestic Spending on R&D (Indicators). Available online: https://data.oecd.org/rd/gross-domestic-spending-on-rd.htm (accessed on 2 February 2021).
- METI Hydrogen and Fuel Cell Strategy Roadmap. An Action Plan for Achieving a Hydrogen Society. Available online: www.meti.go.jp (accessed on 12 January 2021).
- Sen, S. Japan: Taking a Lead in Hydrogen. Available online: https://www.thechemicalengineer.com/features/japan-taking-a-lead-in-hydrogen/ (accessed on 2 March 2021).
- Chaube, A.; Chapman, A.; Shigetomi, Y.; Huff, K.; Stubbins, J. The Role of Hydrogen in Achieving Long Term Japanese Energy System Goals. Energies 2020, 13, 4539. [Google Scholar] [CrossRef]
- Kan, S. South Korea’s Hydrogen Strategy and Industrial Perspectives. Édito Énergie Ifri, 25 March 2018; pp. 1–7. [Google Scholar]
- The UK’s Department for International Trade. The Hydrogen Economy South Korea. Market Intelligence Report; The UK’s Department for International Trade: London, UK, 2011. [Google Scholar]
- Revankar, S.T.; Brown, N.R.; Kane, C.; Oh, S. Development of Efficient Flowsheet and Transient Modeling for Nuclear Heat Coupled Sulfur Iodine Cyclefor Hydrogen Production; Technical Report; Purdue University: West Lafayette, IN, USA, 2010. [Google Scholar]
- Weeda, M.; Segers, R. The Dutch Hydrogen Balance, and the Current and Future Representation of Hydrogen in the Energy Statistics. TNO 2020 P10915; TNO: Amsterdam, The Netherlands, 2020. [Google Scholar]
- Ballard; Deloitte China. Fueling the Future of Mobility—Hydrogen and Fuel Cell Solutions for Transportation—Report; Deloitte: New York, NY, USA, 2020; Volume 1, 103p. [Google Scholar]
- Trencher, G.; Edianto, A. Drivers and Barriers to the Adoption of Fuel Cell Passenger Vehicles and Buses in Germany. Energies 2021, 14, 833. [Google Scholar] [CrossRef]
Figure 1.
The latest hydrogen-related government documents cited in this paper.

Figure 2.
Spearman’s correlation and compilation of data for all analyzed countries in 2008. *, **, ***—the more symbols, the stronger the correlation. Abbreviations: HPV—hydrogen production volume; RDD—energy RD&D in the hydrogen production and fuel cells category; POP—population; GPD—gross domestic product; TFC—total final energy consumption; TFC_T—total final energy consumption in transport; TFC_I—total final energy consumption in industry; RES—share of renewable energy of primary energy supply; CO2—total carbon dioxide emissions; CO2_T—total carbon dioxide emissions in transport; CO2_I—total carbon dioxide emissions in industry.

Figure 3.
Spearman’s correlation and compilation of data for all analyzed countries in 2018. *, **, ***—the more symbols, the stronger the correlation. Abbreviations: HPV—hydrogen production volume; RDD—energy RD&D in the hydrogen production and fuel cells category; PAT—number of patents; POP—population; GPD—gross domestic product; TFC—total final energy consumption; TFC_T—total final energy consumption in transport; TFC_I—total final energy consumption in industry; RES—share of renewable energy of primary energy supply; CO2—total carbon dioxide emissions; CO2_T—total carbon dioxide emissions in transport; CO2_I—total carbon dioxide emissions in industry.


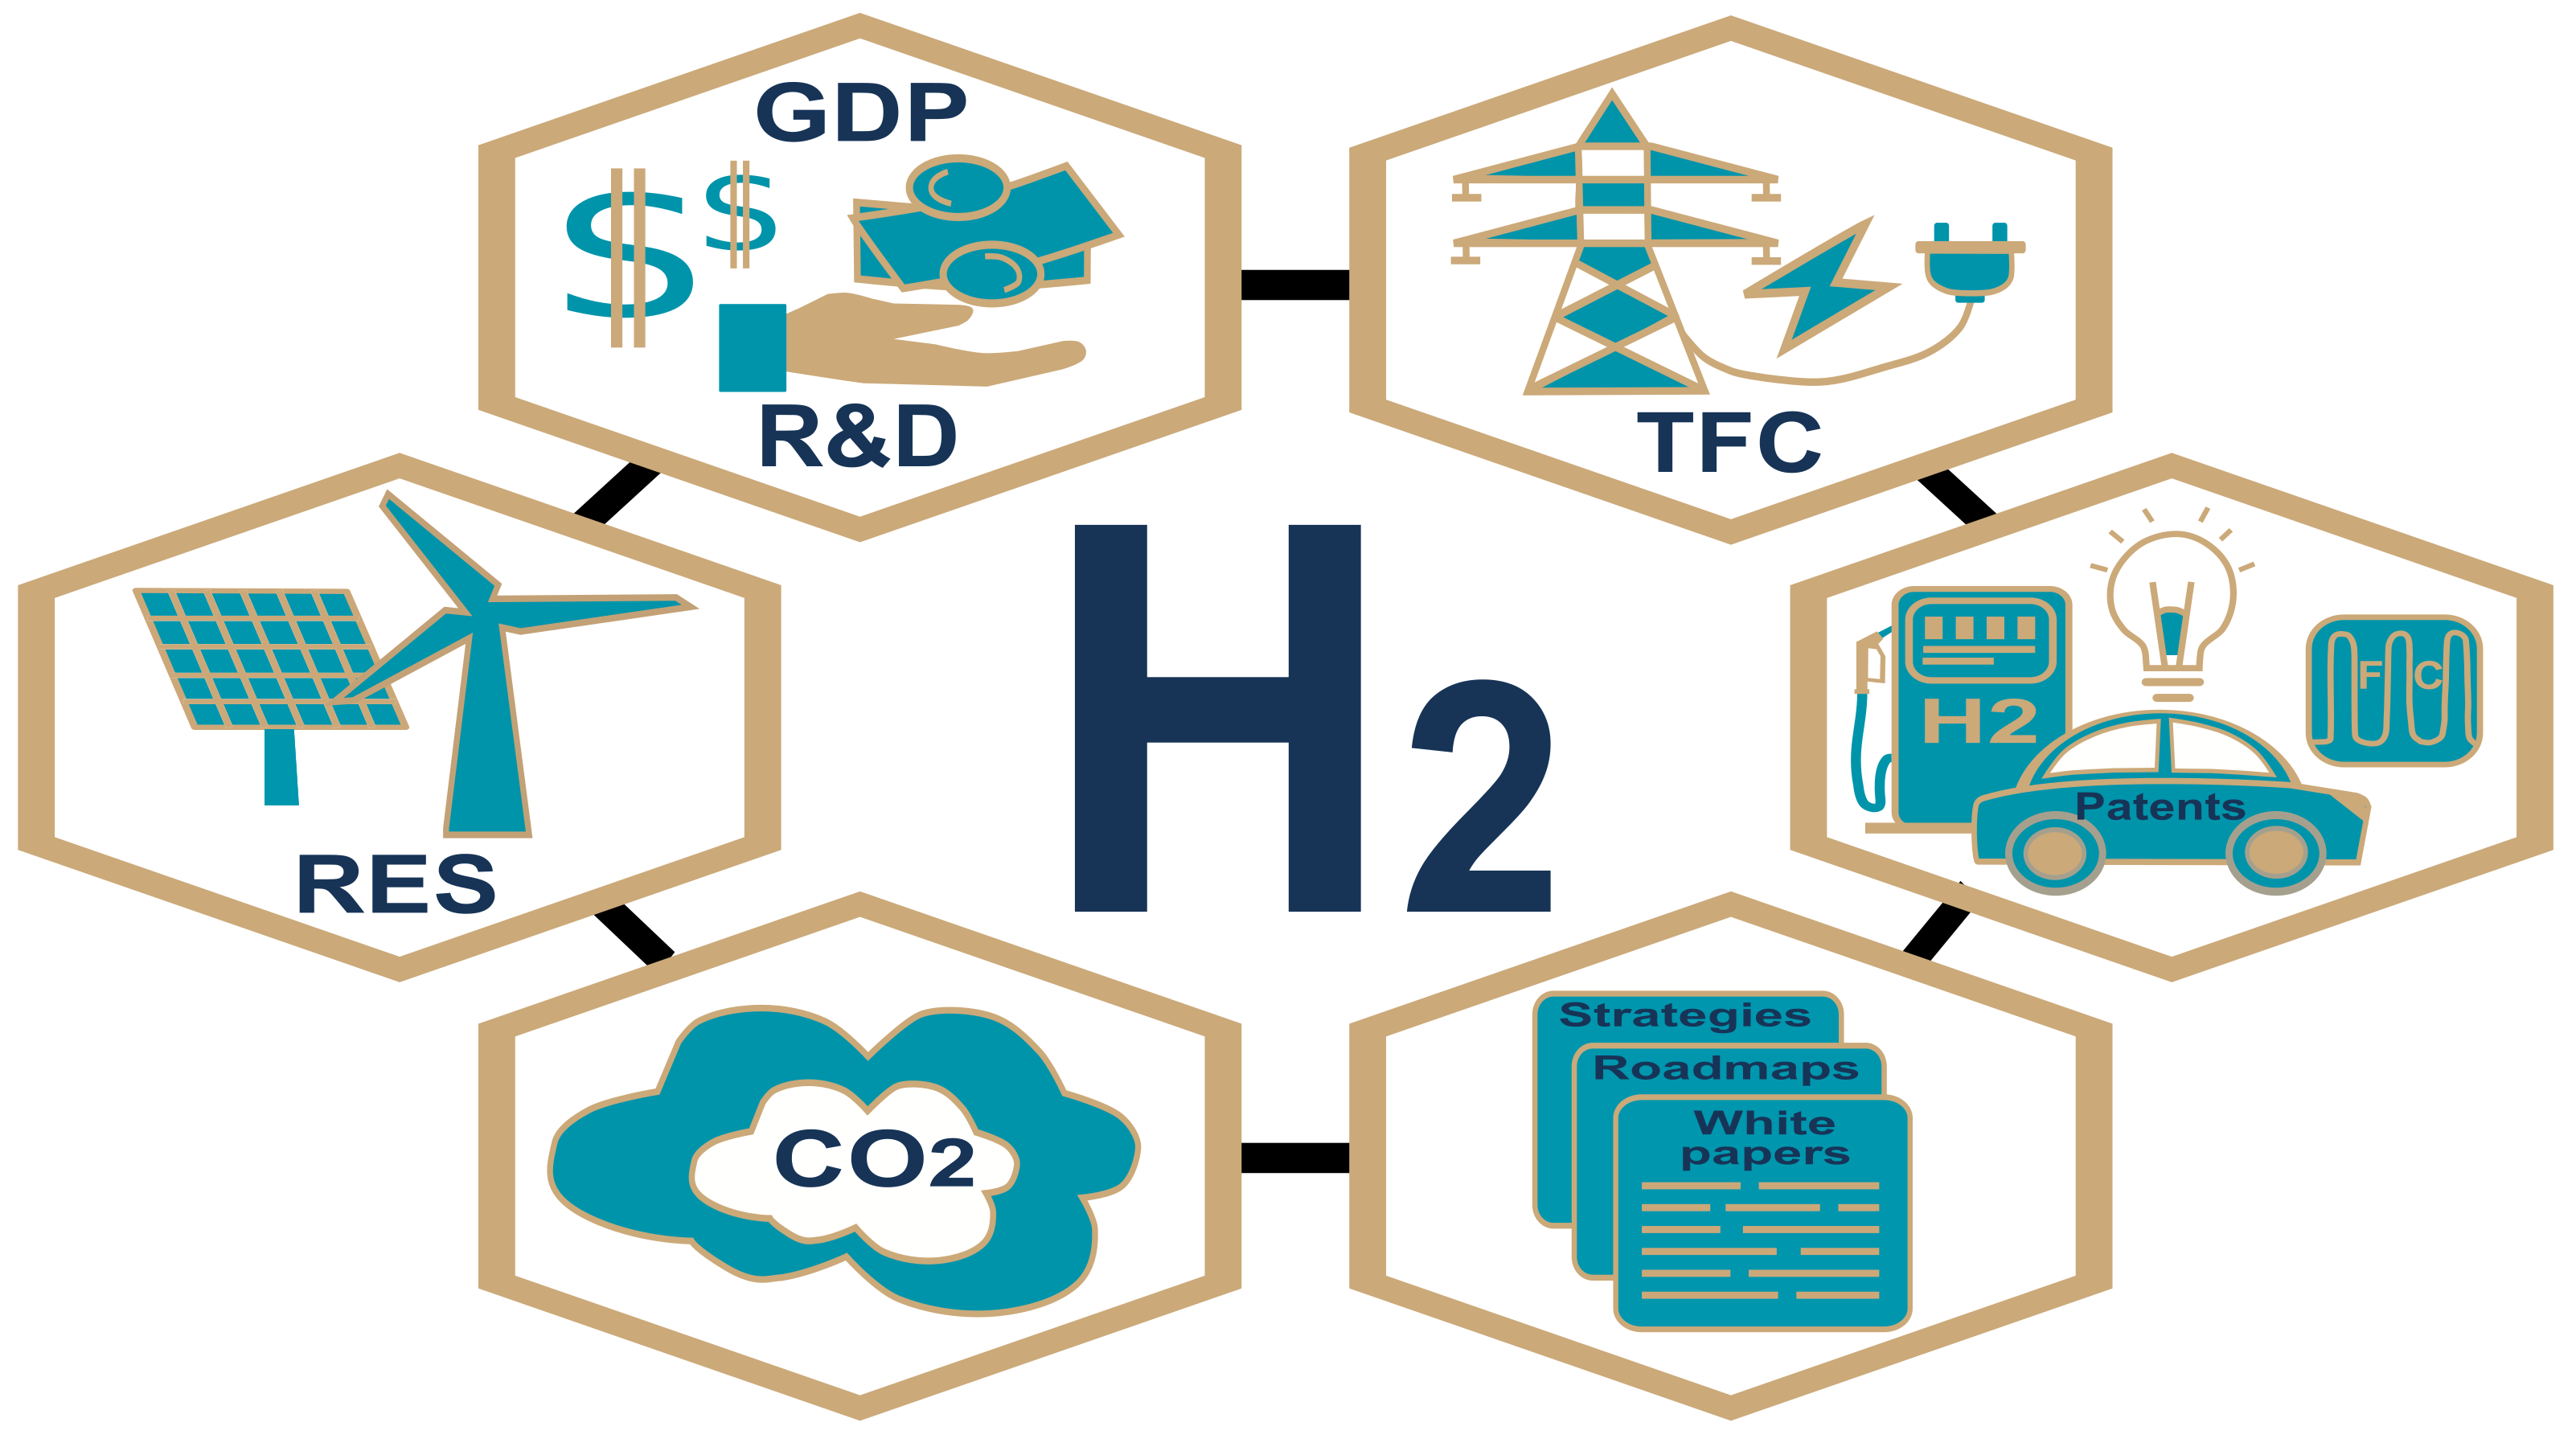
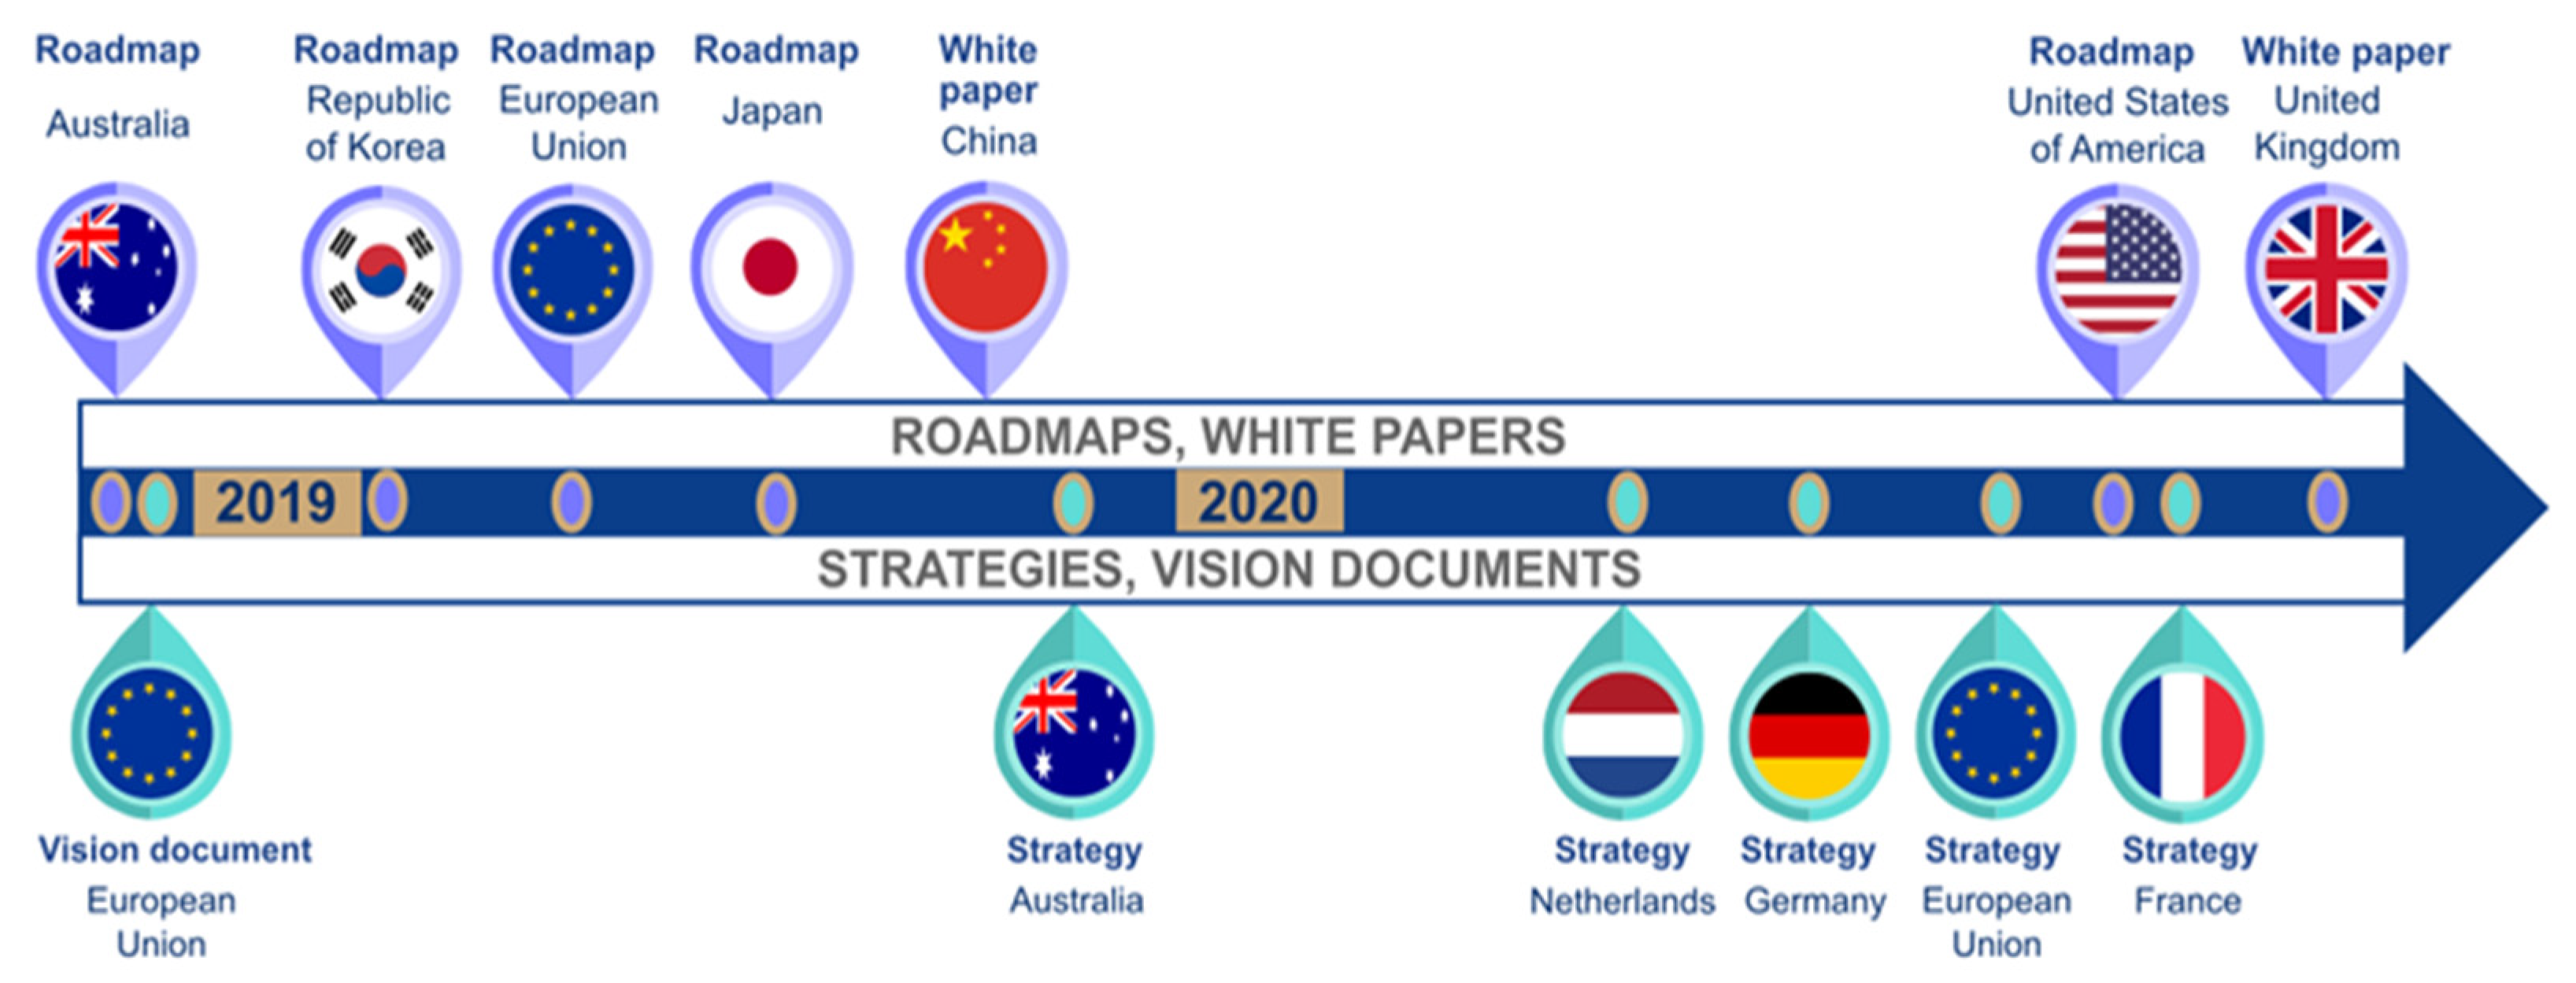
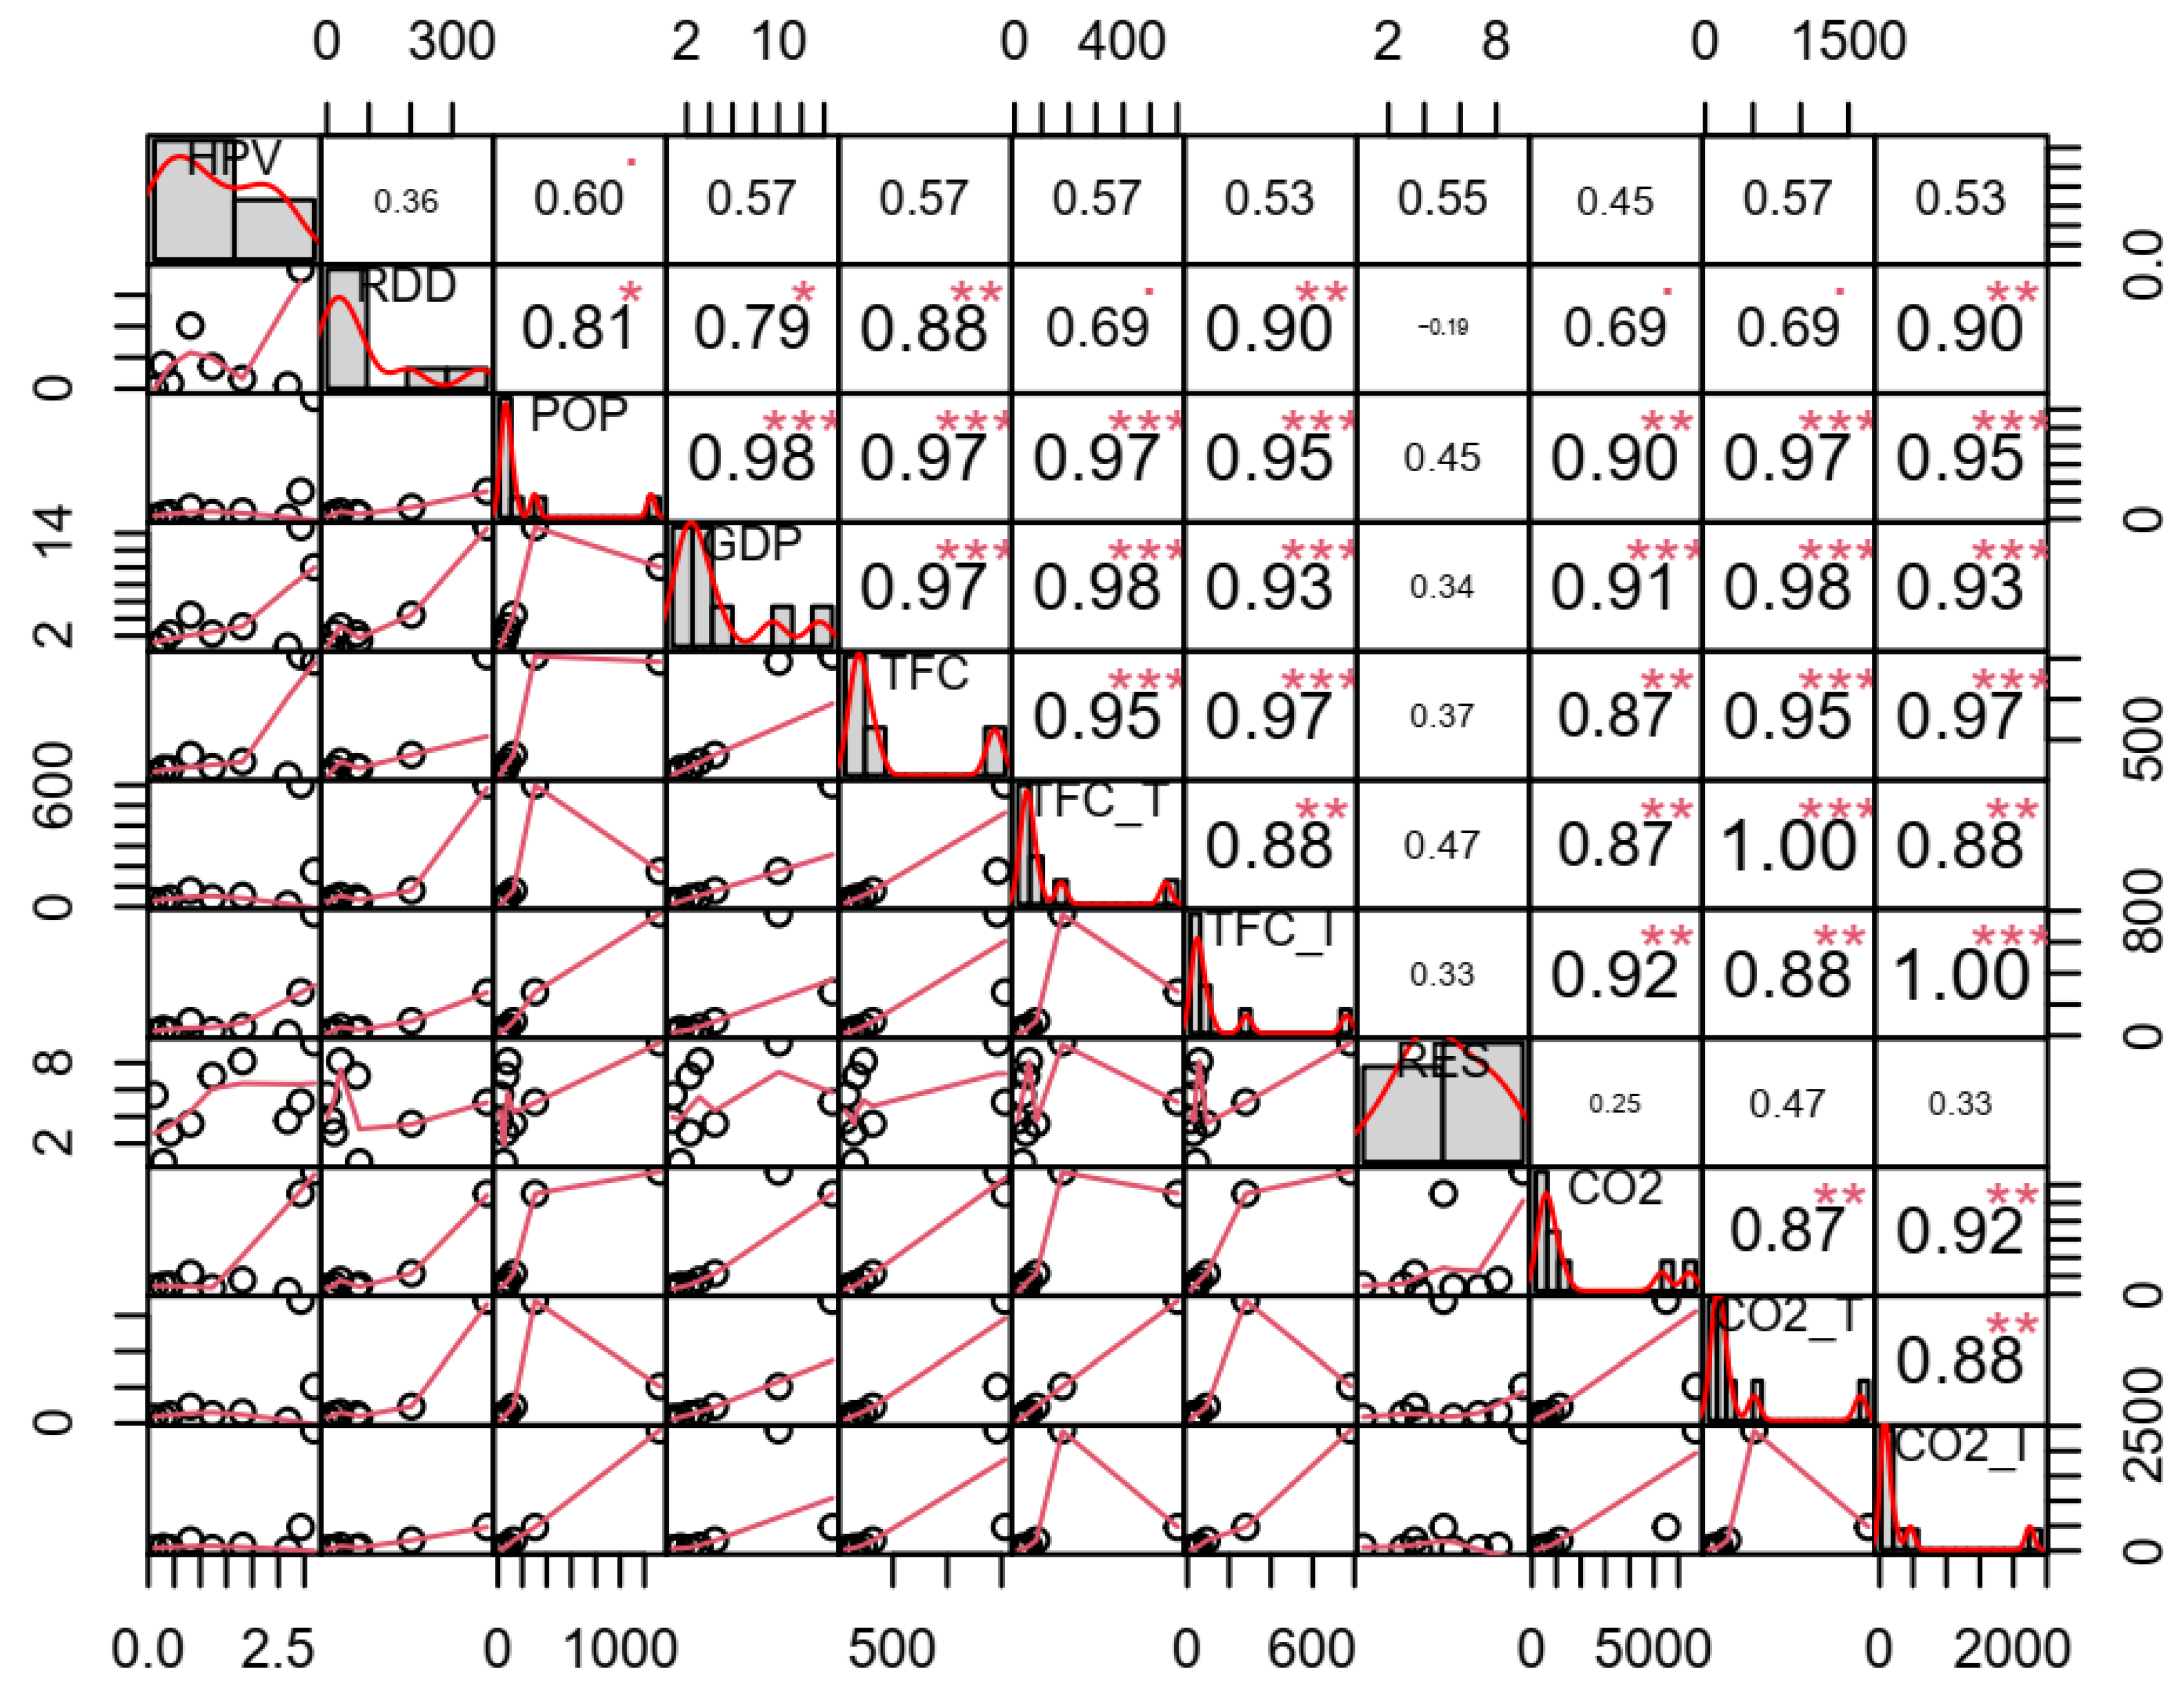
Table 1.
The values of the coefficient of determination for the linear regression (R2) for selected combinations of HPV and parameters xd1 and xd2—four pairs with the highest mean R2 for individual countries were presented. Color agenda: red—the highest value, green—the lower value; the best combination is bold.
| xd1 | xd2 | R2/Country | ||||||||||
|---|---|---|---|---|---|---|---|---|---|---|---|---|
| CHN | USA | JPN | KOR | NLD | FRA | UK | GER | AUS | mean | min | ||
| TFC_T/GDP | CO2_T/GDP | 0.995 | 0.991 | 0.889 | 0.906 | 0.689 | 0.664 | 0.912 | 0.884 | 0.892 | 0.869 | 0.664 |
| TFC_T/GDP | RES | 0.988 | 0.994 | 0.873 | 0.929 | 0.569 | 0.381 | 0.900 | 0.953 | 0.845 | 0.826 | 0.381 |
| GDP/POP | CO2_T/POP | 0.996 | 0.999 | 0.902 | 0.933 | 0.641 | 0.339 | 0.868 | 0.901 | 0.839 | 0.824 | 0.339 |
| TFC_T/GDP | CO2/GDP | 0.995 | 0.993 | 0.879 | 0.927 | 0.704 | 0.279 | 0.866 | 0.931 | 0.820 | 0.821 | 0.279 |
Abbreviations: POP—population; GPD—gross domestic product; TFC_T—total final energy consumption in transport; RES—share of renewable energy of primary energy supply; CO2—total carbon dioxide emissions; CO2_T—total carbon dioxide emissions in transport; CHN—China; USA—United States; JPN—Japan; KOR—Republic of Korea; NLD—Netherlands; FRA—France; UK—United Kingdom; GER—Germany; AUS—Australia.
Table 2.
The values of the coefficient of determination for the linear regression R2 for selected combinations of RDD and parameters xd1 and xd2—four pairs with the highest mean R2 for individual countries were presented. Color agenda: red—the highest value, green—the lower value; the best combination is bold.
| xd1 | xd2 | R2/Country | |||||||||
|---|---|---|---|---|---|---|---|---|---|---|---|
| USA | JPN | KOR | NLD | FRA | UK | GER | AUS | mean | min | ||
| POP/GDP | RES | 0.960 | 0.801 | 0.836 | 0.766 | 0.947 | 0.501 | 0.715 | 0.781 | 0.788 | 0.501 |
| RES | CO2_T/GDP | 0.944 | 0.791 | 0.842 | 0.794 | 0.959 | 0.568 | 0.544 | 0.775 | 0.777 | 0.544 |
| TFC_T/GDP | RES | 0.940 | 0.788 | 0.845 | 0.807 | 0.965 | 0.544 | 0.499 | 0.777 | 0.771 | 0.499 |
| TFC_I/GDP | RES | 0.933 | 0.813 | 0.853 | 0.847 | 0.952 | 0.431 | 0.401 | 0.808 | 0.755 | 0.401 |
Abbreviations: POP—population; GPD—gross domestic product; TFC_T—total final energy consumption in transport; RES—share of renewable energy of primary energy supply; CO2_T—total carbon dioxide emissions in transport; USA—United States; JPN—Japan; KOR—Republic of Korea; NLD—Netherlands; FRA—France; UK—United Kingdom; GER—Germany; AUS—Australia.
Table 3.
The values of the regression coefficients c1, c2, c3 (according to Formula (4)) for pairs xd1 and xd2 were selected based on Table 1 and Table 2.
| Country | HPV = c1 + c2*TFC_T/GDP + c3*CO2_T/GDP | RDD = c1 + c2*RES + c3*CO2_T/GDP | ||||||
|---|---|---|---|---|---|---|---|---|
| c1, bn m3 | c2 | c3 | p-Value | c1, USD mln | c2 | c3 | p-Value | |
| CHN | 0.983 | 2.952 | −0.974 | 0.338 | Lack of data | |||
| USA | 1.626 | 0.064 | −0.011 | 0.443 | −2716.3 | 123.2 | 21.4 | 0.265 |
| JPN | 1.026 | 0.196 | −0.071 | 0.373 | −554.1 | 60.9 | 9.2 | 0.281 |
| KOR | 0.708 | −0.015 | −0.002 | 0.908 | −89.8 | −4.8 | 2.6 | 0.77 |
| NLD | 0.765 | 0.017 | 0.032 | 0.97 | −81.6 | 8.8 | 1.2 | 0.226 |
| FRA | −2.976 | 3.618 | −1.204 | 0.254 | 98.1 | −9.2 | 0.6 | 0.679 |
| UK | −0.253 | 0.022 | 0.005 | 0.955 | 131.3 | −4.5 | −1.8 | 0.065 |
| GER | 3.973 | 2.984 | −1.114 | 0.009 | 173.0 | −5.7 | −1.9 | 0.273 |
| AUS | 0.401 | 0.044 | −0.018 | 0.074 | 14.0 | 2.5 | −0.3 | 0.545 |
Abbreviations: HPV—hydrogen production volume; RDD—energy RD&D in the hydrogen production and fuel cells category; GPD—gross domestic product; TFC_T—total final energy consumption in transport; RES—share of renewable energy of primary energy supply; CO2_T—total carbon dioxide emissions in transport; CHN—China; USA—United States; JPN—Japan; KOR—Republic of Korea; NLD—Netherlands; FRA—France; UK—United Kingdom; GER—Germany; AUS—Australia.
Table 4.
Selected parameters xd0, xd1, and xd2 for which R2 is the highest under the condition p-value < 0.05.
Table 4.
Selected parameters xd0, xd1, and xd2 for which R2 is the highest under the condition p-value < 0.05.
| Country | HPV | RDD | ||||||||
|---|---|---|---|---|---|---|---|---|---|---|
| xd1 | xd2 | R2 | xd0 | R2 | xd1 | xd2 | R2 | xd0 | R2 | |
| CHN | CO2/POP | CO2_I/POP | 0.9934 | POP | 0.91 | Lack of data | ||||
| USA | TFC_I/POP | CO2_I/POP | 0.9995 | POP | 0.99 | GDP/POP | TFC/POP | 0.9785 | RES | 0.84 |
| JPN | TFC/POP | CO2/POP | 0.8868 | GDP | 0.86 | TFC | CO2_T | 0.6178 | CO2 | 0.36 |
| KOR | POP | TFC_I | 0.9189 | GDP | 0.90 | TFC/GDP | TFC_I/GDP | 0.9891 | CO2 | 0.73 |
| NLD | Min. p-value 0.09 | Min. p-value 0.07 | TFC_I/POP | RES | 0.8375 | Min. p-value 0.23 | ||||
| FRA | Min. p-value 0.16 | Min. p-value 0.57 | RES | CO2_T | 0.9494 | RES | 0.86 | |||
| UK | POP | RES | 0.9384 | RES | 0.82 | TFC | CO2_T | 0.6759 | CO2_T | 0.46 |
| GER | CO2/GDP | CO2_T/GDP | 0.9355 | Min. p-value 0.25 | Min. p-value 0.11 | CO2_T | 0.37 | |||
| AUS | CO2/POP | CO2_I/POP | 0.9418 | POP | 0.81 | Min. p-value 0.18 | GDP | 0.46 | ||
Abbreviations: HPV—hydrogen production volume; RDD—energy RD&D in the hydrogen production and fuel cells category; POP—population; GPD—gross domestic product; TFC—total final energy consumption; TFC_I—total final energy consumption in industry; RES—share of renewable energy of primary energy supply; CO2—total carbon dioxide emissions; CO2_T—total carbon dioxide emissions in transport; CO2_I—total carbon dioxide emissions in industry; CHN—China; USA—United States; JPN—Japan; KOR—Republic of Korea; NLD—Netherlands; FRA—France; UK—United Kingdom; GER—Germany; AUS—Australia.
Publisher’s Note: MDPI stays neutral with regard to jurisdictional claims in published maps and institutional affiliations. |
© 2021 by the authors. Licensee MDPI, Basel, Switzerland. This article is an open access article distributed under the terms and conditions of the Creative Commons Attribution (CC BY) license (https://creativecommons.org/licenses/by/4.0/).
Share and Cite
MDPI and ACS Style
Cader, J.; Koneczna, R.; Olczak, P. The Impact of Economic, Energy, and Environmental Factors on the Development of the Hydrogen Economy. Energies 2021, 14, 4811. https://0-doi-org.brum.beds.ac.uk/10.3390/en14164811
AMA Style
Cader J, Koneczna R, Olczak P. The Impact of Economic, Energy, and Environmental Factors on the Development of the Hydrogen Economy. Energies. 2021; 14(16):4811. https://0-doi-org.brum.beds.ac.uk/10.3390/en14164811
Chicago/Turabian StyleCader, Justyna, Renata Koneczna, and Piotr Olczak. 2021. "The Impact of Economic, Energy, and Environmental Factors on the Development of the Hydrogen Economy" Energies 14, no. 16: 4811. https://0-doi-org.brum.beds.ac.uk/10.3390/en14164811
Note that from the first issue of 2016, this journal uses article numbers instead of page numbers. See further details here.