
Hold-Up Problems in International Gas Trade: A Case Study


1
Department of International Finance, I-Shou University, Kaohsiung 84001, Taiwan
2
Faculty of Management and Economics, Gdansk University of Technology, 80-233 Gdansk, Poland
*
Author to whom correspondence should be addressed.
Energies 2021, 14(16), 4984; https://0-doi-org.brum.beds.ac.uk/10.3390/en14164984
Submission received: 16 June 2021
/
Revised: 26 July 2021
/
Accepted: 10 August 2021
/
Published: 13 August 2021
(This article belongs to the Special Issue Challenge and Research Trends of Forecasting Financial Energy)
Abstract
:The infrastructure required for international natural gas trade is considerable, which often leads to hold-up problems and supply disruptions. This study discusses disruptions of gas supply from Algeria, Indonesia, Russia, and Turkmenistan since the early 1980s. The novelty of this study is its focus on the issues related to transit countries, which are rarely considered in the literature. The results of the study classify supply disruptions into six types, show the evolution of supply disruptions over time, and discuss mitigation strategies. The six types of disruptions include political change, price demands, debts, technical issues, transit fees, theft of gas. The evolution of the disruptions shows that the issues related to transit countries have become more frequent in the last two decades. Mitigation strategies tailored to transit countries include using an international organisation, designing contracts with price mechanisms that might reduce the possibility of disputes and reducing the number of parties involved in the trade.
1. Introduction
Since the break-down of the Soviet Union and until the hot war between Russia and Ukraine, these countries were involved in a mutually dependant gas trade, where Russia was an exporter and Ukraine was an importer as well as a transit country. During the 2000s Russia and Ukraine engaged in multiple severe gas wars in which Russia shut off the gas supply to Ukraine due to non-payment of debts, and as a bargaining tool for a price increase. Ukraine demanded a higher transit fee and diverted Russian gas exports to Europe for its own consumption, leading to supply disruptions in Europe. These gas wars led to a heightened interest in the hold-up problem and European gas supply security [1,2,3,4].
International natural gas trade is especially susceptible to hold-up problems because gas pipelines are expensive and asset-specific investments. Though natural gas can also be transported by specialised tanker ships as LNG (liquefied natural gas), liquefaction and re-gasification also require costly investments [5]. The hold-up problem is thus crucial for landlocked countries, as pipelined natural gas exports have to go through transit countries. The problem is exacerbated when more expensive alternative routes imply inertia in building such routes, overinvestment, and overdependence on transit countries [6,7]. Hence, the novelty of this study is its focus on the supply issues related to gas transit countries, which are rarely discussed in the existing literature.
As gas trade contracts are necessarily incomplete, changing market conditions might enable one party to take advantage of the other. For example, the higher oil price has led to Russia’s demands for higher gas price; and higher gas price in Europe has led to Ukraine’s demands for higher transit fee. As the value of asset-specific investments—gas pipeline—is zero in other trades, once the investments are made (often by the exporter), the counterparty (often a transit country) might attempt to appropriate quasi-rents from the investor [8]. The quasi-rents might be substantial, ranging from 5% to 22% of the value of the gas trade [7]. The appropriation of quasi-rents is easier with repeated bargaining and changing market conditions.
Participants in natural gas trade often try to solve the problem by vertical integration or incomplete long-term contracts, as specifying all contingencies might be prohibitively costly [8,9]. Long-term contracts help avoid repeated bargaining in the presence of asset-specific investment. Trades involving more substantial asset-specific investments are associated with longer-term contracts [10]. Changes in contract terms, which might reflect poor design, reduce the average contract duration [11]. However, these changes might also take place due to significant market changes, for example, decreased gas demand in Europe after the global financial crisis forced Gazprom to soften some terms of its long-term gas export contracts [12,13]. As contracts might be too rigid for some market changes, complex provisions, such as take-or-pay obligations, price adjustment provisions, and the use of the most favoured nation clause provide incentives for contractual performance [14,15].
The issues of supply security and hold-up became topical after Russia disrupted its gas supply to Europe. These gas wars lead to new measures of dependence on suppliers and transit countries in the literature, such as the Transit Risk Index [16]. Some authors suggest that Europe can improve its gas supply security by arranging supplies from Central Asia or the Middle East, by relying more on LNG, or by creating a unified energy market in the EU—Energy Union [3,17]. Others state that Russian gas will continue to dominate European gas supplies over the next decade [18].
Such gas supply disruptions in recent years show that long-term contracts often cannot prevent contractual breakdown. As discussed below, in the last few decades, many contracts have failed due to higher price demands, political changes, and other reasons, which often involve opportunistic behaviour. Hence, a broader view of such contractual breakdowns is necessary to generalize the causes and develop mitigation strategies. Hence, the contributions of this study include (1) summarising the major occurrences of gas supply disruptions since the 1980s; (2) classification of supply disruptions based on their causes; (3) illustration of the evolution of hold-up types over time; (4) suggesting hold-up mitigation strategies. This study expands understanding of the transit-related hold-up problem beyond the Transit Risk Index [16] by looking at different forms of risk. This study benefits energy policymakers in their endeavours to minimise the probability of gas wars and to secure energy supplies.
2. Case Studies
In presence of hold-up potential, there is a trade-off between an immediate opportunistic gain and a long-term cooperation gain. Below are several case studies where hold-up took place, involving some of the largest exporters of natural gas over the last few decades. The supply disruptions discussed below were often mainly initiated by the exporter, and sometimes by a transit country.
The exporters discussed below include Algeria, Indonesia, Russia and Turkmenistan. The selection criteria for the case study countries is the combination of the volume of natural gas exports and the availability of public information on their contractual performance. This study omits some large natural gas exporters, such as Qatar, due to a lack of publicly available information on opportunistic behaviour. Future research into Qatar’s experience might illustrate strategies that promote cooperation between trade partners, for example, amicable nationalisation of the world’s largest gas field in the late 1970s, and repeated forgiveness of take-or-pay penalty [19,20].
2.1. Algeria
Algeria has the 11th largest natural gas reserves in the world, at 4.5 Tcm (trillion cubic meters) (EIA, 2019). Over 70% of its gas exports go to Italy, Spain, France, and Turkey [21]. Algeria has acted opportunistically several times, involving contractual breakdowns, interrupted supplies, and unexpected price changes. This opportunistic behaviour was often associated with significant changes in market prices. The following paragraphs present the details of some instances of opportunistic behaviour.
2.1.1. Price Demands and Discontinued Supplies in 1980
In the early 1980s, with growing oil prices, Algeria’s contractual base gas price of $1.30/MBtu was unattractive. In comparison, the UAE increased its LNG price from $2.36/MBtu to $4/MBtu [22]. In January 1980, Sonatrach (the Algerian state-owned exporter) informed El Paso (USA) and Gaz de France (France) that its LNG price was increasing to $6.11/MBtu [23]. That doubled the price for France and tripled it for the USA. After three months of unsuccessful negotiations, on 1st April 1980, Algeria stopped sales to both buyers.
In the spring of 1981, the contract with El Paso (USA) was written off. Algeria claimed that deliveries to France in April 1980 were cut due to technical problems at the Skikda liquefaction plant. French technical advisers, however, found no problems at Skikda. Algeria also had spare liquefaction capacity at its Arzew plant once it cut deliveries to the USA [23]. Hence, these price demands resemble a hold-up rather than a result of market price change. Additionally, Algeria was flexible with export agreements of short duration and low volumes. A contract with Distrigas (USA) for less than 1.5 bcm (billion cubic meters) per year continued uninterrupted at the original price. In autumn 1980, Algeria agreed to extend an LNG contract with British Gas (UK) by nine months at $4.60/MBtu and $4.80/MBtu in the first and second halves of 1981. Beyond 1981, the parties agreed on fixed annual increases of 12%.
Non-opportunistic relations with France were restored in May of 1981, as the new Algerian government attempted to improve the relations. Gas deliveries to France were resumed with prices to be negotiated later. Later that year, Algeria and France agreed on the price of $5.118/MBtu. The parties applied the price retroactively to January 1980 [23].
2.1.2. Price Demands and Discontinued Supplies in 1981
In the autumn of 1981, Algeria unilaterally cancelled its LNG contracts with the Netherlands and West Germany. Distrigaz (Belgium) agreed to pay a higher price of $4.80/MBtu. In mid-1981, when the pipeline Algeria-Tunisia-Italy was more than half completed, Algeria informed SNAM (Italy) that the price demand increased from $3.50/MBtu to $5.50/MBtu. Consequently, the pipeline stayed idle for one year.
Non-opportunistic relations were restored in mid-1982, SNAM agreed to pay the higher price with the Italian government’s 12% subsidy. Algeria’s demands of higher prices from Belgium and Italy came at the cost of reduced export volumes.
2.1.3. Price Demands in 1986
The oil price collapse in 1986 led Sonatrach to alter its gas pricing policy again. After some difficult negotiations in Europe, Sonatrach arranged a new base price of $2.30/MBtu to reflect low oil prices and reintroduced a minimum price of $1.30/MBtu [22]. Algeria also modified its contractual principles (including switching from indexation formula to market-based pricing) to resume exports of LNG to the deregulated US market.
Algerian push for higher gas prices resulted in lost market share in the USA in the 1970s and in Europe in the 1980s. Sonatrach’s low gas exports led to reduced investments [22] and resulted in reduced production capacity. Consequently, when world energy consumption began to rise, Algeria could not increase its exports accordingly. This, together with the oil price collapse in 1986, brought a considerable financial strain on the country.
Non-opportunistic relations were restored in the early 1990s, as investment requirements prompted the government to attract foreign investments in the gas industry by relaxing some legislation. In the first half of the 1990s, Sonatrach offered more flexible take-or-pay provisions and pricing. New contracts signed in the early 1990s for the sale of gas to southern European countries indexed the price to gas oil and heavy fuel oil, to reflect the final consumers’ willingness to pay. Capital inflow from the new contracts allowed doubling of the capacity of the Trans-Mediterranean pipeline (Transmed) in 1994, and completion of the MEG (Maghreb-Europe Gas) pipeline in 1996.
In the 2000s, Algeria’s economy was booming given the high prices for oil and natural gas. By 2004, Algerian gas production became the eighth-largest in the world. By 2007, Algeria’s proven gas reserves became the eighth-largest in the world [24]. Algeria has increasingly allowed greater foreign investment, and foreign gas producers have entered into numerous partnership agreements with Sonatrach. In 2006, however, Algeria created a windfall tax on profits of foreign oil companies when oil price exceeds $30/bbl. In addition, Sonatrach’s option for new projects was increased from 30% to 51% [24,25].
2.2. Indonesia
Indonesia has about 3 Tcm (trillion cubic metres) of gas reserves [26], the largest in the Asia Pacific region. More than 70% of its reserves are located offshore. Since 1971, foreign oil companies can operate in Indonesia as contractors to state-owned Pertamina. Sales to Japan, South Korea, Taiwan and Singapore account for most of the Indonesian gas exports. Liquefied natural gas (LNG) is supplied under long-term contracts [5]. The gas is liquefied in two plants: Bontang and Tangguh; before 2015, a third plant—Arun—was operational, but it currently lacks feed gas for liquefaction [5,27,28,29,30].
Gas prices within the country are regulated, and the difference between the local price and the higher export price has caused friction between gas producers and the state in the 2000s [27]. For example, Indonesia has diverted gas exports to serve growing domestic demand. Indonesia has also disrupted exports due to a lack of gas reserves, which resulted from the failure to attract investments upstream. Changing market conditions have also led Indonesia to increase gas prices for new long-term contracts. The following paragraphs present the details of each instance of opportunistic behaviour.
2.2.1. Political Change and Price Demands in 2004–2005
In 2004, due to declining gas extraction and growing domestic demand, the new Indonesian government requested to divert some of the LNG-destined gas to local customers. This can be viewed as a hold-up of the firms producing gas in Indonesia, as the regulated domestic price was below the export price. The diversion resulted in LNG supply shortages, uncertainty about contract renewals, and possibly reduced upstream investments.
Due to the diversion, in 2005, Pertamina decreased LNG supplies to Japan, Korea and Taiwan by 51 cargoes, a significant reduction compared to the contracted volumes for that year [31]. Indonesia also increased its exported LNG price from $2.40/MBtu to $3.35/MBtu to Chinese, South Korean, Mexican and Japanese buyers [27]. This price increase was partly due to the diversions, and partly due to higher crude oil prices.
2.2.2. Political Changes and Discontinued Supplies in 2006
In 2006, due to growing domestic demand and lack of upstream investments, Indonesia restructured the gas industry to attract foreign investments. Foreign oil companies operating under PSA (production sharing agreement), however, had to sell at least 25% of oil and gas production locally at regulated low prices [31]. This requirement resulted in low upstream profitability and low investments. Despite restructuring the gas industry, due to lack of investments and consequent lack of gas reserves, Indonesia could not export the promised volumes of LNG under long-term contracts to the East Asian buyers in 2006 [27].
2.2.3. Discontinued Supplies in 2007–2009
While prioritisation of growing domestic gas consumption continued, it was not the main reason for falling LNG exports. During 2000–2006, gas consumption increased by 1% per year, and LNG exports declined by 3.2% per year [5]. Since 2006, the main reason for falling LNG exports was declining gas production, which was due to failure to attract investments. As a result, in 2007, Pertamina did not renew a contract for 3.1 bcm with South Korea. In March 2008, Pertamina reduced LNG supplies to Japan for the post-2010 period, from 16.3 bcm to 4.1 bcm for the first five years and 2.7 bcm afterwards. This reduction was crucial for Japan, as 16.3 bcm represented about 20% of Japan’s annual LNG imports. In 2009, Pertamina did not renew a contract for 2 bcm with Taiwan [5,32].
2.3. Russia
Russia is the largest natural gas producer and has the largest reserves in the world. Gazprom is the main producer of natural gas in the country with monopoly rights over gas exports. In 2017, Russia accounted for 35% of total European imports [33]. Russian gas will continue to dominate European gas supplies over the next decade [18]. Most of the Russian gas supplies to Europe passed through Ukraine, Belarus and Moldova. These transit countries are also heavily dependent on deliveries of Russian gas.
During the 1990s and 2000s, there were numerous gas disputes between Russia and these transit countries, emphasising the need to study the mutual dependence of suppliers and transit countries. The disputes arose due to accumulated debts, Russia’s price demands, theft of gas in transit to Europe, and Russian pressure to exchange debts for a share in gas transit networks [2].
2.3.1. Supply Interruptions in the 1990s
In February of 1993, Gazprom cut off the gas supply to Ukraine for the unpaid debt of over 238 million USD [34]. This interruption lasted for one day because Ukraine threatened to close the transit pipeline to Europe. This threat illustrated the mutual dependence between Russia and Ukraine, where Ukraine depended on imports of Russian gas and held negotiating power as a transit country. This interruption was one of several that happened for the reason of unpaid debts by the newly established states after the collapse of the Soviet Union.
Perhaps the newly established independent states were still learning how to deal with the disputes in the 1990s, as during 1998–1999, there was a continuous diversion of gas in transit to Europe by Ukraine. In November of 1999, Russia interrupted oil and electricity sales to Ukraine in response to a theft of nearly 4 bcm of gas in that month [35].
2.3.2. Gas Diversion and Interruption in 2003–2004
During 2002 and 2003, Gazprom tried to purchase a 50% stake in Beltransgaz, owner of the Belarusian transit network. At that time, Belarus was importing gas at Russia’s domestic prices. Russia and Belarus did not agree on the price of Beltransgaz, so the attempted purchase failed, and Gazprom warned of a price increase in 2004 from $30/1000 m3 to $50/1000 m3. Belarus refused, and Gazprom stopped the supplies to Belarus on 1 January 2004. Belarus started to divert Russian gas destined for Europe to domestic consumption. On 18 February 2004, Gazprom completely cut off the supplies to Belarus. In June 2004, Belarus agreed to the price of $46.68/1000 m3 [34].
This was one of the earliest examples of the bargaining power held by transit countries: the diversion of supplies. It illustrates the importance of setting up an international framework to ensure uninterrupted supplies to the final importer during a dispute between an exporter and a transit country.
2.3.3. Gas Diversion and Interruption in 2004–2005
In the summer of 2004, Russia and Ukraine agreed on the delivery of Central Asian gas to Ukraine and settlement of Ukraine’s debts for Russian gas delivered during 1997–2000. The transit fee in Ukraine was set at $1.094/1000 m3/100 kilometres, 2.5 times lower than in Poland [36]. Russia would pay the transit fee with gas at the price of $50/1000 m3, hence Russia would provide Ukraine with 21–25 bcm per year during 2005–2009 [1,35].
In March of 2005, the new Ukrainian government suggested that the transit tariffs be set at European levels and paid in cash. Gazprom, in return, suggested that Ukraine pays the European gas price. At that time the price paid by Ukraine was 25–30% of the gas price at the German border [1,35]. The disagreement escalated by May of 2005 when Gazprom could not retrieve 7.8 bcm of gas that it had pumped into Ukraine’s storage facilities. Gazprom suggested that the stolen volume would be subtracted from transit payments to Ukraine, valued at the European export price. Ukraine threatened to appropriate the corresponding volume from the gas in transit to Europe. Eventually, this problem was resolved by the agreement that part of the gas would be considered as payment for transit by Gazprom, and the rest would be returned during 2005–2006 [1].
2.3.4. Gas War in 2005–2006
In the summer of 2005, Ukraine objected to the debt settlement of 2004 as being excessive. In late 2005, Gazprom demanded an increase in gas prices to European levels ($160–$230/1000 m3) starting from 2006, unless Ukraine allowed the company to buy a stake in Ukraine’s transit pipelines. Ukraine rejected the acquisition but suggested a gradual increase in prices, starting from $80/1000 m3 in 2006 [1,34]. Ukraine also threatened to steal gas in transit to Europe or increase the transit fee if Gazprom insisted on the earlier price hike. On 1 January 2006 Gazprom cut off gas supplies to Ukraine. It appears that the root of this disruption was in Ukraine’s unwillingness or inability to settle its debt.
On 1 January 2006, Ukraine stole some of the Russian gas in transit to Europe. By 2 January European countries lost 14% to 40% of Russian gas supplies. On 2 January, Gazprom stated that it would pump an additional 95 million cubic metres of gas per day to compensate for Ukraine’s withdrawals. By 4 January, Russian gas supplies to Europe were back to normal. On 4 January, Gazprom and Naftogaz also announced the end of the dispute. They signed a contract for five years, stipulating a transit fee of $1.6/1000 m3/100 kilometres for 2006, and an average price for the mix of gas, mostly from Central Asia, of $95/1000 m3, including gas from Gazprom for $230/1000 m3 [1,34].
During these events, many European commentators suggested that Russia used its economic power in political relations with Ukraine. However, similar increases in Russian export prices occurred in other CIS countries. In 2006, for example, the Caucasus countries were required to pay $110/1000 m3. Similarly, Moldova was required to pay $160/1000 m3, double the price paid in 2005. When Moldova refused, Russia stopped deliveries to Moldova for 12 days in January 2006 [1]. Russia and Moldova agreed on the price of $110/1000 m3 [37]. In December of 2006, after a short dispute and a threat to cut gas supplies, Gazprom increased the price to Belarus to $100/1000 m3 (more than doubling of price) and purchased Beltransgaz for the minimum price requested by Belarus in the earlier dispute [38].
2.3.5. Threats and New Contract in 2007–2008
In late 2007, Russia increased the gas price to Ukraine to $179.50/1000 m3, and Ukraine increased the transit tariff to $1.7/1000 m3/100 kilometres [2,34]. In early 2008, Ukraine put these arrangements in doubt. By February Gazprom complained that Ukraine was taking gas in transit to Europe [2,34]. When the negotiation ran into some difficulties, Gazprom briefly reduced the supply of gas to Ukraine on 3 March 2008. Naftogaz replied that it could not guarantee the transit of gas to Europe if Gazprom decreased the supplies to Ukraine.
In October of 2008, Russia and Ukraine annulled the January 2006 contract and agreed on the following: (1) the price and tariff would increase gradually over three years; (2) Ukraine guarantees a reliable transit of gas; (3) Gazprom and Naftogaz would jointly export some gas to Europe [2]. Gazprom shared its lucrative European market with Naftogaz by allowing Ukraine to re-sell some of the gas to incentivise Ukraine for a peaceful implementation of the contracts.
2.3.6. Gas Wars and Debts Problems in 2009
On 2 December 2008, Naftogaz acknowledged that it faced difficulty repaying around $1 billion owed for Russian gas. In mid-December, Gazprom stated that the debt grew to $2.195 billion, and in response, Naftogaz paid $800 million [2]. On 19 December, Gazprom said that if Naftogaz does not pay the balance by the end of 2008, no supply contract would be signed for 2009. Previously Gazprom stated that if no agreement was reached by the end of 2008, the gas price could rise to $400/1000 m3.
On 30 December, Naftogaz paid $1.52 billion but disagreed with penalties of $614 million. On 1 January 2009, Gazprom cut gas supply to Ukraine, while supplies to Europe continued. On 4 January, Gazprom claimed that Ukraine had stolen 50 million m3 of gas, the next day the claim increased to 65.3 million m3. Gazprom requested that Ukraine supplied this volume to Europe from its own resources. Naftogaz stated that it took 52.2 million m3 as technical gas (Technical or fuel gas is required to run the compressor stations along a pipeline. The general practice is that technical gas is provided by the transit country and included in the transit tariff) [2].
On 6 January, Ukraine stated that Gazprom sharply reduced the gas flowing into the transit pipeline. Gazprom said that it provided only 64.7 million m3 out of 130 million m3 required on that day expecting Ukraine to add the missing 65.3 million m3. On 7 January, Gazprom stated that it had stopped all deliveries into the transit pipeline because Ukraine had closed it; Naftogaz said that it had closed the pipeline because Gazprom had stopped the supplies [2].
In the following days, the European Union prepared the terms of reference for a monitoring mission with representatives from both sides of the conflict and major European gas companies. Deployment of the monitoring mission did not result in the resumption of the supply of gas. Russia claimed that the gas could not flow because the transit pipeline was blocked; Ukraine said that no gas was supplied. Naftogaz requested that Gazprom should provide both the technical gas and linepack (Linepack gas is the gas that is maintained within the pipeline to keep the pressure and ensure uninterrupted flow) gas of 140 million m3 [2].
On 19 January, Russia and Ukraine finally signed an agreement to end the dispute. Gas flow to Europe restarted on 20 January and was back to normal after two days. The contract stated that 40 bcm would be delivered to Ukraine in 2009 and 52 bcm per year afterwards. The take or pay provision was 80%. The gas price would be 80% of the European price (netback from the German border) in 2009 and 100% beginning in 2010. The annual transit volume would be at least 110 bcm per year. The transit tariff was set at $1.7/1000 m3/100 kilometres for 2009 and $2.04/1000 m3/100 kilometres, plus an element of the 2009 gas price, for 2010. From 2011 the transit tariff would be indexed to EU inflation [2].
During the 2009 gas dispute, both sides clearly added to the creation and escalation of the dispute. The final payment for the debts by Ukraine was probably too late, there was no time left to make the 2009 agreement before the start of the year.
2.4. Turkmenistan
Turkmenistan has the 6th largest natural gas reserves in the world, at 7.5 Tcm [39]. During the Soviet era, Turkmenistan sent gas to the republics and received transit permission through Russian territory to sell gas to European customers. Deliveries of Turkmen gas were often disrupted due to the inability to pay (repay debts) for the imported gas, Turkmenistan’s demands for a higher price, hold-up by a transit country, and technical issues.
Turkmenistan’s dependence on transit countries was the highest until the late 1990s, when only one gas export pipeline was available, which connected Turkmenistan to Russia via Uzbekistan and Kazakhstan (Central Asia—Centre). Since 1993, Russia has stopped exports of Turkmen gas to Europe.
In 1997, Turkmenistan and Iran built a connecting pipeline with an initial capacity of 4 bcm per year, which was doubled by 2006 [34,40]. Iran financed much (80%) of the pipeline construction costs ($190 million), and 35% of annual deliveries of Turkmen gas were considered as reimbursement for Iran’s contribution [41].
In August of 2007, Turkmenistan and China started the construction of a connecting gas pipeline via Uzbekistan and Kazakhstan; Turkmenistan granted Chinese CNPC local exploration and production licences [34]. On 14 December 2009, gas started flowing from Turkmenistan to China [42,43]. Initially, the gas flow was around five bcm per year, with the full capacity of 40 bcm per year expected to be achieved by 2012.
Although these relatively newer pipelines to Iran and China improved Turkmenistan’s export options, a substantial share of the exports still had to transit through Uzbekistan and Kazakhstan.
2.4.1. Price Demands and Discontinued Supplies in 1992
In 1992, Turkmenistan demanded payment for its gas from all former republics in hard currency. Numerous non-payment disputes followed. In the spring of 1992, a price dispute between Turkmenistan and Ukraine led to the disruption of gas supplies to Ukraine. Turkmenistan wanted a price of $80/1000 m3 (comparable to the Norwegian export price of $92/1000 m3 [44]. Ukraine refused to pay more than $4.7/1000 m3. Turkmenistan cut the supplies on 1 March. After negotiations, Turkmenistan resumed gas supply in the autumn with the price set at $7.2/1000 m3 until the end of 1992 [45].
2.4.2. Transit Fee Demands in 1993
In January of 1993, Armenia, Azerbaijan, Georgia, Kazakhstan, Ukraine, and Uzbekistan increased the transit tariff for deliveries of Turkmen gas from $0.07/1000 m3/100 km to $0.43/1000 m3/100 km. In October 1993, Turkmenistan again tried to raise its gas price but did not succeed because the importers could not afford the higher price. Kazakhstan and Uzbekistan, which were among the importers as well as transit countries, retaliated by demanding higher transit fees for deliveries of Turkmen gas [45].
2.4.3. Debt Problems and Discontinued Supplies in 1994
In February of 1994, Turkmenistan cut gas deliveries to Ukraine due to the accumulated debt of $850 million. Later, Turkmenistan allowed Ukraine to pay partly in barter [34]. In early 1994, Turkmenistan also cut gas supplies to countries in Central Asia and the Caucasus because of non-payments [45]. Supplies to Georgia and Azerbaijan were interrupted because of the debt of $140 million and $35 million respectively. After negotiations, both countries agreed to the price of $80/1000 m3, with Georgia paying in barter and Azerbaijan paying partly in barter.
2.4.4. Debt Problems and Discontinued Supplies in 1997
In 1997, despite the gas sales to Iran, Turkmenistan’s exports fell to 6 bcm [32], as gas exports to Ukraine were stopped due to unpaid debts in March 1997 [34,35]. Between August 1997 and January 1998, the parties could not agree on a new price for the resumption of gas deliveries. During 1998 Russia encouraged the sales of Turkmen gas to Ukraine, which would free up some of the Russian gas for sales to Europe. In January of 1999, deliveries of Turkmen gas to Ukraine resumed under the agreement for 20 bcm per year at the price of $36/1000 m3, paid 60% in barter.
2.4.5. Debt Problems and Discontinued Supplies in 1999
In April 1999, Turkmenistan stopped gas deliveries to Ukraine again as Ukraine was already $100 million in debt and was unable to pay for any more gas [34,35]. In the summer of 2000, Turkmenistan and Ukraine signed a preliminary 10-year agreement with the price of $42/1000 m3 to be paid 50% in barter. Later, the Ukrainian president criticised the agreement because the price was too high. In October of 2000, Turkmenistan and Ukraine agreed for 5 bcm to be delivered in the rest of the year and 30 bcm in 2001 for a price of $40/1000 m3 [34,35]. Due to past non-payment problems, the agreement involved a $7 million insurance fund and weekly advance payments.
2.4.6. Price Demands and Discontinued Supply in 2001
In August 2000, Turkmenistan and Russia agreed on the purchase of 10 bcm from Turkmenistan at the price of $38/1000 m3, paying 60% in barter [35]. In January of 2001, Turkmenistan stopped deliveries to Russia after only 6 bcm had been delivered. Turkmenistan demanded that Russia match the payment terms of its contract with Ukraine; Russia agreed to the new terms in February.
2.4.7. Debt Problems and Discontinued Supply in 2005
In May of 2001, Turkmenistan and Ukraine signed a contract for 2002–2006 for the delivery of 40 bcm in 2002, 50 bcm in 2003, and total expected delivery of 250 bcm until 2010 [34,35]. The agreed price was $42/1000 m3, with 50% in barter. In October of 2002, the parties settled on a price of $44/1000 m3 for 2003 (50% barter) with 36 bcm to be delivered that year.
During 2003–2004, Ukraine failed to make timely payments to Turkmenistan, adding new debts to old ones. After several warnings, Turkmenistan cut the supply of gas to Ukraine (and to Russia) on 31 December 2004, and requested a higher price of $60/1000 m3 for supplies in 2005. Turkmenistan resumed exports to Ukraine on 3 January 2005 at $58/1000 m3, paid 50% in barter [34,35].
2.4.8. Price Demands and Discontinued Supply in 2005
In April of 2003, Russia and Turkmenistan signed a long-term agreement for 2003–2028 [35,46,47]. Gazprom would purchase 4–6 bcm in 2004, –7 bcm in 2005 and 10 bcm in 2006 at $44/1000 m3, with 50% in barter. The volumes would increase to 60–70 bcm in 2007, 63–73 bcm in 2008, and 70–80 bcm for 2009–2028. No prices were set for the post-2006 period. The significant increase in the volumes after 2006 would require most of the gas left after local consumption to be exported to Russia. This implies that Russia was taking over the supply of Turkmen gas to Ukraine once the contract between Turkmenistan and Ukraine was due to expire. Possibly, this was Gazprom’s way of ending direct gas deliveries from Turkmenistan to Ukraine, due to increased European gas prices.
On 31 December 2004, Turkmenistan cut the supply of gas to Russia (and to Ukraine) and requested a higher price of $60/1000 m3. Exports to Russia were resumed in May of 2005. Turkmenistan and Gazprom agreed that the price would stay at $44/1000 m3 in 2005–2006 but that the payment would be 100% cash. Turkmenistan justified the higher price demand and the supply interruptions on (1) a weaker US dollar, (2) higher prices of steel products received in barter in exchange for gas, (3) higher European gas prices.
2.4.9. Price Demands and Discontinued Supply in 2007
In December of 2007, Turkmenistan cut off gas supplies to Iran, attributing it to a technical fault. Extremely cold weather and a dispute over volumes and prices are suggested to be among the reasons for the supply disruption. Iran had been buying Turkmen gas for $95/1000 m3, significantly lower than its export price of about $300/1000 m3 to Turkey [5,34]. After four months of negotiations, Turkmenistan and Iran agreed on a price of $130/1000 m3 for the first half of 2008 and $150/1000 m3 for the second half of 2008.
2.4.10. Lower Price Demands by Importer and Technical Issues in 2009
In April of 2009, another dispute occurred between Turkmenistan and Russia. On 9 April, there was an explosion on the Central Asia—Centre gas pipeline because Russia significantly decreased the offtake from the pipeline. With the decreased gas demand and prices in Europe, Russia cut the imports from Turkmenistan, maintaining its own exports to Europe. Turkmenistan blamed Russia for the accident, while Russia answered that Turkmenistan was informed about the decrease in offtake and could have reduced the flow of gas into the pipeline. The price of Turkmen exports was around $200/1000 m3. In May, Gazprom suggested a decrease in the contracted sales volume for the second quarter of the year by 80% or a decrease in the current price of around $200/1000 m3, to which Turkmenistan did not agree. Gas supplies were resumed only in January 2010 at the annual volume of 11 bcm [48,49,50,51], considerably lower than the 70–80 bcm contracted in 2003.
3. Summary on Hold-Up Occurrences
3.1. Classification of Hold-Up Occurrences
In this section, we categorise the supply disruptions described above. The following categories emerge. (1) Non-payment of debts by the importers. This often led to the interruption of gas supplies and was most common in the 1990s after the break-up of the USSR. (2) Technical faults leading to supply disruptions. This might have been used to cover opportunistic behaviour. (3) Political changes (most notably, a change in the government or domestic orientation of a resource policy) that led to the non-fulfilment of existing agreements. (4) Demands for higher gas export prices, often based on significant changes in market conditions. In some cases, the exporters resort to supply disruptions. (5) Demands for a higher transit fee. This can also lead to supply disruption. (6) Theft of gas in transit. This can lead to supply disruption.
The first two categories listed above (debts and technical faults) are different from the rest in that they often are not due to opportunistic behaviour or hold-up. The latter two categories (transit fee and theft of gas) are special in that they are done by a transit country. The Table 1 below allocates the supply disruptions hold-ups into six categories.
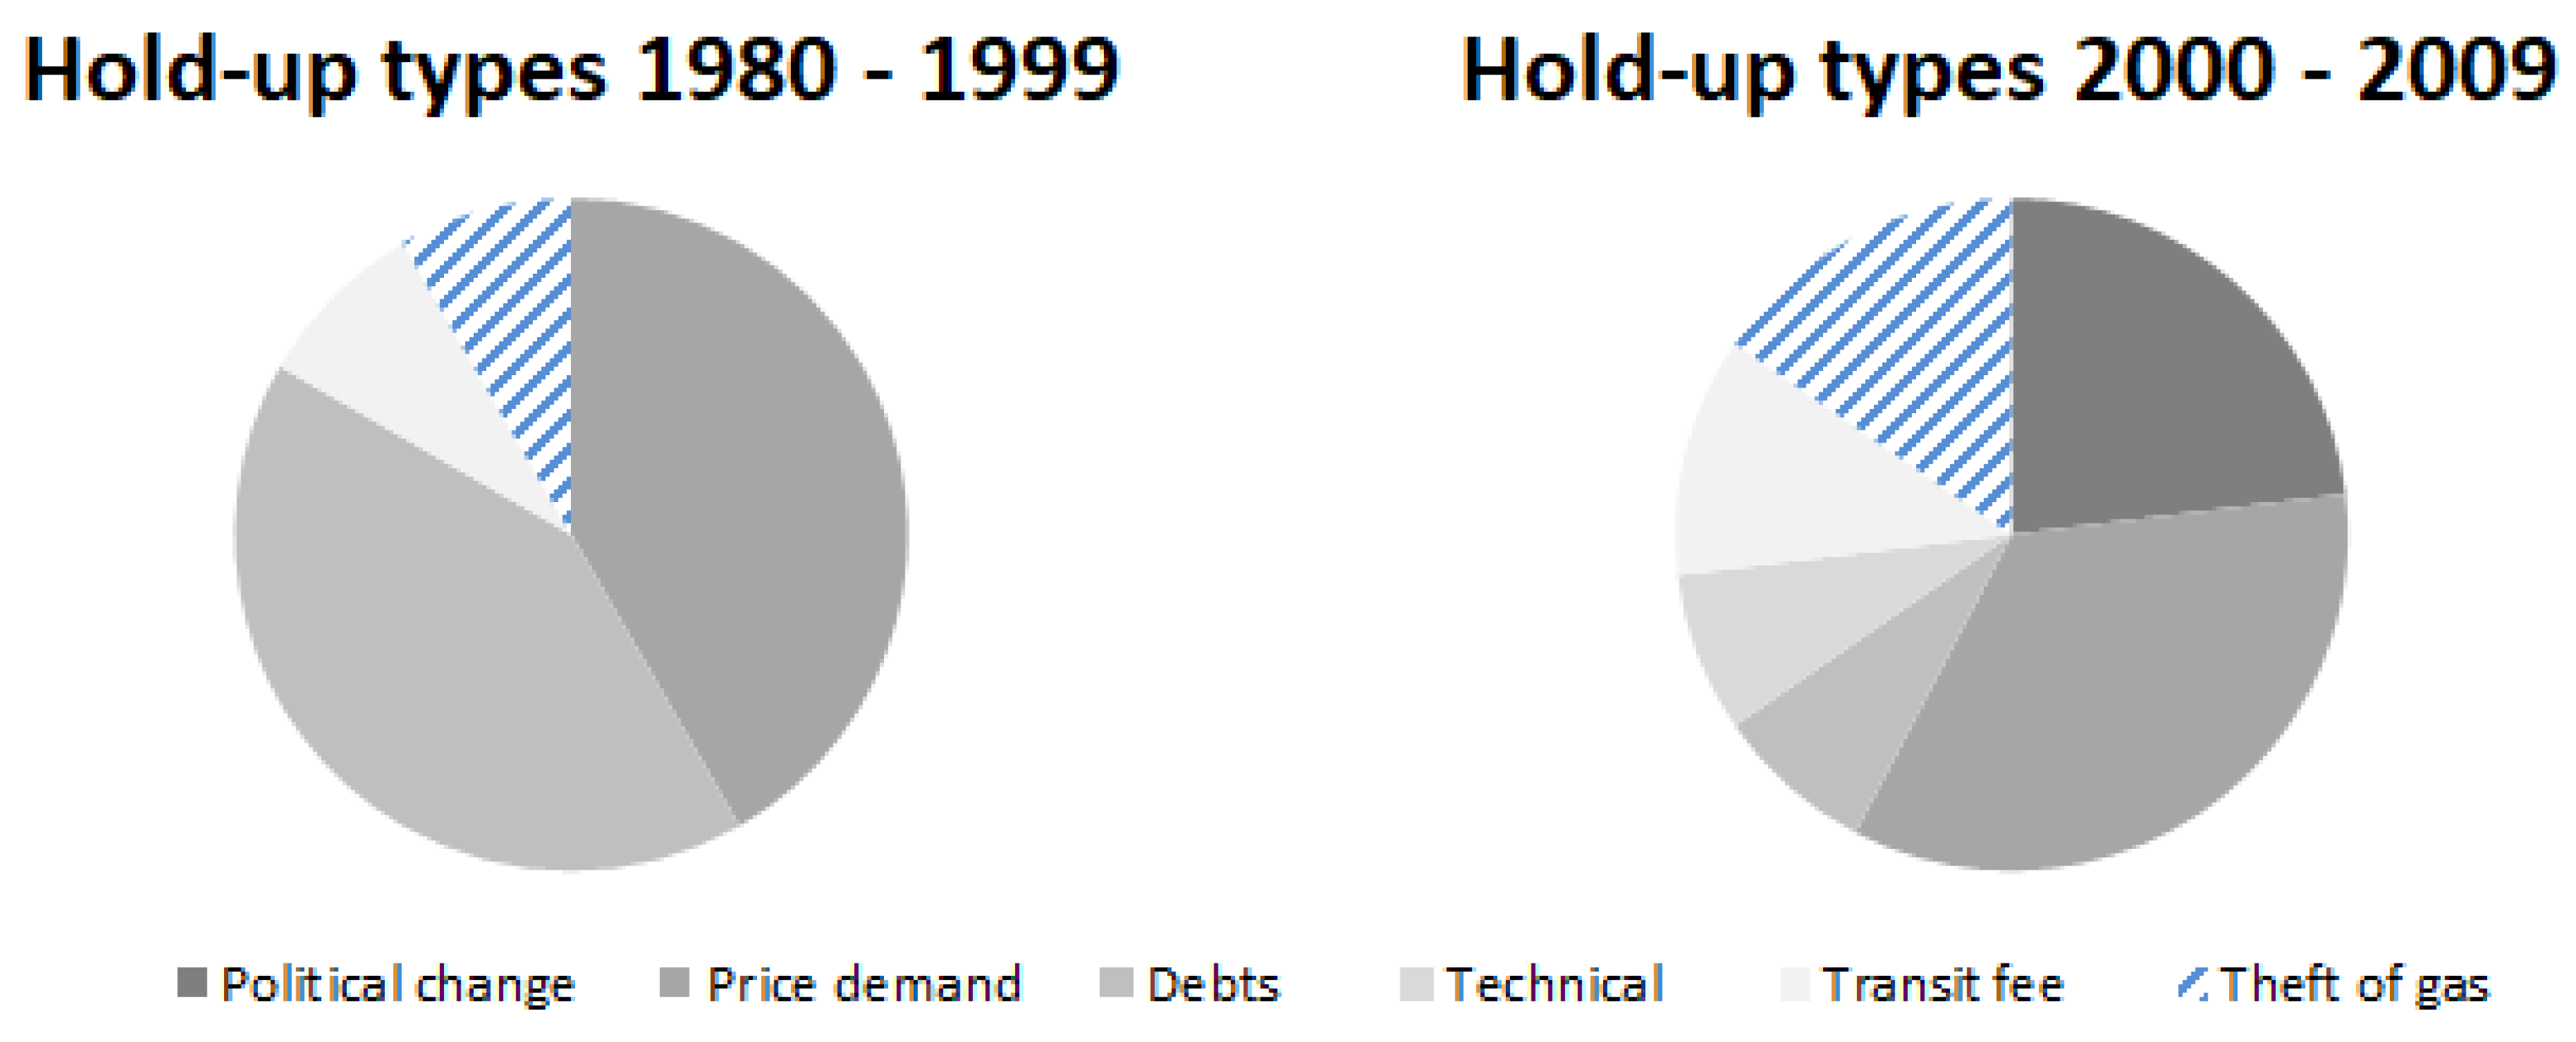
Figure 1 below shows the evolution of hold-up types, indicating greater diversity of reasons for supply disruptions, which attracted more attention to supply security indicators [52]. Before 2000, supply disruptions occurred mostly due to price demands and non-payment of debt. Most of the price demands were made by Algeria in the 1980s and by Turkmenistan in the 1990s. Most of the debt-related disruptions took place in the early 1990s, soon after the collapse of the Soviet Union. Many of the newly-emerged economies were too weak to pay for energy imports with hard currency. Supply disruptions related to transit countries—transit fee demands and theft of gas—occurred infrequently before 2000.
Since 2000, all six types of hold-ups took place. The most common cause for supply disruptions were price demands. The second most common cause for supply disruptions was political change. Price demands were made by Indonesia in the early 2000s and by Russia and Turkmenistan throughout the 2000s. Political changes led to supply disruptions in Indonesia and Russia as well as Ukraine throughout the 2000s. Hence, designing supply contracts that minimise the likelihood of a price dispute, even in case of some political changes, is crucial.
The importance of studying this evolution is emphasised by growing international integration, growing global demand for natural gas to reduce emissions, and growing costs of natural gas investments that increases hold-up potential. Since 2000, supply disruptions related to transit countries—transit fee demands and theft of gas—became more frequent and often complicated the situations around the hold-up. Disruptions related to transit countries are jointly the second most common after price demands since 2000. Hence, arrangements that minimise the likelihood of a dispute with transit countries are also crucial.
The hold-up problem is especially important in the multi-lateral framework, where transit countries are involved. Theoretically, the involvement of a transit country complicates the natural gas trade and increase hold-up potential. Empirical data seems to align with this theoretical notion: the evolution of supply disruptions emphasises the recent importance of transit countries, as disruptions related to transit countries have become more frequent since the year 2000. However, the literature does not contain a considerable discussion of hold-up problems due to a third party. This paper is an early step towards exploring supply disruptions related to transit countries.
3.2. Hold-Up Mitigation
Gas supply disruptions negatively impact households and businesses. Any future disruptions of the supply of Russian gas to Europe would have a significant impact on the economies of Eastern Europe, and a moderate effect on Western Europe [4,53]. This is because Eastern Europe depends more heavily on the supplies of Russian gas. Hence, mitigation of future hold-up is crucial. Three strategies may effectively mitigate the hold-up problem when three parties—exporter, transit country, importer—are involved in trade dependent on asset-specific investments coupled with volatile markets.
The three strategies discussed below are (1) resolving disputes through an international organisation; (2) designing contracts with price mechanisms that might reduce the possibility of disputes; (3) reducing the number of parties involved in the trade. Political issues have often led to gas supply disruptions multiple times. One strategy to mitigate the hold-up problem is to set up an international organisation that can help avoid or resolve the disputes. The Energy Charter Treaty (ECT) was created to facilitate energy flows from east to west in Europe. The ECT covers four main dispute areas: trade, investment, transit and settlement [54].
The Treaty promotes the principles of freedom of transit and non-discrimination, includes an obligation to provide national treatment for energy in transit, and prohibits interruption of flows and the placing of obstacles to the construction of new energy transportation facilities. It also contains a specific conciliation procedure for disputes over energy transit. The ECT requires that, in case of a dispute, the transit country shall not interrupt or reduce the existing flow of energy materials and products prior to the conclusion of the conciliation mechanism. The flow can only be stopped if it was allowed by the original contract or by the conciliator.
The ECT experience so far shows that the hold-up potential has not been eliminated, as parties can simply renege on the agreements. The ability of an international organisation to resolve disputes thus needs further improvement. Before the 2009 gas dispute between Russia and Ukraine, the Energy Charter Secretariat warned that Ukraine had to ensure non-interruption of transit [2]. However, the ECT could not prevent or effectively alleviate the dispute. The ECT (which had been signed and ratified by Ukraine) did not stop Ukraine from interrupting the transit. However, Russia has not ratified the Treaty, stating that it is biased towards consumers. Hence, for the ECT or any future similar organisation to effectively prevent and resolve disputes, it must have some enforcement mechanism.
One such enforcement mechanism is reputation, which has been used relatively successfully by the WTO (World Trade Organisation). The DSB (Dispute Settlement Body) of the WTO has at times been successful at resolving political hold-up problems by providing transparency and reputation damages for violators [55]. Another example of an enforcement mechanism derives from Klein’s [9] self-enforcing range: the parties could post substantial collateral forfeitable upon non-compliance.
Price disputes have also led to gas supply disruptions multiple times. Hence, a second strategy to mitigate the hold-up problem is to design contracts with price mechanisms that might reduce the possibility of disputes as a result of market changes. Current pricing in long-term gas contracts indexes the gas price to trailing averages of fuel oil derivatives prices in Europe [56] and of crude oil prices in Asia [52]. Temporarily large deviations of current price from longer-term averages might lead to disputes. Additionally, eliminating seasonality by indexing contract prices to longer-term average prices might lead to sub-optimal gas consumption or require additional costly gas storage. Although designing a better pricing mechanism than indexing gas prices to average fuel prices is difficult, perhaps accounting for seasonal changes in demand is beneficial.
The gas wars between Russia and Ukraine show that eliminating the need for a transit country can reduce hold-up potential significantly. Hence, a third strategy to mitigate the hold-up problem is to reduce the number of parties involved. This is what Russia is trying to achieve with its new gas pipeline projects, such as Nord Stream and Blue Stream. These pipelines connect Russia with its European customers while avoiding the territories of former Soviet republics (Belarus, Estonia, Latvia, Lithuania, Moldova, Ukraine). The drawback of this strategy is its cost; and delaying investment into expensive alternative routes might also serve as a deterrent [6].
Nord Stream is an offshore pipeline connecting Russia directly with Germany via the Baltic Sea. This pipeline has two lines, opening in 2011 and 2012, with a total capacity of 55 million m3. The capacity is being expanded with Nord Stream 2; which is expected to be completed in the third quarter of 2021 [57]. The cost of the pipeline is over $15 billion (onshore and offshore sections). Russian and German officials stated that this pipeline reduces costs due to the elimination of transit fees and increased pipeline pressure (eliminating the need for midway compressors) [58].
Blue Stream is an offshore pipeline connecting Russia with Turkey via the Black Sea. This pipeline started commercial gas supplies in 2003, with a capacity of 16 billion m3 per year. The cost of the pipeline is over $3.2 billion (onshore and offshore sections). Russian Gazprom stated that the significance of this pipeline is in bypassing transit countries (Bulgaria, Moldova, Romania, Ukraine) [59,60,61,62].
Russian investments in new multi-billion-dollar pipelines to avoid hold-up risks recognise the importance of hold-ups related to transit countries. Game-theoretic models show that potential investment in alternative transit routes shifts the bargaining power [7]. A broader understanding of transit-related hold-up problems and the development of mitigating strategies benefit from a clear account of historic cases of opportunistic behaviour. Hence, this study might be useful for academics in energy economics, for practitioners involved in international energy trade, and for policymakers at the highest state levels.
4. Conclusions
The potential for a hold-up problem is an important challenge in the international natural gas trade. As discussed above, multiple significantly large supply disruptions in the last two decades illustrate this importance. The reasons for this importance are because (1) gas pipelines are expensive and asset-specific investments; (2) international gas trade might include more than two parties to a transaction due to the presence of transit countries. The hold-up problem is thus crucial for landlocked countries. As discussed above, gas supply disruptions due to issues related to transit countries happened quite frequently in the last two decades.
The contribution of this paper is filling the gap in the literature, which rarely discusses the issues related to transit countries, despite their relative importance. Additionally, this paper also suggests three ways to ameliorate the issues related to transit countries: (1) use of an international organisation; (2) designing contracts with price mechanisms that might reduce the possibility of disputes; (3) reducing the number of parties involved in the trade.
Future research on the hold-up problem in natural gas might go along two routes. First, theoretical studies of the cost of a hold-up as a function of relevant factors. Second, empirical studies to test these theoretical studies. A better understanding of the factors affecting hold-ups might be enormously beneficial to avoiding them.
Author Contributions
Conceptualisation, G.N. and T.K.; methodology, G.N. and T.K.; investigation, G.N. and I.T.; resources: G.N. and I.T.; writing—original draft preparation, G.N. and I.T.; writing—review and editing, G.N. and T.K.; visualisation, G.N. and T.K.; project administration, G.N. and T.K. All authors have read and agreed to the published version of the manuscript.
Funding
This research received no external funding.
Data Availability Statement
The data are given in the paper. There is no other data to be provided separately.
Conflicts of Interest
Authors declare no conflict of interest.
References
- Stern, J. The Russian-Ukrainian Gas Crisis of January 2006; Oxford Institute for Energy Studies: Oxford, UK, 2006; Available online: https://www.oxfordenergy.org/publications/the-russian-ukrainian-gas-crisis-of-january-2006/ (accessed on 16 January 2019).
- Pirani, S.; Stern, J.; Yafimava, K. The Russo-Ukrainian Gas Dispute of January 2009: A Comprehensive Assessment; OIES: Oxford, UK, 2009; Available online: http://www.oxfordenergy.org/pdfs/NG27.pdf (accessed on 20 February 2019).
- Bilgin, M. Geopolitics of European gas demand: Supplies from Russia, Caspian and the Middle East. Energy Policy 2009, 37, 4482–4492. [Google Scholar] [CrossRef]
- Bouwmeester, M.C.; Oosterhaven, J. Economic impacts of natural gas flow disruptions between Russia and the EU. Energy Policy 2017, 106, 288–297. [Google Scholar] [CrossRef]
- International Energy Agency. Natural Gas Market Review; International Energy Agency: Paris, France, 2008. [Google Scholar]
- Hubert, F.; Suleymanova, I. Strategic Investment in International Gas-Transport Systems: A Dynamic Analysis of the Hold-Up Problem; DIW Discussion Papers, No. 846; Deutsches Institut für Wirtschaftsforschung (DIW): Berlin, Germany, 2008. [Google Scholar]
- Hubert, F.; Ikonnikova, S. Investment options and bargaining power: The Eurasian supply chain for natural gas. J. Ind. Econ. 2011, 59, 85–116. [Google Scholar] [CrossRef] [Green Version]
- Klein, B.; Crawford, R.; Alchian, A. Vertical integration, appropriable rents and competitive contracting process. In The Economic Nature of the Firm: A Reader; Putterman, L., Ed.; Cambridge University Press: Cambridge, UK, 1986; pp. 230–249. [Google Scholar]
- Klein, B. Why hold-ups occur: The self-enforcing range of contractual relationships. Econ. Inq. 1996, 34, 444–463. [Google Scholar] [CrossRef]
- Joskow, P. Contract duration and relationship-specific investments: Empirical evidence from coal markets. Am. Econ. Rev. 1987, 77, 168–185. [Google Scholar]
- Crocker, K.; Masten, S. Mitigating contractual hazards: Unilateral options and contract length. RAND J. Econ. 1988, 19, 327–343. [Google Scholar] [CrossRef]
- Konoplyanik, A. Russian gas at European energy market: Why adaptation is inevitable. Energy Strategy Rev. 2012, 1, 42–56. [Google Scholar] [CrossRef]
- Lee, Y. Interdependence, issue importance, and the 2009 Russia-Ukraine gas conflict. Energy Policy 2017, 102, 199–209. [Google Scholar] [CrossRef]
- Masten, S.; Crocker, K. Efficient adaptation in long-term contracts: Take-or-pay provisions for natural gas. Am. Econ. Rev. 1985, 75, 1083–1093. [Google Scholar]
- Mulherin, H. Complexity in long-term contracts: An analysis of natural gas contractual provisions. J. Law Econ. Organ. 1986, 2, 105–117. [Google Scholar]
- Le Coq, C.; Paltseva, E. Assessing gas transit risk: Russia vs the EU. Energy Policy 2011, 42, 642–650. [Google Scholar] [CrossRef] [Green Version]
- Austvik, O.G. The Energy Union and security of gas supply. Energy Policy 2016, 96, 372–382. [Google Scholar] [CrossRef]
- Mitrova, T.; Boersma, T.; Galkina, A. Some future scenarios of Russian natural gas in Europe. Energy Strategy Rev. 2016, 11, 19–28. [Google Scholar] [CrossRef]
- Dargin, J. The Dolphin Project: The Development of a Gulf Gas Initiative; Oxford Institute for Energy Studies: Oxford, UK, 2008; Available online: https://www.oxfordenergy.org/publications/the-dolphin-project-the-development-of-a-gulf-gas-initiative/ (accessed on 27 January 2019).
- Economist. Qatar Renegotiates Some LNG Contract Terms; Economist: London, UK, 2015; Available online: http://country.eiu.com/article.aspx?articleid=733733857 (accessed on 7 March 2019).
- BP. BP Statistical Review of World Energy, 67th ed.; BP: London UK, 2018; Available online: https://www.bp.com/content/dam/bp/business-sites/en/global/corporate/pdfs/energy-economics/statistical-review/bp-stats-review-2018-full-report.pdf (accessed on 23 March 2019).
- Mabro, R.; Wybrew-Bond, I. Gas to Europe: The Strategies of Four Major Suppliers; Oxford University Press: Oxford, UK, 1999. [Google Scholar]
- Stern, J. International Gas Trade in Europe: The Policies of Exporting and Importing Countries; Heinemann Educational Books: London, UK, 1984. [Google Scholar]
- Energy Information Administration. Country Analysis Briefs, Algeria; Energy Information Administration: Washington, DC, USA. Available online: http://www.eia.doe.gov/emeu/cabs/Algeria/pdf.pdf (accessed on 12 April 2019).
- The Encyclopedia of Earth. Energy Profile of Algeria. 2007. Available online: http://www.eoearth.org/article/Energy_profile_of_Algeria (accessed on 26 April 2019).
- World Factbook 2009. Available online: https://www.cia.gov/library/publications/the-world-factbook/index.html (accessed on 9 May 2019).
- Stern, J. Natural Gas in Asia: The Challenges of Growth in China, India, Japan and Korea; Oxford University Press: Oxford, UK, 2008. [Google Scholar]
- Source Watch. Arun LNG Terminal. Available online: https://www.sourcewatch.org/index.php?title=Arun_LNG_Terminal (accessed on 19 May 2019).
- Source Watch. Bontang LNG Terminal. Available online: https://www.sourcewatch.org/index.php?title=Bontang_LNG_Terminal (accessed on 19 May 2019).
- Source Watch. Tangguh LNG Terminal. Available online: https://www.sourcewatch.org/index.php?title=Tangguh_LNG_Terminal (accessed on 19 May 2019).
- International Energy Agency. Natural Gas Market Review; International Energy Agency: Paris, France, 2006. [Google Scholar]
- International Energy Agency. Natural Gas Information, World Supply; International Energy Agency: Paris, France, 2008. [Google Scholar]
- Energy Information Administration. Europe’s Liquefied Natural Gas Imports Have Increased Lately, but Remain Below 2011 Peak; Energy Information Administration: Washington, DC, USA, 2018. Available online: https://www.eia.gov/todayinenergy/detail.php?id=37354# (accessed on 14 February 2019).
- Pirani, S. Russian and CIS Gas Markets and Their Impact on Europe; Oxford University Press: Oxford, UK, 2009. [Google Scholar]
- Stern, J. The Future of Russian Gas and Gazprom; Oxford University Press: Oxford, UK, 2005. [Google Scholar]
- Energy Charter Secretariat. Gas Transit Tariffs in Selected Energy Charter Treaty Countries; Energy Charter Secretariat: Brussels, Belgium, 2006. [Google Scholar]
- Lobjakas, A. Moldova: EU Lauds Temporary Resolution of Moldova-Russia Gas Dispute. Radio Free Europe: Radio Liberty. 17 January 2006. Available online: https://www.rferl.org/a/1064794.html (accessed on 13 June 2019).
- BBC News. Russia-Belarus Gas Deal Reached; BBC: London, UK, 2009; Available online: http://news.bbc.co.uk/2/hi/europe/6221835.stm (accessed on 28 June 2019).
- Energy Information Administration. International Energy Portal, Beta; Energy Information Administration: Washington, DC, USA, 2019. Available online: https://www.eia.gov/beta/international (accessed on 15 February 2020).
- British Broadcasting Corporation. Iranian Media Reports on New Gas Pipeline; BBC: London, UK, 1997; Available online: http://news.bbc.co.uk/1/hi/world/monitoring/43226.stm (accessed on 11 July 2019).
- Energy Information Administration. Caspian Sea Region: Natural Gas Export Options; Energy Information Administration: Washington, DC, USA, 2002. [Google Scholar]
- Pannier, B. New Turkmen-China pipeline breaks Russia’s hold over Central Asian gas. Radio Free Europe: Radio Liberty. 14 December 2009. Available online: https://www.rferl.org/a/TurkmenistanChina_Gas_Pipeline_To_Open/1903108.html (accessed on 25 July 2019).
- Turkmenistan.ru. Turkmenistan-Uzbekistan-Kazakhstan-China Gas Pipeline Launched (14 December 2009). Available online: http://www.turkmenistan.ru/?page_id=3&lang_id=en&elem_id=16014&type=event&sort=date_desc (accessed on 7 August 2019).
- Statistics Norway. Statistical Yearbook of Norway. 2013. Available online: http://www.ssb.no/english/yearbook/emne09.html (accessed on 24 August 2019).
- Miyamoto, A. Natural Gas in Central Asia: Industries, Markets and Export Options of Kazakhstan, Turkmenistan and Uzbekistan; The Royal Institute of International Affairs: London, UK, 1997. [Google Scholar]
- Turkmenistan.ru. Russia and Ukraine Ready to Join Forces to Increase Turkmen Gas Purchases (29 October 2003). Available online: http://www.turkmenistan.ru/en/node/2636 (accessed on 8 September 2019).
- Turkmenistan.ru. Turkmen Gas as a Tool of Integration (19 February 2003). Available online: http://www.turkmenistan.ru/?page_id=12&lang_id=en&elem_id=5745&type=event&sort=date_desc (accessed on 22 September 2019).
- Turkmenistan.ru. Russia to Buy 11 bcm of Turkmen Natural Gas in 2010 (15 January 2010). Available online: http://www.turkmenistan.ru/?page_id=3&lang_id=en&elem_id=16153&type=event&sort=date_desc (accessed on 9 October 2019).
- Gazeta.ru Newspaper. Gazoprovodchika Vyzyvali? Gazeta.ru Newspaper: Moscow, Russia, 2009. [Google Scholar]
- Gazeta.ru Newspaper. “Gazprom” Razvyazal Ruki Turkmenam: Glavnyy Vopros—Razmer Ustupok; Gazeta.ru Newspaper: Moscow, Russia, 2009. [Google Scholar]
- Gazeta.ru Newspaper. Ih Gaz, Nash “KamAZ”; Gazeta.ru Newspaper: Moscow, Russia, 2009; Available online: https://www.gazeta.ru/politics/2009/08/24_a_3239869.shtml (accessed on 9 October 2019).
- Cabalu, H. Indicators of security of natural gas supply in Asia. Energy Policy 2010, 38, 218–225. [Google Scholar] [CrossRef] [Green Version]
- Abada, I.; Massol, O. Security of supply and retail competition in European gas market. Some model-based insights. Energy Policy 2011, 39, 4077–4088. [Google Scholar] [CrossRef]
- International Energy Charter. Energy Charter Treaty 1994. Available online: https://energycharter.org/process/energy-charter-treaty-1994/energy-charter-treaty/ (accessed on 18 October 2019).
- Carnegie, A. States held hostage: Political hold-up problems and the effects of international institutions. Am. Political Sci. Rev. 2014, 108, 54–70. [Google Scholar] [CrossRef] [Green Version]
- DG Competition. DG Competition Report on Energy Sector Inquiry; SEC(2006) 1724; European Commission, DG Competition: Brussels, Belgium, 2007; Available online: http://ec.europa.eu/competition/sectors/energy/2005_inquiry/full_report_part1.pdf (accessed on 6 November 2019).
- RT. Russia’s Nord Stream 2 Gas Pipeline to be Completed in August. RT. 12 July 2021. Available online: https://www.rt.com/business/528963-nord-stream-ii-completed-august (accessed on 25 November 2019).
- United Press International. Nord Stream Costs Ukraine $720 million. 2011. Available online: https://www.upi.com/Energy-News/2011/05/20/Nord-Stream-costs-Ukraine-720-million/83611305917575/ (accessed on 14 December 2019).
- Gazprom. Gas and Oil Reserves. Available online: http://www.gazprom.com/about/production/reserves/ (accessed on 28 December 2019).
- Gazprom. Gas and Oil Production. Available online: http://www.gazprom.com/about/production/extraction/ (accessed on 8 January 2020).
- Gazprom. Blue Stream: Russian Natural Gas Supplies to Turkey. 2018. Available online: http://www.gazprom.com/projects/blue-stream/ (accessed on 21 January 2020).
- Gazprom Export. Delivery Statistics. Available online: http://www.gazpromexport.ru/en/statistics/ (accessed on 4 March 2020).
Figure 1.
Classification of hold-up occurrences.


Table 1.
Summary of disruptions.
| Initiator | Date | Opportunistic Behaviour | Classification |
|---|---|---|---|
| Algeria | 1980 | Disrupted supply from Algeria to France and the USA. | Price demands |
| Algeria | 1981 | Disrupted supply from Algeria to Germany and Netherlands. Price hike for Belgium and Italy. | Price demand |
| Algeria | 1986 | Price hike for European importers. | Price demand |
| Indonesia | 2004–2005 | Reduced supply from Indonesia to Japan, Korea, Taiwan. Price hike for China, Japan, Korea, Mexico. | Price demand, Political change |
| Indonesia | 2006 | Disrupted supply from Indonesia to East Asian importers. | Political change |
| Indonesia | 2007–2009 | Disrupted supply from Indonesia to Korea and Taiwan. Reduced supply to Japan. | Political change |
| Ukraine | 1993 | Disrupted supply from Russia to Ukraine. | Unpaid debts |
| Ukraine | 1999 | Disrupted crude oil and electricity supply from Russia to Ukraine. | Theft of gas |
| Russia | 2003–2004 | Disrupted supply from Russia to Belarus. | Price demand, Theft of gas |
| Ukraine | 2004–2005 | Disrupted supply from Russia to Ukraine. | Political change, Transit fee demand, Theft of gas |
| Ukraine | 2005–2006 | Disrupted supply from Russia to Ukraine, higher transit fee. | Political change, Transit fee demand, Theft of gas |
| Russia | 2006 | Price hike for Belarus. | Price demand |
| Russia | 2006 | Price hike and disrupted supplies to Moldova. | Price demand |
| Ukraine | 2007–2008 | Reduced supply from Russia to Ukraine, price hike, higher transit fee. | Price demand, Transit fee demand |
| Ukraine | 2009 | Disrupted supply from Russia to Ukraine. Ukraine stole some of the Russian gas. | Political change, Unpaid debts, Theft of gas |
| Turkmenistan | 1992 | Disrupted supplies to Ukraine, price hike. | Price demand |
| Multiple transit countries | 1993 | Higher transit fee for gas from Turkmenistan. | Transit fee demand |
| Turkmenistan | 1994 | Disrupted supplies to Ukraine due to debts. | Unpaid debts |
| Turkmenistan | 1994 | Disrupted supplies to countries of Central Asia and the Caucasus due to debts. | Unpaid debts |
| Turkmenistan | 1997 | Disrupted supplies to Ukraine due to debts. | Unpaid debts |
| Turkmenistan | 1999 | Disrupted supply to Ukraine due to debts, price hike. | Unpaid debts, Price demand |
| Turkmenistan | 2001 | Disrupted supply to Russia, price hike. | Price demand |
| Turkmenistan | 2005 | Disrupted supply to Ukraine due to debts, price hike. | Price demand, Unpaid debts |
| Turkmenistan | 2005 | Disrupted supply to Russia, price hike. | Price demand |
| Turkmenistan | 2007 | Disrupted supply to Iran due to a technical fault, price hike. | Price demand, Technical issues |
| Russia | 2009 | Disrupted supply from Turkmenistan to Russia due to pipeline explosion, reduced imports. | Technical issues |
Publisher’s Note: MDPI stays neutral with regard to jurisdictional claims in published maps and institutional affiliations. |
© 2021 by the authors. Licensee MDPI, Basel, Switzerland. This article is an open access article distributed under the terms and conditions of the Creative Commons Attribution (CC BY) license (https://creativecommons.org/licenses/by/4.0/).
Share and Cite
MDPI and ACS Style
Nuryyev, G.; Korol, T.; Tetin, I. Hold-Up Problems in International Gas Trade: A Case Study. Energies 2021, 14, 4984. https://0-doi-org.brum.beds.ac.uk/10.3390/en14164984
AMA Style
Nuryyev G, Korol T, Tetin I. Hold-Up Problems in International Gas Trade: A Case Study. Energies. 2021; 14(16):4984. https://0-doi-org.brum.beds.ac.uk/10.3390/en14164984
Chicago/Turabian StyleNuryyev, Guych, Tomasz Korol, and Ilia Tetin. 2021. "Hold-Up Problems in International Gas Trade: A Case Study" Energies 14, no. 16: 4984. https://0-doi-org.brum.beds.ac.uk/10.3390/en14164984
Note that from the first issue of 2016, this journal uses article numbers instead of page numbers. See further details here.