
Effect of Pyrolysis Reactions on Coal and Biomass Gasification Process


1
Department of Thermal and Fluid Flow Machines, Faculty of Energy and Fuels, AGH University of Science and Technology, 30-059 Krakow, Poland
2
Department of Fuel Technology, Faculty of Energy and Fuels, AGH University of Science and Technology, 30-059 Krakow, Poland
3
Center of Energy, AGH University of Science and Technology, 30-059 Krakow, Poland
*
Author to whom correspondence should be addressed.
Energies 2021, 14(16), 5091; https://0-doi-org.brum.beds.ac.uk/10.3390/en14165091
Submission received: 13 July 2021
/
Revised: 1 August 2021
/
Accepted: 13 August 2021
/
Published: 18 August 2021
(This article belongs to the Special Issue Application and Development of Pyrolysis Technology)
Abstract
:Thermodynamic analysis of a gasification process was conducted assuming that it is composed of two successive stages, namely: pyrolysis reaction followed by a stage of gasification reaction. This approach allows formulation the models of selected gasification processes dominating in industrial applications namely: Shell (coal), SES (coal), and DFB (dual fluid bed, biomass) gasification. It was shown that the enthalpy of fuel formation is essential for the correctness of computed results. The specific computational formula for a wide range of fuels enthalpy of formation was developed. The following categories were evaluated in terms of energy balance: total reaction enthalpy of gasification process, enthalpy of pyrolysis reaction, enthalpy of gasification reaction, heat demand for pyrolysis reaction, and heat demand for gasification reactions. The discussion of heat demand for particular stages of gasification related to the various processes was performed concluding the importance of the pyrolysis stage.
1. Introduction
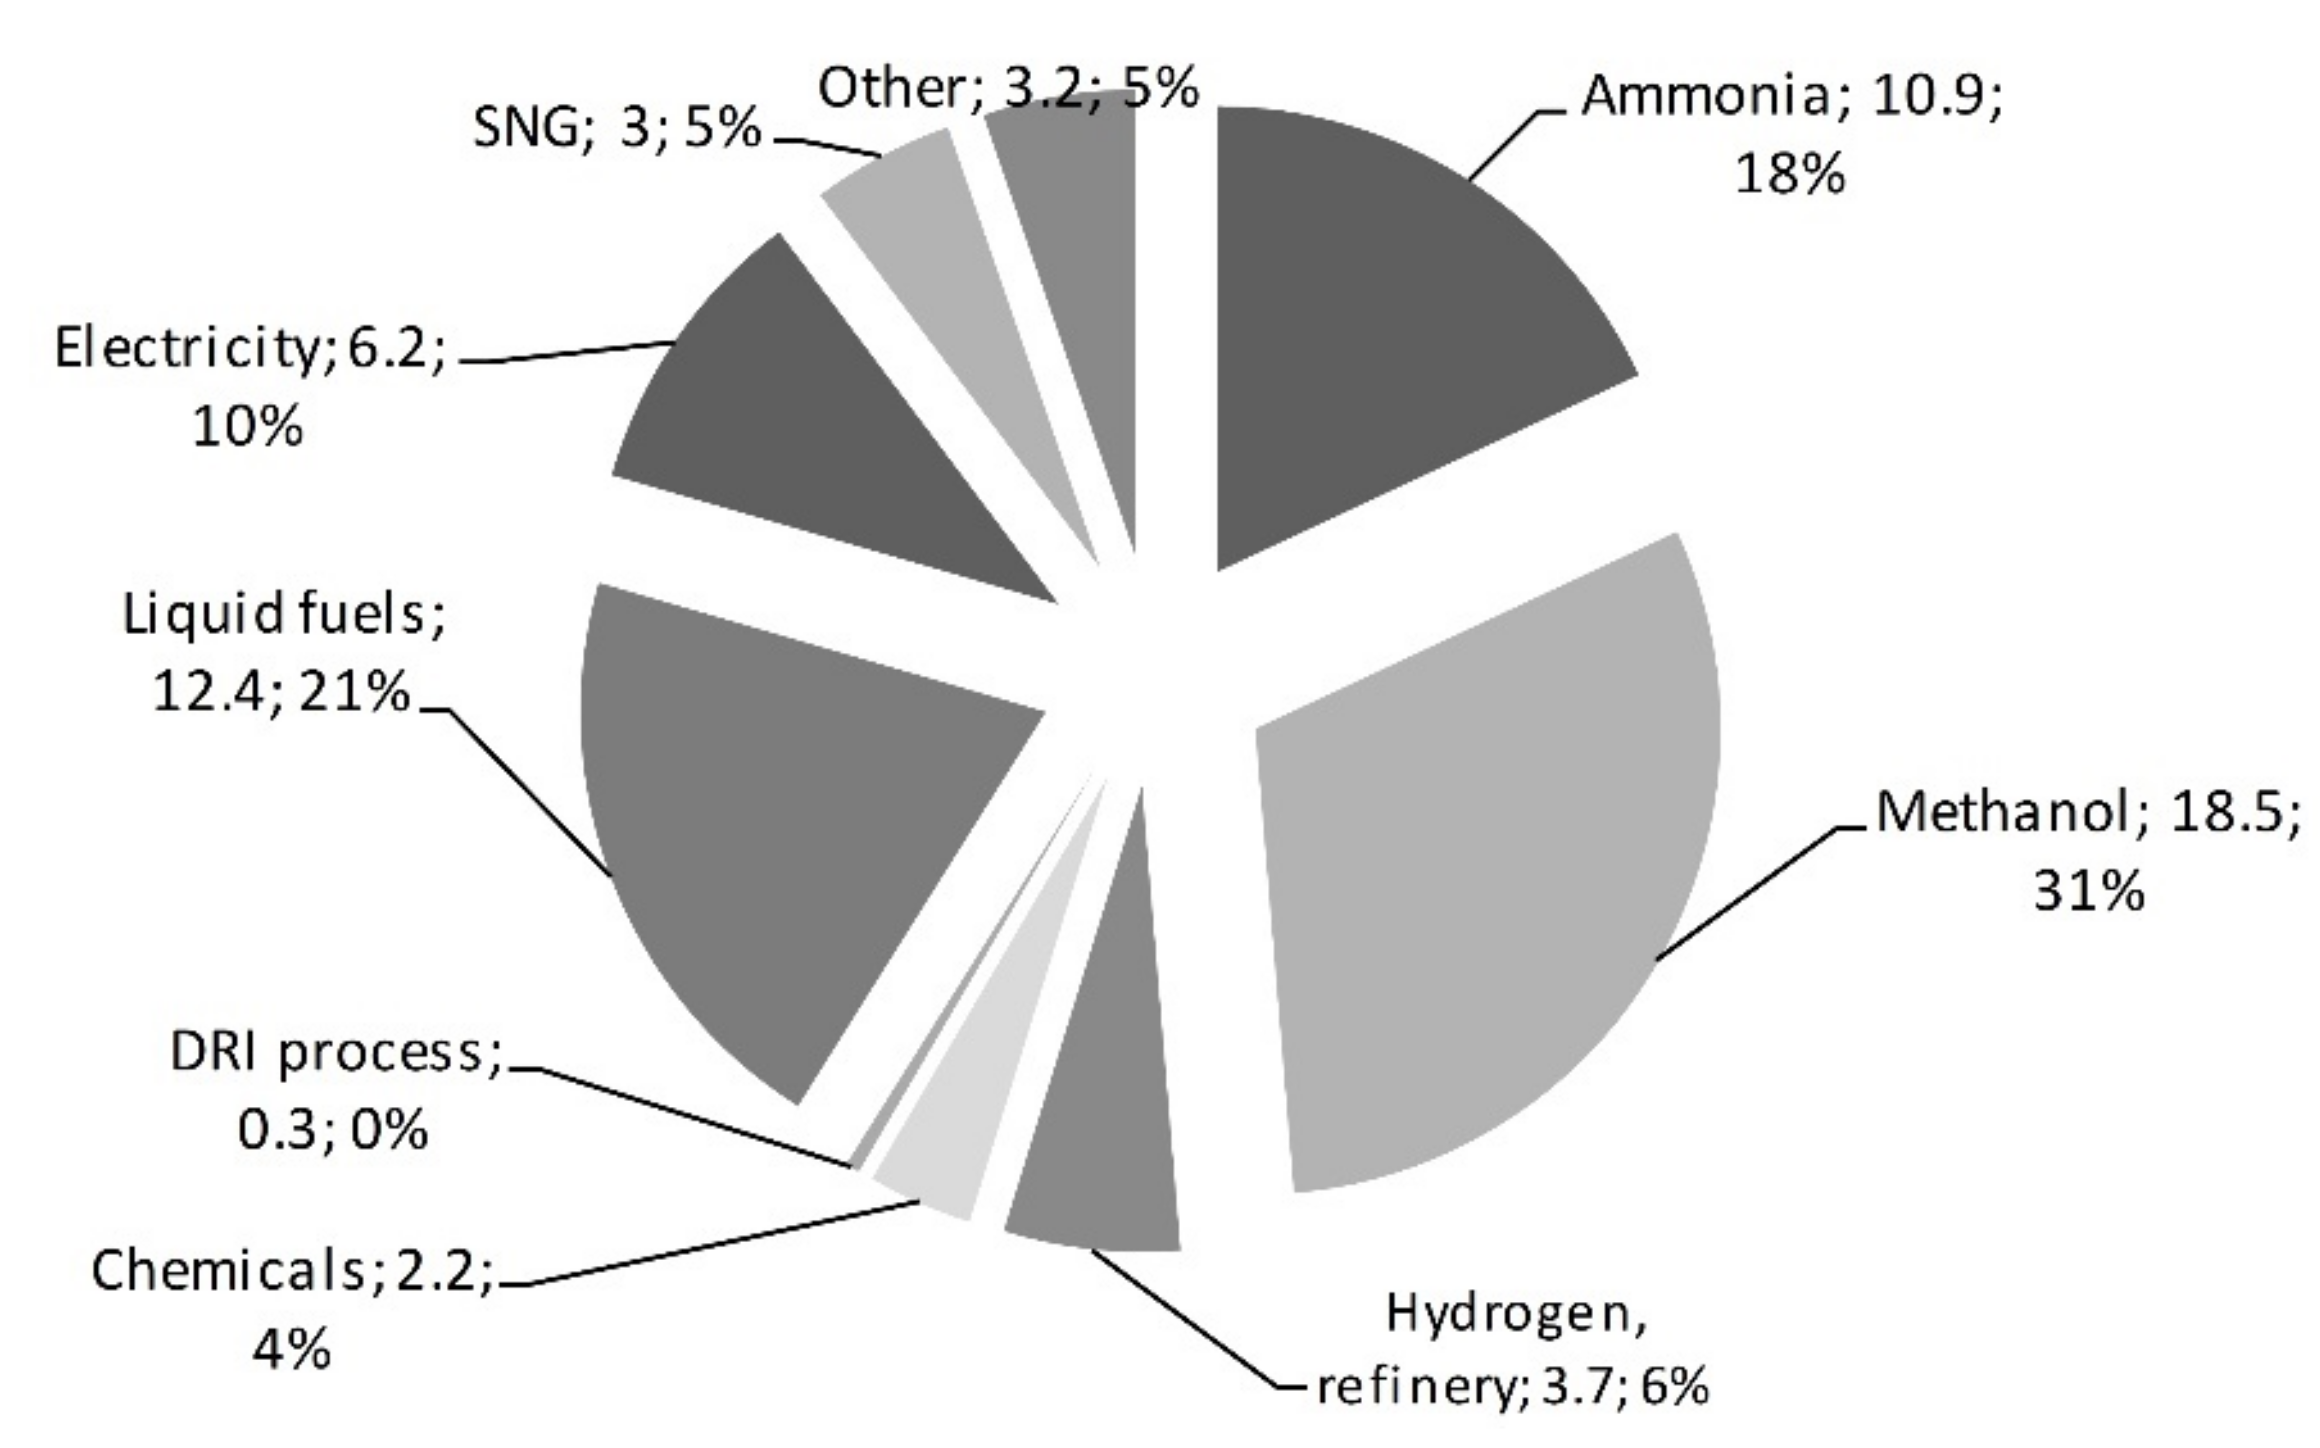
The coal gasification technology plays an important role in the global economy. It is used mainly to produce chemical substances; 24% of global ammonia output and 55% of methanol are now produced using the coal gasification technology. Figure 1 presents a final products oriented structure of the application of gasification technology.
In 2018 there were 451 industrial gasification plants operating worldwide, equipped with 1074 reactors of total power of 206 GWth (chemical energy in the produced gas); 129 plants were under construction, equipped with 255 reactors of total power of 108 GWth, and at the stage of planning there were 135 plants equipped with 667 gasification reactors [1]. A significant increase in the installed capacity occurred after 2010, resulting in 290% growth. Such a substantial increase was caused primarily by a huge demand for gasification technologies in Asia, where during 8 years (2010–2018) an approximately six-fold increase in the installed capacity was recorded (from 26.2 GWth to more than 150 GWth) [1,2].
There are a few types of reactor used to conduct the process. Entrained bed reactors are most frequently used in the case of coal gasification, featuring high process efficiency and productivity. Fluidized and fixed bed reactors are usually applied to gasify low-quality coals, biomass and wastes.
A wide application of the gasification intensifies the demand for reliable design tools and in depth understanding of thermochemical transformations proceeding in the reactor. One can find in the literature a relatively large number of described models. Reviews, classification, and application areas of solid fuels gasification models are presented in [3,4,5,6]. They refer to results of studies usually related to laboratory-scale test plants. Unfortunately, the models’ validation with the use of results obtained from industrial plants is missing. Because of that, published models—namely stoichiometric, equilibrium, kinetic or their hybrids—do not reflect all significant issues related to the gasification modelling. They also do not allow to use them reliably for other applications or reactor scales, primarily due to the accumulation of errors in underestimated reactions in equivalent pseudo-equilibrium constants or kinetic parameters.
Models described in the literature are usually based on a one-stage approach, i.e., consider only a classical set of gasification reactions [7,8,9,10,11]. These models are used primarily for gasification carried out at temperatures much higher than 1000 °C, where the equilibrium conditions may be applied with a relatively good approximation. The existence of two types of reaction, homo- and heterogeneous, may be also considered in this modelling [12]. Models, taking into consideration a two-stage fuel conversion, i.e., pyrolysis and gasification, are the second group [13,14,15]. These models are used mainly for processes occurring at temperatures of 750–1000 °C, basically carried out in fluidized bed rectors, however this approach should be also important in the analysis of high temperature gasification.
In [16] the two competing rates models were used to describe the devolatilization rate, basically distinguishing only volatiles and a char. The specific gaseous species composition was evaluated assuming arbitrary chosen parametric reactions. It is not clear whether the material balance at the pyrolysis step was closed. In [17] the authors did in depth analysis of different pyrolysis models which can be used in gasification modelling. It was concluded that the models of Ranzi [18] and Anca-Couce [19] are most appropriate for that purpose. However, those models are based on an arbitrary chosen set of reactions considering biomass morphology, i.e., lignin, cellulose and hemicellulose, not a chemical elements composition. In this situation it is hard to apply the model for other fuels as well as perform a material and energy balance of the pyrolysis. The same problem can be encountered with the application of the Anca-Couce model. In an extensive review of coal gasification published in [20], the authors discussed a number of published pyrolysis models; however, they are suitable either only for coal or there is a problem with closure of material and energy balances relevant for the process analysis of any gasification reactor.
However, irrespective of the reactor type or the temperature range of carried out reactions, the fuel is introduced at ambient conditions or close to it, and due to that in the first stage it must be heated to the reaction temperature. Taking into account that grains are heated in the fluidized bed at an average rate of 5000 °C/s, and in entrained bed reactors a few times faster, the grains achieve the reaction temperature in a fraction of a second. An intensive thermal decomposition (pyrolysis) of the organic matter dominates in this period and because of that oxygen has no access to the solid residue, i.e., char. Only after the release of volatile matter can the oxygen react with it in the gaseous phase or with the formed char in the heterogeneous phase. Taking this into account, it was assumed throughout that work that the entire gasification process is composed of a pyrolysis reaction stage which is followed by a gasification reaction stage. From this point of view, pyrolysis, which is the first stage of solid fuel conversion, becomes an important element of the process, first of all when deciding about gas phase composition and properties of char, and about heat demand, because it may consume the main portion of heat delivered for the reaction. This stage is non-isothermal, raising solid fuel temperature to the final one. The gasification reaction which follows is basically isothermal, and the pyrolysis products undergo decomposition due to interaction basically with oxygen or/and steam. Considering the above, it is important to distinguish both stages in the process of modelling and to analyze the share of energy needs for each of them. This will allow determining the effect of fuel type as well as process differences. At the pyrolysis stage, two key thermodynamic parameters are important from the point of view of energy balance, but also of the final products composition, i.e., the heat demand for pyrolysis, and enthalpy of pyrolysis reaction determined at standard conditions.
The modelling of fuels’ thermal conversion systems requires the knowledge of correct standard values of the enthalpy of formation for reactants and products. It allows real thermal effects of the reaction to be calculated and, as a result, the final process temperature affecting the potential equilibrium condition of chemical reactions existing in the process. In the case of fuels gasification this translates into the produced gas composition—the key parameter affecting the efficiency of the entire technological process.
Based on the knowledge of standard enthalpies of formation for process reactants and products, it is possible to determine a standard enthalpy of chemical reaction in accordance with a general relationship (1):
In reactions, in which only defined chemical substances take part, the determination of the enthalpy of reaction is relatively simple due to the availability of standard thermodynamic data of enthalpy of formation for pure substances [21].
In the case of coal or biomass it becomes more complicated, because the heat of combustion determined calorimetrically is not equal to the computational value of the heat of reaction determined from relationship (1), assuming that the fuel is a mixture of elements existing in their standard states [22,23]. The difference between these values is defined as enthalpy of formation, which should be accounted for in energy balances performed on the process.
There is no clearly validated formula on enthalpy of formation which can be used for the entire range of fuels, i.e., from coal to biomass and wastes. The paper expands the computational formula for fuels enthalpy of formation, described for coal in [23], on biomass and alternative fuels. The paper also discusses the impact of the enthalpy of formation for solid fuels on the results of the gasification process modelling in terms of energy balance. The obtained results have been compared against available literature data collected on real demonstration and industrial systems of coal or biomass gasification.
The gasification process model computations were performed using a ChemCAD computer code [24]. Like other similar computational tools (Aspen, EES), in the process energy balancing accounts for the enthalpy of substance formation used in chemical thermodynamics, in the case of the fuels under consideration based on elemental composition. To unify the computations over the entire range of carbon content, the formula derived in this work was applied. In the case of pyrolysis modeling a MathCad [25] computing environment was used for running in house developed simulation codes.
Based on the process computations carried out and balances verified by means of experimental data in fluidized bed and entrained bed reactors, processing both biomass and coal, the share and role of pyrolysis in the entire gasification process is discussed.
The process computations were made using the developed models of coal gasification in an entrained bed reactor with a dry feed (Shell technology, now The Air Products Gasification Process DSC (dry-feed syngas cooled) [26] and a fluidized bed reactor (based on the SES (synthesis energy systems) technology) [27]. In the case of biomass gasification, the developed model applies to the gasification system in a dual-bed type reactor, developed at the TU Wien (DFB, dual fluid bed) [28]. This technology, under the name of FICFB (fast internal circulating fluid-bed), was applied for the biomass gasification system in Güssing (Austria). The processes listed above are developed and applied in industrial scale and the data from those large scale units were used for the analysis of process performance in terms of heat demand and enthalpy flow considering the two-stage reaction system.
2. Methods and Assumptions
Three cases were evaluated in terms of in depth analysis of energy balance of gasification processes. All of them are based on operational data collected in industrial-scale units. In the case of the Shell process, the entrained bed reactor is used, for SES gasification (former U-Gas) the bubbling fluidized bed is used, and for the DRB-FICFB process the twin fluidized bed reactors are used.
2.1. Computational Model for an Entrained Bed Reactor, the Shell Process
The Shell gasifier is an oxygen blown entrained bed reactor with a dry feed of fuel. The Shell gasification technology was widely applied in chemical industry and electricity production systems. The fuel is fed to the gasification reactor in the form of pulverised coal of grain size below 0.1 mm with the use of nitrogen. Oxygen and steam are the gasifying agents. The fuel, oxygen, and steam are fed to gasification reactor burners situated in its bottom part. The gasification process runs in the reactor at temperatures of 1400–1700 °C (above the ash melting points), at a pressure of 42 bars. The technology is offered in two variants, with convection gas cooling (for applications in IGCC, integrated gasification combined cycle energy generation systems), and with gas cooling through direct contact with water (quench, in applications for chemicals production).
To simulate the gasification process an assumption was made that process temperature is so high that it is possible to model its parameters assuming a thermodynamic equilibrium of the system [29]. The method of thermodynamic potential minimisation was used for computations, applying a Gibbs reactor as the basic model (Figure 2). The method of thermodynamic potential minimisation is used in the case of complex reaction systems. In this method, for the set temperature and pressure, an equilibrium composition is sought for the considered system, for which its thermodynamic potential, expressed in the form of Gibbs function, reaches the minimum value.
The composition and properties of coals which were used for process calculations are presented in Table 1.
2.2. Computational Model for a Fluidized Bed Reactor, the Synthesis Energy Systems (SES) Technology
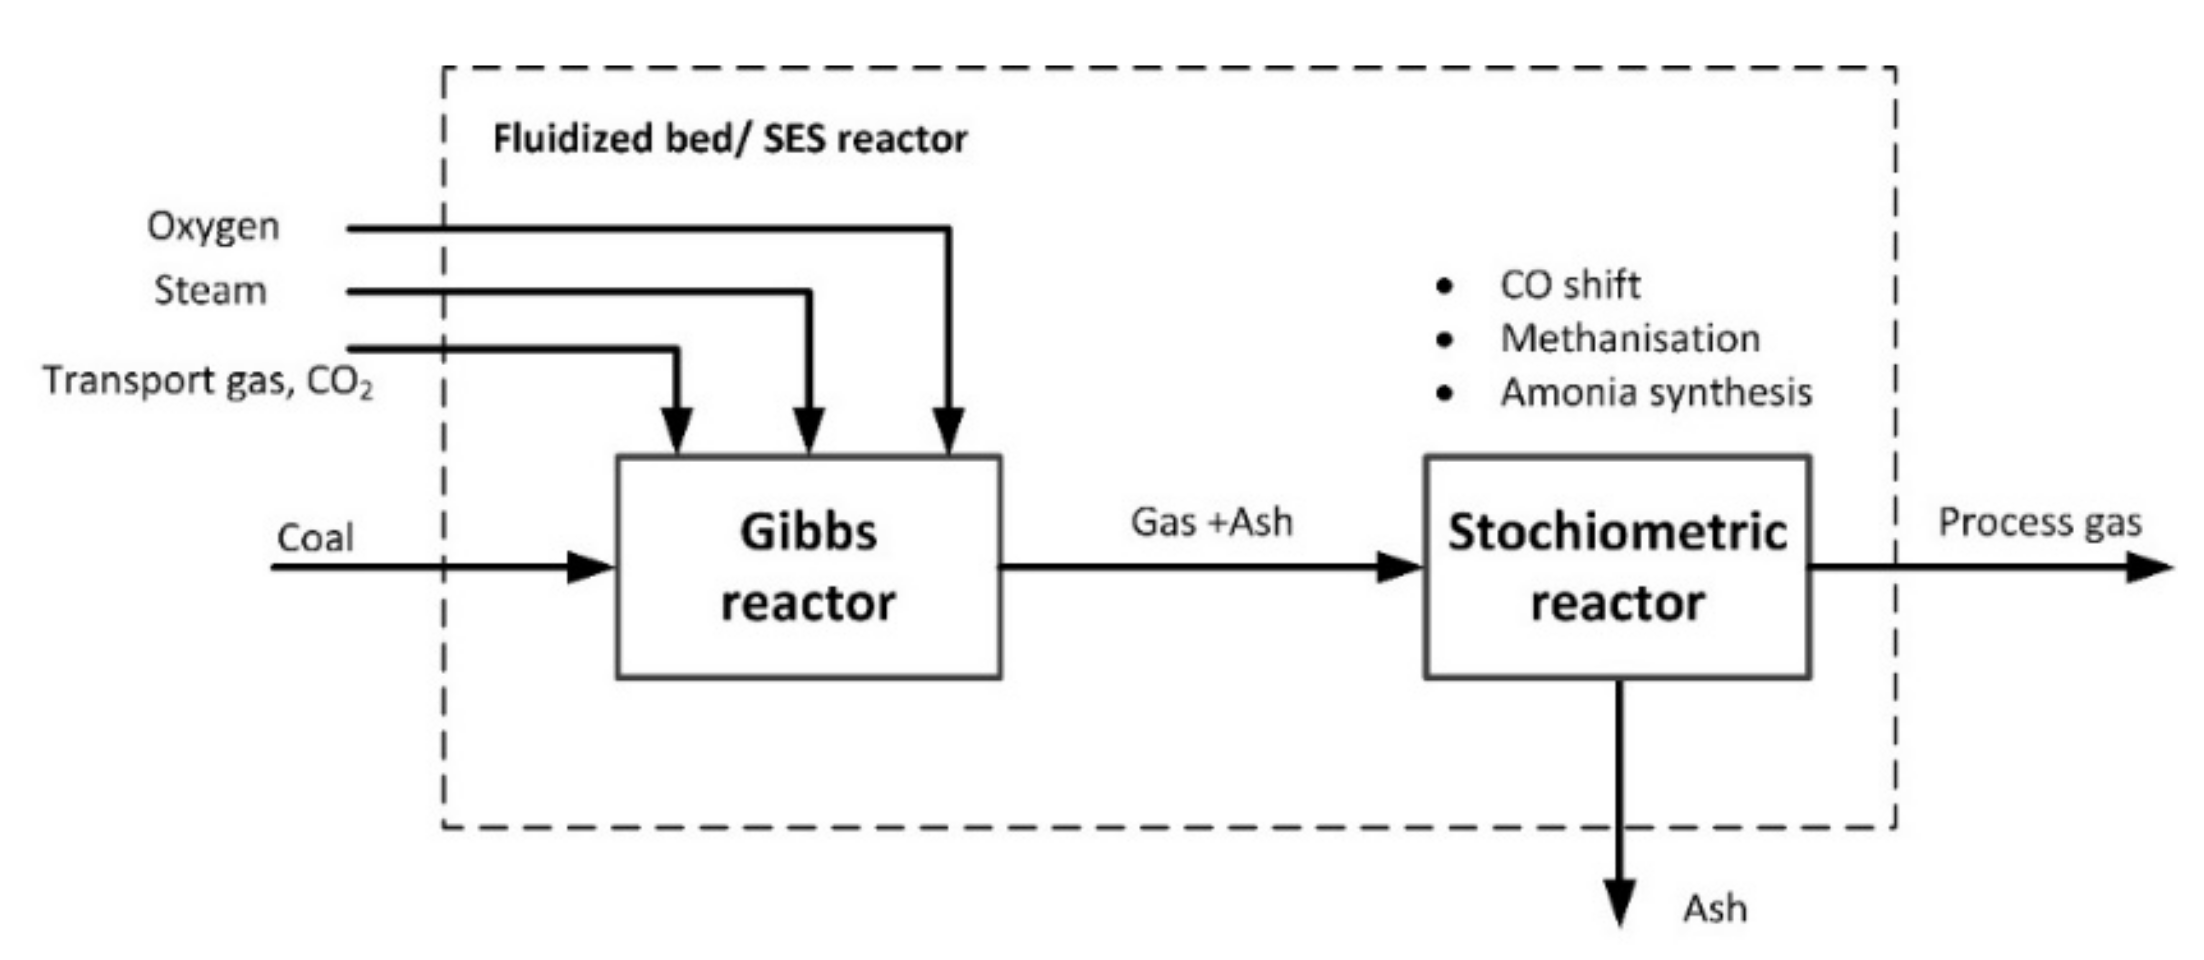
The SES gasification (former U-Gas) is the technology of oxygen/steam fluidized bed gasification used to produce synthesis gas for various applications. Five plants are operating now worldwide on an industrial scale, using 12 SES gasification reactors producing methanol and fuel gas (aluminium production plants). The developed model is based on a Gibbs reactor in series connected with a stochiometric reactor (Figure 3) [32]. The occurrence of three additional reactions is assumed in the stochiometric reactor, at the assumed conversion of CO and N2, i.e.,
CO shift reaction:
Methane production reaction:
Ammonia production reaction:
Process calculations were conducted for coals used in one of the industrial plants of 28 t/h coal throughput, the properties of which are presented in Table 2.
2.3. Computational Model for a Dual Fluid Bed (DFB) Fluidized Bed Reactor
The DRB-FICFB technology consists of two fluidized bed reactors. In the first the gasification proceeds in the atmosphere of steam. Sand is used as the fluid bed material. Sand and the unreacted char leave the reactor at the bottom and enter an air fluidized bed reactor for combustion. Hot sand, after separation from the flue gas in a cyclone, is returned to the gasification reactor and used as a heat carrier. This technology was developed at the Technological University in Vienna and demonstrated in Güssing, in a CHP (combined heat and power) system, where electricity and heat are generated at amounts of 4 MW [33]. The model described elsewhere [34] considers two main stages of the biomass reaction: the first one pyrolysis, which is followed by gasification of unreacted char, remaining tar, and selected pyrolysis gas components. The model is based on the first order single devolatilization reaction kinetics. Based on a literature study, the model parameters were modified to describe biomass pyrolysis. The pyrolysis model encompasses also thermally driven secondary decomposition of tar. The products of the pyrolysis reaction are: pyrolytic gas consisting of: CO, CO2, H2, CH4, higher gaseous aliphatic hydrocarbons represented by C2H6, additionally H2S and NH3, water, BTX represented by benzene, tar represented by 1-naphthol (C10H8O) and unreacted char with ash. Primary and secondary pyrolysis products were gasified using steam. For gasification process calculations the pseudo-equilibrium model was employed. The model embodies three reactions, namely:
Water gas reaction:
water gas shift reaction:
reaction of tar with steam according to arbitrary assumed stoichiometry:
The graphical layout of the model can be seen in Figure 4. The two stage pyrolysis model was developed in the Mathcad 15 computing environment.
Specific correction factors were assumed to the equilibrium constant of water–gas and water–gas shift reactions. The value of thermodynamic constant was multiplied by the factors of 100 and 0.85, respectively [34].
The model verification was based on the experimental data obtained in an experimental plant of a biomass steam gasification reactor (DFB) of 100 kW power, developed at the TU Wien [33]. The experimental plant was equipped with a biomass and steam gasification reactor and a fluid-bed char combustor for heat generation, which is necessary for gasification. The properties of the fuel are listed in Table 3.
3. Results and Discussion
3.1. Enthalpy of Formation
Ronsch and Wagner [35] concluded regarding organic substances (e.g., coal, biomass) that the heating value in general is determined with the help of empiric correlations depending on the elemental fuel composition. However, as the correlations used in flowsheet simulation programs are often developed for coal or biomass calculations, using the same formula for the entire range of fuels may lead to incorrect results. In a study presented by Sciazko [21] the analysis of the enthalpy of formation of coal was debated with respect to the composition of coal. The difference between the measured heat of combustion and the calculated thermal effect of combustion, which defines the formation enthalpy, was based on 224 sets of data describing the properties of American [36], Russian [37] and Polish [38] coal and char/coke.
The coal/coke data were supplemented for the work under consideration with 76 sets of data published by Channiwala, Parikh [39,40] who studied correlations on biomass HHV including biowastes. The database comprised then a wide spectrum of fuel properties, and the ranges are presented in Table 4.
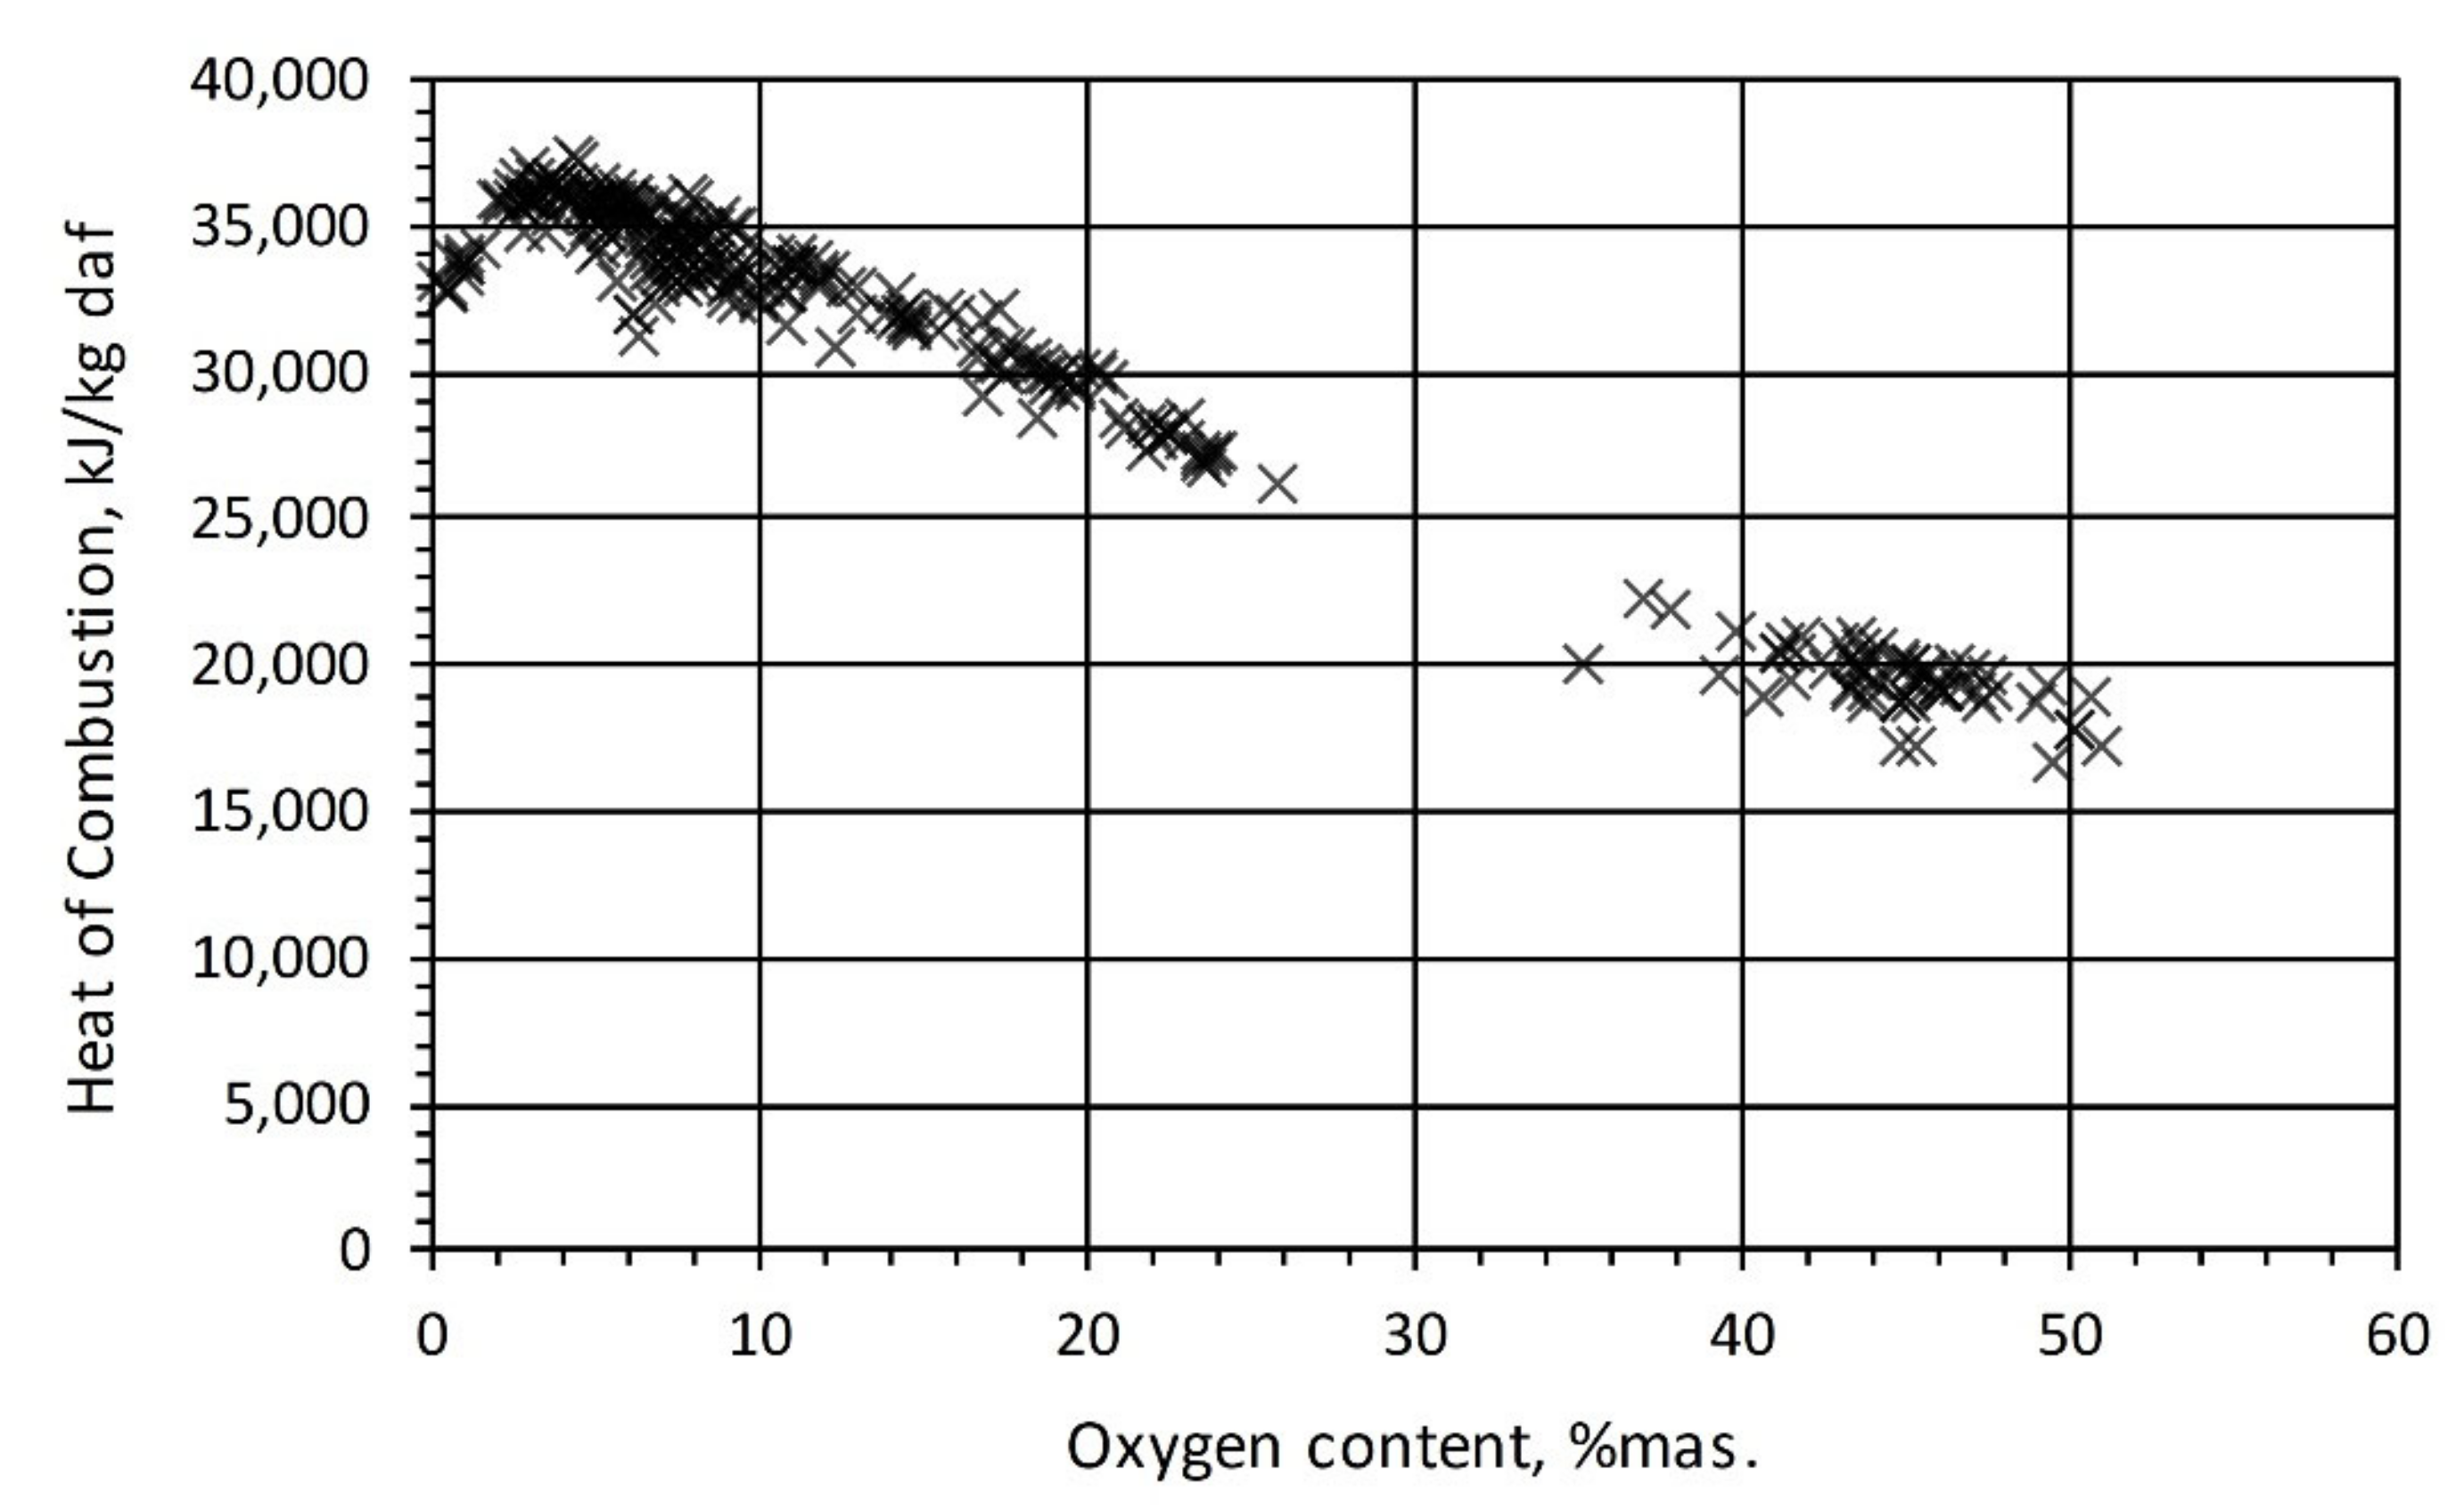
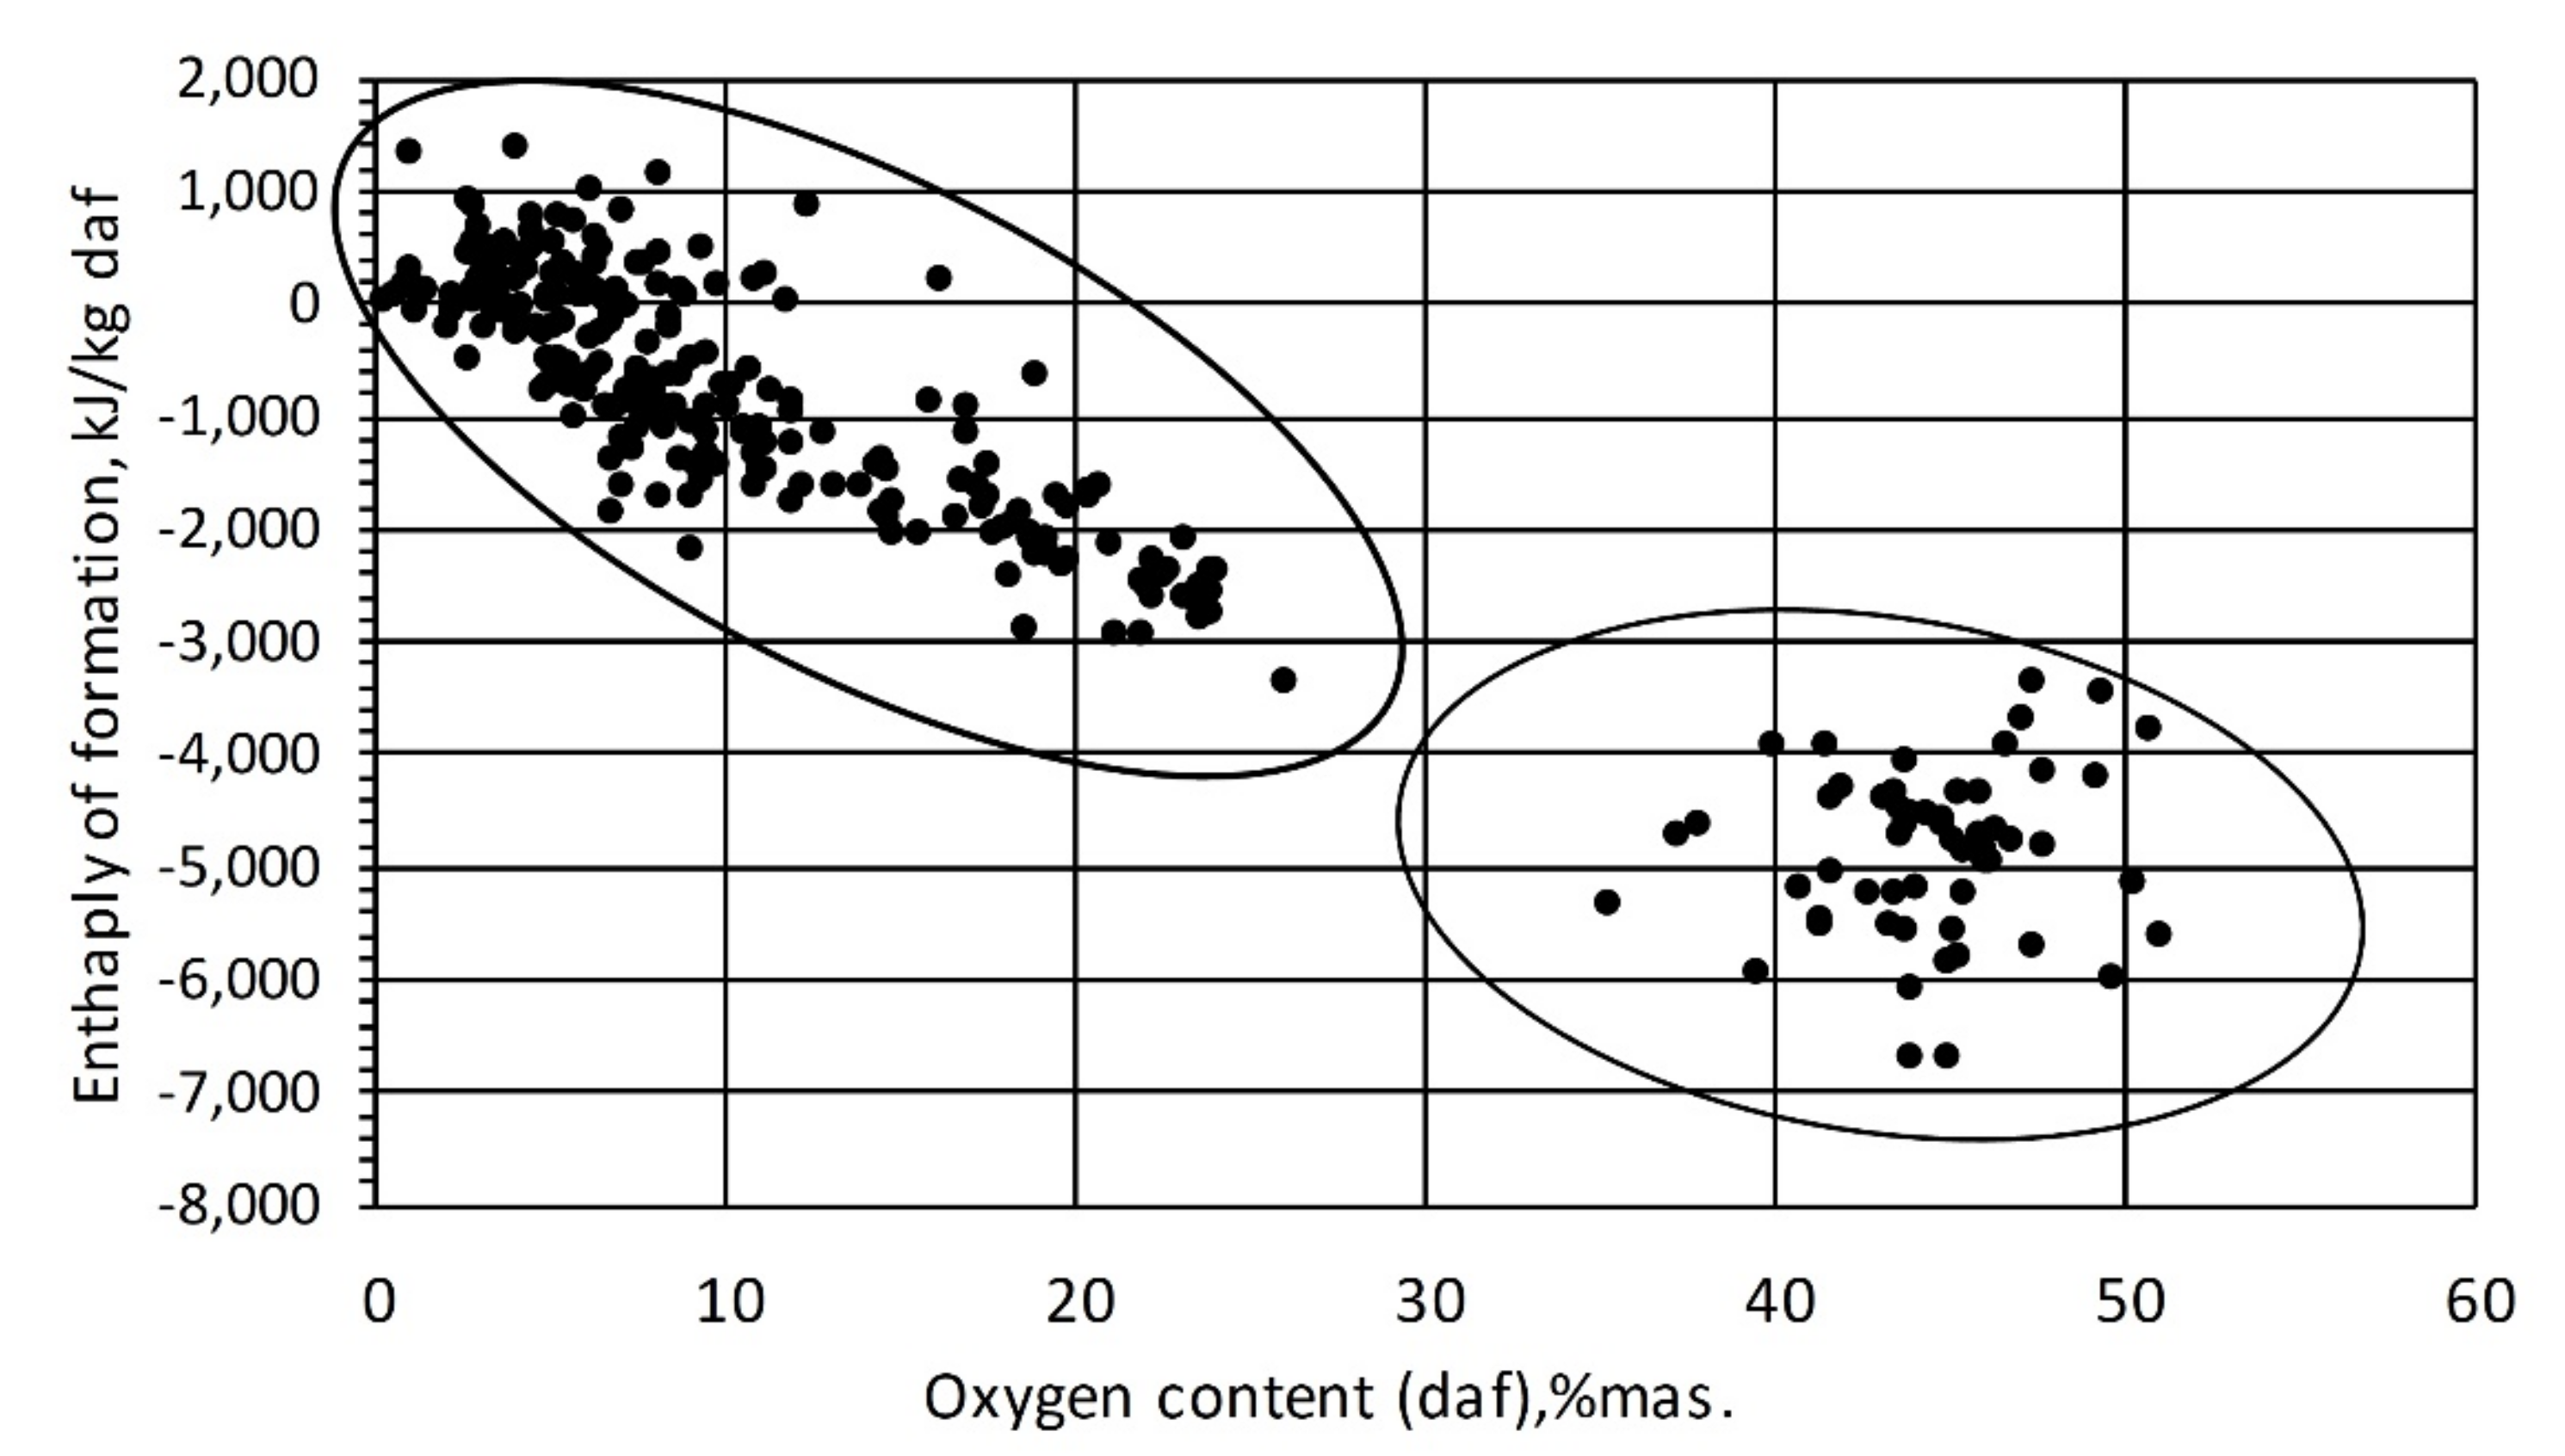
In Figure 5, the basic relationships between the measured heat of combustion and the content of oxygen content for a wide range of fuels is presented. It is clearly noticeable that the maximum value is achieved at oxygen content of 3–4%. The value of the heat of combustion Qs approaches the heat of graphite combustion (32.84 MJ/kg) as the oxygen content decreases to zero.
The thermodynamic enthalpy of combustion of separated elements which form coal or biomass assuming that the each element fraction can be expressed as a mass share in a percentage, can be computed from Equation (2):
When applying the definition of the enthalpy of fuel formation expressed by Equation (3), the thermodynamic enthalpy of the combustion (reaction) must be correlated to the real heat of combustion.
In general, the relationship between the enthalpy of combustion and the calorimetric heat of combustion may take on the following form:
Here, f(θ) is a function that modifies the thermodynamic enthalpy of combustion and defines the ratio of absolute values of the heat of combustion and the reaction enthalpy of combustion. The resulting correlation for f(θ) is presented below (Equation (5)):
where: b1 = 0.00195, b2 = −0.00305 and b3 = 1.01314.
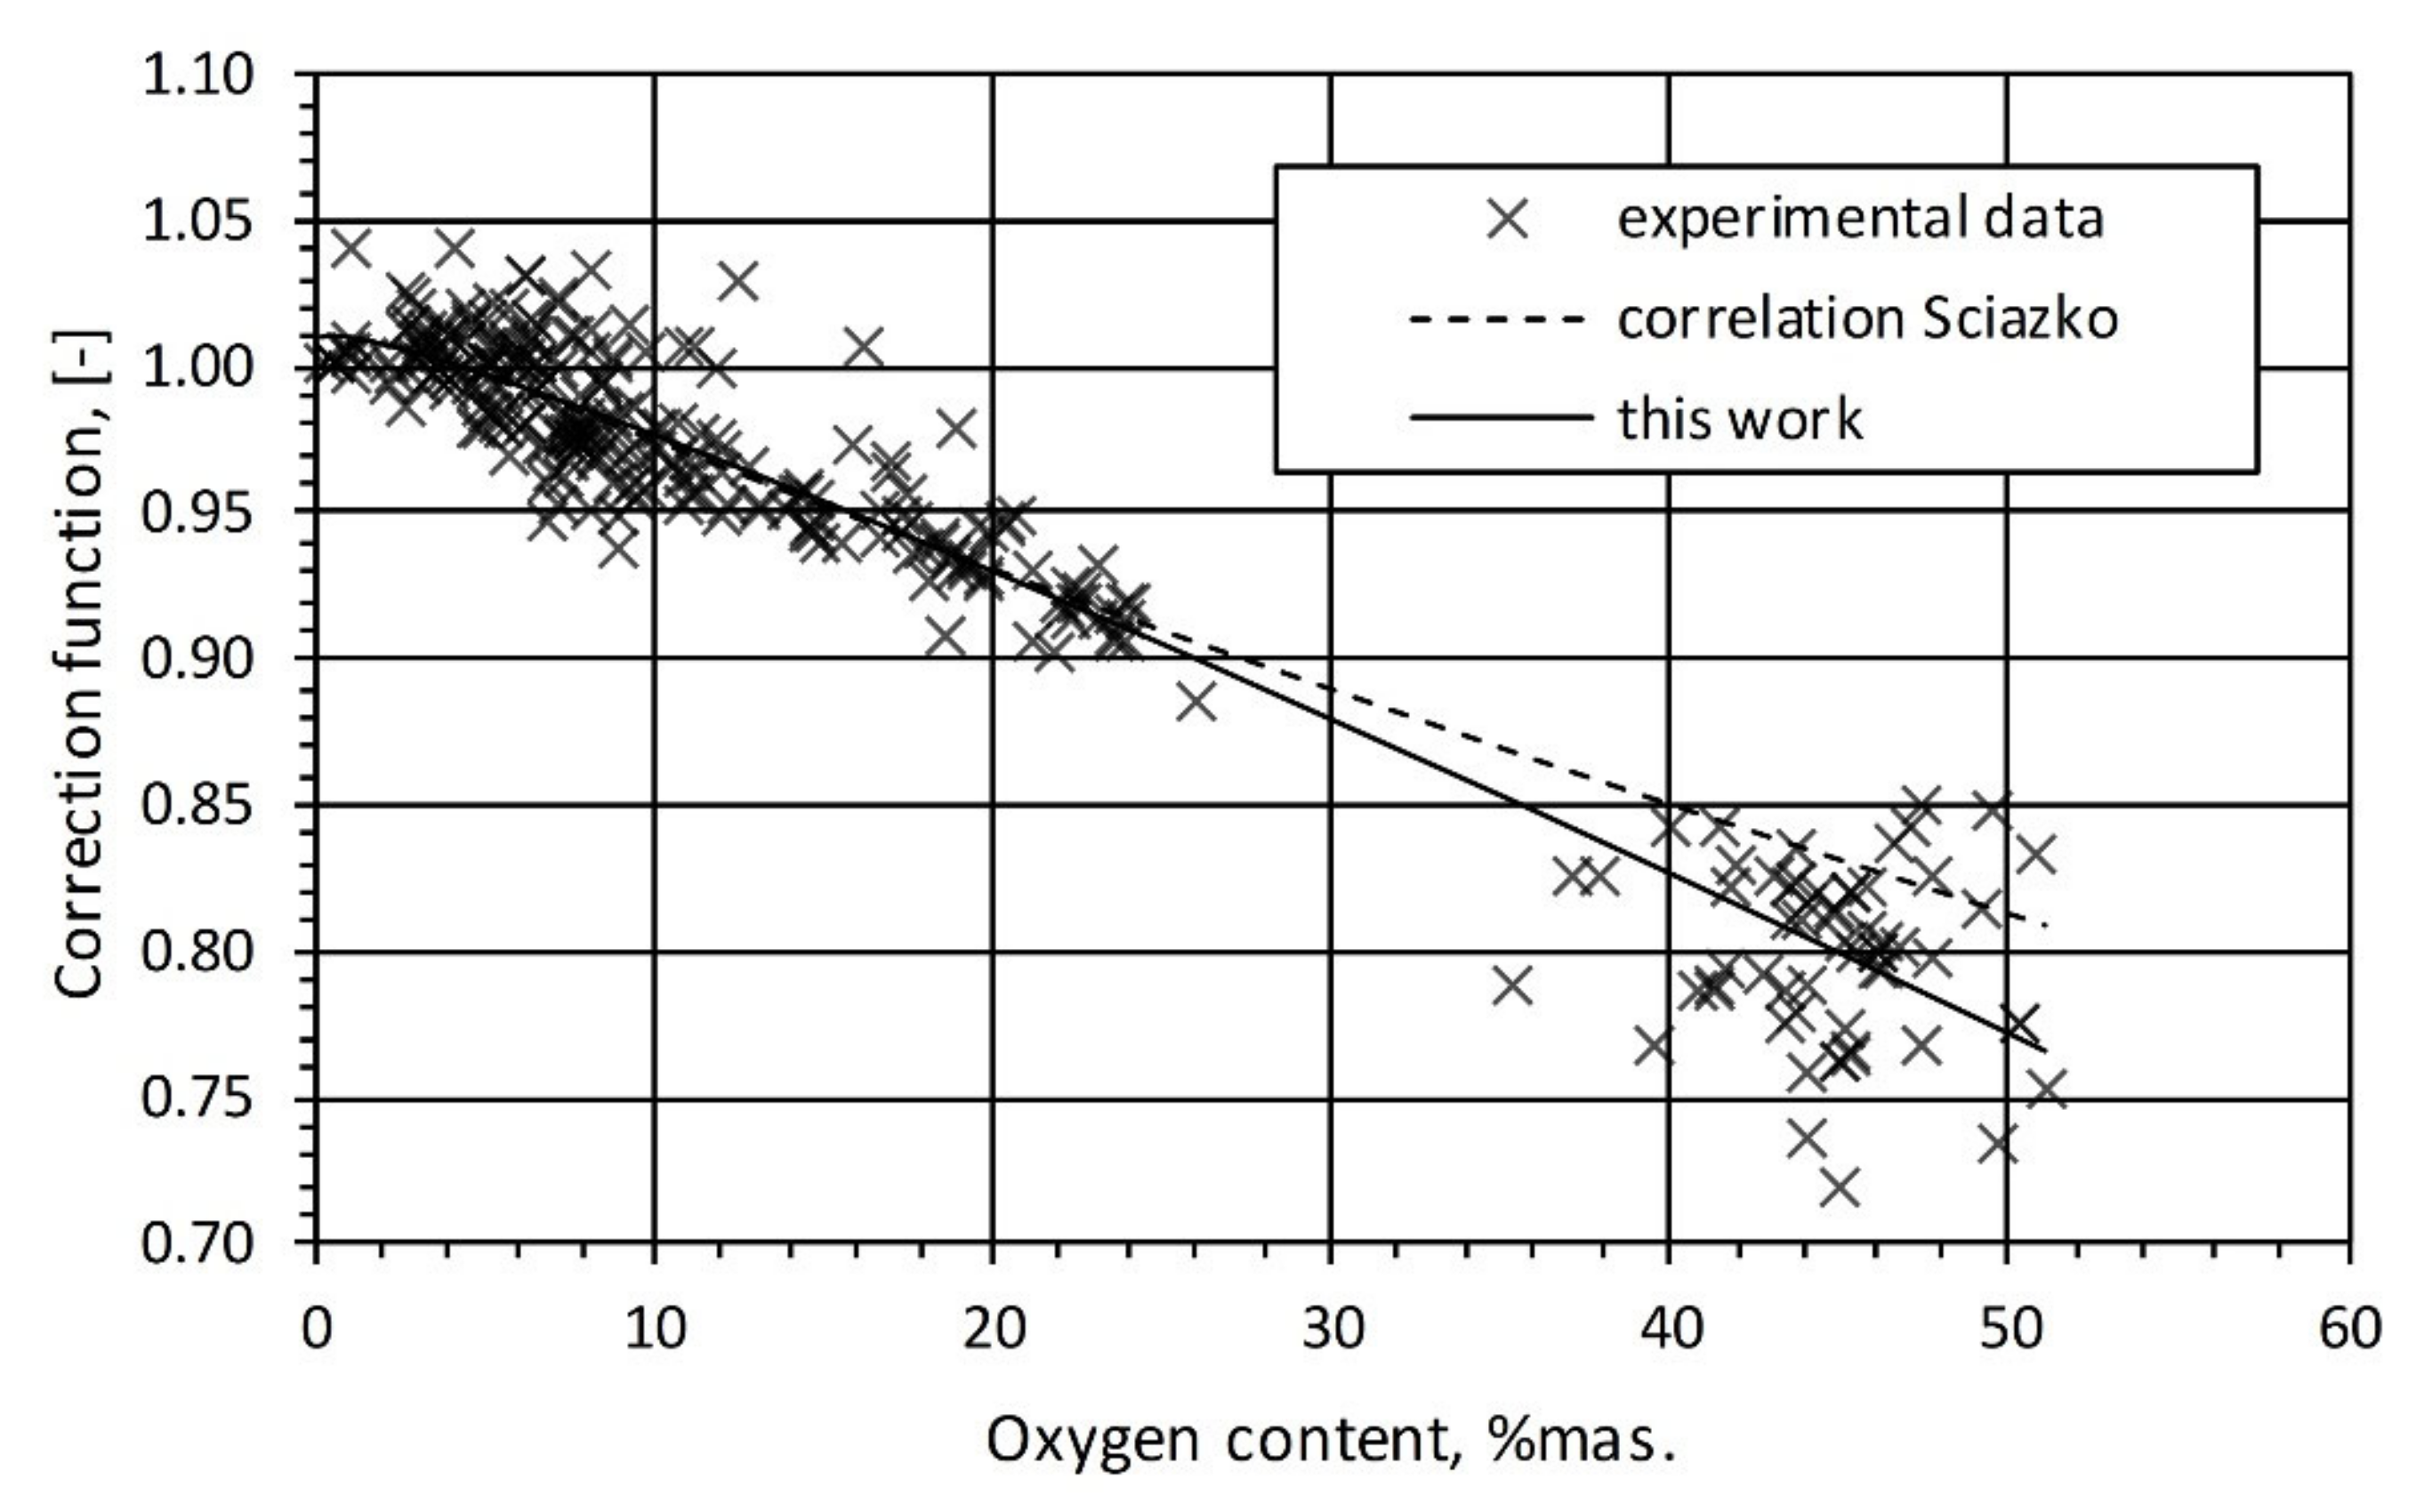
The comparison of the experimental data for a wide range of fuels with the developed correlation is presented in Figure 6. Additionally the previous correlation is also shown, which was valid only for coal and char. Figure 7 shows the relative error of the correlation. All data including coal and biomass fall in the range +/−10%. The comparison with the predictions of Ronsch and Burnham [35] was also analysed. Correlation of Ronsch and Burnham substantially deviates from experimental data at the ends of the range investigated particularly for the values lesser than (−4000) kJ/kg and greater than 0. The difference may be as high as 1000 kJ/kg. On the other hand, the correlation of Lozano et al. [23] produces much more scattered data. The final results of formation enthalpy for a wide range of fuels are presented in Figure 8.
Taking into account the analysis presented above it can be stated that the modified correlation of Sciazko [21] covers the entire range of fuel properties and thus can be used for the modelling of various gasification processes including coal and biomass and biowastes. For the purpose of this work, in particular, it will be used for the evaluation of the fuel formation enthalpy effect on gasification performance.
3.2. Enthalpy Formation Effect
3.2.1. Entrained Bed Reactor
Considering the Shell gasification technology, the carbon conversion degree was taken as 99.5%. The impact of the enthalpy of coal formation application on the results of gasification calculations was analysed using the published literature data [30,31], and related to gasification of coals with a varying degree of coalification (Table 4).
Table 5 and Figure 9 present the adopted data and results of calculations. The computations were carried out for a steady state, using the ChemCAD process simulator, version 7.
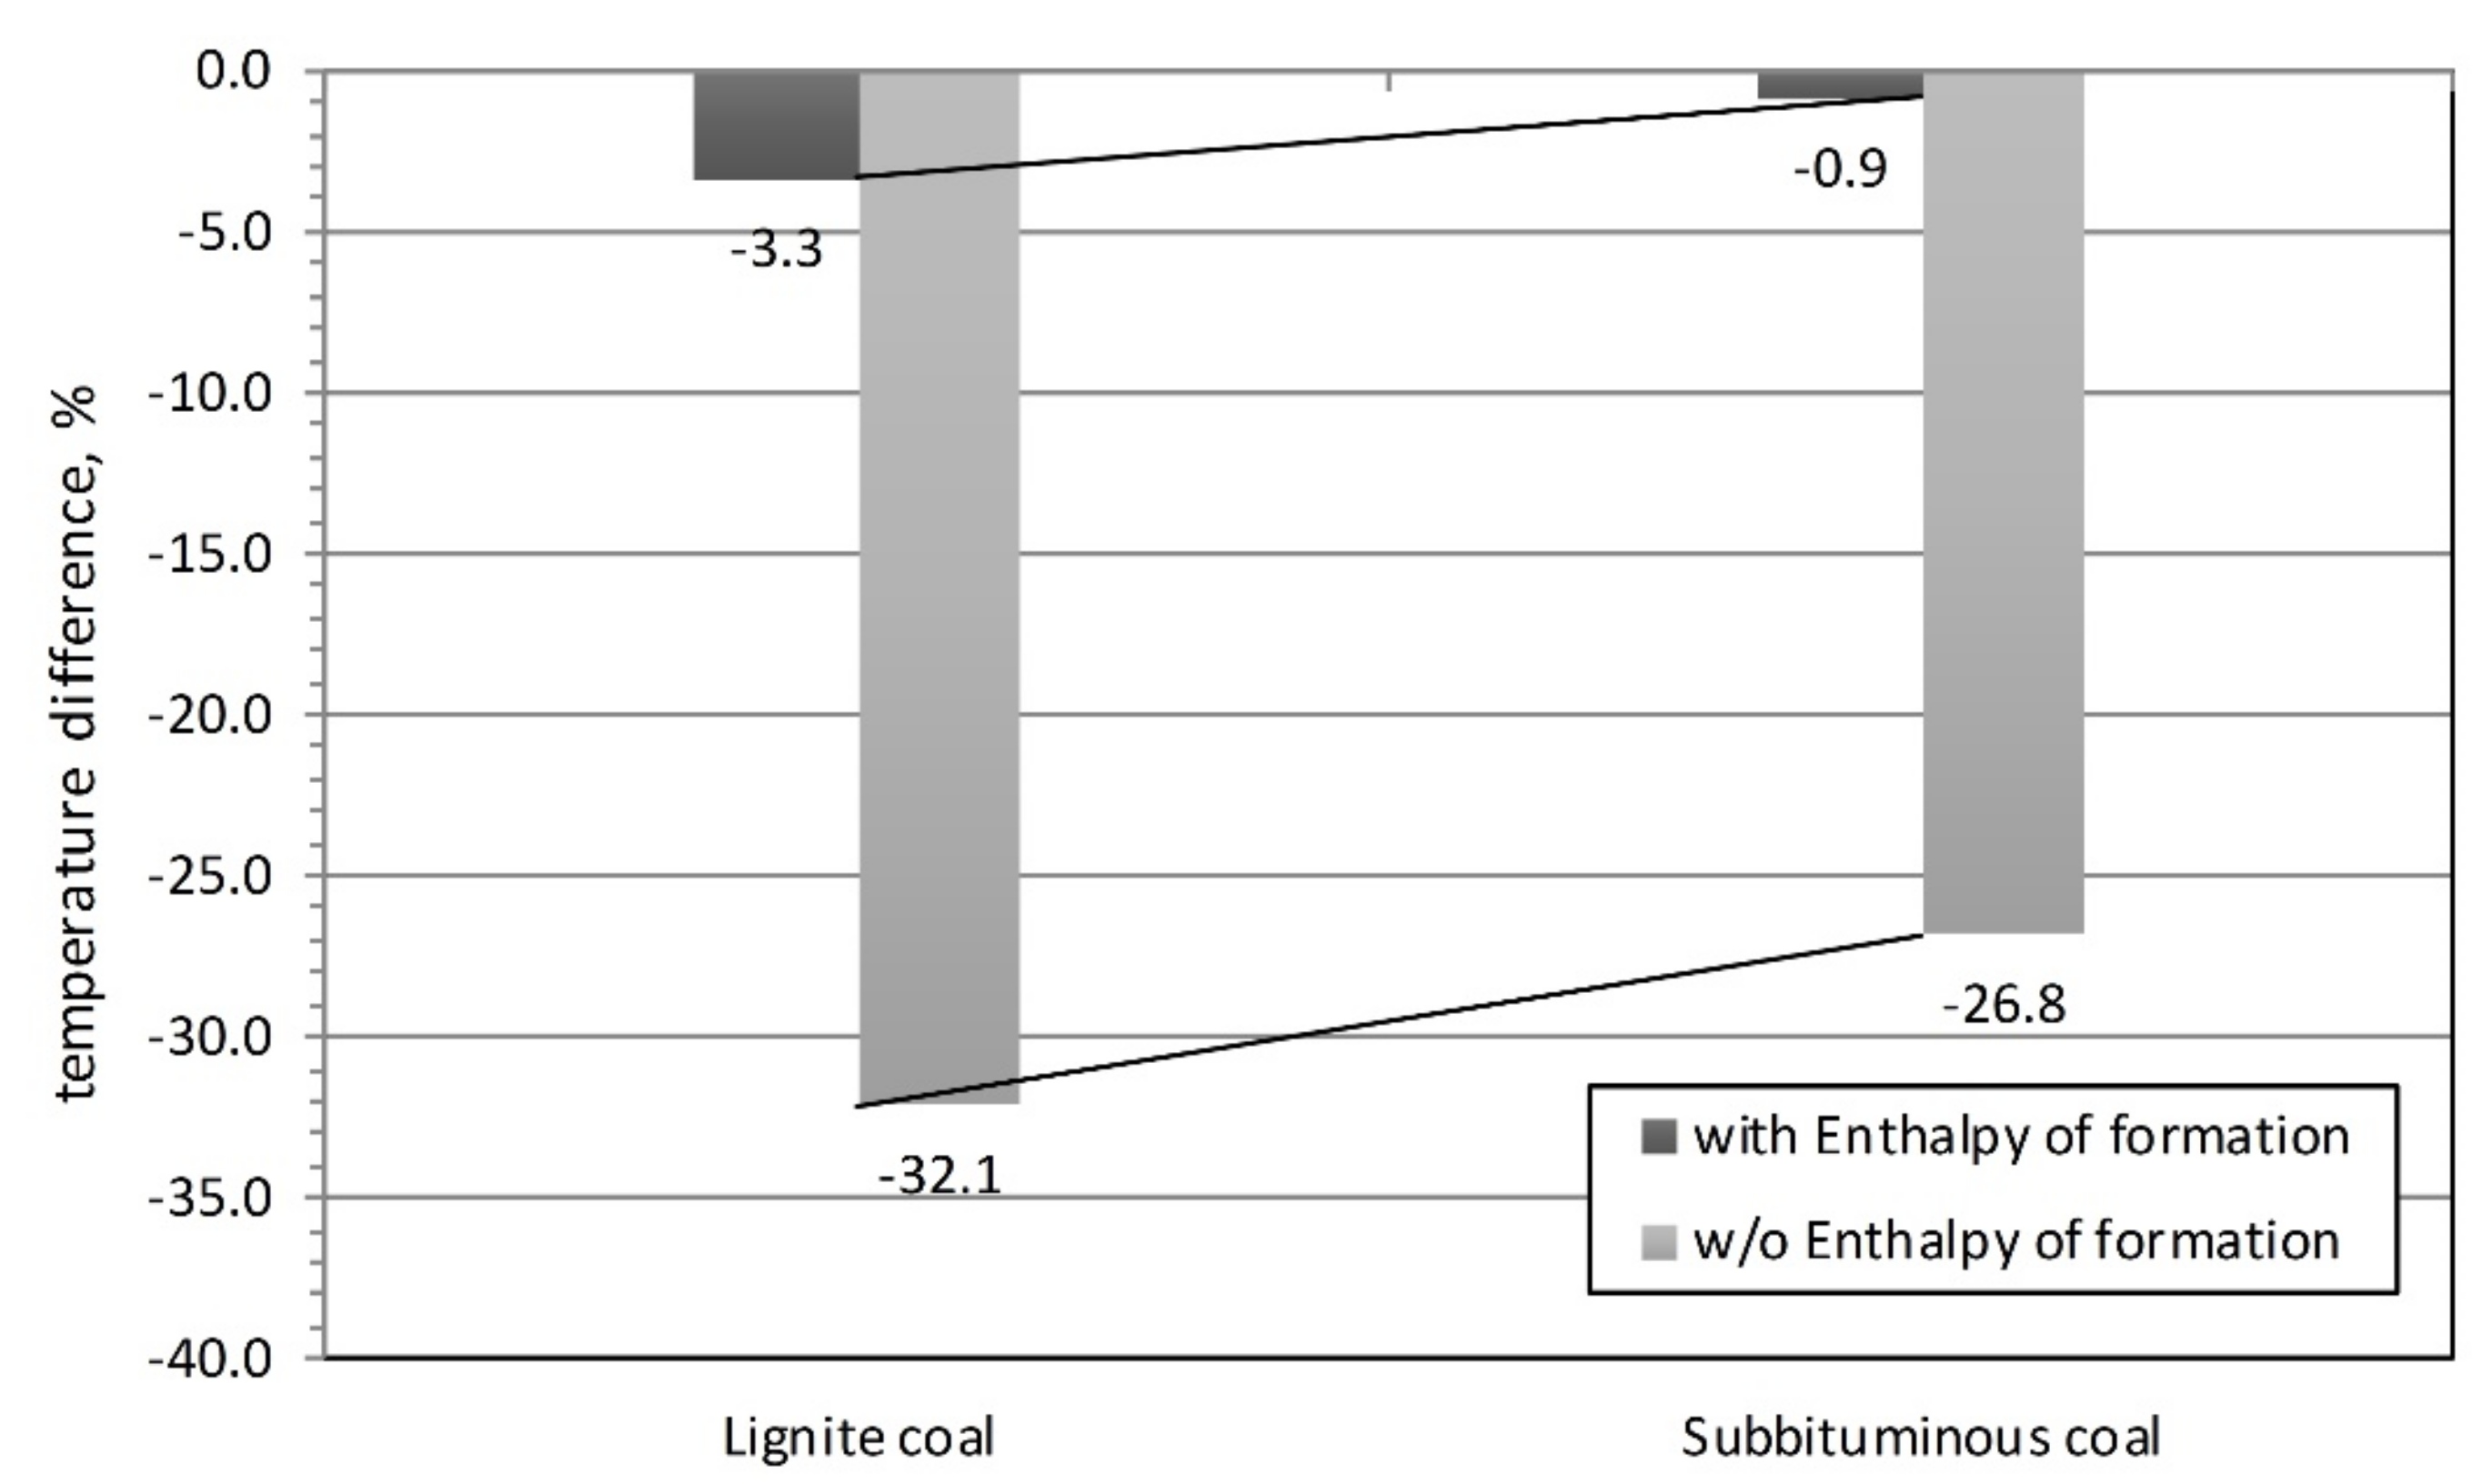
When the enthalpy of formation is not accounted for it results in the overestimation of process temperatures by 572, 551, and 101 °C for lignite, sub-bituminous, and bituminous coal, respectively. The application of the enthalpy of coal formation results in better fitting of the calculation results to the published literature data. The obtained relative difference between calculations and the literature data was −15.1, −13.9, and 2.4% for lignite, sub-bituminous, and bituminous coal, respectively.
Relatively higher temperature differences in the case of lower rank coals (cases with application of enthalpy of formation) may be caused by the non-consideration of other thermal loads of the system, such as losses to the environment or the heat used to produce medium-pressure steam in the reactor. In the case of sub-bituminous coal and lignite, the assumed thermal losses of approximately 1% of the fuel chemical enthalpy at the inlet to the reactor and the heat used to produce medium-pressure steam in the reactor’s shell, at the amount of 1.9% [30], results in practically identical process temperatures (relative errors of −3.3 and 0.9%, Figure 10).
3.2.2. Fluidized Bed Reactor, SES Technology
Model simulations of the fluidized bed reactor were carried out in accordance with the diagram presented in Figure 3. Coal, with a composition presented in Table 2, was used in model calculation. Average values, presented in the Table 2, were determined based on a dozen or so analyses of the fuel composition collected during weeks in the industrial coal gasification system.
Twelve measuring points for various fuel and gasifying agent streams were taken into account during the industrial coal gasification plant operation. Table 6 and Figure 11 present the adopted data and results of calculations. The computations were carried out for a steady state, using the ChemCAD process simulator, version 7.
As the graph in Figure 11 shows, the consideration of the enthalpy of coal formation in all cases results in lowering the calculation process temperature, resulting in approaching the actual temperature that exists in the reactor. The difference between the calculation and the actual temperature, for the model without the enthalpy of formation, on average was approximately 13% (118 °C), while the consideration of the enthalpy of formation in calculations allows us to reduce it to approximately 6% (51 °C). This change translates into reduction of the simulated process temperature by approximately 67 °C.
3.2.3. Fluidized Bed Reactor, DFB Technology, Biomass Gasification
For the DFB the impact was studied of the enthalpy of biomass and char formation on thermal effects of the process obtained through calculations, using the developed and experimentally verified model of a biomass fluidized bed gasification reactor [34,38]. The characteristic of wood pellets, taken for calculations is presented in Table 3. Table 7 presents the basic design parameters of the system and the process data taken for calculations.
The application of the enthalpy of biomass and char formation allows us to obtain proper thermal effects of the process and, as a result, the process gas composition and the required recirculation of the heat carrier. The results of thermal effects calculation for biomass pyrolysis (Qpyr) and char gasification (Qgas) for the case with and without the enthalpy of biomass and char formation are presented in Table 8.
Omitting the enthalpy of formation in the computing results in unrealistic value of process parameters. The pyrolysis and, and as a result, the steam gasification process becomes an exothermic process (heat demand to the reactor is negative), and the value of heat carrier recirculation in the system has a negative value (−108.3 kg/h; Table 8).
3.3. Pyrolysis Contribution to Gasification Process
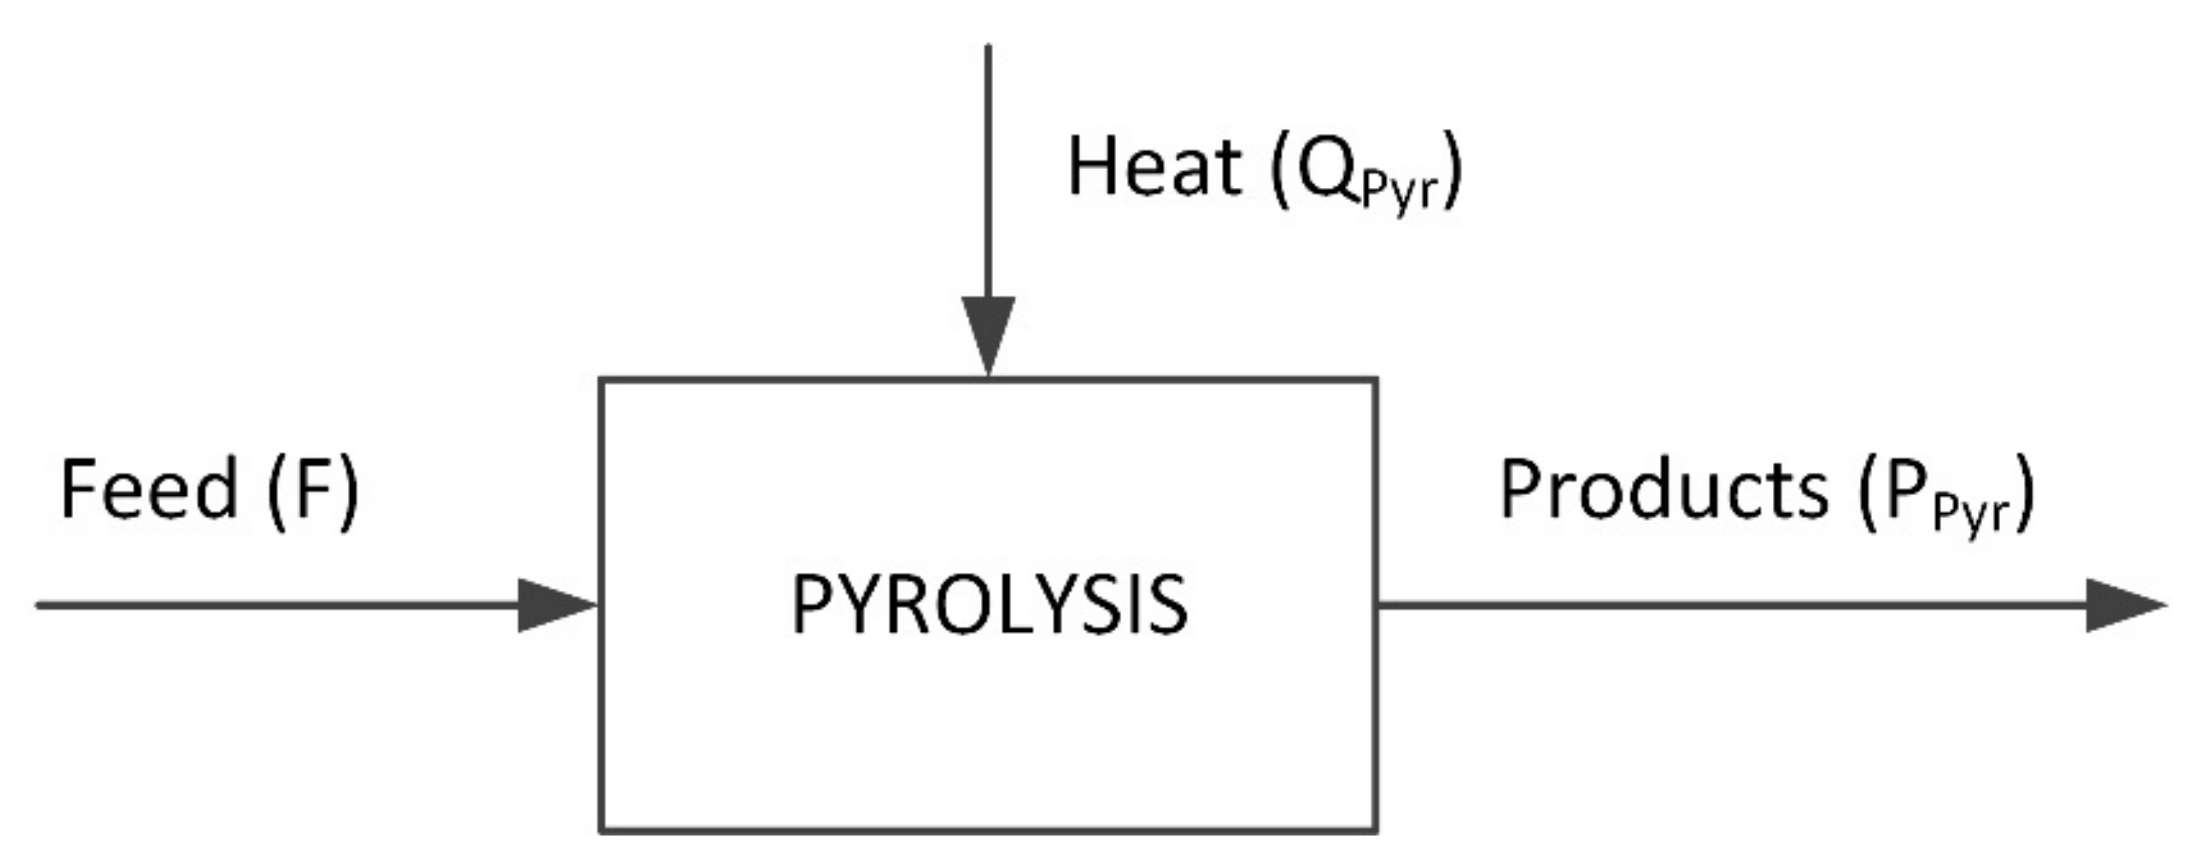
In this paragraph the effect of formation enthalpy is discussed in details assuming that pyrolysis reaction is the first stage of the gasification process. The energy balance for pyrolysis, in which entire heat demand (Qpyr) must be delivered from the other exothermal reactions, can be sketched as follows (Figure 12, Equation (6)). It may be internally generated in the case of the oxygen blown gasifier or externally in case of steam gasification.
The heat demand for a pyrolysis reaction can be expressed by the Equation (6) assuming that the fuel is fed at the standard temperature. In this case the physical enthalpy of the feed takes zero value.
The pyrolysis reaction enthalpy at standard conditions (ΔrxnHpyr) is defined by Equation (7).
In the analysis it was assumed that heat losses can be neglected.
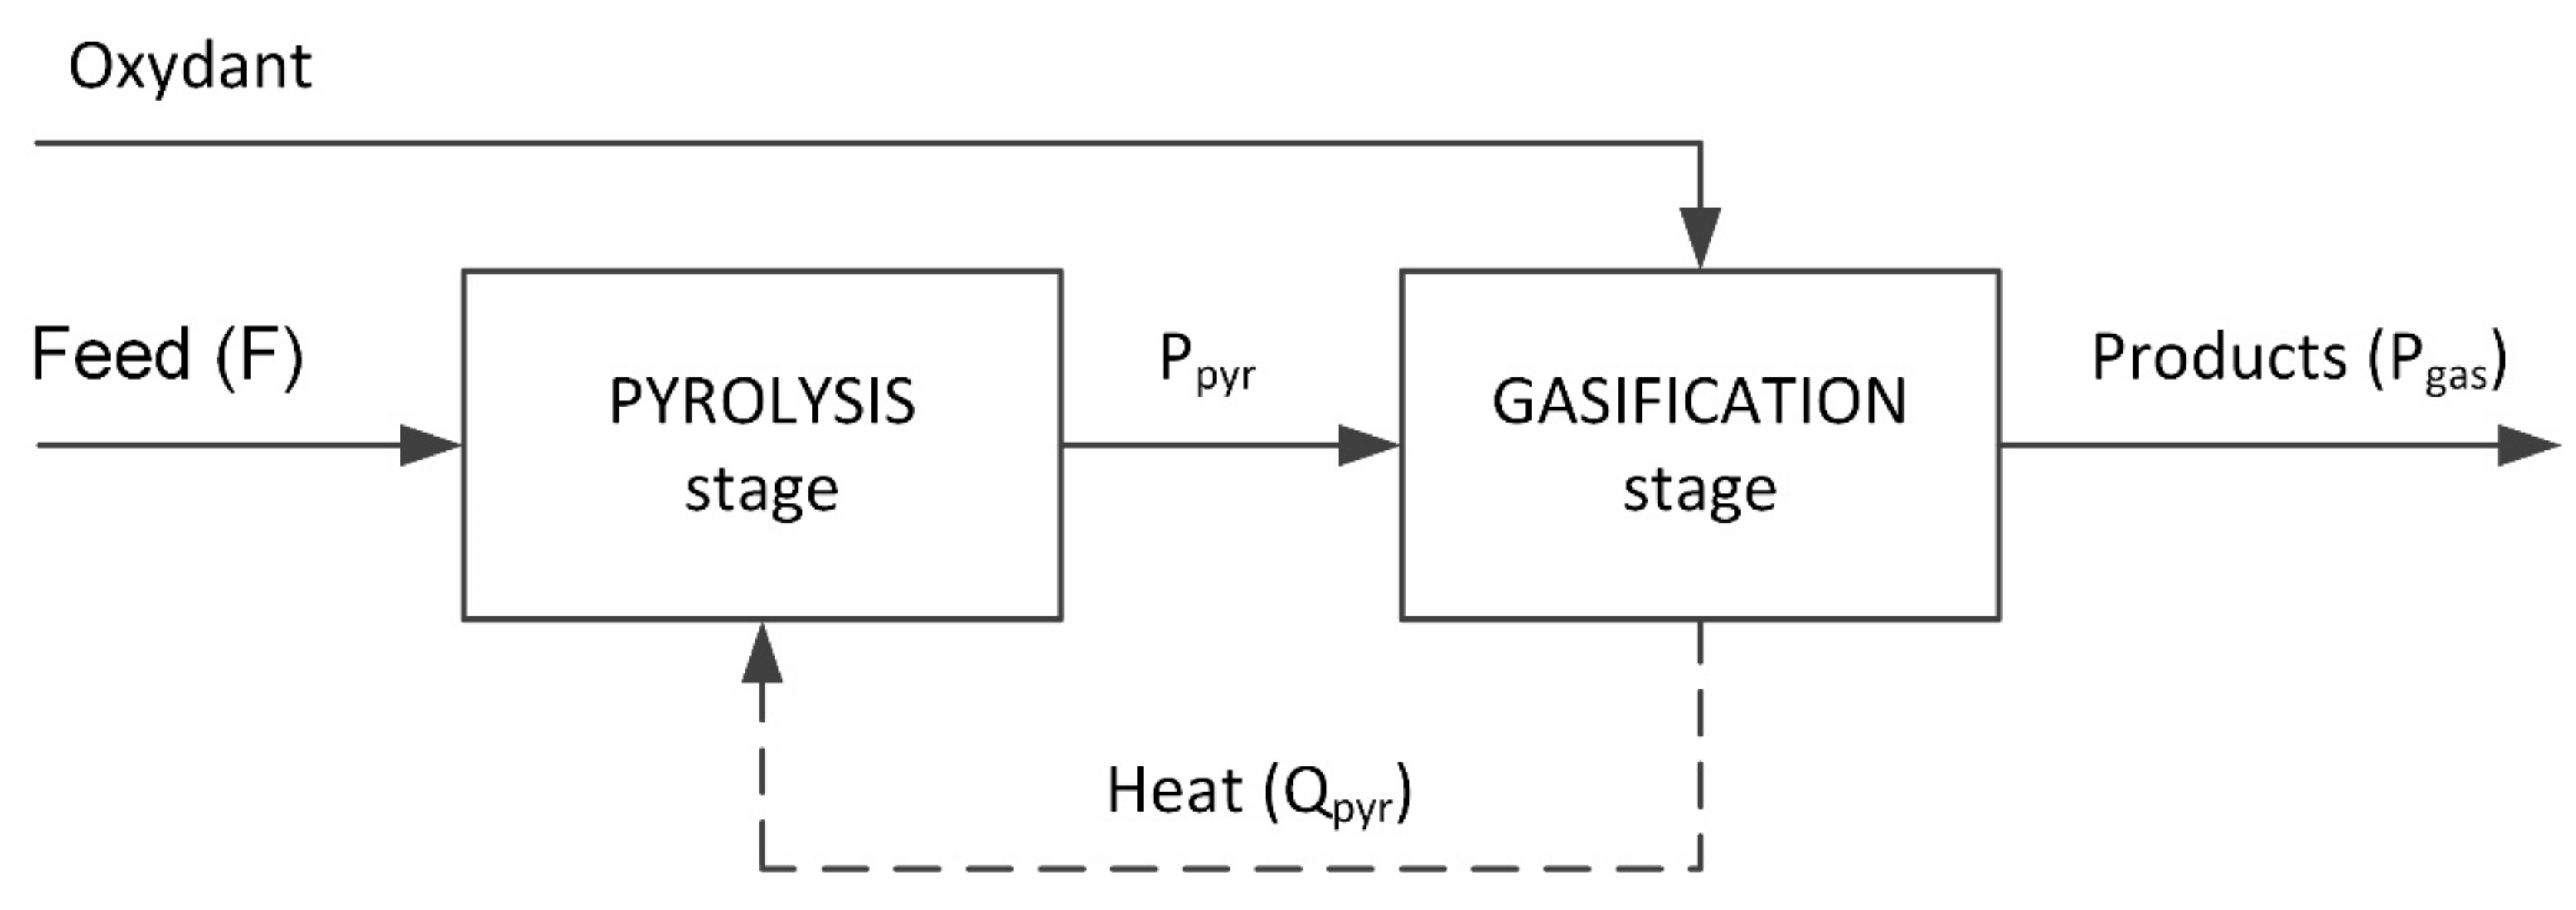
Discussing the gasification process it was assumed in this work that it consists of two stages of fuel transformation: the first one being the pyrolysis reaction which is non-isothermal stage, and the second one isothermal gasification of pyrolysis products. (Figure 13). Both take place at the same final temperature regarding an energy balance.
In this case the heat necessary for the reaction of pyrolysis and gasification is generated internally by exothermic gasification reactions including partial combustion of a char delivered form the pyrolysis step or gaseous components. Air or oxygen separated from air with steam can be used for gasification. This means that the total heat demand for pyrolysis and heating the products to final reaction temperature needs to be covered internally. Total reaction enthalpy can be expressed as a sum of enthalpy of pyrolysis and enthalpy of gasification reactions. It results in Equation (8).
Heat generated or demanded in a gasification process equals:
and shows amount of heat which is used only to cover demand of gasification reactions. The described approach is used for the analysis of different gasification processes performance in terms of thermodynamic data.
The analysis was carried out for three different gasification processes, using hard coal, lignite and biomass. For analysis, it was assumed that all fuels have the same moisture content equal to 7.2%. Fuel composition taken for analysis is presented in Table 9. In order to balance the analysed processes, appropriate process parameters were calculated, namely: physical enthalpy, chemical enthalpy and total enthalpy of the stream. For process performance evaluation, the following parameters were calculated as well: total reaction enthalpy, enthalpy of pyrolysis and gasification step, heat demand for the pyrolysis and gasification step, and fuels enthalpy of formation.
3.3.1. Shell Entrained Bed Gasification
The Shell reactor is an oxygen entrained bed reactor with a dry feed of coal. The energy balance is presented in Figure 14. The presented balance applies to a system gasifying 250,430 kg/h of coal featuring characteristics presented in Table 9 (North Dakota Beulah Zap Lignite).
In the case of coal processing by Shell technology the energy balance shows that the enthalpy of lignite pyrolysis amounts to 341.1 kJ/kg and the total heat demand to raise the temperature to 1509 °C is 3084.8 kJ/kg. The enthalpy of gasification reactions is (−4631.3) kJ/kg. However the most interesting is the relation of heat demand for pyrolysis and heat demand for gasification reactions. As can be seen the first one is almost twofold higher then the value of the heat necessary for gasification reaction. This difference is largely created by the value of the formation enthalpy of coal, which needs to be balanced with a suitable amount of heat delivered to the pyrolysis stage and high final reaction temperature. The share of formation enthalpy in heat demand for pyrolysis is almost 68%.
3.3.2. SES Fluid Bed Gasification
Synthesis Energy Systems, Inc. [27] gasification technology (SGT) offers a flexible way to convert lower quality fuels into syngas. A minimal LHV for a fuel to be converted in a entrained bed reactor is 18 MJ/kg but in a fluid bed reactor can be as low as 14 MJ/kg due to higher reactor inventory caused by fluid bed.
The energy balance is presented in Figure 15. The presented balance applies to a system gasifying 27,856.46 kg/h of coal with characteristics presented in Table 9.
In the case of coal processing by SES technology, the energy balance shows that the heat demand for pyrolysis to raise the temperature to 940 °C is 2062.0 kJ/kg. The heat demand for gasification reactions is 1991.6 kJ/kg. This means that in this case the values are comparable. This is a result of much lower formation enthalpy of coal than in a Shell case and a lower final temperature of reaction. However, it is relevant that the share of formation enthalpy is substantial as well amounting to almost 40% of heat demand for the pyrolysis stage.
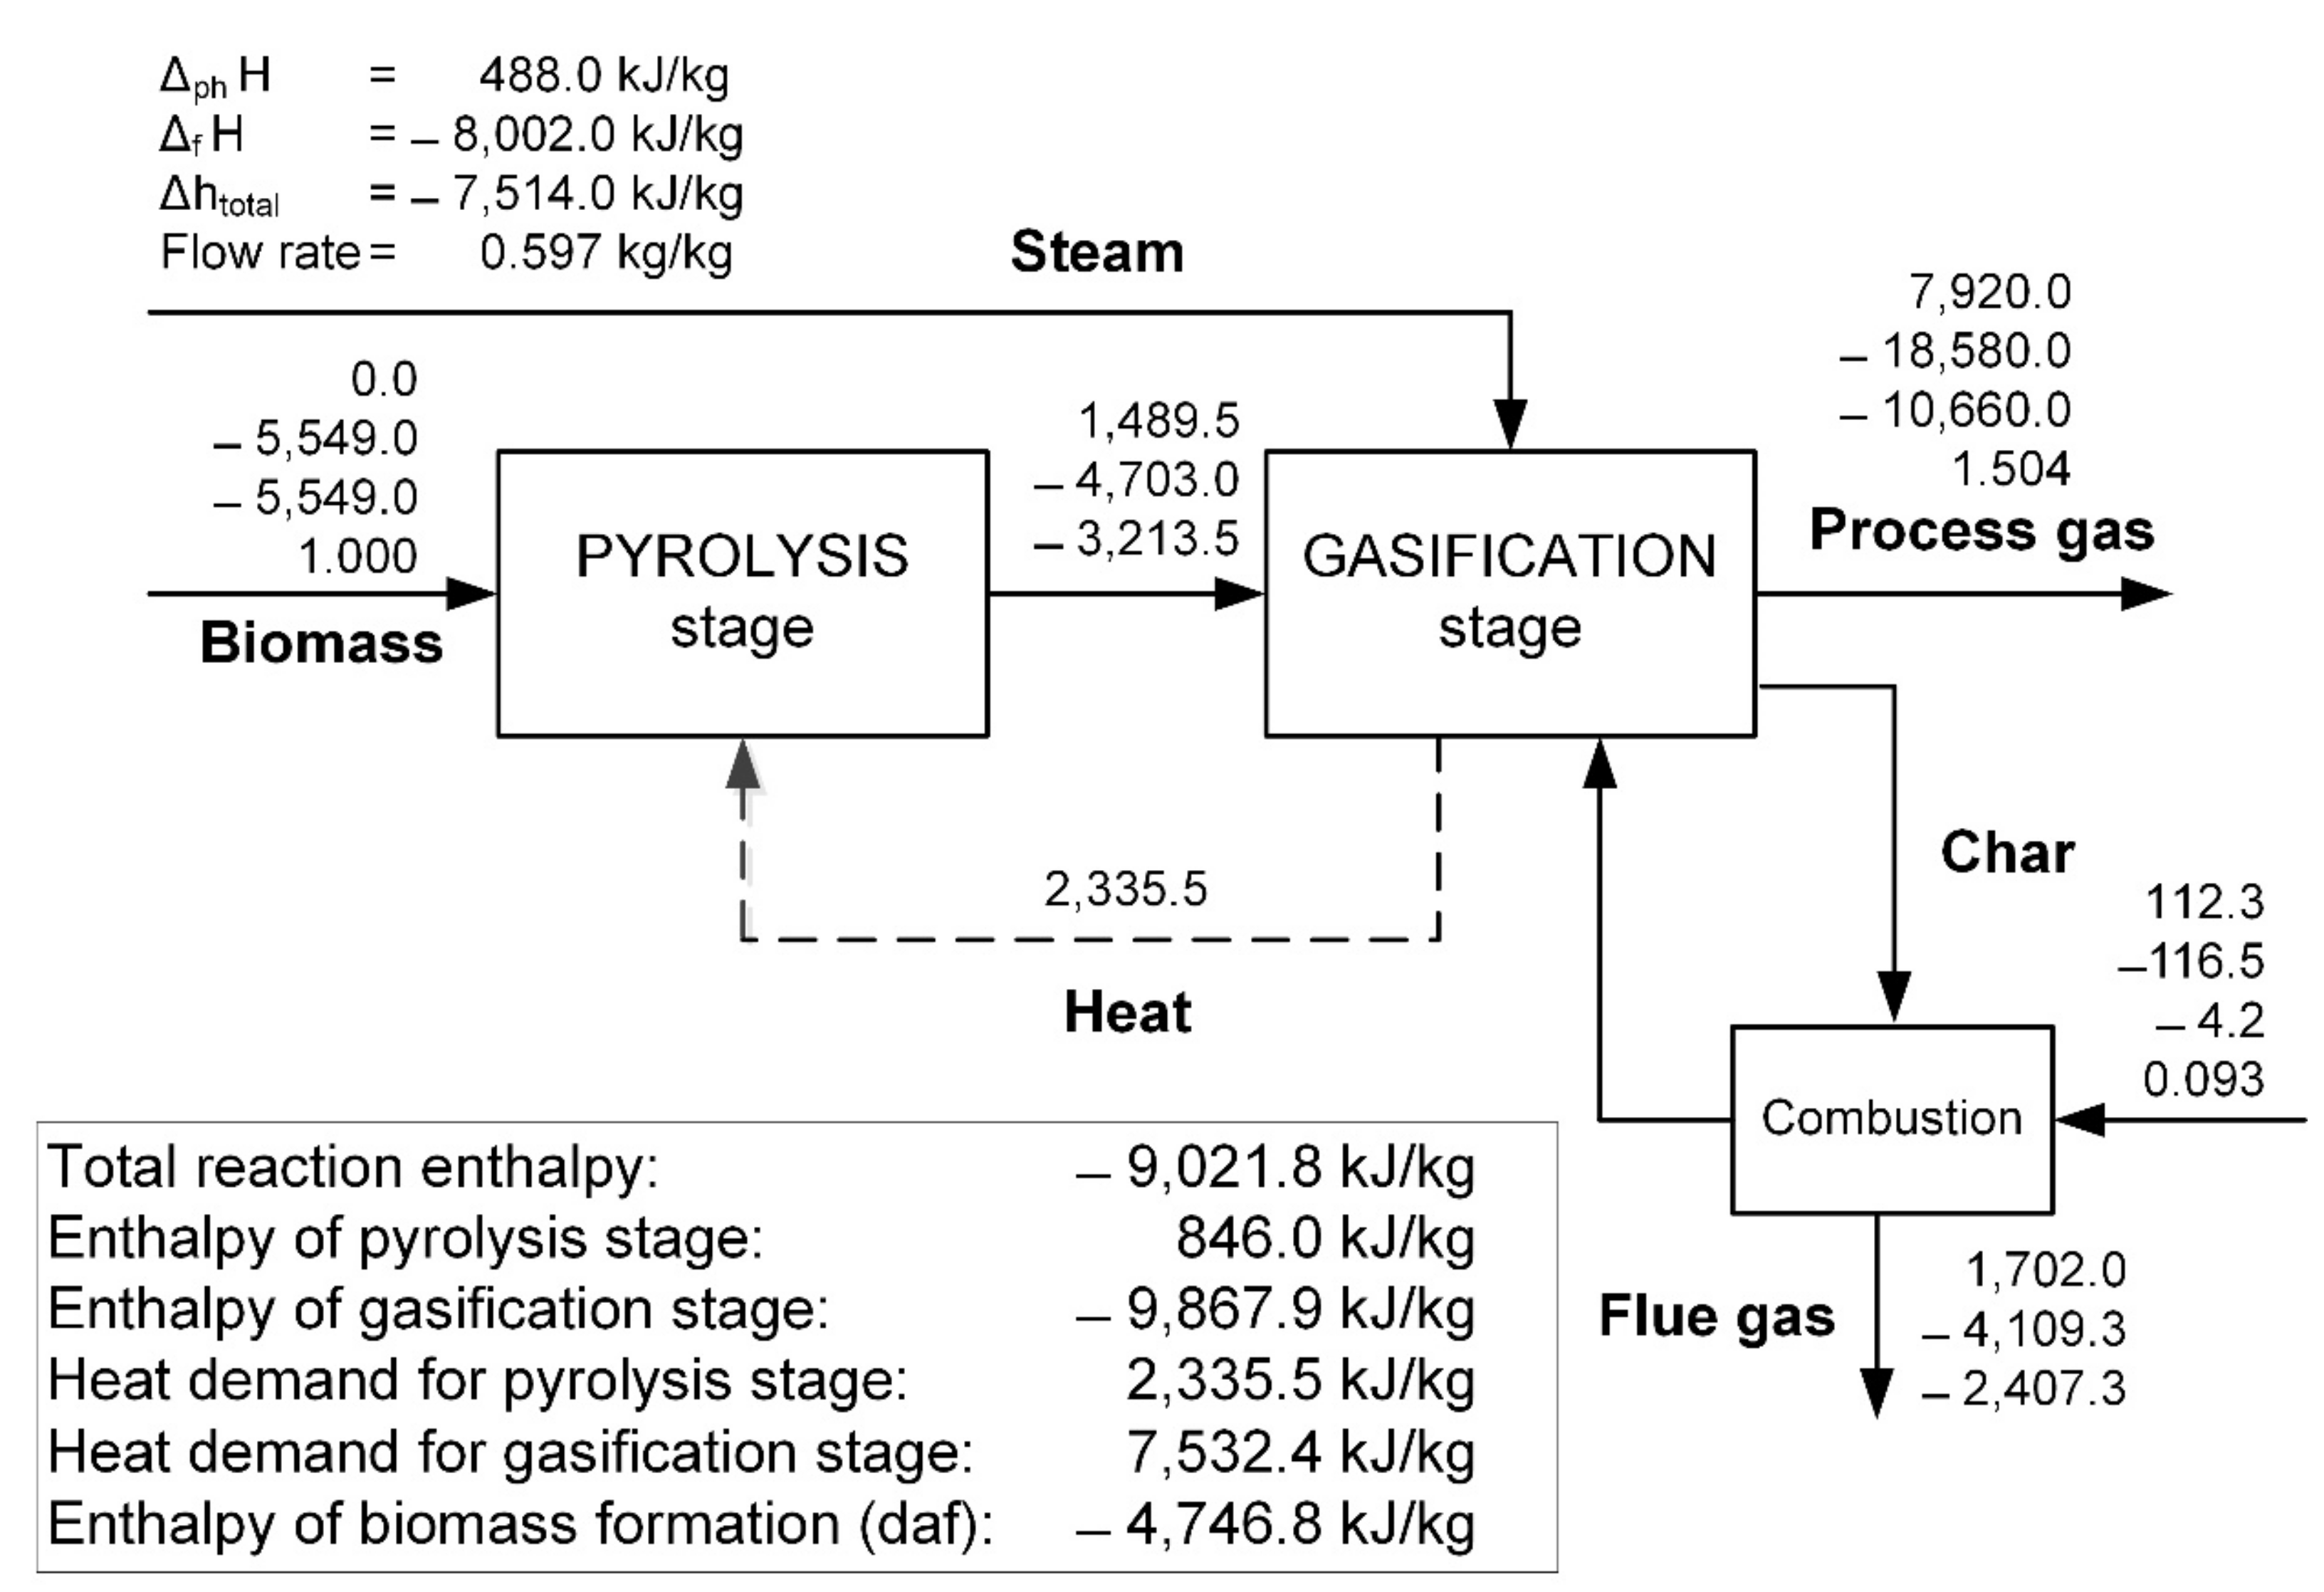
3.3.3. Biomass Gasification in a Dual Fluid Bed Reactor
The DFB steam gasification of biomass produces a nearly nitrogen-free medium calorific product gas from solid fuel. The technology was developed mainly to use biogenic feedstock. Fluidized bed technologies offer high levels of fuel flexibility relative to other gasifiers. The gasification medium is pure steam without any addition of oxygen. The heat for the reaction is generated by the combustion of remaining char and transferring heat with circulating hot sand. The process block diagram following a two-step concept is presented in Figure 16.
In the case of biomass processing, which was described in detail in [34], the energy balance shows that heat demand to raise the temperature to 850 °C is 2335.5 kJ/kg (which is close to that for the SES process). However, this is achieved at very high value of enthalpy of formation, which is in this case (−4746.8) kJ/kg. This means that in the thermal decomposition process an exothermic reaction takes place to an extent greater than in the case of coal. This effect covers heat demand for the compensation of formation enthalpy. On the other hand, the heat demand for gasification is much higher than in the SES case due to highly endothermal reactions of steam gasification. As presented, the heat demand for a process is mainly gasification reactions driven. It should be also noted that without formation enthalpy the energy balance of pyrolysis would deliver a negative value of heat of pyrolysis and the process would be self-sustained in terms of an internal heat source. However, this is not the case in a real situation.
4. Conclusions
Considering thermodynamic analysis of the gasification process it was assumed that it is composed of two successive stages, namely: pyrolysis reaction followed by a stage of gasification reaction. An intensive thermal decomposition (pyrolysis) of the organic matter dominates in the first period of fuel processing and because of that oxygen has no access to the solid residue, i.e., char. Only after the release of volatile matter can the oxygen react with it in the gaseous phase or with the char formed in the heterogeneous phase. This approach allows us to formulate the models of a selected gasification processes dominating in industrial applications. The data used for analysis were collected from industrial-scale operation units in case of Shell and SES gasification. In the case of biomass gasification, DFB demonstration-scale data were used.
Analysis of the energy balance, which is necessary for process modelling, leads to the conclusion that the enthalpy of fuel formation is essential for the correctness of the computed results. There was not a clearly validated formula on enthalpy of formation, which can be used for an entire range of fuels, i.e., from coal to biomass and wastes. This work delivers the computational formula for wide range of fuels enthalpy of formation, and discusses the impact of the enthalpy of formation on results of gasification process modelling in terms of energy balance. The obtained results have been compared against available literature data collected on real demonstration and industrial systems of coal or biomass gasification.
Different configurations of process analysis for thermodynamic modelling were developed and suitable ChemCAD based computing was performed to show the conditions for model validation. It was shown that in all three cases the enthalpy of formation play an important role, particularly related to the fuel rank.
Splitting the gasification process into two stages the following categories were evaluated in terms of energy balance:
- Total reaction enthalpy;
- Enthalpy of pyrolysis stage;
- Enthalpy of gasification stage;
- Heat demand for pyrolysis reaction;
- Heat demand for gasification reactions.
In all cases the effect of enthalpy of formation was under consideration.
Total reaction enthalpy is very much dependent on the value of fuel formation enthalpy. It is clearly noticeable that the higher the enthalpy of the reaction the higher the formation enthalpy and this is not dependent on the final temperature of the process. Enthalpy of the pyrolysis stage is always positive as this is an endothermic reaction. However, the effect for biomass is more than twice greater than for coal.
The most interesting are the results of comparable energy analysis of the considered processes assuming the same moisture content in a fuel. In this case, the heat demand for pyrolysis and gasification separately were identified.
Considering the Shell process it was shown that the relation of heat demand for pyrolysis is almost twice greater than that of the heat necessary for gasification reaction. This difference is largely created by the value of formation enthalpy of coal, which needs to be balanced with a suitable amount of heat delivered to pyrolysis stage and high final reaction temperature. The share of formation enthalpy in heat demand for pyrolysis is almost 68%.
In the case of coal processing by SES technology, the energy balance shows that the values of both parameters are comparable. This is a result of much lower formation enthalpy of coal than in a Shell case and lower final temperature of the reaction. However what is relevant is that the share of formation enthalpy is still substantial, amounting to almost 40% of heat demand for pyrolysis stage.
In the case of biomass processing heat demand for pyrolysis is close to that for the SES process. However, this is achieved at a very high value of enthalpy of formation, which is almost fivefold greater (−4746.8) kJ/kg. It means that in the thermal decomposition process some exothermic reactions take place to an extent greater than in the case of coal. This effect covers heat demand for the compensation of formation enthalpy. On the other side, the heat demand for gasification is much higher than in the SES case due to the highly endothermal reactions of steam-based gasification. As presented, the heat demand for a process is mainly gasification reaction driven. It should be also noted that without formation enthalpy the energy balance of pyrolysis would deliver a negative value of the heat of pyrolysis and the process would be self-sustained in terms of an internal heat source. However, this is not the case in a real situation.
Concluding, it should be stated that thermodynamic analysis of fuel gasification needs to be performed with a good knowledge of enthalpy of formation and an in depth understanding of the process. It is valuable to analyse it in terms of a two-stage process, namely: pyrolysis and gasification reactions. This delivers crucial information on the energy balance in subsequent stages of the fuel conversion.
Author Contributions
Conceptualization, T.C.; Investigation, T.C., L.S. and M.S.; Methodology, T.C. and M.S.; Supervision, M.S. and W.N.; Writing—original draft, T.C., L.S. and M.S.; Writing—review & editing, T.C., L.S., M.S. and W.N. All authors have read and agreed to the published version of the manuscript.
Funding
This research was funded by an internal grand for research in AGH University of Science and Technology, Krakow.
Institutional Review Board Statement
Not applicable.
Informed Consent Statement
Not applicable.
Data Availability Statement
Not applicable.
Conflicts of Interest
The authors declare no conflict of interest.
List of Symbols
| Symbols | |
| ∆H | enthalpy difference |
| ν | stoichiometric coefficient |
| Q | heat |
| θ | oxygen content |
| Subscripts | |
| rxn | reaction |
| f | formation |
| t | total |
| pyr | pyrolysis |
| gas | gasification |
| daf | dry and ash free |
| th | thermal |
| ph | physical |
| proc | process |
| c | combustion |
| F | feed |
References
- Higman, C. GSTC Global Syngas Database. In Proceedings of the Global Syngas Technologies Conference, Colorado Springs, CO, USA, 28–30 October 2018. [Google Scholar]
- Chmielniak, T. Simulation and Analysis of Hydrogen Production Technologies from Coal in Terms of CO2 Emissions in Cycle of Mining, Transport and Conversion of Coal; Publishing House of Silesian University of Technology: Gliwice, Poland, 2014; ISBN 978-83-7880-143-6. (In Polish) [Google Scholar]
- Silva, I.P.; Lima, R.M.A.; Silva, G.F.; Ruzene, D.S.; Silva, D.P. Thermodynamic equilibrium model based on stoichiometric method for biomass gasification: A review of model modifications. Renew. Sustain. Energy Rev. 2019, 114, 109305. [Google Scholar] [CrossRef]
- Safarian, S.; Unnþórsson, R.; Richter, C. A review of biomass gasification modelling. Renew. Sustain. Energy Rev. 2019, 110, 378–391. [Google Scholar] [CrossRef]
- Ramosa, A.; Monteirob, E.; Rouboab, A. Numerical approaches and comprehensive models for gasification process: A review. Renew. Sustain. Energy Rev. 2019, 110, 188–206. [Google Scholar] [CrossRef]
- La Villettaa, M.; Costab, M.; Massarottia, N. Modelling approaches to biomass gasification: A review with emphasis on the stoichiometric method. Renew. Sustain. Energy Rev. 2017, 74, 71–88. [Google Scholar] [CrossRef]
- George, J.; Arun, P.; Muraleedharan, C. Stoichiometric equilibrium model based assessment of hydrogen through biomass gasification. Procedia Technol. 2016, 25, 982–989. [Google Scholar] [CrossRef] [Green Version]
- Kangas, P.; Hannula, I.; Koukkari, P.; Hupa, M. Modelling super-equlibrium in biomass gasification with constrained Gibbs energy method. Fuel 2014, 129, 86–94. [Google Scholar] [CrossRef]
- Amaro, J.; Mendiburu, A.Z.; Avila, I. Modeling of syngas composition obtained from fluidized bed gasifiers using Kuhn-Tucker multipliers. Energy 2018, 152, 371–382. [Google Scholar] [CrossRef] [Green Version]
- Aydin, E.S.; Yucel, O.; Sadikoglu, H. Development of semi-empirical equilibrium model for downdraft gasification systems. Energy 2017, 130, 86–98. [Google Scholar] [CrossRef]
- Upadhyah, D.S.; Sakhiya, A.K.; Panchal, K.; Patel, A.H.; Patel, R.N. Effect of equivalence ratio on the performance of the downdraft gasifier—An experimental and modelling approach. Energy 2019, 168, 833–846. [Google Scholar] [CrossRef]
- Nguyen, T.D.B.; Lim, Y.I.; Song, B.H.; Kim, S.M.; Joo, Y.J.; Ahn, D.H. Two-stage equilibrium model applicable to the wide range of operating conditions in entrained-flow coal gasifiers. Fuel 2010, 89, 3901–3910. [Google Scholar] [CrossRef]
- Al-Zareer, M.; Dincer, I.; Rosen, M.A. Modeling and performance assessment of a new integrated gasification combined cycle with a water gas shift membrane reactorfor hydrogen production. Comp. Chem. Eng. 2017, 103, 275–292. [Google Scholar] [CrossRef]
- Weber, K.; Li, T.; Lovas, T.; Perlman, C.; Seidel, L.; Mauss, F. Stochastic reactor modeling of biomass pyrolysis and gasification. J. Anal. Appl. Pyrolysis 2017, 124, 592–601. [Google Scholar] [CrossRef] [Green Version]
- Trninic, M.; Stojiljkovic, D.; Manic, N.; Skreiberg, O.; Wang, L.; Jovovic, A. A mathematical model of biomass downdraft gasification with an integrated pyrolysis model. Fuel 2020, 265, 116867. [Google Scholar] [CrossRef]
- Sang, S.P.; Hyo, J.J.; Jungho, H. 3-D CFD Modeling for Parametric Study in a 300-MWe One-Stage Oxygen-Blown Entrained-Bed Coal Gasifier. Energies 2015, 8, 4216–4236. [Google Scholar] [CrossRef] [Green Version]
- Verissimo, G.L.; Kalab Leiroz, A.J.; Cruz, M.E. Influence of the pyrolysis and heterogeneous char reactions modeling in the simulation of sugarcane bagasse gasification in a bubbling fluidized bed reactor. Fuel 2020, 281, 118750. [Google Scholar] [CrossRef]
- Ranzi, E.; Cuoci, A.; Faravelli, T.; Frassoldati, A.; Migliavacca, G.; Pierucci, S. Chemical kinetics of biomass pyrolysis. Energy Fuels 2008, 22, 4292–4300. [Google Scholar] [CrossRef]
- Anca-Couce, A.; Mehrabian, R.; Scharler, R.; Obernberger, I. Kinetic scheme of biomass pyrolysis considering secondary charring reactions. Energy Convers. Manag. 2014, 87, 687–696. [Google Scholar] [CrossRef]
- Mularski, J.; Pawlak-Kruczek, H.; Modlinski, N. A review of recent studies of the CFD modelling of coal gasification in entrained flow gasifiers, covering devolatilization, gas-phase reactions, surface reactions, models and kinetics. Fuel 2020, 271, 117620. [Google Scholar] [CrossRef]
- Ściążko, M. Models of Coal Classification in Terms of Thermodynamics and Kinetics (In Polish); Publishing House of AGH University of Science and Technology in Kraków: Kraków, Poland, 2010. [Google Scholar]
- Sciazko, M. Rank-dependent formation enthalpy of coal. Fuel 2013, 114, 2–9. [Google Scholar] [CrossRef]
- Lozano, E.M.; Pedersen, T.H.; Rosendahl, L.A. Generic Approach for the Modeling of Liquefied Thermochemical Products and Biomass Heat of Formation. Case Study: HTL Biocrude, Pyrolysis Oil and Assessment of Energy Requirements. Department of Energy Technology, Aalborg University. Available online: https://arxiv.org/ftp/arxiv/papers/1908/1908.00799.pdf (accessed on 18 August 2021).
- Chemstations. Available online: https://www.chemstations.com (accessed on 19 May 2021).
- MathCAD. Available online: https://www.mathcad.com/en/ (accessed on 19 May 2021).
- Air Products. Available online: https://www.airproducts.com/applications/syngas-solutions/solid-hydrocarbons (accessed on 19 May 2021).
- Synthesis Energy. Available online: http://www.synthesisenergy.com/ (accessed on 19 May 2021).
- Mauerhofer, A.M.; Schmid, J.C.; Benedikt, F.; Fuchs, J.; Müller, S.; Hofbauer, H. Dual fluidized bed steam gasification: Change of product gas quality along the reactor height. Energy 2019, 173, 1256–1272. [Google Scholar] [CrossRef]
- Higman, C.; Van der Burgt, M.J. Gasification; Gulf Professional Publishing, Elsevier Inc.: Houston, TX, USA, 2008. [Google Scholar] [CrossRef]
- Cost and Performance Baseline for Fossil Energy Plants, Volume 3a: Low Rank Coal to Electricity: IGCC Cases. DOE/NETL–2010/1399, May 2011. Available online: http://www.netl.doe.gov/ (accessed on 16 August 2021).
- Cost and Performance Baseline for Fossil Energy Plants Volume 1b: Bituminous Coal (IGCC) to Electricity Revision 2b—Year Dollar Update, DOE/NETL-2015/1727, 31 July 2015. Available online: http://www.netl.doe.gov/ (accessed on 16 August 2021).
- Ściążko, M.T.; Chmielniak, T.; Lau, F.; Taber, W.; Bigda, J.; Sobolewski, A. Process analysis of the low-quality fuels gasification, integrated with coal boiler. In Proceedings of the 19th International Freiberg Conference on IGCC & XtL Technologies, Closing the Carbon Cycle, Berlin, Germany, 3–8 June 2018. [Google Scholar]
- Pasteiner, H.; Schmid, J.C.; Müller, S.; Hofbauer, H. Cold Flow Investigations on a Novel Dual Fluidized Bed Steam Gasification Test Plant. In Proceedings of the 11. Minisymposium der Verfahrenstechnik, an der BOKU, Wien, Österreich, 14–15 April 2015. [Google Scholar]
- Wojnicka, B.; Sciazko, M.; Schmid, J. Modelling of biomass gasification with steam. Biomass Convers. Biorefinery 2019, 1–19. [Google Scholar] [CrossRef]
- Rönsch, S.; Wagner, H. Calculation of heating values for the simulation of thermo-chemical conversion plants with Aspen plus. In Proceedings of the DBFZ Workshop “Fließschemasimulation in der Energietechnik”, Leipzig, Germany, 13 November 2012. [Google Scholar]
- Burnham, A.K. Estimating the Heat of Formation of Foodstuffs and Biomass; Report UCRL-TR-464095; Energetic Materials Center Lawrence Livermore National Laboratory: Livermore, CA, USA, 2010. [Google Scholar]
- Gagarin, S.G.; Gladun, T.G. Evaluation of enthalpy of formation of coal organic matter. Chem. Tvierdovo Topliwa 2003, 4, 3–23. (In Russian) [Google Scholar]
- Sciazko, M. Balancing of Coking Process (in Polish). Institute for Chemical Processing of Coal: Zabrze, Poland, 2010. [Google Scholar]
- Parikh, J.; Channiwala, S.A.; Ghosal, G.K. A correlation for calculating HHV from proximate analysis of solid fuels. Fuel 2005, 84, 487–494. [Google Scholar] [CrossRef]
- Chinnawala, S.A.; Parikh, P.P. A unified correlation for estimating HHV for solid, liquid and gaseous fuels. Fuel 2002, 81, 1051–1063. [Google Scholar] [CrossRef]
Figure 1.
Gasification process syngas use (million m3/h) [2].
Figure 1.
Gasification process syngas use (million m3/h) [2].

Figure 2.
Block diagram for coal gasification in Shell reactor-calculation scheme.

Figure 3.
Model of the synthesis energy systems (SES) gasification reactor-calculation scheme [32].
Figure 3.
Model of the synthesis energy systems (SES) gasification reactor-calculation scheme [32].

Figure 4.
Graphical layout of the two-stage steam gasification model [34] calculation scheme.
Figure 4.
Graphical layout of the two-stage steam gasification model [34] calculation scheme.

Figure 5.
The effect of the oxygen content (daf) on the heat of fuel combustion.

Figure 6.
Comparison of experimental data with a new (Equation (5)) and former [22] correlation on enthalpy of formation.
Figure 6.
Comparison of experimental data with a new (Equation (5)) and former [22] correlation on enthalpy of formation.

Figure 7.
Prediction of HHV with a proposed correlation.

Figure 8.
Enthalpy of formation against oxygen content.

Figure 9.
Difference in the calculation temperatures of coal gasification.

Figure 10.
Results of the enthalpy of formation calculations. The heat losses to the environment and the heat necessary to produce medium-pressure steam in the reactor’s shell (sub-bituminous coal and lignite) have been considered.
Figure 10.
Results of the enthalpy of formation calculations. The heat losses to the environment and the heat necessary to produce medium-pressure steam in the reactor’s shell (sub-bituminous coal and lignite) have been considered.

Figure 11.
Difference between the actual and calculation process temperature obtained with and without the enthalpy of fuel formation.
Figure 11.
Difference between the actual and calculation process temperature obtained with and without the enthalpy of fuel formation.

Figure 12.
The flow diagram for energy balance of pyrolysis.

Figure 13.
The block diagram of the entire gasification process (Ppyr—intermediate products of pyrolysis stage).
Figure 13.
The block diagram of the entire gasification process (Ppyr—intermediate products of pyrolysis stage).

Figure 14.
Energy balance of Shell process for lignite gasification per 1 kg of feed material.

Figure 15.
Energy balance of SES process for subbituminous coal gasification per 1 kg of feed material.
Figure 15.
Energy balance of SES process for subbituminous coal gasification per 1 kg of feed material.

Figure 16.
Energy balance of dual fluidized bed (DFB) process for sub-bituminous coal gasification per 1 kg of feed material.
Figure 16.
Energy balance of dual fluidized bed (DFB) process for sub-bituminous coal gasification per 1 kg of feed material.


| Parameter | Symbol | Unit | Bituminous Coal. Illinois. No. 6 | Subbituminous Coal. Montana Rosebud. PRB | North Dakota Beulah Zap Lignite |
|---|---|---|---|---|---|
| Carbon | C | wt. % | 63.75 | 50.07 | 39.55 |
| Hydrogen | H | wt. % | 4.50 | 3.38 | 2.74 |
| Nitrogen | N | wt. % | 1.25 | 0.71 | 0.63 |
| Sulphur | S | wt. % | 2.51 | 0.73 | 0.63 |
| Oxygen | O | wt. % | 6.88 | 11.14 | 10.51 |
| Chlorine | Cl | wt. % | 0.29 | 0.01 | 0.00 |
| Water | W | wt. % | 11.12 | 25.77 | 36.08 |
| Ash | A | wt. % | 9.70 | 8.19 | 9.86 |
| Lower heating value | Qi | kJ/kg | 26,151 | 19,195 | 14,804 |
| Higher heating value | Qs | kJ/kg | 27,113 | 19,920 | 15,391 |
Table 2.
Coal properties for the fluidized bed gasification technology.
| Parameter | Symbol | Unit | Average | Range |
|---|---|---|---|---|
| Carbon | C | wt. % | 70.51 | 69.80–71.02 |
| Hydrogen | H | wt. % | 4.12 | 4.08–4.15 |
| Nitrogen | N | wt. % | 8.87 | 8.78–8.93 |
| Sulphur | S | wt. % | 0.58 | 0.57–0.59 |
| Oxygen | O | wt. % | 1.13 | 1.12–1.14 |
| Water | W | wt. % | 9.87 | 9.22–10.77 |
| Ash | A | wt. % | 4.93 | 4.88–4.96 |
| Low heating value | Qi | kJ/kg | 27,183 | 26,892–27,395 |
| High heating value | Qs | kJ/kg | 28,380 | 28,104–28,581 |
Table 3.
Wood pellets properties [30].
Table 3.
Wood pellets properties [30].
| Parameter | Symbol | Unit | Value |
|---|---|---|---|
| Water content | Wt | wt. % | 7.2 |
| Volatiles, dry basis | Vdry | wt. % | 85.4 |
| Fixed carbon (including ash), dry basis | FCdry | wt. % | 14.6 |
| Low Heating Value, dry basis | Qidry | MJ/kg | 18.9 |
| Low Heating Value, as received | Qiar | MJ/kg | 17.4 |
| Carbon, dry basis | Cdry | wt. % | 50.7 |
| Hydrogen, dry basis | Hdry | wt. % | 5.9 |
| Oxygen, dry basis | Odry | wt. % | 43.0 |
| Nitrogen, dry basis | Ndry | wt. % | 0.2 |
| Sulphur, dry basis | Sdry | wt. % | 0.005 |
| Chlorine, dry basis | Cldry | wt. % | 0.005 |
| Ash content, dry basis | Adry | wt. % | 0.2 |
Table 4.
Range of elemental compositions and heats of combustion.
| Parameter | Symbol | Min. Value | Max. Value |
|---|---|---|---|
| Composition, wt. % (daf) | |||
| Carbon | C | 42.57 | 91.26 |
| Hydrogen | H | 0.35 | 6.77 |
| Oxygen | O | 0.3 | 50.98 |
| Nitrogen | N | 0.0 | 7.26 |
| Sulphur | S | 0.0 | 9.37 |
| Heat of combustion, MJ/kg | Qs,daf | 16.6 | 37.3 |
| Parameter | Bituminous Coal. Illinois. No. 6 | Subbituminous Coal. Montana Rosebud. PRB | North Dakota Beulah Zap Lignite |
|---|---|---|---|
| Coal Input, kg/h (1) | 185,222 | 194,396 | 250,430 |
| Heat rate, MWth (2) | 1439.5 | 1322.8 | 1435.3 |
| Oxygen input, kg/h | 147,752 | 150,725 | 171,673 |
| Steam input, kg/h | 19,111 | - | - |
| Enthalpy of coal formation, kJ/kg (daf) | (−657.8) | (−1758.5) | (−2094.6) |
| Temperature of the process °C | |||
| According to [26,27] | 1459.6 | 1454.0 | 1371.0 |
| Results of calculation | |||
| w/o fuel enthalpy of formation | 1560.7 | 2005.4 | 1942.9 |
| w. coal enthalpy of formation | 1425.0 | 1656.2 | 1577.4 |
(1)—moisture content 6% (Sub-bituminous coal. Montana Rosebud. PRB), 12% (North Dakota Beulah Zap Lignite), 5% (Bituminous coal. Illinois. no. 6; (2) based on coal high heating value Qs.
Table 6.
Process parameters and results of calculation.
| Parameter | Average | Range |
|---|---|---|
| Coal input, kg/h | 13,997.5 | 16,783–29,392 |
| Heat rate, MWth (1) | 200.9 | 133.2–229.5 |
| Oxygen input, kg/h | 12,045.2 | 8907–13,167 |
| Steam input, kg/h | 33,459.3 | 32,388–35,228 |
| Temperature of the process °C | 881.1 | 857–911 |
| Pressure of the process, bar | 9.0 | 8.5–9.4 |
| Enthalpy of coal formation, kJ/kg daf | (−844.8) | (−844.6)–(−844.9) |
(1) based on coal high heating value Qs.
| Parameter | Gasification Reactor |
|---|---|
| Biomass feed rate, kg/h | |
| - dry (moisture content 7.2%) | 21.4 |
| - dry ash free | 19.8 |
| Heat rate, MWth (1) | 0.091 |
| Temperature, °C | 940 (2)–970 (3) |
| Enthalpy of formation, kJ/kgdaf | (−4405) |
| Circulation rate (kg/h) | 334 |
| Steam/biomass (daf) ratio | 0.8 |
(1)—Based on biomass high heating value Qs, (2)—Lower gasification reactor; (3)—Higher gasification reactor.
Table 8.
Results of thermal effects calculation for biomass pyrolysis and char gasification processes.
Table 8.
Results of thermal effects calculation for biomass pyrolysis and char gasification processes.
| Parameter | Unit | With Enthalpy of Formation | Without Enthalpy of Formation |
|---|---|---|---|
| Heat demand for pyrolysis, Qpyr | kJ/kg | 2335.00 | −2003.00 |
| Heat demand for gasification, Qgas | kJ/kg | 857.00 | 973.00 |
| Total | kJ/kg | 3192.00 | −1036.00 |
| Circulation rate (heat carrier) | kg/h | 333.73 | −108.27 |
Table 9.
Coal characteristic.
| Parameter | Symbol | North Dakota Beulah Zap Lignite | Hard Coal SES | Biomass |
|---|---|---|---|---|
| Content, wt. % | ||||
| Carbon | C | 57.42 | 72.60 | 47.0 |
| Hydrogen | H | 3.98 | 4.24 | 5.5 |
| Oxygen | O | 19.44 | 9.13 | 39.9 |
| Nitrogen | N | 1.17 | 1.16 | 0.2 |
| Sulphur | S | 1.17 | 0.59 | 0.005 |
| Water | W | 7.2 | 7.2 | 7.2 |
| Ash | A | 14.31 | 5.07 | 0.195 |
Publisher’s Note: MDPI stays neutral with regard to jurisdictional claims in published maps and institutional affiliations. |
© 2021 by the authors. Licensee MDPI, Basel, Switzerland. This article is an open access article distributed under the terms and conditions of the Creative Commons Attribution (CC BY) license (https://creativecommons.org/licenses/by/4.0/).
Share and Cite
MDPI and ACS Style
Chmielniak, T.; Stepien, L.; Sciazko, M.; Nowak, W. Effect of Pyrolysis Reactions on Coal and Biomass Gasification Process. Energies 2021, 14, 5091. https://0-doi-org.brum.beds.ac.uk/10.3390/en14165091
AMA Style
Chmielniak T, Stepien L, Sciazko M, Nowak W. Effect of Pyrolysis Reactions on Coal and Biomass Gasification Process. Energies. 2021; 14(16):5091. https://0-doi-org.brum.beds.ac.uk/10.3390/en14165091
Chicago/Turabian StyleChmielniak, Tomasz, Leszek Stepien, Marek Sciazko, and Wojciech Nowak. 2021. "Effect of Pyrolysis Reactions on Coal and Biomass Gasification Process" Energies 14, no. 16: 5091. https://0-doi-org.brum.beds.ac.uk/10.3390/en14165091
Note that from the first issue of 2016, this journal uses article numbers instead of page numbers. See further details here.