
Analysis and Forecasting of PM2.5, PM4, and PM10 Dust Concentrations, Based on In Situ Tests in Hard Coal Mines

 , , and
Abstract
:
1. Introduction
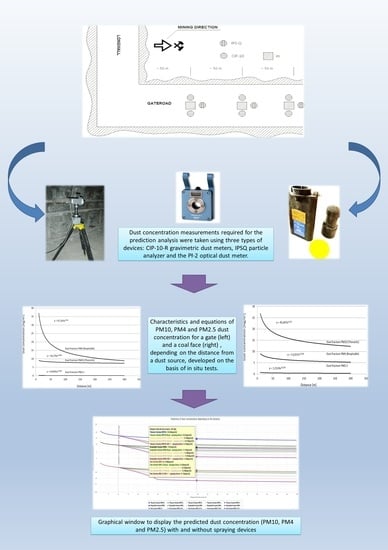
2. Test Methodology
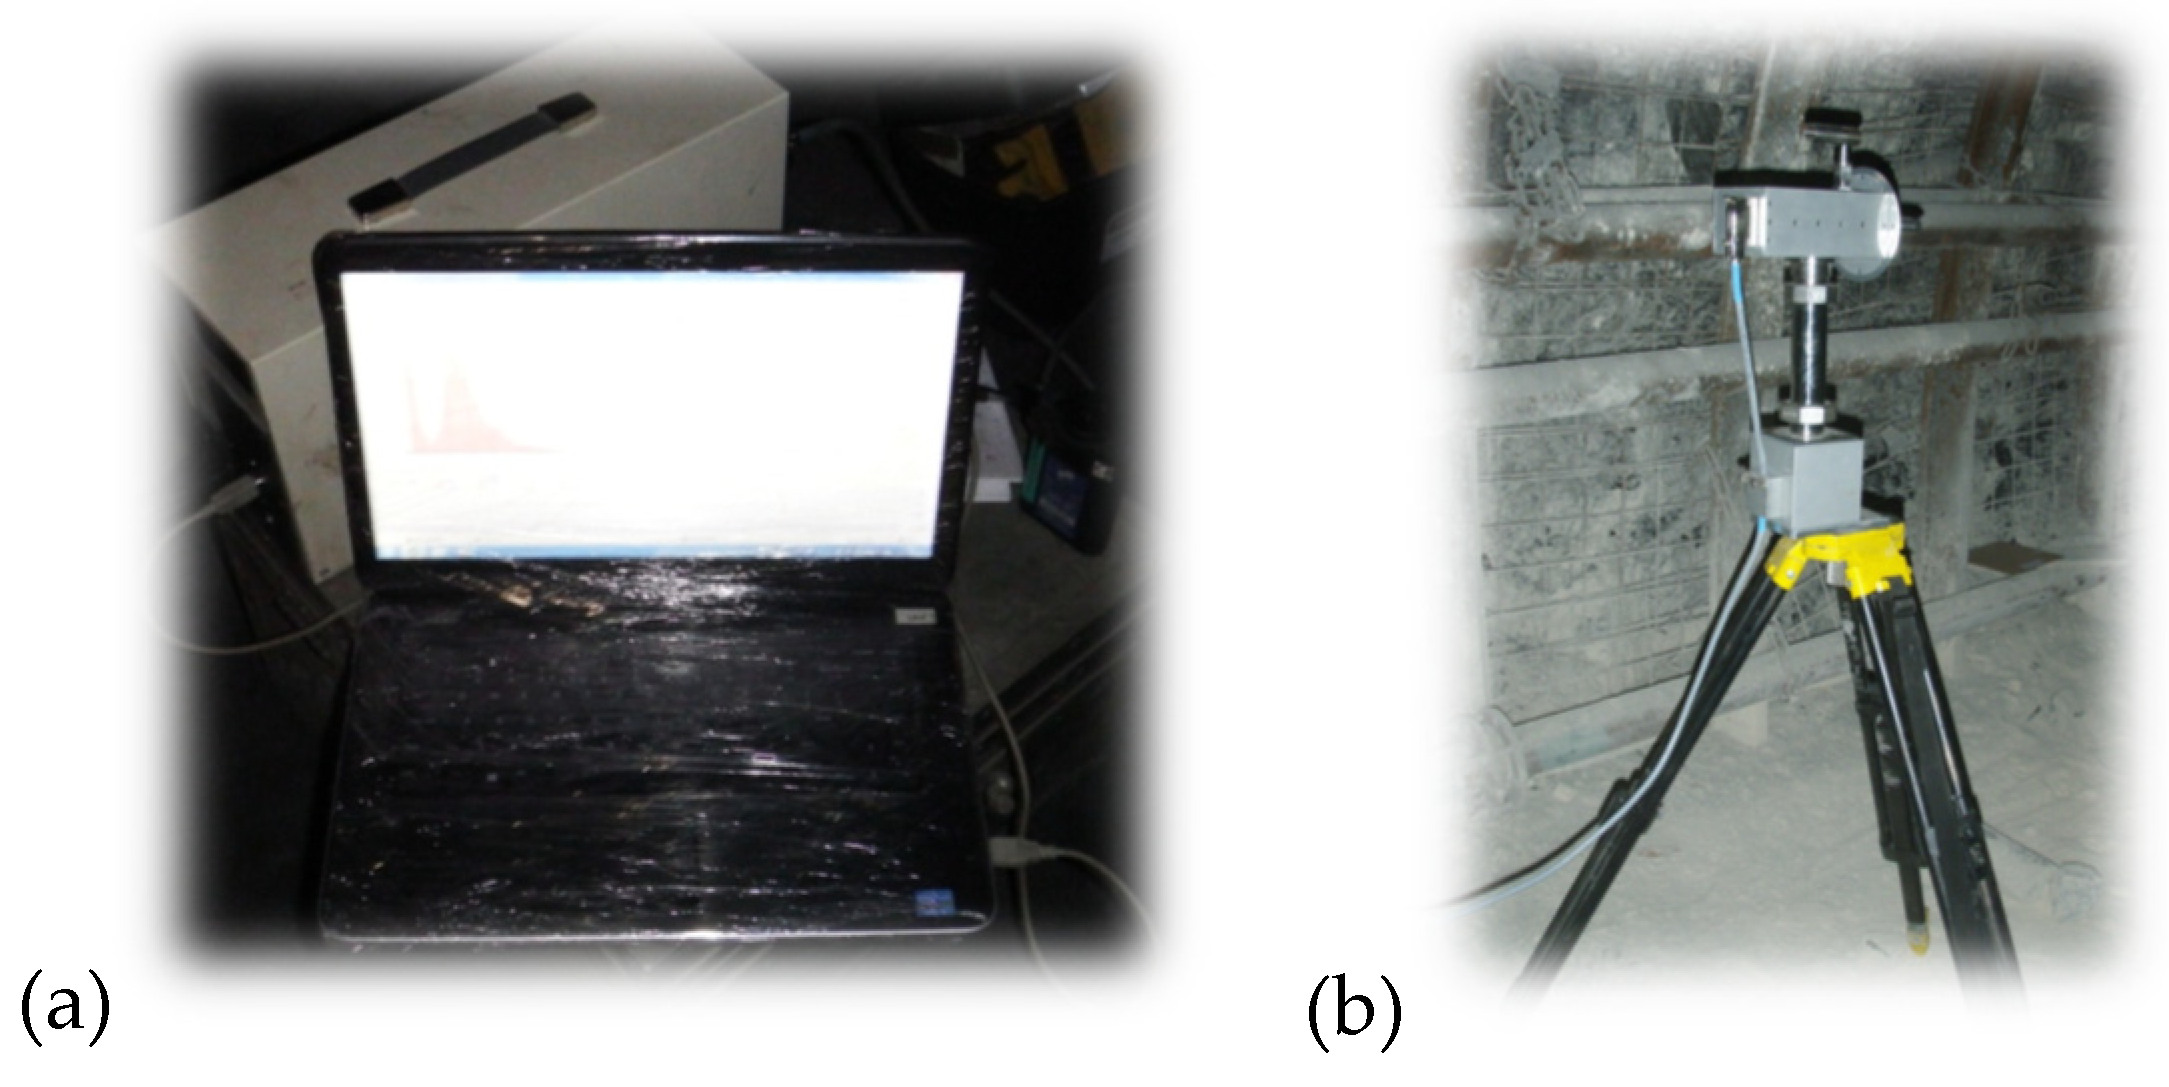
3. In Situ Tests
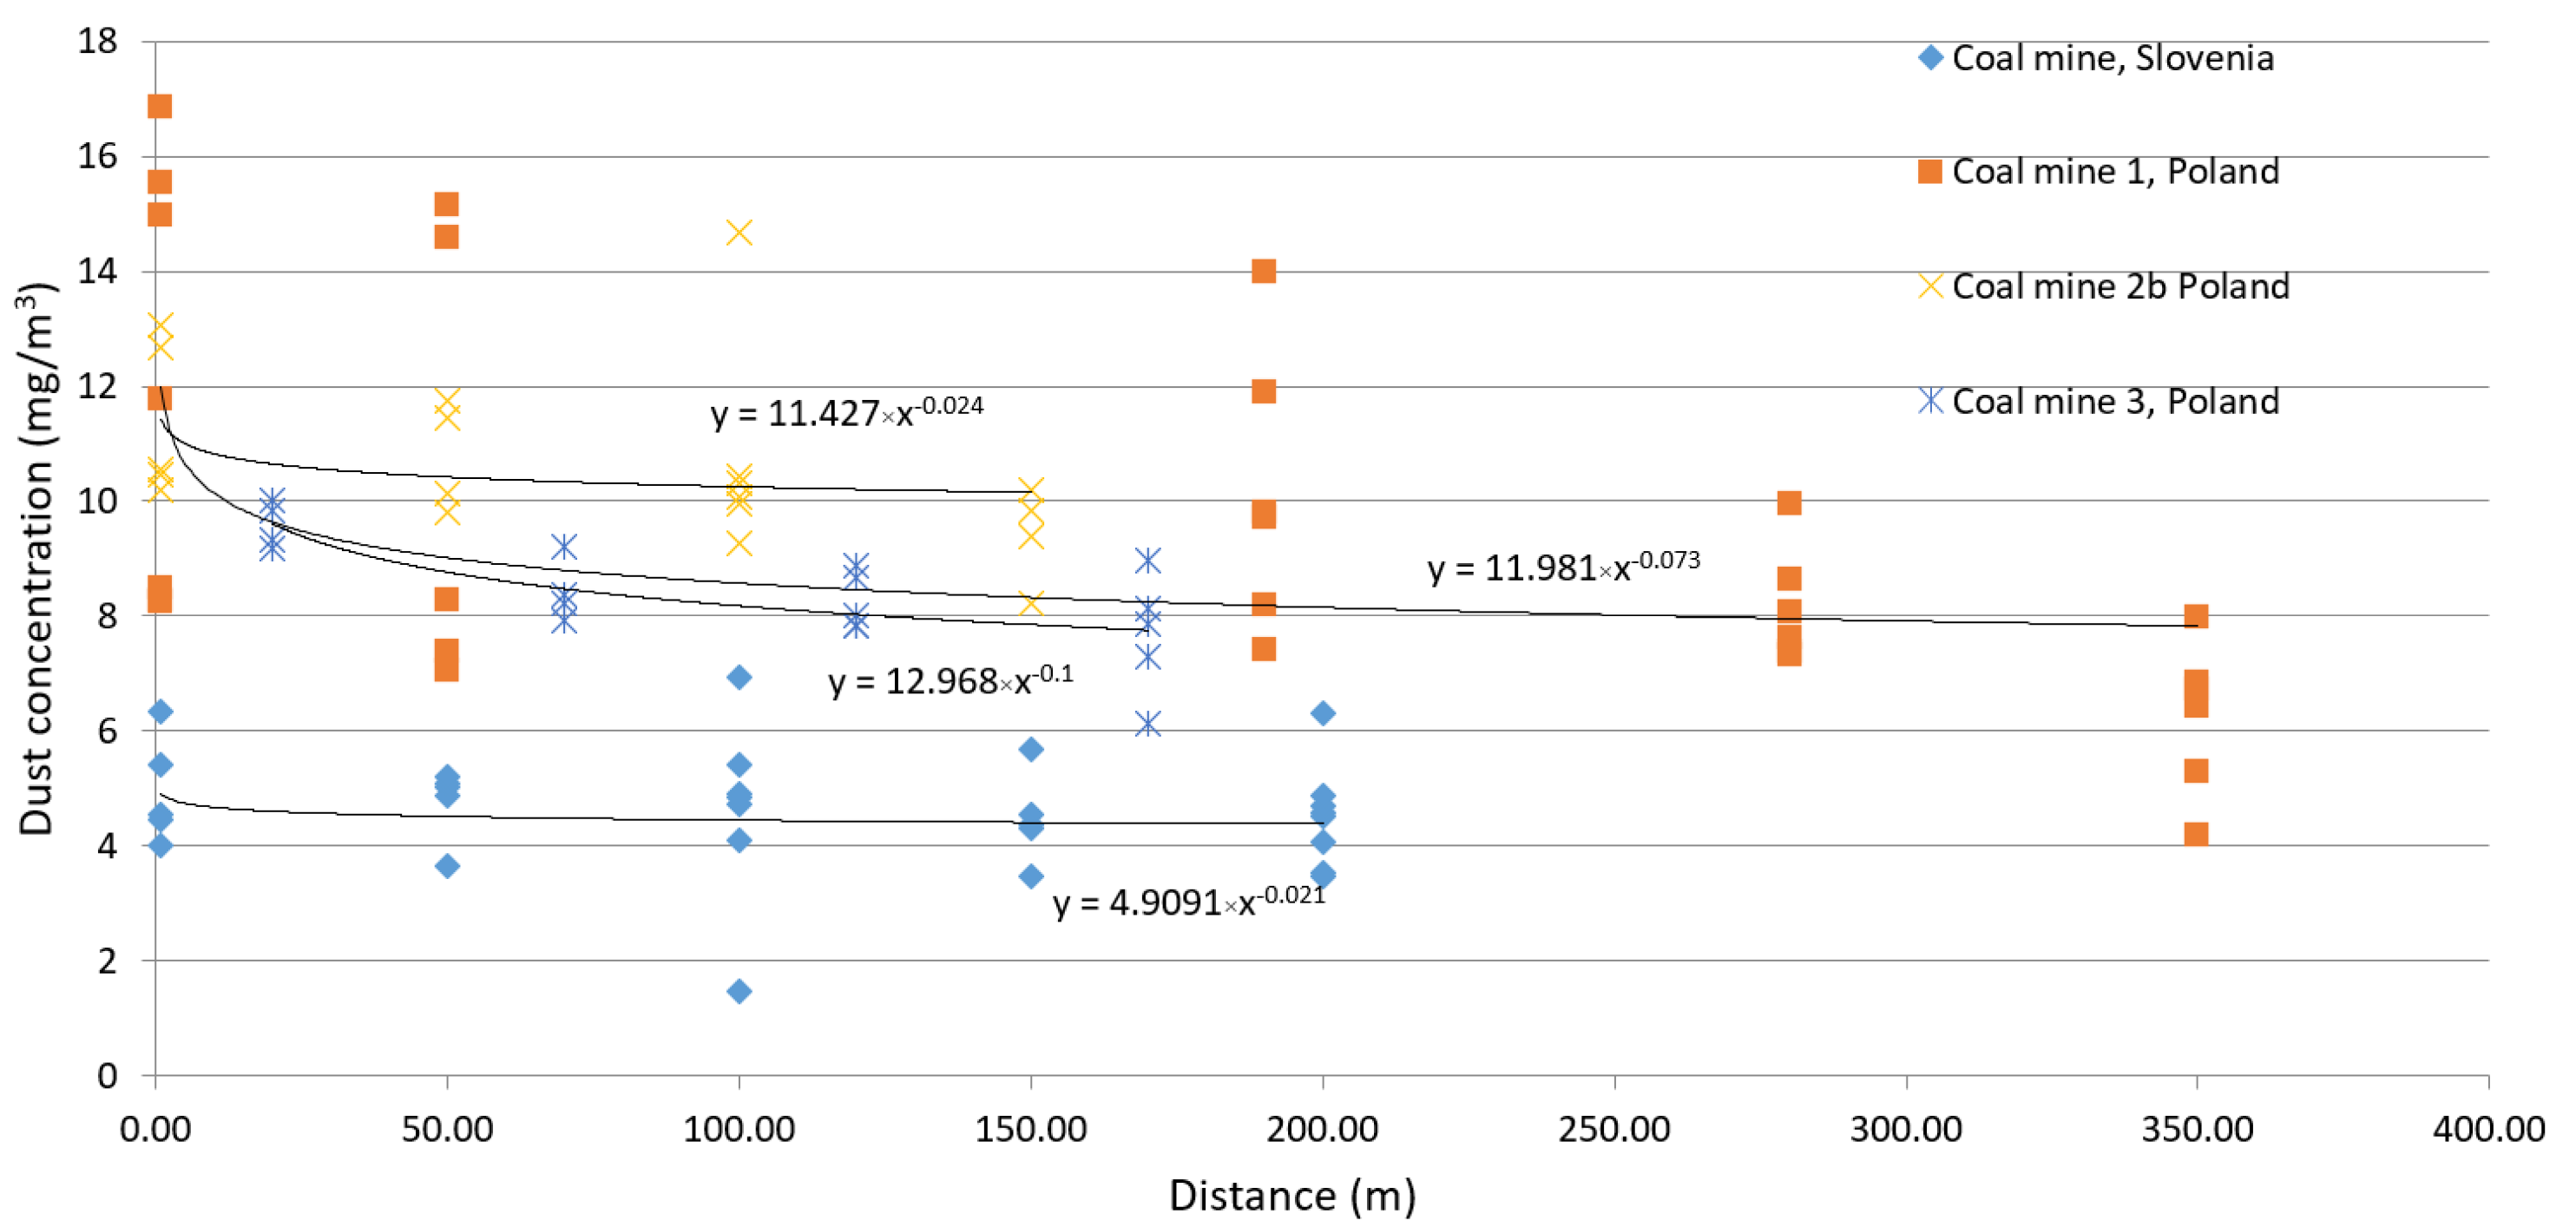
4. Analysis of the Results
5. Conclusions
Author Contributions
Funding
Conflicts of Interest
References
- Petsonk, E.L.; Rose, C.; Cohen, R. Coal mine dust lung disease new lessons from an old exposure. Am. J. Respir. Crit. Care Med. 2013, 187, 1178–1185. [Google Scholar] [CrossRef] [PubMed]
- NIOSH. Coal Mine Dust Exposures and Associated Health Outcomes: A Review of Information Published Since 1995; Department of Health and Human Services, Centers for Disease Control and Prevention, National Institute for Occupational Safety and Health, Current Intelligence Bulletin: Cincinnati, OH, USA, 2011; Volume 64.
- Olejnik, M. Testing the equipment used in ventilation of mine workings. Min. Mach. 2020, 2, 26–37. [Google Scholar]
- Landen, D.D.; Wassell, J.T.; McWilliams, L.; Patel, A. Coal dust exposure and mortality from ischemic heart disease among a cohort of US coal miners. Am. J. Ind. Med. 2011, 54, 727–733. [Google Scholar] [CrossRef] [PubMed]
- Brodny, J.; Tutak, M. Exposure to harmful dusts on fully powered longwall coal mines in Poland. Int. J. Environ. Res. Public Health 2018, 15, 1846. [Google Scholar] [CrossRef] [PubMed] [Green Version]
- Cohen, R.A.; Petsonk, E.L.; Rose, C.; Young, B.; Regier, M.; Najmuddin, A.; Abraham, J.L.; Churg, A.; Green, F.H. Lung pathology in U.S. coal workers with rapidly progressive pneumoconiosis implicates silica and silicates. Am J Respir Crit Care Med. 2018, 15, 673–680. [Google Scholar] [CrossRef] [PubMed] [Green Version]
- Świątkowska, B.; Hanke, W. Occupational diseases in poland in 2016/Choroby zawodowe w polsce w 2016 roku. Med. Pr. 2018, 69, 643–651. [Google Scholar] [PubMed]
- Górniczy, W.U. Ocena Stanu Bezpieczeństwa Pracy, Ratownictwa Górniczego oraz Bezpieczeństwa Powszechnego w Związku z Działalnością Górniczo-Geologiczną w 2019 Roku; Wyższy Urząd Górniczy: Katowice, Poland, 2020. [Google Scholar]
- Xia, Y.; Liu, J.; Shi, T.; Xiang, H.; Bi, Y. Prevalence of pneumoconiosis in Hubei, China from 2008 to 2013. Int. J. Environ. Res. Public Health 2013, 11, 8612–8621. [Google Scholar] [CrossRef] [PubMed] [Green Version]
- Stansbury, R.C.; Beeckman-Wagner, L.-A.F.; Wang, M.-L.; Hogg, J.P.; Petsonk, E.L. Rapid decline in lung function in coal miners: Evidence of disease in small airways. Am. J. Ind. Med. 2013, 56, 1107–1112. [Google Scholar] [CrossRef] [PubMed]
- Prostański, D. Empirical models of zones protecting against coal dust explosion. Arch. Min. Sci. 2017, 62, 612–619. [Google Scholar] [CrossRef] [Green Version]
- Kalita, M. Badania przemieszczania pyłu zalegającego w wyrobisku chodnikowym. Wiadomości Górnicze 2016, 67, 441–449. [Google Scholar]
- Yueze, L.; Akhtar, S.; Sasmito, A.P.; Kurnia, J.C. Prediction of air flow, methane, and coal dust dispersion in a room and pillar mining face. Int. J. Min. Sci. Technol. 2017, 27, 657–662. [Google Scholar] [CrossRef]
- Ceмин, M.A.; Иcaeвич, A.Г.; Жиxapeв, C.Я. Иccлeдoвaниe oceдaния пыли кaлийнoй coли в гopнoй выpaбoткe. Φизикo-тexничecкиe пpoблeмы paзpaбoтки пoлeзныx иcкoпaeмыx 2021, 2, 178–191. [Google Scholar] [CrossRef]
- Cheng, W.; Yu, H.; Zhou, G.; Nie, W. The diffusion and pollution mechanisms of airborne dusts in fully-mechanized excavation face at mesoscopic scale based on CFD-DEM. Process. Saf. Environ. Prot. 2016, 104, 240–253. [Google Scholar] [CrossRef]
- Jiang, W.; Xu, X.; Wen, Z.; Wei, L. Applying the similarity theory to model dust dispersion during coal-mine tunneling. Process. Saf. Environ. Prot. 2021, 148, 415–427. [Google Scholar] [CrossRef]
- MAK. Substance Overview for Coal Mine Dust (Respirable Fraction). The MAK Collection for Occupational Health and Safety. 1. 2012. Available online: http://0-onlinelibrary-wiley-com.brum.beds.ac.uk/doi/10.1002/3527600418.mbe0163sta/full (accessed on 31 January 2012).
- Brown, J.S.; Gordon, T.; Price, O.; Asgharian, B. Thoracic and respirable particle definitions for human health risk assessment. Part. Fibre Toxicol. 2013, 10, 1–12. [Google Scholar] [CrossRef] [PubMed] [Green Version]
- Lepeule, J.; Laden, F.; Dockery, D.; Schwartz, J. Chronic exposure to fine particles and mortality: An extended follow-up of the Harvard Six Cities study from 1974 to 2009. Environ. Health Persp. 2012, 120, 965–970. [Google Scholar] [CrossRef] [PubMed]
- Liu, Z.; Zhu, M.; Yang, H.; Zhao, D.; Zhang, K. Study on the influence of new compound reagents on the functional groups and wettability of coal. Fuel 2021, 302, 121113. [Google Scholar] [CrossRef]
- Bałaga, D.; Siegmund, M.; Kalita, M.; Williamson, B.J.; Walentek, A.; Małachowski, M. Selection of operational parameters for a smart spraying system to control airborne PM10 and PM2.5 dusts in underground coal mines. Process. Saf. Environ. Prot. 2021, 148, 482–494. [Google Scholar] [CrossRef]


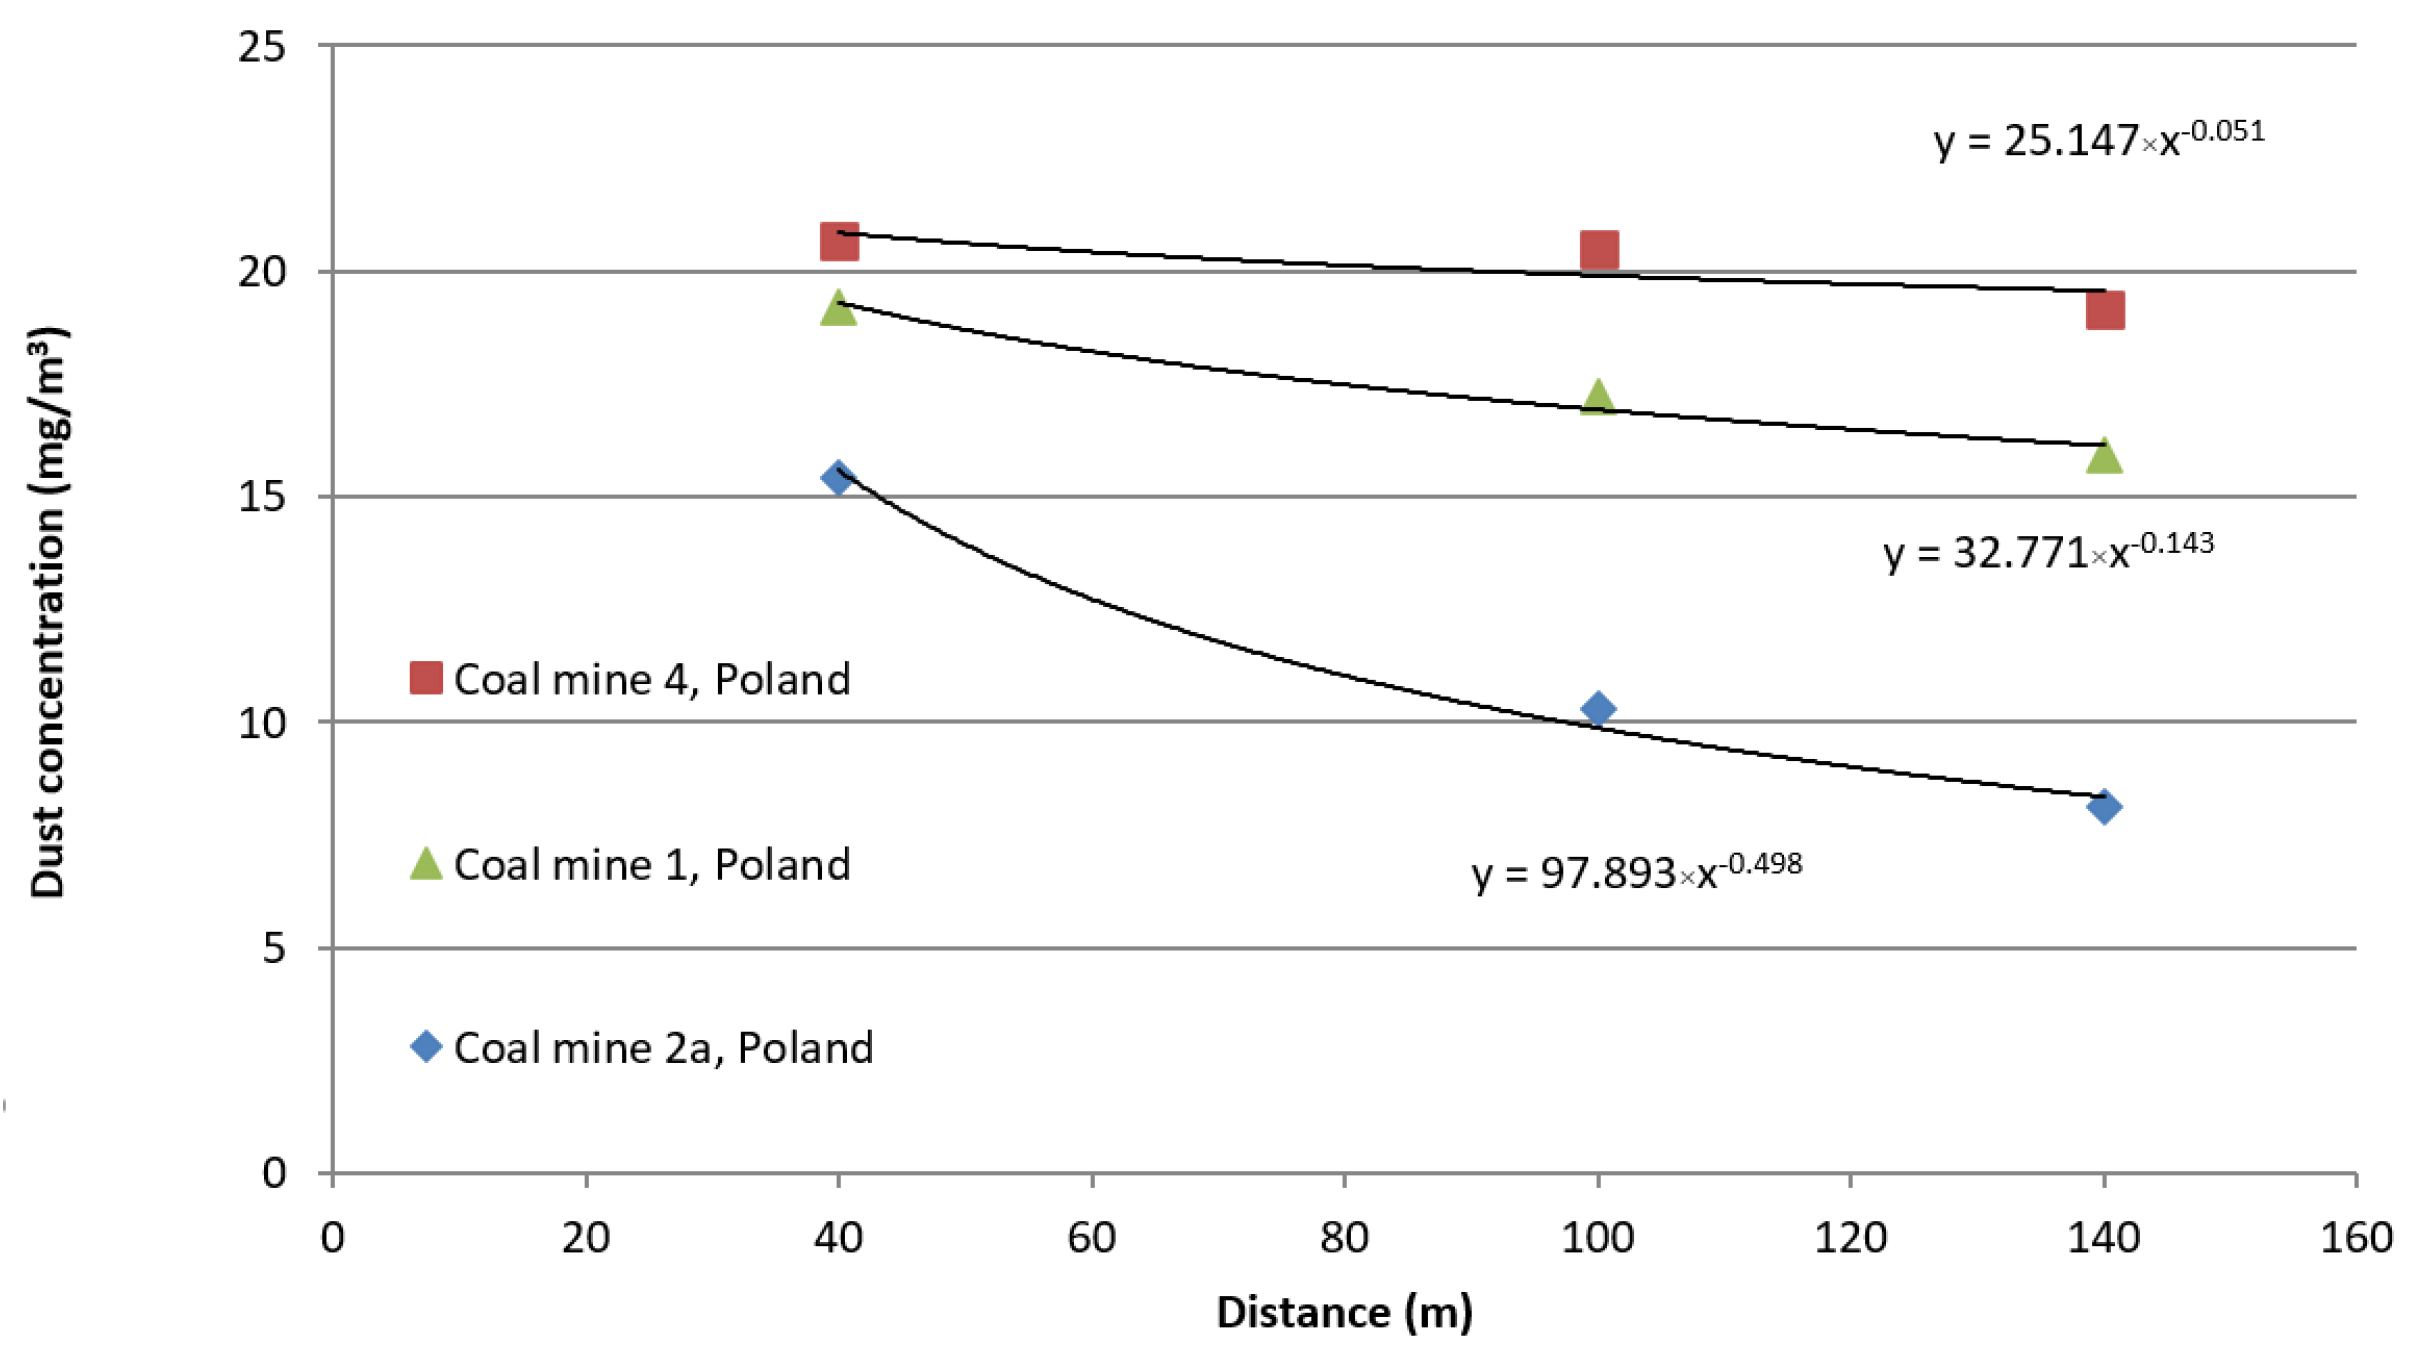
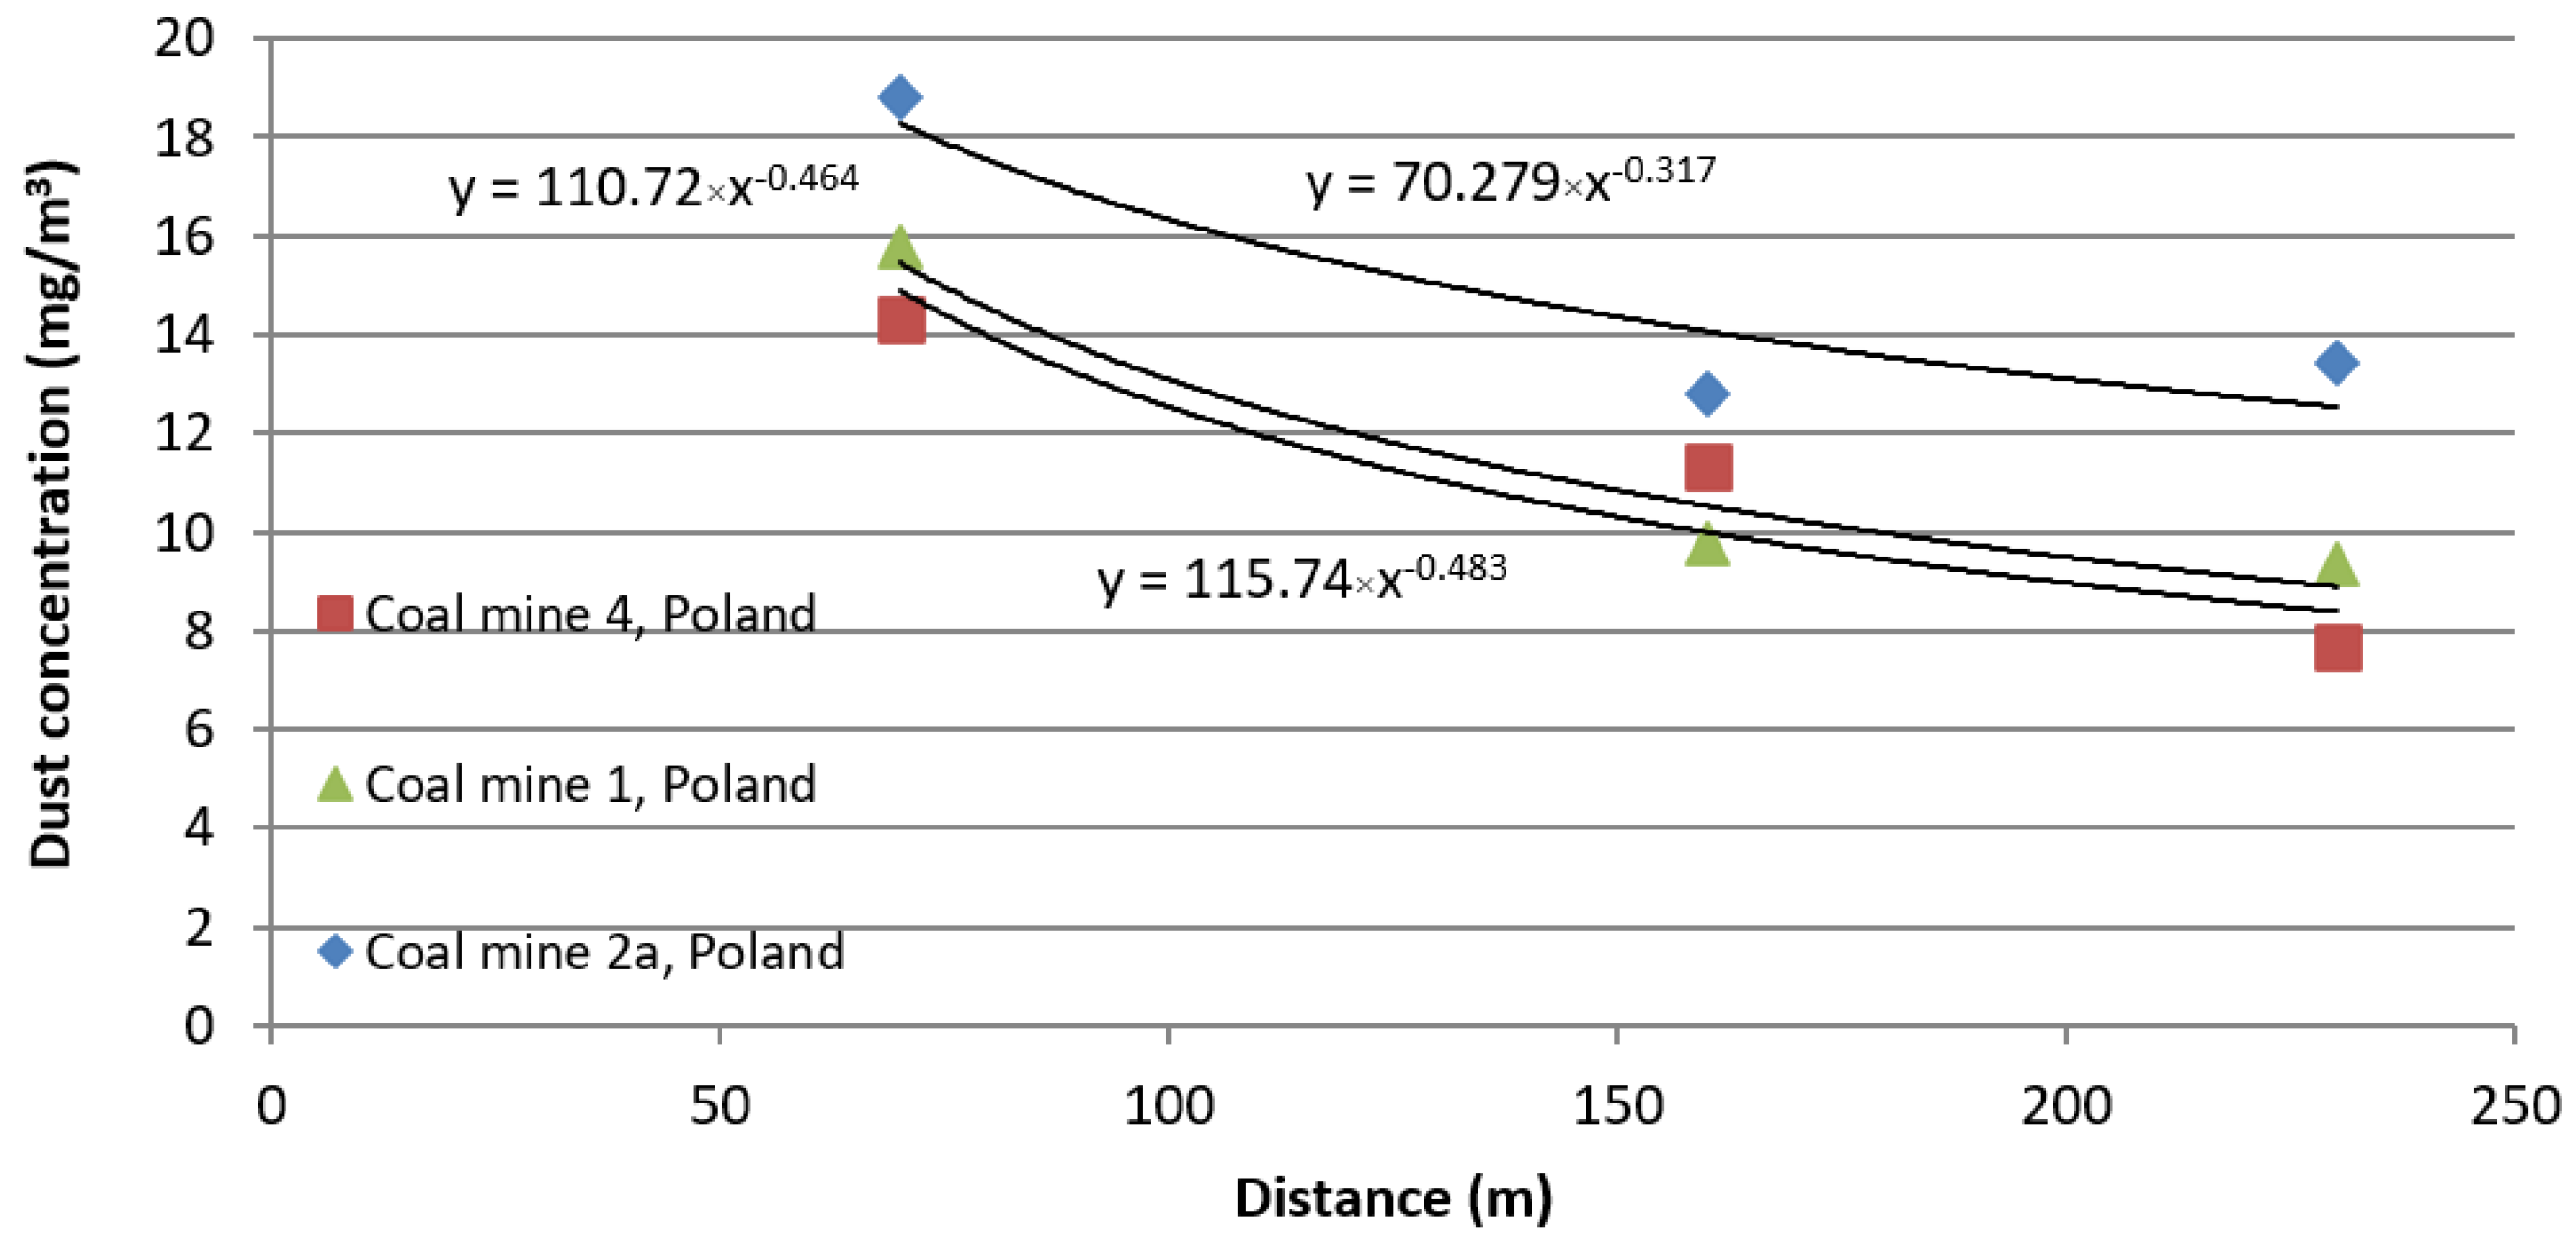
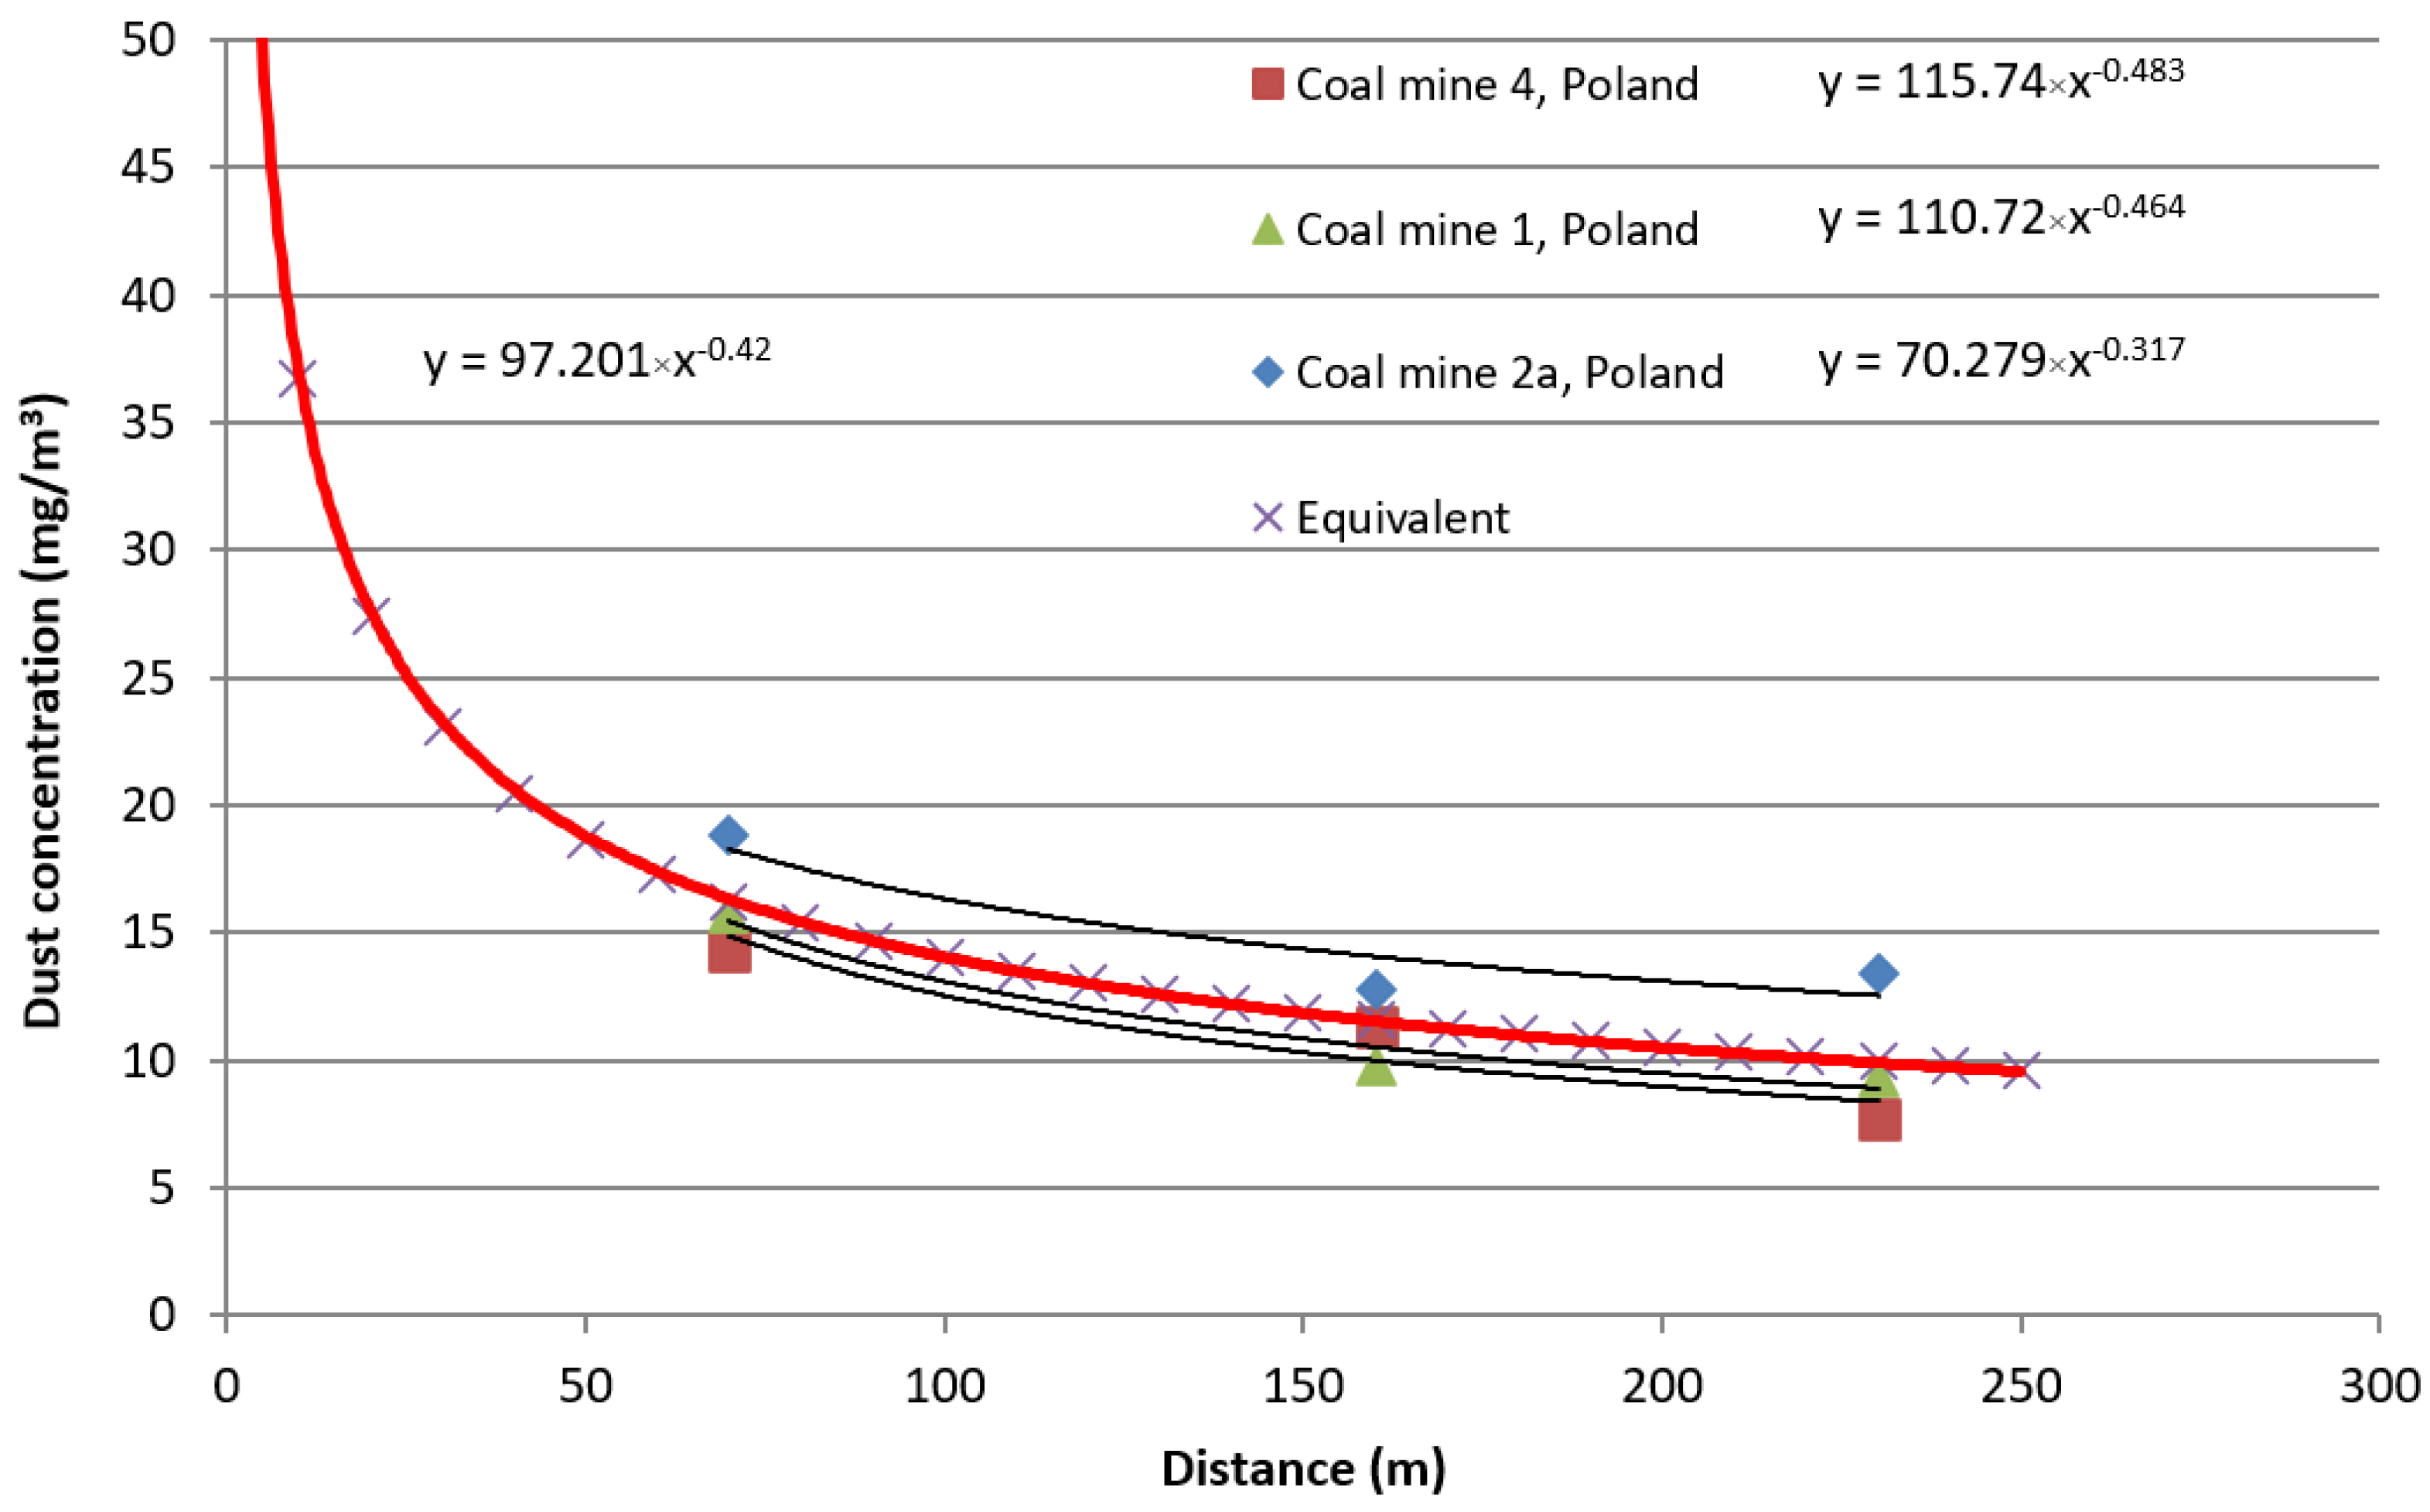
| Distance, m | PM10 Dust Concentration, Mine No 1, mg/m3 | PM10 Dust Concentration, Mine No 2, mg/m3 | PM10 Dust Concentration, Mine No 3, mg/m3 |
|---|---|---|---|
| y = 70.279 × x−0.317 | y = 115.74 × x−0.483 | y = 110.72 × x−0.464 | |
| 1 | 70.73 | 115.74 | 110.72 |
| 50 | 20.47 | 17.49 | 18.03 |
| 100 | 16.43 | 12.52 | 13.07 |
| 150 | 14.45 | 10.29 | 10.83 |
| 200 | 13.19 | 8.96 | 9.47 |
| 250 | 12.29 | 8.04 | 8.54 |
| 300 | 11.60 | 7.36 | 7.85 |
Publisher’s Note: MDPI stays neutral with regard to jurisdictional claims in published maps and institutional affiliations. |
© 2021 by the authors. Licensee MDPI, Basel, Switzerland. This article is an open access article distributed under the terms and conditions of the Creative Commons Attribution (CC BY) license (https://creativecommons.org/licenses/by/4.0/).
Share and Cite
Bałaga, D.; Kalita, M.; Dobrzaniecki, P.; Jendrysik, S.; Kaczmarczyk, K.; Kotwica, K.; Jonczy, I. Analysis and Forecasting of PM2.5, PM4, and PM10 Dust Concentrations, Based on In Situ Tests in Hard Coal Mines. Energies 2021, 14, 5527. https://0-doi-org.brum.beds.ac.uk/10.3390/en14175527
Bałaga D, Kalita M, Dobrzaniecki P, Jendrysik S, Kaczmarczyk K, Kotwica K, Jonczy I. Analysis and Forecasting of PM2.5, PM4, and PM10 Dust Concentrations, Based on In Situ Tests in Hard Coal Mines. Energies. 2021; 14(17):5527. https://0-doi-org.brum.beds.ac.uk/10.3390/en14175527
Chicago/Turabian StyleBałaga, Dominik, Marek Kalita, Piotr Dobrzaniecki, Sebastian Jendrysik, Krzysztof Kaczmarczyk, Krzysztof Kotwica, and Iwona Jonczy. 2021. "Analysis and Forecasting of PM2.5, PM4, and PM10 Dust Concentrations, Based on In Situ Tests in Hard Coal Mines" Energies 14, no. 17: 5527. https://0-doi-org.brum.beds.ac.uk/10.3390/en14175527