Article

Experimental Research on the Macroscopic and Microscopic Spray Characteristics of Diesel-PODE3-4 Blends

1
College of Mechanical Engineering, Guangxi University, Nanning 530004, China
2
Department of Engineering, Durham University, Durham DH1 3LE, UK
*
Authors to whom correspondence should be addressed.
Submission received: 30 July 2021 / Revised: 31 August 2021 / Accepted: 1 September 2021 / Published: 6 September 2021
(This article belongs to the Topic Actions for Bioenergy and Biofuels: A Sustainable Shift)

Abstract

:
Polyoxymethylene dimethyl ether (PODE) is a low-viscosity oxygenated fuel that can improve the volatility of blended fuels. In this work, the macroscopic and microscopic spray characteristics of diesel-PODE3-4 under different ambient temperatures and injection pressures (IP) are studied. The studied blends consisted of pure diesel (P0), two diesel blend fuels of 20% (P20) and 50% (P50) by volume fraction of PODE3-4. The Mie scattering and Schlieren imaging techniques are used in the experiment. The results show that with the increase in IP, the vapor phase penetration distance and the average cone angle of the three fuels increased, and the Sauter mean diameter (SMD) of the three fuels decreased. When the ambient temperature increased, the vapor phase projection area and the average vapor phase cone angle of P20 and P50 increased, and the SMD decreased, but the vapor phase projection area of pure diesel did not change significantly. The results indicate that the blended fuel with PODE3-4 has better spray characteristics than P0 at low temperature, and the SMD hierarchy between the three fuels is P0 > P20 > P50. Through the visualization experiment, it is helpful to further understand the evaporation characteristics of different fuel properties and develop appropriate alternative diesel fuel.

1. Introduction

Diesel engines are widely used in ships, generators and heavy trucks due to their high power output and high thermal efficiency [1,2,3]. However, due to the related environmental problems, the shortage of oil resources and the requirements of national laws and regulations in recent years, the internal combustion engines, which depend on traditional oil as the power source, have been severely challenged, and the quest to find a novel fuel mixed with diesel fuel is seen as a solution to these problems [4,5]. At present, the most common method is to add biomass oxygenated fuel to diesel to form a suitable blend.
Biodiesel, alcohols and ethers are the most suitable additives for compression ignition internal combustion engines [6,7]. Many countries are committed to developing biofuels. In Europe, bioeconomy has been well developed especially in Ireland, Denmark, Portugal and Austria [8]. D’Adamo et al. [9] researched a circular economy model and found that applying biomethane in the transport system of Rome leads to a reduction of emissions. Compared with diesel, biodiesel is renewable, non-toxic and has higher hexadecane value. Biodiesel contains no aromatic hydrocarbons, which is capable for reduction of unburned hydrocarbons (HC), particulate matter (PM) and carbon monoxide (CO) emissions. Thus, Colombia’s government has implemented laws about promoting biodiesel production industry [10]. Hassaan et al. [11] also suggested that the Egyptian government should pay more attention to the construction of biogas and biomethane production plants in the future. The high density and viscosity of biodiesel, which is not conducive to atomization, results in engine combustion performance decline. Meanwhile, due to the high oxygen content of biodiesel, it produces higher nitrogen oxide (NOx), especially since most engines are turbocharged [12,13,14]. Alcoholic fuels have great advantages for combustion and resources, but they have high latent heat of vaporization, low viscosity and low cetane number, resulting in poor ignition and lubricity of alcohols. Although alcohol fuel and diesel oil have good solubility, their stability is easily affected by moisture. If the engine is not changed, alcoholic fuels are difficult to apply directly in diesel engines [15,16]. Due to this reason, ether-based fuels are used more often in diesel engines. PODEn (polyoxymethylene dimethyl ethers) has the structural formula of H3CO(CH2O)nCH3 (where ‘n’ represents the degree of polymerization) and is regarded as the most promising alternative fuel for developing diesel engine fuels due to its high cetane number, high oxygen content, good solubility with diesel fuel and no need to modify the engine after blending with diesel [17,18,19]. When n < 2, it is volatile, has a low boiling point and its safety for use in transportation cannot be guaranteed. When n > 6, it is easy to precipitate after mixing with diesel oil, and therefore, n is generally between 3 and 5. Burger et al. [20] used methanol and trimeric formalin as reactants in a reacting furnace using distillation. They proposed a new process for the preparation of PODEn and investigated the physical and chemical properties, synthesis and purification of PODEn. The same authors reported that more than a million tons of PODEn could be produced using their proposed process. They also observed that PODEn has lower saturated vapor pressure, stable solubility when mixed with diesel oil and can reduce the formation of soot after combustion. In addition, many experts and scholars have studied the combustion performance and emission characteristics of diesel oil mixed with a certain proportion of PODEn. Lumpp et al. [21] produced a PODEn-diesel blend with 20% PODEn through a transient and steady-state engine cycle and used it in a heavy-duty diesel engine, which met Euro V emission standards and achieved simultaneous reduction of PM and soot emissions. They also reported that the use of a diesel oil blend with 10% PODEn in cylinder diesel engines reduces the PM emissions by 40% and has the potential to reduce carbon dioxide emissions. Pellegrini et al. [22] investigated the diesel blended PODE3-5 in single-cylinder and multi-cylinder diesel engines and found that the formation of soot emissions can be significantly suppressed when the blend is used in single-cylinder diesel engines, whereas the PM and NOx emissions can be synchronously reduced after mixing the diesel with 50% PODE3-5 in multi-cylinder diesel engines. Furthermore, they also reported that the noise of the multi-cylinder diesel engine was also optimized. Later, Pellegrini et al. [23] studied the diesel blended PODE3-5 in a Euro II diesel engine, and found that PM emissions were reduced by 18% when diesel was blended with 10% PODE3-5 and by 77% when pure PODE3-5 was burned, which are far lower than Euro IV emission standards. However, it is worth noticing that the combustion of pure PODE3-4 leads to an increase in NOx and CO emissions. Iannuzzi et al. [24] first tested the burning process of diesel blended PODEn in a constant volume device and found that, with the increase in the PODEn blending ratio, soot product was greatly reduced. When pure PODEn burnt, the smoke was almost zero. Subsequently, Iannuzzi et al. [25] investigated the emission and performance of different proportions of PODEn in diesel blends in a single-cylinder heavy-duty diesel engine, and found that, compared to pure diesel, when the PODEn’s blending ratio reached 10%, soot emissions were reduced by 34% and the thermal efficiency was guaranteed, although NOx emissions did not change much. Similar conclusions have been reported by Huang et al. [26] and Liu et al. [27]. Liu et al. [28] investigated the combustion performance and emission characteristics of diesel blended PODEn on a four-cylinder supercharged diesel engine and found that, with the increase in PODEn’s blending ratio, the ignition delay was shortened. When the proportion of PODEn blended diesel successively reached 10%, 20% and 30% at full load, compared with the pure diesel fuel, the carbon smoke decreased by 27.6%, 41.5% and 47.6%, respectively, while the HC and CO emissions decreased significantly, although the NOx emissions showed a slight increase. Song et al. [18] compared the combustion characteristics of dual fuels and found that the PODEn/natural gas blend resulted in fewer hydrocarbon, CO and soot emissions compared to the diesel/natural gas blend, and significantly improved the thermal efficiency.
These works have mainly focused on the in-cylinder combustion process of the engine. In fact, the fuel injection, atomization and mixing with air are critical to the entire combustion process, which is of great significance to energy saving and emissions reduction. Li et al. [29] researched the macroscopic and microscopic spray characteristics of diesel/PODE blended fuels and found that, with the increase in the proportion of PODE in diesel-PODE blend, the spray penetration distance decreased, though the average spray cone angle increased. In addition, both the characteristic diameters and the Sauter mean diameter decreased with the increase in the proportion of PODE in the diesel/PODE blend, though the range of relative size of droplets showed little change. However, Li et al. did not study the evaporation characteristics of PODE, whereas the test temperature was only the room temperature. Currently, the techniques of Mie scattering and diffuse back-illumination (DBI) images are widely used methods for measuring liquid spray characteristics, while schlieren image technology is suitable for studying spray evaporation characteristics [30,31,32]. Huang et al. [33] researched the spray, evaporation and combustion characteristics of ethanol/diesel blends under low temperature combustion (LTC) using DBI and schlieren image techniques. The results showed that the evaporation characteristics of the fuel blend increased the spray spreading angle and projected area, though they had little influence on the spray penetration distance, whereas the combustion phenomenon spread from the periphery behind the spray tip to the forward of the spray and then to the nozzle. Ma et al. [34] investigated the evaporation and spray characteristics of n-pentanol/diesel blends using DBI and schlieren image techniques, and found that pure diesel has a longer spray penetration distance and a smaller spray cone angle than n-pentanol in the absence of evaporation. When the ambient temperature exceeds 800 K under evaporation conditions, the spray penetration distance of pure diesel is reduced, although the spray penetration distance of n-pentanol increases and this trend is particularly remarkable for higher proportions of n-pentanol in diesel. Payri et al. [35] used Mie scattering and schlieren images techniques to study the effects of cylindrical and conical nozzles on the liquid and vapor phase spray characteristics of n-heptane, n-hexane and diesel alternative fuels (composed of n-tetradecane, n-decane and methylnaphthalene), and found that, for the same fuel under the same working conditions, the cylindrical nozzle has a smaller vapor phase penetration distance and liquid phase length than the conical nozzle. However, the spray spreading angle shows the opposite trend. Subsequently, Payri et al. [32] compared the experimental and calculated values of the vapor and liquid phase spray penetration distances of pure diesel oil at different IPs, ambient density and ambient temperature, and found that the experimental and calculated values can be in good agreement. Therefore, it is concluded that the IP affects the vapor phase length and the ambient temperature affects the liquid phase length.
However, the research on the spray (liquid penetration distance, liquid phase cone angle and liquid phase projection area) and evaporation characteristics (vapor phase cone angle, vapor phase penetration distance and vapor phase projection area) of a diesel/PODEn blend (chain length of PODEn is: n = 3–4) is still lacking, especially regarding the droplet size distribution characteristics of blended fuel. Many studies [20,36] have shown that the mixing of diesel and PODE3-4 is the most suitable for application in diesel engines. Therefore, in this work, the effect of different ambient temperatures and IPs on the macroscopic and microscopic spray characteristics of diesel/PODE3-4 blend is analyzed. From the results, the evaporation characteristics of different fuel properties and appropriate alternative diesel fuels can be further understood.

2. Experimental

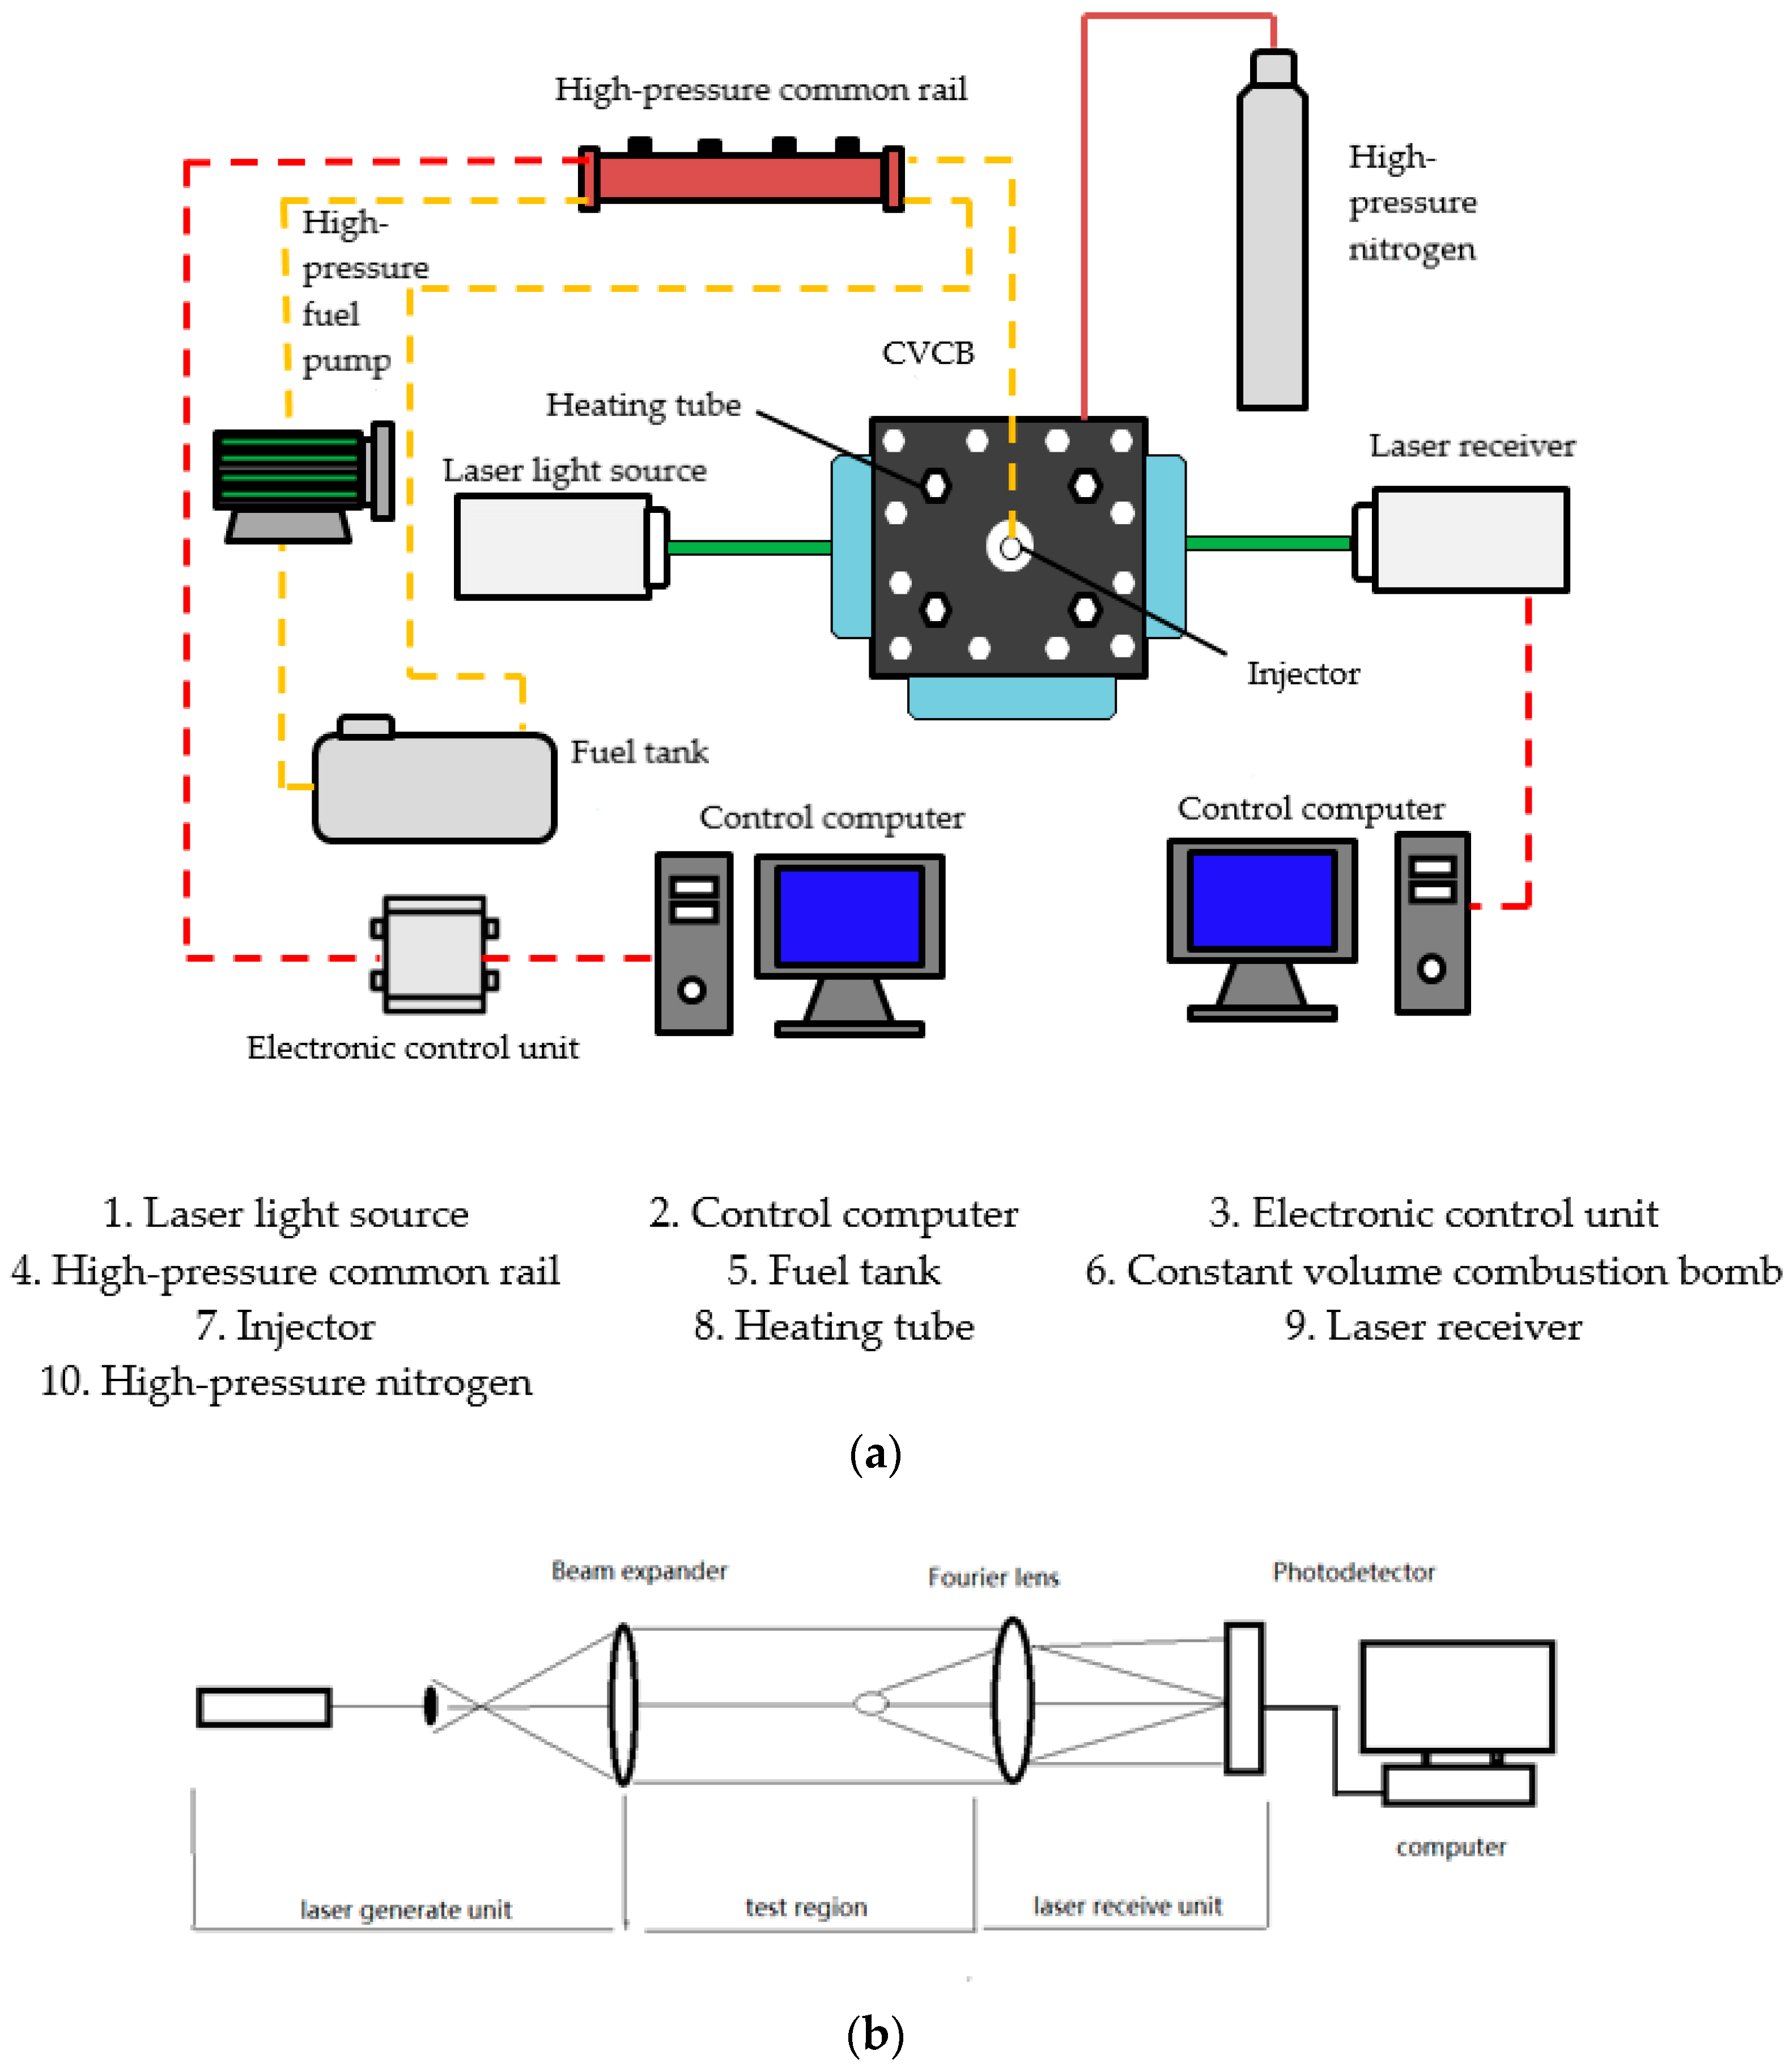
2.1. Experimental Setup

Figure 1 shows the schematic of the experimental setup, which mainly consists of a constant volume combustion bomb (CVCB), fuel supply system and image acquisition system. The specific parameters of CVCB are described in detail in a previous work [37]. In order to ensure the optical path and camera shooting, three quartz windows with the diameter of 110 mm were located on the side of the CVCB. A single hole electromagnetic valve injector was used for the experiments, and the fuel supply system was procured from Bosch’s third-generation high-pressure common rail test rig. Each set of experiments was repeated three times and the average of the three test data was taken. The uncertainties of the apparatus are shown in Table 1.
The images were taken using a FASTCAM-SA7 high-speed camera, which was manufactured by PhotronCorp, Tokyo, Japan. During the experiments, the external computer issued an injection command, and then the electronic control unit (ECU) in a high-pressure common rail system drove the injector and high-speed camera to work synchronously according to the detected fuel injection signal. The schlieren device adopted a Z-shaped arrangement, which is mainly composed of a light source slit system and a knife-edge camera system.
Figure 2 shows the schematic of the Mie scattering device, which is mainly used to measure the liquid spray characteristics. During the experiments, two tungsten halogen lamps were placed in each of the two quartz windows. During operation, the tungsten halogen lamp emitted a light to illuminate the spray. Then, the scattered light, reflected by the spray, was received by the high-speed camera. Finally, the liquid phase spray boundary image was displayed on the computer screen. A micro-nano particle size analyzer (Winner 318A) was used to measure the microscopic characteristics of the spray and the micro experimental test structure diagram as shown in Figure 3a. The working principle of Winner 318A is shown in Figure 3b, which obtains particles’ size by using a laser beam to test the intensity of scattering spectrum of particles.

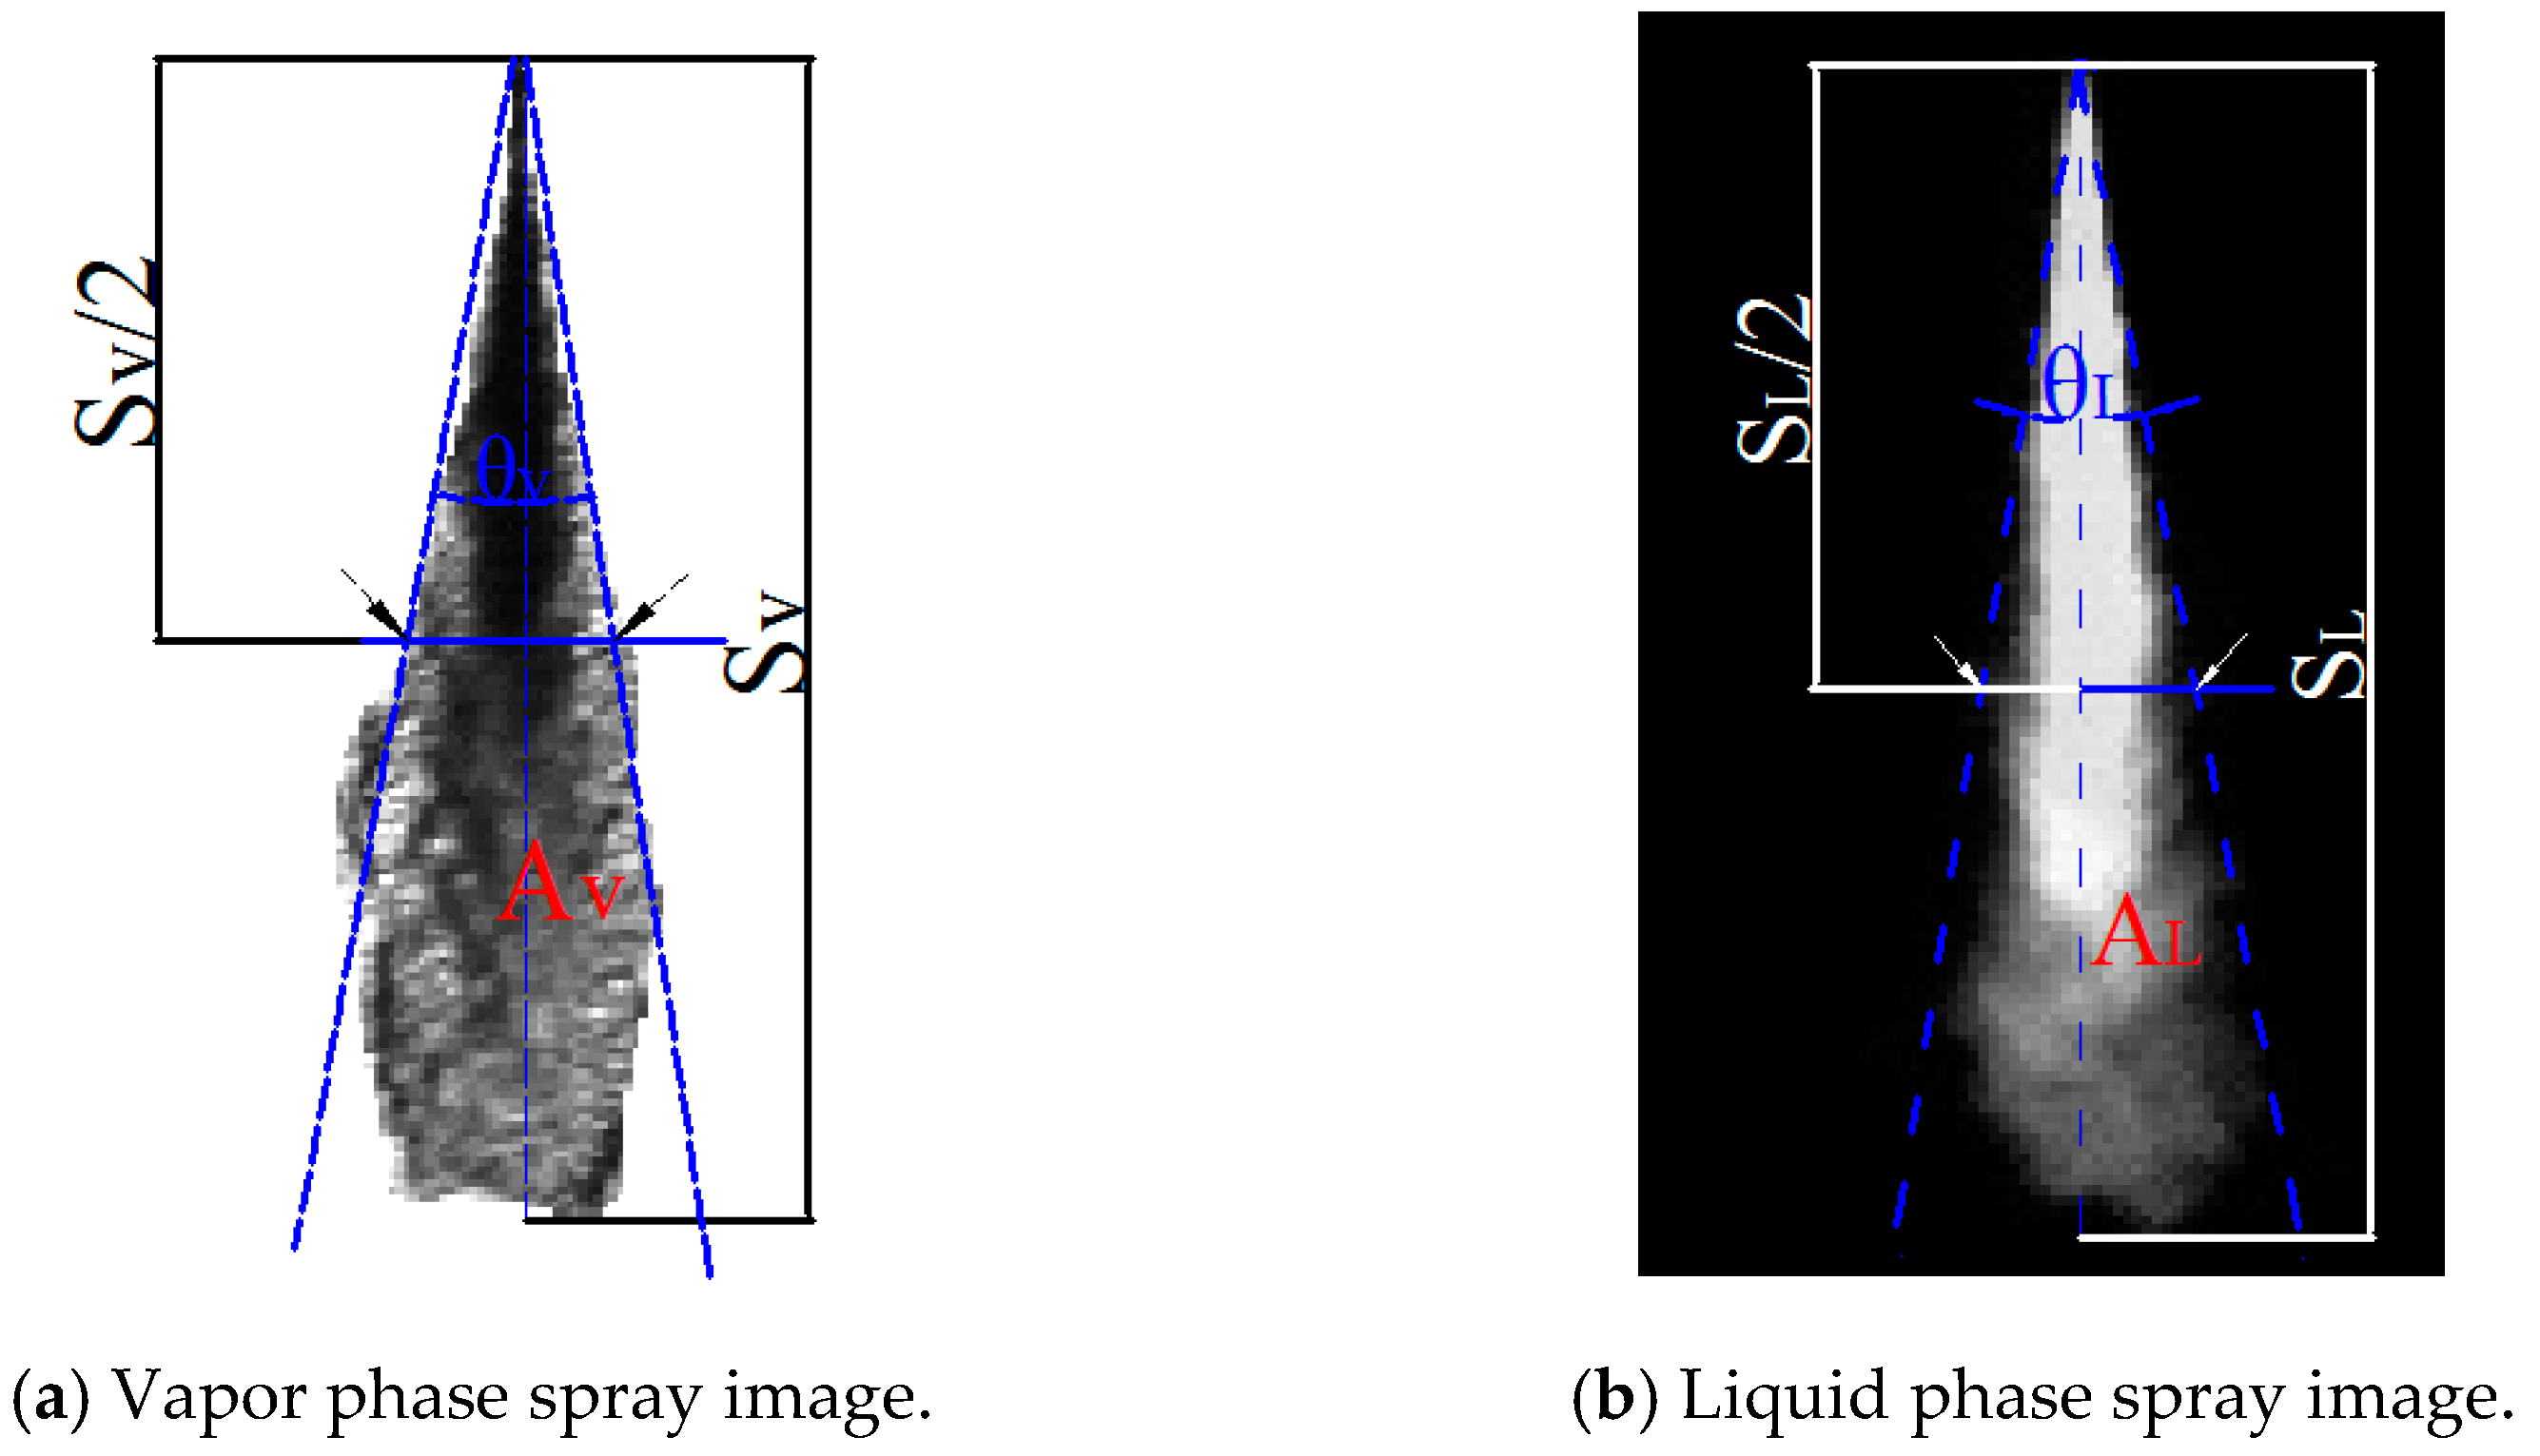
2.2. Image Processing

The Mie scattering method can capture the liquid phase spray boundary image, while the schlieren method can capture the spray boundary image of the vapor phase. Both the methods use MATLAB’s self-programming process for image processing. The steps of processing the image are similar for both methods. Firstly, the background image and the spray image are subtracted by using the MATLAB program to achieve the removal of background. Then, the edge pixels of the spray are detected using two thresholds of the Sobel and the cany operator, and the boundary curve of the spray is determined to obtain the liquid phase spray characteristic parameters. The Sobel operator and cany operator are used to edge the spray image detection, obtaining the coordinate values for the edge point of the image. Finally, the spray characteristic parameters of the liquid or vapor phase are obtained. Figure 4 shows the processed images from Mie scattering and schlieren methods.

2.3. Experimental Procedure

The experimental conditions are presented in Table 2. The fuel sample is based on No. 0 diesel fuel sold in China’s petroleum market. The blended PODEn is obtained from Qingdao Tong Chuan Petrochemical Engineering Company, Qingdao, China, and is mainly composed of PODE2, PODE3 and PODE4 with the mass fractions of 2.6%, 88.9% and 8.5%, respectively. Since the main components are PODE3 and PODE4, this article uses PODE3-4 to represent PODEn. There were three different volume ratios of diesel/PODE3-4 blends used in the experiments, 0%, 20% and 50% with respect to PODE3-4, and were abbreviated as P0, P20 and P50, respectively. The relevant physical and chemical properties of the blends are presented in Table 3 and Table 4.

3. Results and Analysis

3.1. Definition of Spray Parameters

The evaporation characteristics of the spray influence the droplet size, whereas the size of the vapor penetration distance determines the rate of fuel impingement on the combustion chamber. The definition of the projected area is the calculated area inside the spray boundary. The projected area of vapor and liquid phase reflects the range of fuel spray diffusion, which is the combined effect of cone angle and penetration distance, while its size can reflect the quality of mixing of fuel and the surrounding environment gas [43]. The Mie scattering method is used to obtain the liquid phase spray boundary image, while the schlieren method is used to obtain the spray boundary image of the vapor phase. Therefore, it is necessary to define and distinguish the spray image parameters obtained by the two shooting methods. Figure 5 illustrates the way the spray characteristic parameters are defined in this work. The subscripts L and V represent the liquid phase and vapor phase spray characteristic parameters, respectively. The penetration distance for each phase is defined as the axial distance, which the fuel can reach farthest from the nozzle to the spray front, and is denoted by SV and SL for vapor and liquid phase, respectively. The spray cone angle for each phase is defined based on the method of Naber et al. [44], and is defined as the angle between the line from fuel injection from the nozzle to the half of the spray penetration distance and the tangent line along the spray contour. In Figure 5, the spray cone angle is represented by θV and θL for vapor and liquid phase, respectively. The sum of the values of the pixel area included in the entire spray image is the spray projection area, whereas the vapor and liquid phase projected areas are represented by AV and AL, respectively.

3.2. Effect of Ambient Temperature on Fuel Spray Characteristics

Figure 6 shows the evolution of vapor and liquid spray patterns for different fuel blends over time at different ambient temperatures (573 K, 623 K and 673 K) and the IP of 160 MPa. It can be known from Figure 6a,c,e that the vapor phase spray for each fuel blend at different ambient temperatures gradually increases with time. Meanwhile, the spray gradually changes from “dark black” (liquid phase) to “transparent color” (vapor phase) with the increase in temperature. This trend is particularly pronounced as the proportion of PODE3-4 in the blend increases. It can be seen from Figure 6b,d,f that the liquid phase spray of the three fuels gradually increases with time at 573 K. However, when the ambient temperature is 623 K, and both the P0 and P20 are in the middle and late spray (after 0.7 ms), the front end of the liquid phase spray gradually becomes blurred, producing a “mist”, which is composed of a lot of small droplets. On the other hand, the sample P50 shows a rapid reduction of spray at the same temperature (623 K). As the ambient temperature increases to 673 K, the mist area of the three blends decreases. This is because the rate of evaporation of droplets becomes faster due to an increase in the ambient temperature, which results in rapid evaporation of small droplets formed at the edge of the liquid core and the front end of spray during the spraying process.
Figure 7 shows the vapor and liquid phase penetration distances for the three blends at different ambient temperatures. It can be clearly seen from the picture that the vapor phase penetration distances of P0, P20 and P50 increase with time. However, when the ambient temperature is 673 K, the vapor phase penetration distance of the three fuels is significantly lower than those for 573 K and 623 K. The reason is that, at lower temperatures, the spray mainly develops in liquid form, while at a high temperature, the fuel evaporates in a large amount, causing the spray mainly to develop in vapor form. Furthermore, the vapor spray develops at a lower rate than that in liquid phase. Therefore, when the ambient temperature is 673 K, the vapor phase penetration distances of the three blends are smaller than the vapor phase penetration distances at low temperatures. For the liquid phase penetration distance, the fuel did not undergo significant evaporation at the temperatures of 573 K and 623 K. When the temperature was increased to 673 K, the liquid phase penetration distance for P0 was substantially similar to the vapor phase penetration distance during the initial stage of the spray. However, the passage of time gradually separated both the values. The liquid penetration distance for each of P20 and P50 is expressed as the situation, in which the initial value of the spray quickly reaches a certain value and keeps fluctuating around this value. Therefore, it is indicated that diesel will slowly evaporate after the background temperature reaches a certain value until a certain period of time. However, when the diesel blend contains a large proportion of PODE3-4, the liquid phase and vapor phase spray are separated at the initial moment of the spray. The liquid phase penetration distance reaches the maximum value and becomes stable. Meanwhile, the amount of evaporation and the amount of fuel injection achieve certain equilibrium. In addition, compared with the ambient temperature of 573 K and 623 K, when the ambient temperature is 673 K, the vapor and liquid phase penetration distances of the three fuels are all lower. This is consistent with the results reported by Gimeno et al. [30], who stated that “the ambient temperature rises, and the fuel vapor and liquid phase penetration distances decrease”.
Figure 8 shows the vapor and liquid cone angles of the three fuels at different ambient temperatures. It can be known that the vapor phase cone angles of P0, P20 and P50 increase with the increase in ambient temperature. However, the change in vapor phase cone angle does not agree with the increase in vapor phase conge angle of P0 before 0.6 ms, whereas the temperature increases gradually after 0.6 ms. The reason is that the viscosity of the diesel oil is high, which initially causes the droplets to stick together after the fuel is sprayed from the nozzle. Due to this, it is not easy for the droplets to diffuse in the radial direction. As time and temperature increase, the spray sharply evaporates, and the situation improves. In addition, when the temperature is 673 K, compared with the pure diesel, the average vapor cone angles of P20 and P50 increased by 1.9°and 3.3°, respectively, and the average liquid cone angle reduced by 1° and 2.2°, respectively, indicating that the addition of PODE3-4 to diesel in a certain proportion can improve the evaporation and diffusion of the spray. It can also be seen that the liquid phase cone angles of P0, P20 and P50 decrease with the ambient temperature increase. The reason is that the ambient temperature increases, causing the heat exchange between the liquid phase fuel in the spray front and the edge region and the high-temperature ambient gas to increase. Therefore, the rate of evaporation of liquid fuel greatly increases, resulting in the decrease in liquid phase spray cone angle.
Figure 9 shows the vapor and liquid phase projected areas of the three tested fuels at different ambient temperatures. It can be seen that the vapor and liquid phase projection areas of P0 are not much different for the ambient temperatures of 573 K and 623 K and before 0.9 ms. However, the vapor phase projection area of P0 after 0.5 ms at ambient temperature of 673 K is larger than the other two temperatures. The results for P20 and P50 show that the higher the temperature, the larger the vapor phase projection area and smaller the liquid phase projection area. It shows that the increase in pure diesel in the low temperature range (within 623 K) has little influence on the evaporation characteristics and spray diffusion, while the fuel blend with PODE3-4 still has good diffusion capability and evaporability at low temperatures. For the liquid fuel projected area of the mixed fuel, with the ambient temperature, the projected area decreases. When the temperature is 673 K, the liquid projection area of the three blends tends to flatten with time. The reason is that the higher the ambient temperature, the more evaporation on both sides of the liquid fuel spray and the faster the evaporation rate, which results in a smaller projected area. When the evaporation speed of the droplets is equal to the diffusion speed, the liquid projected area reaches a stable state.

3.3. Effect of Injection Pressure on Spray Characteristics

Figure 10 shows the development of vapor and liquid spray patterns at different temperatures for different IPs (80, 120 and 160 MPa) at the ambient temperature of 673 K. It can be seen that the vapor phase and the liquid phase spray lengths for P0, P20 and P50 increase with the IP increase. For the vapor phase oil bundle, the vapor phase spray profile grows evenly larger under high IPs. Before 0.3 ms, the vapor phase fuel spray regions of the three fuels are dark black, whereas the vapor phase and liquid phase spray regions substantially coincide. However, the liquid phase of the fuel is relatively large. After 0.3 ms, the vapor phase oil jets of the three blends showed obvious vapor and liquid phase separation with time. This situation is particularly remarkable under the condition of high IP and high mixing ratio of PODE3-4. For liquid phase spray, the liquid phase spray length of pure diesel oil under the same IP is significantly larger than the liquid phase spray lengths of P20 and P50. In addition, at a higher IP, the front end of the liquid fuel spray of the three fuels produces a “mist”, which is composed of broken atomized droplets, indicating that increasing the IP promotes the atomization of the fuel.
Figure 11 shows the penetration distance for P0, P20 and P50 over time for different IPs. It can be seen that the vapor and liquid phase penetration distances of the three fuels increase with the increase in IP. This is because when the IP increases, the pressure difference between the inside and outside of the nozzle increases, and the initial kinetic energy of the oil droplets becomes higher [45]. This increased kinetic energy makes the spray penetrate to a longer distance. In addition, the liquid phase penetration distances of P0 and P20 change significantly with the increase in IP. However, the liquid phase penetration distance of P50 does not show much change with the increase in injection pressure. This is because the P50 blend has a lower viscosity relative to P0 and P20, and the lower viscosity will make the fuel break into small droplets more easily after being sprayed from the nozzle [46]. Additionally, at high temperatures, small droplets at the liquid spray front are rapidly evaporated, which cause the liquid penetration distance of P50 to change little with the increase in IP. This process is beneficial to reduce the proportion of liquid phase fuel in the flame region after ignition and improve the combustion efficiency in the cylinder.
Figure 12 shows the vapor and liquid cone angles for P0, P20 and P50 under different IPs. The results show that it is not intuitive to see the regularity of the vapor and liquid phase cone angles of the three fuels as a function of IP. Therefore, the average values of the vapor and liquid phase cone angles are shown in Figure 13. It can be seen that the average vapor phase cone angles of the three fuels increase with the increase in IP. When the IP is increased from 80 MPa to 160 MPa, the average vapor phase cone angles for P0, P20 and P50 increase by 1.7°, 1.8° and 2.5°, respectively. This is because when the IP is increased, the kinetic energy of the fuel from the nozzle outlet increases, which in turn leads to enhanced mixing of the spray with the surrounding gas [47], thus resulting in an increase in the vapor cone angle. In addition, regardless of the IP, the average vapor phase cone angles for the three samples are found in the following ascending order: P0 < P20 < P50. This is because as the proportion of PODE3-4 in the blend increases, the viscosity of the mixed fuel decreases compared to pure diesel. This leads to an increase in the resistance of spray to ambient gas [30], causing the average vapor cone angle to increase. These results are consistent with those reported by Valentino et al. [48], who concluded that “reducing the viscosity of the fuel will increase the spray cone angle”. Interestingly, the average liquid phase cone angle decreases as the proportion of PODE3-4 in the blend increases. This is because the viscosity of the mixed fuel is lowered, which causes the fuel to break more easily and hence, atomize after being ejected from the nozzle. Therefore, it becomes easier to evaporate under high temperature conditions, and results in a decrease in average liquid phase cone angle. It can also be seen from Figure 13b that the average liquid phase cone angle of the three fuels does not differ much under different IPs. This because although increasing the IP will cause the spray to spread to both sides, at the same time, the higher IP will cause the fuel to break more severely. Due to this reason, the spray evaporation speed will increase, and therefore, the change in average liquid cone angle will not be obvious.
Figure 14 shows the vapor and liquid phase projection areas of P0, P20 and P50 under different IPs. It can be seen that the vapor phase projected areas of P0, P20 and P50 increase with the IP increase, indicating that increasing the IP will increase the propagation speed of the spray. This will also improve the spread of spray to surrounding [49], thereby improving the utilization of air in the cylinder. It can be seen from the liquid projection area that the liquid projection area increases slightly with the increase in injection pressure. This is because with higher injection pressure, the axial velocity and radial momentum of the fuel are greater after it is ejected from the nozzle. Due to this, the range of oil beam space diffusion becomes wider. However, higher IP will aggravate the degree of breakage of droplets, which leads to the speed of partial evaporation of oil beam outline, due to which the overall liquid projection area does not increase much. In addition, it can be seen that the liquid phase projected area curve of P0 is substantially coincidental with the vapor phase projected area before 0.5 ms and for the IPs of 80 MPa and 120 MPa. However, for P20 and P50, these timings are 0.3 ms and before 0.2 ms, respectively, and after these time intervals, curves for both the samples gradually start to separate from each other. It shows that, compared with the pure diesel, the mixed fuel can produce diffusion and evaporation earlier, which is very important for the fuel and gas mixing in the cylinder when the engine is actually working.

3.4. Microscopic Spray Characteristics

To further understand the atomization characteristics of blended fuel, in this section, the microscopic spray characteristics of blended fuels at different temperatures (303 K, 363 K) and injection pressures are studied.
Figure 15 shows the influence of different temperature and IPs on the SMD of test fuels’ droplets. As can been seen from the figure, with the IP and temperature increases, the SMD of the test fuels’ droplets are reduced. This is due to the increase in IP, which increases the degree of oil bundle breakage and tends to produce more small droplets; the higher of temperature, the more volatile the fuel is, and more tiny droplets can be added, so the SMD of the test fuel is reduced. It can also be seen from the figure that as the proportion of PODE3-4 added increases, the fuel’s SMD decreases. This is because of the low viscosity of PODE3-4 (see Table 4), as the proportion of PODE3-4 increases, the viscosity of blended fuel decreases, which is conducive to the improvement of volatility and the SMD reduced.
Figure 16 shows the effects of different temperature and IPs on the droplet size distribution. It can be seen from the figure, when the IP is 80 MPa, the P20 and P50 particle size curves shift to the left with the temperature rises, while P0 shifts to the right. This is because as the temperature rises, the volatility of the blended fuel increases, and a large number of small diameter droplets are generated. As the viscosity of P0 is relatively high, the oil bundle is easy to be broken and form large diameter droplets, while the kinetic energy of the larger droplets is relatively small and easy to be absorbed and merged into larger droplets, so more large diameter droplets are generated. With the IP increases, the droplets’ size distribution curve of the fuel shifts to the left at 303 K. This is due to the higher IP, which improves the atomization and generates more small droplets, especially P20 and P50, which are highly volatile, generating more droplets of small size than P0. When the IPs is 160 MPa, with the temperature rises and the P0 curve shifts to the left, while the P20 and P50 curves shift to the right and with a bimodal distribution. This is because under high temperature and high IP, P0 can have a higher degree of atomization and smaller droplet size, but for P20 and P50, under high IP, it is easier to generate more smaller droplets (as shown in Figure 16d). However, as the temperature rises, the movement speed of the droplets increases and the probability of mutual adsorption between droplets increases, so the probability of large-size droplets appearing increases.

4. Conclusions

In the CVCB premixed combustion device, the macroscopic and microscopic spray characteristics of the three different diesel and PODE blends (P0, P20 and P50) were studied under different temperatures and IPs. Based on the results, the following conclusions are drawn.
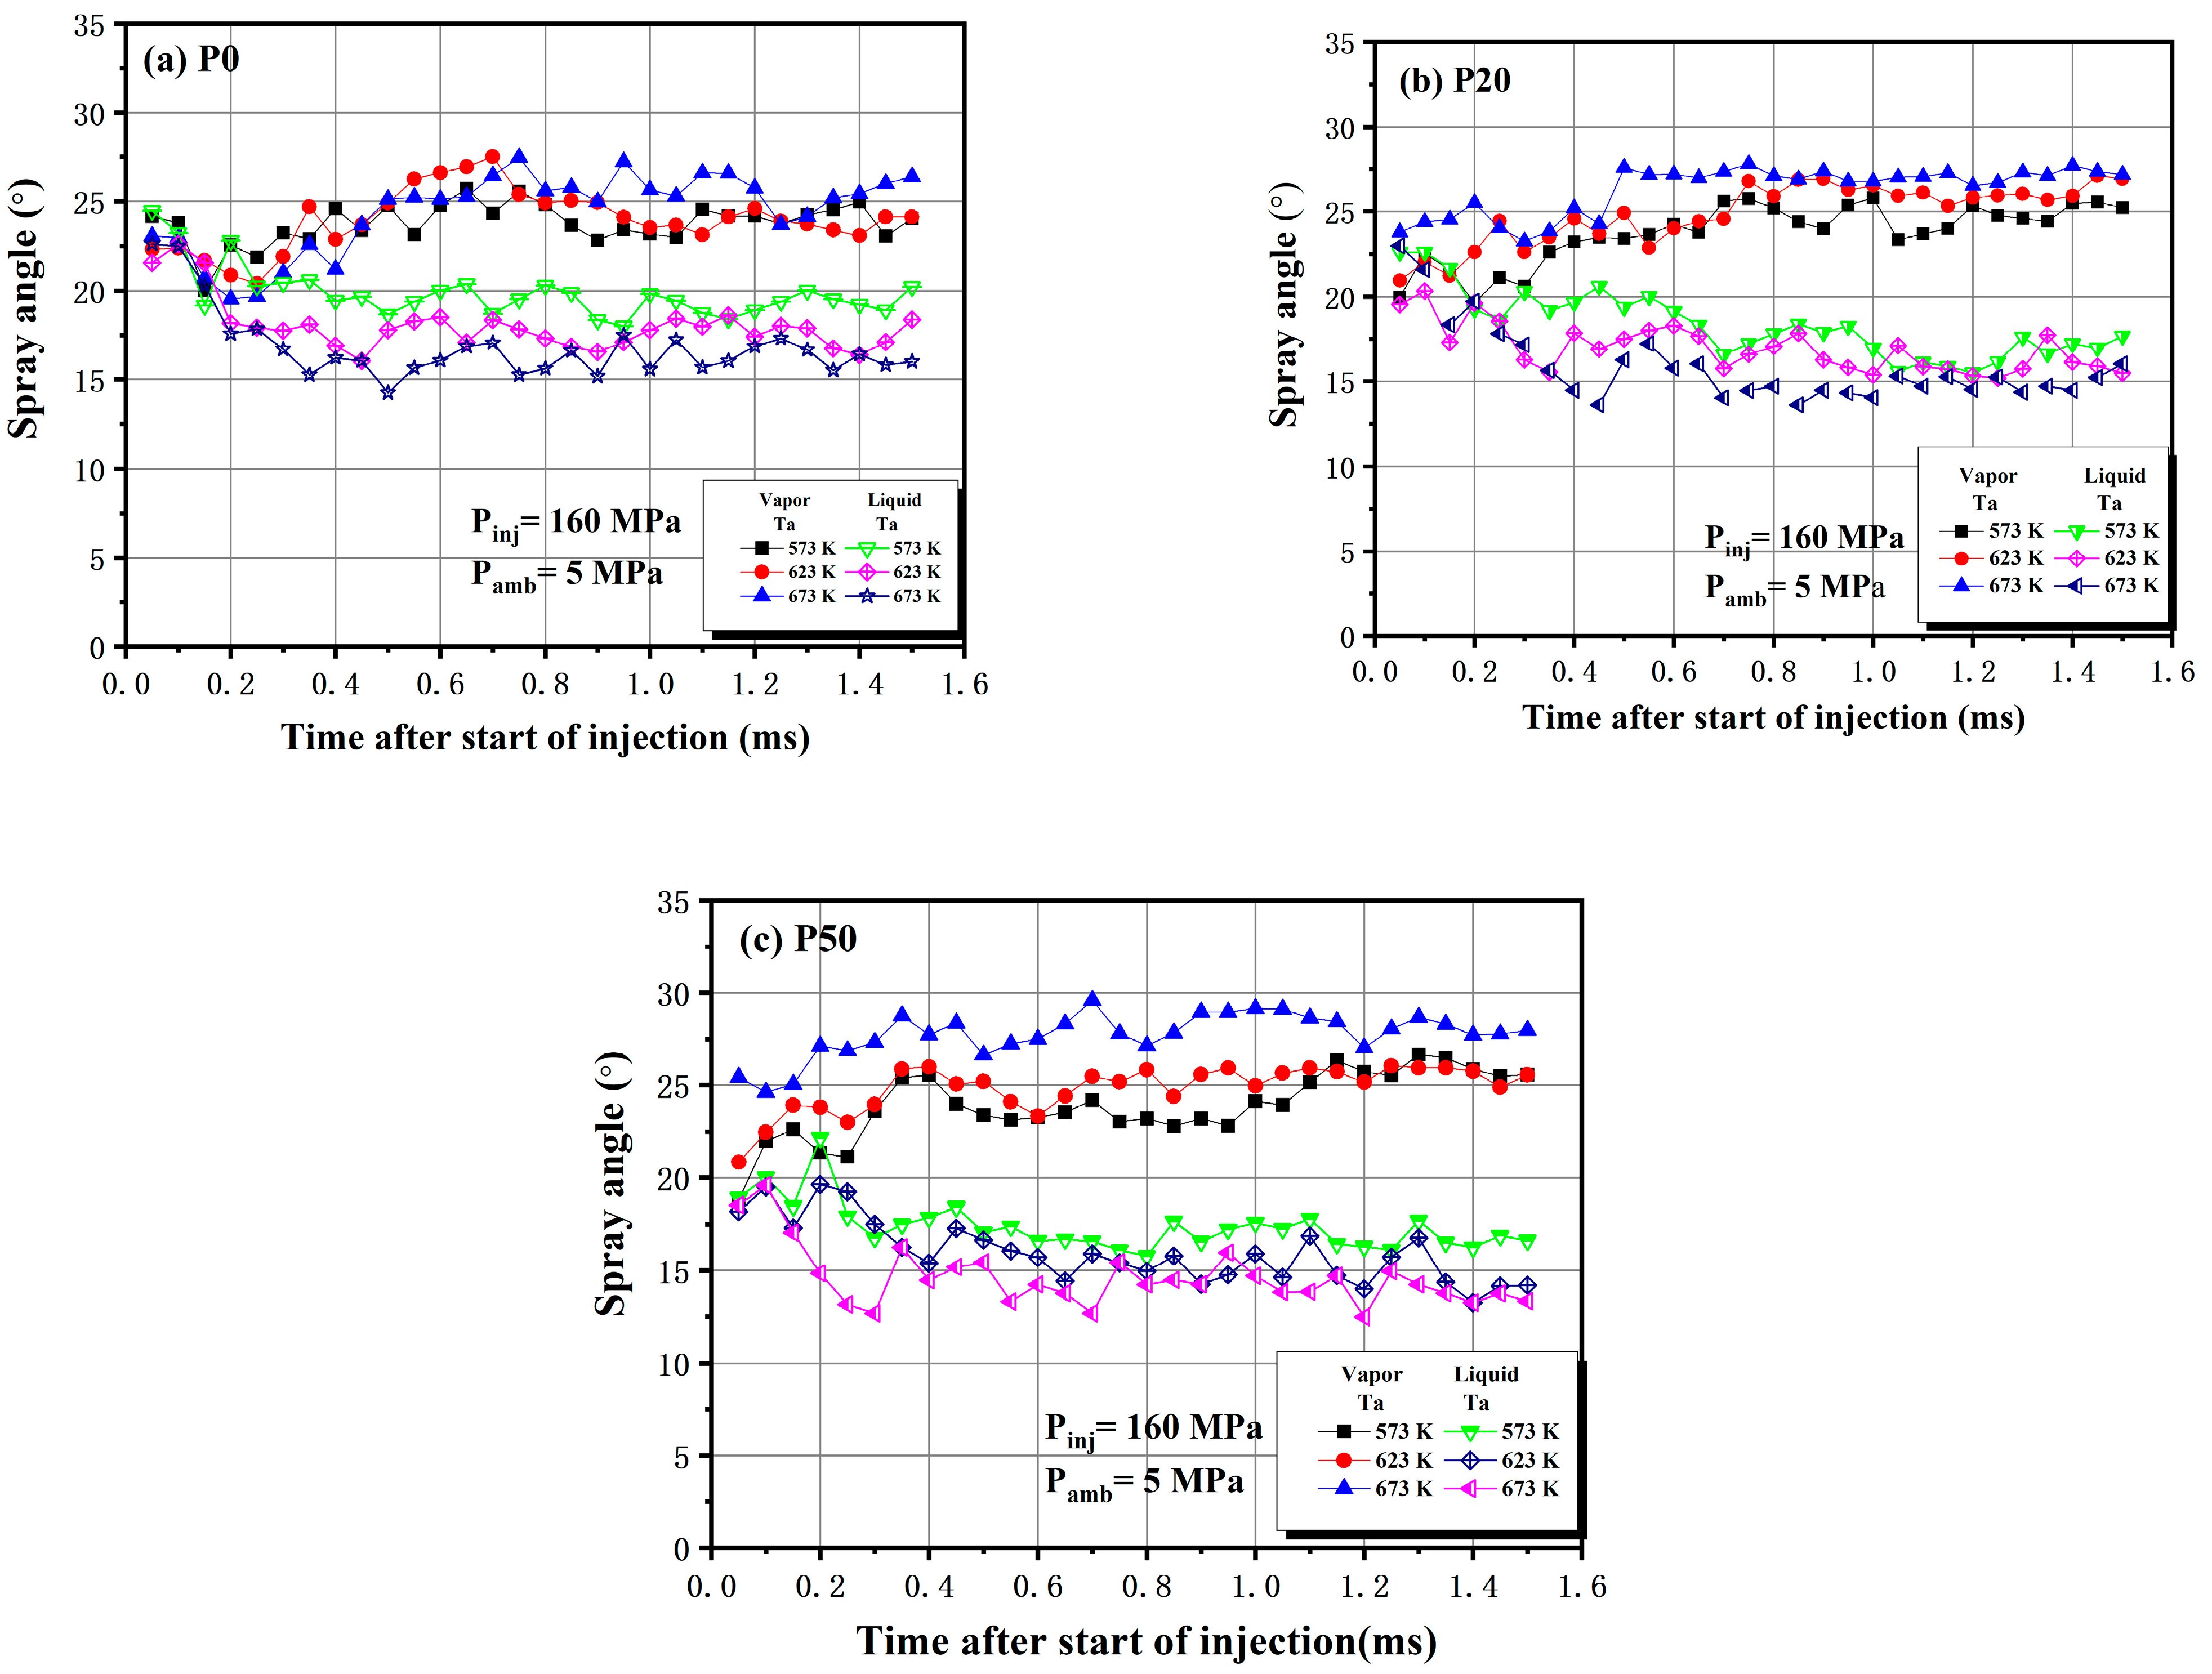
  • When the ambient temperature increases, the liquid cone angles decrease and the vapor cone angles increase for test fuels. When the ambient temperature is 673 K, P0 has the smallest average vapor phase cone angles, but the average liquid cone angle is largest.
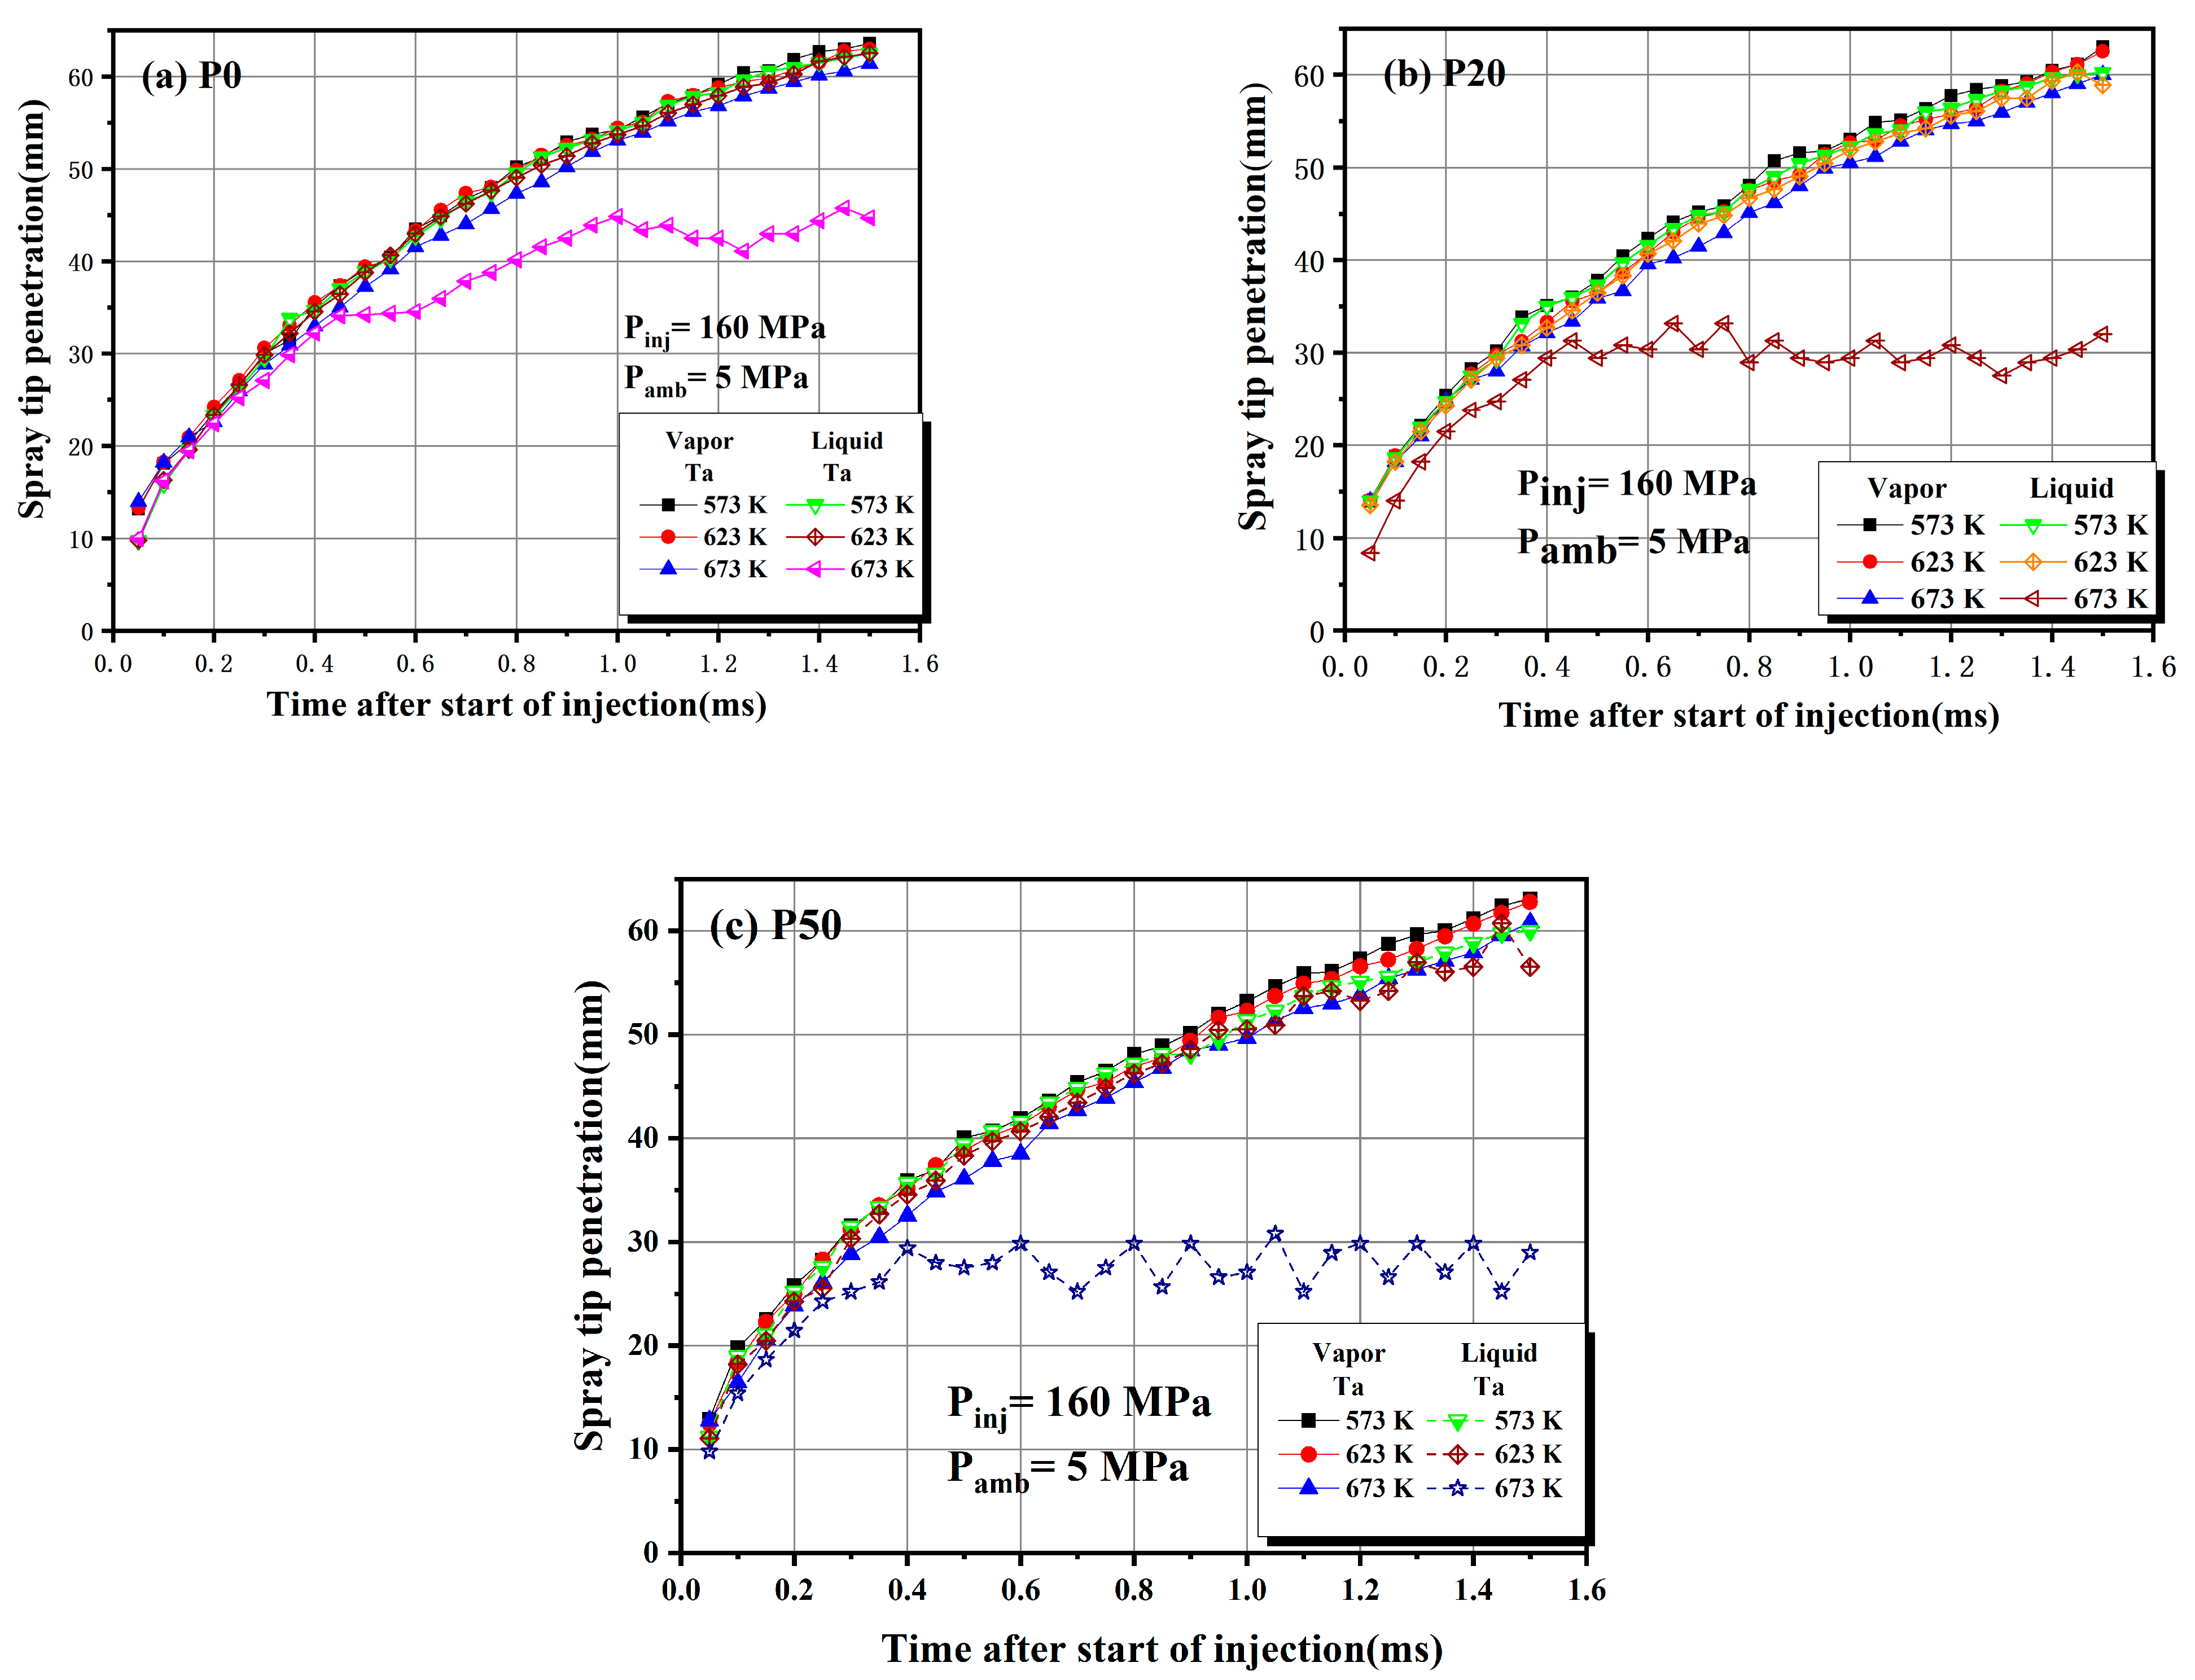
  • For the ambient temperatures of 573 K and 623 K, the P0, P20 and P50 vapor and liquid phase penetrations do not change much. When the temperature increases to 673 K, the vapor and liquid phase penetration distances of the three fuels decrease, while the liquid phase penetration distance decreases the most.
  • The vapor phase projection areas of P20 and P50 show that the higher the ambient temperature, the larger the projected area, whereas the liquid phase projected area shows the opposite trend. The vapor and liquid phase projections of P0 at ambient temperatures of 573 K and 623 K do not change much, and the situation improved when the temperature increased to 673 K.
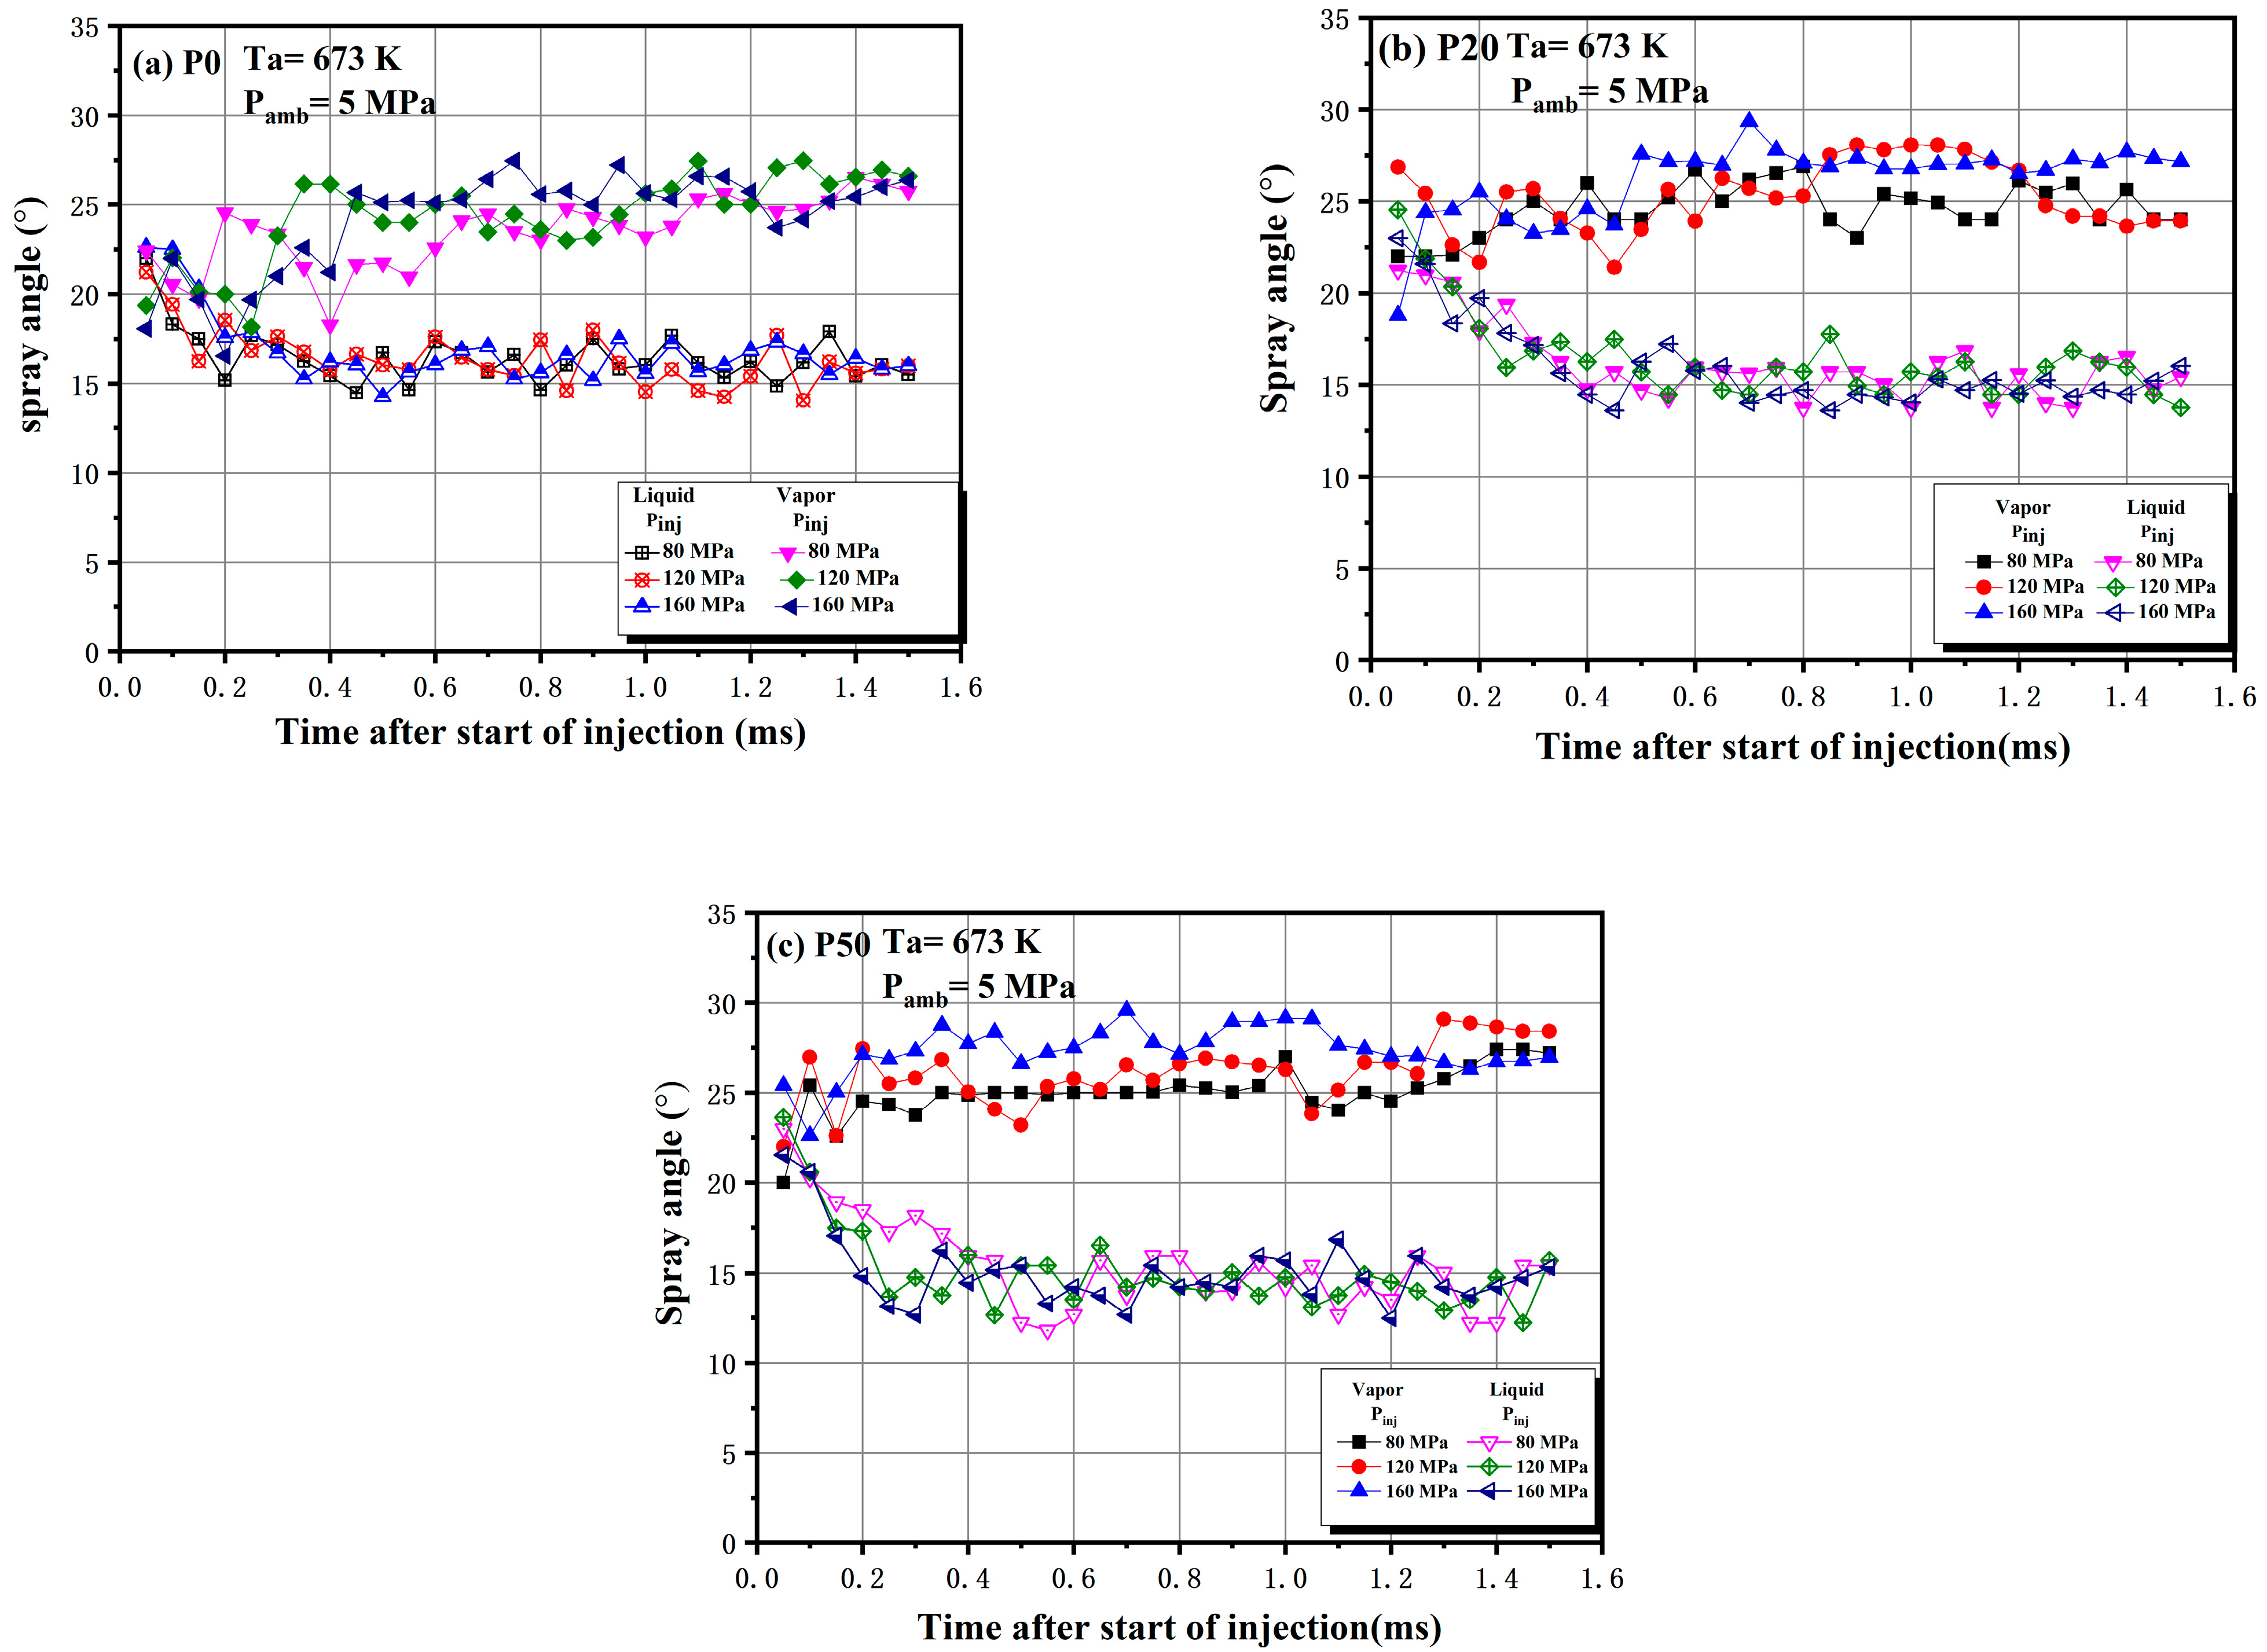
  • With the IP increase, the vapor phase penetration distance and the vapor phase cone angles of P0, P20 and P50 increase. Meanwhile, the average liquid phase cone angles of the three fuels will decrease. The liquid phase penetration distances increase in P0 and P20 with the IP increase, although the change in the liquid phase penetration distance of P50 is not obvious.
  • As the IP increases, the vapor and liquid phase projection areas of the test fuels increase. Compared with the P0, the vapor and liquid phase projection area curves of the blends can be distinguished at an early stage, indicating that the blended fuel can undergo earlier diffusion and evaporation, which are critical to the mixing of oil and gas in the cylinder during actual engine operation.
  • For the vapor phase, both the smallest cone angle and penetration distance is at 673 K and 80 MPa, while the largest projected area is at 673 K and 160 MPa of P50. For the liquid phase, it has the largest cone angle at 673 K and 160 MPa, and smallest penetration at 673 K and 80 MPa. At 573 K, 160 MPa, the liquid phase projected area of P0 is the largest of all tested points.
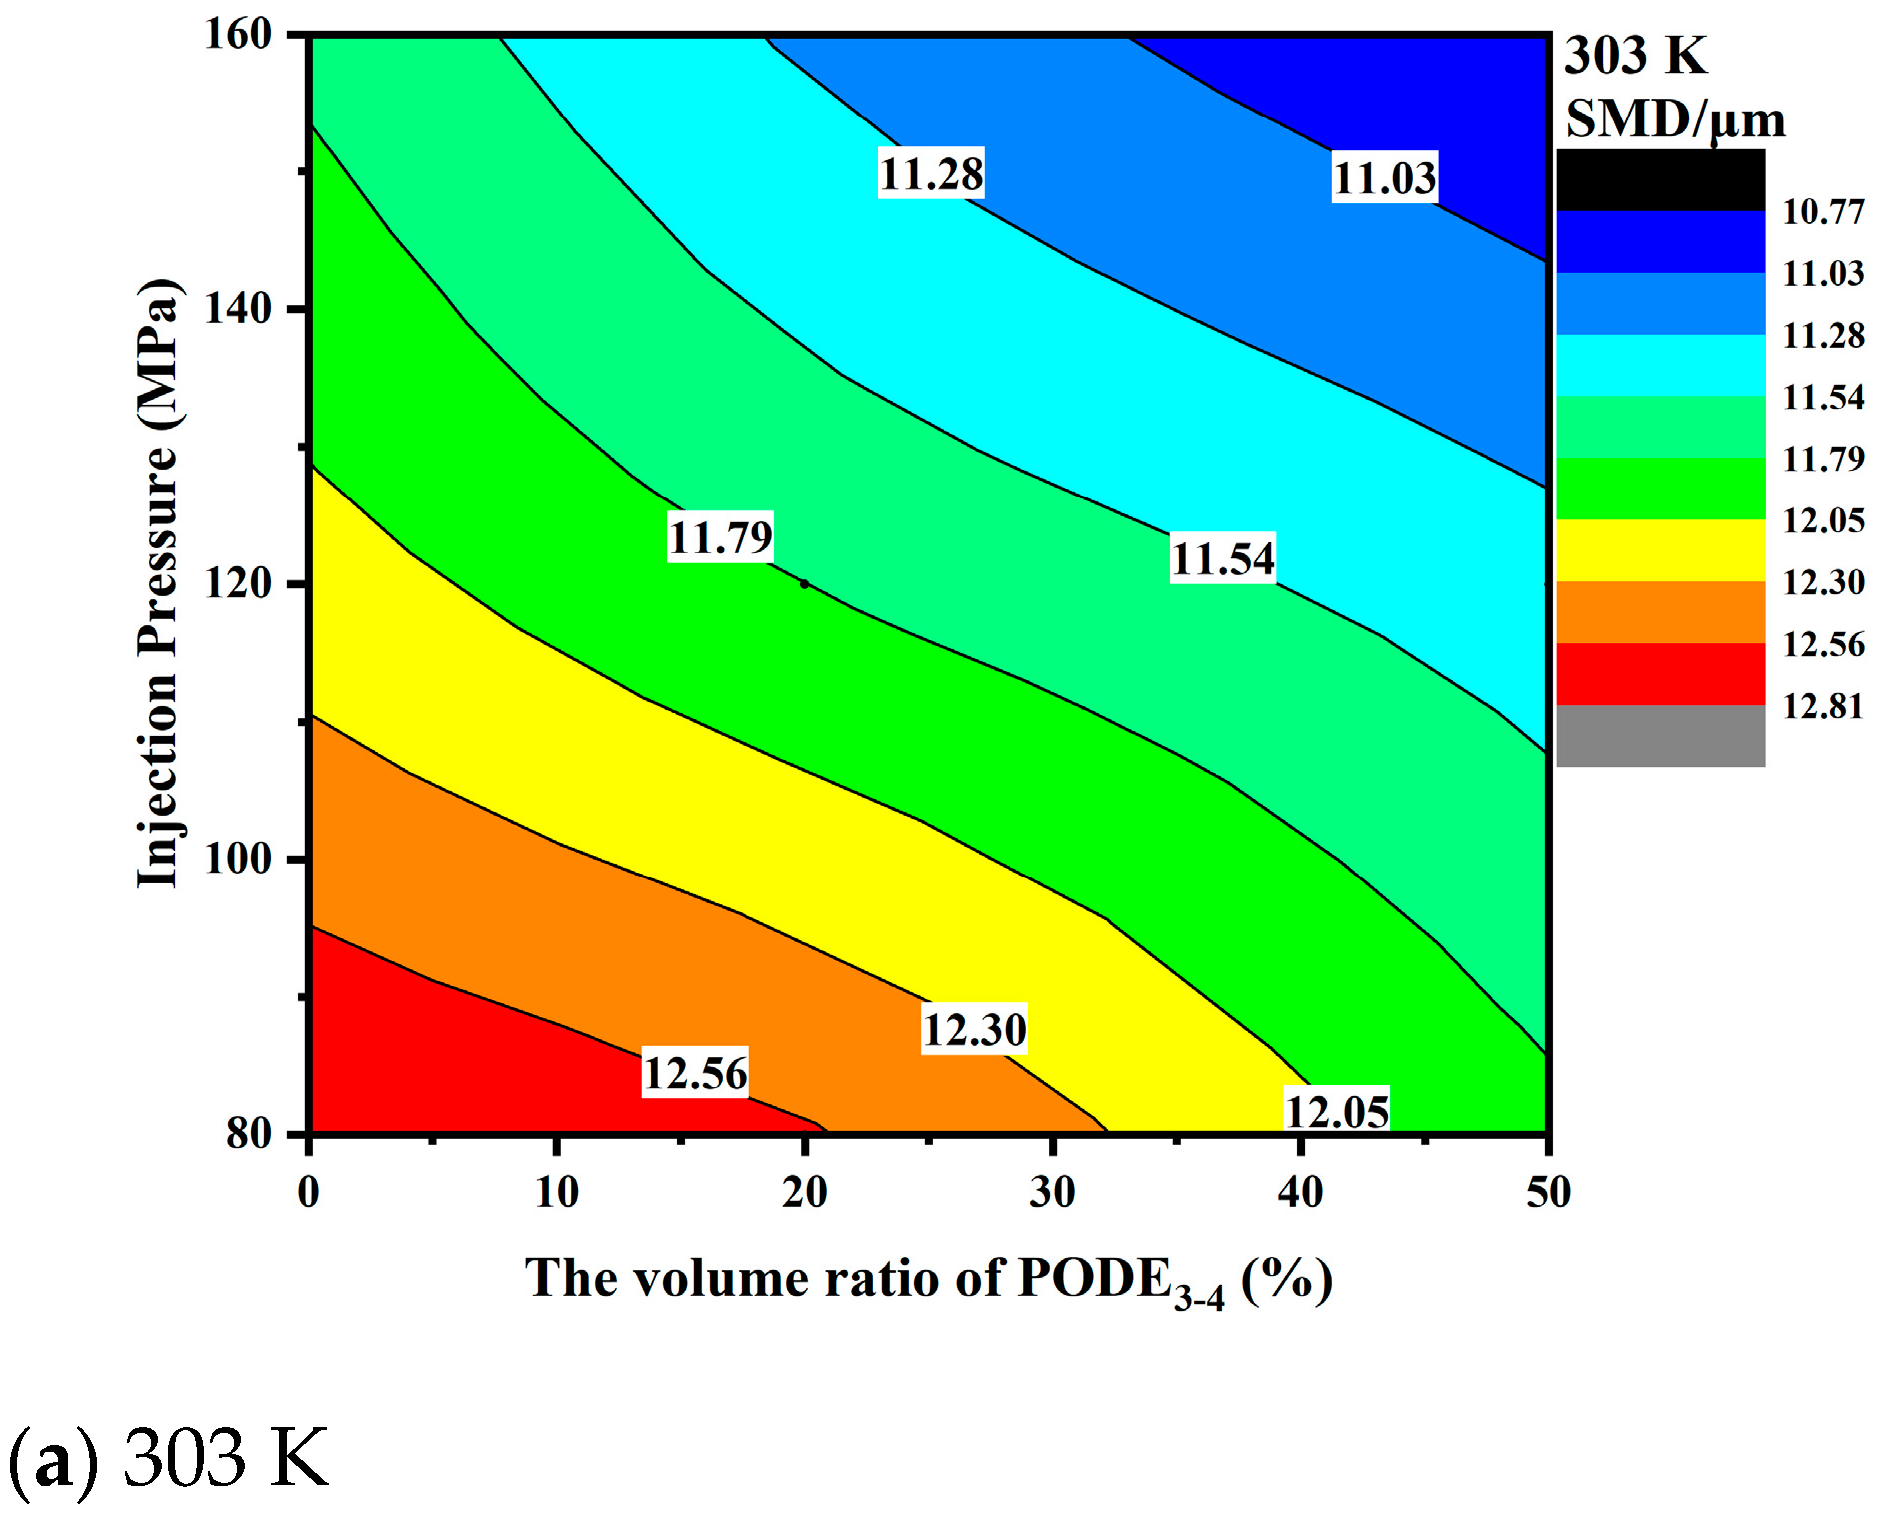
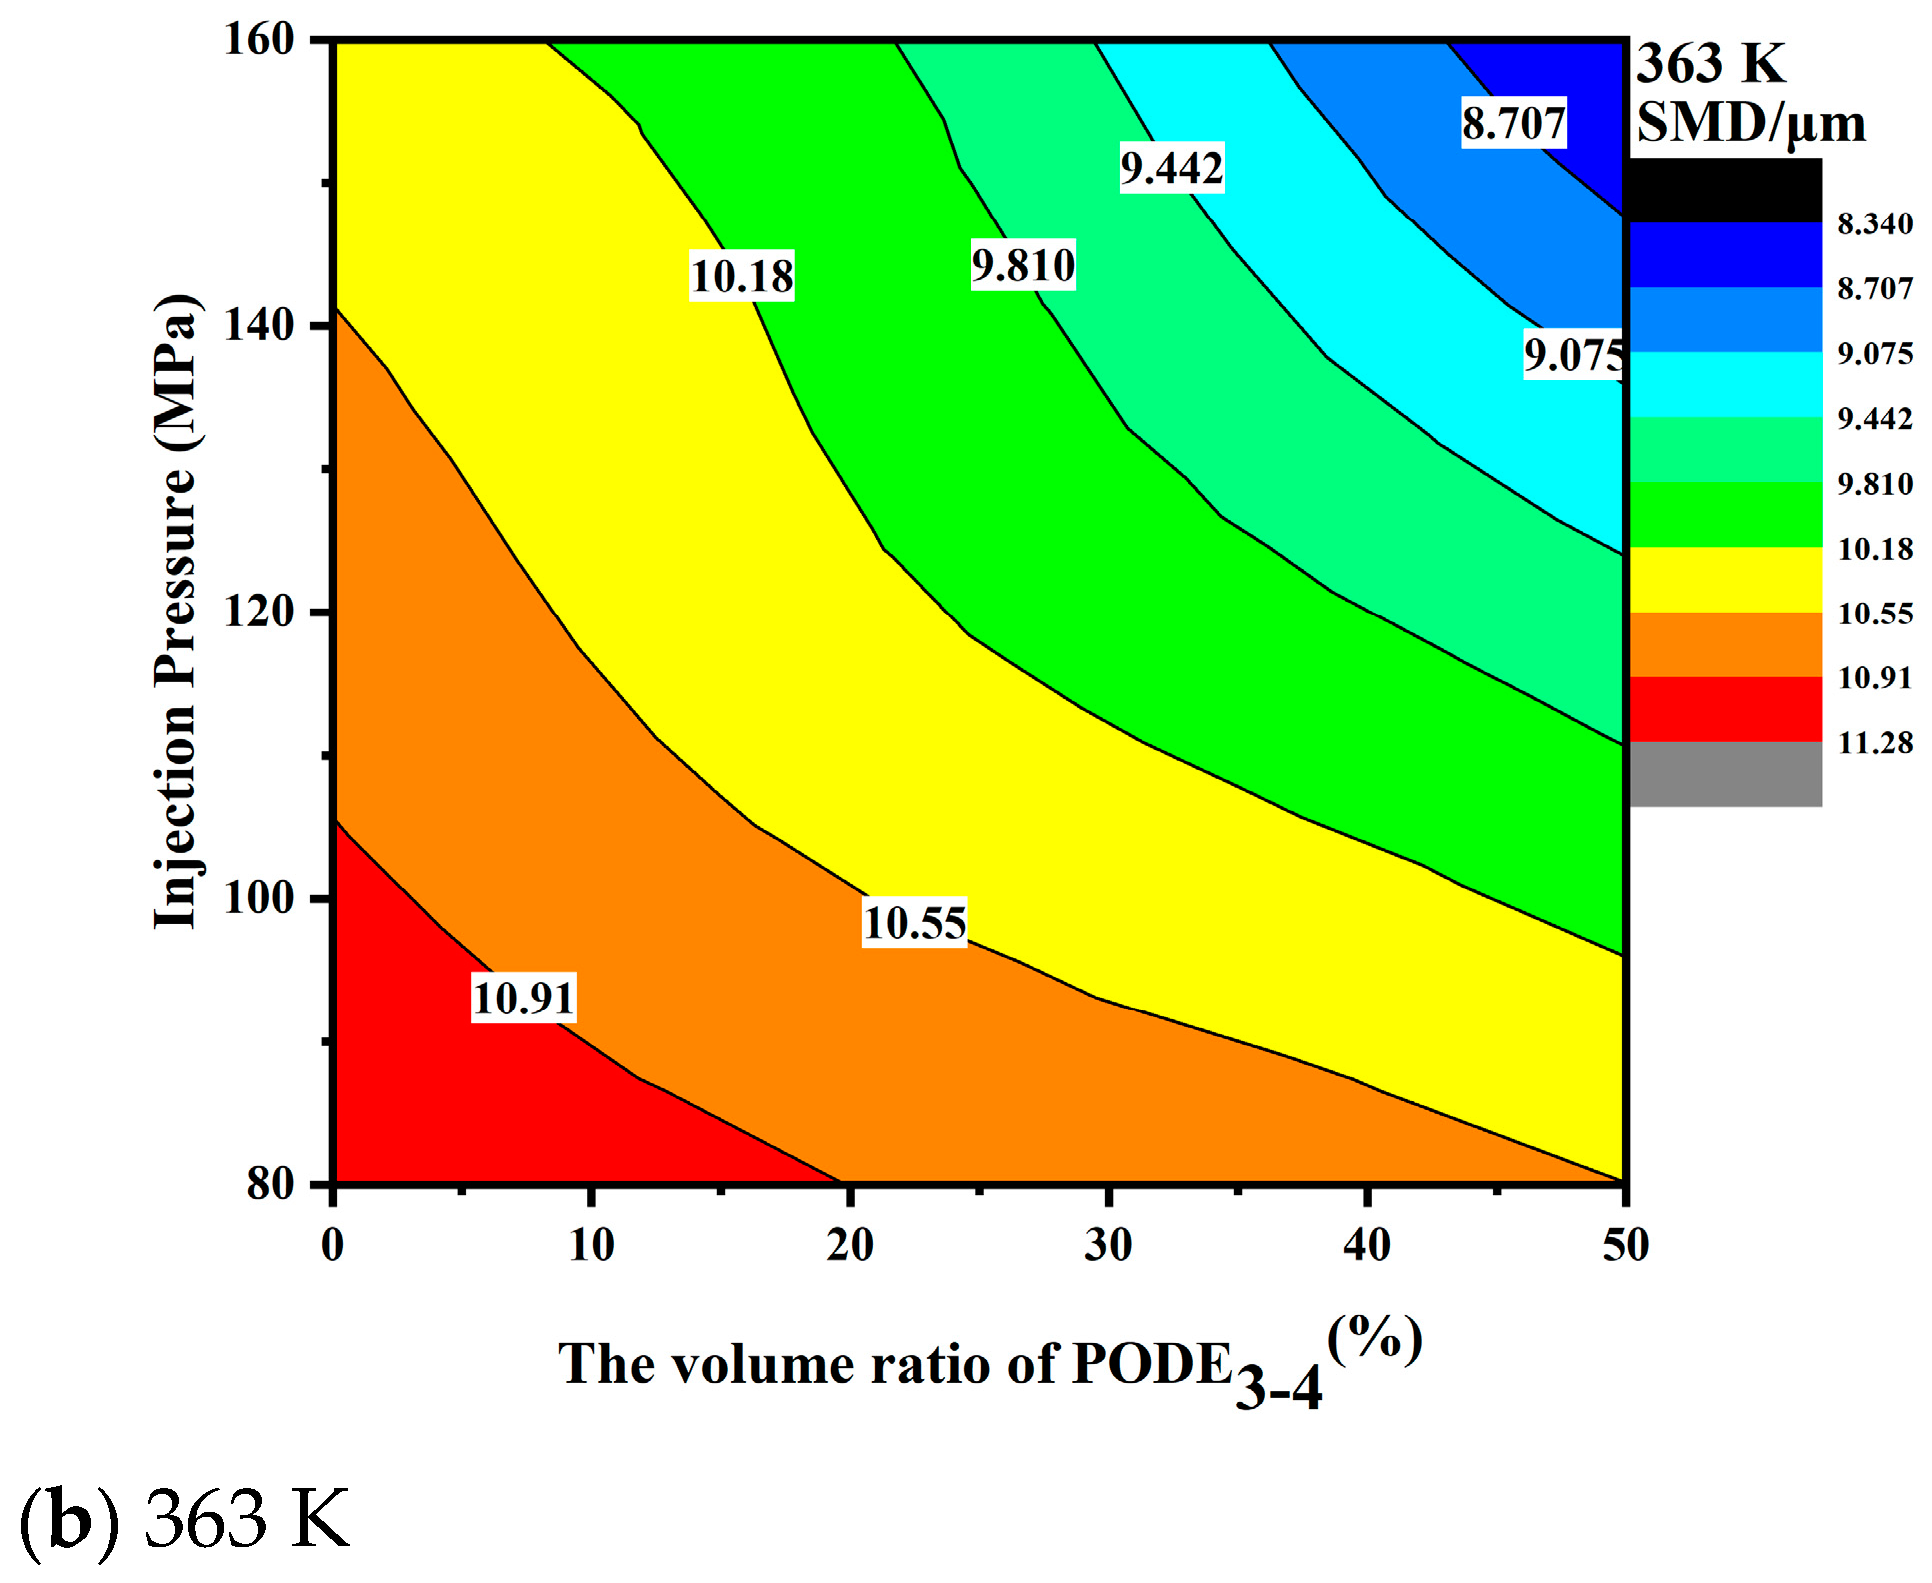
  • When the temperature and IPs increase, the SMD of the three fuels decrease, and the SMD hierarchy between the three fuels is P0 > P20 > P50. As the IPs and temperature increase, the droplet size decreases, especially when the IP is 160 MPa and the temperature is 363 K, the droplet size distribution of P50 and P20 is bimodal, and the droplet size is smaller.
This article accomplished research on the characteristics of the three different diesel and PODE blends, but more situations should be considered in the next experiments. In the future, the microscopic spray characteristics in high ambient temperature or ambient pressure should become the key point of discussion.

Author Contributions

Methodology, X.H. and H.H.; investigation, X.G. and Y.W.; resources, X.H. and H.H.; data curation, S.L.; writing—original draft preparation, Y.C.; writing—review and editing, C.J.; project administration, X.H. and H.H.; funding acquisition, Y.W. and H.H. All authors have read and agreed to the published version of the manuscript.

Funding

This work was supported by the National Natural Science Foundation of China (51966001) and the projects of EPSRC funded projects (EP/R041970/2 and EP/S032134/1).

Institutional Review Board Statement

Not applicable.

Informed Consent Statement

Not applicable.

Data Availability Statement

Data presented in this study can be made available upon request from the corresponding authors.

Acknowledgments

The authors gratefully acknowledge the support from the Engineering and Physical Sciences Research Council of the UK.

Conflicts of Interest

The authors declare no conflict of interest.

Nomenclature

Vthe vapor phase ECUelectronic control unit
Lthe liquid phaseHCunburned hydrocarbon
SVthe vapor phase spray tip penetrationIPinjection pressure
SLthe liquid phase spray tip penetrationLTClow temperature combustion
θVthe vapor phase spray cone angleNOXnitrogen oxide
θLthe liquid phase spray cone angleP0pure diesel
AVthe vapor phase projected areasPODEpolyoxymethylene dimethyl ether
ALthe liquid phase projected areasPMparticulate matter
CVCBconstant volume combustion bombP2080% diesel + 20% PODE3-4
COcarbon monoxideP5050% diesel + 50% PODE3-4
DBIdiffuse back-illuminationSMDSauter mean diameter

References

  1. Yannopoulos, M.; EL-Seesy, A.; Abdel-Rahman, A.; Bady, M. Influence of adding aluminum oxide nanoparticles to diesterol blends on the combustion and exhaust emission characteristics of a diesel engine. Exp. Therm. Fluid Sci. 2018, 98, 634–644. [Google Scholar]
  2. Valipour, M. Future of agricultural water management in Africa. Arch. Agron. Soil Sci 2014, 61, 907–927. [Google Scholar] [CrossRef]
  3. Ma, Y.; Huang, S.; Huang, R.; Zhang, Y.; Xu, S. Ignition and combustion characteristics of n-pentanol–diesel blends in a constant volume chamber. Appl. Energy 2017, 185, 519–530. [Google Scholar] [CrossRef]
  4. Han, K.; Yang, B.; Zhao, C.; Fu, G.; Ma, X.; Song, G. Experimental study on evaporation characteristics of ethanol–diesel blend fuel droplet. Exp. Therm. Fluid Sci. 2016, 70, 381–388. [Google Scholar] [CrossRef]
  5. Guo, H.; Liu, S.; He, J. Performances and emissions of new glycol ether blends in diesel fuel used as oxygenated fuel for diesel engines. J. Energy Eng. 2016, 142, 04015003. [Google Scholar] [CrossRef]
  6. Awad, O.; Mamat, R.; Ali, O.; Sidik, N.; Yusaf, T.; Kadirgama, K.; Kettner, M. Alcohol and ether as alternative fuels in spark ignition engine: A review. Renew. Sustain. Energy Rev. 2018, 82, 2586–2605. [Google Scholar] [CrossRef]
  7. Jamrozik, A. The effect of the alcohol content in the fuel mixture on the performance and emissions of a direct injection diesel engine fueled with diesel-methanol and diesel-ethanol blends. Energy Convers. Manag. 2017, 148, 461–476. [Google Scholar] [CrossRef]
  8. D’Adamo, I.; Falcone, P.; Morone, P. A New Socio-economic Indicator to Measure the Performance of Bioeconomy Sectors in Europe. Ecol. Econ. 2020, 176, 106724. [Google Scholar] [CrossRef]
  9. D’Adamo, I.; Falcone, P.; Huisingh, D.; Morone, P. A circular economy model based on biomethane: What are the opportunities for the municipality of Rome and beyond? Renew. Energy 2021, 163, 1660–1672. [Google Scholar] [CrossRef]
  10. Restrepo, J.B.; Paternina-Arboleda, C.D.; Bula, A.J. 1,2—Propanediol Production from Glycerol Derived from Biodiesel’s Production: Technical and Economic Study. Energies 2021, 14, 5081. [Google Scholar] [CrossRef]
  11. Hassaan, M.A.; El Nemr, A.; Elkatory, M.R.; Ragab, S.; El-Nemr, M.A.; Pantaleo, A. Synthesis, Characterization, and Synergistic Effects of Modified Biochar in Combination with α-Fe2O3 NPs on Biogas Production from Red Algae Pterocladia capillacea. Sustainability 2021, 13, 9275. [Google Scholar] [CrossRef]
  12. Lapuerta, M.; Armas, O.; Rodriguez-Fernandez, J. Effect of biodiesel fuels on diesel engine emissions. Prog. Energy Combust. 2008, 34, 198–223. [Google Scholar] [CrossRef]
  13. Kent-Hoekman, S.; Robbins, C. Review of the effects of biodiesel on NOx emissions. Fuel Process. Technol. 2012, 96, 237–249. [Google Scholar] [CrossRef]
  14. Szybist, J.; Song, J.; Alam, M.; Boehman, A. Biodiesel combustion, emissions and emission control. Fuel Process. Technol. 2007, 88, 679–691. [Google Scholar] [CrossRef]
  15. Geng, P.; Cao, E.; Tan, Q.; Wei, L. Effects of alternative fuels on the combustion characteristics and emission products from diesel engines: A review. Renew. Sustain. Energy Rev. 2016, 71, 523–534. [Google Scholar] [CrossRef]
  16. Li, F.; Fu, W.; Yi, B.; Song, L.; Liu, T.; Wang, X.; Wang, C.; Lei, Y.; Lin, Q. Comparison of macroscopic spray characteristics between biodiesel-pentanol blends and diesel. Exp. Therm. Fluid Sci. 2018, 98, 523–533. [Google Scholar] [CrossRef]
  17. Suh, H.; Yoon, S.; Chang, S. Effect of Multiple Injection Strategies on the Spray Atomization and Reduction of Exhaust Emissions in a Compression Ignition Engine Fueled with Dimethyl Ether (DME). Energy Fuel 2010, 24, 1323–1332. [Google Scholar] [CrossRef]
  18. Song, H.; Liu, C.; Li, F.; Wang, Z.; He, X.; Shuai, S.; Wang, J. A comparative study of using diesel and PODEn as pilot fuels for natural gas dual-fuel combustion. Fuel 2017, 188, 418–426. [Google Scholar] [CrossRef]
  19. Li, B.; Li, Y.; Liu, H.; Liu, F.; Wang, Z.; Wang, J. Combustion and emission characteristics of diesel engine fueled with biodiesel/PODE blends. Appl. Energy 2017, 206, 425–431. [Google Scholar] [CrossRef]
  20. Burger, J.; Siegert, M.; Ströfer, E.; Hasse, H. Poly(oxymethylene) dimethyl ethers as components of tailored diesel fuel: Properties, synthesis and purification concepts. Fuel 2010, 89, 3315–3319. [Google Scholar] [CrossRef]
  21. Lumpp, B.; Rothe, D.; Pastötter, C.; Lämmermann, R.; Jacob, E. Oxymethylene ethers as diesel fuel additives of the future. MTZ World Emaga. 2011, 72, 34–38. [Google Scholar] [CrossRef]
  22. Pellegrini, L.; Marchionna, M.; Patrini, R.; Beatrice, C.; Del Giacomo, N.; Guido, C. Combustion behaviour and emission performance of neat and blended polyoxymethylene dimethyl ethers in a light-duty diesel engine. Microelectron Eng. 2012, 87, 778–781. [Google Scholar]
  23. Pellegrini, L.; Marchionna, M.; Patrini, R.; Florio, S. Emission performance of neat and blended polyoxymethylene dimethyl ethers in an old light-duty diesel car. In Proceedings of the SAE International SAE 2013 World Congress& Exhibition, Detroit, MI, USA, 16–18 April 2013. [Google Scholar]
  24. Iannuzzi, S.E.; Barro, C.; Boulouchos, K.; Burger, J. Combustion behavior and soot formation/oxidation of oxygenated fuels in a cylindrical constant volume chamber. Fuel 2016, 167, 49–59. [Google Scholar] [CrossRef]
  25. Iannuzzi, S.E.; Barro, C.; Boulouchos, K.; Burger, J. POMDME-diesel blends: Evaluation of performance and exhaust emissions in a single cylinder heavy-duty diesel engine. Fuel 2017, 203, 57–67. [Google Scholar] [CrossRef]
  26. Huang, H.; Liu, Q.; Teng, W.; Pan, M.; Liu, C.; Wang, Q. Improvement of combustion performance and emissions in diesel engines by fueling n-butanol/diesel/PODE3–4 mixtures. Appl. Energy 2017, 227, 38–48. [Google Scholar] [CrossRef]
  27. Liu, H.; Wang, Z.; Zhang, J.; Wang, J.; Shuai, S. Study on combustion and emission characteristics of Polyoxymethylene dimethyl Ethers/diesel blends in light-duty and heavy-duty diesel engines. Appl. Energy 2017, 185, 1393–1402. [Google Scholar] [CrossRef]
  28. Liu, H.; Wang, Z.; Wang, J.; He, X.; Zheng, Y.; Tang, Q.; Wang, J. Performance, combustion and emission characteristics of a diesel engine fueled with polyoxymethylene dimethyl ethers (PODE3-4)/diesel blends. Energy 2015, 88, 793–800. [Google Scholar] [CrossRef]
  29. Li, D.; Gao, Y.; Liu, S.; Ma, Z.; Wei, Y. Effect of polyoxymethylene dimethyl ethers addition on spray and atomization characteristics using a common rail diesel injection system. Fuel 2016, 186, 235–247. [Google Scholar] [CrossRef]
  30. Gimeno, J.; Bracho, G.; Martí-Aldaraví, P.; Peraza, J.E. Experimental study of the injection conditions influence over n-dodecane and diesel sprays with two ECN single-hole nozzles. Part I: Inert atmosphere. Energy Convers. Manag. 2016, 126, 1146–1156. [Google Scholar] [CrossRef]
  31. Manin, J.; Bardi, M.; Pickett, L. Evaluation of the liquid length via diffused back-illumination imaging in vaporizing diesel sprays. In Proceedings of the Proposed for Presentation at the COMODIA 2012, Fukuoka, Japan, 23–26 July 2012; p. 2012. [Google Scholar]
  32. Payri, R.; Giraldo, J.; Ayyapureddi, S.; Versey, Z. Experimental and analytical study on vapor phase and liquid penetration for a high pressure diesel injecto. Appl. Therm. Eng. 2018, 137, 721–728. [Google Scholar] [CrossRef]
  33. Huang, S.; Deng, P.; Huang, R.; Wang, Z.; Ma, Y.; Dai, H. Visualization research on spray atomization, evaporation and combustion processes of ethanol–diesel blend under LTC conditions. Energy Convers. Manag. 2015, 106, 911–920. [Google Scholar] [CrossRef]
  34. Ma, Y.; Huang, S.; Huang, R.; Zhang, Y.; Xu, S. Spray and evaporation characteristics of n-pentanol–diesel blends in a constant volume chamber. Energy Convers. Manag. 2016, 130, 240–251. [Google Scholar] [CrossRef]
  35. Payri, R.; Viera, J.P.; Gopalakrishnan, V.; Szymkowicz, P.G. The effect of nozzle geometry over the evaporative spray formation for three different fuels. Fuel 2017, 188, 645–660. [Google Scholar] [CrossRef] [Green Version]
  36. Tan, Y.; Botero, M.; Sheng, Y.; Dreyer, J.A.; Xu, R.; Yang, W.; Kraft, M. Sooting characteristics of polyoxymethylene dimethyl ether blends with diesel in a diffusion flame. Fuel 2018, 224, 499–506. [Google Scholar] [CrossRef]
  37. Huang, H.; Liu, Q.; Shi, C.; Wang, Q.; Zhou, C. Experimental study on spray, combustion and emission characteristics of pine oil/diesel blends in a multi-cylinder diesel engine. Fuel Process. Technol. 2016, 153, 137–148. [Google Scholar] [CrossRef]
  38. Liu, J.; Wang, H.; Li, Y.; Zheng, Z.; Xue, Z.; Shang, H.; Yao, M. Effects of diesel/PODE (polyoxymethylene dimethyl ethers) blends on combustion and emission characteristics in a heavy duty diesel engine. Fuel 2016, 177, 206–216. [Google Scholar] [CrossRef]
  39. Kang, M.; Song, H.; Jin, F.; Chen, J. Synthesis and physicochemical characterization of polyoxymethylene dimethyl ethers. J. Fuel Chem. Technol. 2017, 45, 837–845. [Google Scholar] [CrossRef]
  40. Xiong, Y.; Li, Z.; Jiang, Z.; Huang, R. Test of the Influence of Injection Pressure on the Combustion of Mixed Fuel. Equip. Manuf. Technol. 2018, 5, 142–144. [Google Scholar]
  41. Wang, J.; Wu, F.; Xiao, J.; Shuai, S. Oxygenated blend design and its effects on reducing diesel particulate emissions. Fuel 2009, 88, 2037–2045. [Google Scholar] [CrossRef]
  42. Ramirez-Verduzco, L. Density and viscosity of biodiesel as a function of temperature: Empirical models. Renew. Sustain. Energy Rev. 2013, 19, 652–665. [Google Scholar] [CrossRef]
  43. Sohrabiasl, I.; Gorji-Bandpy, M.; Hajialimohammadi, A.; Mirsalim, M.A. Effect of open cell metal porous media on evolution of high pressure diesel fuel spray. Fuel 2017, 206, 133–144. [Google Scholar] [CrossRef]
  44. Naber, J.; Siebers, D. Effects of gas density and vaporization on penetration and dispersion of diesel Sprays. SAE Tech. Pap. 1996, 105, 82–111. [Google Scholar]
  45. Kim, W.; Lee, K.; Chang, S. Spray and atomization characteristics of isobutene blended DME fuels. J. Nat. Gas Sci. Eng. 2015, 22, 98–106. [Google Scholar] [CrossRef]
  46. Dahmen, N.; Arnold, U.; Djordjevic, N.; Henrich, T.; Kolb, T.; Leibold, H.; Sauer, J. High pressure in synthetic fuels production. J. Supercrit. Fluid 2015, 96, 124–132. [Google Scholar] [CrossRef]
  47. Yu, S.; Yin, B.; Jia, H.; Wen, S.; Li, X.; Yu, J. Theoretical and experimental comparison of internal flow and spray characteristics between diesel and biodiesel. Fuel 2017, 2018, 20–29. [Google Scholar] [CrossRef]
  48. Valentino, G.; Allocca, L.; Iannuzzi, S.; Montanaro, A. Biodiesel/mineral diesel fuel mixtures: Spray evolution and engine performance and emissions characterization. Energy 2011, 36, 3924–3932. [Google Scholar] [CrossRef]
  49. Wang, Z.; Xu, H.; Jiang, C.; Wyszynski, M.L. Experimental study on microscopic and macroscopic characteristics of diesel spray with split injection. Fuel 2016, 174, 140–152. [Google Scholar] [CrossRef]
Figure 1. Schematic of the constant volume combustion chamber system.
Energies 14 05559 g001
Figure 2. Optical setup for Mie scattering.
Energies 14 05559 g002
Figure 3. (a) Micro experimental test structure diagram. (b) Working principle of Winner 318A.
Energies 14 05559 g003
Figure 4. Comparison of processed and raw images using Mie scattering and schlieren methods.
Energies 14 05559 g004
Figure 5. Definition of various spray parameters.
Energies 14 05559 g005
Figure 6. Spray development for different blends at different ambient temperatures.
Energies 14 05559 g006aEnergies 14 05559 g006b
Figure 7. Penetration distances of blends at different temperatures: (a) P0, (b) P20, (c) P50.
Energies 14 05559 g007
Figure 8. Cone angle of the three blends at different temperatures: (a) P0, (b) P20, (c) P50.
Energies 14 05559 g008
Figure 9. Projection areas of the three fuels at different ambient temperatures: (a) P0, (b) P20, (c) P50.
Energies 14 05559 g009
Figure 10. Spray image of three fuels under different IPs.
Energies 14 05559 g010
Figure 11. Penetration distances of the three fuels under different IPs: (a) P0, (b) P20, (c) P50.
Energies 14 05559 g011
Figure 12. Cone angle of three fuels under different IPs: (a) P0, (b) P20, (c) P50.
Energies 14 05559 g012
Figure 13. Average cone angles of the three fuels under different fuel Ips: (a) average vapor phase cone angle, (b) average liquid phase cone angle.
Energies 14 05559 g013
Figure 14. Projection area of the three fuels under different fuel IPs: (a) P0, (b) P20, (c) P50.
Energies 14 05559 g014aEnergies 14 05559 g014b
Figure 15. The influence of different temperature and IPs on the SMD of test fuels’ droplets.
Energies 14 05559 g015aEnergies 14 05559 g015b
Figure 16. The effects of different temperature and IPs on the droplet size distribution.
Energies 14 05559 g016aEnergies 14 05559 g016b
Table 1. Uncertainties and experimental measurement techniques/instruments.
Measurement% UncertaintyMeasurement Technique
Pressure pickup±0.1Magnetic pickup principle
Temperature±0.15Thermocouple
Diesel fuel measurement±1Volumetric measurement
PODE3-4 fuel measurement±1Volumetric measurement
Table 2. Experimental parameters used in the current work.
ParameterNumerical Value
FuelsP0, P20, P50
Injection pressure/MPa80, 120, 160
Ambient temperature/K573,623,673 (macroscopic)
303 363 (microscopic)
Ambient Pressure/MPa5 (macroscopic)
0.1 (microscopic)
Filming speed/fps20,000
Injection pulse width/ms1.0
Table 3. Physical and chemical parameters of PODEn (n = 2–4) [29,38,39,40,41].
ParameterPODE2PODE3PODE4
Density (298 K)/g·cm−30.961.021.06
Viscosity (298 K)/(mm2·s−1)0.641.051.75
Oxygen content/(%)45.347.148.2
Cetane value637090
Flash point/(T·K−1)289.1293.1350.1
Low calorific value/(MJ·kg−1)22.4419.1418.39
Sulfur content/(%)000
Table 4. Physical and chemical parameters of various fuel blends used in the experiments.
ParameterPODE3-4P0
Density (298 K)/g·cm−31.02 *0.86
Viscosity (298 K)/(mm2·s−1)1.05 **3.44
Surface tension/(10−3N·m−1)35.67 *27.74
Oxygen content/(%)46.98 *0
Cetane value78.6 *56.5
Flash point/(T·K−1)297.64 *>328.1
Low calorific value/(MJ·kg−1)19.2 *42.80
Sulfur content/(%)00
* Calculated from Ref. [41]. ** Calculated from Ref. [42].
Publisher’s Note: MDPI stays neutral with regard to jurisdictional claims in published maps and institutional affiliations.

