
Enhancement of the Flickermeter for Grid-Connected Wind Turbines


Department of Electrical Engineering, National Changhua University of Education, Changhua 50074, Taiwan
*
Author to whom correspondence should be addressed.
Energies 2021, 14(18), 5734; https://0-doi-org.brum.beds.ac.uk/10.3390/en14185734
Submission received: 13 August 2021
/
Revised: 7 September 2021
/
Accepted: 10 September 2021
/
Published: 13 September 2021
(This article belongs to the Collection Feature Papers on Wind, Wave and Tidal Energy)
Abstract
:Distributed generators connected to the power system usually produce voltage fluctuations. For wind turbines connected to a grid, large changes in wind speed can cause voltage flicker at the point of common coupling. The measurement of voltage flicker caused only by wind turbines is difficult. The wind turbine under test is usually connected to a medium voltage point, in which other fluctuating loads may produce significant voltage disturbances at the wind turbine terminal where the measurement is made. Although the IEC 61400-21-1 standard specifies a method to evaluate voltage flicker caused by wind turbines, because of the complex algorithm and process of the IEC standard, there is currently a lack of measurement equipment that meets the IEC standard. In addition, some countries that use other voltage flicker standards, such as ΔV10, do not have suitable flicker measurements for wind turbines. Therefore, this study proposes an enhanced version of the IEC 61400-21-1 standard, which integrates the ΔV10 method, so that the proposed measurement system complies with the IEC and ΔV10 standards. In this study, the voltage flicker measurement system is successfully implemented, which can help engineers to predict the voltage flicker by wind turbines and assess whether a region or grid is suitable for installing wind turbines. Therefore, it can provide wind turbine companies with a quick assessment of voltage flicker to comply with the certification process.
1. Introduction
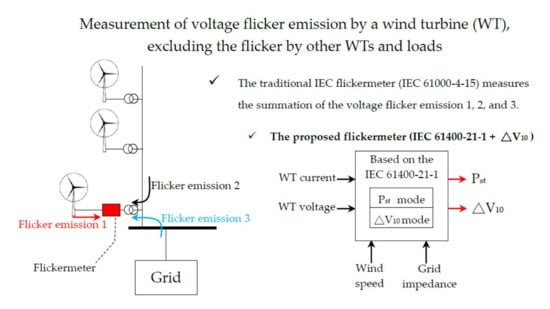
Wind energy is a safe, clean, and endless renewable energy source. Because wind energy has no fuel and air pollution problems, in the face of the current climate abnormalities and global warming, wind energy technology has attracted more and more attention from the world [1,2]. Although wind power is a sustainable energy, when the wind power generator is merged with or disconnected from the existing electric power system, it will cause voltage fluctuations and short-circuit current in the grid, thereby affecting power quality. Furthermore, the inherently unstable wind speed can also cause the wind turbines to produce voltage fluctuations, called voltage flicker [3,4,5,6]. Voltage flicker will not only cause unstable lighting of lamps, but also cause health problems and electronic equipment failure [7]. Therefore, measuring voltage flicker becomes an important issue of power quality. The flickermeter standard IEC 61000-4-15 was developed by the International Electrotechnical Commission and has been widely used worldwide for decades [7]. It can evaluate the flicker severity level of power supply voltage as the values of Pst (short-term flicker severity) and Plt (long-term flicker severity). However, the IEC 61000-4-15 flickermeter is not suitable for directly measuring the voltage flicker caused by wind turbines, because the tested wind turbine is usually connected to a medium voltage point, and other fluctuating loads may generate obvious voltage perturbations in the grid during measurement. Thus, the IEC announced the standard of IEC 61400-21-1 in 2019 [8] for evaluating the voltage flicker caused by grid-connected wind turbines, which is partially based on the IEC 61000-4-15 standard.
Wind turbine companies need a certification process for selling wind turbines. Gutierrez et al. [9] presented a flicker measurement system for wind turbines’ certification based on the IEC standard. The system consisted of two modules: a signal register to store the voltage and current time-series data and a process algorithm in accordance with the IEC standard. The IEC standard method is based on measuring the flicker of a single wind turbine and then using this measurement result to calculate the flicker emission from a number of wind turbines. Therefore, Barahona et al. [10] investigated the validity and accuracy of the standard method in IEC 61400-21, i.e., the early version of IEC 61400-21-1, for evaluating the flicker emission from multiple wind turbines. Dexiong Li [11] revealed that the fictitious grid circuit provided in the IEC standard should not connect a current source with an inductor in series. Thus, two new fictitious grid circuits were proposed to improve the deficiency. Khan et al. [12] worked on the deviation on flicker evaluation of wind turbines associating with the disturbance of harmonics and interharmonics. However, because of the complexity of the algorithm and process of the IEC 61400-21-1 standard, there is currently a lack of measurement equipment that meets the standard.
Another flicker measurement approach called “Equivalent 10-Hz Voltage Flicker (ΔV10)”, developed by the Central Research Institute of the Electric Power Industry (CRIEPI) [13,14] in 1978, is widely used in Japan, Brazil, France, Italy, Argentina, and Taiwan. According to the specification of the approach, the voltage flicker severity is measured as the term of ΔV10 value, and the maximum value of the evaluation index ΔV10 should not exceed 0.45% as the basis for regulation. However, the CRIEPI does not provided a method to evaluate the voltage flicker caused by wind turbines. Although the works in Gherasim [15], Redondo [16,17], and Manas [18] implemented the flickermeter based on the IEC standard for wind turbines, the ΔV10 standard has not been considered. Thus, in this work, we added the ΔV10 method into the IEC 61400-21-1 standard to propose an enhanced version of the two-mode IEC voltage flicker measurement for wind turbines, which is suitable for countries using the IEC standard or the ΔV10 standard.
To implement this proposed method, MATLAB Simulink is used to build a model of a doubly fed induction generator (DFIG) with grid connection to generate current and voltage time-series data at the wind turbine terminals to simulate the voltage flicker on the virtual grid without other voltage fluctuation loads. A measurement system based on the IEC 61400-21-1 combined with ΔV10 standard was implemented to assess the voltage flicker caused by wind turbines under continuous operation. It can help wind turbine companies with a quick certification of power quality for wind turbine installations. The proposed system can evaluate whether a region or grid is suitable for installing wind turbines. It can also predict the voltage flicker that wind turbines may cause in advance.
2. Methodology
The measurement of voltage flicker caused by wind turbines is a complex issue. As mentioned above, the point of common coupling (PCC) where the measurement of wind turbines is taken also connects to other fluctuating loads producing voltage flicker. Thus, neither the IEC 61000-4-15 nor the ΔV10 flickermeter connected to the PCC can directly measure the voltage flicker caused by wind turbines. In addition, the severity of voltage flicker depends on the characteristic of wind turbine itself, the changing wind speed, the grid impedance phase angle, and the short-circuit apparent power of the grid [3]. Currently, only the standard of IEC 61400-21-1 provides an assessment of the voltage flicker of grid-connected wind turbines. Thus, we added the ΔV10 method to the algorithm of IEC 61400-21-1 to evaluate the voltage flicker in wind turbines in terms of Pst and ΔV10. This section represents the proposed method based on the IEC standard combined with the ΔV10 method.
As shown in Figure 1, a DFIG wind turbine model is built by MATLAB Simulink to simulate a continuously operating wind turbine. Then, the measurement data of wind speed, generated current, and voltage can be obtained in time series form. According to the standard, the wind speed is sampled at least at 1 S/s (one sample per second). Because of the Nyquist rate, the current im(t) and voltage um(t) of the wind turbine terminal are sampled at 2 kS/s, owing to the low pass filter with an 800 Hz cut-off frequency in data acquisition. The time-series data of im(t) and um(t) are then analyzed according to the algorithm specified in the IEC 61400-21-1 and 61000-4-15 standards. At the end of the analysis, the voltage flicker severity values of Pst and ΔV10 can be determined. Figure 2 shows a three-phase grid-connected DFIG generic wind turbine model with current and voltage data acquisition designed in Simulink. The parameters shown in Figure 2 and their values are listed in Table 1. In this work, the DFIG wind turbine is 2 MW and connected to an 11.4 kV distribution system. The wind speed is usually set from 3 m/s to 15 m/s, which are the lowest wind speed at which the wind turbine can be started and the highest wind speed at which the wind turbine can operate safely, respectively.
There is a three-phase grounding transformer in the 11.4 kV feeder to protect the distribution system. The DFIG wind turbine includes a wound rotor induction generator and an AC/DC/AC IGBT-based PWM converter. The stator winding is directly connected to the grid, but the rotor is fed at variable frequency through the PWM converter. The optimal wind turbine speed producing maximum power energy is proportional to the wind speed. For lower wind speeds, the rotor is rotating at subsynchronous speed, while for high wind speeds, it is rotating at hypersynchronous speed.
The proposed flickermeter modified from the IEC 61400-21-1 standard is illustrated in Figure 3, in which each block is described in the following paragraphs. Besides IEC 61000-4-15 standard to calculate the preliminary flicker level, ΔV10 measurement is also adopted in the proposed method to fit more countries, as shown in the thick-line box in Figure 3.
2.1. Step 1: Data Acquisition of im(t) and um(t)
The standard requires groups of at least five time-series data of voltage and current in 10 min span per wind speed bin for three phases. The requirement of a 10 min data span is based on the IEC 61000-4-15 to calculate Pst for each 10 min voltage span. Table 2 shows the required groups of test data.
2.2. Step 2: Fictitious Grid
The voltage measured in the terminal of wind turbines is often affected by other fluctuating loads in the grid. Therefore, the standard proposes an equivalent circuit of a fictitious grid, as shown in Figure 4, to transfer the measured data um(t) to ufic(t) so that the flicker from other fluctuating loads is excluded, and the transferred data are then suitable for entering the IEC 61000-4-15 algorithm, block 2.
In Figure 4, an ideal phase-to-neutral voltage source with the instantaneous value uo(t) is represented in the fictitious grid, and a grid impedance is given by a resistor Rfic in series with an inductor Lfic. The wind turbine is represented by the current generator im(t), which is the measured current. This model gives a simulated value ufic(t) of instantaneous phase-to-neutral voltage according to Equations (1) and (2), which is implemented in block 1 of Figure 3.
where Un represents the rms value of the nominal voltage and αm(t) is the fundamental phase angle of um(t). The values of Rfic and Lfic are derived from the grid impedance phase angle ψk = 30°, 50°, 70°, and 85°, which are determined by the IEC 61400-21-1. Rfic and Lfic shall be selected to obtain the appropriate grid impedance phase angle ψk according to the Equation (3).
where fg is the nominal frequency (50 or 60 Hz). Once the series data of ufic(t) are deter- mined, they can be sent to block 2 in Figure 3 for flicker calculation in accordance with the IEC 61000-4-15 standard.
2.3. Step 3: IEC 61000-4-15 Flickermeter and ΔV10 Calculation
The IEC standard of flickermeter provides a model to simulate the behavior of the lamp–eye–brain response when voltage slight variation causes lamp flickering [7]. The model attempts to assess the annoying level subject to the flickering of voltage and lighting. The flickermeter outputs the short-term flicker severity Pst to characterize the subjective phenomenon. The IEC specification recommends to take Pst = 1 as the upper-limit of regulation, called unit flicker. For Pst < 0.7, the flicker usually is insensible; for Pst > 1.3, the flicker will make people feel uncomfortable [11].
Entering the time-series data ufic(t) into the input of block 2 will obtain the values of Pst,fic or ΔV10,fic for each phase and for different grid impedance angle ψk. The implementation of block 2, i.e., a general flickermeter, has been completed in previous works [19,20], so the details of this general flickermeter are not described again here.
On the other hand, for the countries using the ΔV10 standard, the block 2 in Figure 3 can be switched to ΔV10 mode. In ΔV10 mode, all of the magnitudes (ΔVn) of the voltage fluctuation for flicker frequencies could be determined by the fast Fourier transform (FFT). The next stage is to look up the equivalent effect (or sensitivity coefficient) of all frequency components with respect to 10 Hz, as shown in Figure 5. Then, using these coefficients to weight the corresponding frequency components, one can obtain the value of ΔV10 expressed as Equation (4).
where ΔV10 indicates the severity level of flicker; V is the rated main voltage; and ΔVn and an represent the fluctuation amplitude of specified frequency and its sensitivity coefficient, respectively. Normally, the value of ΔV10 is regulated under 0.45% [13].
2.4. Step 4: Normalization
As shown in block 3 of Figure 3, the step is to determine the flicker coefficient c(ψk) of a wind turbine as a function of the grid impedance phase angle ψk and wind speed distribution. Each Pst,fic is normalized to a flicker coefficient c(ψk) by Equation (5).
where Sn is the rated apparent power of a wind turbine and Sk,fic represents the short-circuit apparent power of the fictitious grid, which can be determined from Equation (6).
2.5. Step 5: Weighting
To scale the measured frequency of occurrence of the flicker coefficients to correspond with the assumed wind speed distribution, a weighting factor shall be determined for each wind speed bin (block 4). The procedure to find the weighting factor is as follows. The assumed frequency of occurrence fy,i of wind speeds within the i’th wind speed bin shall correspond to a Rayleigh distribution [3,21]:
where vi is the midpoint of the i’th wind speed bin and va is the annual average wind speed. The actual occurrence frequency fm,i of measured flicker coefficients within the i’th wind speed bin is obtained by Equation (8).
where Nm,i is the number of measured flicker coefficient values within the i’th wind speed bin and Nm is the total number of flicker coefficient values. Then, the weighting factor wi for each wind speed bin is determined in the Equation (9).
The weighted accumulated distribution Pr(c < x) of the measured flicker coefficient values is found by Equation (10).
where Nm,i,c < x is the number of flicker coefficient values less than or equal to the value x within the i’th wind speed bin and Nbin is the total number of wind speed bins. Finally, the flicker coefficient c(ψk,va) is determined as the 99th percentile of the weighted accumulated distribution of the flicker coefficient values, which can be obtained by calculating Pr(c < x) and reading the 99th percentile from that. The determined flicker coefficient c(ψk,va) shall be reported and recorded in block 5.
2.6. Step 6: Calculation of Pst and ΔV10
The 99th percentile flicker emission from a single wind turbine under continuous operation is calculated by the following:
where c(ψk,va) is the flicker coefficient of the wind turbine for the given grid impedance phase angle ψk and for the given annual average wind speed va; Sn is the rated apparent power of the wind turbine; and Sk is the short-circuit apparent power at the PCC. The flicker coefficient c(ψk,va) for other values of ψk and va can be produced by applying linear interpolation. For multiple wind turbines, the flicker emission of them can be assessed from Equation (12).
where ci(ψk,va) is the flicker coefficient of individual wind turbine; Nwt is the number of wind turbines connected to the PCC; and Sn,i is the rated apparent power of the individual wind turbine.
In the other mode, the voltage flicker emission for the ΔV10 standard can also be determined through the same algorithm from Equations (4) to (12). The symbols used in the text and their meanings are listed in Table 3.
3. Experimental Results
Series data of collected current im(t) of a grid-connected wind turbine are shown in Figure 6, in which the generated current is not stable owing to wind speed changing. The current is sampled at 2 kHz for 10 min. The data of im(t) are then entered to block 1 of Figure 3 to obtain the series data of ufic(t). In order to validate the proposed meas-urement system, the built DFIG wind turbine model is utilized to generate 180 sets of im(t) data in 10 min span per wind speed bin for three phases according to Table 2.
The wind turbine parameters and virtual grid parameters are shown in Table 4.
After inputting these 180 sets of im(t) data, the flicker coefficient output c(ψk) of block 3 in Figure 3 with ψk = 30° is determined and shown in Figure 7. The flicker coefficient can be regarded as an indicator for preliminary assessment of the severity of flicker. It can be seen from the figure that the flicker coefficient is roughly proportional to the wind speed. In addition, owing to the inherent characteristics of wind speed, the higher the wind speed, the greater the deviation of the flicker coefficient.
The weighted flicker coefficient c(ψk,va) for different wind speeds and grid impedance phase angle, i.e., the output of step 5 mentioned above, is listed in Table 5 and Table 6 for the Pst model and ΔV10 model, respectively. The final outputs Pst and ΔV10 are determined by Equation (11) and shown in Figure 8 and Figure 9, respectively.
It is seen that the wind turbine operating under the grid impedance phase angle ψk = 30°–85° has acceptable Pst and ΔV10 values. The acceptable Pst value is Pst < 1 and the acceptable ΔV10 value depends on the country, as listed in Table 7 [13]. In addition, the figures show that, the higher the wind speed, the greater the value of Pst and ΔV10, because a high wind speed will cause the wind speed and power generation to be more unstable. Furthermore, the higher the grid impedance phase angle, the lower the voltage flicker caused by the wind turbine. This is because the fictitious network with wind turbines shown in Figure 4 is actually an RL low-pass filter with a cut-off frequency of R/L, so the high grid impedance phase angle will produce a lower cut-off frequency to suppress the voltage variation.
If the grid impedance phase angle and annual average wind speed are not given in Table 4 and Table 5, the IEC standard claims that linear interpolation can be used to obtain the weighted flicker coefficients and determine the Pst and ΔV10 values. For example, assuming that the grid impedance phase angle ψk = 35° and the wind speed va = 6 m/s, linear interpolation can be used to determine that the c(ψk,va) of Pst mode and ΔV10 mode are 10.17 and 3.88, respectively. Then, Pst = 0.23 and ΔV10 = 0.09 are determined in the end. This section fully demonstrates the entire calculation process of Pst and ΔV10 with average wind speed and grid impedance phase angle as parameters. The pre-evaluated Pst and ΔV10 values can help engineers assess the feasibility of the combination of wind turbine specifications, grid impedance, and average wind speed at the location of the wind turbine. For countries using ΔV10 standard, this is a reliable solution for evaluating the voltage flicker caused by wind turbines.
4. Conclusions
Renewable energy is receiving more and more attention, and the power quality problems caused by renewable energy are also an issue worth investigating. This study presents an enhanced flickermeter to measure the voltage flicker caused by grid-connected wind turbines in accordance with the standard IEC 61400-21-1 (Pst) and the standard CRIEPI (ΔV10), so that countries using the ΔV10 standard can also evaluate the flicker emission by wind turbines based on the ΔV10 standard. In this work, given the wind turbine specification, grid apparent power and grid impedance, and wind speed data, the voltage flicker by wind turbines can be pre-determined in terms of Pst and ΔV10. Therefore, the proposed system can help engineers in the countries using ΔV10 to adopt the IEC standard during the transition period. During the measurement, the proposed system can distinguish the flicker coefficient c(ψk,va) with different grid impedance phase angles and wind speeds. It can be seen from the experimental results that a higher wind speed will lead to the worst flicker coefficient, and a lower grid impedance phase angle will result in a greater severity of flicker.
In addition, the greater the wind speed, the greater the deviation of the flicker coefficient. The deviation is caused by the harmonics and inter-harmonics existing in the fictitious grid, so the measurement accuracy might be slightly reduced. The solution to this problem is to increase the filter operation in the flickermeter input. The proposed measurement system is successfully implemented using MATLAB, and can output Pst and ΔV10 values according to the engineer’s needs. It can provide wind turbine companies with a quick pre-evaluation of voltage flicker to comply with the certification process before installing the wind turbines. Moreover, the pre-assessment results can be used to confirm the specifications of installing a voltage stabilizer for wind turbines, or to assess the appropriate location of the grid connected to the wind turbine for less voltage flicker caused. Another renewable energy, photovoltaic panels, is also an unstable power source that might cause voltage flicker. The voltage flicker produced by the mixing of photovoltaic panels and wind turbines is worthy of discussion in future work.
Author Contributions
C.-S.W.; methodology, C.-S.W.; software, W.-R.Y. and Y.-C.H.; validation, C.-S.W. and W.-R.Y.; formal analysis, Y.-C.H.; investigation, C.-S.W.; resources, W.-R.Y.; data curation, W.-R.Y.; writing—original draft preparation, C.-S.W.; visualization, C.-S.W.; supervision, C.-S.W.; project administration, C.-S.W.; funding acquisition, C.-S.W. All authors have read and agreed to the published version of the manuscript.
Funding
This research was funded by Ministry of Science and Technology, Taiwan, grant number 105-2221-E-018-009.
Conflicts of Interest
The authors declare no conflict of interest.
References
- Duga, R.C.; McGranaghan, M.F.; Santoso, S.; Beaty, H.W. Electrical Power Systems Quality, 2nd ed.; McGraw-Hill Education: New York, NY, USA, 2004. [Google Scholar]
- Liu, Y.-J.; Lan, P.-H. Power Quality Assessments of A Commercial Grid-Connected Small Wind Turbine Product. In Proceedings of the 2016 IEEE 5th Global Conference on Consumer Electronics, Kyoto, Japan, 11–14 October 2016; pp. 1–4. [Google Scholar]
- IEC (International Electrotechnical Commission). Wind Turbines Generator Systems—Part 21: Measurement and Assessment of Power Quality Characteristics of Grid Connected Wind Turbines, 2nd ed.; IEC-61400-21; IEC: Geneva, Switzerland, 2008. [Google Scholar]
- Redondo, K.; Gutierrez, J.J.; Saiz, P.; Leturiondo, L.A.; Azcarate, I.; Lazkano, A. Accurate Differentiation for Improving the Flicker Measurement in Wind Turbines. IEEE Trans. Power Deliv. 2016, 32, 88–96. [Google Scholar] [CrossRef]
- Redondo, K.; Lazkano, A.; Saiz, P.; Gutierrez, J.J.; Leturiondo, L.; Azkárate, I. Effects of Digital Differentiation on Flicker Measurements in Wind Turbines. In Proceedings of the 2014 16th International Conference on Harmonics and Quality of Power (ICHQP), Bucharest, Romania, 25–28 May 2014; pp. 263–267. [Google Scholar]
- Lazkano, A.; Redondo, K.; Gutierrez, J.J.; Saiz, P.; Leturiondo, L.A.; Azkarate, I. Revision of the Standard Method for Statistical Evaluation of Flicker Coefficients in Wind Turbines. In Proceedings of the 2014 16th International Conference on Harmonics and Quality of Power (ICHQP), Bucharest, Romania, 25–28 May 2014; pp. 258–262. [Google Scholar]
- IEC (International Electrotechnical Commission). Electromagnetic Compatibility (EMC)—Part 4: Testing and Measurements Techniques—Section 15: Flickermeter—Functional and Design Specifications, 2nd ed.; IEC-61000-4-15; IEC: Geneva, Switzerland, 2010. [Google Scholar]
- IEC (International Electrotechnical Commission). IEC 61400-21-1:2019 Wind Energy Generation Systems—Part 21-1: Measurement and Assessment of Electrical Characteristics—Wind Turbines; IEC: Geneva, Switzerland, 2019. [Google Scholar]
- Gutierrez, J.J.; Ruiz, J.; Leturiondo, L.A.; Lazkano, A. Flicker Measurement System for Wind Turbine Certification. IEEE Trans. Instrum. Meas. 2008, 57, 375–382. [Google Scholar] [CrossRef]
- Barahona, B.; Sørensen, P.E.; Christensen, L.; Sorensen, T.; Nielsen, H.K.; Larsén, X.G. Validation of the Standard Method for Assessing Flicker from Wind Turbines. IEEE Trans. Energy Convers. 2010, 26, 373–378. [Google Scholar] [CrossRef] [Green Version]
- Li, D.; Li, B. Improved Design for the Testing Circuit of Wind Turbines Voltage Flicker. In Proceedings of the 2013 International Conference on Computational and Information Sciences, Shiyang, China, 21–23 June 2013; pp. 1099–1102. [Google Scholar]
- Khan, N.; Farooq, U.; Wang, X.; Helle, L.; Davari, P. Evaluation of Flicker Measurement in Grid-Connected Wind Turbine. In Proceedings of the 2018 IEEE PES Asia-Pacific Power and Energy Engineering Conference (APPEEC), Kota Kinabalu, Malaysia, 7–10 October 2018; pp. 633–639. [Google Scholar]
- CRIEPI (Central Research Institute of the Electric Power Industry). New Trend in Supply Problems of Arc Furnace for Steel Plants. Tech. Rep. Electr. Eng. Soc. 1978, 2, 3–26. [Google Scholar]
- Wiczyński, G. Model of ΔV10-meter signal chain for periodic voltage fluctuation. Measurement 2016, 93, 224–231. [Google Scholar] [CrossRef]
- Gherasim, C.; Croes, T.; Keybus, J.V.D.; Driesen, J.; Belmans, R. Development of a flickermeter for grid connected wind turbines using a DSP based prototyping system. IEEE Trans. Instrum. Meas. 2006, 55, 550–556. [Google Scholar] [CrossRef]
- Redondo, K.; Gutierrez, J.; Saiz, P.; Azcarate, I.; Leturiondo, L.; Lazkano, A. A proposal for verification tests for the flicker measurement procedure of grid-connected wind turbines. Measurement 2017, 95, 116–127. [Google Scholar] [CrossRef]
- Redondo, K.; Gutiérrez, J.J.; Azcarate, I.; Saiz, P.; Leturiondo, L.A.; De Gauna, S.R. Experimental Study of the Summation of Flicker Caused by Wind Turbines. Energies 2019, 12, 2404. [Google Scholar] [CrossRef] [Green Version]
- Manas, J.; Bilik, P. The Analyser of the Impact of Renewable Resources on the Flicker Level in the Distribution System. In Proceedings of the 2014 ELEKTRO, Rajecké Teplice, Slovakia, 19–20 May 2014. [Google Scholar] [CrossRef]
- Wang, C.-S. A method for determining the IEC flickermeter correction factor-applied to 110 V/60 Hz Taiwan power system. J. Chin. Inst. Eng. 2017, 40, 141–145. [Google Scholar] [CrossRef]
- Dimchev, V.; Kokolanski, Z.; Srbinovska, M.; Denić, D.; Simic, M. Low Cost Virtual Flickermeter. In Proceedings of the 2012 IEEE International Instrumentation and Measurement Technology Conference Proceedings, Graz, Austria, 13–16 May 2012. [Google Scholar]
- Celik, A.N. A statistical analysis of wind power density based on the Weibull and Rayleigh models at the southern region of Turkey. Renew. Energy 2004, 29, 593–604. [Google Scholar] [CrossRef]
Figure 1.
The proposed research methodology.

Figure 2.
A grid-connected DFIG wind turbine model.

Figure 3.
The proposed modification of IEC 61400-21-1 algorithm suitable for Pst and ΔV10 modes.

Figure 4.
Equivalent circuit of the fictitious grid.

Figure 5.
Flicker sensitivity coefficient curve of the ΔV10 method.

Figure 6.
The sampled current data from a wind turbine terminal.

Figure 7.
The flicker coefficient c(Ψk) as a function of wind speed at Ψk = 30°.

Figure 8.
Pst values for different grid impedance phase angles and wind speeds.

Figure 9.
ΔV10 values for different grid impedance phase angles and wind speeds.


Table 1.
Parameters of the DFIG wind turbine and their values.
| Parameters | Values |
|---|---|
| Wind speed sampling rate | 1 S/s |
| Sampling rate of wind turbine terminal voltage um and current im | 2 kS/s |
| Wind speed range | 3–15 m/s |
| DFIG rated active power | 2 MW |
| Distribution system | 1.4 kV |
Table 2.
Number of current and voltage test data to be captured.
| 3 ϕ | Wind Speed Bin (m/s) | Number of 10 Min Data | |
|---|---|---|---|
| current im(t) voltage um(t) | R | 3–<4 | at least 5 sets |
| 4–<5 | at least 5 sets | ||
| …. | …. | ||
| 14–<15 | at least 5 sets | ||
| S | 3–<4 | at least 5 sets | |
| 4–<5 | at least 5 sets | ||
| …. | …. | ||
| 14–<15 | at least 5 sets | ||
| T | 3–<4 | at least 5 sets | |
| 4–<5 | at least 5 sets | ||
| …. | …. | ||
| 14–<15 | at least 5 sets |
Table 3.
Symbols used in the text and their meanings.
| Symbols | Meaning |
|---|---|
| Pst | Short-time flicker severity |
| Pst,fic | Pst in fictitious grid |
| ΔV10 | Equivalent 10 Hz voltage flicker severity |
| im(t) | Captured current |
| um(t) | Captured voltage |
| ufic(t) | Transferred voltage in fictitious grid |
| Rfic | Equivalent resistor in fictitious grid |
| Lfic | Equivalent inductor in fictitious grid |
| Un | rms value of the nominal voltage |
| αm(t) | Fundamental phase angle of um(t) |
| ψk | Grid impedance phase angle |
| fg | Nominal frequency |
| c(ψk) | Flicker coefficient |
| Sn | Rated apparent power of a wind turbine |
| Sk,fic | Short-circuit apparent power of the fictitious grid |
| va | Annual average wind speed |
| wi | Weighting factor for the ith wind speed bin |
| Pr | Weighted accumulated distribution |
| Sn,i | Rated apparent power of the ith wind turbine |
Table 4.
Parameters of The Wind Turbine and Fictitious Grid.
| Rfic | 4.5 Ω | Sn | 2 MW |
| Lfic | 0.007 H | Sk | 90 MW |
| Sk,fic | 100 MW | Un | 22.8 kV |
| Ψk | 30°, 50°, 70°, 85o | va | 6, 7.5, 8.5, 10 m/s |
Table 5.
Weighted flicker coefficients for different wind speeds and grid impedance phase angle in the Pst model.
Table 5.
Weighted flicker coefficients for different wind speeds and grid impedance phase angle in the Pst model.
| ψk (°) | 30 | 50 | 70 | 85 |
|---|---|---|---|---|
| Va (m/s) | C (ψk,va) in the Pst model | |||
| 6 | 10.47 | 9.26 | 7.77 | 6.04 |
| 7.5 | 11.59 | 10.25 | 8.60 | 6.69 |
| 8.5 | 11.66 | 10.31 | 8.65 | 6.73 |
| 10 | 11.93 | 10.55 | 8.85 | 6.89 |
Table 6.
Weighted flicker coefficients for different wind speeds and grid impedance phase angle in the ΔV10 model.
Table 6.
Weighted flicker coefficients for different wind speeds and grid impedance phase angle in the ΔV10 model.
| ψk (°) | 30 | 50 | 70 | 85 |
|---|---|---|---|---|
| Va (m/s) | C (ψk,va) in the ΔV10 model | |||
| 6 | 4.14 | 3.11 | 1.63 | 0.42 |
| 7.5 | 4.33 | 3.21 | 1.71 | 0.44 |
| 8.5 | 4.50 | 3.34 | 1.78 | 0.45 |
| 10 | 4.63 | 3.44 | 1.83 | 0.47 |
Table 7.
The acceptable ΔV10 values.
| Voltage Flicker Limits ΔV10 (%) | |
|---|---|
| France, Italy | Max. < 0.3 |
| Japan | Max. < 0.45, Avg. < 0.32 |
| Taiwan | Max. < 0.45 |
| Brazil, Argentina, Iran | Max. < 0.5 |
Publisher’s Note: MDPI stays neutral with regard to jurisdictional claims in published maps and institutional affiliations. |
© 2021 by the authors. Licensee MDPI, Basel, Switzerland. This article is an open access article distributed under the terms and conditions of the Creative Commons Attribution (CC BY) license (https://creativecommons.org/licenses/by/4.0/).
Share and Cite
MDPI and ACS Style
Wang, C.-S.; Yang, W.-R.; Hsu, Y.-C. Enhancement of the Flickermeter for Grid-Connected Wind Turbines. Energies 2021, 14, 5734. https://0-doi-org.brum.beds.ac.uk/10.3390/en14185734
AMA Style
Wang C-S, Yang W-R, Hsu Y-C. Enhancement of the Flickermeter for Grid-Connected Wind Turbines. Energies. 2021; 14(18):5734. https://0-doi-org.brum.beds.ac.uk/10.3390/en14185734
Chicago/Turabian StyleWang, Chau-Shing, Wen-Ren Yang, and Yi-Cheng Hsu. 2021. "Enhancement of the Flickermeter for Grid-Connected Wind Turbines" Energies 14, no. 18: 5734. https://0-doi-org.brum.beds.ac.uk/10.3390/en14185734
Note that from the first issue of 2016, this journal uses article numbers instead of page numbers. See further details here.