Article

Modelling to Lower Energy Consumption in a Large WWTP in China While Optimising Nitrogen Removal

1
Department for Water, Environment, Construction and Safety, Magdeburg-Stendal University of Applied Sciences, Breitscheidstr. 2, 39114 Magdeburg, Germany
2
Institute Water Infrastructure Resources, Technical University of Kaiserslautern (TUK), Paul-Ehrlich-Str. 14, 67663 Kaiserslautern, Germany
*
Author to whom correspondence should be addressed.
Submission received: 19 August 2021 / Revised: 6 September 2021 / Accepted: 10 September 2021 / Published: 15 September 2021
(This article belongs to the Special Issue Contributions of WWTPs to the Clean Energy Transition)

Abstract

:
In the last decade, China has sharply tightened the monitoring values for wastewater treatment plants (WWTPs). In some regions with sensitive discharge water bodies, the values (24 h composite sample) must be 1.5 mg/L for NH4-N and 10 mg/L for total nitrogen since 2021. Even with the previously less strict monitoring values, around 50% of the wastewater treatment plants in China were permanently unable to comply with the nitrogen monitoring values. Due to the rapid changes on-site to meet the threshold values and the strong relation to energy-intensive aeration strategies to sufficiently remove nitrogen, WWTPs do not always work energy-efficiently. A Chinese WWTP (450,000 Population equivalents or PE) with upstream denitrification, a tertiary treatment stage for phosphorus removal and disinfection, and aerobic sludge stabilisation was modelled in order to test various concepts for operation optimisation to lower energy consumption while meeting and undercutting effluent requirements. Following a comprehensive analysis of operating data, the WWTP was modelled and calibrated. Based on the calibrated model, various approaches for optimising nitrogen elimination were tested, including operational and automation strategies for aeration control. After several tests, a combination of strategies (i.e., partial by-pass of primary clarifiers, NH4-N based control, increase in the denitrification capacity, intermittent denitrification) reduced the air demand by up to 24% and at the same time significantly improved compliance with the monitoring values (up to 80% less norm non-compliances). By incorporating the impact of the strategies on related processes, like the bypass of primary settling tanks, energy consumption could be reduced by almost 25%. Many of the elaborated strategies can be transferred to WWTPs with similar boundary conditions and strict effluent values worldwide.

Graphical Abstract

1. Introduction

1.1. Energy Consumption and Energy Efficiency in WWTP

WWTPs are a significant energy consumer, with electricity representing one of the major operational costs in most WWTPs around the world [1]. For example, in a study of Austrian WWTPs, the electricity costs represented around 11% and 17% of the total operating costs, the second largest costs, after personnel, in WWTP < 100,000 PE [2]. Another study in Brazil estimates that the energy represents 11–31% of the total operational costs in WWTP with activated sludge and nutrient removal [3]. In other countries, where personnel costs are lower and/or electricity prices are higher, the electricity share can be even higher. According to data extracted from a benchmarking study of the IBNET Database of the World Bank, it has been estimated to be as high as 40% in Bangladesh or 55% in Iraq [4].
It is estimated that WWTPs represent about 1–3% of the overall energy use of a country [5]; in Europe, the overall electricity use of WWTPs > 2000 PE, is about 0.8% of the total electricity consumption in the EU-28 [6]. Furthermore, in practice, the energy demand is inversely proportional to the treatment capacity of the plant, for capacities below approximately 38,000 m3/d or 190,000 PE—for 200 L/(PE·d) [1]. This is also observed in Europe, where plants smaller than 50,000 PE represent almost 90% of the total number of plants, but process only 31% of the PE and require 42% of the electricity use [6].
The energy consumption of WWTPs with conventional activated sludge is estimated to be in a range between 0.27 and 1.89 kWh/m3, depending on the country and for A2/O 0.267 kWh/m3 [7]. However, this value is an oversimplification, as diverse factors directly impact the energy consumption, such as the type of treatment processes (with or without primary treatment, type of biological treatment step, type of sludge treatment, etc.), the treatment target (i.e., COD removal, nitrogen and phosphorous removal), the norm to comply (dependant on the local regulations or and/or water bodies to discharge), influent load and the topography of the catchment area, among others.
In recent years, internal energy consumption in WWTPs seems to be on the rise due to the modernisation and adaptation of processes to meet the increasingly stringent effluent discharge standards that apply in a growing number of countries [1]. This is has been observed in China, where the effluent discharge standards have been tightened in recent years [8].
The biological treatment, and more specifically aeration, is usually the main energy consumer in a WWTP, with a share between ca. 50 and 70%, as observed in studies from different countries (see Figure 1). This consume is commonly followed by pumping and or sludge treatment processes. Therefore, in optimisation studies, these are usually the first consumers to pay attention to.
In the biological stage, the main consumption is usually aeration [5,9,11,14,15], but mixing and recirculation [15] are also significant consumers. In the treatment of sludge, dewatering is commonly identified as one of the largest consumers [11].
The aeration system in a WWTP generally offers many optimisation opportunities. On one hand, an adequate air distribution in the aeration tank, with a surface-covering aeration that avoids anoxic pockets or dead zones should be assured. On the other hand, excess aeration can have negative consequences for the denitrification (anoxic) stage [16].
To adjust the current air requirements in the individual tank zones, numerous measuring instruments, fittings and controllers are required [17]. The incorporation of the adequate instrumentation, control and automation (ICA) strategies, with adequate online measurements and regular maintenance is key, because the air delivery can be tailored to the system requirements at different points in time, while assuring effluent quality. The incorporation of ammonium and or nitrate sensors to the aeration control loop shows significant advantages in the air requirement [18,19]. Computer simulation is a useful tool to test different ICA approaches [20,21].
Upstream denitrification is one of the preferred configurations for WWTPs with activated sludge systems for nitrogen removal. However, alternative configurations, such as intermittent denitrification or simultaneous nitrification/denitrification, present advantages in WWTP with simultaneous aerobic sludge stabilisation; the higher activated sludge volume and solids retention time (SRT) are advantageous in the case of highly variable influent loads [17].
The power reduction for mixing in anoxic and anaerobic tanks can offer not only advantages for the energy efficiency, but also to the process efficiency, as reduced surface turbulence minimises the transfer of oxygen to the sludge liquor [5].

1.2. Overview of the Wastewater Situation in China

China is one of the fastest growing economies worldwide and has undergone an unparalleled process of accelerated urbanisation and industrialisation [22]. However, its rapid economic development and population growth has brought on many challenges, including high inequality and challenges to environmental sustainability [23]. This rapid industrial expansion has also implied an enormous exploitation of natural resources and a general degradation of environmental quality [24].
China’s rapid economic growth also surpassed the speed of institutional development, which is why the country is addressing important institutional and reform gaps to move towards more sustainable growth [23].
The most recent 14th Five-Year Plan (2021‒2025) has a focus on the “new progress of ecological civilisation” and includes several energy and climate indicators, such as a reduction in energy consumption and CO2 emissions per unit of GDP, an increment in the days with good air quality and an increase in surface water quality and an aim to ensure that 85% of surface water has a quality class III or superior by 2025 [25].
This is also reflected in the recently enforced stricter norms for treated wastewater quality [26]. The main parameters of the standard GB 18918-2002, which is currently officially valid, are presented in Table 1 Moreover, a consultation draft was released in 2015 to update the standard for stricter values, especially for N and P. This gives an insight into the coming years and has already been incorporated into many regional regulations. For example, in some regions discharging in the Tai Hu basin, the city standard (CS) is applied from 2021.
Chinese discharge standards are divided into four stages, which differ depending on not only the treated wastewater volume but also on the regional situation, the purpose of water reuse and the receiving waterbody. China applies the 24-h composite samples, which are mixtures of samples that are taken at least once every 2 h.
Unfortunately, according to Zhang et al. about 50% of wastewater treatment plants in China do not meet the monitoring values for nitrogen and about 90% of wastewater treatment plants have problems with nutrient removal [8]. A significant fraction of WWTPs experience difficulties in meeting increasingly strict effluent discharge standards, taking into account that the number of WWTPs required to meet Grade I-A and Grade I-B standards increased to 90% in 2018 [27].
As a result of the update to China’s policies, in the last three decades, the number of WWTPs in China has grown enormously, as observed in Figure 2. Most plants are concentrated in the largest urban agglomerations. Moreover, as China continues increasing its standards for wastewater treatment, WWTPs must follow this accelerated pace, challenging their adaptation capacity and generating sometimes unsustainable coping mechanisms.
Approximately 75% of the WWTPs in China correspond to medium size plants, treating 1000–10,000 m3/d [29]. In China, the most dominant process in the WWTPs is the activated sludge process in different variations. The processes mainly used are the A2/O process (anaerobic–anoxic–aerobic) and oxidation ditch, which accounted for 31% and 21% of the WWTPs in 2013 [29].
Step-by-step monitoring facilities have been increasingly applied in modern WWTPs, but until now the operation often lacks a reliable strategical process control. Therefore, in many cases, treatment processes can be improved in order to run more stably and to reduce highly fluctuating effluent quality.
In China, a study has shown that the energy consumption of different plant sizes differs greatly, in that it averages 27 kWh/(PE·a) at the treatment plants up to a size of 50,000 PE. For plants with more than 100,000 PE, the specific energy consumption decreases to an average of about 16 kWh/(PE·a) [30]. Increasing energy demand for wastewater treatment, increasing energy prices and higher standards for the discharge of treated sewage are drivers towards more efficient treatment systems.

1.3. Modelling as a Tool for Operational Optimisation and Energy Efficiency

The modelling of activated sludge processes became a common part of the design and operation of wastewater treatment plants in the early 2000 [31]. Models and simulation can be used as cost-effective tools to support decision-making processes, sustained with data and analysis, backing up the first steps for implementing change. The dynamic simulation of wastewater treatment plants has been used in many studies worldwide as an instrument to increase the knowledge of the process and system behaviour [32,33], for optimisation studies [34], for training and teaching and for model-based process control [35,36]. SIMBA® is a simulation system that allows the holistic consideration of sewer system, wastewater treatment plant, sludge treatment and rivers. The software can be applied for a large variety of tasks in engineering practice, research and education [37]. The software has been widely used, especially in the German-speaking community, for water systems modelling, e.g., in [38,39,40] to demonstrate adequate performance, for studies to improve operation (costs, critical situations), as well as for the planning and dimensioning of WWTPs [41].
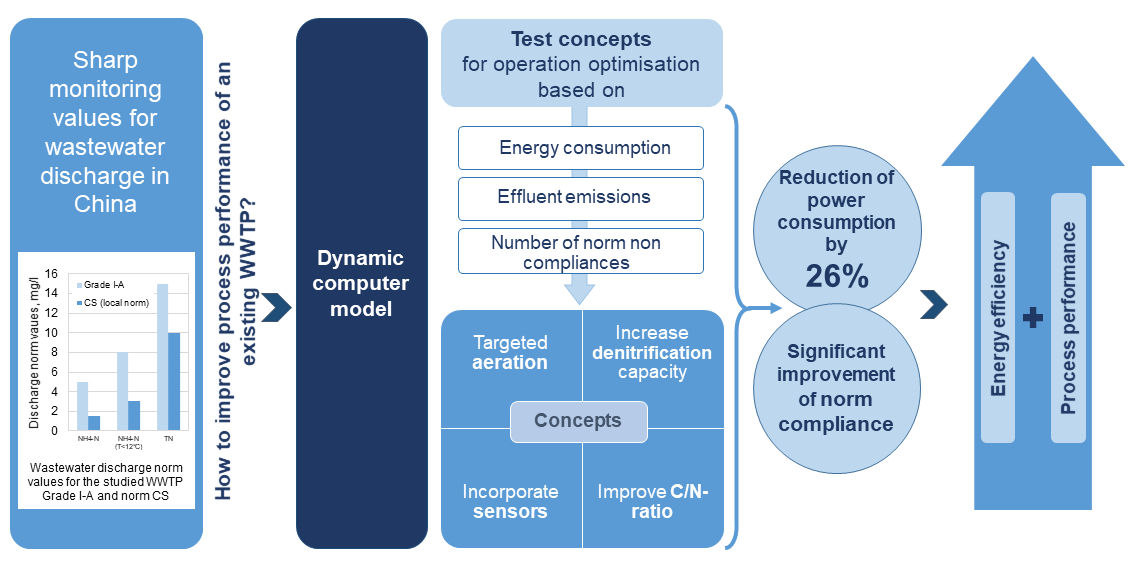
In this context, and with the use of modelling as a tool, China has the opportunity to adapt its wastewater treatment for future challenges, reducing its pollutant emissions to water bodies by applying an energy and resource-efficient approach to WWTPs and increasing its treatment standards.

2. Materials and Methods

To identify the most energy consuming treatment steps in the model WWTP, the energy consumption of the equipment provided by the operator was estimated and compared to optimal values. The results of this energy analysis regarding the main consumers were then used for targeted improvement strategy definition.
To find and test the potential effects of different simple operational and automation strategies in nitrogen removal and energy consumption, the WWTP was modelled in the SIMBA software. The objective was to check if these strategies contribute to increasing the norm compliance without requiring additional post-treatment stages, and to achieve overall energy savings.
The first step was to carry out a thorough analysis of the plant data, focused on treatment performance (especially in the activated sludge process) and the energy balance. Then, a computer model could be created, following the guidelines provided by the Hochschulgruppe Simulation (HSG) [36].
After obtaining a well calibrated model, different optimisation strategies were tested. The tested strategies were based on the authors’ experience in other WWTPs and were tested starting from the simplest measures to more complex ones, and then a combination of several single strategies. The obtained results could then be compared in terms of the number of norm non-compliances in a year, pollutants emissions load and estimated energy consumption.

2.1. Wastewater Treatment Plant Description

The example WWTP has a size of ca. 450,000 PECOD (calculated with the 85%-percentile for the COD load between 2017 and 2018 and 120 g COD/(PE·d)) or ca. 120,000 m³/d, and it is located in the Tai Hu catchment; it treats mostly municipal wastewater and a small fraction (around 10–20%) of industrial wastewater from the food industry, and has a traditional mechanical-biological treatment with simultaneous aerobic sludge stabilisation. The WWTP has a mechanical pre-treatment with screens, an aerated grit chamber and primary settling, as described in Figure 3.
Its biological treatment step is activated sludge type A2/O and it carries out tertiary treatment for chemical phosphorous elimination. The treated wastewater is filtrated and disinfected with UV-light before discharge. The sewage sludge is thickened, dewatered and then transported for disposal. The disposal route is typically incineration in a thermal power plant, but disposal in landfill is also an option. The example WWTP possesses only few online measurements and must rely heavily on manual measurements and on the operators’ experience.
The plant was designed to comply with the Grade 1-A standard (GB18918-2002) effluent parameters (see Table 1). However, in recent years, over-urbanisation and industrialisation have seriously compromised the water quality in the Tai Hu Basin area, reaching a state of extremely serious water pollution [42]. Therefore, according to the national authorities, the Tai Hu basin, as a sensitive water body, has to achieve quality level III according to the Environmental Quality Standards for Surface Water (GB3838-2002) (see Table 1) [42]. This has led to a tightening of the regulations in the catchment area, enforcing provincial and city regulatory standards stricter than the national regulations. For the studied WWTP, the new regulation “City standard” (CS) was enforced as of 2021. In order to comply with the new, stricter norms, in 2020, the WWTP began upgrading measurements, including an additional internal recirculation to increase its denitrification capacity and a downstream denitrification filter.
Due to the combined sewer system, the influent flow to the WWTP is strongly influenced by rain. The maximum design flow of the plant is frequently surpassed during peak periods, leading to a hydraulic overload, observed in the secondary clarifiers with frequent surface feeding velocities above 1.6 m/h. The COD/BOD ratio variates in the influent of the WWTP between 2 and 4 (2.75 on average), an indication of a moderately biodegradable influent. The inflow COD/TN ratio is variable, with values below the desired minimum ratio for denitrification of 100:10 approximately half of the time. Denitrification requires easily biodegradable carbon sources for the heterotrophic microorganisms that reduce nitrate, which in the case of upstream denitrification are provided by the raw wastewater. An inconvenient C/N ratio can lead to the need for external carbon sources as sodium acetate or methanol, increasing the operational costs. The hydraulic retention time (HRT) in the primary clarification stage is around 2.5 h, which could contribute to an excessive COD removal and poorer denitrification performance, with an already often-unfavourable C/N ratio in the influent. The influence of the HRT in the primary clarifiers on the C to N ratio is described in German standards and is shown in Table 2. As observed in the table, an increment in the HRT in the primary settling tanks (PST) reduces the C/N ratio, as is the case in the WWTP.
The biological tank has a volume of ca. 100,000 m3 (VAT) and it is distributed as Anaerobic: Anoxic: Aerobic (VA:VD:VN) = 1:1:4. This results in an anoxic volume of ca. 17% with respect to the total biological treatment volume (VD/VAT), which is lower than the recommended 20 to 60% [43]. The anoxic tanks have 48 submersible stirrers of the company Flygt. The internal recirculation is performed by 12 pumps (8 in operation + 4 as reserve) of the same brand, with a capacity of 2400 m3/h each. The dissolved oxygen set point in the aeration tanks (DO) is between 2 and 3 mg O2/L. The air is provided by 8 blowers (6 in operation + 2 as reserve) of the companies Siemens and Turbo (Korea), delivering a maximum air flow of 135 m3/min each.
The sludge concentration in the biological tanks (Mixed Liquor Suspended Solids, MLSS) fluctuates between 4000 and 8000 g/m3, reaching its lowest values in late summer. The sludge is recirculated by four Flygt pumps with a capacity of 2000 m3/h each. The activated sludge stage is designed for a SRT (or sludge age) between 15 and 20 days. After a detailed analysis of the sludge production, the calculated SRT is on average ca. 38 days, and it fluctuates strongly.

2.2. Energy Check and Analysis

The energy check and energy analysis of the example WWTP was conducted based on the German Work Sheet DWA-A 216 [44]. To get a quick overview of its energy consumption, the most important characteristic values of the example WWTP (e.g., the total annual energy consumption) were collected and compared to a reference group (i.e., similar plant size and technology) to show an approximate energy savings potential. This energy check can be conducted by the plant operator and should be performed on a regular basis to help classify its energy consumption, estimate its energy saving potentials and react to changes in energy consumption in an early stage. Usually, with the worksheet DWA-A 216, the rough comparison is done with values for the undercutting probability. The closer the comparison group resembles the WWTP, the better the comparison quality is, but since data are often scarce, averages over other WWTPs can also be sufficient.
Compared to the energy check, the energy analysis is a more profound process that compares the energy consumption of the used equipment with calculated plant-specific ideal values of this equipment. The goal is to find concrete energy efficiency deficits and to then define the most relevant measurements to get closer to the minimal energy consumption of the plant. The ideal values can be extracted from technical guidelines and can be adapted according to plant size and operation type.
The values needed for the energy check and the energy analysis in this paper were transmitted by the plant management. The electrical energy consumption of the equipment is not measured separately by the plant operator, which is why the energy consumption by equipment had to be calculated by its power consumption and the operation time per year. Due to the COVID19-pandemic, control measurements could not be conducted, but it is recommended to confirm the actual energy consumption to achieve more detailed measurements.
Energy required for aeration: As SIMBA hands out the aeration volume in Nm³/d, the energy consumption for aeration must be calculated via Equations (1) and (2) [44,45]:
E = SOTR t SAE = Q L , N 3 SSOTE h D t 1000 SAE
Q L , N = 1000 SOTR 3 SSOTE h D
where:
E = Energy consumption, kWh/d
SOTR = Standard oxygen transfer ratio, kg O2/d
QL,N = aeration volume, Nm³/d
SAE = Standard aeration efficiency, kg O2/kWh
SSOTE = Standard oxygen transfer efficiency, %/m
hD = depth of diffusers in basin, m
t = daily operation time of blowers, h
The assumptions for the calculations can be found in Table 3.

2.3. Simulation Model

The WWTP was modelled with information provided by the operator and observations carried out during a plant visit in 2019. The example WWTP was built using a system based on the well-known Activated Sludge Model No. 3 (ASM3) [31] with modifications and parameters following the recommendations by the HSG research group. The system calculates simulation results in accordance to the German design guideline DWA-A 131, as presented in [46]. The system also includes phosphorous precipitation by the addition of ferric salts.
To carry out the modelling, the guidelines provided by the HSG group [36] were followed. The first step was the definition of the objectives of the study and its boundaries, followed by the collection of information on the plant’s layout, operation and performance. With this data, a preliminary model for the WWTP under study was carried out. After that, the quality of the plant data was verified using mass balances, as the third step [47].
A pre-simulation using a steady state model was performed and the results were compared with average plant data. In addition, a sensitivity analysis was performed to determine the parameters with most influence on the simulation results [36] This corresponds to the fourth step.
The next phase (fifth step), data collection for simulation study, aimed to close the data gaps found in previous stages. During the sixth phase, the dynamic calibration of the model and validation were performed. The calibration is an iterative process, and the success of the model calibration was judged visually, considering peak and median values of the simulation results [47].
The HSG guidelines also advise to perform model validation, where the calibrated model is verified with an independent set of data [36]. In the final step (seventh step), the calibrated and validated model were used to simulate different scenarios, according to the objectives of the study.

2.3.1. Pre Simulation

In order to test in preliminary form the plausibility of modelling the WWTP in SIMBA, and to build the basic model structure and choose the corresponding blocks, a model with average values (steady state model) was built. After the evaluation of the plant performance and operation, a preliminary model, with average values, was built in SIMBA version 3.2.26 (see Figure 4). This also allowed us to carry out a sensitivity analysis and identify the parameters with higher relevance in the results.
The influent is described as four vectors: COD, to calculate the organic load in g COD/m3; TKN, to calculate the nitrogen load in g N/m3; P, to calculate the phosphorous load and the flowrate in m3/d. The sludge production in the steady state model is based on the measured average primary sludge concentration and a target sludge age of 21 days. The internal sludge recirculation was set on 100% of the average influent flowrate, and the internal water recirculation was set on 300%. The DO set point is 3 mg/L, as the measured average on the aeration basins. The influent COD and TSS fractionation selected values are standard values and are summarized in Table 4.
A sensitivity analysis helps to identify which parameters have a larger influence on the effluent values and sludge production, as these are the most relevant parameters for the objectives of this work. To evaluate the sensitivity of the model, the method proposed by van Veldhuizen et al. [48] was followed. The sensitivity, calculated for the following parameters, was analysed based on a 10% increase of the standard values of the following parameters:
  • Distribution of COD in the influent (COD fractionation) over:
    Fraction TSS to COD
    Fraction of non-volatile TSS (fB)
    Fraction of inert soluble COD (fS)
    Fraction of inert COD from particulate COD (fA)
  • Internal flows of sludge and mixed liquor
  • Air flow to the aerobic zone
  • Oxygen set point for the aeration controller
  • Sludge retention time
  • Modification of the reactors hydraulic (one reactor per zone (Anaerobic, anoxic, aerobic), or three per zone)

2.3.2. Model Calibration

Using the information on the plant configuration, the pre-model and the influent WWTP information, a full model was built and calibrated, based on one year of effluent operational data. The model base included the IWA Activated Sludge Model ASM3, including phosphorous precipitation by addition of ferric salts, with modifications and parameters following the recommendations by the researcher group HSG. This model can calculate simulation results in accordance with the German design guideline DWA-A 131.
A one-year period (from now on “Calibration period”) was selected for model calibration, including cold and rainy periods. The main aspects that were modified and that define the model, i.e., those with relevance for the calibration, are listed here:
Primary clarifiers: The volume was distributed in four tanks, and the sludge extraction is controlled by the primary sludge concentration since the measured TSS concentration fluctuates sharply from one day to the other. This approach provided a good fit in terms of primary sludge production volume.
Hydraulic behaviour in activated sludge tanks: Since the real tanks are long and narrow, it was assumed that the tanks behave like a Plug Flow Reactor (PFR). The available reactors in SIMBA are type Continuous Stirred Tank Reactors (CSTR). Therefore, for a better approximation to the PFR behaviour, each section of the tanks (anaerobic, anoxic and aerobic) was modelled as three CSTR in series. The volume of each section of the tank was divided in three reactors of equal size.
DO control and air distribution in the tanks: The set point for the DO concentrations in the aerated tanks is delivered by the average measured DO concentration, informed by the plant operators (between 2 and 3 mg O2/L in the studied period) and controlled in a PI-type controller. There is a single DO online measurement per nitrification tank that controls the air input in the tank and there are no other online measurements incorporated to the aeration control loop. In an attempt to realistically model the DO distribution in the aerated tanks, an air distribution profile was used: 60% for the front section of the tank, 25% for the middle section and 15% for the rear section. Additionally, the maximum capacity of the existent 8 blowers was limited to 40% to 50%. These changes will serve to model an uneven air distribution, the single DO sensor, the PFR-like behaviour and the outdated and/or poorly maintained air diffusers. This configuration delivered a better fit for NH4-N effluent concentrations.
Including temperature variation: The wastewater temperature is estimated based on a brief set of measurements (3 months) outside the calibration and validation periods. As the measured wastewater temperature showed a good correlation with the air temperature in the region—which is predictable on a yearly basis—the wastewater temperature was estimated based on the monthly daily average, and fluctuates between 10 and 24 °C. The ASM3 model has been tested and validated for temperatures between 8 and 23 °C.
Adjustment of the sludge age: To calibrate the model, one of the main parameters to adjust was the sludge age. In this case, it was done by adjusting the MLSS (sludge concentration in the activated sludge tanks). By knowing the target sludge concentration in activated sludge tanks, the excess sludge extraction could be controlled using a PI controller, measuring the TSS after the last aerated tank. To reach the sludge concentrations in the tanks, the sludge volume index (SVI) was adjusted as well.
Limits for different equipment: According to the WWTP description data, several pumps and equipment were dimensioned with their corresponding limitations in the model (e.g., pumps for water and sludge recirculation and aeration). This assures that the model does not surpass the physical limits of the real WWTP.

2.3.3. Model Validation

The model was validated with a 120 day period after the calibration period. This period is considered for validation, since it is different than the one used for calibration, and involves a temperature decrease and winter operation.
In addition, to corroborate the modelled air amount obtained in the model, since there are no measurements of the used air in the example WWTP, the theoretical air consumption calculated according to the DWA-M 229-1 [45] and Metcalf and Eddy [49] was calculated. The modelled air amount is between 27% and 35% higher than the calculated average SOTR over a year period, making the obtained modelled results plausible, but only referential values. It is important to mention, however, that the assumptions to transform the Standard Oxygen Transfer Rate (SOTR) to air flow have a great influence in the final value.

3. Results

3.1. Energy Consumption and Savings Potential

The power consumption ratio was on average 31.40 kWh/(PE·a) (±2.27 kWh/(PE·a)) between 2017 and 2019 and increased along with the stricter treatment requirements. The model WWTP falls into the category of WWTPs > 100,000 PE, and as mentioned in Section 1.1, the average energy consumption for plants with this size is about 16 kWh/(PE·a) [30] to 24 kWh/(PE·a) (calculated with 200 L/(PE·d) for a WWTP with Grade I-A Standard discharge limits) [50]. Therefore, the energy check of the plant shows that there is an optimisation potential, which is substantiated in the following energy analysis.
The energy consumption distribution, described in Figure 5, shows the biological treatment stage, specifically the aeration stage, as the main energy consumer, as it is typical in plants of this type. To better classify the energy consumption of the biological stage, a comparison with calculated design values and reference values was conducted.

3.1.1. Blowers

The calculation of the theoretical air consumption was conducted according to DWA-A 131 [43] and DWA-M 229-1 [45]. The results showed that the blowers should consume between 7.0 kWh/(PE·a) and 9.6 kWh/(PE·a), depending on how favourably the aeration system is designed. Therefore, the energy consumption of the blowers has a potential to be lowered (see Table 5), as will be tested in the simulation model.

3.1.2. Agitators

In the model WWTP, the agitators consume around 5.6% of the power used for the whole wastewater treatment process. Mixing is needed in the non-aerated zones, so that solids stay suspended in the biological reactor. Nevertheless, excessive mixing can lead to an entry of oxygen into the anaerobic and anoxic zones, leading to a negative impact on the nitrogen effluent values. Therefore, excessive mixing only influences the energy consumption of the mixing equipment directly but also has an impact on the energy use for N-elimination.
The redox values in the anaerobic and in the denitrification zones must be observed. Values above −100 mV for the anaerobic zone and above +100 mV in the anoxic zone indicate potentially high DO concentrations in each zone, which might be caused by an excessive aeration in the nitrification zone, or an undesired oxygen input due to intensive stirring.
In the example WWTP, the agitators consume around 5 W/m³ of mixed volume. Considering the large tank sizes, the ideal reduction for the size of the aeration tank would be to approx. 1.5 W/m³ [44]. In this case, a savings potential of approx. 70% can be achieved, if the stirred volume stays the same, leading to a specific energy consumption of 1.14 kWh/(PE·a).
It is important to note that the ideal value of the mixing energy might not be compatible with the geometry of the tanks, so that in practice it might lead to dead zones and sedimentation of sludge in the biological tank. Therefore, if the mixing energy is lowered, the process should be observed closely, to identify negative effects on time.

3.1.3. Recirculation

In the example WWTP, around 300% water and 100% sludge are recirculated to achieve the nitrogen effluent values. The recirculation values are very high and contribute to a decrease in the average concentration of nitrogen-compounds in the effluent. However, the reduction of the HRT in the activated sludge system can lead to an increased process instability and higher peak values in the effluent. With better process and control strategies, the recirculation volume could be adapted, and energy consumption onsite could be reduced further.

3.2. Model Fit and Validation

3.2.1. Pre-Simulation

The results of the steady state model calibration are presented in Figure 6. The static model shows a very good fit for COD (1.2% difference between simulated and measured values) and for ammonium (14.5% difference) and nitrogen (11.5% difference) values in the effluent.
The sensitivity analysis shows that the effluent nitrate (and thus the total nitrogen) concentration is sensitive to changes in the fraction of inert soluble COD, as it represents a reduction in the available COD for denitrification. The effluent COD shows, as expected, a high sensitivity to this parameter as well, since almost all COD in the effluent should be inert and soluble, especially after a filtration stage. Possible offsets of this parameters must be checked when calibrating the dynamic model and adjust accordingly to the effluent COD values to the measured values. Moreover, if possible, these parameters must be evaluated in a representative measurement campaign.

3.2.2. Model Fit

To evaluate the model fit, a simple approach was used. If the simulation values differ from the measured values by less than 15%, the model fit is considered very good. If the difference is greater than 15% and up to 30% the fit is considered good, and if the fit is between 30 and 50%, it is considered medium. This is also supported by a visual evaluation of the representation of the peaks.
After adjusting the MLSS concentration in the activated sludge tanks, the model shows a very good fit for COD (1.3%), NO3-N (7.1%) and TN (14.5%) values, this means, the magnitude and the trend are essentially correct, and there are partial deviations with regard to some peak values (see Figure 7b–d). It is worth noting that before day 120, there are no laboratory measurements for nitrate. The fit of NH4-N is good on average, but the overall fit is medium (45%), as some of the peaks are not adequately modelled, especially in the last phase, after day 150. The fit of the first 150 days is much better, with a 3.9% deviation. This fit was challenging, and the model required several adjustments, as mentioned above.
Several modifications in the aeration configuration were made to adjust the ammonium effluent values, but only a medium fit was obtained. From day 150 onwards, peaks could not be built up at all. There are several reasons for this. It is possible that the ammonium peaks observed in the effluent (see Figure 7d) are caused by mixing problems in the aerated tanks, an effect that cannot be accurately modelled in SIMBA. An uneven aeration and even punctual problems in the analytical procedure at the WWTP—as revealed by some inconsistencies in the nitrogen balance—are also plausible explanations.
This is also supported by the fact that there is a very good fit for total nitrogen and nitrate nitrogen, as can be observed in the general trend, and in the good reproduction of most peaks, an indicator that the kinetic/biological values parameters do not need readjustment, and that the model shortcomings are related to the hydraulic and physical behaviour.
For the objectives of the study, which are to find potential strategies for the improvement of nitrogen removal and energy consumption, a good visual fit between the measured and simulated curves is determined as enough.
For the validation period, the observed fit here is also good for the MLSS, and nitrate and total nitrogen concentrations in the effluent. The calibrated and validated model is considered the baseline scenario (“Base”).

3.3. Optimisation Strategies for Energy Efficient Nitrogen Removal

The tested strategies are detailed here, starting with simple operational modifications and then simple automation strategies. Finally, combinations of single strategies are presented. The summary of the description of specific strategies can be found in Table 6.

3.3.1. Partial or Total By-Pass of Primary Settling Tanks

By bypassing the primary clarification (PST), either partially or totally, reducing the volume and therefore the HRT, the COD removal is reduced, helping to improve the C/N ratio for denitrification. Several tests were carried out reducing the primary clarification volume, putting out of order one tank at a time. With the bypassing of the whole primary clarification the average TN-effluent concentration can be reduced by 6.1%.

3.3.2. Increase of the Denitrification Volume

The plant analysis and the preliminary simulation results show that the aerobic part of the plant works very effectively, reducing COD and ammonium-nitrogen to values well below the norm. Regarding nitrogen removal, the problem seems to be in the denitrification stage. The example WWTP has a small denitrification volume equivalent to approx. 17% of the total activated sludge volume. To modify the denitrification capacity of the plant, the denitrification volume (VD) can be increased.
First, tests increasing this volume (VD) by reducing the nitrification volume (VN) were carried out. The total volume and the anaerobic tank volume were maintained. Then, a combination of the bypass of primary clarifiers and the use of the empty PC volume as denitrification tank were tested.
An increase in the denitrification volume effectively improves the nitrogen effluent values. According to the tests, a proportion of 0.25 VD/VAT is the best option, improving the total nitrogen removal (up to 12.5%), and reducing the number of times the current and future norm is not fulfilled (see strategies S1 and S2 in Figure 8).
Another way to increase the denitrification capacity is to use the volume primary clarifiers (as in strategy C2); this empty volume could be used as a denitrification tank. For this, stirring of the former primary clarifiers and an additional internal recirculation is required. For example, with the bypass of 50% of the primary clarifiers, the denitrification volume can be increased, reaching a total VD/VAT of ca. 22%.

3.3.3. Modification of the Dissolved Oxygen Set Point

The dissolved oxygen (DO) set point (DOsp) was also modified, as 3 mg/L as average is very high in comparison with the typical set points of around 2 mg/L [49]. By maintaining the DOsp in 3 mg/L, only 3.5% less air is required in a year. However, when decreasing the DOsp to 2 mg/L, 20% less air is required in a year (see Figure 11). Both options could improve the current norm compliance, reducing the number of times the norm is not fulfilled in a year (see Figure 8).

3.3.4. NH4-N-Based Aeration Control

The principle of an ammonium-based control of aeration is that the air supply can be adjusted to the amount of ammonium, i.e., very low NH4-N values indicate when most of it has been oxidised. By limiting the ammonium concentration to a maximum of 1.35 mg/L (90% of the maximum value according to the city standard), the TN effluent concentrations are significantly reduced. This is mainly due to a reduction of the aeration, which leads to an increased nitrate removal. This leads also to an important decrease in the number of norm non-compliances (see strategy S3 in Figure 8). The frequent limited DO concentrations provide denitrification-like conditions in the aeration tanks, contributing to an increased denitrification.
However, this strategy, leads to too low DO average concentrations in the nitrification tanks, i.e., below 0.5 mg O2/L, which is not adequate for the operation. In general, a DO below 0.8 mg/L should be avoided, as this increases the risk of the formation of bulking and floating sludge and even to the formation of nitrous oxide [51]. N2O has a global warming potential ca. 300 times greater than CO2. To avoid the aforementioned problems, a limitation for the minimum and maximum DO concentrations (0.8 to 2 mg O2/L) in nitrification tanks was included in strategy S4, but the results were less promising, with a higher number of norm non-compliances.

3.3.5. Intermittent Aeration

Intermittent aeration is the alternation of aerated and anoxic phases in a single tank. As indicated by the DWA 131 (2016), the denitrification phase duration can be set with a timer or adjusted by a control strategy, by the nitrate content, the ammonium content, the change of the redox potential or the oxygen consumption [43]. Here, the duration of the aeration was tested based on time and NH4-N concentration in the effluent of the activated sludge.
Intermittent denitrification based on time: In this model, a pulse block, allows to switch the aeration from zero to the desired set point. Here, the fluctuation time can be set. The fluctuation time was varied, and the best results were obtained with an aeration time of 30% in a 30 min interval (strategy S5).
Intermittent aeration based on NH4-N concentration: The principle of an ammonium-based control of aeration is that very low NH4-N values indicate when most of it has been oxidised, and, therefore, aeration can be stopped to favour denitrification, and enable the system to reduce nitrate (strategy S6). If the NH4-N concentration in the effluent of the activated sludge tanks is larger than the set point, then the aeration is turned on, with a DO set point of 2 mg O2/L. If the ammonium concentration is lower, the aeration is turned off, to reach anoxic conditions for denitrification.

3.3.6. Combination of Strategies

After each strategy was tested individually, different combinations were tested, mixing the strategies with the best results to obtain the top combinations in terms of norm compliance and aeration requirements. The combination strategies are described in Table 6 and named C1, C2 and C3. The grey background color marks the different strategy description for each scenario.

3.4. Comparison of the Different Strategies

Number of norm non-compliances in a year: The tested strategies are compared in terms of the number of non-compliances in a year (see Figure 8). As expected, the best results are obtained with the combinations. All the selected strategies show a significant decrease when compared with the baseline scenario (base), but the combination strategies (C1 to C3) are the best and reduce the non-compliance with the norm from around 30 events per year to around 5 events per year. The COD effluent values are always within the discharge norm and are therefore not shown nor discussed here.
Pollutants emissions load: As can be seen in Figure 9, the strategies including intermittent aeration (S6, C2 and C3) based on the NH4-N effluent values, show lower emissions of nitrogen compounds in a one-year period. This can be explained due to the flexible operation, which responds better to the challenges in the plant, i.e., the limited denitrification capacity of the plant and the variable C/N ratio in the influent values. It is easy to see from the strategies studied that usually either the denitrification or the nitrification is significantly improved. A significantly better denitrification is, therefore, at the expense of a slightly worse nitrification. The difference in COD emissions in the different strategies is negligible.
The average TN, and NH4-N removal rates are shown in Figure 10. The TN average removal rate is improved in all scenarios. The NH4-N trend is more variable. The baseline scenario shows the highest NH4-N removal rate, as here the nitrification capacity is the highest; however, as the denitrification volume is too small in comparison, the effluent total nitrogen values (which are mostly nitrate nitrogen) are higher. Since the WWTP originally had a good capacity to remove NH4-N, the tested strategies aimed at increasing the denitrification capacity. Therefore, there is an improvement in the total nitrogen parameter and not particularly in the NH4-N parameter. However, as can be seen in Figure 8, good and/or better compliance with the discharge standard is preserved for both parameters in all tested scenarios, because peaks are flattened.

3.5. Estimated Energy Consumption

The estimated energy reduction is based on the control volume of the biological stage, including the water line from mechanical treatment to secondary settling tank. Even though aeration is the main consumer in this control volume, the tested strategies also influence other parts in the plant.

3.5.1. Aeration Requirements

Since aeration represents almost 30% of the total energy consumption (see Figure 5), any reduction of air requirements contributes to improvements in the overall energy balance and costs reduction. In all tested strategies, except in C1, the air requirements are reduced (see Figure 11). The highest reduction is obtained with strategy C3, with a reduction in air requirement of approx. 24%. It is worth mentioning, that these are relative values, and are independent of the actual aeration system, as the values obtained in the different scenarios are compared with the (modelled) baseline scenario. This means for example, if we have a favourable (i.e., well designed, well maintained) aeration system, the absolute saving is somewhat lower than it is with an unfavourable aeration system.
The results show that a modification in the proportion of anoxic to total volume (VD/VAT) to increase the anoxic volume (S2), can contribute to save energy and at the same time, improve the effluent values. This is because the aerated volume is reduced—reducing the air requirements—and the denitrification capacity is improved.
It can be observed that the incorporation of an NH4-N measurement to the aeration control loop (S3 and S4) can contribute to reducing the air requirements by more than 7%. The incorporation of better ICA control strategies avoids an excess of aeration, as the air supply is better adjusted to the air demand. This also contributes to improve denitrification, as an excess of DO in the recirculated water can impair the necessary anoxic conditions.
Even though intermittent aeration (S5 and S6) is a strategy that would require more significant changes in the WWTP equipment (i.e., change the aeration elements and automation strategy), and the current tanks configuration and geometry (PFR) is not ideal for this type of nitrogen removal configuration—round tanks are the usual configuration [17]—a flexible operation shows to be an effective way to deal with the sometimes unfavourable conditions for (upstream) denitrification that are common in China.

3.5.2. Combination of Energy Saving of Aeration and Further Equipment

The scenarios may also include bypassing of the primary settling tanks to improve the C:N ratio. If one of the two primary settling tanks (PST) is by-passed, the included equipment is not going to be used, leading to a reduction in energy consumption which can be estimated to be 50% of the original energy consumption of the primary stage. Equipment which consumes energy is in the case of the example WWTP case the sludge rake, the sludge pump, and sludge sieving machines. The equipment can differ in other WWTP.
As explained before in Section 3.1.2, the mixing energy can be assumed to be reduced by 70% as well. If intermittent denitrification could be applied in the whole biological stage, all agitators could be eliminated and full mixing with air could be applied (with pulses during denitrification).
With a change in aeration operation strategies, the need for recirculation mixed liquor should also be adapted, which will have an impact on pumping energy. The possibility of suspending recirculation is particularly interesting for full intermittent denitrification. Because in this study, intermittent aeration is only tested for the aerobic zones, recirculation has not been changed, but is planned for further research.
The modelled combinations C1 to C3 are varied with possible energy reduction in mixing and in the primary settling tank. The results can be seen in Table 7. If the agitators are adapted, the energy consumption of the biological stage from primary to secondary settling tank could be reduced by more than a quarter.
The results obtained in the tested scenarios show a similar trend to the results obtained in by Lozano Avilés et al. [52]. In their simulation, the implementation of a real-time control system, adapted to the current needs of a WWTP in Spain, achieves reductions of over 15% in overall energy consumption, due to the reduction in the aeration requirements and recirculation rates.
Another study, [53], demonstrates as well through energy analysis and a computer simulation, in this case with ASM1, that there is potential for significant reductions in energy consumption in an Italian WWTP as well as improvement of effluent quality through operational changes alone.
The implementation of simple aeration energy conservation measures, according to Zvimba and Musvoto [54], can lead to large energy savings up to 50%, as demonstrated in simulation studies from a South African WWTP.

4. Conclusions

Modelling is a powerful tool to test optimisation strategies at a low cost. The prerequisite is to have a well calibrated model for the study objectives. Moreover, the quality of the models and simulations results depends heavily on the quality and availability of real data. By analysing the plant and the associated equipment energy-wise in advance, the strategy development can be more target-oriented. In accordance with the model calibration, which has a mostly good and sometimes medium fit for the studied parameters, the statements and the results of the tested strategies are to be understood more as a relative comparison and less as absolutely precise results.
According to the simulations, simple automation and operational strategies can serve to reduce the energy consumption and simultaneously improve the discharge values and norm compliance. In the pre-treatment and biological treatment stages, sometimes small changes in operating and automation strategies can contribute to large savings in energy and resource consumption; for example, the reduction of the DO set point, the bypass of primary clarifiers or the reduction of the aerated volume or the incorporation of ammonium sensors to the aeration control loop.
The transfer and adaptation of the proposed optimisation strategies requires thorough knowledge of the water treatment process.
As expected, the studied scenarios with a combination of strategies show better results in all analysed categories: norm compliances, emissions and energy consumption. In general, the strategies that allow for system flexibility, i.e., intermittent aeration are the most successful. Further investigation should also integrate the impact of changes in recirculation on the energy consumption of the plant.
This study demonstrates that strategies to achieve energy efficiency in wastewater treatment plants do not have to compromise the process performance (i.e., effluent values, norm compliance); on the contrary, sensible strategies promote both better process performance and energy savings.
This is of particular interest in a country like China, where increasing environmental challenges have influenced the establishment of stricter standards and policies, along with an accelerated development of the number of WWTPs and the amount of wastewater treated. This has put pressure on existing infrastructures and WWTP operators to come up with sustainable solutions and it is an important driver for investing in measures to improve the performance of WWTPs. However, it is very important that when optimising the performance of a WWTP, this is done without increasing operational or investment costs, especially from an energy point of view.
The knowledge gained in this study is also transferable to other countries with similar problems or similar framework conditions worldwide. In this way, WWTPs will continue to contribute to sustainable development, environmental care and energy efficiency.

Author Contributions

Conceptualization, M.V.-A., V.H. and D.P.; methodology, M.V.-A. and V.H.; software, M.V.-A.; validation, M.V.-A. and V.H.; formal analysis, M.V.-A. and V.H.; investigation, M.V.-A., V.H. and D.P.; data curation, M.V.-A. and V.H.; writing—original draft preparation, M.V.-A. and V.H.; writing—review and editing, M.V.-A., V.H., H.S. and J.W.; visualization, M.V.-A. and V.H.; supervision, H.S. and J.W.; project administration, H.S., V.H. and D.P.; funding acquisition, H.S. All authors have read and agreed to the published version of the manuscript.

Funding

This research was funded by the German Federal Ministry of Education and Research (BMBF) in the framework of the program CLIENT II-International partnerships for sustainable innovations, grant number: 02WCL1469A-J.

Institutional Review Board Statement

Not applicable.

Informed Consent Statement

Not applicable.

Data Availability Statement

The data presented in this study are available on request from the corresponding author. The data are not publicly available due to the request of the example WWTP to remain anonymous.

Acknowledgments

The authors thank the Ministry for support and the project partners for the cooperation. We thank the operator of the Chinese WWTP for its cooperation with this article, delivering the data and providing intensive discussion.

Conflicts of Interest

The authors declare no conflict of interest.

References

  1. Zhang, M.; Ma, Y. Energy use and challenges in current wastewater treatment plants. In A-B Processes: Towards Energy Self-Sufficient Municipal Wastewater Treatment; Liu, Y., Gu, J., Zhang, M., Eds.; IWA Publishing: Lodon, UK, 2020; pp. 1–28. ISBN 9781789060089. [Google Scholar]
  2. Haslinger, J.; Lindtner, S.; Krampe, J. Operating costs and energy demand of wastewater treatment plants in Austria: Benchmarking results of the last 10 years. Water Sci. Technol. 2016, 74, 2620–2626. [Google Scholar] [CrossRef]
  3. von Sperling, M. Urban Wastewater Treatment in Brazil: Technical Note Nº IDB-TN-970; Water and Sanitation Division: Sao Paulo, Brazil, 2016; Available online: https://publications.iadb.org/publications/english/document/Urban-Wastewater-Treatment-in-Brazil.pdf (accessed on 9 July 2021).
  4. Limaye, D.R.; Jaywant, S. Development of Indicators from the World Bank IBNET Database, 2019. Available online: http://www.indiaenvironmentportal.org.in/files/file/Mainstreaming-Energy-Efficiency-Investments-in-Urban-Water-and-Wastewater-Utilities.pdf (accessed on 6 July 2021).
  5. Capodaglio, A.; Olsson, G. Energy issues in sustainable urban wastewater management: Use, demand reduction and recovery in the urban water cycle. Sustainability 2020, 12, 266. [Google Scholar] [CrossRef] [Green Version]
  6. Ganora, D.; Hospido, A.; Husemann, J.; Krampe, J.; Loderer, C.; Longo, S.; Moragas Bouyat, L.; Obermaier, N.; Piraccini, E.; Stanev, S.; et al. Opportunities to improve energy use in urban wastewater treatment: A European-scale analysis. Environ. Res. Lett. 2019, 14, 44028. [Google Scholar] [CrossRef]
  7. Gu, Y.; Li, Y.; Li, X.; Luo, P.; Wang, H.; Wang, X.; Wu, J.; Li, F. Energy self-sufficient wastewater treatment plants: Feasibilities and challenges. Energy Procedia 2017, 105, 3741–3751. [Google Scholar] [CrossRef]
  8. Zhang, Q.H.; Yang, W.N.; Ngo, H.H.; Guo, W.S.; Jin, P.K.; Dzakpasu, M.; Yang, S.J.; Wang, Q.; Wang, X.C.; Ao, D. Current status of urban wastewater treatment plants in China. Environ. Int. 2016, 92–93, 11–22. [Google Scholar] [CrossRef]
  9. He, Y.; Zhu, Y.; Chen, J.; Huang, M.; Wang, P.; Wang, G.; Zou, W.; Zhou, G. Assessment of energy consumption of municipal wastewater treatment plants in China. J. Clean. Prod. 2019, 228, 399–404. [Google Scholar] [CrossRef]
  10. UBA. Energieeffizienz Kommunaler Kläranlage; Umweltbundesamt: Dessau-Roßlau, Germany, 2009; Available online: https://www.umweltbundesamt.de/sites/default/files/medien/publikation/long/3855.pdf (accessed on 4 April 2020).
  11. Siatou, A.; Manali, A.; Gikas, P. Energy consumption and internal distribution in activated sludge wastewater treatment plants of Greece. Water 2020, 12, 1204. [Google Scholar] [CrossRef]
  12. Mizuta, K.; Shimada, M. Benchmarking energy consumption in municipal wastewater treatment plants in Japan. Water Sci. Technol. 2010, 62, 2256–2262. [Google Scholar] [CrossRef]
  13. Pabi, S.; Amarnath, A.; Goldstein, R.; Reekie, L. Electricity Use and Management in the Municipal Water Supply and Wastewater Industries; Water Research Foundation: Denver, CO, USA, 2013; Available online: https://www.sciencetheearth.com/uploads/2/4/6/5/24658156/electricity_use_and_management_in_the_municipal_water_supply_and_wastewater_industries.pdf (accessed on 7 July 2021).
  14. Clos, I.; Krampe, J.; Alvarez-Gaitan, J.P.; Saint, C.P.; Short, M.D. Energy benchmarking as a tool for energy-efficient wastewater treatment: Reviewing international applications. Water Conserv. Sci. Eng. 2020, 5, 115–136. [Google Scholar] [CrossRef]
  15. Ranieri, E.; Giuliano, S.; Ranieri, A.C. Energy consumption in anaerobic and aerobic based wastewater treatment plants in Italy. Water Pract. Technol. 2021, 16, 851–863. [Google Scholar] [CrossRef]
  16. Wagner, M.; Stenstrom, M.K. Aeration and mixing. In Activated Sludge—100 Years and Counting; Jenkins, D., Wanner, J., Eds.; IWA Publishing: London, UK, 2014; ISBN 9781780404936. [Google Scholar]
  17. Zettl, U. Die gestaltung des belüftungssystems für eine belebungsstufe—Eine komplexe aufgabe. In Siedlungswasserwirtschaft ‘from K’Town to KOSMOS’: Festschrift zur Verabschiedung von Prof. Dr.-Ing. Theo G. Schmitt; Steinmetz, H., Ed.; Technische Universität Kaiserslautern, Institut Wasser Infrastruktur Ressourcen: Kaiserslautern, Germnay, 2019; pp. 103–122. ISBN 978-3-95974-104-0. [Google Scholar]
  18. Åmand, L.; Carlsson, B. Parameter scheduling in ammonium feedback control. In Proceedings of the 11th IWA Conference on Instrumentation Control and Automation—ICA2013, Narbonne, France, 18–20 September 2013; IWA, Ed.; IWA: London, UK, 2013. [Google Scholar]
  19. Wiese, J. Transparente Prozessüberwachung von Biogasanlagen und Kläranlagen durch Einsatz Moderner Mess- und Automationstechnik. Habilitation Thesis, Helmut-Schmidt-Universität/Universität der Bundeswehr Hamburg, Hamburg, Germany, 2014. [Google Scholar]
  20. Steinmetz, H.; Wiese, J. Instrumentation, control and automation for full-scale sequencing batch reactor plants. Water Pract. Technol. 2006, 1, wpt2006076. [Google Scholar] [CrossRef] [Green Version]
  21. Olsson, G.; Carlsson, B.; Comas, J.; Copp, J.; Gernaey, K.V.; Ingildsen, P.; Jeppsson, U.; Kim, C.; Rieger, L.; Rodríguez-Roda, I.; et al. Instrumentation, control and automation in wastewater—From London 1973 to Narbonne 2013. Water Sci. Technol. 2014, 69, 1373–1385. [Google Scholar] [CrossRef] [PubMed]
  22. Li, W.-W.; Sheng, G.-P.; Zeng, R.J.; Liu, X.-W.; Yu, H.-Q. China’s wastewater discharge standards in urbanization: Evolution, challenges and implications. Environ. Sci. Pollut. Res. Int. 2012, 19, 1422–1431. [Google Scholar] [CrossRef] [PubMed]
  23. World Bank. The World Bank in China: Overview. Available online: http://www.worldbank.org/en/country/china/overview (accessed on 15 April 2021).
  24. Linster, M.; Yang, C. China’s Progress Towards Green Growth: An International Perspective: OECD Green Growth Papers; No. 2018/05; OECD: Paris, France, 2018. [Google Scholar]
  25. Liu, H.; Liu, J.; You, X. Q&A: What does China’s 14th ‘five year plan’ mean for climate change? In Proceedings of the Fourth Session of the 13th National Peoples Congress, Bejing, China, 12 March 2021. [Google Scholar]
  26. Ministry of Ecology and Environment of the People’s Republic of China. Chinese Discharge Standard of Pollutants for Municipal Wastewater Treatment Plant (GB 18918–2002); Ministry of Ecology and Environment of the People’s Republic of China: Beijing, China, 2002.
  27. Lu, J.-Y.; Wang, X.-M.; Liu, H.-Q.; Yu, H.-Q.; Li, W.-W. Optimizing operation of municipal wastewater treatment plants in China: The remaining barriers and future implications. Environ. Int. 2019, 129, 273–278. [Google Scholar] [CrossRef]
  28. Ministry of Housing and Urban-Rural Development. China Statistical Yearbook 2017 on Urban and Rural Construction, 2019. Available online: http://www.mohurd.gov.cn/xytj/tjzljsxytjgb/ (accessed on 10 March 2020).
  29. Jin, L.; Zhang, G.; Tian, H. Current state of sewage treatment in China. Water Res. 2014, 66, 85–98. [Google Scholar] [CrossRef]
  30. Zeng, S.; Chen, X.; Dong, X.; Liu, Y. Efficiency assessment of urban wastewater treatment plants in China: Considering greenhouse gas emissions. Resour. Conserv. Recycl. 2017, 120, 157–165. [Google Scholar] [CrossRef]
  31. Henze, M. Activated Sludge Models ASM1, ASM2, ASM2d and ASM3; IWA Publishing: London, UK, 2000; ISBN 9781780402369. [Google Scholar]
  32. Calise, F.; Eicker, U.; Schumacher, J.; Vicidomini, M. Wastewater treatment plant: Modelling and validation of an activated sludge process. Energies 2020, 13, 3925. [Google Scholar] [CrossRef]
  33. Alikhani, J.; Takacs, I.; Al-Omari, A.; Murthy, S.; Massoudieh, A. Evaluation of the information content of long-term wastewater characteristics data in relation to activated sludge model parameters. Water Sci. Technol. 2017, 75, 1370–1389. [Google Scholar] [CrossRef]
  34. Hernández-del-Olmo, F.; Gaudioso, E.; Dormido, R.; Duro, N. Energy and environmental efficiency for the N-ammonia removal process in wastewater treatment plants by means of reinforcement learning. Energies 2016, 9, 755. [Google Scholar] [CrossRef] [Green Version]
  35. Gazsó, Z.; Házi, F.; Kenyeres, I.; Váci, L. Full-scale wastewater treatment plant simulation for real-time optimization. Water Pract. Technol. 2017, 12, 848–856. [Google Scholar] [CrossRef]
  36. Langergraber, G.; Rieger, L.; Winkler, S.; Alex, J.; Wiese, J.; Owerdieck, C.; Ahnert, M.; Simon, J.; Maurer, M. A guideline for simulation studies of wastewater treatment plants. Water Sci. Technol. 2004, 50, 131–138. [Google Scholar] [CrossRef] [PubMed]
  37. IFAK. Simba#Water. Available online: https://www.ifak.eu/en/products/simba-water (accessed on 21 June 2021).
  38. HSGSim. Integrierte Modellierung von Kanalnetz, Kläranlage und Gewässer: HSG-Leitfaden der Arbeitsgruppe Integrierte Modellierung. Available online: http://www.hsgsim.org (accessed on 21 June 2021).
  39. Ahnert, M.; Alex, J.; Dürrenmatt, D.; Langergraber, G.; Hobus, I.; Schmuck, S.; Spering, V. Dynamische simulation als bestandteil einer kläranlagenbemessung nach DWA-A131: Praxisanwendung des ASM3_A131 und fallbeispiele. Kommunale Abwasserbehandl. 2015, 7, 615–624. [Google Scholar] [CrossRef]
  40. Torregrossa, D.; Hansen, J. SK-DSSy: How to integrate the youtube platform in a cooperative decision support? In Decision Support Systems VIII: Sustainable Data-Driven and Evidence-Based Decision Support; Dargam, F., Delias, P., Linden, I., Mareschal, B., Eds.; Springer International Publishing: Cham, Switzerland, 2018; pp. 145–156. ISBN 978-3-319-90314-9. [Google Scholar]
  41. IFAK. Modellierung von Kläranlagen: Grundlagen-Schulung zur Dynamischen Simulation Mit SIMBA; IFAK: Magdeburg, Germany, 2018. [Google Scholar]
  42. Wang, X.; Katopodes, N.; Shen, C.; Wang, H.; Pang, Y.; Zhou, Q. Control of pollutants in the trans-boundary area of Taihu Basin, Yangtze Delta. Int. J. Environ. Res. Public Health 2016, 13, 1253. [Google Scholar] [CrossRef] [Green Version]
  43. DWA. Bemessung von Einstufigen Belebungsanlagen; Deutsche Vereinigung für Wasserwirtschaft Abwasser und Abfall: Hennef, Germany, 2016; ISBN 978-3-88721-332-9. [Google Scholar]
  44. DWA. Arbeitsblatt Energiecheck und Energieanalyse: Instrumente zur Energieoptimierung von Abwasseranlagen; DWA: Hennef, Germany, 2015; ISBN 978-3-88721-276-6. [Google Scholar]
  45. DWA. Systeme zur Belüftung und Durchmischung von Belebungsanlagen; Deutsche Vereinigung für Wasserwirtschaft Abwasser und Abfall: Hennef, Germany, 2017; ISBN 978-3-88721-513-2. [Google Scholar]
  46. Alex, J.; Ahnert, M.; Dürrenmatt, D.; Langergraber, G.; Hobus, I.; Schmuck, S.; Spering, V. Voraussetzungen für eine dynamische simulation als bestandteil einer kläranlagenbemessung nach DWA-A 131. Kommunale Abwasserbehandl. 2015, 5, 436–446. [Google Scholar]
  47. Sin, G.; van Hulle, S.W.H.; de Pauw, D.J.W.; van Griensven, A.; Vanrolleghem, P.A. A critical comparison of systematic calibration protocols for activated sludge models: A SWOT analysis. Water Res. 2005, 39, 2459–2474. [Google Scholar] [CrossRef]
  48. van Veldhuizen, H.; van Loosdrecht, M.; Heijnen, J. Modelling biological phosphorus and nitrogen removal in a full scale activated sludge process. Water Res. 1999, 33, 3459–3468. [Google Scholar] [CrossRef]
  49. Tchobanoglous, G. Wastewater Engineering: Treatment and Resource Recovery, 5th ed.; McGraw-Hill: New York, NY, USA, 2014; ISBN 1259250938. [Google Scholar]
  50. Li, Z.; Zhao, L.; Zhu, H.; Song, X.; Wang, J. Analysis of construction and operation status and existing problems of municipal wastewater treatment plants in China. Water Wastewater Eng. 2018, 44, 52–57. [Google Scholar]
  51. Pinnekamp, J.; Schröder, M.; Bolle, F.-W.; Gramlich, E.; Gredigk-Hoffmann, S.; Koenen, S.; Loderhose, M.; Miethig, S.; Ooms, K. Energie und Abwasser Handbuch NRW; Ministerium für Umwelt, lnadwirtschaft, Natur- und Verbraucherschutz des Landes NRW: Düsseldorf, Germany, 2017. [Google Scholar]
  52. Lozano Avilés, A.B.; Del Cerro Velázquez, F.; Del Llorens Pascual Riquelme, M. Methodology for energy optimization in wastewater treatment plants. Phase I: Control of the best operating conditions. Sustainability 2019, 11, 3919. [Google Scholar] [CrossRef] [Green Version]
  53. Borzooei, S.; Amerlinck, Y.; Panepinto, D.; Abolfathi, S.; Nopens, I.; Scibilia, G.; Meucci, L.; Zanetti, M.C. Energy optimization of a wastewater treatment plant based on energy audit data: Small investment with high return. Environ. Sci. Pollut. Res. Int. 2020, 27, 17972–17985. [Google Scholar] [CrossRef]
  54. Zvimba, J.N.; Musvoto, E.V. Modelling energy efficiency and generation potential in the South African wastewater services sector. Water Sci. Technol. 2020, 81, 876–890. [Google Scholar] [CrossRef] [Green Version]
Figure 1. Typical Energy End-Uses in Municipal WWTPs, as percentage of the total in different countries (elaborated with data from [9,10,11,12,13]).
Energies 14 05826 g001
Figure 2. Development of wastewater treatment plants and treatment capacity in China (elaborated with data from [28].)
Energies 14 05826 g002
Figure 3. Scheme of the example WWTP.
Energies 14 05826 g003
Figure 4. Basic model of the example WWTP in SIMBA.
Energies 14 05826 g004
Figure 5. Energy consumption distribution in the example WWTP.
Energies 14 05826 g005
Figure 6. (a) Effluent load comparison between measured (blue) and simulated values (black); (b) COD and TN removal comparison between measured (blue) and simulated values (black).
Energies 14 05826 g006
Figure 7. Model calibration results: (a) MLSS concentration; (b) Effluent concentration of COD; (c) TN; (d) NH4-N. Measured in laboratory (dashed blue), simulated values (black).
Energies 14 05826 g007
Figure 8. Number of norm non-compliances in a year with the CS norm.
Energies 14 05826 g008
Figure 9. Effluent load of TN and NH4-N in a year with the tested strategies.
Energies 14 05826 g009
Figure 10. Average removal rates of TN and NH4-N in different scenarios.
Energies 14 05826 g010
Figure 11. Air requirements of the tested strategies as percentage of the baseline scenario (Base).
Energies 14 05826 g011
Table 1. Main basic parameters of the Chinese discharge standards of pollutants for municipal WWTP according to norm GB 18918-2002 [26] and the local city standard (CS) in the Tai Hu basin as an example.
GradeConcentration in mg/L (24 h Composite Sample)Application
CODBOD5SSNH4-NTNTP
CS3010101.5 (3)100.3Local regulation
Grade I-A5010105 (8)150.5for water discharged by WWTP for reuse
Grade I-B6020208 (15)201for WWTP discharging wastewater into surface water classified as Grade III according to GB 3838-2002
Grade II100303025 (30)-3for WWTP discharging wastewater into surface water classified as Grade IV–V
Grade III1206050--5for WWTP with only mechanical treatment and potential expansion
* Limits in brackets are for wastewater temperatures below 12 °C.
Table 2. COD and TN in typical domestic wastewater as a function of the primary clarification HRT (calculated according to DWA 131, 2016).
HRT in PST with Dry Weather Flow, h COD/TN
0 (Raw wastewater)10.9:1
0.5–1.05.0:1
1.0–1.5 4.5:1
>1.54.0:1
Table 3. Assumptions for the calculation of aeration energy consumption of the scenarios based on the airflow generated in SIMBA.
ParameterValueUnitReference
SSOTE8%/mDWA-M 229-1 [45]
SAE4.2kg O2/kWhDWA-M 229-1 [45]
t 24h-
hD4m-
Table 4. Selected influent parameters.
Influent COD Fractionation and ParametersFormulaSelected Value
Fraction TSS to CODCTSS/CCODEquation (3)0.475
Fraction of non-volatile TSS (fB)XI,TSS/XTSSEquation (4)0.3
Fraction of inert soluble COD (fS)SI,COD/CCODEquation (5)0.05
Fraction of inert COD from particulate COD (fA)XI,COD/XCODEquation (6)0.3
Table 5. Energy consumption for the biological treatment system of the example WWTP.
Aeration SystemEnergy Consumption
kWh/akWh/(PE·a)
Blowers7,670,40017.05
Mixers1,445,4003.21
Recirculation803,8001.79
Sludge recirculation963,6002.14
Table 6. Description of the tested strategies.
Strategy DescriptionScenario
BaseS1S2S3S4S5S6C1C2C3
Primary settling tanks (PST)Bypass of half of the PST
DO set pointDO = 2 mg/L
DO = 3 mg/L
VD/VATReduction of aerated volume to increase anoxic volume (VD = 0.25)
Use of the by-passed PC as anoxic tanks
Aeration control based on the NH4-N effluent valuesw/o DO limit
w/DO limit
Intermittent
denitrification
time based
NH4-based
Table 7. Total energy reduction by the different tested combinations of strategies.
ScenarioUsage of PST as VDVD/VATVN/VATIntermittent DenitrificationAeration EnergyEnergy Consumption PSTEnergy Consumption Mixing Total Energy Reduction
Base-17%67%No100%-100%0%
C1-25%58%No100%50%100%0%
30%12%
C2yes19%65%yes in VN76%50%100%14%
30%26%
C3-25%58%yes in VN76%50%100%15%
30%26%
Publisher’s Note: MDPI stays neutral with regard to jurisdictional claims in published maps and institutional affiliations.

