Article

Experimental Validation of Flow Uniformity Improvement by a Perforated Plate in the Heat Exchanger of SFR Steam Generator

1
School of Mechanical Engineering, Chungnam National University, 99 Daehak-ro, Yuseong-gu, Daejeon 34134, Korea
2
Center for Thermometry and Fluid Flow Metrology, Korea Research Institute of Standards and Science, 267 Gajeong-ro, Yuseong-gu, Daejeon 34113, Korea
3
Versatile Reactor Technology Development Division, Korea Atomic Energy Research Institute, 111 Daedeock-daero, 989 beon-gil, Yuseong-gu, Daejeon 34057, Korea
*
Author to whom correspondence should be addressed.
Co-first authors. These authors contributed equally to this work and should be considered first authors.
Submission received: 12 August 2021 / Revised: 8 September 2021 / Accepted: 10 September 2021 / Published: 15 September 2021
(This article belongs to the Topic Nuclear Energy Systems)

Abstract

:
The steam generator in a nuclear power plant is a type of heat exchanger in which heat transfer occurs from the hot fluid in multiple channels to the cold fluid. Therefore, a uniform flow over multiple channels is necessary to improve heat exchanger efficiency. The study aims at experimentally investigating the improvement of flow uniformity by the perforated plate in the heat exchanger used for a sodium-cooled fast reactor stream generator. A 1/4-scale experimental model for one heat exchanger unit with 33 × 66 channels was manufactured. The working fluid was water. A perforated plate was systematically designed using numerical simulations to improve the flow uniformity over the 33 × 66 channels. As a result, the flow uniformity greatly improved at a slight cost of pressure drop. To validate the numerical results, planar particle image velocimetry measurements were performed on the selected planes in the inlet and outlet headers. The experimental velocity profiles near the exits of the channels were compared with numerical simulation data. The experimental profiles agreed with the numerical data well. Both the numerical simulation and the experimental results showed a slight increase in pressure drop, despite significant improvement in the flow uniformity.

Graphical Abstract

1. Introduction

A sodium-cooled fast reactor (SFR) is a fast neutron nuclear reactor cooled by liquid sodium. An SFR has advantages and disadvantages. One of the primary advantages is an efficient utilization of uranium resources and a reduction of a high-level waste volume and toxicity. However, the main disadvantage is the possibility of large heat and hydrogen generation if sodium comes into contact with water. Therefore, special care must be taken to prevent this interaction. However, because the benefits outweigh the disadvantages, the Generation IV International Forum selected the SFR as one of the advanced nuclear energy systems, the Generation IV reactors [1]. Moreover, the SFR was evaluated as the most advanced and feasible system [2].
The Korea Atomic Energy Research Institute (KAERI) created a reactor design with the final goal of constructing a Prototype Gen-IV Sodium-cooled Fast Reactor (PGSFR) [3]. The main objective of the PGSFR was to verify transuranic (TRU) metal fuel performance, reactor operation, and transmutation ability of high-level wastes. One of the biggest issues in developing SFRs is the possibility of a sodium–water reaction accident in a steam generator in which heat is transferred from the hot sodium flow side to the water flow side. The Korea Atomic Energy Research Institute (KAERI) evaluated three different design concepts of steam generators in terms of the sodium–water reaction accident and decided to adopt a copper-bonded steam generator (CBSG) [4].
Figure 1 illustrates the concept of a CBSG in which a number of heat exchanger units are vertically stacked [5]. Water enters the CBSG from the bottom inlet and passes through the vertical 33 × 66 channels. Hot liquid sodium enters the CBSG from the top inlet and passes through the heat exchanger units in a zigzag pattern. For each heat exchanger unit, water flows through the vertical 33 × 66 channels, and liquid sodium flows through the horizontal 33 × 66 channels. The heat exchanger units are connected by 180° return pipings. The flow uniformity of liquid sodium flow over the horizontal 33 × 66 channels is crucial for achieving high heat transfer from the hot-sodium side to the cold-water side in the steam generator.
Various efforts have been made to improve the flow uniformity of heat exchangers. The inlet header configuration was geometrically optimized [6], and a flow-distribution device was installed in the inlet header [7,8,9]. Lalot et al. (1999) showed experimentally that a perforated plate with holes of equal diameter in the inlet header increased the heat transfer efficiency [10]. Recently, numerical studies have been conducted to increase the thermal performance of heat exchangers and air distribution devices by considering a perforated plate [11], baffles [12], or varying the transverse and longitudinal pitches of tube bundles [13].
Jiao et al. [6] conducted an experimental investigation to improve the performance of flow distribution in a plate-fin heat exchanger. They defined the area of the header and its equivalent diameter in order to describe the characteristics of the header configuration. Gajapathy et al. [7] proposed a flow distribution device for an intermediate heat exchanger in a pool-type fast breeder reactor. The flow distribution device was a perforated plate with holes in line with the tube sheet holes, and the diameter of the holes was equal to the inlet diameter of the tubes. Wen et al. [9] performed flow visualization to show the effect of a baffle with small holes in the header on flow uniformity. The hole diameters were determined qualitatively based on the flow velocity distribution. Baek et al. [14] verified the impact of axial conduction and flow maldistribution effects in microchannel heat exchangers by comparing simulation results with experimental data. Lance et al. [15] also investigated the flow distribution in microchannel heat exchangers, changing the inlet header configurations. Khovanskyi et al. [11] performed the three-factor factorial experiment for an improvement of the design of the air distribution devices. They obtained the mathematical model for determining the dependence of the average velocity on the flow rate, perforated plate area, and diameter of holes. Petinrin et al. [12] numerically investigated the performance of shell-and-tube heat exchangers with single segmental baffles and varying configurations of concave-cut baffles. Their numerical results generally showed that shell-and-tube heat exchangers with concave-cut baffles had a lower performance as compared with the single-segmental baffle type. In addition, they numerically studied the effect of tube pitch on heat and flow characteristics from tube bundles in cross-flow conditions [13]. The tube bundles with decreasing pitches had higher heat transfer performance, whereas the low friction factor was obtained with increasing pitches, which also gave good thermal–hydraulic performance.
In most studies, the flow patterns in a heat exchanger with straight inlet and outlet pipings were investigated [6,9,14,15]. However, as shown in Figure 1, sodium flow is introduced into the inlet header through a curved piping. Therefore, it is necessary to consider the asymmetric inflow into the inlet header to investigate the flow uniformity.
Previously, numerical simulations were performed to design a full-scale perforated plate [5] in which the hole diameters were determined based on the local flow velocities. The study aims at experimentally investigating the improvement of flow uniformity by the perforated plate in the heat exchanger used for a sodium-cooled fast reactor stream generator. To this end, particle image velocimetry (PIV) measurements were conducted using a 1/4-scale model.

2. Research Methodology

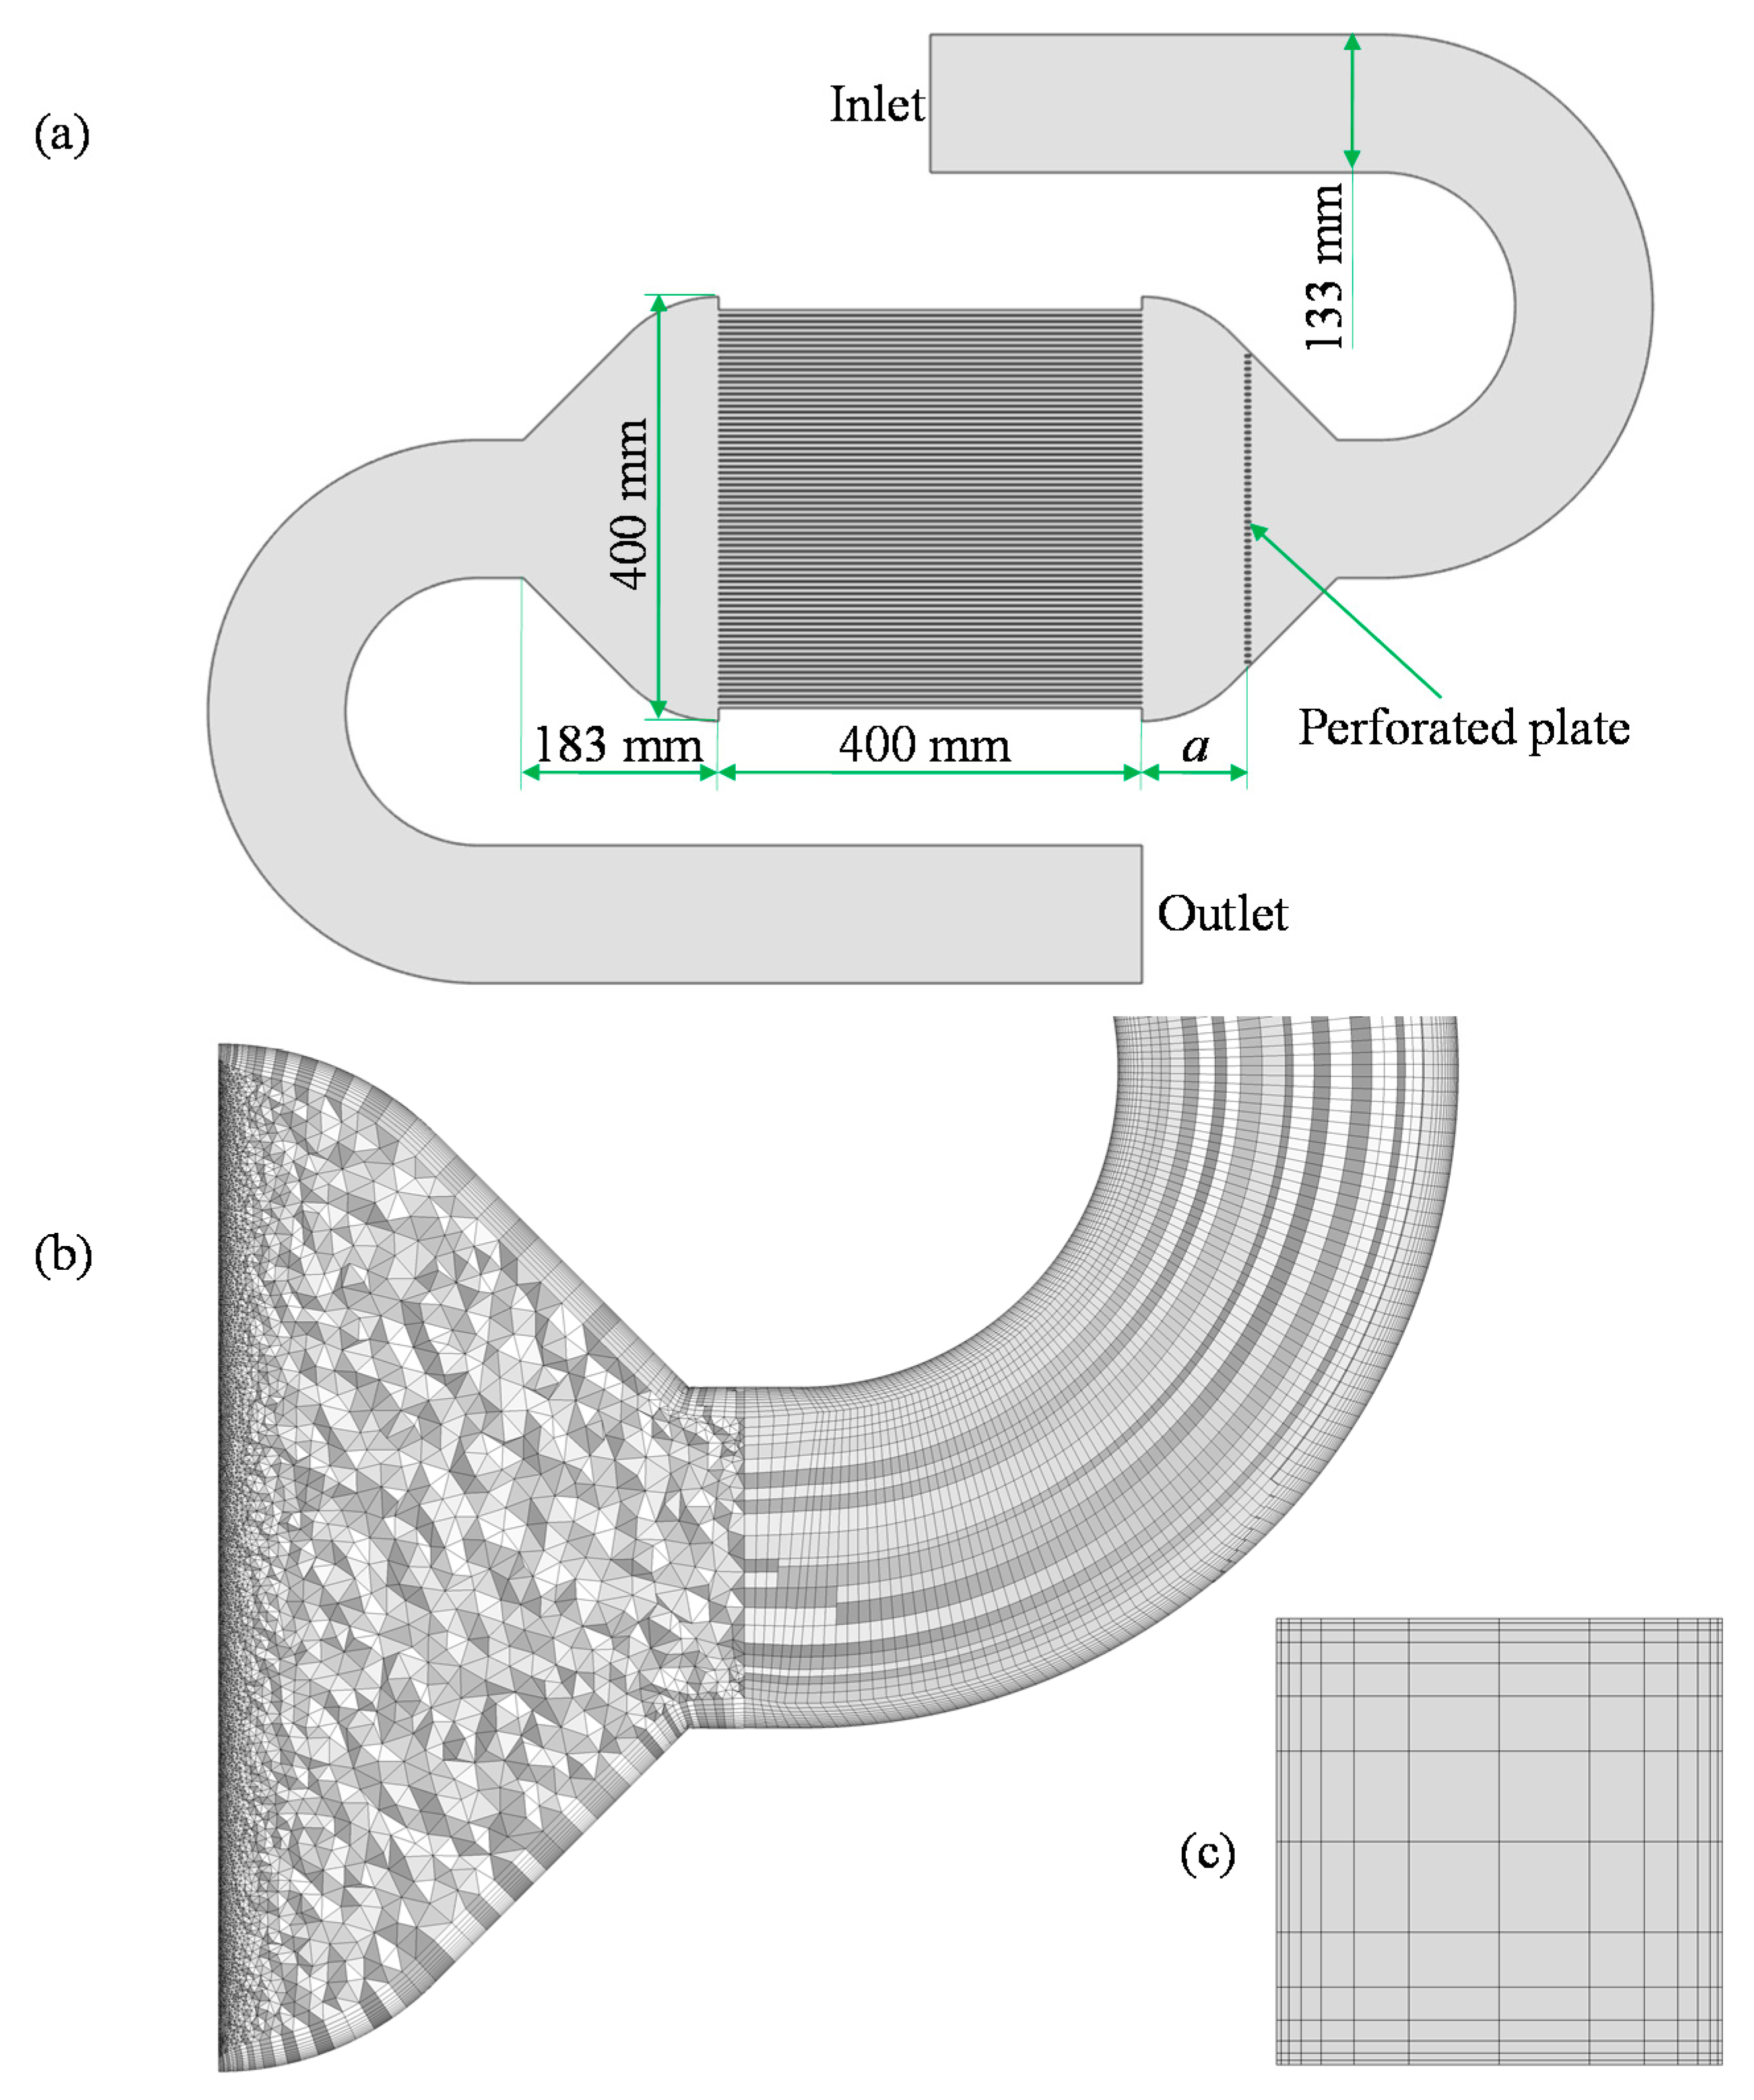
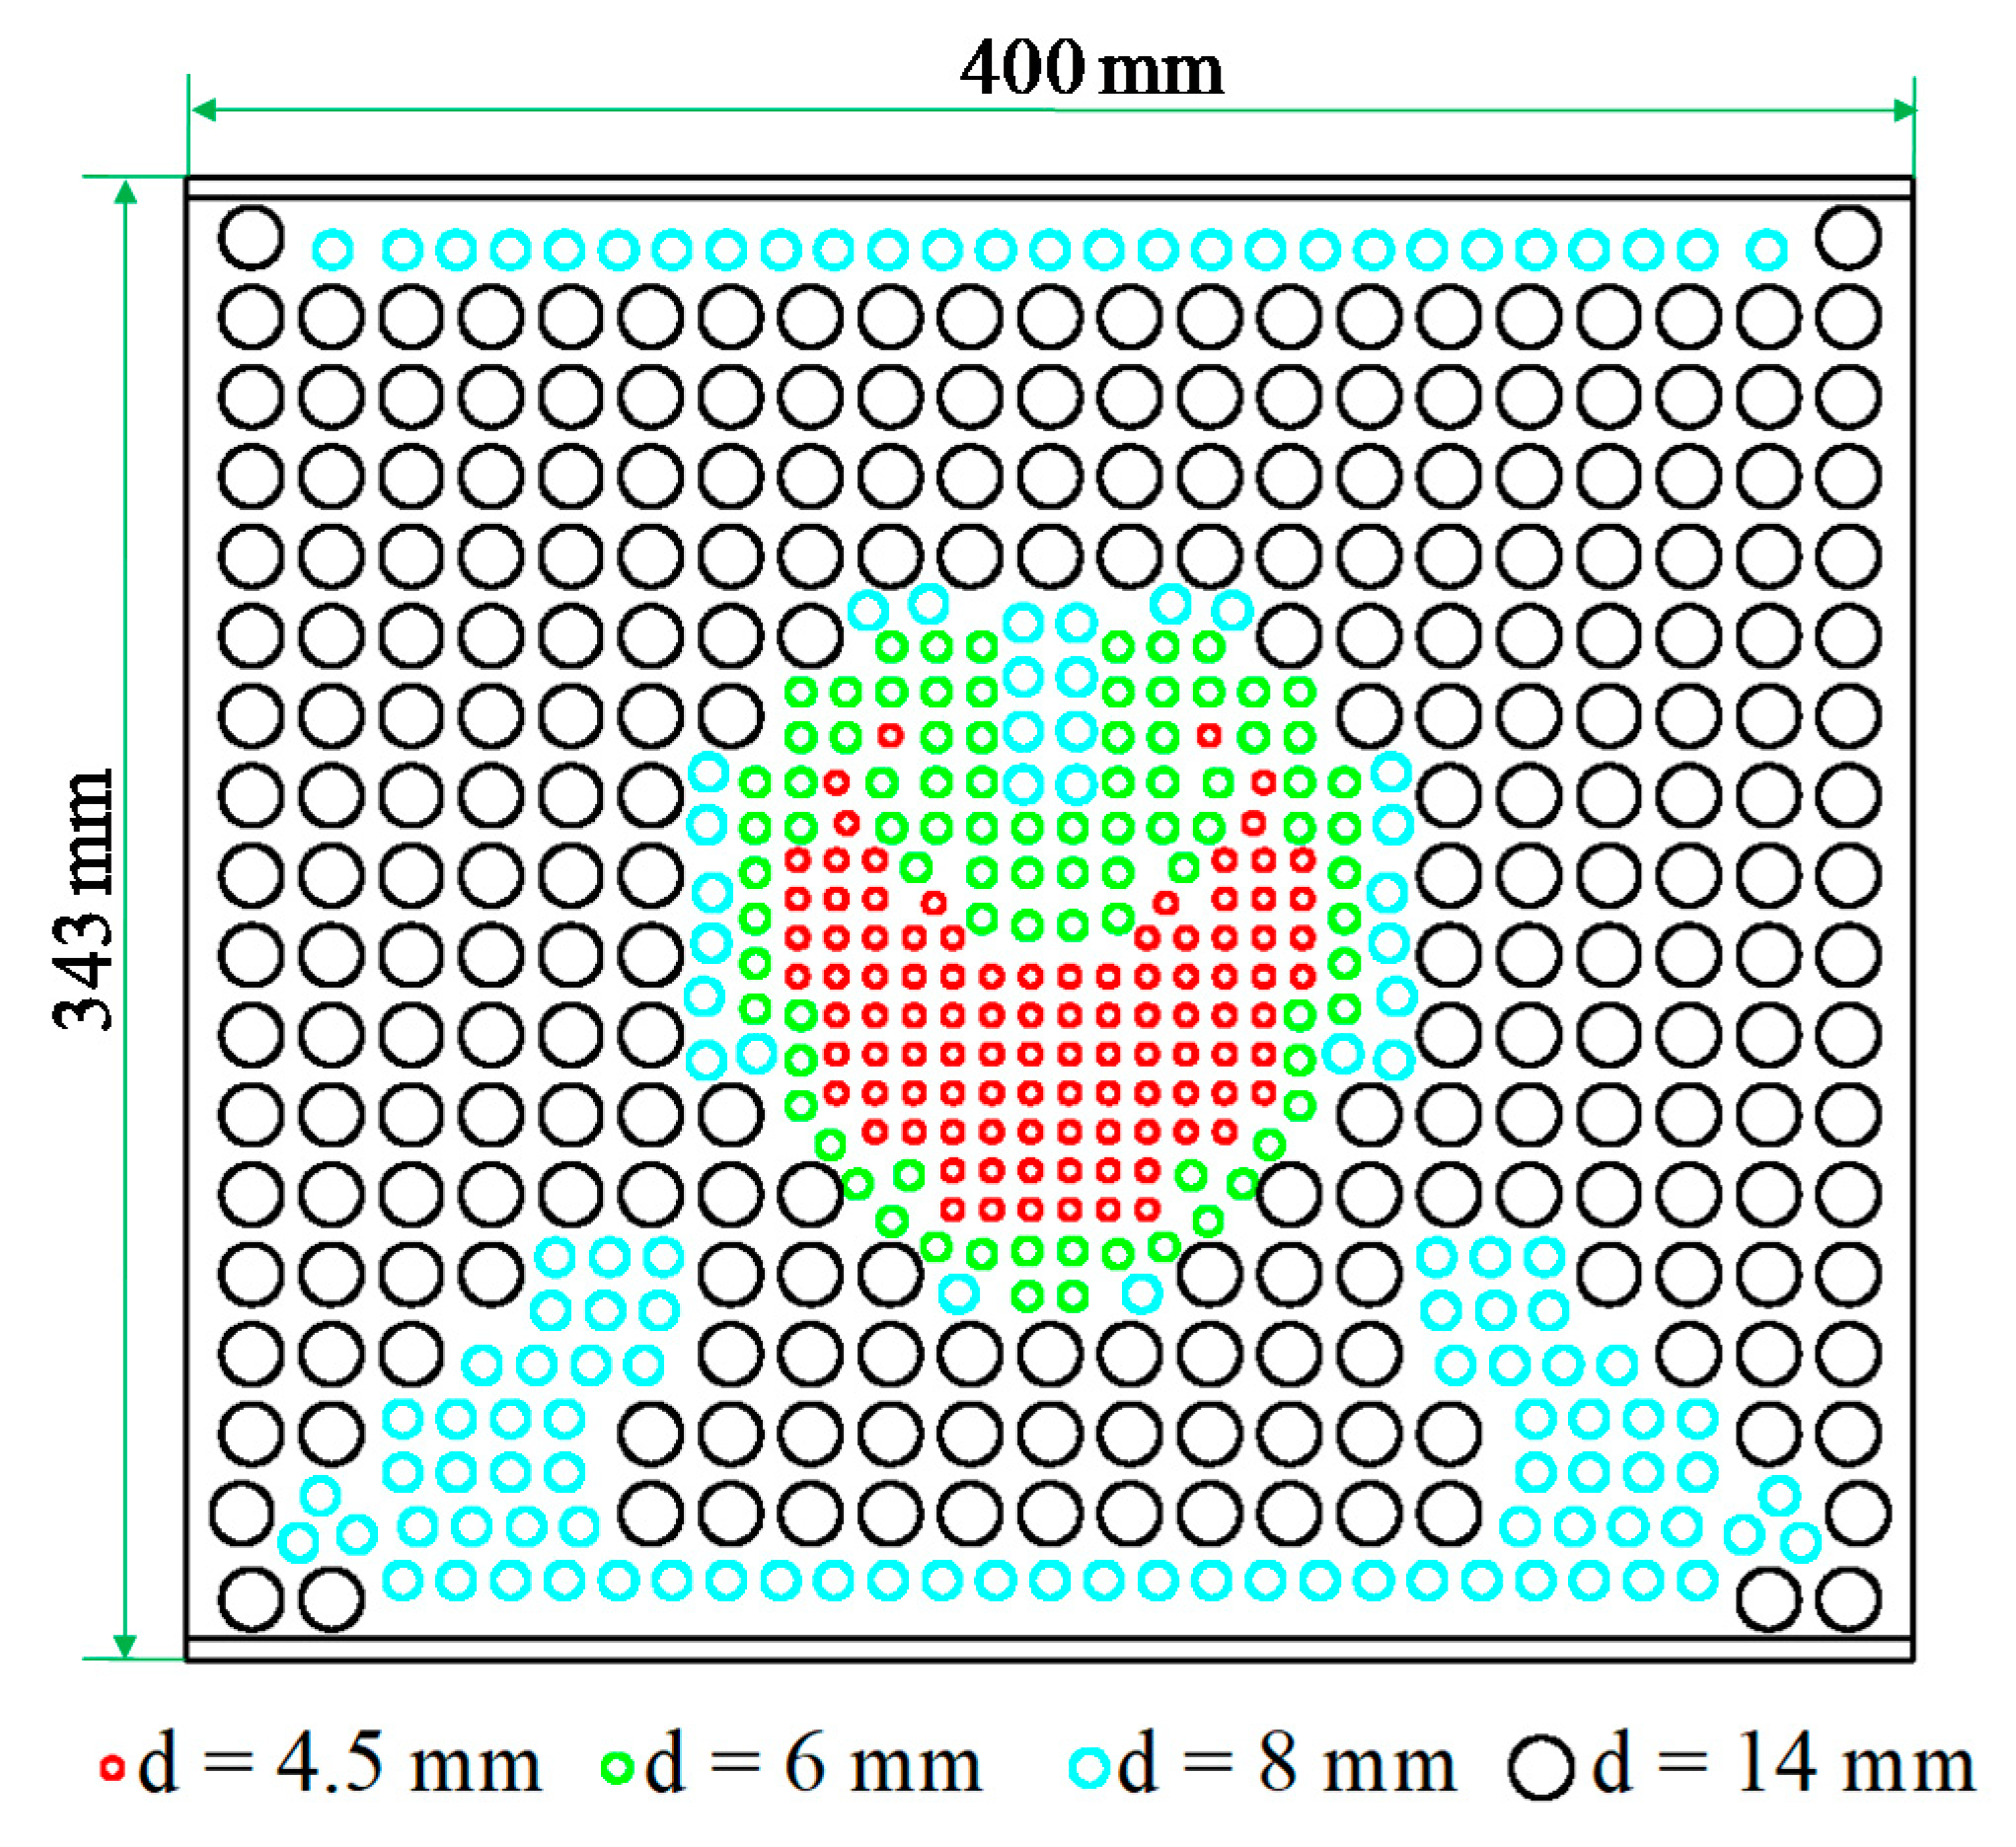
2.1. Numerical Design of a Perforated Plate

Before the experiment in a 1/4-scaled geometry model with one heat exchange unit, a perforated plate was designed using numerical simulations based on the method suggested by [5].
Figure 2 illustrates the sodium flow simulation domain, including one heat exchanger unit. There are 33 × 66 horizontal channels inside the heat exchanger unit. Considering the experiment in the laboratory, the 1/4-scale geometry model was used in this study, compared to the original model in [5]. There are two main differences from the original geometry shown in Figure 1. The pipings connecting the upper and lower heat exchanger units are curved in Figure 1, whereas straight pipings are additionally attached to the curved pipings in Figure 2. This modification was made for a simple experimental loop and was not expected to affect the flow patterns in the inlet and outlet headers significantly. Meanwhile, in previous experiments [6,14,15], straight inlet and outlet pipings were connected directly to the heat exchanger unit. Thus, an asymmetric jet flow into the inlet header was not reflected. In contrast, the present 1/4-scaled model can reflect an asymmetric flow jet into the inlet header. Another modification was made to the inlet and outlet header shapes. In Figure 1, the inlet and outlet headers are three-dimensionally expanded and contracted, respectively. However, in Figure 2, they are two-dimensionally expanded and contracted, respectively. This modification was necessary because image distortion was inevitable when recording flow images through the curved acrylic.
In both the numerical design and the experiment, water at 25 °C and 1.013 bar was used as the working fluid. As shown in Figure 2, water was injected through the inlet at a mean velocity of 0.4813 m/s (400 lpm). The Reynolds number was 6.789 × 10⁴, which corresponds to 1/100 times the Reynolds number of the prototype flow. The reduced Reynolds number was the maximum value to avoid the vibration of the experimental facility. Fortunately, although not shown here, numerical simulations revealed that the flow pattern with the reduced Reynolds number was quite similar to that with the prototype Reynolds number, which means that the reduced Reynolds number is acceptable.
Numerical simulations were performed for a steady turbulent flow using ANSYS Fluent [16]. The mass and momentum conservations are given in Equations (1) and (2), respectively [5].
u i x i = 0 ,
u j u i x j = 1 ρ p x i + x j ( ν u i x j u i u j ¯ ) + g i ,
where u, ρ, p, ν, and g are the mean velocity, density, pressure, kinematic viscosity, and gravity, respectively. The Reynolds stress tensor was calculated using the realizable k–ε turbulence model. Assuming a fully developed turbulent flow at the inlet, the inlet velocity profile was set using the one-seventh power-law equation, a pressure boundary was imposed on the outlet, and a wall function was applied to the wall.
With respect to the numerical methods, the COUPLED algorithm was used for pressure–velocity coupling, and the second-order upwind scheme was used for the spatial discretization of the momentum, turbulent kinetic energy, and turbulent dissipation rate equations. For the convergence criteria, a scaled residual of 0.0001 was used for all variables.
The dimensions of the sodium channel array in the heat exchanger unit are shown in Figure 3. The heat exchanger efficiency is significantly affected by the flow rate uniformity over the 33 × 66 sodium flow channels. Poor flow uniformity may reduce the heat exchanger efficiency by 5–15% [14]. In this study, the flow uniformity was evaluated using the coefficient of variation (CoV).
CoV = 1 m ˙ ¯ k = 1 N ( m ˙ k m ˙ ¯ ) 2 / N ,
where m ˙ k is the mass flow rate in channel k, m ˙ ¯ is the average value of the mass flow rates over all channels, and N is the total number of channels. The smaller the CoV, the better the flow uniformity.
Figure 4a shows the vertical and middle cross-sections of the flow domain. The heat exchanger unit was 400 mm × 400 mm × 400 mm and had 33 × 66 channels inside. To improve the flow uniformity, a perforated plate was installed in the inlet header, where a is the distance from the entrance of the heat exchanger unit to the perforated plate. According to the previous design for the full-scale original geometry [5], when the plate was placed in the middle of the inlet header, the COV was minimized at a slight cost of pressure drop. Since the header shapes of the original and model geometries are slightly different, as shown in Figure 1 and Figure 2, the perforated plate was set to be placed at the middle of the inlet header, i.e., a = 80 mm.
A grid test was conducted without a perforated plate. A large number of grids were required due to the 33 × 66 channels in the heat exchanger unit. Table 1 summarizes the grid test results, where Δp is the pressure difference between the inlet and outlet. The result differences between Cases 3 and 4 were less than 2%. The values of y+ at the grids adjacent to the wall were less than 300. Consequently, a grid system based on Case 3 was adopted. The mesh view in the middle plane in the inlet region is shown in Figure 4b, and the mesh view in the cross-sectional plane of one horizontal flow channel is shown in Figure 4c. The average mesh density is 1220 cell/cm3. The growth rate is less than 1.2 to ensure smooth transition between the cells.
Figure 5 shows the distribution of the mass flow rates over the 33 × 66 channels. The mass flow rate ranged from 0.002286 to 0.005383 kg/s, and the CoV was computed to be 0.2536. The flow rate was highest in the region slightly below the center because of the bending inlet pipe.
To improve the flow uniformity, the perforated plate was installed at a distance of a = 80 mm, as mentioned previously. The local hole diameters on the perforated plate were determined based on the local flow velocities at a = 80 mm when the plate was not installed. Figure 6 shows the contours of the flow velocity magnitude in the cross-section plane at a = 80 mm. To determine the local hole diameters on the perforated plate, the velocity magnitude was divided into five levels. Subsequently, the five different hole diameters were calculated using d i = 2 ( u ¯ / u i ) 1 / 2 d ¯ , where d i is the hole diameter for the i-th level velocity magnitude, d ¯ = 4.5 mm is the length of one side of each horizontal channel, u i is the i-th level velocity magnitude, and u ¯ is the average velocity magnitude in the cross-section plane at a = 80 mm. The calculated diameters were rounded to standard sizes in practice. Figure 7 shows the final design of the perforated plate. The hole diameters are 4.5, 6, 8, and 14 mm, the hole distances are 4.5 mm, and the plate thickness is 5 mm.
Figure 8 shows the distribution of the mass flow rates over the 33 × 66 channels when the perforated plate was installed in the inlet header. Compared with Figure 5, the flow uniformity improved considerably. Before the perforated plate was installed, the CoV and Δp were 0.2536 and 378.8 Pa, respectively. In contrast, when the perforated plate was installed, the CoV and Δp were, respectively, 0.0481 and 477.2 Pa. The CoV was greatly reduced at a slight cost of pressure drop.

2.2. Experimental Setup
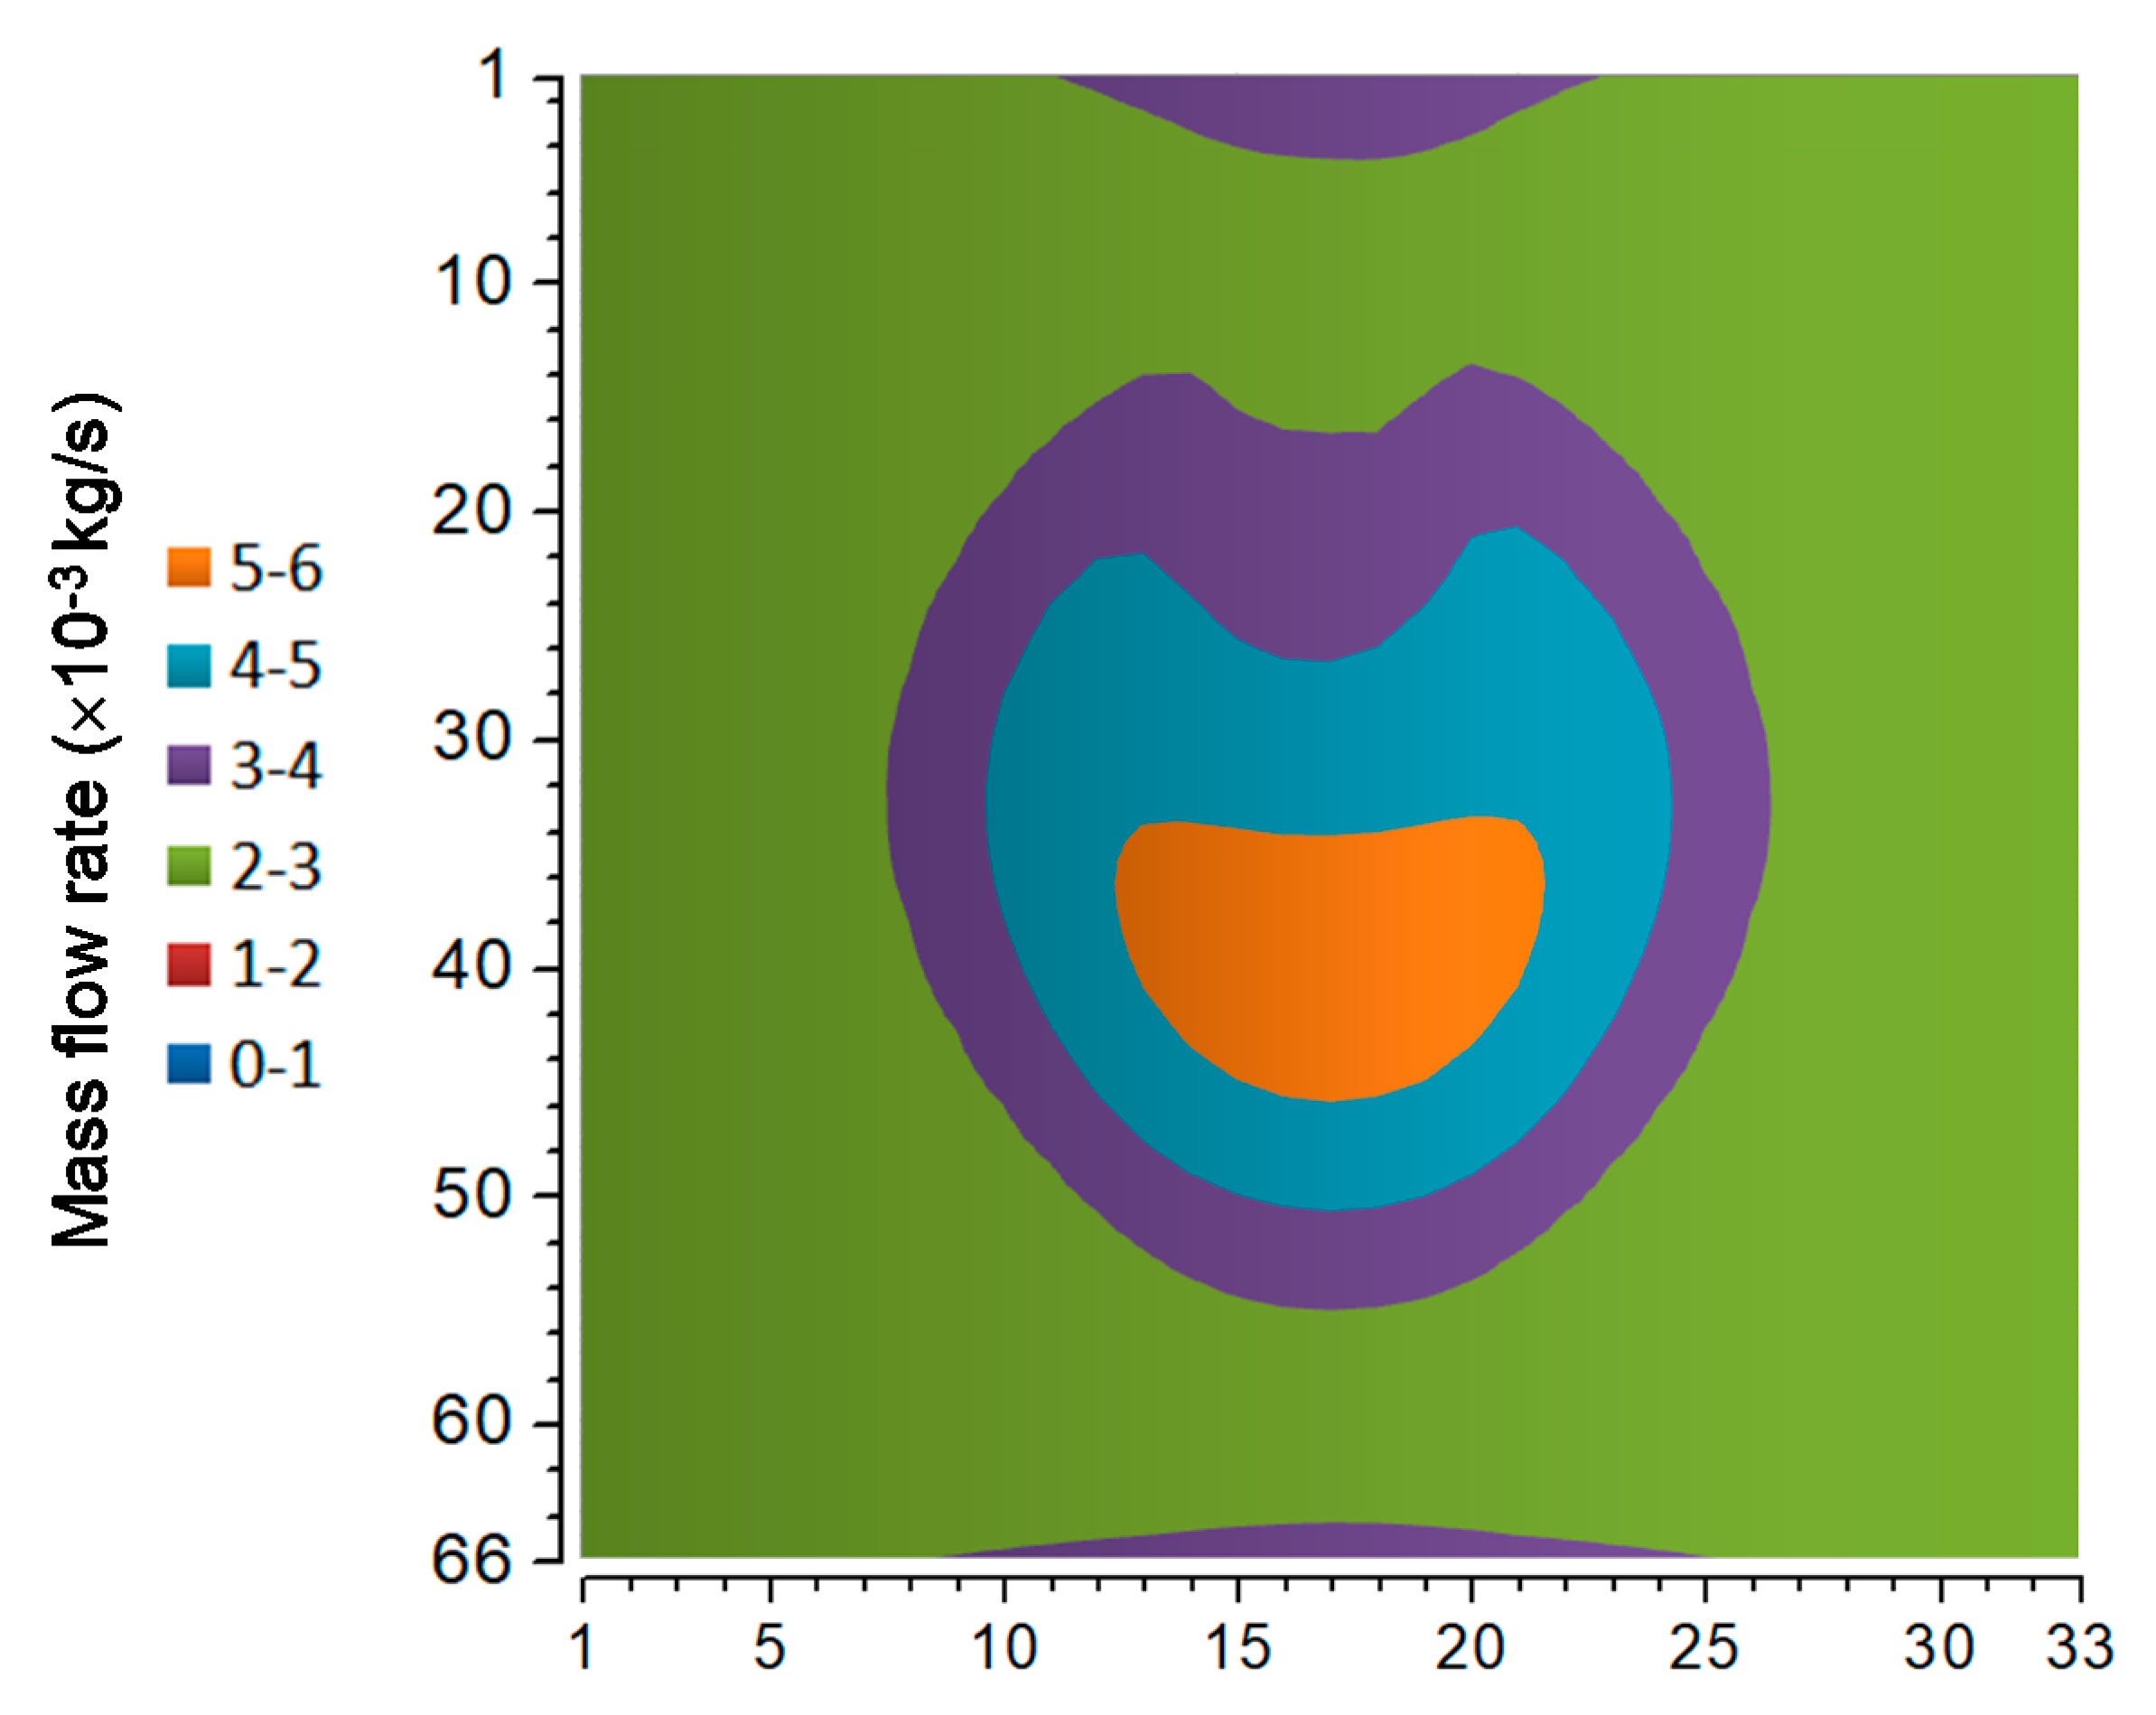
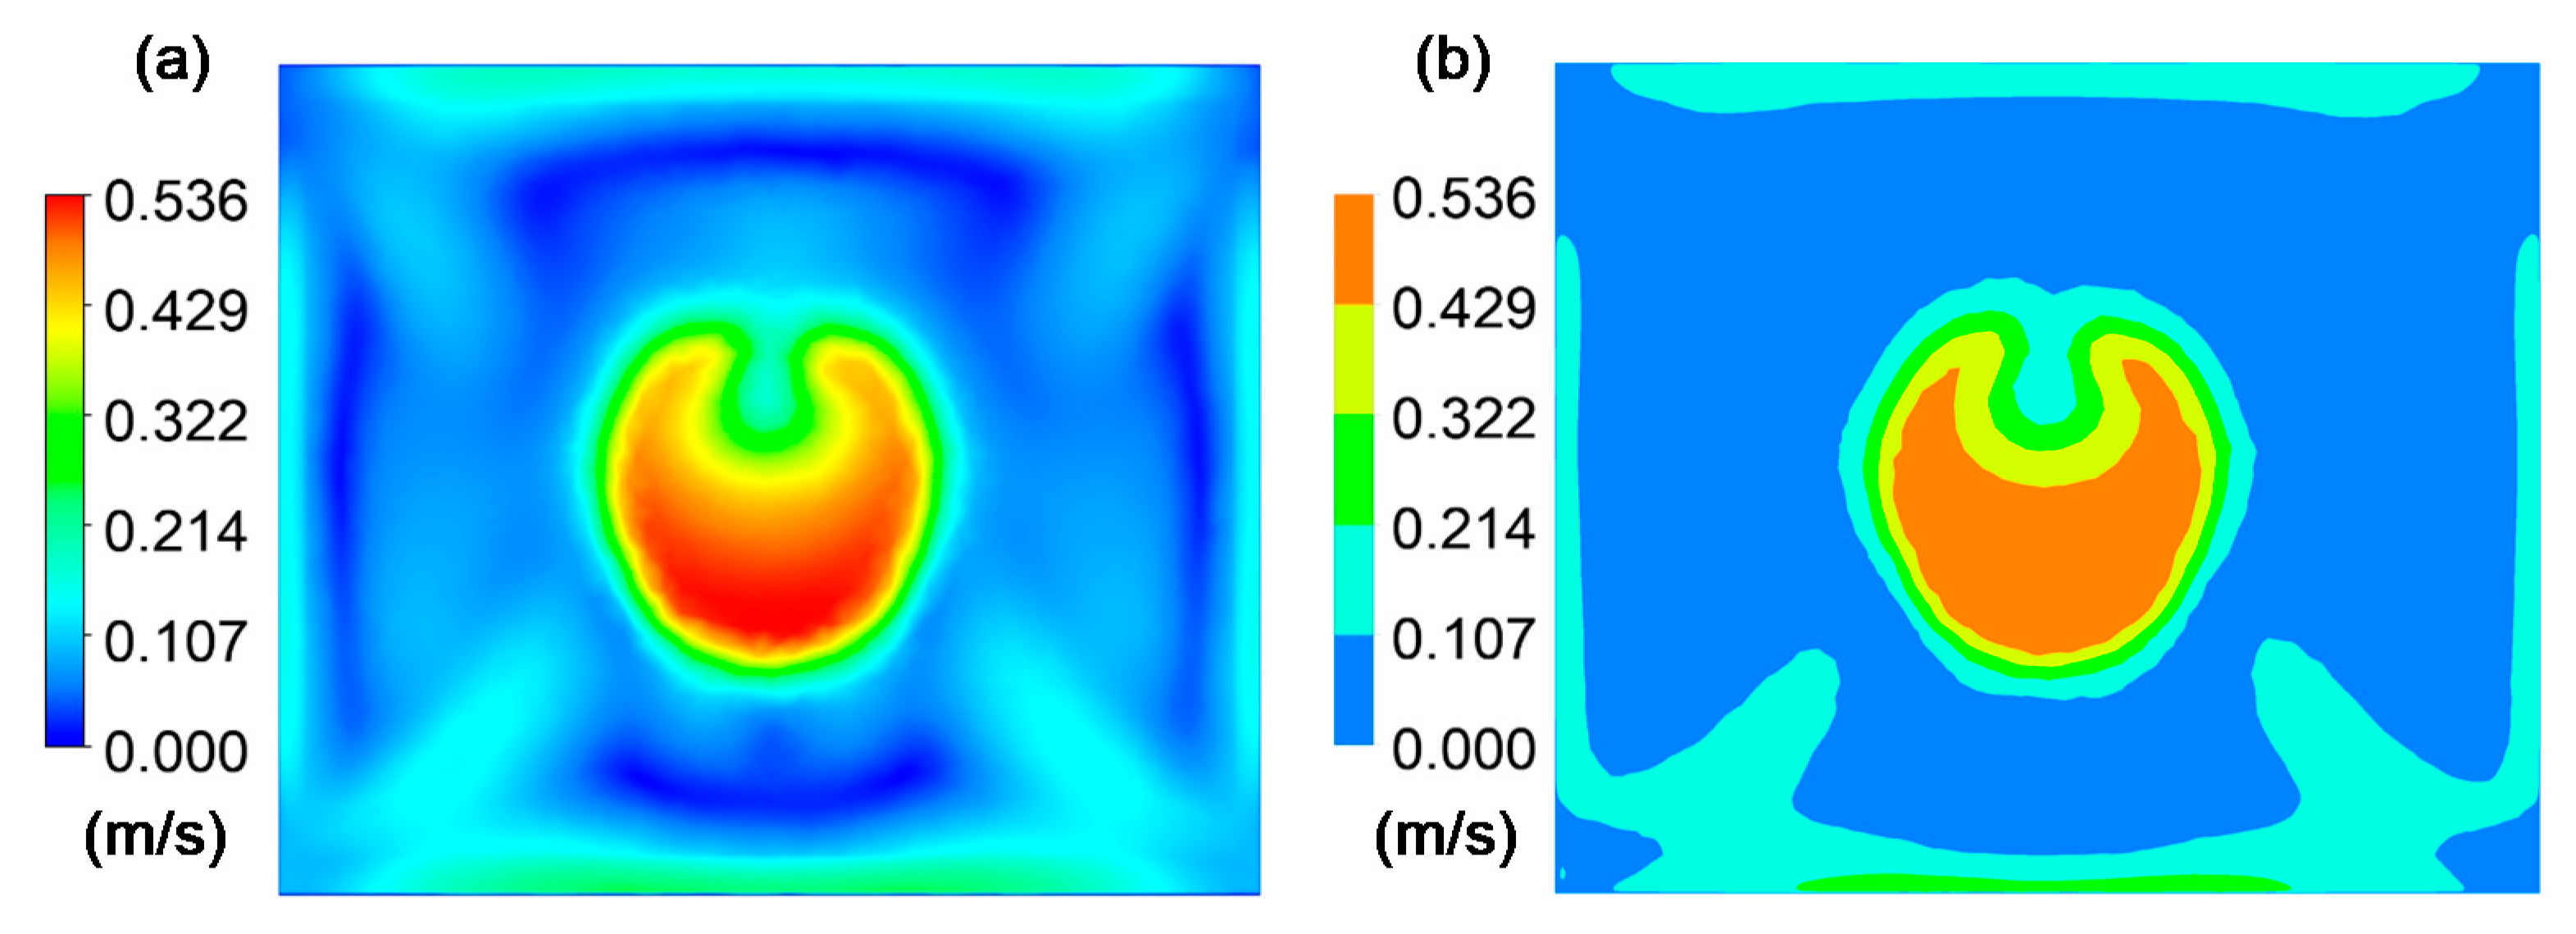
In principle, the flow uniformity over the 33 × 66 channels can be evaluated only when the flow rates are experimentally measured in all individual channels. From a practical point of view, this is extremely difficult or almost impossible. Therefore, the numerical simulation results are the only way to evaluate the flow uniformity. However, the numerical results must be validated through a comparison with experimental data.
Experiments were conducted to validate the numerical results. The 33 × 66 channels were fabricated by stacking aluminum plates. Figure 9 shows the exit side of the horizontal channels. Each channel has dimensions of 400 mm × 4.5 mm× 4.5 mm, as shown in Figure 3 and Figure 4.
Figure 10 shows the experimental setup used to test the 1/4-scale model of the heat exchanger unit. The water loop consisted of a pump, flow meter, and test section. The inlet and outlet headers were made of transparent acrylic for flow visualization.
Figure 11 shows a schematic diagram of the test section. A differential pressure gauge with a measurement uncertainty of 2% was used to measure the pressure difference between the inlet header entrance and outlet header exit. A magnetic flow meter with a measurement uncertainty of 0.5% was used to measure the water flow rate in the loop.
The flow patterns in the inlet and outlet headers were obtained using PIV [17]. An 8 W green continuous laser was used to illuminate the measurement planes. Figure 12 shows the locations of the measurement planes. As mentioned before, the measurement of flow rates in all individual channels is extremely difficult or nearly impossible. Therefore, the middle and side planes were selected as the measurement planes. A comparison of the velocity profiles between the middle and side planes can provide an indirect evaluation of the flow uniformity in the lateral direction. As shown in Figure 12, each vertical laser sheet was traversed to illuminate one column of vertical entrances or exits of the horizontal channels.
Since the cross-section size of each channel was too small (4.5 mm × 4.5 mm) to reasonably measure the mean velocity for each channel, each measurement plane near the exits of the channels was divided into five equal parts, as shown in Figure 12. Each measurement part was recorded using a lens with a focal length of 85 mm. The PIV images were analyzed using an in-house program [18] adopting correlation-based correction [19] and the multigrid method [20]. According to the accuracy evaluation through artificial particle images, the PIV program has less than 0.01 pixel mean error and uncertainty for shear flow, which corresponds to about 0.25% velocity error and uncertainty.

3. Results

For each measurement, 10,000 images were recorded at a rate of 200 or 400 Hz, and the ensemble average velocity field was obtained from 5000 instantaneous vector fields. Figure 13 shows the velocity fields and contours in the inlet header when a perforated plate is not installed, and the experimental and numerical simulation results are compared. In the inlet header, the overall flow pattern was of interest; thus, the PIV measurements were conducted for the entire inlet header region. The velocities were much higher in the middle plane than in the side plane. In addition, the highest velocity was observed in the region slightly below the centerline. This asymmetric flow is attributed to the introduction of water into the header through curved piping. Moreover, a counter-rotating vortex pair occurred in the inlet header. The flow distribution before the entrance of the horizontal channels was not uniform.
Figure 14 shows the velocity fields and contours in the inlet header when the designed perforated plate is installed, and the experimental and numerical simulation results are compared. The perforated plate with various hole diameters significantly alleviates the flow nonuniformity in the region after the perforated plate.
In the outlet header, the velocities near the exits of the channels were of interest because they were used to evaluate the flow uniformity over the horizontal channels indirectly. For this reason, the measurement plane in the region near the exits of the channels was divided into five equal parts, and the ensemble average velocity fields for different measurement parts were combined to obtain a velocity field with a high spatial resolution (2.6 mm). Figure 15 shows the velocity fields in the region near the exits of the channels. As shown in Figure 15a, when a perforated plate was not installed, the velocity field in the middle plane was not uniform. Moreover, the velocity fields in the middle and side planes were not similar. However, as shown in Figure 15b, the flow uniformity in the region near the exit of the channel improved significantly due to the perforated plate. The velocity field in the middle plane was relatively uniform and similar to the velocity field in the side plane. The flow uniformity over the 33 × 66 channels improved noticeably.
Next, the experimental and numerical simulation results are compared. In general, the PIV technique has a limitation in measuring the flow velocity near the wall. The measured velocity near the exit of the channel is not accurate. Hence, the velocity profiles at a distance of 20 mm from the channel exit were compared. Figure 15 shows the results of the comparison. With reference to Figure 14 and Figure 15, the main flow direction is from the right to the left. However, as shown in Figure 16, the horizontal flow velocity is reversed. The Y-axis represents the vertical position from the lowest bottom of the outlet header. The upper two graphs show the results when the perforated plate is not installed. Overall, the distributions of the experimentally measured velocities tend to be similar to the numerical simulation data. The velocity distribution is not uniform in the middle plane. In addition, the velocity distributions in the middle and side planes are not similar. The lower two graphs show the results when the perforated plate was installed. It can be seen that the distributions of the experimentally measured velocities tend to be similar to the numerical simulation data. The velocity profiles in the middle and side planes are similar.

4. Discussion

Table 2 shows the comparison results between the numerical and experimental velocity profiles shown in Figure 16. For a quantitative comparison, we calculated the mean absolute percentage error (MAPE). The MAPE is defined as
MAPE = 1 n i = 1 n | x exp i x sim i x exp i | × 100 ,
where n is the total number of data, xexp is the experimental value, and xsim represents the measured and simulation value. For the case where the perforated plate is not installed, the values of the MAPE in the middle and side planes are calculated to be 27.5% and 27.1%, respectively. For the case where the perforated plate is installed, the values of the MAPE in the middle and side planes are computed to be 28.8% and 23.6%, respectively. According to [21], those MAPE values indicates the reasonable agreement.
After the flow patterns were examined, the pressure drop between the two locations was investigated, as shown in Figure 11. Table 3 lists the pressure drop results. In the absence of the perforated plate, the numerical prediction (378.8 Pa) is extremely close to the experimentally measured value (388.1 Pa). The relative difference is only approximately 2%. When the perforated plate is installed, the pressure drop increased by 20.6% to 477.2 Pa in the numerical simulation and by 11.1% to 436.7 Pa in the experiment. The numerical simulation and experimental results show a slight increase in the pressure drop despite a significant improvement in the flow uniformity.

5. Conclusions

A perforated plate was designed to improve the flow uniformity in a heat exchanger used in an SFR steam generator. To experimentally validate the improvement of the flow uniformity, the PIV technique was applied to water flow in the heat exchanger unit.
The flow uniformity over the 33 × 66 channels was evaluated using numerical simulation results. To improve the flow uniformity, a perforated plate was installed in the middle of the inlet header. The local hole diameters on the perforated plate were determined based on the local flow velocities when the plate was not installed. As a result, the flow uniformity over the 33 × 66 channels improved greatly at a slight cost of pressure drop. Since the flow rate measurement for all individual channels is extremely difficult, experiments were conducted to validate the numerical simulation results. Planar PIV measurements were performed on the selected planes in the inlet and outlet headers. When a perforated plate was not installed in the inlet header, the velocities were much higher in the middle plane than in the side plane. In addition, the highest velocity was observed in the region slightly below the centerline. Moreover, a counter-rotating vortex pair occurred in the inlet header. The flow distribution before the entrance of the horizontal channels was not uniform. Most importantly, the velocity fields in the middle and side planes in the region near the exits of the channels were not similar. However, when the perforated plate was installed, the velocity field in the middle plane near the exits of the channels was relatively uniform and similar to the velocity field in the side plane, which means that the flow uniformity over the 33 × 66 channels improved.
The experimental velocity profiles near the exits of the channels were compared with numerical simulation data. A comparison between the experimental and simulation velocity profiles showed less than 30% MAPE, which means reasonable agreement. The numerical simulation and experimental results showed a slight increase in the pressure drop, despite significant improvement in the flow uniformity.
The newly designed perforated plate is expected to improve the heat transfer efficiency of the heat exchanger in the SFR steam generator.

Author Contributions

Data curation, formal analysis and writing, M.-H.K. and V.T.N.; Review, S.I., Y.J., and S.-R.C.; Supervision, review, and editing, B.-J.K. All authors have read and agreed to the published version of the manuscript.

Funding

This work was supported by the National Research Foundation of Korea (NRF) grant funded by the Korea government (MSIT). (No. 2021M2E2A1037871). This work was also supported by the research program at Chungnam National University.

Institutional Review Board Statement

Not applicable.

Informed Consent Statement

Not applicable.

Data Availability Statement

The data presented in this study are available on request from the corresponding authors.

Conflicts of Interest

The authors declare no conflict of interest.

References

  1. Technology Roadmap update for Generation IV Nuclear Energy Systems; the OECD Nuclear Energy Agency: Paris, France, 2014; p. 63.
  2. Development of a Combined Heat Exchanger Design Concept for an SFR Decay Heat Removal System; KAERI: Daejeon, Korea, 2014; p. 171.
  3. Yoo, J.; Chang, J.; Lim, J.-Y.; Cheon, J.-S.; Lee, T.-H.; Kim, S.K.; Lee, K.L.; Joo, H.-K. Overall System Description and Safety Characteristics of Prototype Gen IV Sodium Cooled Fast Reactor in Korea. Nucl. Eng. Technol. 2016, 48, 1059–1070. [Google Scholar] [CrossRef] [Green Version]
  4. Im, S.; Hong, J.; Han, J.-W.; Choi, S.R. In Preliminary Development of a Copper Bonded Steam Generator for minimizing a Sodium-Water Reaction. In Proceedings of the Transactions of the Korean Nuclear Society Spring Meeting, Jeju, Korea, 23–24 May 2019. [Google Scholar]
  5. Nguyen, V.T.; Choi, S.R.; Jung, Y.; Im, S.; Kim, B.J. Design of perforated plate for uniform flow distribution in heat-exchanger unit of SFR steam generator. J. Mech. Sci. Technol. 2021, 35, 3469–3474. [Google Scholar] [CrossRef]
  6. Jiao, A.; Zhang, R.; Jeong, S. Experimental investigation of header configuration on flow maldistribution in plate-fin heat exchanger. Appl. Therm. Eng. 2003, 23, 1235–1246. [Google Scholar] [CrossRef]
  7. Gajapathy, R.; Velusamy, K.; Selvaraj, P.; Chellapandi, P.; Chetal, S.; Sundararajan, T. Thermal hydraulic investigations of intermediate heat exchanger in a pool-type fast breeder reactor. Nucl. Eng. Des. 2008, 238, 1577–1591. [Google Scholar] [CrossRef]
  8. Wen, J.; Li, Y. Study of flow distribution and its improvement on the header of plate-fin heat exchanger. Cryogenics 2004, 44, 823–831. [Google Scholar] [CrossRef]
  9. Wen, J.; Li, Y.; Wang, S.; Zhou, A. Experimental investigation of header configuration improvement in plate–fin heat exchanger. Appl. Therm. Eng. 2007, 27, 1761–1770. [Google Scholar] [CrossRef]
  10. Lalot, S.; Florent, P.; Lang, S.; Bergles, A. Flow maldistribution in heat exchangers. Appl. Therm. Eng. 1999, 19, 847–863. [Google Scholar] [CrossRef]
  11. Khovanskyi, S.; Pavlenko, I.; Pitel, J.; Mizakova, J.; Ochowiak, M.; Grechka, I. Solving the Coupled Aerodynamic and Thermal Problem for Modeling the Air Distribution Devices with Perforated Plates. Energies 2019, 12, 3488. [Google Scholar] [CrossRef] [Green Version]
  12. Petinrin, M.; Dare, A. Numerical Investigation of the Concave-Cut Baffles Effect in Shell-and-Tube Heat Exchanger. J. Eng. Sci. 2019, 6, e1–e9. [Google Scholar] [CrossRef]
  13. Petinrin, M.O.; Towoju, O.A.; Ajiboye, S.A.; Zebulun, O.E. Numerical Study of the Effect of Changing Tube Pitches on Heat and Flow Characteristics from Tube Bundles in Cross Flow. J. Eng. Sci. 2019, 6, e1–e10. [Google Scholar] [CrossRef]
  14. Baek, S.; Lee, C.; Jeong, S. Effect of flow maldistribution and axial conduction on compact microchannel heat exchanger. Cryogenics 2014, 60, 49–61. [Google Scholar] [CrossRef]
  15. Lance, B.W.; Carlson, M.D. Microchannel Heat Exchanger Flow Validation Study, Turbo Expo: Power for Land, Sea, and Air, 2018; American Society of Mechanical Engineers: Oslo, Norway, 2018; p. V009T38A027. [Google Scholar]
  16. ANSYS Fluent Theory Guide; ANSYS: Canonsburg, PA, USA, 2016.
  17. Westerweel, J. Fundamentals of digital particle image velocimetry. Meas. Sci. Technol. 1997, 8, 1379–1392. [Google Scholar] [CrossRef] [Green Version]
  18. Kim, B.J.; Sung, H.J. A further assessment of interpolation schemes for window deformation in PIV. Exp. Fluids 2006, 41, 499–511. [Google Scholar] [CrossRef]
  19. Hart, D.P. PIV error correction. Exp. Fluids 2000, 29, 13–22. [Google Scholar] [CrossRef]
  20. Scarano, F.; Riethmuller, M.L. Iterative multigrid approach in PIV image processing with discrete window offset. Exp. Fluids 1999, 26, 513–523. [Google Scholar] [CrossRef]
  21. Meade, N. Industrial and business forecasting methods, Lewis, C.D., Borough Green, Sevenoaks, Kent: Butterworth, 1982. Price: £9.25. Pages: 144. J. Forecast. 1983, 2, 194–196. [Google Scholar] [CrossRef]
Figure 1. Schematic diagram of the copper-bonded steam generator for sodium-cooled fast reactor.
Energies 14 05846 g001
Figure 2. One-quarter (1/4)-scaled geometry model for the sodium flow side.
Energies 14 05846 g002
Figure 3. Dimensions of the horizontal sodium channel array.
Energies 14 05846 g003
Figure 4. (a) Vertical and middle cross-section of the flow domain, (b) Mesh view in the middle plane in the inlet region, (c) Mesh view in the cross-sectional plane of one horizontal flow channel.
Energies 14 05846 g004
Figure 5. Distribution of the mass flow rates over the 33 × 66 channels when no perforated plate is installed.
Energies 14 05846 g005
Figure 6. Contours of the velocity magnitude in the cross-section plane at a = 80 mm (zy-plane): (a) continuous contour and (b) five-level contour.
Energies 14 05846 g006
Figure 7. Final design of the perforated plate.
Energies 14 05846 g007
Figure 8. Distribution of the mass flow rates over the 33 × 66 channels when the perforated plate is installed.
Energies 14 05846 g008
Figure 9. Exit view of the 33 × 66 channels in the heat exchanger unit.
Energies 14 05846 g009
Figure 10. Experimental setup.
Energies 14 05846 g010
Figure 11. Schematic diagram of the test section: ① continuous laser sheet, ② differential pressure gauge.
Energies 14 05846 g011
Figure 12. Positions of laser sheets for planar PIV.
Energies 14 05846 g012
Figure 13. Velocity fields and contours in the inlet header when the perforated plate is not installed: (a) experiment and (b) numerical simulation.
Energies 14 05846 g013
Figure 14. Velocity fields and contours in the inlet header when the perforated plate is installed: (a) experiment and (b) numerical simulation.
Energies 14 05846 g014
Figure 15. Ensemble average velocity fields in the region near the channel exits in the outlet header: (a) in the absence of perforated plate and (b) when the perforated plate is installed.
Energies 14 05846 g015
Figure 16. Comparison of the measured horizontal velocity profiles with the numerical simulation data: (a) without perforated plate (middle plane), (b) without perforated plate (side plane), (c) with perforated plate (middle plane), and (d) with perforated plate (side plane).
Energies 14 05846 g016
Table 1. Simulation results for different grid cases.
Grid CaseNumber of Cells, 106CoVΔp (Pa)
146.40.2401490.2
294.10.2496410.5
3108.50.2536378.8
4122.90.2512379.3
Table 2. Comparison of simulation and experimental velocity profiles.
Perforated PlatePositionMAPE
Not installedMiddle plane27.5%
Side plane27.1%
InstalledMiddle plane28.8%
Side plane23.6%
Table 3. Pressure drop.
Perforated PlateNumerical SimulationExperiment
Not installed378.8 Pa388.1 Pa
Installed477.2 Pa (20.6% ↑)436.7 Pa (11.1% ↑)
Publisher’s Note: MDPI stays neutral with regard to jurisdictional claims in published maps and institutional affiliations.

