1. Introduction
Despite the fact that freshwater and energy are essential for human survival, existing and future energy and freshwater demands are having a significant impact on the earth. Renewable Energy (RE) resources play a critical role in addressing these concerns. This is especially true in rural and distant areas where the grid expansion is neither feasible nor cost-effective. For a multitude of reasons, planning and constructing an off-grid microgrid is difficult from a both technological and economic perspective. One of them is the reliance of RE resources on meteorological conditions. A suitable battery storage system is needed for power supply continuity. In order to fulfil the energy requirements, most off-grid systems are either over or under-sized. While the larger system is more expensive and produces more energy, the smaller system is incapable of meeting the required load demands, resulting in a power supply shortage. To overcome these challenges and fully utilize the benefits of an off-grid microgrid built with RE sources, an Energy Management Strategy (EMS) is necessary [
1]. Furthermore, renewable energy resources, particularly solar energy resource can be used in a wide range of applications, including solar dryers, solar home systems, solar cookers, thermal power generation and water heaters. The biomass generator can produce both heat and electricity. The hydro energy resource can be used for irrigation, drinking water supply and hydropower generation. Wind energy has many applications, including power generation, water pumps and windmills. Some commercial and residential applications of battery energy storage systems are explained as follows. From a commercial point of view, battery energy storage systems are useful in the following applications such as peak shaving, emergency backup, microgrids, load shifting, grid services and renewable energy resource integration. From a residential standpoint, battery energy storage systems are useful in the following applications: storing excess energy produced by the solar PV panels, emergency backup and off-grid applications.
Numerous studies on the sizing of microgrids have been published in reputed journals. These approaches can be classified into three broad categories, which are categorized as follows: (i) software tools such as IHOGA, RETScreen, HOMER and HOGA, [
2] (ii) deterministic methodologies such as linear programming, numerical, iterative, graphical design, analytical and probabilistic methods [
3] and (iii) metaheuristic algorithms such as Grasshopper Optimization Algorithm (GOA), Moth Flame Optimization (MFO), Genetic Algorithm (GA) and Dragonfly Algorithm (DA). Nevertheless, while software tools are simple to use the relevant components inside them cannot be picked. Furthermore, its algorithms and calculations are hidden from users. When it comes to estimating the size of a microgrid, software tools are constrained by certain assumptions. Deterministic approaches, on the other hand, outperform the software tools but the solutions are trapped at the local optima due to its complex design. They are unable to discover the global best optimal values under such conditions. It should be run several times with random beginning conditions to prevent the local optima trapping. Hence, the solution is unlikely to be the global best optimum value. Obtaining the global best optimal solution may necessitate multiple efforts. Finally, metaheuristic algorithms were chosen as the most promising methods, and they are widely used for optimization problems [
4].
Last decade, metaheuristic algorithms were built to manage microgrid sizing issues. Surprisingly, certain algorithms, such as Differential Evolutionary Algorithm (DE), Particle Swarm Optimization (PSO) [
5] and GA, are well-known among most software engineers as well as other researchers from other disciplines. They are adaptable techniques and offer better results than deterministic methods by preventing the local optima entanglement. These algorithms offer a range of properties that allow them to tackle any optimization problem and they solve optimization problems by imitating natural processes. On the other hand, the No-Free-Lunch theorem states that while a specific metaheuristic algorithm can produce optimal results for a specific objective function, the same algorithm produces lower performance in other objective functions. For such reasons, researchers working on microgrid sizing issues have looked at robust metaheuristic algorithms [
6].
A review of the literature on off-grid microgrid size issues revealed that evaluating the techno-economic feasibility analysis with various battery technologies to deliver an uninterrupted electrical supply is quite limited. Moreover, researchers can determine a specific algorithm’s robustness and convergence efficiency using various algorithms. However, such studies are limited.
The limitations stated above should be addressed while analyzing perfect off-grid rural electrification from a techno-economic perspective. So, taking these limitations into account, some research has been undertaken to supply power to four un-electrified villages in the Indian state of Odisha. After conducting some research in the study area, it was discovered that the accessible RE resources in the study area are solar and biomass. Solar energy is the most volatile of the two RE resources due to its time-dependent nature and weather conditions. So, the power supply is not continuous. Hence, a robust battery system is essential to ensure a continuous electrical supply. Therefore, in this study, a detailed analysis with three v kinds of batteries, such as Ni-Fe, Li-Ion and LA, has been carried out. Three types of configurations are modelled using available RE resources and battery technologies to identify the most viable configuration for electrifying the study region, such as Photovoltaic Panels (PVP)/ Biomass Generator (BIOMG)//BATTERY
(Ni-Fe), PVP/BIOMG/BATTERY
(Li-Ion) and PVP/BIOMG/BATTERY
(LA). In order to find out a feasible configuration to electrify the study area, nine proven metaheuristic algorithms have been used in the study, such as Differential Evolutionary Algorithm (DE) [
5], Genetic Algorithm (GA) [
6], Moth Flame Optimization (MFO) [
7], Dragonfly Algorithm (DA) [
8], Particle Swarm Optimization (PSO) [
9], Ant Lion Optimization (ALO) [
10], Grey Wolf Optimization (GWO) [
11], Grasshopper Optimization Algorithm (GOA) [
12] and Dynamic Differential Annealed Optimization Algorithm [
13]. Finally, after identifying the optimal configuration, it is evaluated with various loss of power supply probability values.
The novelty in this work can be summarized as:
A renewable energy-based plan for electrification of an un-electrified village in a remote location.
Identification of a suitable optimization algorithm amongst nine prominent ones in the literature for energy management.
Exploration of the most cost-effective and technically suitable battery storage technology for the given setup.
Identify the best configuration cost wise amongst three different possibilities.
2. The Study Area Identification
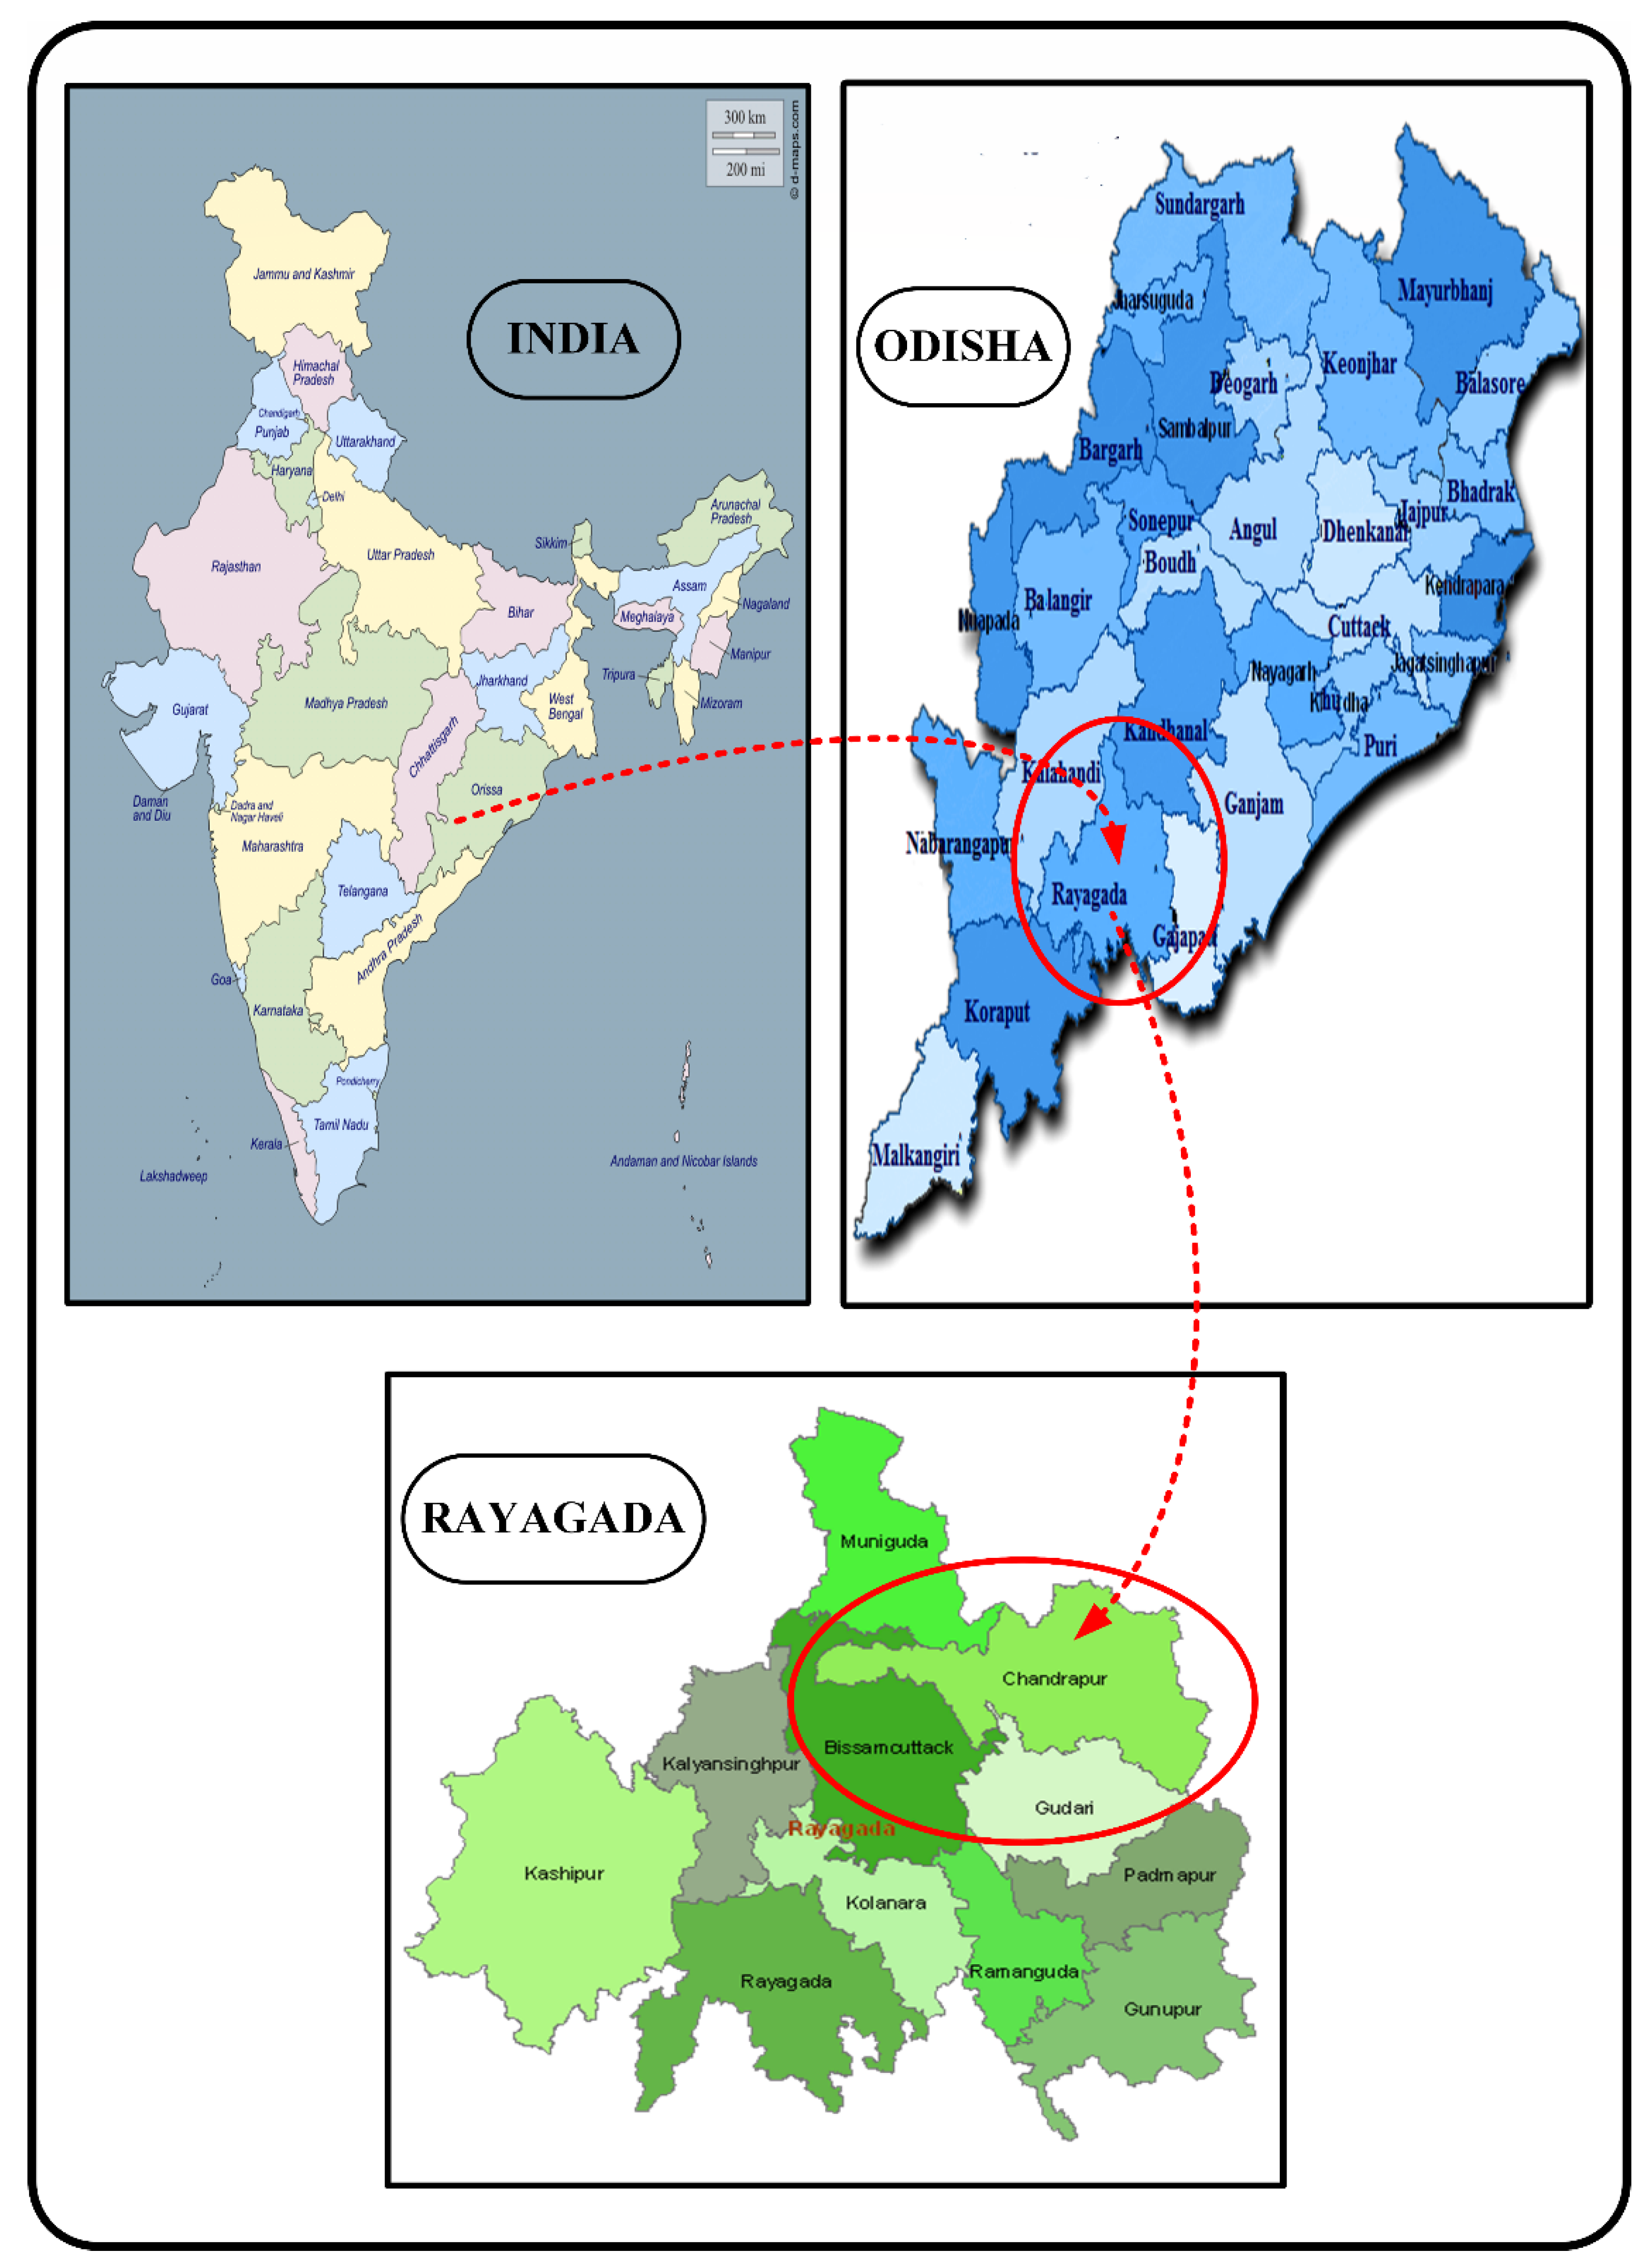
The study examined the off-grid rural electrification procedure using an off-grid remote rural area located more than 50 km away. Power supply to this area via grid connection is not possible due to the area’s hilly terrain and its location in the middle of a dense forest. Four villages are included in the study area, which are located in the Chandrapur block of the Rayagada district of Odisha state in India.
Figure 1 depicts the study area’s location on a map of India. The study area’s latitude and longitude are 19.5927° N and 83.8712° E, respectively. The whole population of the villages is accommodated in 153 houses. People in this area continue to rely on candles, kerosene lanterns and solar lamps for illumination.
3. Renewable Energy Resources Identification in the Study Region
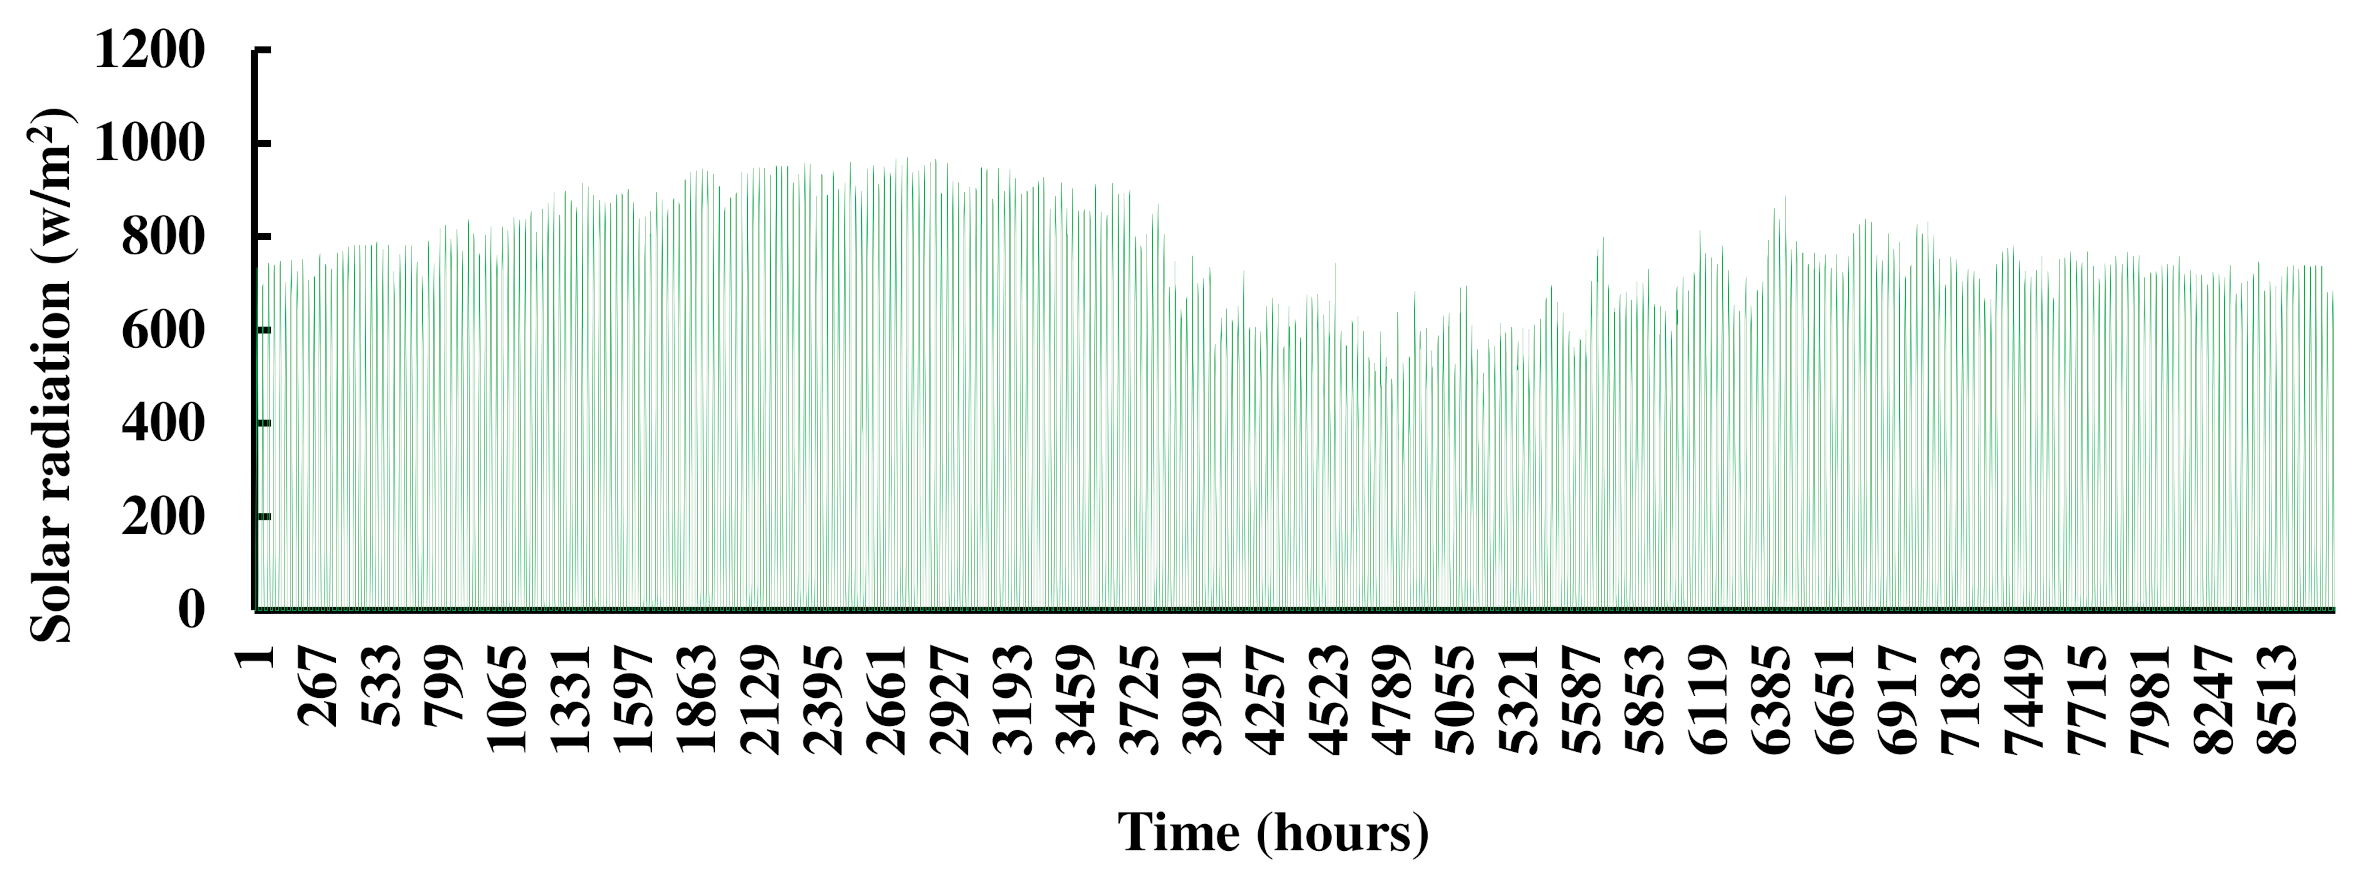
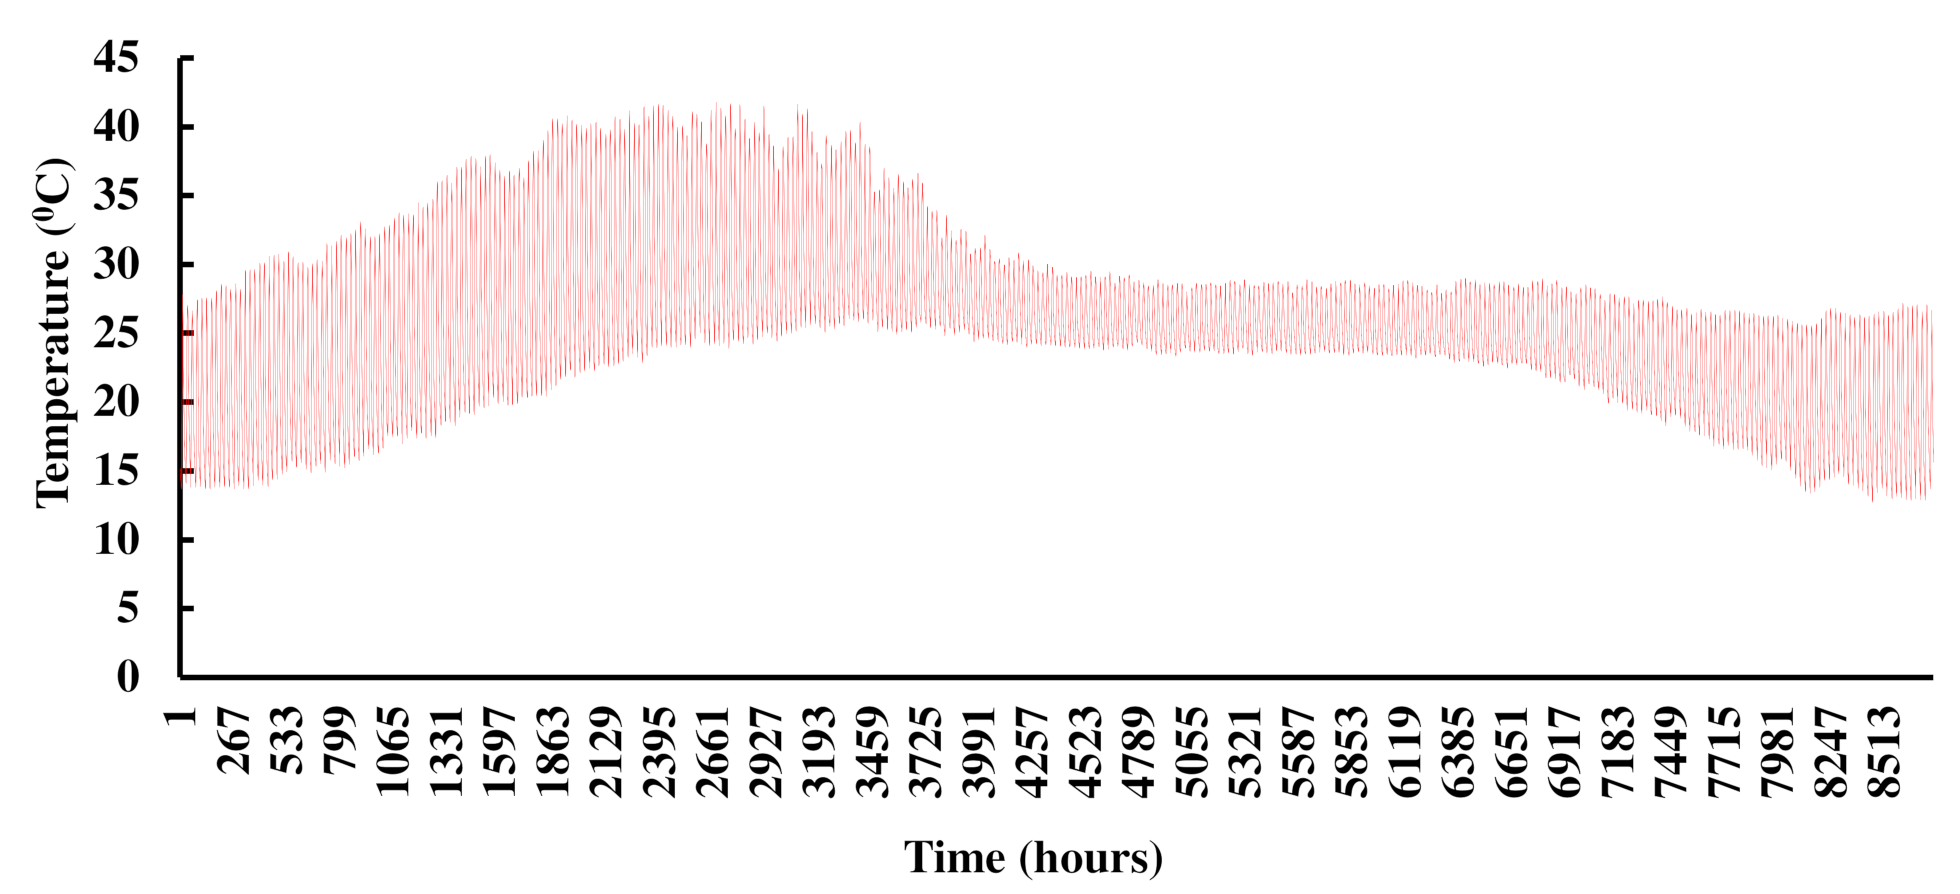
Natural RE resources can be exploited to electrify off-grid areas. The study area has been completely covered by solar and biomass energy resources. The study area’s annual ambient temperature is 26 °C. The simulation used a ten-year average, i.e., from 2005 to 2015, of ambient temperature and solar radiation values obtained from the National Renewable Energy Laboratory, which are provided, respectively, in
Figure 2 and
Figure 3. The study area is located in the middle of a high-density forest, which is around 196 hectares. With a foliage production assumption of 16 tons per hectare. Each year, the foliage for the 196 hectares of forest will be 31.36 tons. If the yearly foliage collecting rate is 60%, the annual foliage collection will be around 19 tons.
4. Study Area’s Load Estimation
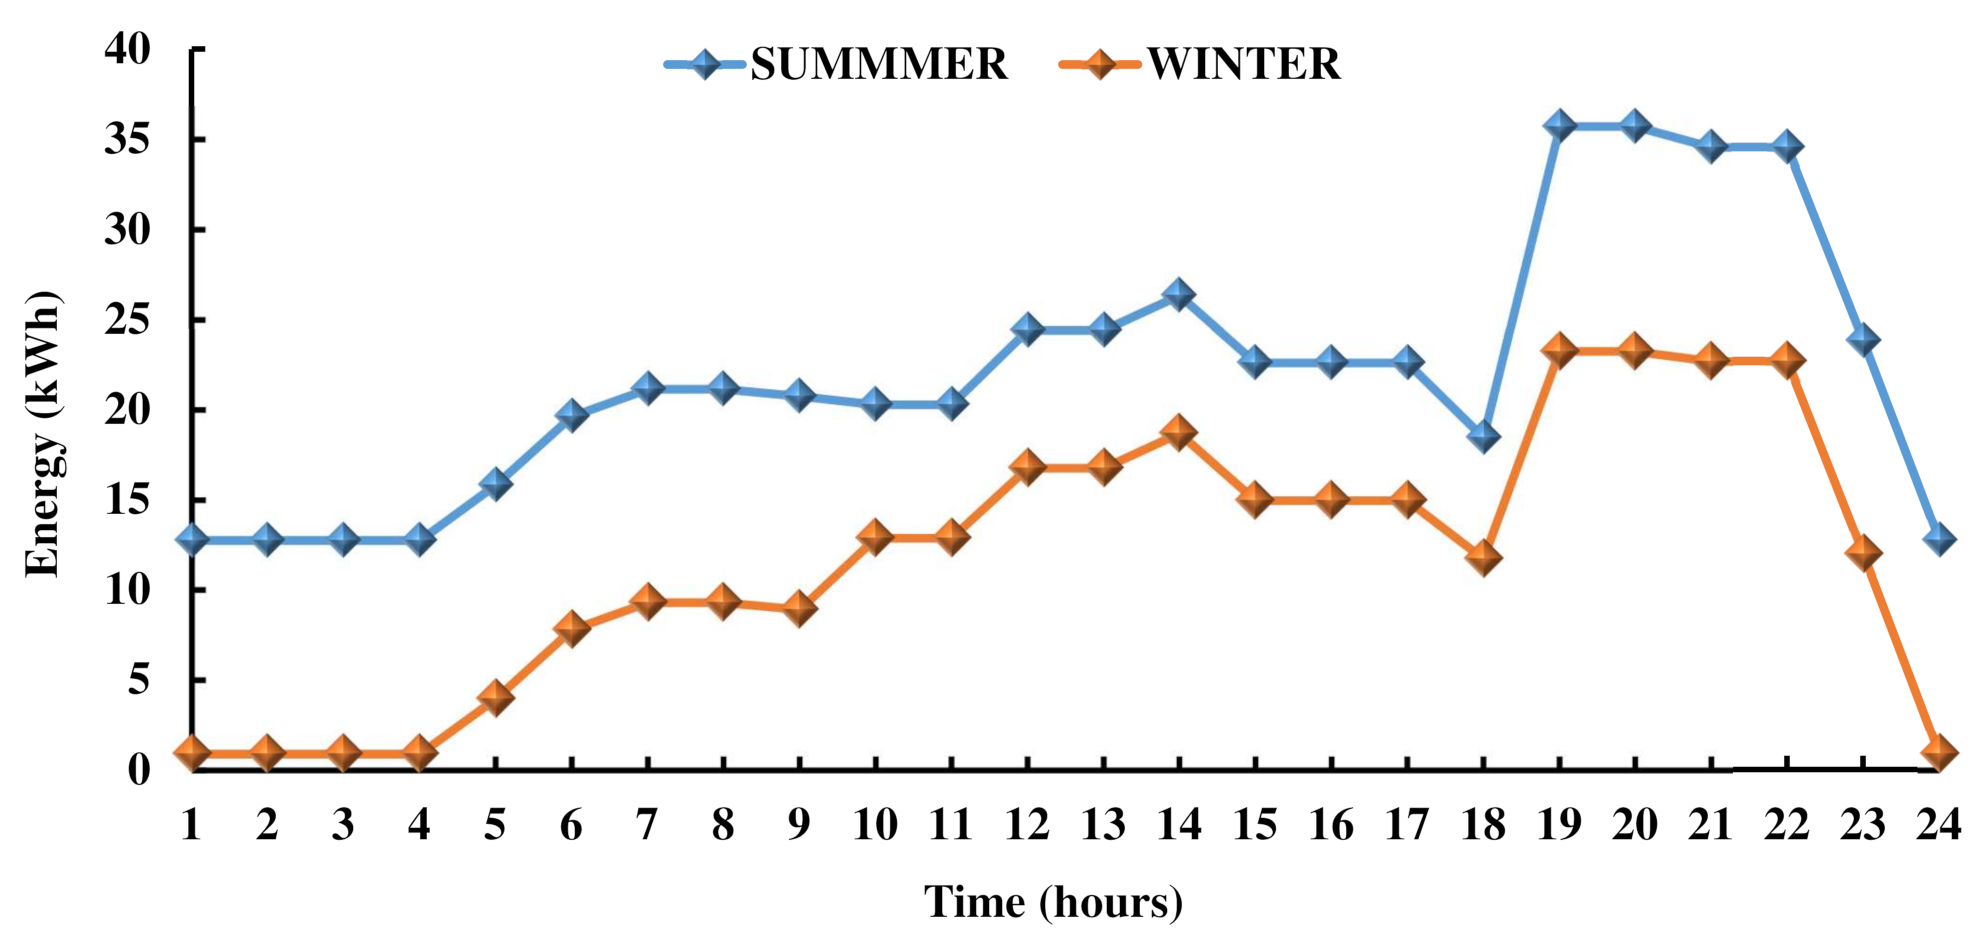
The load demands have been estimated based on the villagers’ load requirements. According to villagers’ needs, the total number of load sectors is anticipated to be domestic, community, agricultural, small scale industrial and commercial.
Table 1 clearly explains the complete load estimation details of the rated power, quantity and time of usage of the appliances for the study areas winter (November–February) and summer (March–October) seasons of the study area.
Figure 4 depicts the corresponding load demand graphs.
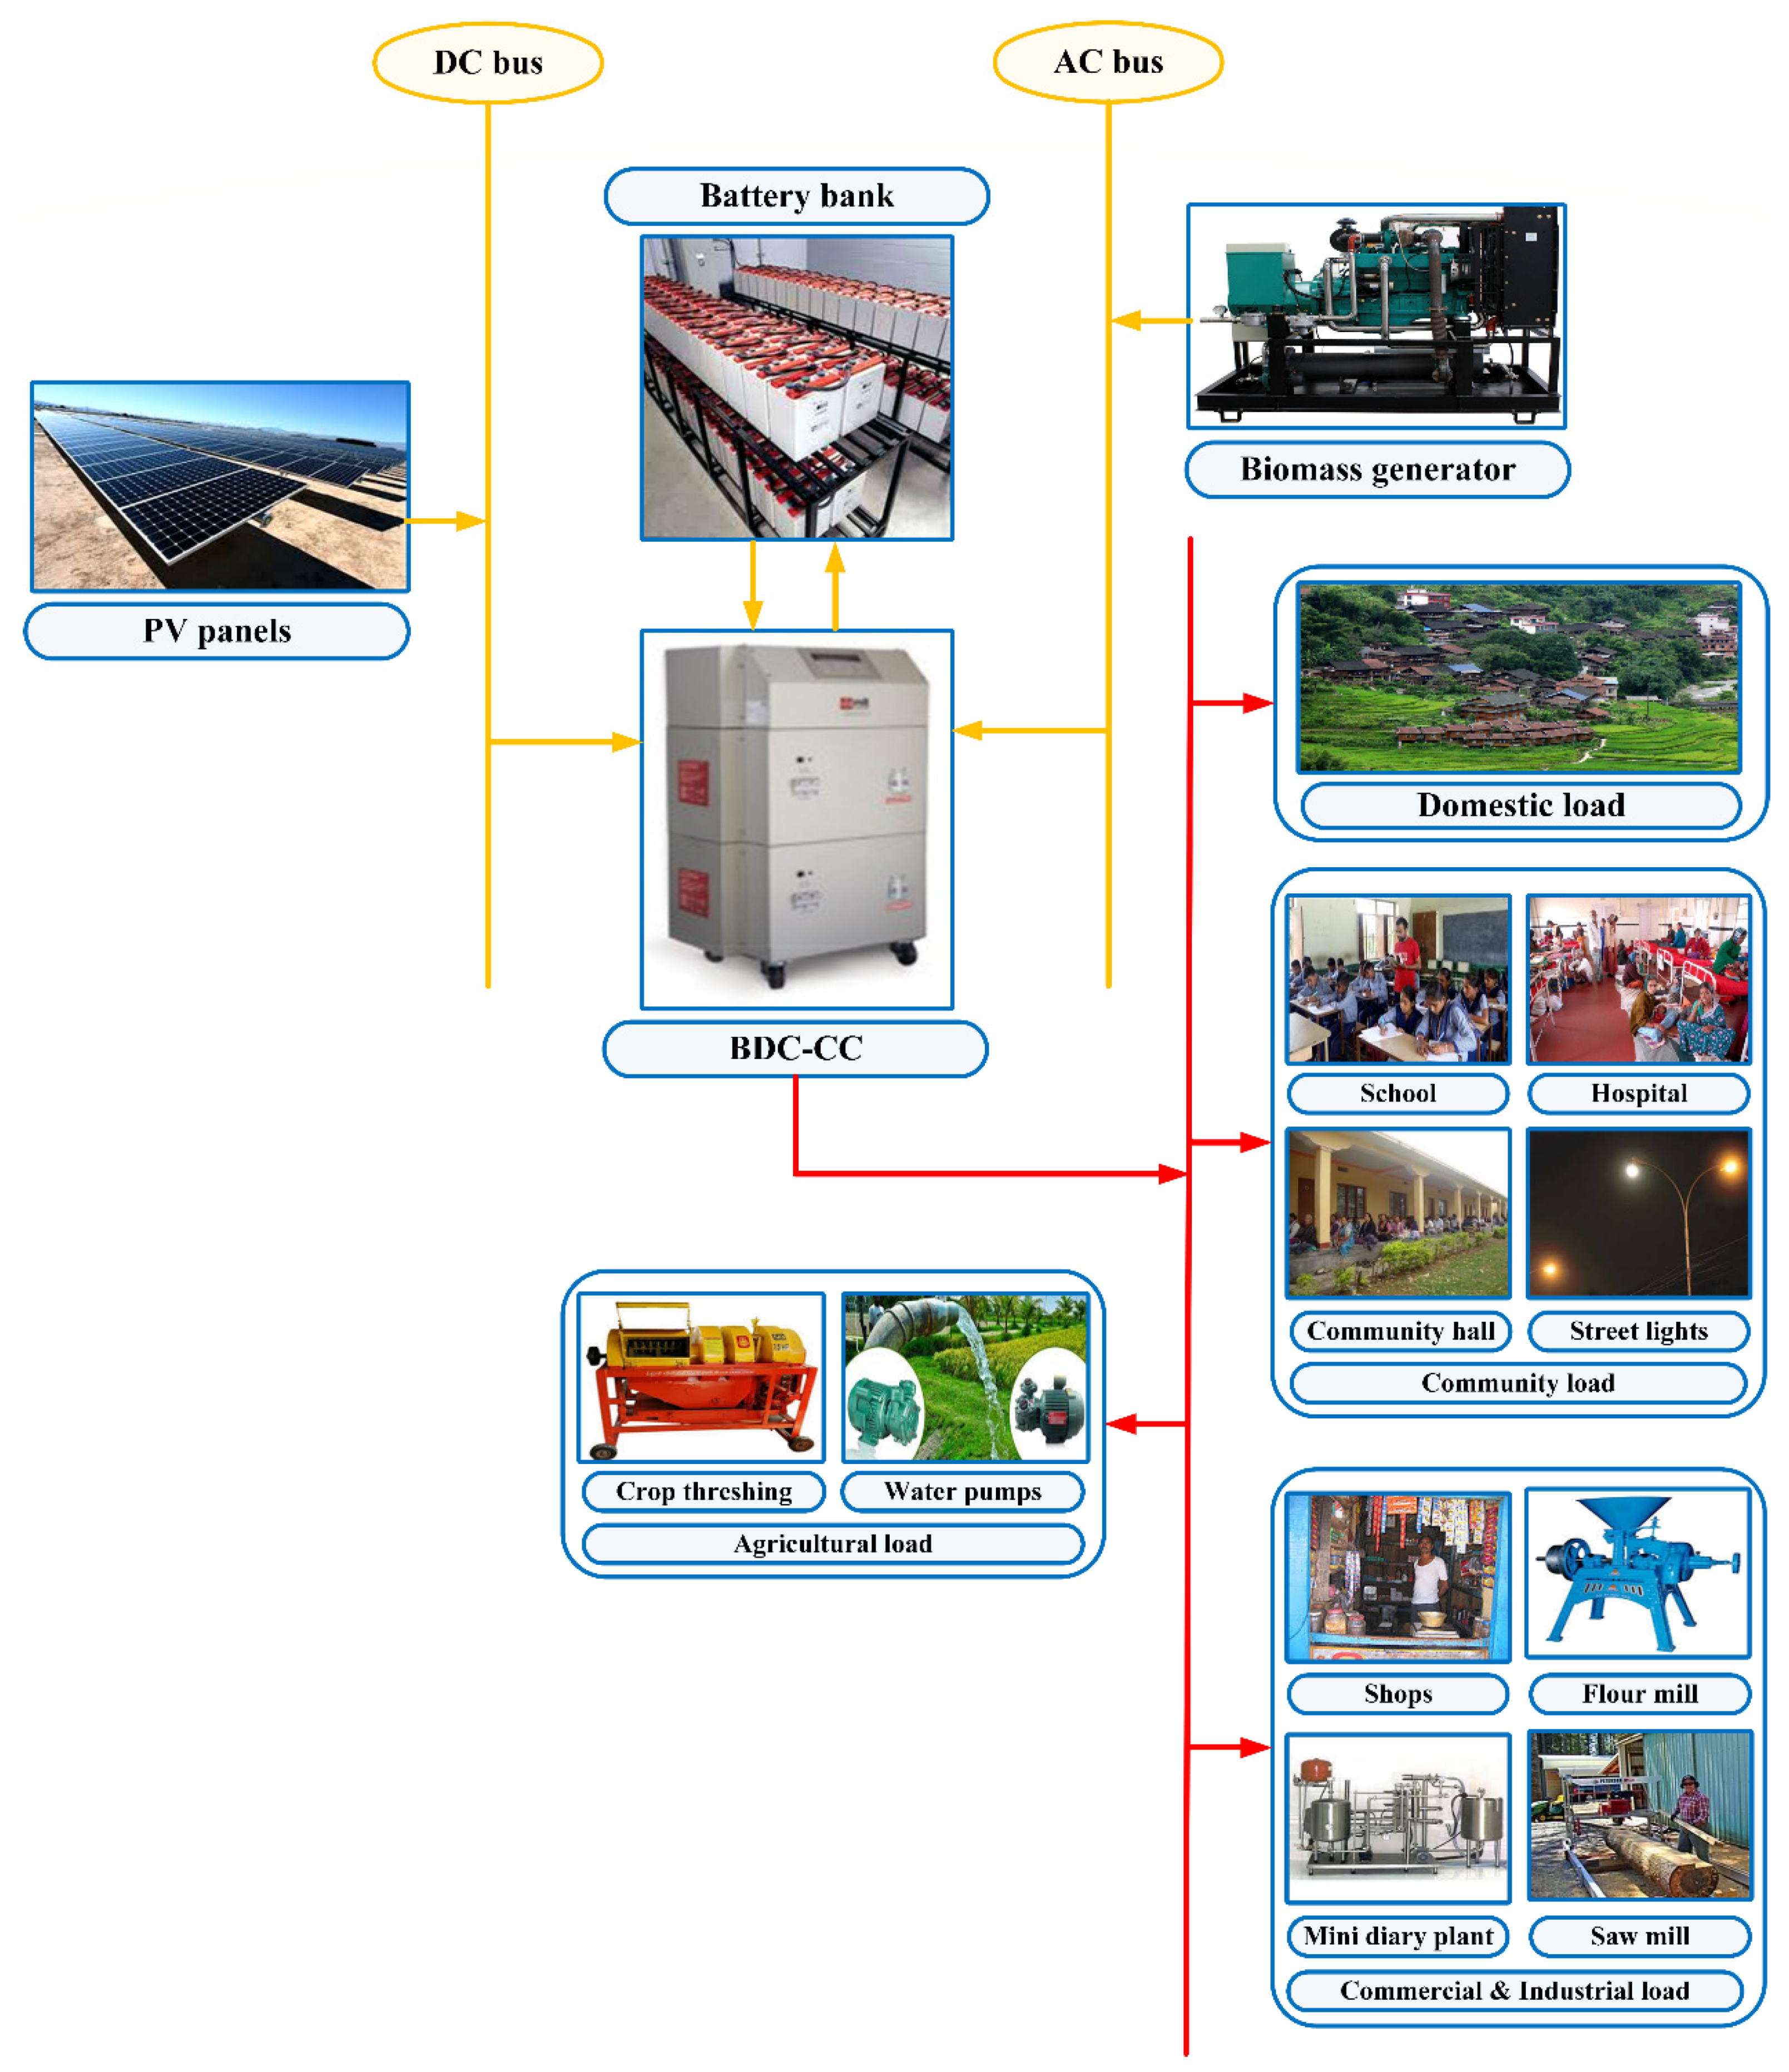
5. The Components of Mathematical Modelling
The optimal sizing of an off-grid microgrid is primarily determined by the components utilized in the analysis, hence accurate component analysis is essential before optimal sizing of the off-grid microgrid. The current study includes PV panels, a biomass generator, a battery bank and a bi-directional converter with a charge controller. The schematic diagram is shown in
Figure 5.
5.1. Solar Energy System
A variety of approaches can be used to compute the PV output power from the PV panels. A normal framework was employed in this study to compute the output power of the PV panels, which was determined by taking into consideration of hourly ambient temperature and solar radiation values [
14]:
where,
= the standard test condition temperature value i.e., 25° degrees Celsius for PV cells.
= the PV panel’s rated power,
= at maximum power, the temperature coefficient, its value is 3.7 × 10
−3 (1/°C) and
= the solar radiation value at reference condition, its value is 1000 W/m
2..
The PV panel cell temperature
can be determined as:
The amount of energy produced by the PV panels (
) can be determined as follows:
where, Δ
t = time period.
5.2. Biomass Generator
In this study, we are advised to use the down draught gasifier model of biomass generator. The following equation can be used to calculate the power generated by the Biomass Generator [
1]:
where, the conversion factor from kcal to kWh is 860,
= biomass quantity (tons/year),
= efficiency of the biomass generator,
= per day operative hours of the biomass generator and
= the biomass has a calorific value of 4015 kcal/kg.
The biomass generator’s hourly energy output is determined as follows:
5.3. Battery Bank
When RE sources are not available to deliver power, the battery bank will supply power in off-grid systems. In general, the battery bank stores the extra energy generated by the RE sources. This phenomenon is known as a battery bank charging process, and it is expressed by the equation below [
14,
15]:
where,
, and
are the energy levels of a battery bank, respectively, at time “
” and “
”,
= hourly self-discharge rate of the battery,
= efficiency of the charge controller,
= electrical energy demand,
= generated electrical energy,
= the bidirectional converter’s efficiency and
= the battery’s round-trip efficiency.
The total electrical energy generation is calculated as:
where, (
) denotes the DC energy produced by the RE resources:
The AC energy (
) produced by RE sources is calculated as follows:
Whenever the energy produced by the RE sources is inadequate to meet the load demands or when RE resources completely fail to meet the load demand. The energy in the battery bank will supply the load demand; this occurrence is known as the battery bank discharge process, and it is described in the following equation:
5.4. Bi-Directional Converter with a Charge Controller
The bi-directional converter is essential in off-grid systems because it collects energy from both DC and AC sources. Its primary function is to convert direct current to alternating current and vice versa. The charge controller inside the converter is useful for controlling the battery bank’s overcharging and discharging. The following equation can be used to compute the converter’s rated power for the off-grid microgrid [
2]:
The multiplication factor 1.1 specifies the converter’s overloading capacity, which means that the converter power rating should be 10% greater than the system’s peak load demand.
6. Economic Analysis of the Off-Grid Microgrid
The Life Cycle Cost (LCC) technique is widely used for economic analysis. The LCC has been estimated in this study by adding the Initial Capital Costs (ICC), Erection Costs
, the Present Value of O&M Costs
, the Present Value of Replacement Costs
and the Present Value of Fuel Costs
using all system components, which is expressed as follows [
2]:
The initial capital cost (
) of the IRES components are calculated as follows [
2]:
where,
,
,
and
are the initial capital costs of the biomass generator, PV panels, batteries and bi-directional converter with a charge controller respectively.
The erection costs (
) of the IRES components are calculated as follows [
2]:
where,
,
,
and
are erection costs of the PV panels, batteries and bi-directional converter with a charge controller and biomass generator, respectively.
The present value of annual O&M (
) costs of the IRES components are calculated as follows [
2]:
where,
,
,
and
are O&M costs of the PV panels, biomass generator, batteries and bi-directional converter with a charge controller, respectively, and
y is defined as follows [
2]:
where,
= nominal interest rate,
y = discount rate,
N = life span of the project and
x = inflation rate of the project.
The IRES components, such as a bi-directional converter with a charge controller, biomass generator are needed to replace because they have a shortened lifespan than the project lifetime. The present value of annual replacement cost (
) of the microgrid is calculated as follows [
2]:
where,
,
and
are the replacement costs of the batteries, biomass generator and bi-directional converter with a charge controller, respectively, and the
is defined as follows [
2]:
where,
= the number of replacements needed for the system components and
= life span of each system component.
The present value of annual fuel cost (
PV,FUEL) of the microgrid is calculated as follows [
2]:
where,
and
are the quantity and cost of the biomass.
7. The Objective Function and Its Constraints
The objective function of the system is finding the optimal Life Cycle Cost (LCC) of the system. The system cost mainly depends on two variable parameters such as the number of PV panels and batteries. The objective function is defined as follows:
7.1. Upper and Lower Bounds
In this study, the biomass generator is considered as a fixed energy resource. Which is operational every day for 5 h, i.e., from 6 p.m. to 10 p.m. The biomass generator’s rated power is considered to be 10 kW. The biomass generator produces around 9 kWh of energy each hour. As a result, the biomass generator is not bound by any constraints. PV energy is the remaining energy resource, which is bound by the following constraint.
where,
is the number of PV panels.
The battery bank is bound by the following constraint.
where,
is the number of batteries.
7.2. Battery Bank Energy Storage Limits
During the charging and discharging processes, some energy will be stored or discharged from the battery bank, which will be limited by the following constraints [
3]:
The battery bank’s min-max energy storage levels are computed as follows:
where,
= rated capacity of the battery (Ah) and
= battery’s voltage.
The battery’s min-max state of charges are computed as follows:
where,
DOD is the depth of discharge of the battery.
7.3. Power Reliability Index
A microgrid’s power reliability can be described as its capacity to supply power on a continuity basis. The
LPSP is a critical microgrid criterion that will define the microgrid’s power supply continuity. Which is calculated as follows [
4]:
where,
is the loss of power supply at any hour “
t”
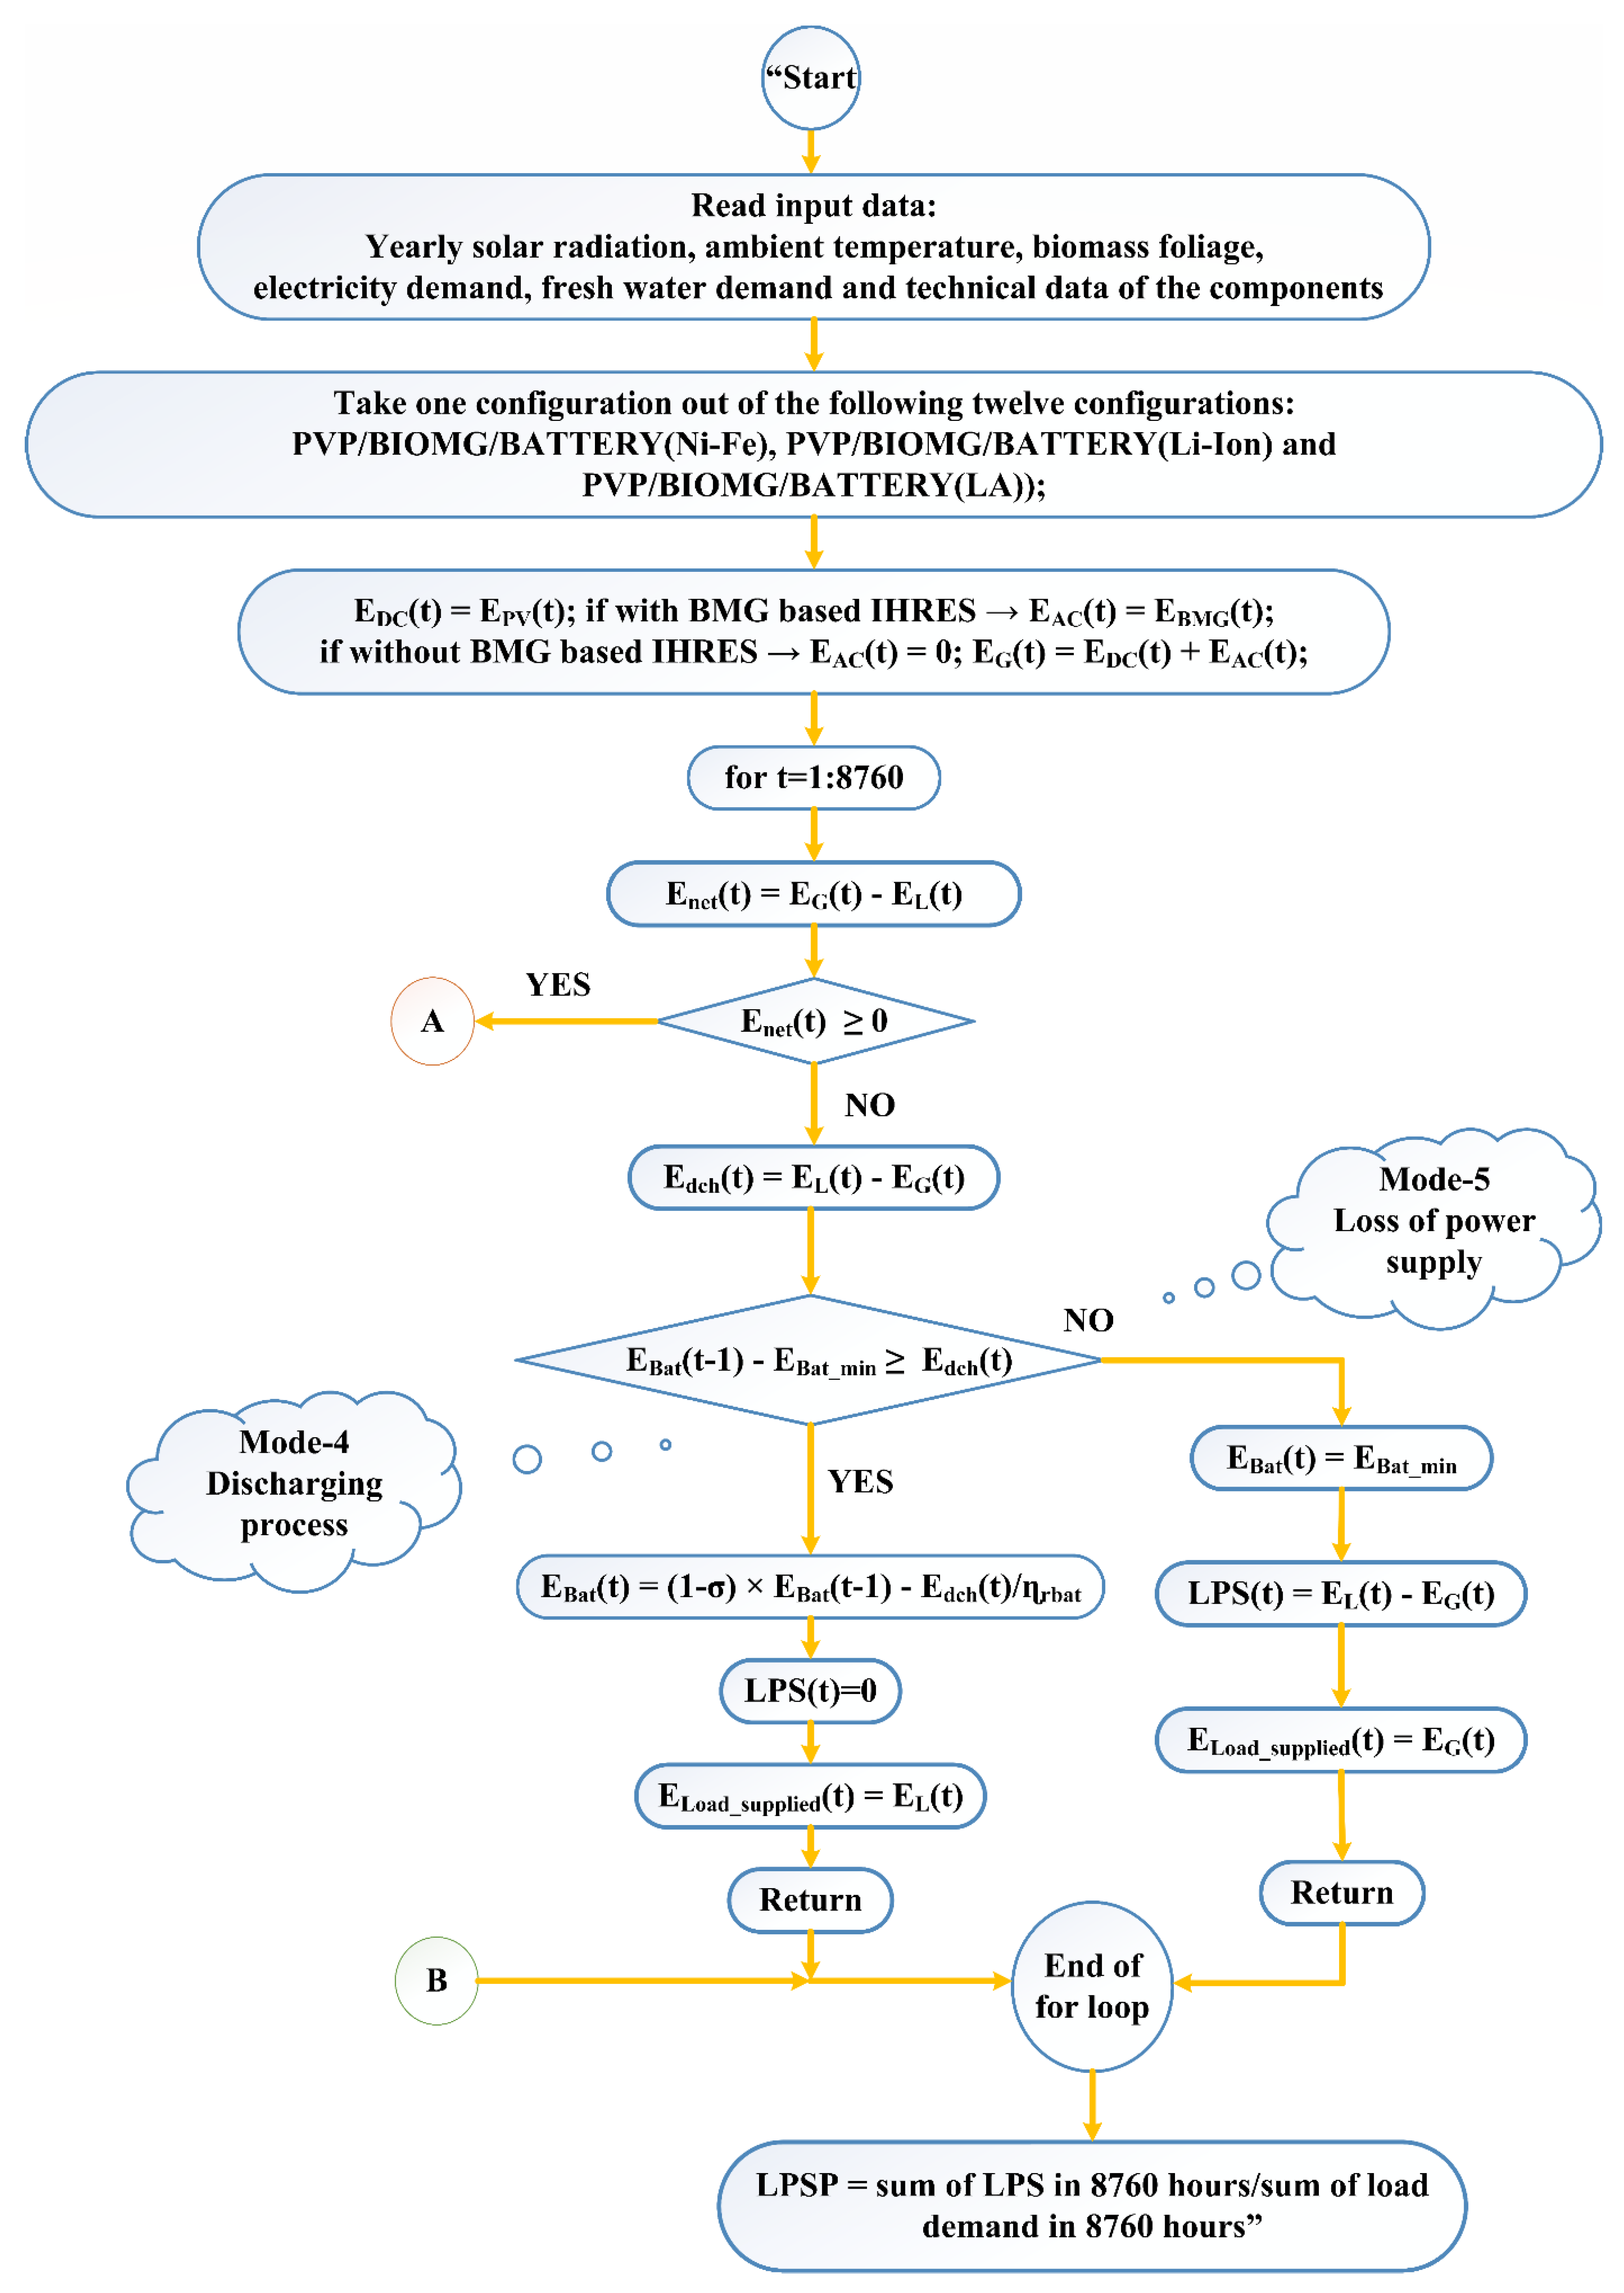
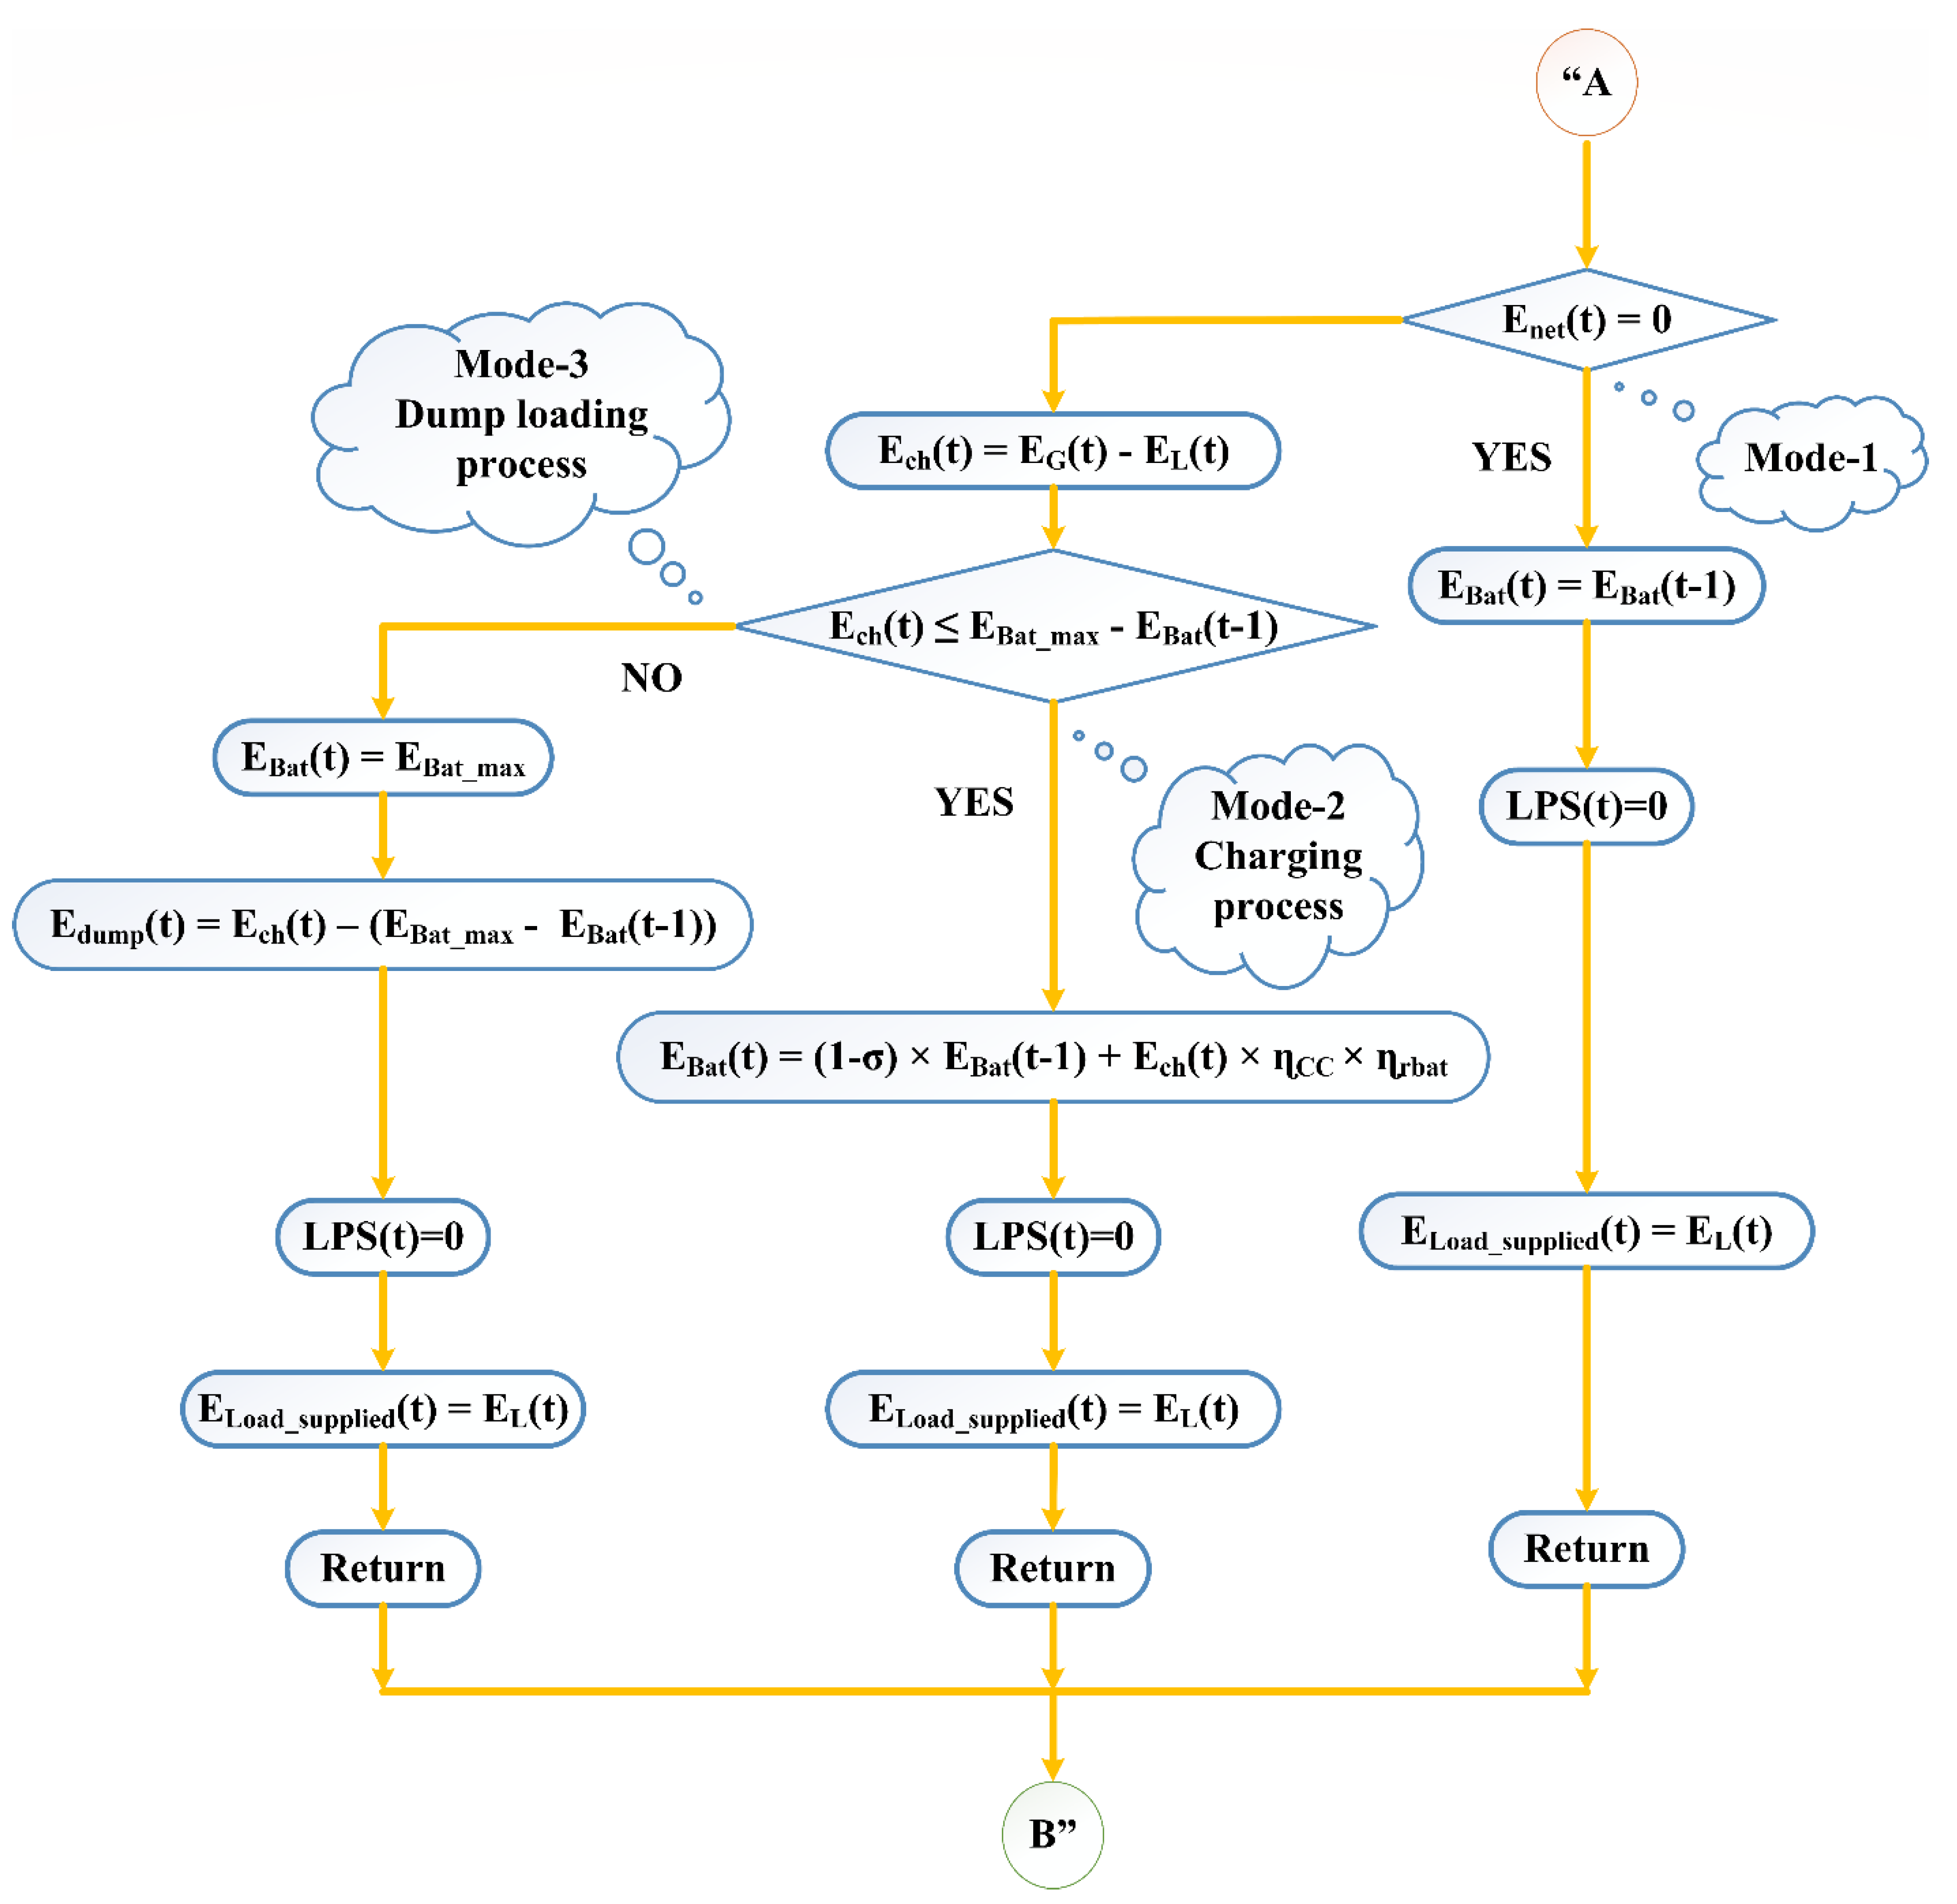
8. Methodology
The methodology of the power flow among the various components used in the study are explained in the following modes of operation [
5]:
Mode 1: In this operating mode, the power produced by the RE sources is equal to the load demand, hence there is no deficit or excess energy in the system.
Mode 2: In this operating mode, whenever the RE sources generate excess energy, it will be stored in the battery bank through the charging process of the battery bank.
Mode 3: In this operating mode, both the energy generated by the RE resources and the energy stored in the bank are at their maximum capacity. At this time, the extra energy generated will be delivered to the dump load.
Mode 4: This mode of operation demonstrates that whenever the energy provided by the RE resources is insufficient to supply the load demand, the energy stored in the battery bank will be delivered to the loads through the discharging process of the battery bank.
Mode 5: In this operating mode, the energy provided by the RE resources does not meet the load demand and the battery bank is also at its minimum energy storage levels, resulting in a loss of power supply to the system.
The above-mentioned modes of operation are depicted pictorially in the form of a flowchart as shown in
Figure 6 and
Figure 7.
9. Results and Discussion
In general, using the existing RE resources, rural distant communities can be electrified. However, the fundamental disadvantage of RE resources is their inherent nature, as well as their energy production depends on the metrological conditions in the chosen location. As a result of the RE resources’ time and metrological dependence, the power supply to the study area is not continuous.
As a result, while RE resources were used to electrify the study area, one of the key problems with these resources is that they cannot provide a continuous power supply. Hence, a reliable battery storage system is required to provide a continuous power supply. So, three different types of battery technologies have been proposed in this study to provide a continuous power supply in order to select a battery technology that is technologically and economically feasible for the study area.
Finally, we have been modelled three different types of configurations employing available RE resources and battery technologies, such as PVP/BIOMG/BATTERY(Ni-Fe), PVP/BIOMG/BATTERY(Li-Ion) and PVP/BIOMG/BATTERY(LA) to Identify a configuration that is technologically and economically feasible to electrify the study area. PV panels and batteries are the variable parameters in all of the three configurations and their quantities can be determined using optimization algorithms based on the required load demand and constraints. However, the biomass generator is regarded as a fixed energy resource, with a rated power of 10 kW. Hence, no optimization algorithm is required to estimate its size because it is already fixed as a 10 kW. The converter size is also considered as a fixed parameter because it is already predesigned to meet the peak load demands of the study area. Because the study area’s peak load demand is 35.72 kW, the converter power rating is set to 40 kW. For safety reasons, the converter power rating is set to be 10% higher than the peak load demand. As a result, there is no need to use optimization algorithms to optimize the converter size.
The three above-mentioned configurations have been optimized using well-known algorithms such as Differential Evolutionary Algorithm (DE) [
10], Genetic Algorithm (GA) [
11], Moth Flame Optimization (MFO) [
12], Dragonfly Algorithm (DA) [
13], Particle Swarm Optimization (PSO) [
14], Ant Lion Optimization (ALO) [
15], Grey Wolf Optimization (GWO) [
16], Grasshopper Optimization Algorithm (GOA) [
17] and Dynamic Differential Annealed Optimization Algorithm [
18]. These algorithms that were run with their default control parameter values with the population and iterations are considered to be 100. The technical and cost values used in the study are listed in
Table 2 and
Table 3.
The results shown in
Table 4 were obtained with an LPSP value of 0% for the above-mentioned three configurations using the algorithms shown above. For each configuration, this table shows the optimal LCC values as well as the optimal number of PV panels and batteries.
9.1. The Impact of Various Battery Technologies on System Performance
According to the results given in
Table 4, the configuration made up of Ni-Fe battery technology provided the lowest LCC value when compared to the configurations made up of LA and Li-Ion battery technologies. The Ni-Fe battery configuration offered the optimal LCC value as 367,586 USD and its required number of PV panels and Ni-Fe batteries to electrify the study area are 511 and 351, respectively.
The next optimal configuration to electrify the study area is the configuration made up of LA battery technology, which has provided the optimal LCC value as 607,030 USD, which is about 65% higher than the LCC value obtained with the Ni-Fe battery technology and about 41% lower than the LCC obtained with the Li-Ion battery technology. To electrify the study area using the configuration made up of LA battery technology, 474 PV panels and 136 LA batteries are required.
The final optimal configuration to electrify the study area is the configuration made up of Li-Ion battery technology, which produced the optimal LCC value as 1,019,683 USD. Which is about 177% and 68% higher than the LCCs obtained with the configurations made up of Ni-Fe and LA battery technologies, respectively. Finally, the number of PV panels and Li-Ion batteries required to electrify the study area with this configuration are 436 and 155, respectively.
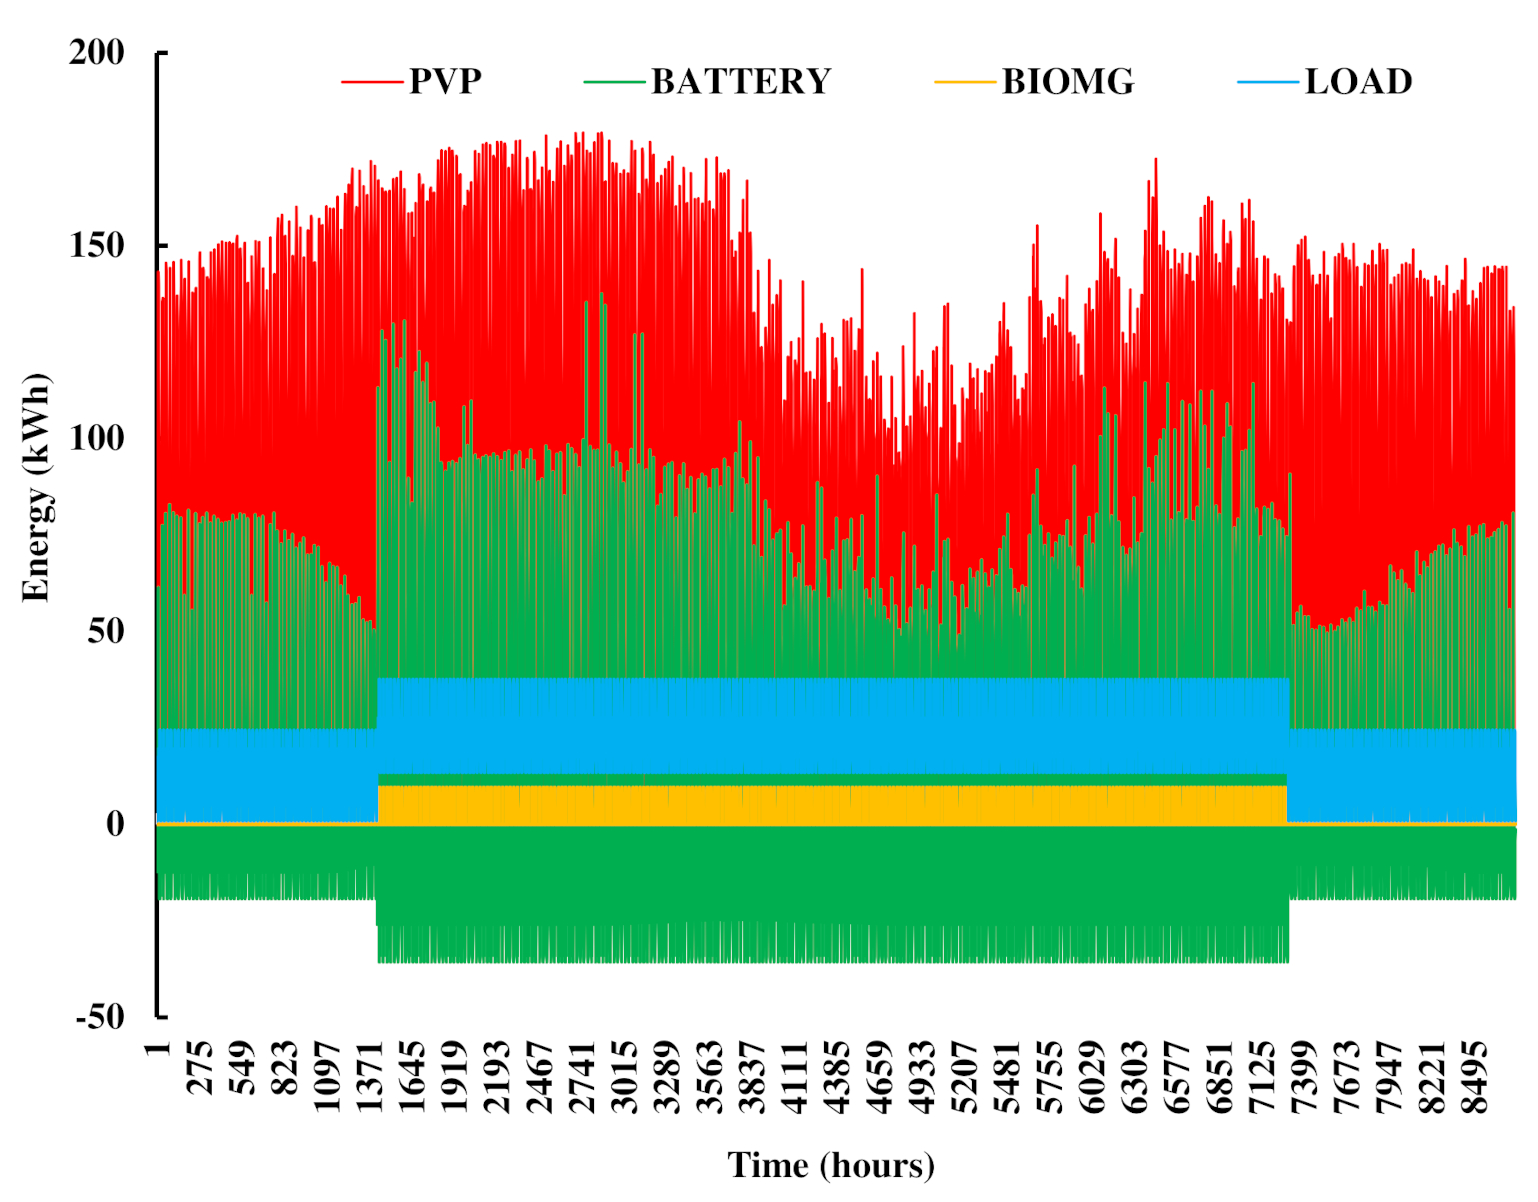
Figure 8 depicts the annual energy production of the PV panels and biomass generator, as well as the charging and discharging process of the battery bank based on load demand.
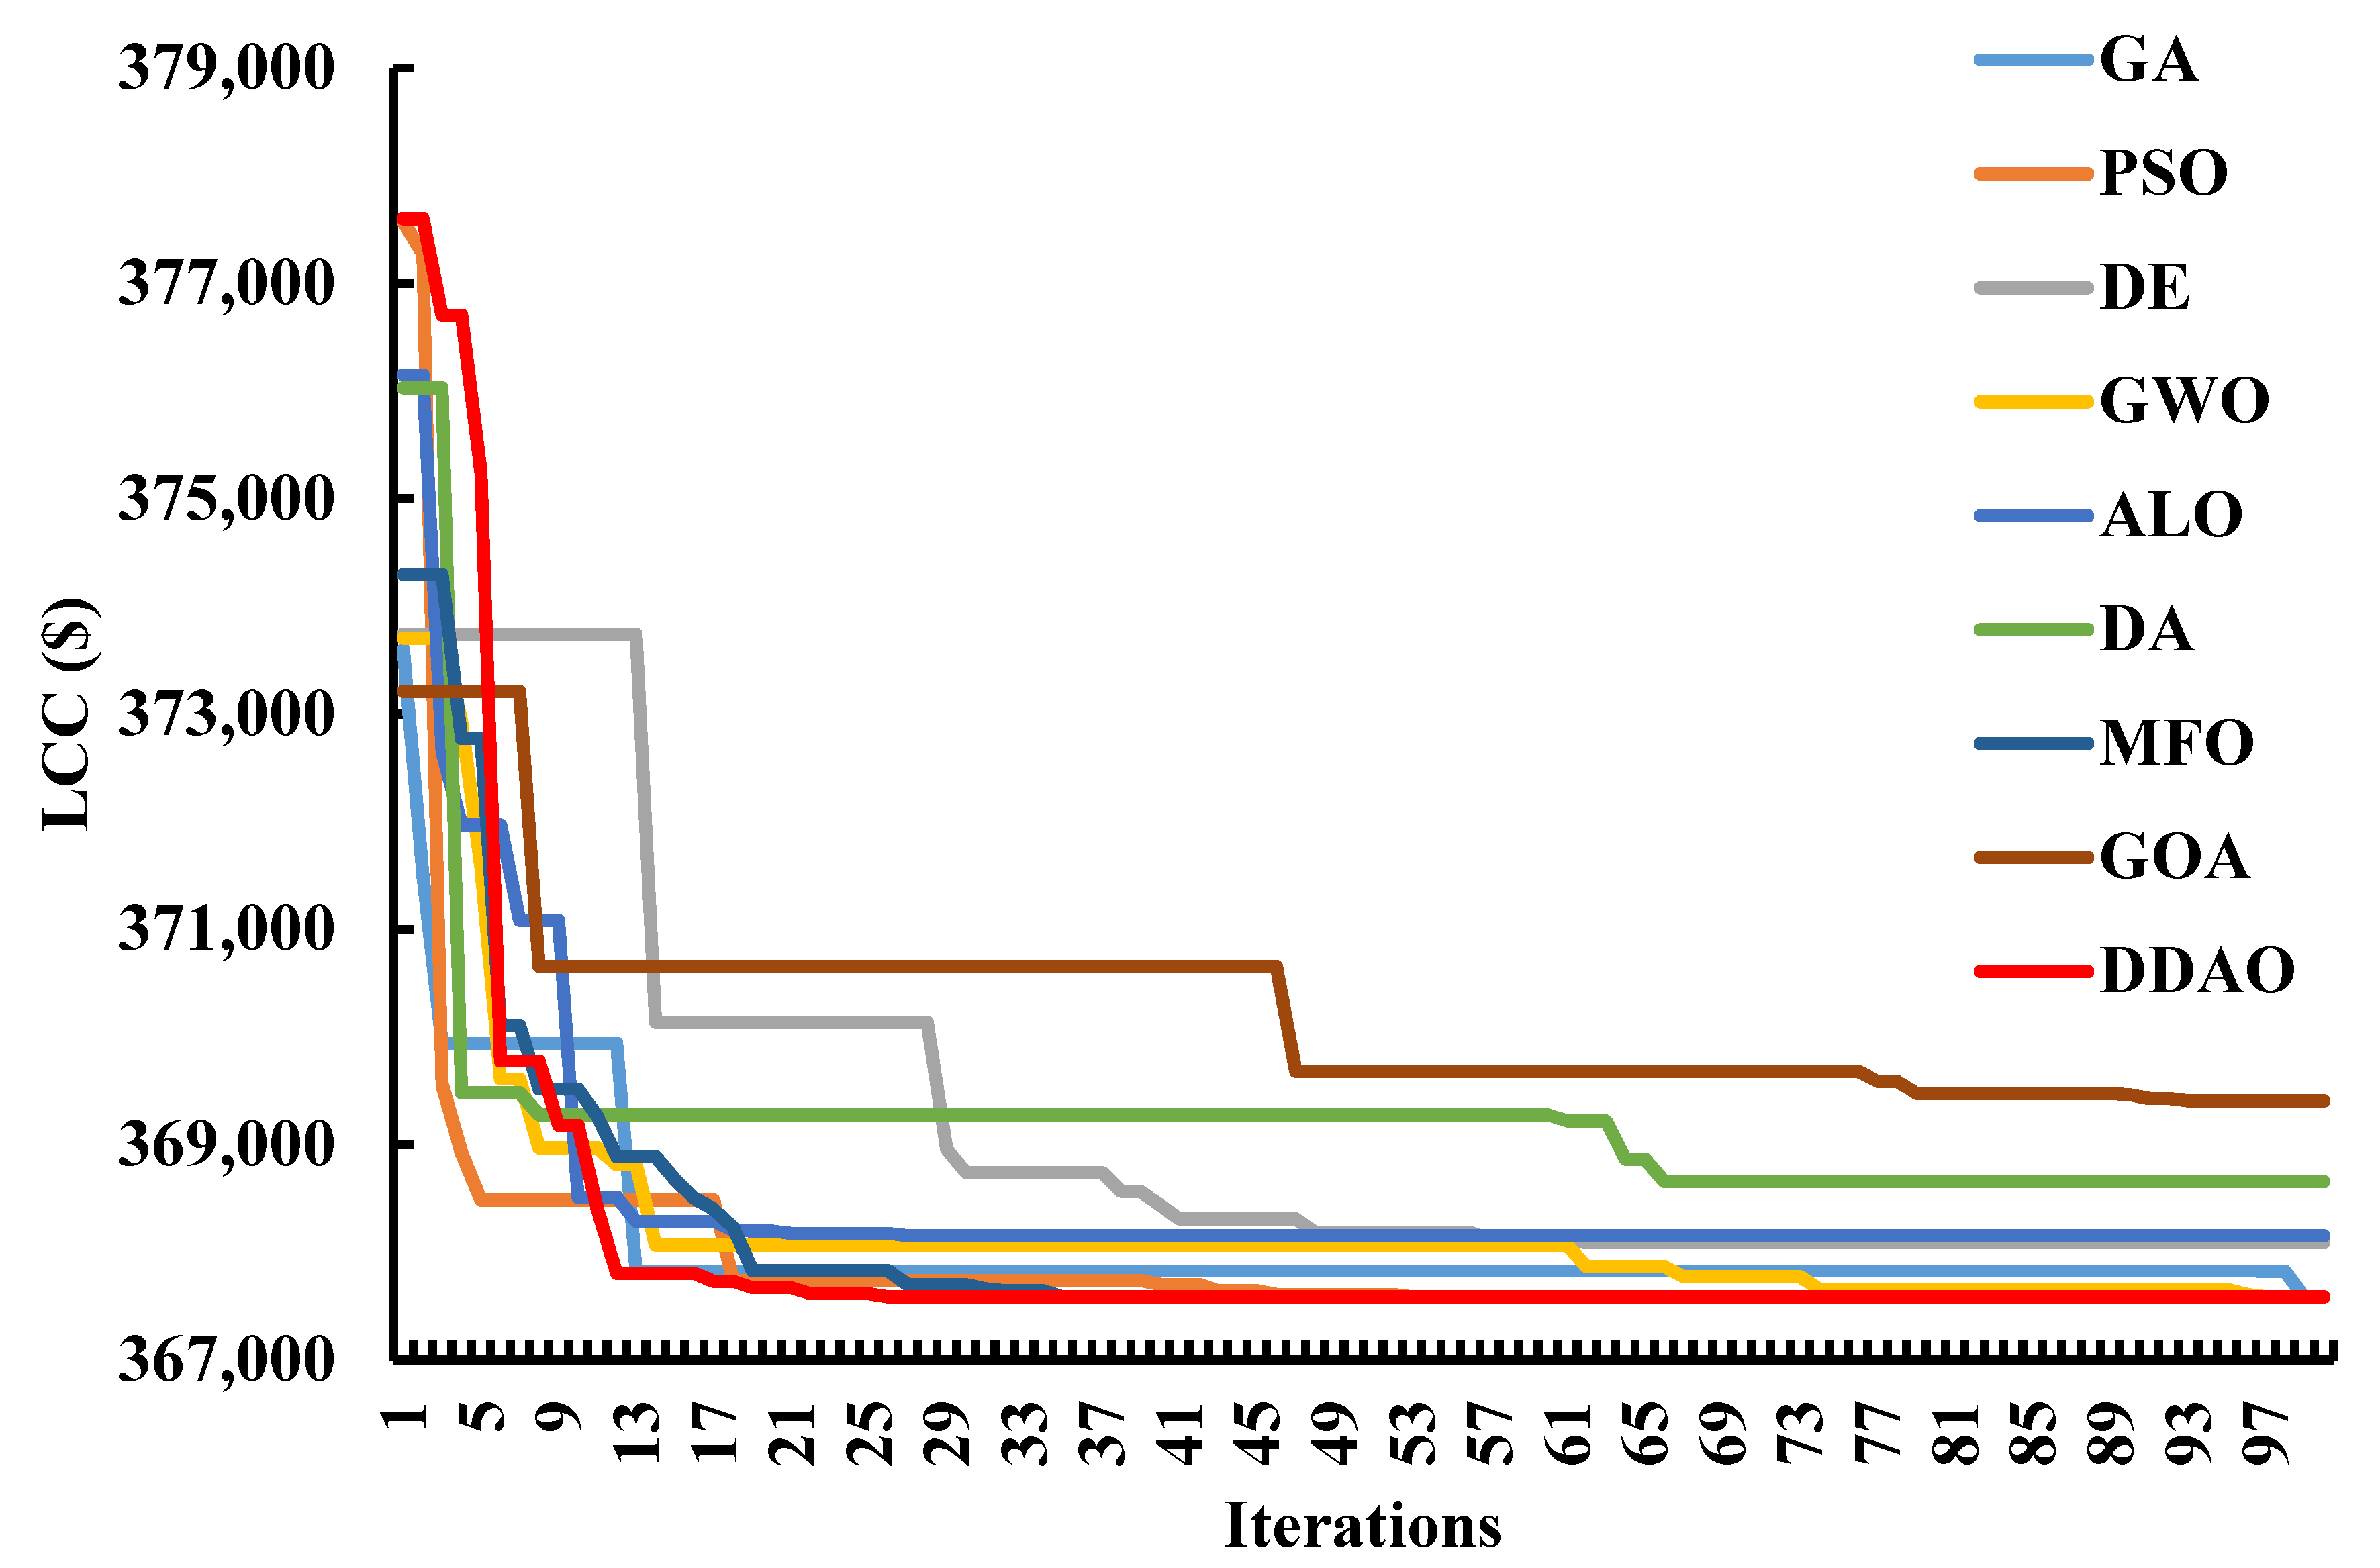
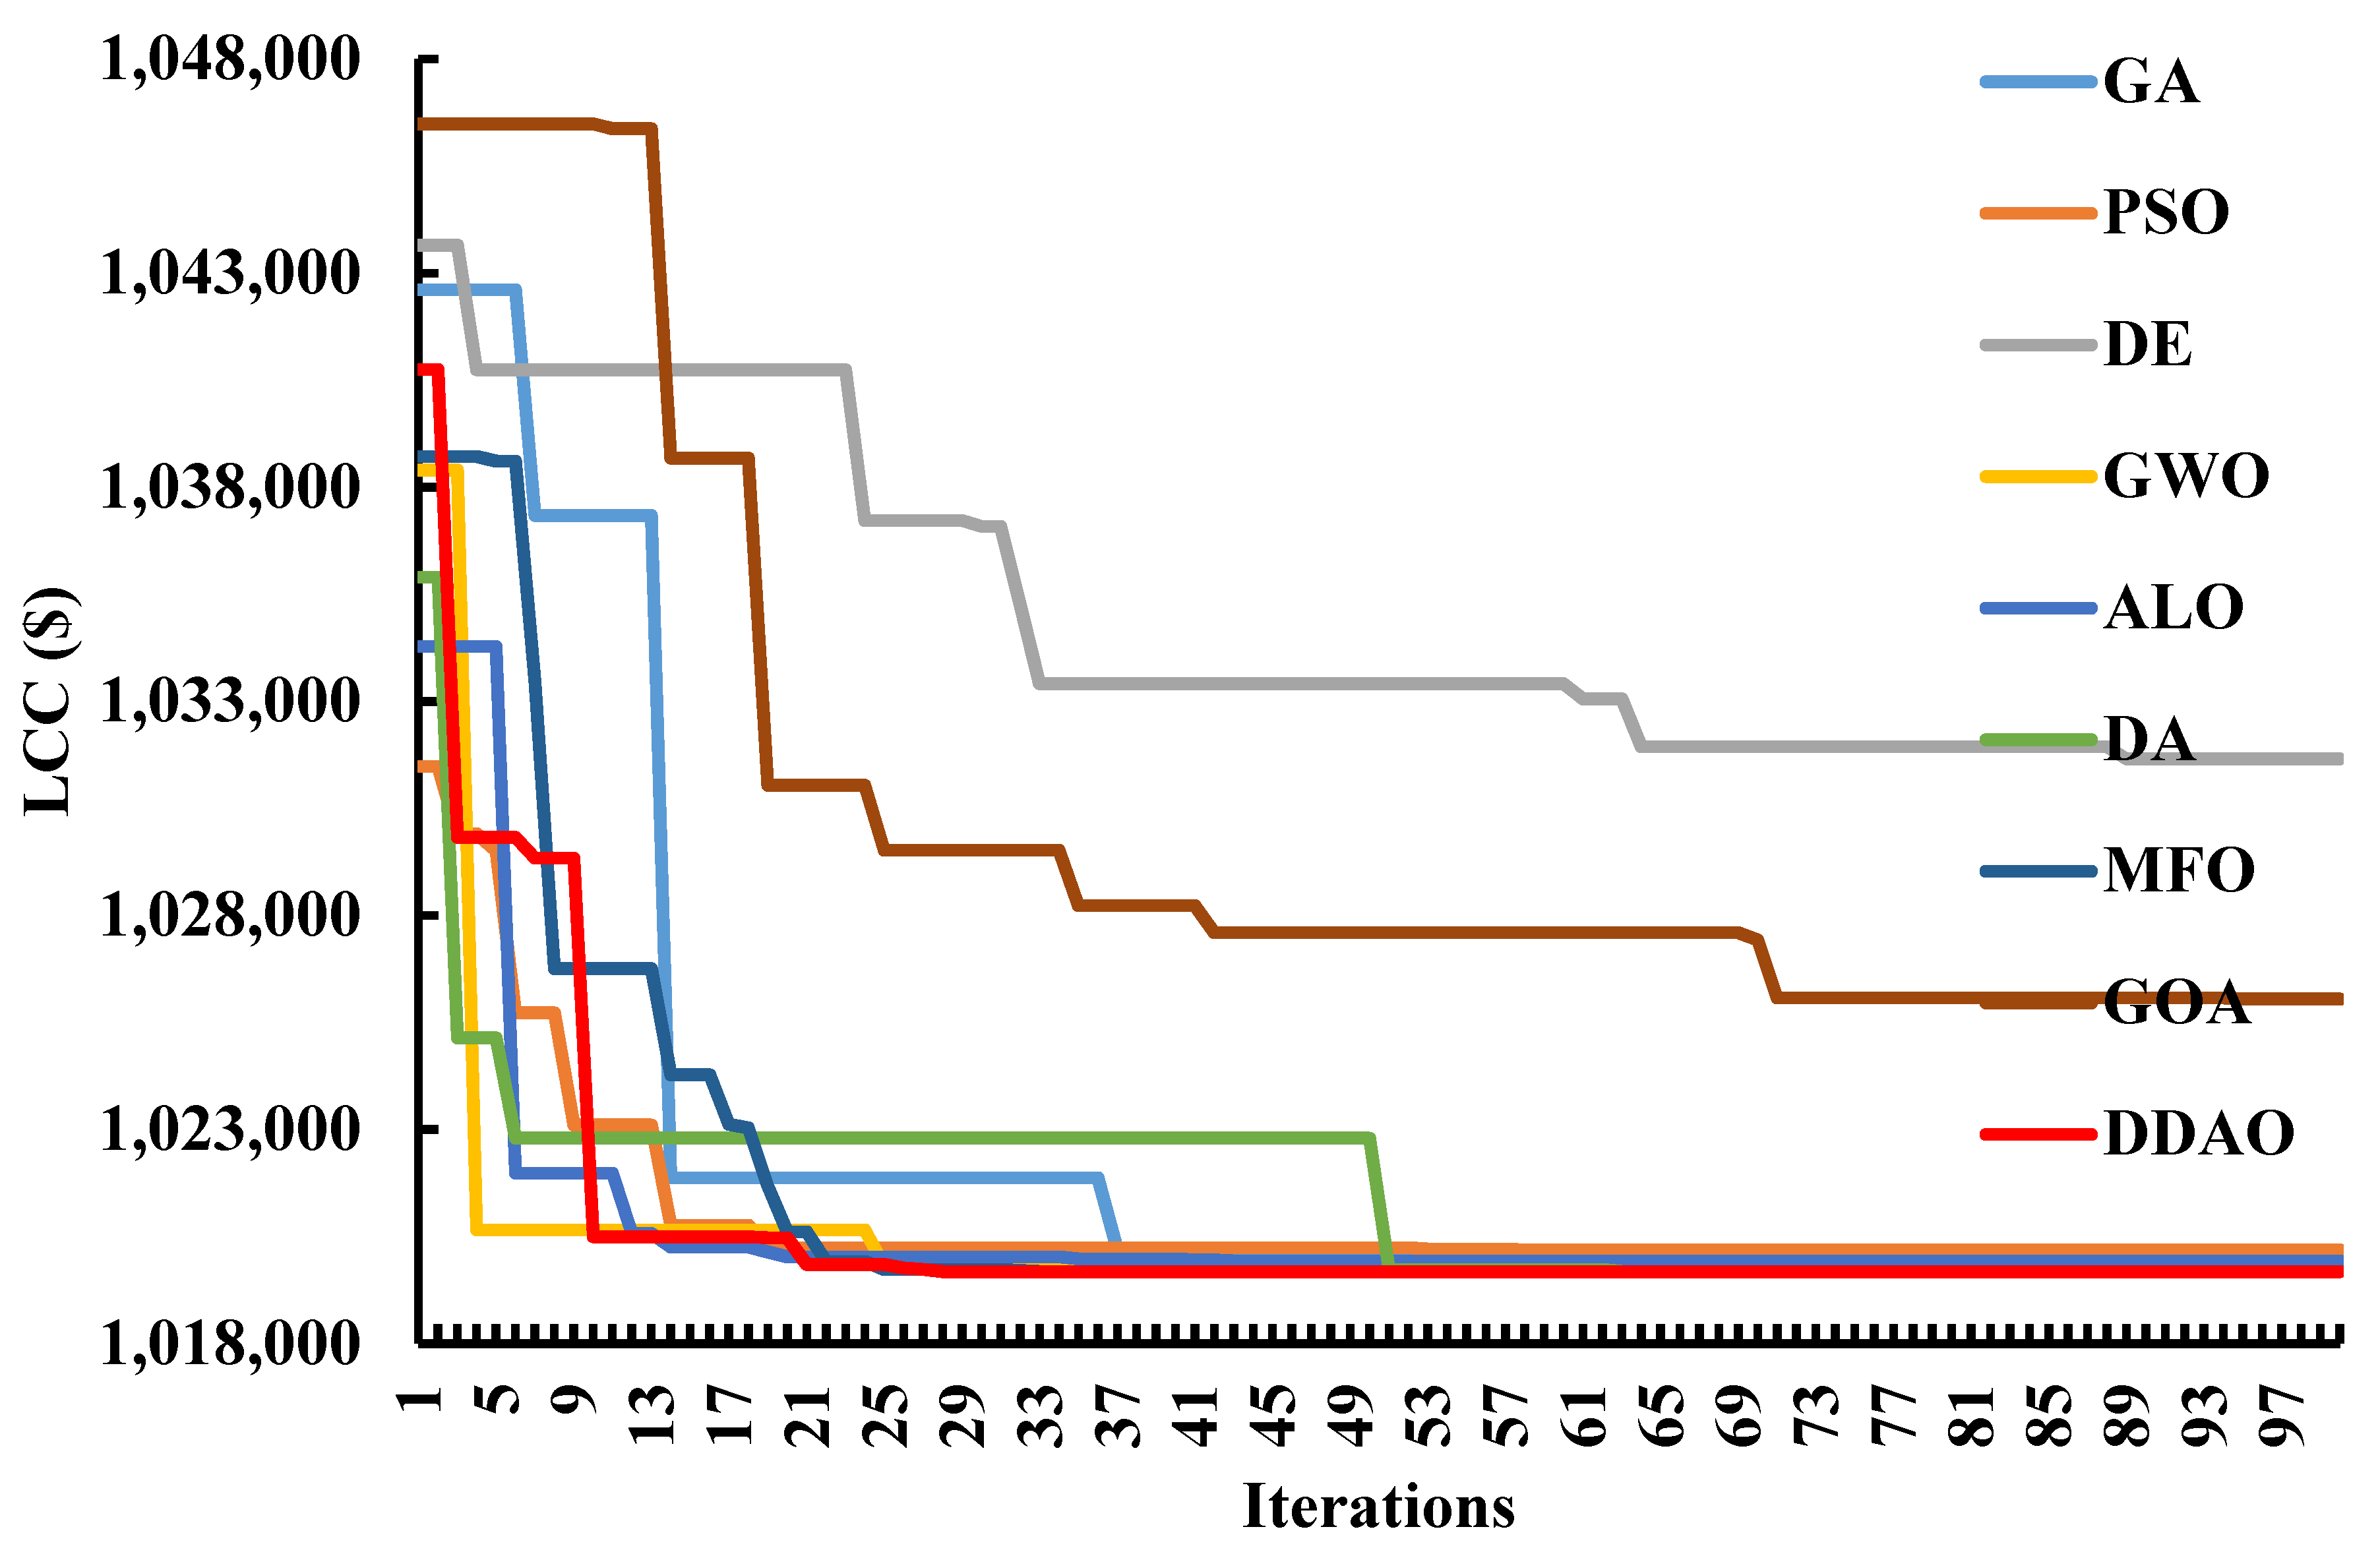
9.2. Robustness of the Algorithms
The robustness of the algorithm can be determined by its ability to provide the global best optimal values for the proposed configurations. Three configurations were modelled in this study, and these configurations were tested using well-known algorithms as well as a new proposed metaheuristic algorithm Dynamic Differential Annealed Optimization (DDAO). For each of these three configurations, the proposed algorithm, DDAO, provided the optimal LCC values. The number of times each algorithm provided the global best optimal values for three configurations are shown in
Table 5.
According to
Table 4, when compared to the remaining algorithms in terms of Simulation Time in Seconds (STIS), the DDAO algorithms performed the best in both finding global best optimal values and simulation completion process.
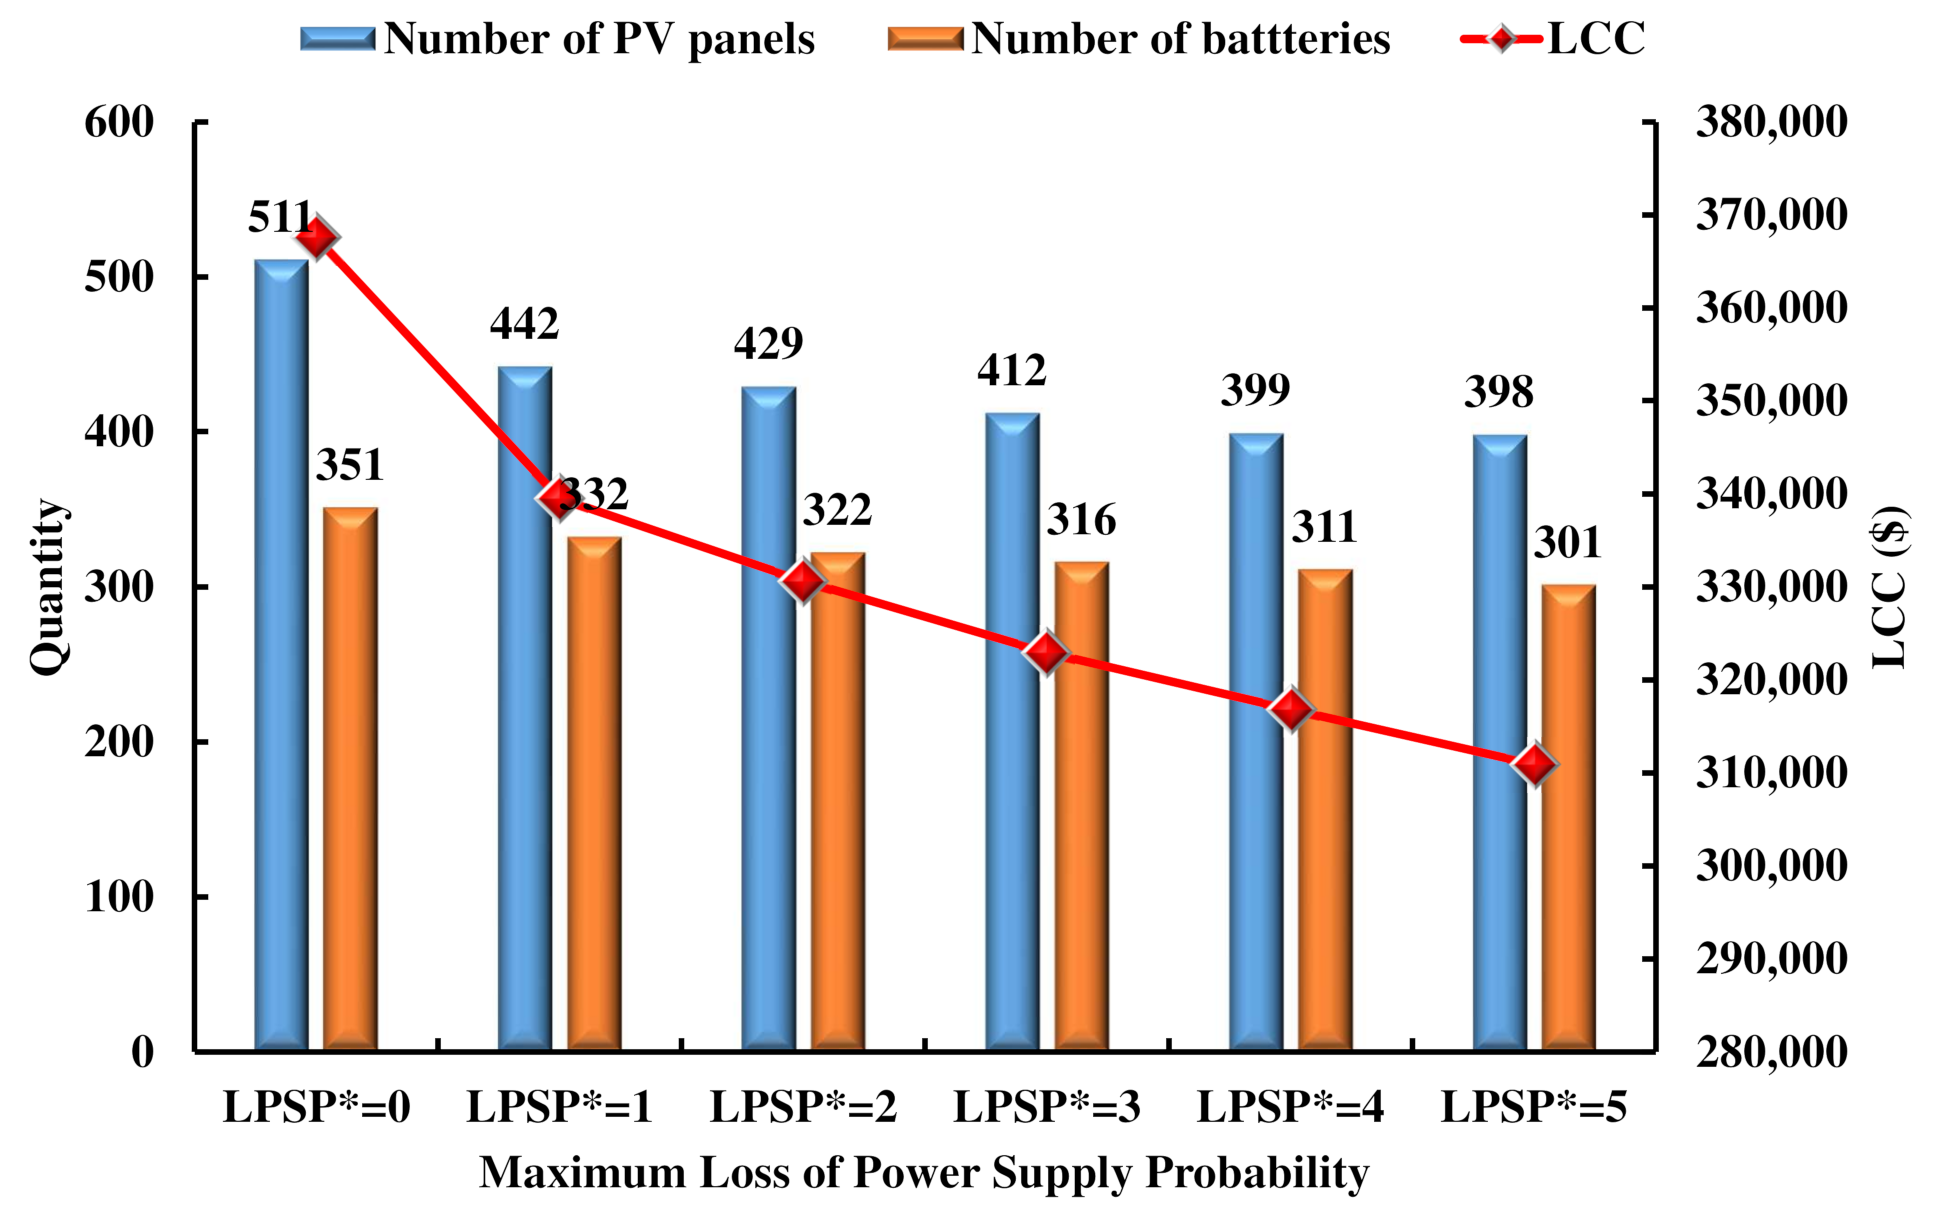
9.3. Loss of Power Supply Probability
The configuration made up of Ni-Fe battery technology is identified as the optimal configuration for electrifying the study area. This configuration was examined with various probabilities of power supply failure. As a result, the optimal configuration was examined with different LPSP values ranging from 1% to 5%.
Table 6 shows the optimal values for this configuration with various LPSP values.
Table 6 and
Figure 12 shows that at the LPSP value of 1%, there is a significant change in all values when compared to the values obtained at the LPSP value of 0%. When we compare the difference between the 1% LPSP and the remaining LPSP values ranging from 2% to 5% optimal values, the difference in LCC and component values is not that much of significant. At an LPSP value of 1%, the number of power supply hours lost is also 123 only out of 8760 h. As a result, electrification of the study area at an LPSP value of 1% is also recommendable.
10. Conclusions
The current study has focused on off-grid rural electrification in a remote rural area of the Indian state of Odisha. The location is still not electrified due to its remote location because grid extension to that area is not feasible for two reasons: first, extending the grid to that area is more expensive because it is more than 50 km away. The second reason is that grid extension is not a viable option for the location since it is located in a densely forested area surrounded by hilly mountains. As a result, electrification of the study area is planned, utilizing the study area’s readily available RE resources, such as solar and biomass. However, due to the time dependence and metrological weather conditions dependence of these RE resources, the power supply is not continuous. As a consequence, three different types of battery technologies have been proposed for the current study. To identify a battery technology that is technologically and economically suitable for the study area.
The current study used available RE resources and battery technologies to model three configurations: PVP/BIOMG/BATTERY(Ni-Fe), PVP/BIOMG/BATTERY(Li-Ion) and PVP/-BIOMG/BATTERY(LA). The main goal here is to identify the configuration that is appropriate for electrifying the study area. The identification process incorporated with nine well-known and established algorithms, such as Differential Evolutionary Algorithm, Genetic Algorithm, Moth Flame Optimization, Dragonfly Algorithm, Particle Swarm Optimization, Grey Wolf Optimization, Ant Lion Optimization, Grasshopper Optimization Algorithm and Dynamic Differential Annealed Optimization (DDAO) Algorithm. When DDAO was compared to the remaining algorithms, it produced the global best optimal results. Based on the results, the PVP/BIOMG/BATTERY(Ni-Fe) configuration was identified as the feasible configuration to electrify the study area.
When compared to the configurations made up of Li-Ion and LA battery, the configuration of Ni-Fe battery provided the lowest LCC value as 367,586 USD, which is 39% and 64% lower in percentage terms. The optimal configuration has been further analyzed with different loss of power supply probability values ranging from 1% to 5%. According to the findings, at a loss of power supply probability value of 1%, the optimal configuration may be recommendable for electrifying the study area.


