
Experimental Investigation on Uniaxial Compression Mechanical Behavior and Damage Evolution of Pre-Damaged Granite after Cyclic Loading

 , , and
Abstract
:
1. Introduction
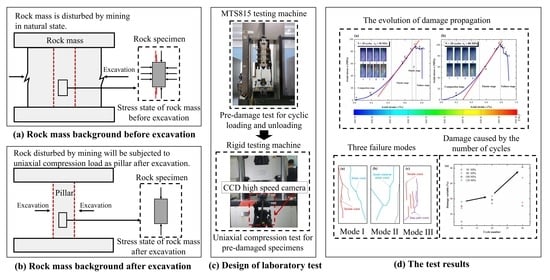
2. Experiment
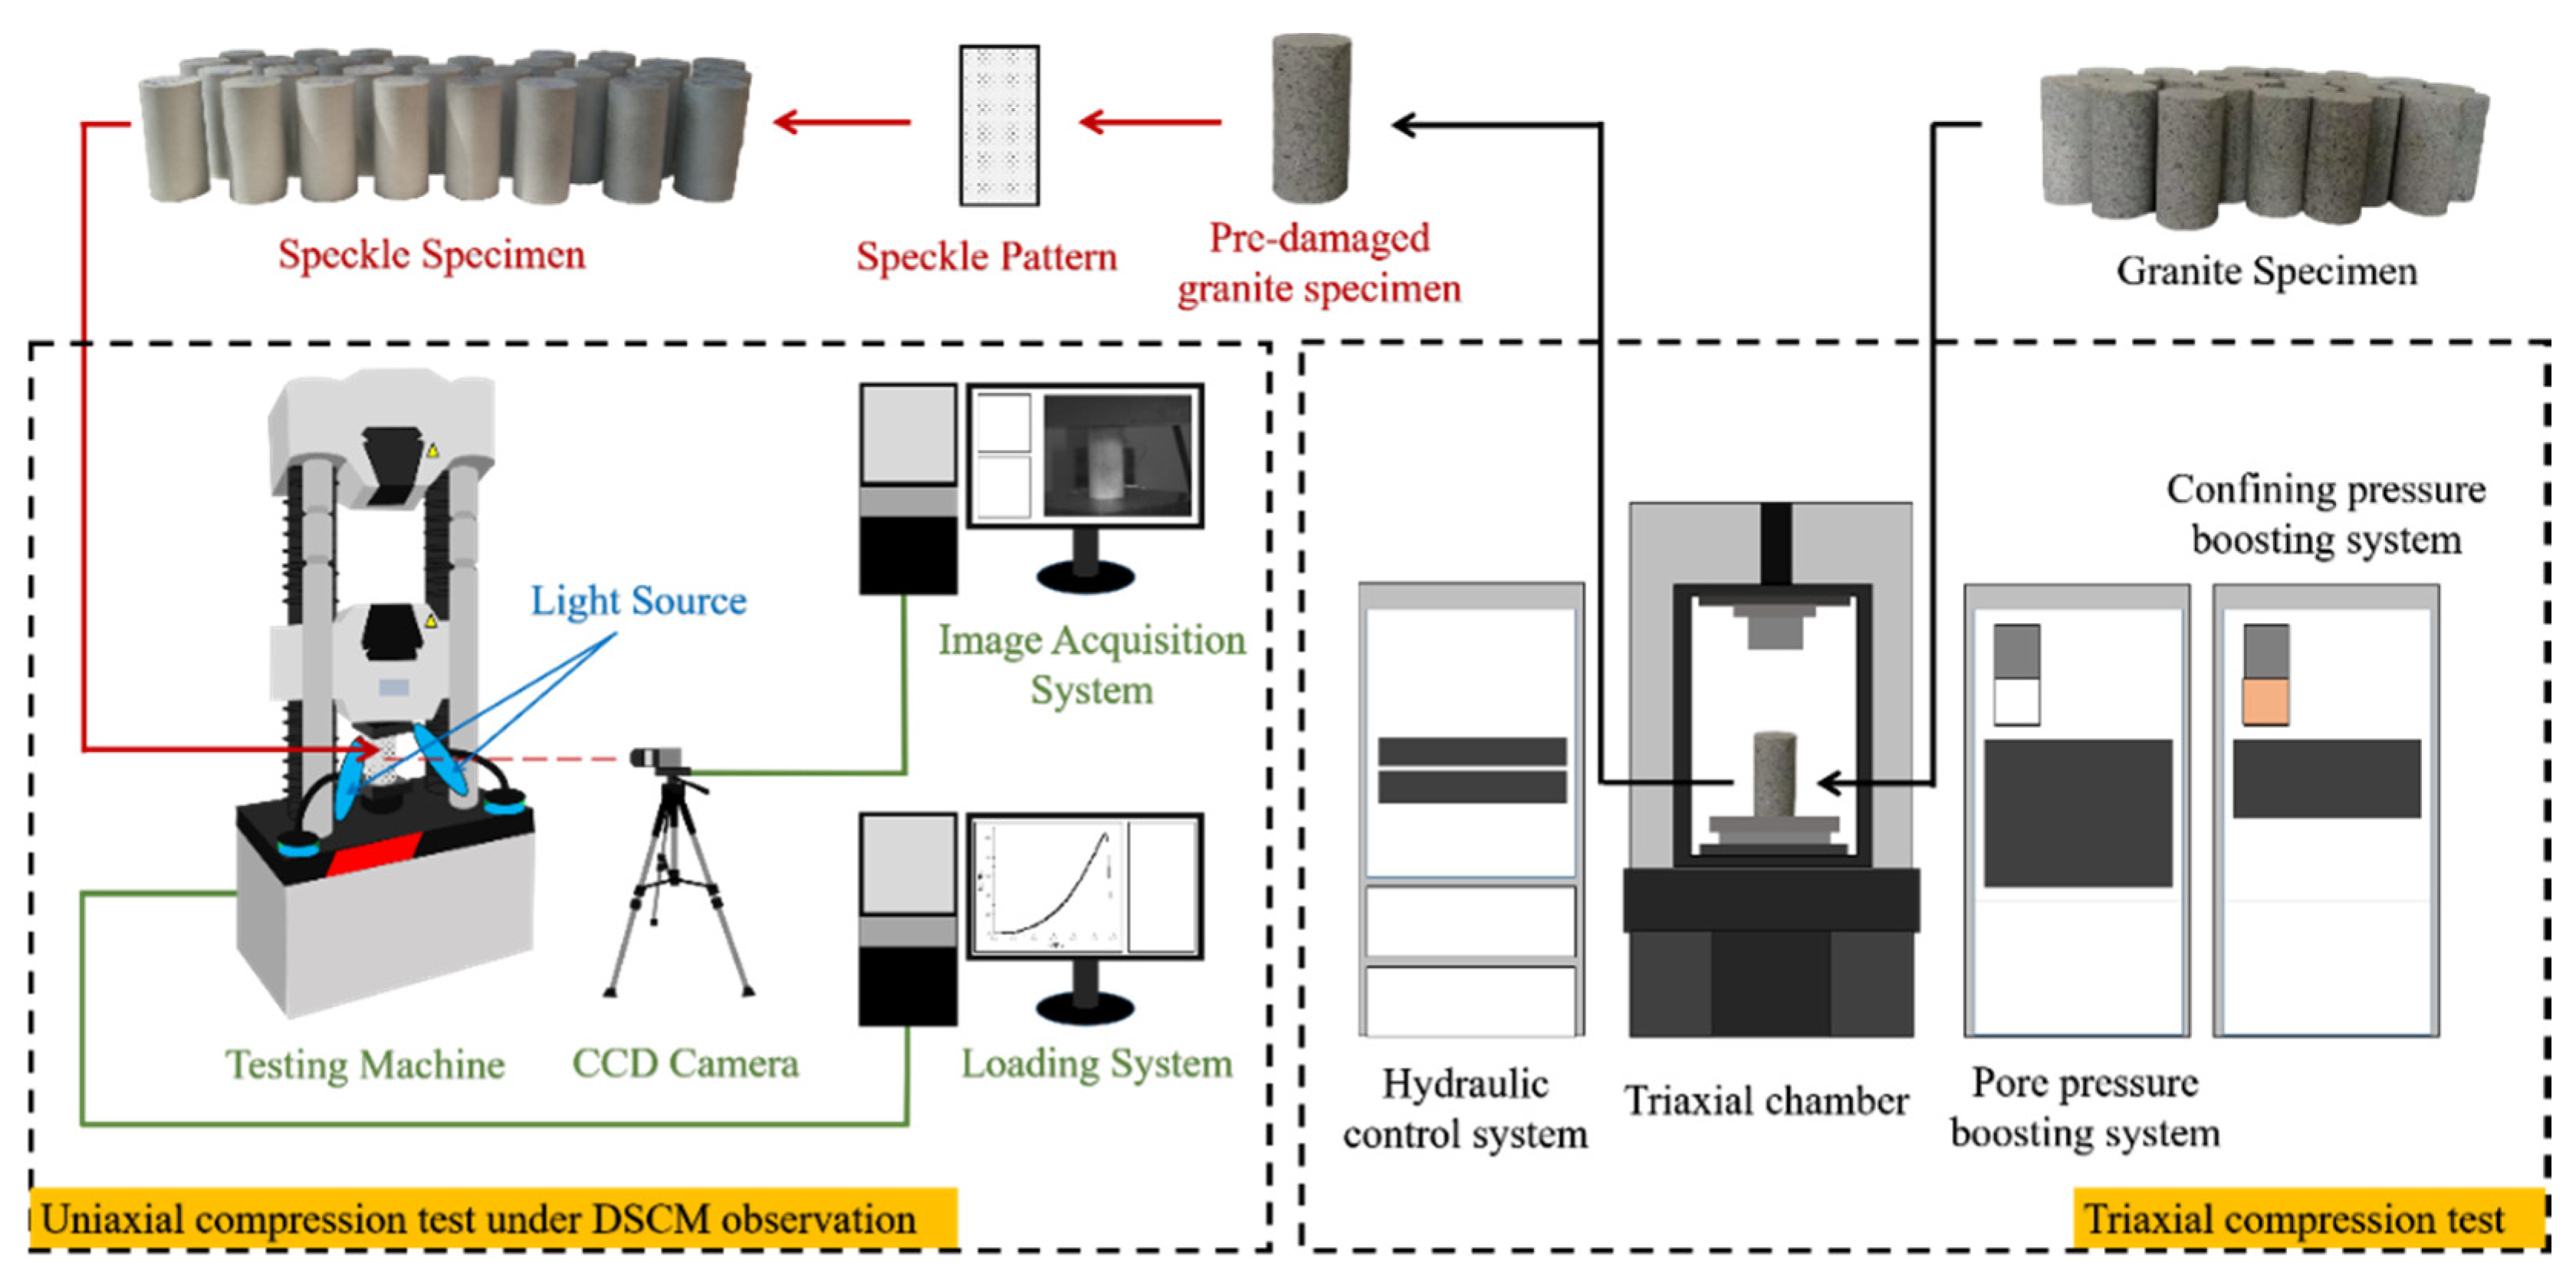
2.1. Equipment
2.2. Experimental Scheme
2.2.1. Pre-Damage Treatment of Specimens
- Four groups of rock specimens were vacuumed and saturated with water using the vacuum water saturation equipment, first for 240 min dry pumping and then for 120 min wet pumping to completely saturate the specimens;
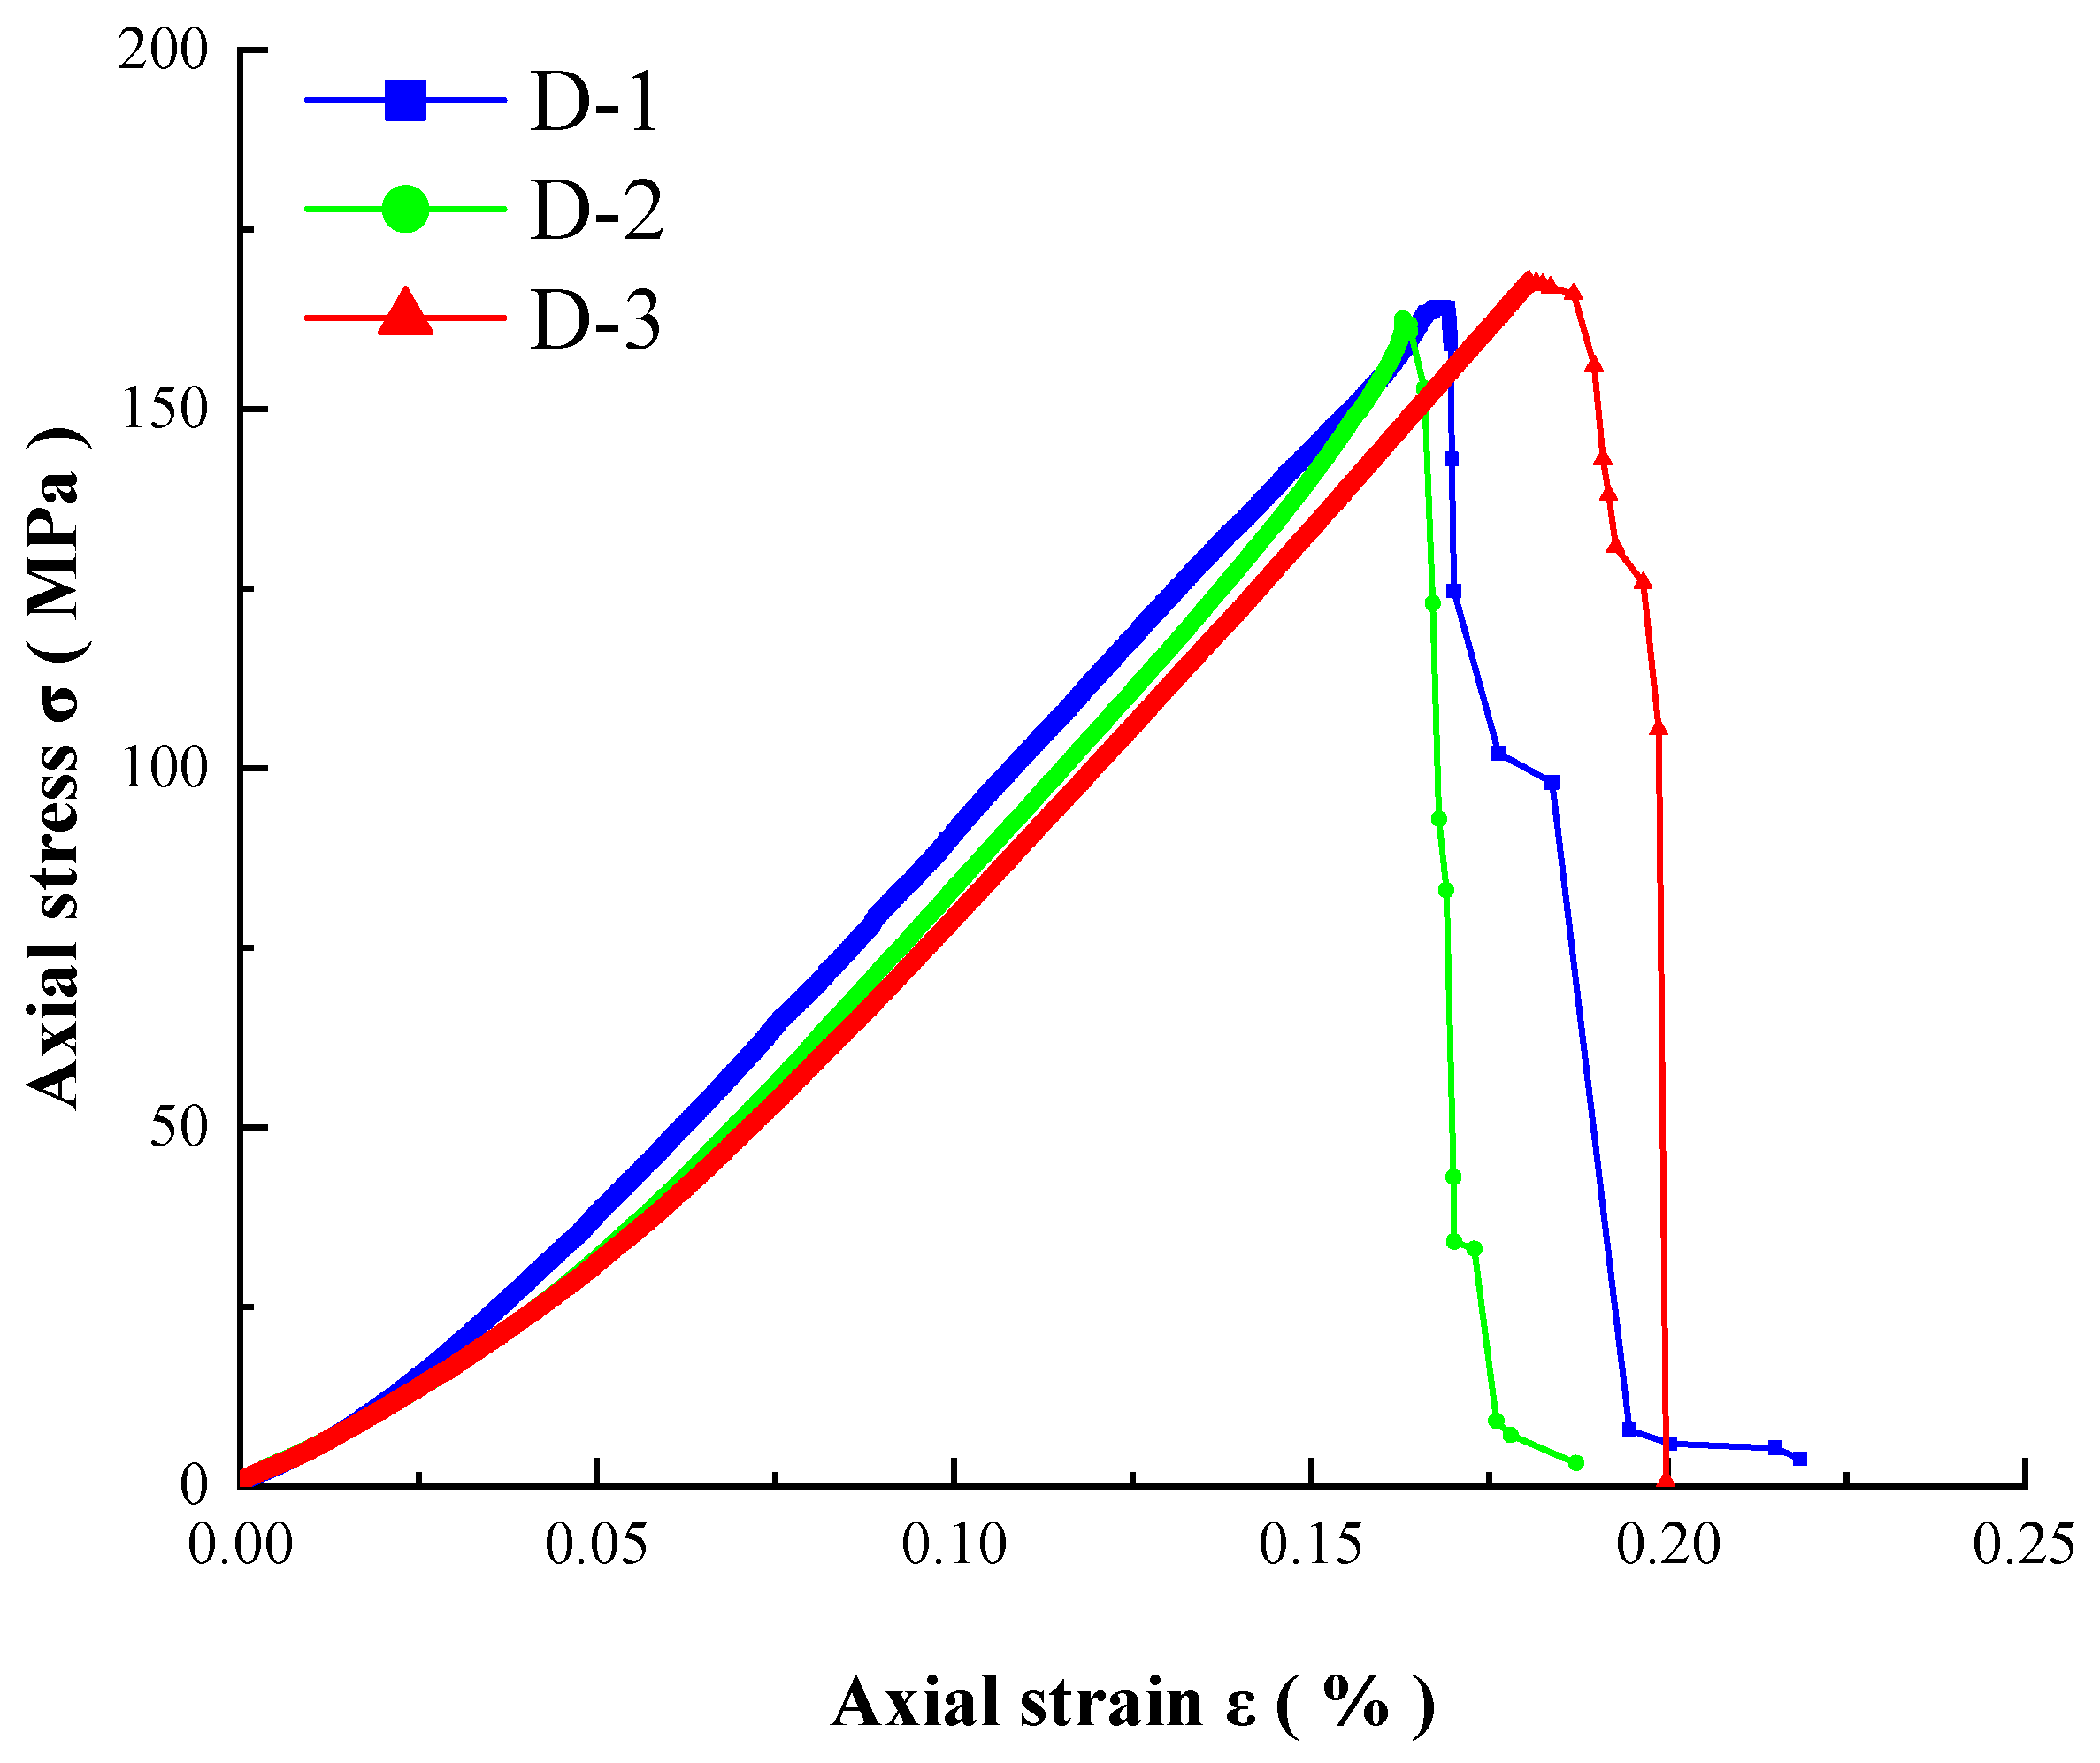
- Uniaxial compressive strength of specimens in Group D were measured with the MTS815 testing machine loaded at a rate of 2 kN/s (Group D was the control group);
- The remaining rock specimens of Group A, B, and C were cyclically loaded and unloaded for 10, 20, and 30 times under confining pressures of 50 MPa, 80 MPa, 100 MPa, and 120 MPa, respectively, without destroying the specimens, to realize the pre-damage treatment inside the granite specimens (see Table 2 for the specific scheme). The load cycle path used constant confining pressure and unloading axial pressure; both loading and unloading rates were 2 kN/s, loading stress point was 153 MPa (about 93% of the average uniaxial compressive strength), and unloading stress point was 5 MPa (about 3% of the average uniaxial compressive strength).
2.2.2. Uniaxial Compression Test with DSCM
3. Results
3.1. Uniaxial Compressive Strength Results for Intact Specimens
3.2. Uniaxial Compressive Strength Results for Pre-Damaged Specimens
3.3. Strength Characteristics of Pre-Damaged Specimens
4. Rock Damage Mechanisms and Failure Modes Analysis
4.1. Relationship of Damage Variables to Cycle Numbers and Confining Pressures
4.2. Damage Evolution Mechanism of Pre-Damaged Specimens
4.3. Failure Mode of Pre-Damaged Specimens
- (1)
- Mode I: The main cracks in this failure mode are tensile cracks and shear cracks, and these two main cracks are independent of each other at the time of final failure. No crack coalescence occurs, so this failure mode is called tensile shear failure (Figure 12a). The red line is a tensile crack, the blue line is a shear crack, and the gray line is secondary shear cracks in Figure 12a. The final failure in this mode will cause spalling on the tensile crack or shear crack surface, and the overall degree of damage is small. This failure mode is also identified in [33,36], which is called mixed coalescence mode.
- (2)
- Mode II: The main cracks in this failure mode are two intersecting shear cracks, so this mode is called quasi-coplanar shear failure (Figure 12b). The blue line is a quasi-coplanar shear crack, and the gray line is a shear secondary crack in Figure 12b. The damage in this mode is generally marked by peeling from its conjugate surface or collapse, and the degree of damage is large. Such quasi-conjugate or single shear plane failure results have been reported in [37].
- (3)
- Mode III: The main cracks in this failure mode are tensile cracks. Because multiple tensile cracks interact, propagate and coalescence to form a shear crack in a stepped path, this mode is called a stepped path failure (Figure 12c). The purple line is a step path crack, and the blue line is a tensile crack in Figure 12c. The main feature of this failure mode is that there are generally multiple groups of parallel tensile cracks above or below the step. Failure mode III in this mode generally shows layers of peeling in the tensile crack area, and the degree of damage is relatively large. This result is consistent with those of a granite specimen that contains multiple pre-existing holes in [33].
5. Conclusions
- (1)
- The mechanical properties of granite specimens that undergo high cycle pre-damage are significantly different from those of their low cycle pre-damage specimens. The mechanical properties of the high cycle pre-damaged specimens decreased significantly. Under uniaxial compression, the pre-damaged specimens showed complex strength characteristics, and uniaxial compressive strength presents a non-linear relationship with cycle numbers and confining pressures. Damage to pre-damaged specimens was primarily due to the strength weakening effect caused by cycle numbers.
- (2)
- The damage variables of pre-damaged specimens positively correlate with the cycle numbers and confining pressure. Damage to the pre-damaged specimens continues to increase with increasing cycle numbers, and the magnitude of damage varied with various confining pressure. The greater the confining pressure, the greater the damage variable in pre-damaged specimens. When specimens were subjected to high cycle numbers, the confining pressure restriction effect was not obvious.
- (3)
- The evolution laws of uniaxial compression damage propagation in pre-damaged specimens showed differences and obvious localization phenomenon under different cycle numbers and confining pressures. The number of initial cracks was less at low cycle numbers. However, the number of initial cracks was large under high cycle numbers, and they coalesced with each other to form stepped shear cracks. Tensile cracks were always the earliest cracks to appear in pre-damaged granite specimens, and the greater the cycle numbers, the more concentrated the crack initiation was in the plastic deformation stage.
- (4)
- There are three uniaxial compression failure modes for pre-damaged specimens, namely tensile shear failure (mode I), quasi-coplanar shear failure (mode II), and stepped path failure (mode III). The failure modes of pre-damaged specimens are related to confining pressure. Under different pre-damage stress environments with high confining pressures, the failure modes are dominated by Mode II and Mode III, respectively.
Author Contributions
Funding
Institutional Review Board Statement
Informed Consent Statement
Data Availability Statement
Conflicts of Interest
References
- Wang, Y.T.; Zhou, X.P.; Xu, X. Numerical simulation of propagation and coalescence of flaws in rock materials under compressive loads using the extended non-ordinary state-based peridynamics. Eng. Fract. Mech. 2016, 248–273. [Google Scholar] [CrossRef]
- Singh, P.K. Blast vibration damage to underground coal mines from adjacent open-pit blasting. Int. J. Rock Mech. Min. Sci. 2002, 39, 959–973. [Google Scholar] [CrossRef]
- Vaneghi, R.G.; Ferdosi, B.; Okoth, A.D.; Kuek, B. Strength degradation of sandstone and granodiorite under uniaxial cyclic loading. J. Rock Mech. Geotech. Eng. 2018, 10, 117–126. [Google Scholar] [CrossRef]
- Zhou, Z.L.; Wang, H.Q.; Cai, X.; Zang, H.Z.; Chen, L.; Liu, F. Bearing characteristics and fatigue damage mechanism of multi-pillar system subjected to different cyclic loads. J. Cent. South Univ. 2020, 27, 542–553. [Google Scholar] [CrossRef]
- Fan, X.; Kulatilake, P.H.S.W.; Chen, X. Mechanical behavior of rock-like jointed blocks with multi-non-persistent joints under uniaxial loading: A particle mechanics approach. Eng. Geol. 2015, 190, 17–32. [Google Scholar] [CrossRef]
- Hu, J.H.; Yang, D.J. Meso-damage evolution and mechanical characteristics of low-porosity sedimentary rocks under uniaxial compression. Trans. Nonferr. Met. Soc. China 2020, 30, 1071–1077. [Google Scholar] [CrossRef]
- Xiao, J.Q.; Ding, D.X.; Jiang, F.L.; Xu, G. Fatigue damage variable and evolution of rock subjected to cyclic loading. Int. J. Rock Mech. Min. Sci. 2010, 47, 461–468. [Google Scholar] [CrossRef]
- Bagde, M.N.; Petroš, V. Fatigue and dynamic energy behaviour of rock subjected to cyclical loading. Int. J. Rock Mech. Min. Sci. 2009, 46, 200–209. [Google Scholar] [CrossRef]
- Chen, Y.Q.; Watanabe, K.; Kusuda, H.; Kusaka, E.; Mabuchi, M. Crack growth in Westerly granite during a cyclic loading test. Eng. Geol. 2011, 117, 189–197. [Google Scholar] [CrossRef] [Green Version]
- Zhang, P.; Xu, J.G.; Li, N. Fatigue properties analysis of cracked rock based on fracture evolution process. J. Cent. South Univ. Technol. 2008, 15, 95–99. [Google Scholar] [CrossRef]
- Fuenkajorn, K.; Phueakphum, D. Effects of cyclic loading on mechanical properties of Maha Sarakham salt. Eng. Geol. 2010, 112, 43–52. [Google Scholar] [CrossRef]
- Taheri, A.; Yfantidis, N.; Olivares, C.L.; Connelly, B.J.; Bastian, T.J. Experimental Study on Degradation of Mechanical Properties of Sandstone under Different Cyclic Loadings. Geotech. Test. J. 2016, 39, 673–687. [Google Scholar] [CrossRef]
- Jia, C.J.; Xu, W.Y.; Wang, R.B.; Wang, W.; Zhang, J.C.; Yu, J. Characterization of the deformation behavior of fine-grained sandstone by triaxial cyclic loading. Constr. Build. Mater. 2018, 162, 113–123. [Google Scholar] [CrossRef]
- Wang, Z.C.; Li, S.C.; Qiao, L.P.; Zhao, J.G. Fatigue Behavior of Granite Subjected to Cyclic Loading under Triaxial Compression Condition. Rock Mech. Rock Eng. 2013, 46, 1603–1615. [Google Scholar] [CrossRef]
- Liu, E.L.; Huang, R.Q.; He, S.M. Effects of Frequency on the Dynamic Properties of Intact Rock Samples Subjected to Cyclic Loading under Confining Pressure Conditions. Rock Mech. Rock Eng. 2011, 45, 89–102. [Google Scholar] [CrossRef]
- Hu, J.H.; Wen, G.P.; Lin, Q.B.; Cao, P.; Li, S. Mechanical properties and crack evolution of double-layer composite rock-like specimens with two parallel fissures under uniaxial compression. Theor. Appl. Fract. Mech. 2020, 108, 102610–102621. [Google Scholar] [CrossRef]
- Xie, Z.Z.; Zhang, N.; Meng, F.F.; Han, C.L.; An, Y.P.; Zhu, R.J. Deformation Field Evolution and Failure Mechanisms of Coal–Rock Combination Based on the Digital Speckle Correlation Method. Energies 2019, 12, 2511. [Google Scholar] [CrossRef] [Green Version]
- Tan, Y.L.; Guo, W.Y.; Zhao, T.B.; Yu, F.H.; Huang, B.; Huang, D.M. Influence of Fissure Number on the Mechanical Properties of Layer-Crack Rock Models under Uniaxial Compression. Adv. Civ. Eng. 2018, 2018, 1–12. [Google Scholar] [CrossRef]
- Sun, Q.; Cai, C.; Zhang, S.K.; Tian, S.; Li, B.; Xia, Y.J.; Sun, Q.W. Study of localized deformation in geopolymer cemented coal gangue-fly ash backfill based on the digital speckle correlation method. Constr. Build. Mater. 2019, 215, 321–331. [Google Scholar] [CrossRef]
- Cao, R.H.; Lin, H.; Cao, P. Strength and failure characteristics of brittle jointed rock-like specimens under uniaxial compression: Digital speckle technology and a particle mechanics approach. Int. J. Min. Sci. Technol. 2018, 28, 669–677. [Google Scholar] [CrossRef]
- Li, X.P.; Wang, B. Research on Distribution Rule of Geostress in Deep Rock in Chinese Mainland. Adv. Mater. Res. 2011, 243–249, 2116–2122. [Google Scholar] [CrossRef]
- Zhou, Z.L.; Cai, X.; Ma, D.; Cao, W.Z.; Chen, L.; Zhou, J. Effects of water content on fracture and mechanical behavior of sandstone with a low clay mineral content. Eng. Fract. Mech. 2018, 47–65. [Google Scholar] [CrossRef]
- Ma, S.P.; Wang, L.G.; Jin, G.C. Damage evolution inspection of rock using digital speckle correlation method (DSCM). Exp. Mech. Nano Biotech. 2006, 326–328, 1117–1120. [Google Scholar] [CrossRef]
- Liu, L.; Xu, W.Y.; Zhao, L.Y.; Zhu, Q.Z.; Wang, R.B. An experimental and numerical investigation of the mechanical behavior of granite gneiss under compression. Rock Mech. Rock Eng. 2017, 50, 499–506. [Google Scholar] [CrossRef]
- Huang, B.; Lu, W. Experimental investigation of the uniaxial compressive behavior of thin building granite. Constr. Build. Mater. 2021, 267. [Google Scholar] [CrossRef]
- Yang, S.Q.; Huang, Y.H.; Tian, W.L.; Yin, P.F.; Jing, H.W. Effect of high temperature on deformation failure behavior of granite specimen containing a single fissure under uniaxial compression. Rock Mech. Rock Eng. 2019, 52, 2087–2107. [Google Scholar] [CrossRef]
- He, C.; Yang, J. Laboratory study of dynamic mechanical characteristic of granite subjected to confining pressure and cyclic blast loading. Lat. Am. J. Solids Struct. 2018, 15, 1–16. [Google Scholar] [CrossRef]
- Taheri, A.; Royle, A.; Yang, Z.; Zhao, Y. Study on variations of peak strength of a sandstone during cyclic loading. Geomech. Geophys. Geo-Energy Geo-Resour. 2016, 2, 1–10. [Google Scholar] [CrossRef]
- Wu, F.; Chen, J.; Zou, Q.L. A nonlinear creep damage model for salt rock. Int. J. Damage Mech. 2018, 28, 758–771. [Google Scholar] [CrossRef]
- Shang, J.L.; Hu, J.H.; Zhou, K.P.; Luo, X.W. Porosity increment and strength degradation of low-porosity sedimentary rocks under different loading conditions. Int. J. Rock Mech. Min. Sci. 2015, 75, 216–223. [Google Scholar] [CrossRef]
- Liu, G.; Xiao, F.K.; Guo, Z.B.; Chi, X.H.; Jiang, Y.N.; Yu, H.; Hou, Z.Y.; Zhao, R.X. Plastic characteristics of rock under point load. Sci. Technol. Eng. 2018, 18, 217–222. [Google Scholar]
- Amitrano, D. Rupture by damage accumulation in rocks. Int. J. Fract. 2006, 139. [Google Scholar] [CrossRef] [Green Version]
- Huang, Y.H.; Yang, S.Q.; Tian, W.L. Cracking process of a granite specimen that contains multiple pre-existing holes under uniaxial compression. Fatigue Fract. Eng. Mater. Struct. 2019, 42, 1341–1356. [Google Scholar] [CrossRef]
- Shi, G.C.; Yang, X.J.; Yu, H.C.; Zhu, C. Acoustic emission characteristics of creep fracture evolution in double-fracture fine sandstone under uniaxial compression. Eng. Fract. Mech. 2019, 210, 13–28. [Google Scholar] [CrossRef]
- Lee, H.; Jeon, S. An experimental and numerical study of fracture coalescence in pre-cracked specimens under uniaxial compression. Int. J. Solids Struct. 2011, 48, 979–999. [Google Scholar] [CrossRef] [Green Version]
- Liu, J.P.; Li, Y.H.; Xu, S.; Jin, C.Y.; Liu, Z.S. Moment tensor analysis of acoustic emission for cracking mechanisms in rock with a pre-cut circular hole under uniaxial compression. Eng. Fract. Mech. 2015, 135, 206–218. [Google Scholar] [CrossRef]
- Lin, P.; Wong, R.H.C.; Tang, C.A. Experimental study of coalescence mechanisms and failure under uniaxial compression of granite containing multiple holes. Int. J. Rock Mech. Min. Sci. 2015, 77, 313–327. [Google Scholar] [CrossRef]


| Group | Number of Cycles | Height (mm) | Diameter (mm) | Dry Mass (g) | Natural Mass (g) | Saturated Mass (g) | Saturated Mass after Load (g) |
|---|---|---|---|---|---|---|---|
| A3-1 | 10 | 100.67 | 49.11 | 495.25 | 495.79 | 496.58 | 497.20 |
| A3-2 | 101.01 | 49.12 | 492.53 | 493.02 | 493.91 | 499.00 | |
| A3-3 | 100.30 | 48.91 | 491.73 | 492.17 | 493.03 | 497.62 | |
| B3-1 | 20 | 100.17 | 49.34 | 493.82 | 494.49 | 495.35 | 497.42 |
| B3-2 | 100.45 | 49.05 | 494.89 | 495.54 | 496.51 | 497.02 | |
| B3-3 | 100.43 | 49.45 | 498.07 | 498.61 | 499.54 | 502.21 | |
| C3-1 | 30 | 100.95 | 49.04 | 494.66 | 495.20 | 496.02 | 496.68 |
| C3-2 | 100.30 | 49.59 | 502.68 | 503.24 | 504.73 | 504.77 | |
| C3-3 | 100.75 | 49.16 | 496.48 | 497.02 | 497.96 | 498.56 | |
| D-1 | 0 | 100.50 | 49.12 | 492.24 | 492.74 | 493.65 | —— |
| D-2 | 100.77 | 49.04 | 495.15 | 495.73 | 496.61 | —— | |
| D-3 | 99.45 | 49.17 | 491.03 | 491.57 | 492.40 | —— |
| Confining Pressure (MPa) | Cyclic Loading and Unloading of Specimens | Uniaxial Compression Specimens | ||
|---|---|---|---|---|
| 10 Cycles | 20 Cycles | 30 Cycles | ||
| 50 | A1-1 | B1-1 | C1-1 | D-1 D-2 D-3 |
| A1-2 | B1-2 | C1-2 | ||
| A1-3 | B1-3 | C1-3 | ||
| 80 | A2-1 | B2-1 | C2-1 | |
| A2-2 | B2-2 | C2-2 | ||
| A2-3 | B2-3 | C2-3 | ||
| 100 | A3-1 | B3-1 | C3-1 | |
| A3-2 | B3-2 | C3-2 | ||
| A3-3 | B3-3 | C3-3 | ||
| 120 | A4-1 | B4-1 | C4-1 | |
| A4-2 | B4-2 | C4-2 | ||
| A4-3 | B4-3 | C4-3 | ||
| N 1 | ||||
|---|---|---|---|---|
| 10 | 148.13 | 118.86 | 114.60 | 105.32 |
| 20 | 109.21 | 101.03 | 100.87 | 93.04 |
| 30 | 113.87 | 107.12 | 85.65 | 53.59 |
| N | |||
|---|---|---|---|
| 10 | 20 | 30 | |
| 50 |  Failure mode I |  Failure mode II |  Failure mode II |
| 80 |  Transitional mode I-III |  Failure mode III |  Failure mode II |
| 100 |  Failure mode III |  Failure mode III |  Failure mode III |
| 120 |  Failure mode III |  Failure mode III |  Failure mode II |
Publisher’s Note: MDPI stays neutral with regard to jurisdictional claims in published maps and institutional affiliations. |
© 2021 by the authors. Licensee MDPI, Basel, Switzerland. This article is an open access article distributed under the terms and conditions of the Creative Commons Attribution (CC BY) license (https://creativecommons.org/licenses/by/4.0/).
Share and Cite
Hu, J.; Zeng, P.; Yang, D.; Wen, G.; Xu, X.; Ma, S.; Zhao, F.; Xiang, R. Experimental Investigation on Uniaxial Compression Mechanical Behavior and Damage Evolution of Pre-Damaged Granite after Cyclic Loading. Energies 2021, 14, 6179. https://0-doi-org.brum.beds.ac.uk/10.3390/en14196179
Hu J, Zeng P, Yang D, Wen G, Xu X, Ma S, Zhao F, Xiang R. Experimental Investigation on Uniaxial Compression Mechanical Behavior and Damage Evolution of Pre-Damaged Granite after Cyclic Loading. Energies. 2021; 14(19):6179. https://0-doi-org.brum.beds.ac.uk/10.3390/en14196179
Chicago/Turabian StyleHu, Jianhua, Pingping Zeng, Dongjie Yang, Guanping Wen, Xiao Xu, Shaowei Ma, Fengwen Zhao, and Rui Xiang. 2021. "Experimental Investigation on Uniaxial Compression Mechanical Behavior and Damage Evolution of Pre-Damaged Granite after Cyclic Loading" Energies 14, no. 19: 6179. https://0-doi-org.brum.beds.ac.uk/10.3390/en14196179