Article

Analysis of Controlling Factors at Separate Imbibition Stages for Ultra-Low-Permeability Reservoirs

1
Department of Oil and Gas Field Development Engineering, College of Petroleum Engineering, China University of Petroleum, Beijing 102249, China
2
Research Institute of Shaanxi Yanchang Petroleum (Group) Co., Ltd., Xi’an 710075, China
3
Research Center of Exploration and Development Engineering for Extra Low Permeability Oil and Gas Fields in Shaanxi Province, Xi’an 710075, China
*
Authors to whom correspondence should be addressed.
Submission received: 25 August 2021 / Revised: 18 October 2021 / Accepted: 25 October 2021 / Published: 30 October 2021

Abstract

:
Spontaneous imbibition is an important mechanism in naturally fractured reservoirs. In our previous studies on the effect of imbibition efficiency of ultra-low permeability reservoirs, we mostly focused on the relationship between macroscopic core recovery rate and influential factors. Additionally, we also mainly focused on the factors that control the final imbibition recovery for ultra-low permeability reservoirs. Through a large number of experiments, it was found that the factors affecting imbibition are different in separate stages. However, the relative importance of those factors in different imbibition stages was hardly studied. In this work, we tested six key factors, i.e., the core length, RQI, salinity, interfacial characteristics, initial oil saturation, and oil viscosity, in natural sandstone samples from Chang 6 in the Zichang area. Based on experimental results, we divided the imbibition process into three stages (i.e., the early stage, the middle stage, and the late stage) to quantify the effects of the controlling factors. The results show that the relative importance of the controlling factors is changing during the imbibition process. The weight of importance is obtained for those factors at each stage. In addition, a comparative model is established for the dual-porosity media from Chang 6 formation. The results show that the increase of the rock size can extend the imbibition period for the early and middle stages. Moreover, the weight of importance for the initial oil saturation, interfacial characteristics, and salinity are also analyzed in three imbibition stages. This study provides theoretical support to guide water injection in ultra-low-permeability reservoirs and to understand the formation of energy supplements and oil recovery during the imbibition process.

1. Introduction

Spontaneous imbibition is one of the main production mechanisms for waterflooded ultra-low-permeability reservoirs [1,2,3]. By using capillary forces, the wetting-phase fluid (water) spontaneously invades into pores and extracts the non-wetting phase fluid (crude oil) to fractures for production. The study of spontaneous water imbibition is essential to predict the production performance in reservoirs developed by waterflooding, especially in highly stratified formations and fractured reservoirs [4,5,6,7,8], and has already helped some hydrophilic, fractured oil reservoirs to increase their oil recovery [9,10].
As spontaneous imbibition is dominated by capillary pressure, the imbibition rate is significantly dependent on the properties of the porous media, fluids, and their interactions. In previous studies, scholars have completed a lot of research on the influencing properties of imbibition. Most of the studies in the literature mainly focused on the influence of a single factor on spontaneous imbibition as a whole process [11,12,13,14,15]. Hua et al. [3] summarized the influences of the core size, RQI, initial oil saturation, salinity, interfacial characteristics, oil viscosity, temperature, system pressure, and contacted area on the imbibition efficiency and imbibition rate in a low-permeability sandstone reservoir, respectively [2]. Ghasemi et al. [16] inferred a new scaling equation for the imbibition process in naturally fractured gas reservoirs. Wang et al. [17] studied the moderate water-injection technique based on the double effects of the imbibition-displacement mechanism, and the water injection development effect for the ultra-low-permeability fractured reservoirs can be improved significantly. Li and Horne [18,19,20,21,22] studied the mechanism of gas–water two-phase spontaneous imbibition under different saturation conditions and established a theoretical model, which described a good linear relationship between imbibition rate and recovery. Li and Liu [23] studied the effects of the core size, water saturation, interfacial tension, wettability, and other influential factors on the efficiency of imbibition oil recovery. Meng and Cai [24] researched various boundary conditions of spontaneous imbibition, which has important effects on the imbibition rate and efficiency. Babadagli and Zeidani [25] deduced the matrix-fracture dual-media interaction equation of spontaneous imbibition in different rocks and fluids. Arihara [26] studied the flow process of matrix fracture. Hatiboglu and Babadagli [27] studied the effect of temperature on matrix type and interfacial tension during the imbibition process. Cai et al. [28] summarized the recent significant progress in mathematical models about the Lucas–Washburn (LW) equation to demonstrate the modifications and extensions of capillary imbibition predictions in various microchannels and porous media. Gao et al. [29] studied the influencing factors and revealed the mechanism of spontaneous imbibition in the gas/oil recovery from tight reservoirs.
However, few studies and methods discussed quantitative characterizations of the main controlling factors during different imbibition processes. In this work, natural sandstone samples with ultra-low permeability from the Ordos basin Chang 6 formation are used to quantify the effects of the main controlling factors in imbibition stages. Previous results indicated that the system pressure has little effect on the static imbibition [30,31]; the influence of contact area is often studied through the core length [32]; the effect of temperature can be studied through the changing oil viscosity [33,34]. Therefore, we minimized the testing control factors to six, which are the core size, RQI, initial oil content, salinity, interface characteristics, and crude oil viscosity. Through a series of experiments, it was found that the factors affecting imbibition are different in each stage, and the imbibition performance is used to divide an imbibition process into three stages in order to analyze the effects of those controlling factors. The analytical hierarchy process (AHP) is used to establish a comparative analysis model for the main controlling factors. Moreover, a quantitative study is carried out to analyze the main controlling factors in different imbibition stages to provide new theoretical support for guiding the water injection in ultra-low-permeability reservoirs to understand the formation of energy supplement and oil recovery during the imbibition processes.

2. Experimental Study

2.1. Geologic Features of the Study Area

Zichang area of Yanchang Oilfield is located in the northern Shaanxi slope of the eastern Ordos Basin. The slope is monocline with a westward dip angle of less than 1°. Zichang area is a typical ultra-low-permeability fractured reservoir with low permeability, low porosity, and low-pressure coefficient. Spontaneous imbibition is an important oil recovery mechanism for Chang 6 formation in this reservoir.

2.2. Experimental Preparation

The major experimental setup includes the Amott cell, vacuum saturation device, oven, Brookfield rheometer (manufacterer’s location: Middleboro, MA, USA), gas-permeability measuring instrument, electronic balance, and electronic Vernier caliper.
The average density of surface crude oil is 0.849 g/cm3. The viscosity of surface crude oil is 4.28~8.89 mPa·s (the average is 5.22 mPa·s), and the freezing point is −6~22 °C (the average is 7.4 °C). Therefore, No. 5 white oil, which has similar properties to crude oil in Chang 6 formation, is selected as the experimental oil. The formation water in the study area is calcium chloride (CaCl2) water type, with a total salinity of 91.3384 g/L and PH value of 6.53~7.37 (the average is 6.85). Based on the above properties, the formation water is prepared in the laboratory. The salinity is measured as 91 g/L. The core samples are selected from Chang 6 formation in Zichang area. The cores are processed by cutting flat, washing oil, drying, weighing, etc., for experimental use.
There are three main steps for experiments. First, cores are saturated to No. 5 white oil by vacuum saturation device. Then, the saturated cores are put into an Amott cell that contains the simulated formation water for spontaneous imbibition processes. During the imbibition, the volume of the produced oil is recorded with time. The schematic of the experiments is shown in Figure 1.

2.3. Experimental Cases

In total, 29 imbibition tests are conducted. All experiments are tested at room temperature (25 °C). Table 1 listed the petrophysical properties of cores according to the tested controlling factors. In this work, six controlling factors for imbibition processes are studied. They are the core length, reservoir RQI, salinity, interfacial characteristics, initial oil rate, and viscosity. For each set of experiments, we make sure there is only one controlling factor by keeping other petrophysical properties fixed so that the reliability of the experimental results can be guaranteed.

2.4. Experimental Results

In short, after half an hour of an experiment, oil beads appear on the core surface. With imbibition, continuously, oil beads become larger, detach from the core, and finally gather in the graduated tube of the Amott cell. Figure 2 gives an example of time snapshots in imbibition experiments for investigating salinity effects. The detailed results of oil production profiles are summarized in Figure 3, Figure 4, Figure 5, Figure 6, Figure 7 and Figure 8 for controlling factors, respectively, which can refer to the following subsections.

2.4.1. Effects of the Core Length

Figure 3 depicts the imbibition results for testing the effects of the core length. The final imbibition displacement efficiencies of four cores with different lengths are approximately equal, and the range of variation is small. A shorter core length leads to a greater peak of the early flow velocity; the shorter the time for the imbibition front to reach the nonflow boundary, the shorter the time to reach the stable condition and stop the imbibition.

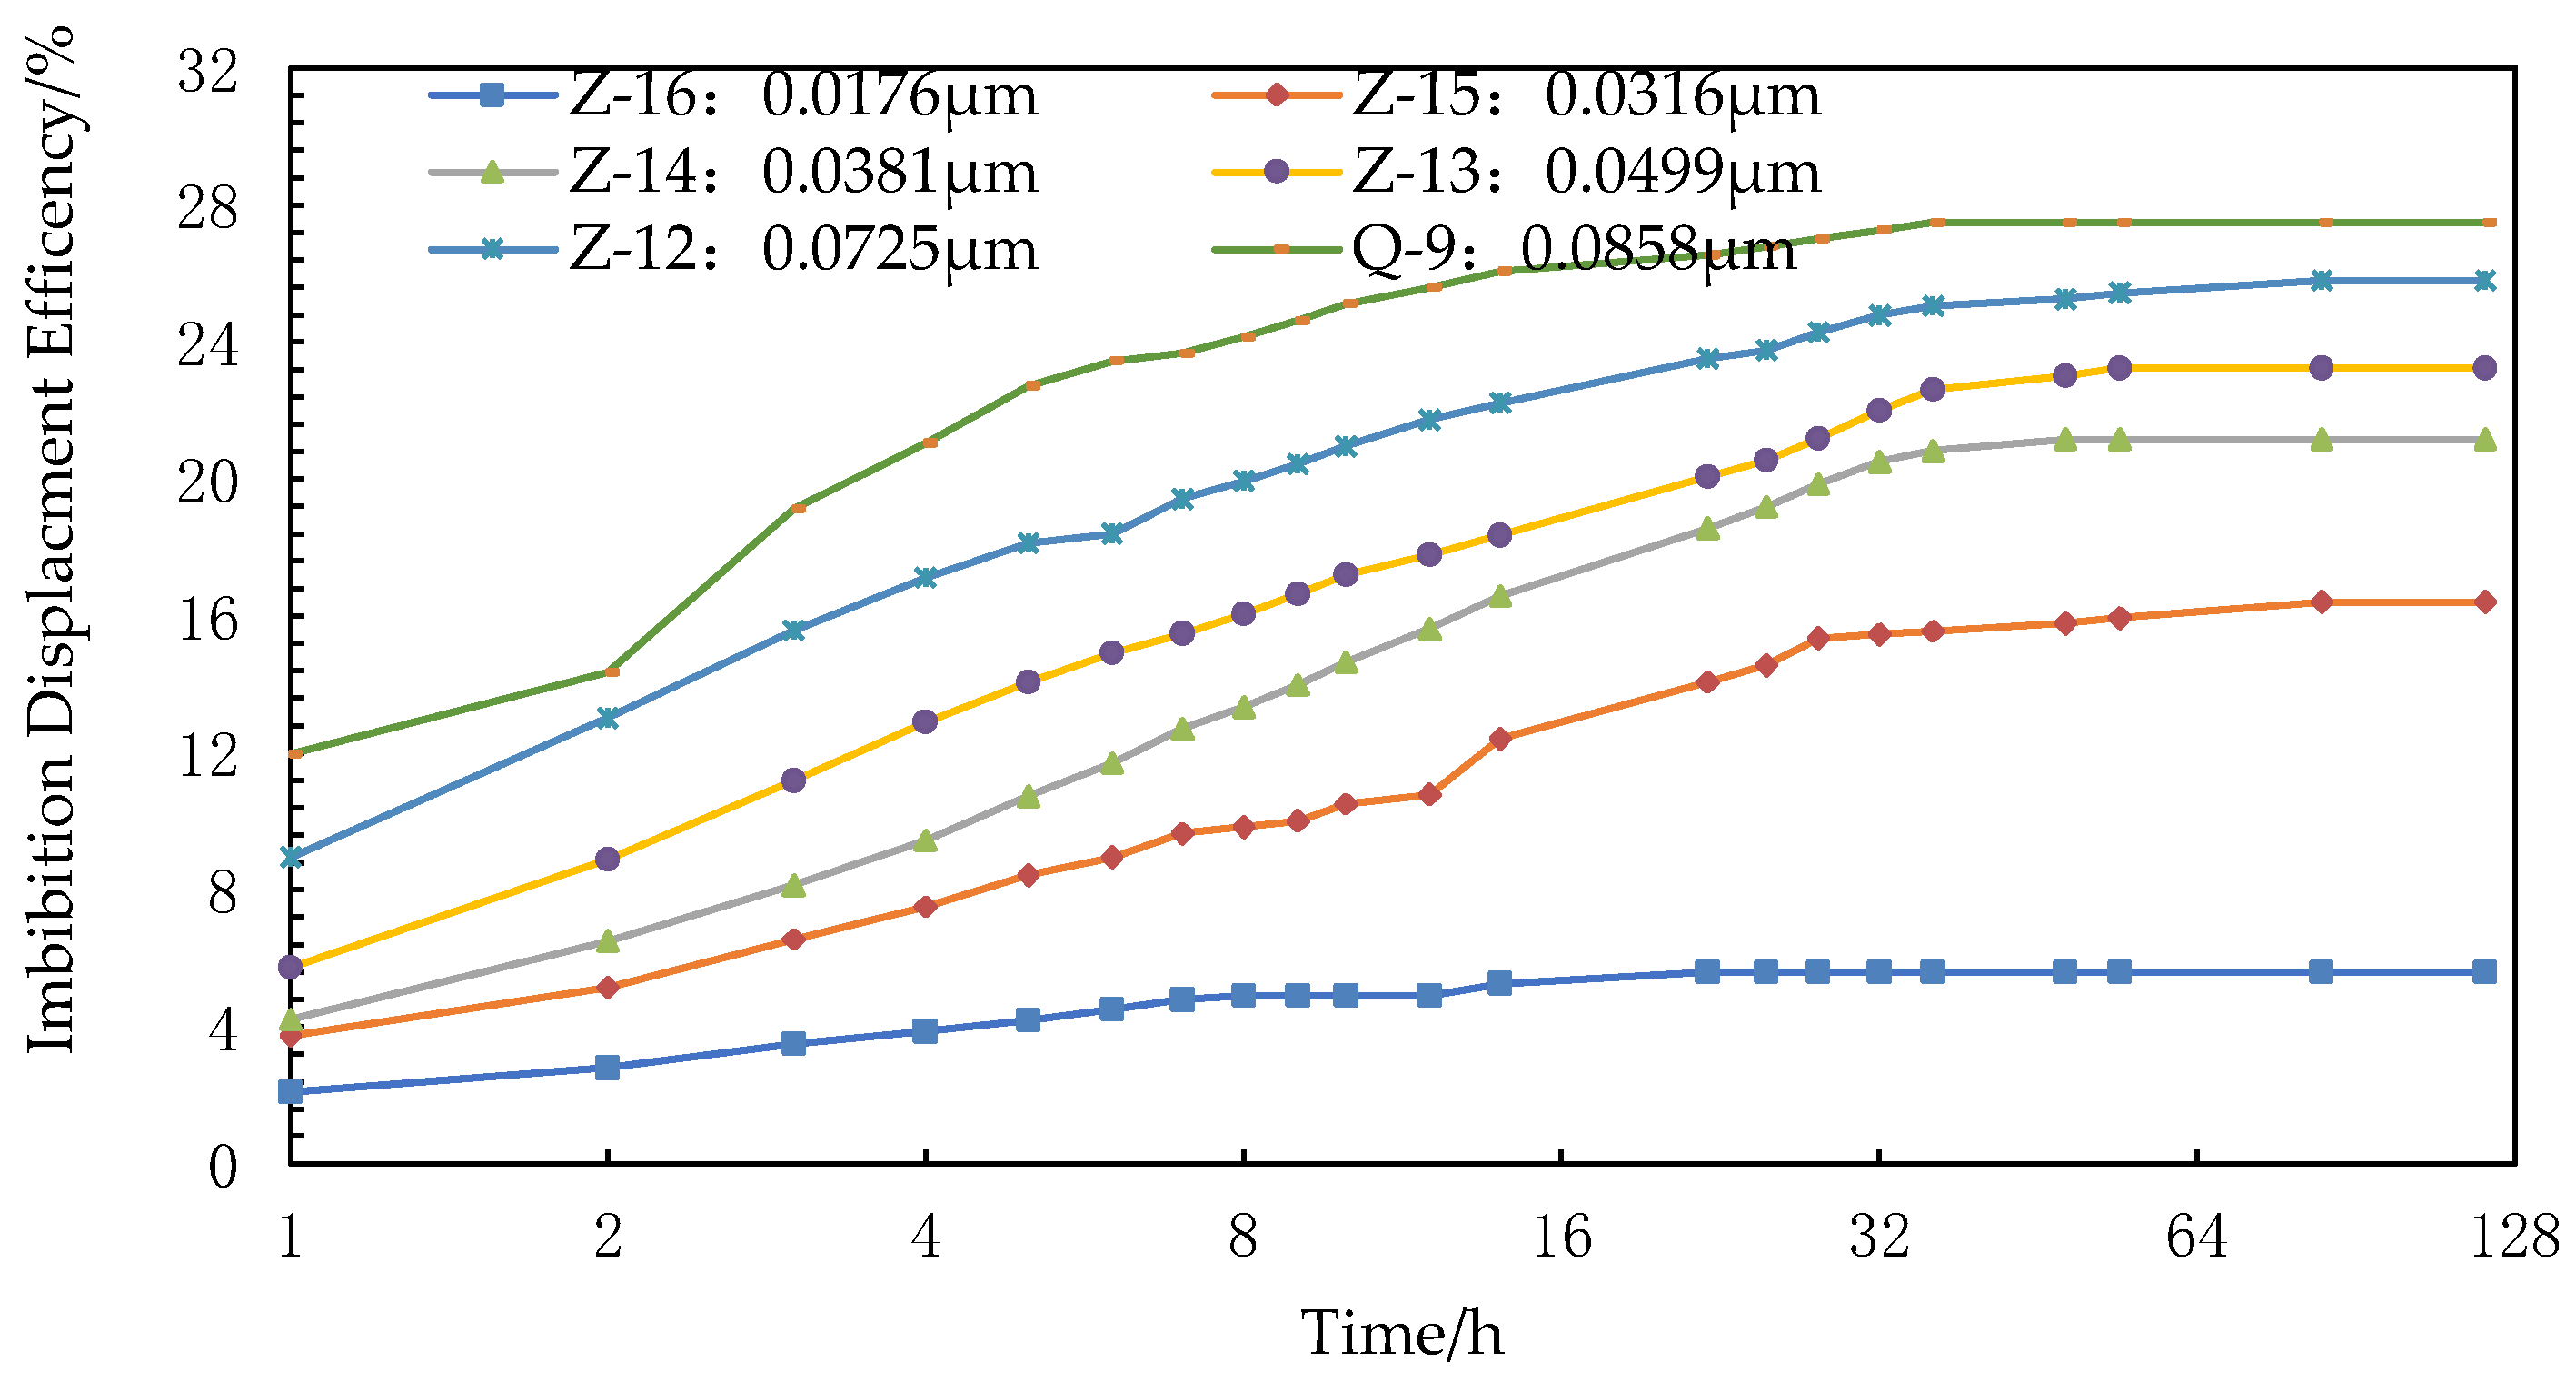
2.4.2. Effects of the RQI (Reservoir Quantity Index)

Figure 4 depicts the imbibition results for testing the effects of the RQI. There is a big error in evaluating the physical properties of ultra-low-permeability reservoirs with a single parameter of permeability or porosity, so the reservoir RQI ( k / φ ) is used to characterize the impact of reservoir physical properties on the imbibition displacement efficiency [10,16,17,18]. The imbibition results in Table 2 show that a higher RQI leads to a greater final imbibition displacement efficiency and higher imbibition speed at the early stage of imbibition. Figure 4 shows a good positive correlation between the RQI and the final oil displacement efficiency.
Figure 4. Displacement efficiency curve of imbibition for investigating the RQI.
Energies 14 07093 g004

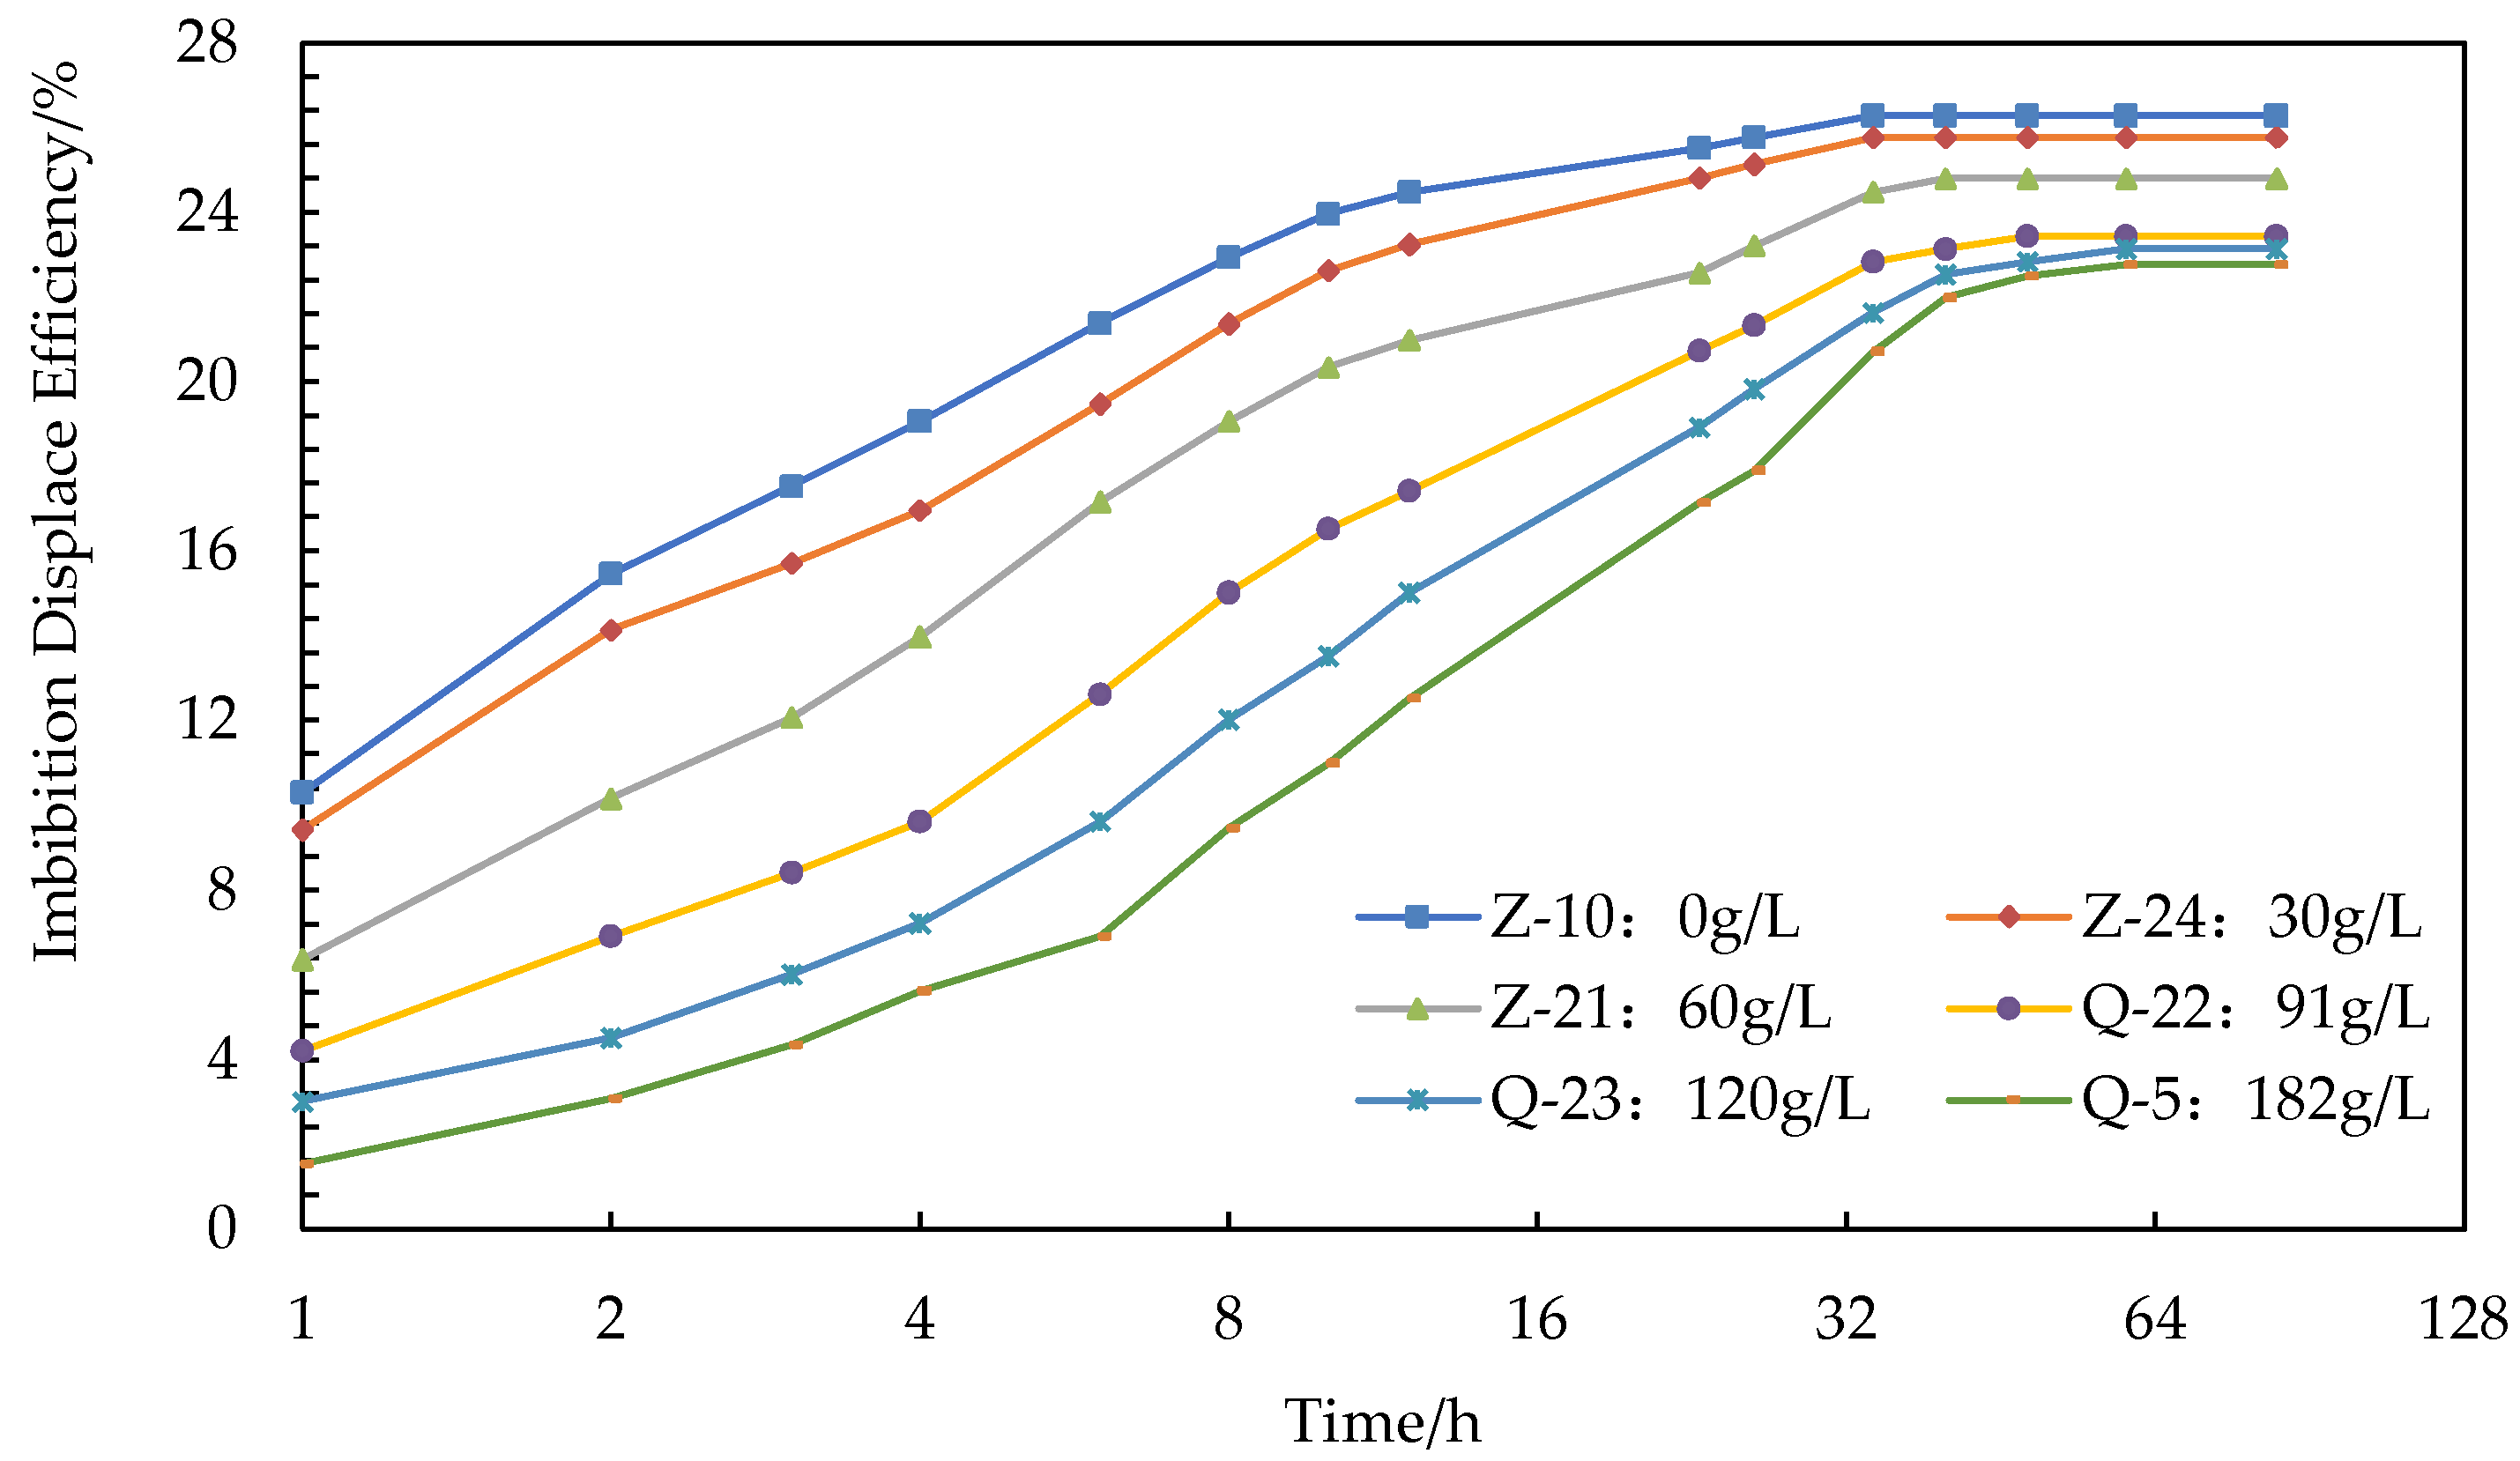
2.4.3. Effects of Salinity

Figure 5 depicts the imbibition results for testing the effects of salinity. The experimental cores are Z-10, Z-24, Z-21, Z-22, Z-23, Q-5, with similar length and permeability. The salinity of the imbibition fluid is 0, 1/3, 2/3, 1, 4/3, and 2 times the formation waters, respectively, which are 0 g/mL, 30 g/mL, 60 g/mL, 91 g/mL, 120 g/mL, and 182 g/mL. The concrete data are summarized in Table 3. With the increase in the salinity of the imbibition fluid, the final imbibition recovery rate decreases. Under the condition of the distilled water, the imbibition process tends to be stable after 34 h. When the salinity is 182 g/L, the imbibition process tends to be stable after 48 h. Thus, the increase of salinity can reduce imbibition recovery and rate and further inhibit the imbibition processes. Though the experiments changed the salinity from 0 to 82 g/L, the variation of oil recovery is small, which is between 22.76% and 26.29%. It can be concluded that the salinity of the formation water strongly controls the imbibition rate but has limited effects on imbibition recovery.
Figure 5. Displacement efficiency curve of imbibition for investigating salinity.
Energies 14 07093 g005

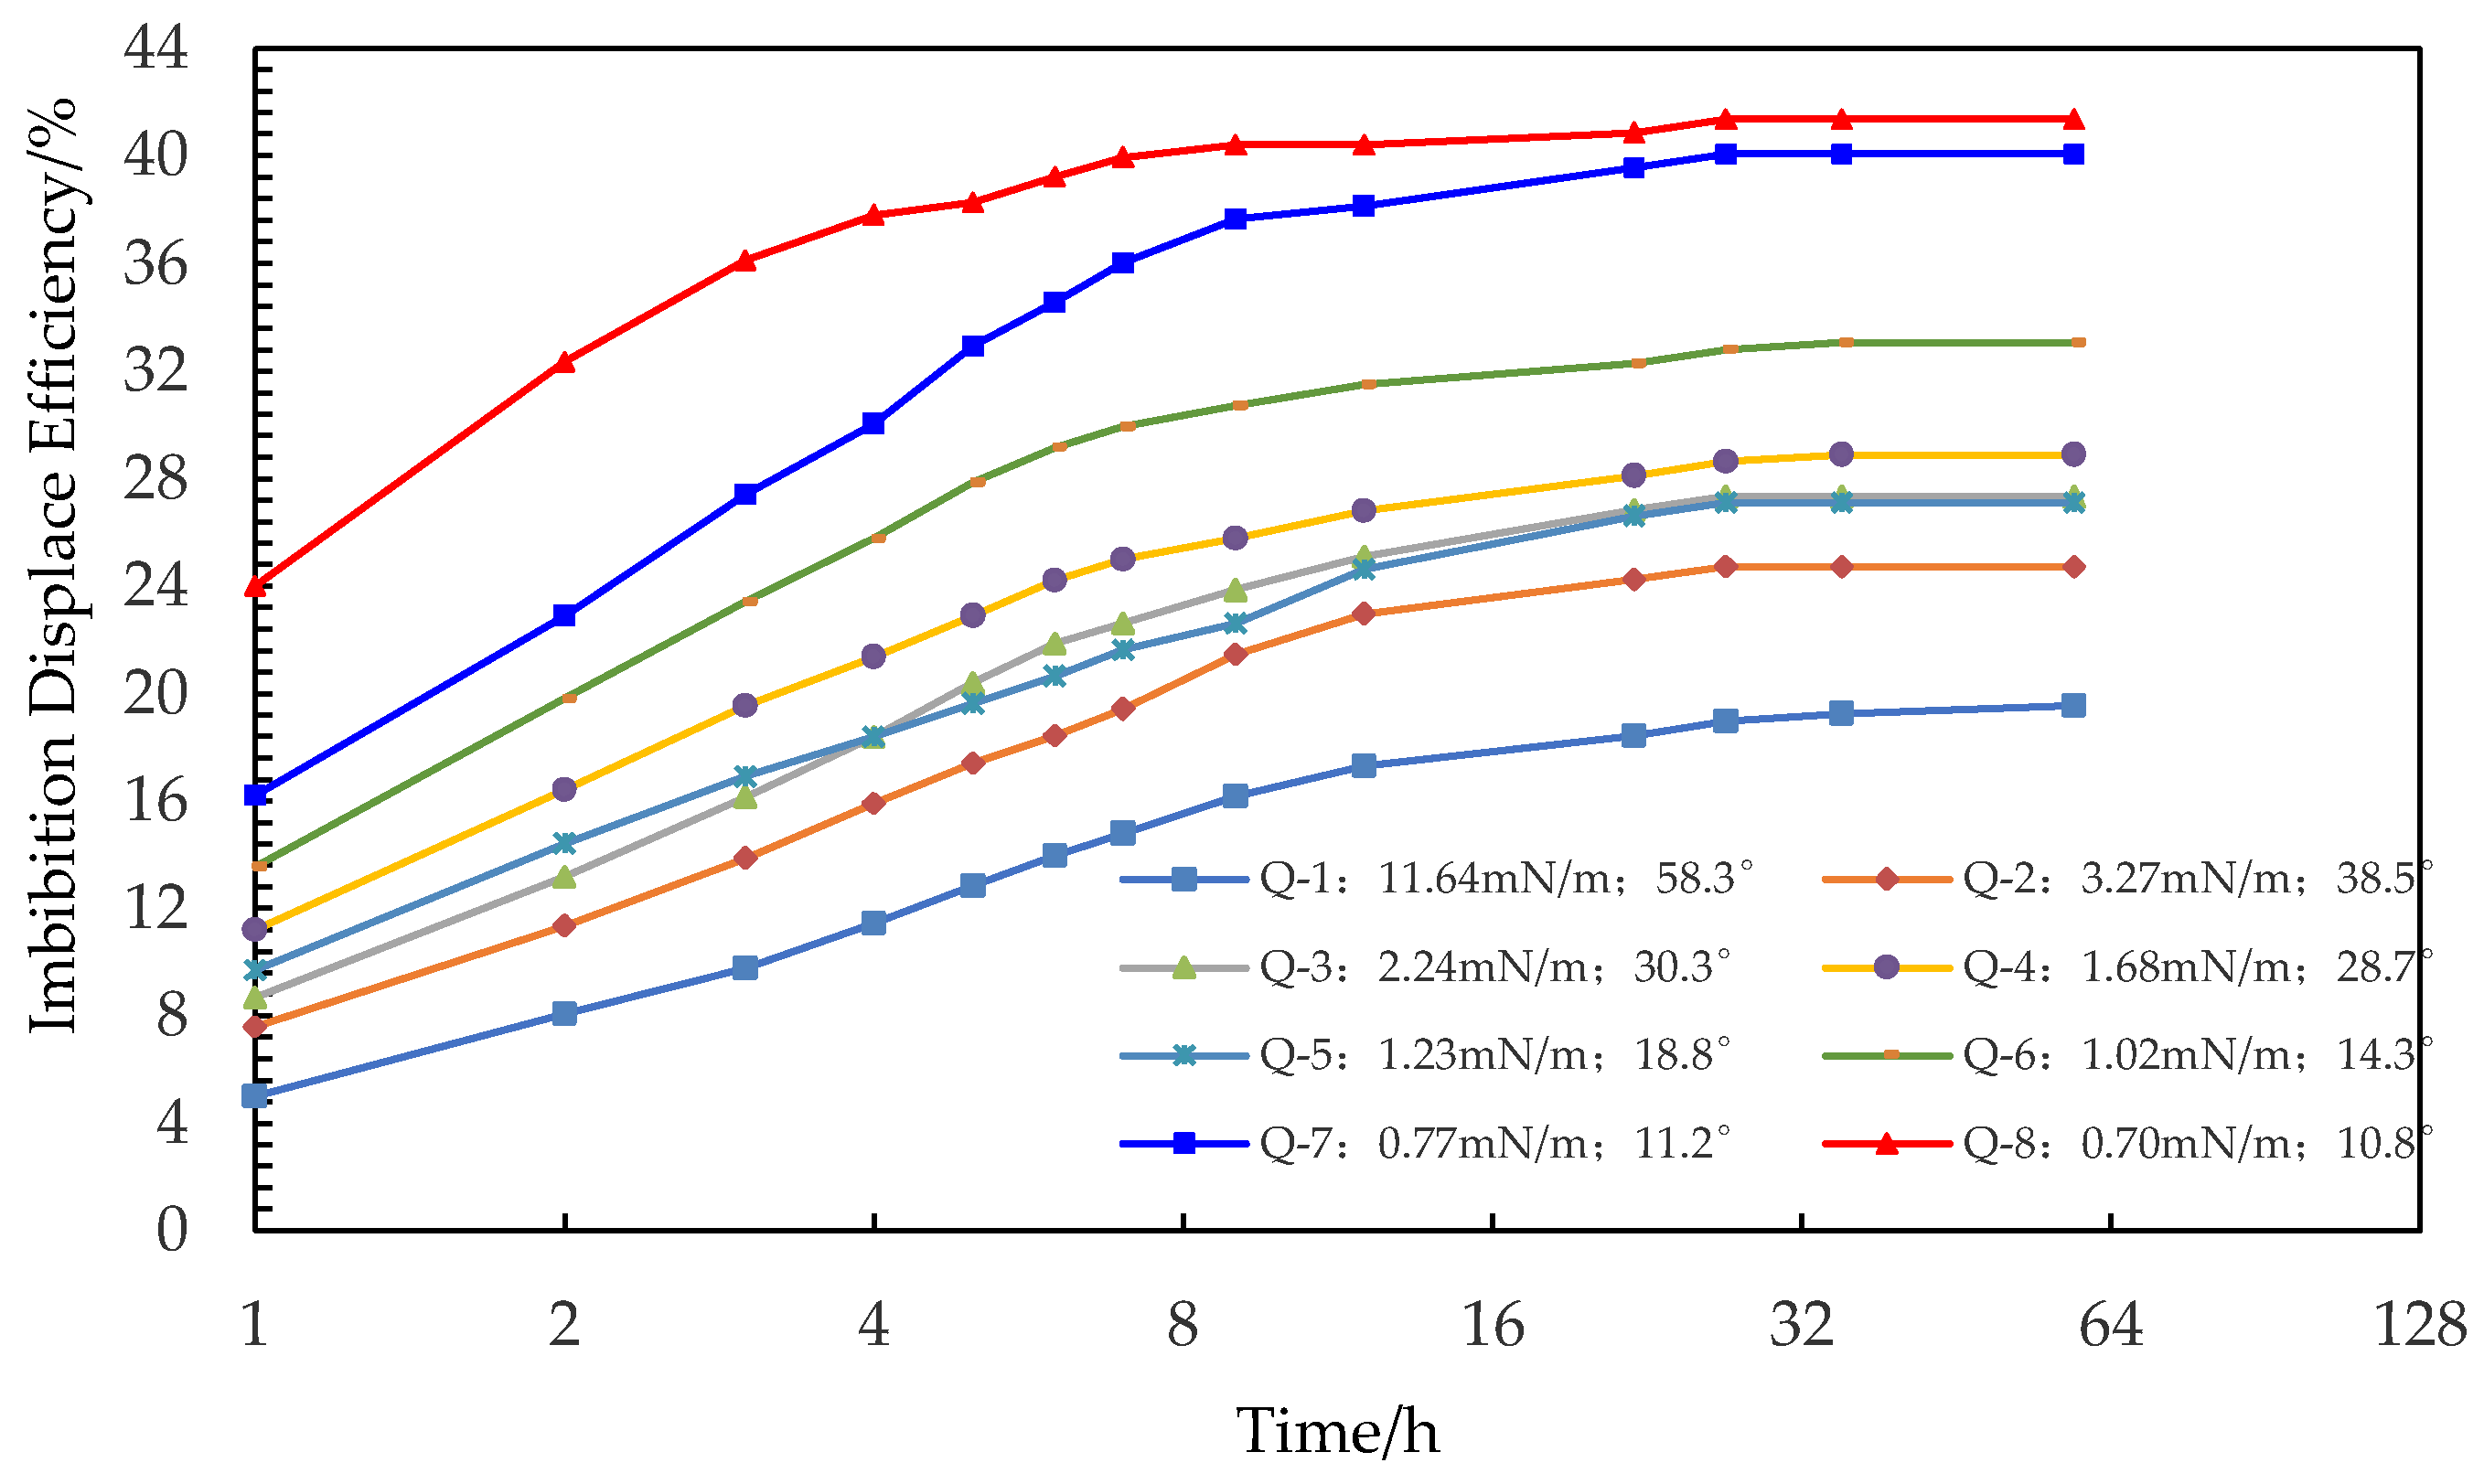
2.4.4. Effects of the Interfacial Tension and Contact Angle

Figure 6 depicts the imbibition results for testing the effects of the interfacial tension and contact angle. The oil–water interfacial tension range of the eight cores is 11.64~0.77 mN/m, and the wetting angle range is 58.3°~10.8°. With the decrease of interfacial tension and contact angle, the final oil recovery gradually increases from 19.52% to 41.36%. With the decreasing interfacial tension and contact angle, both imbibition recovery factor and production rate are increased. When the interfacial tension is the smallest, the final imbibition recovery (41.36%) with the smallest interfacial tension is about twice as high as that with the highest interfacial tension. Therefore, the reduction of the interfacial tension can significantly improve the imbibition recovery factor and production rate.
Figure 6. Displacement efficiency curve of imbibition for investigating the interface characteristics.
Energies 14 07093 g006

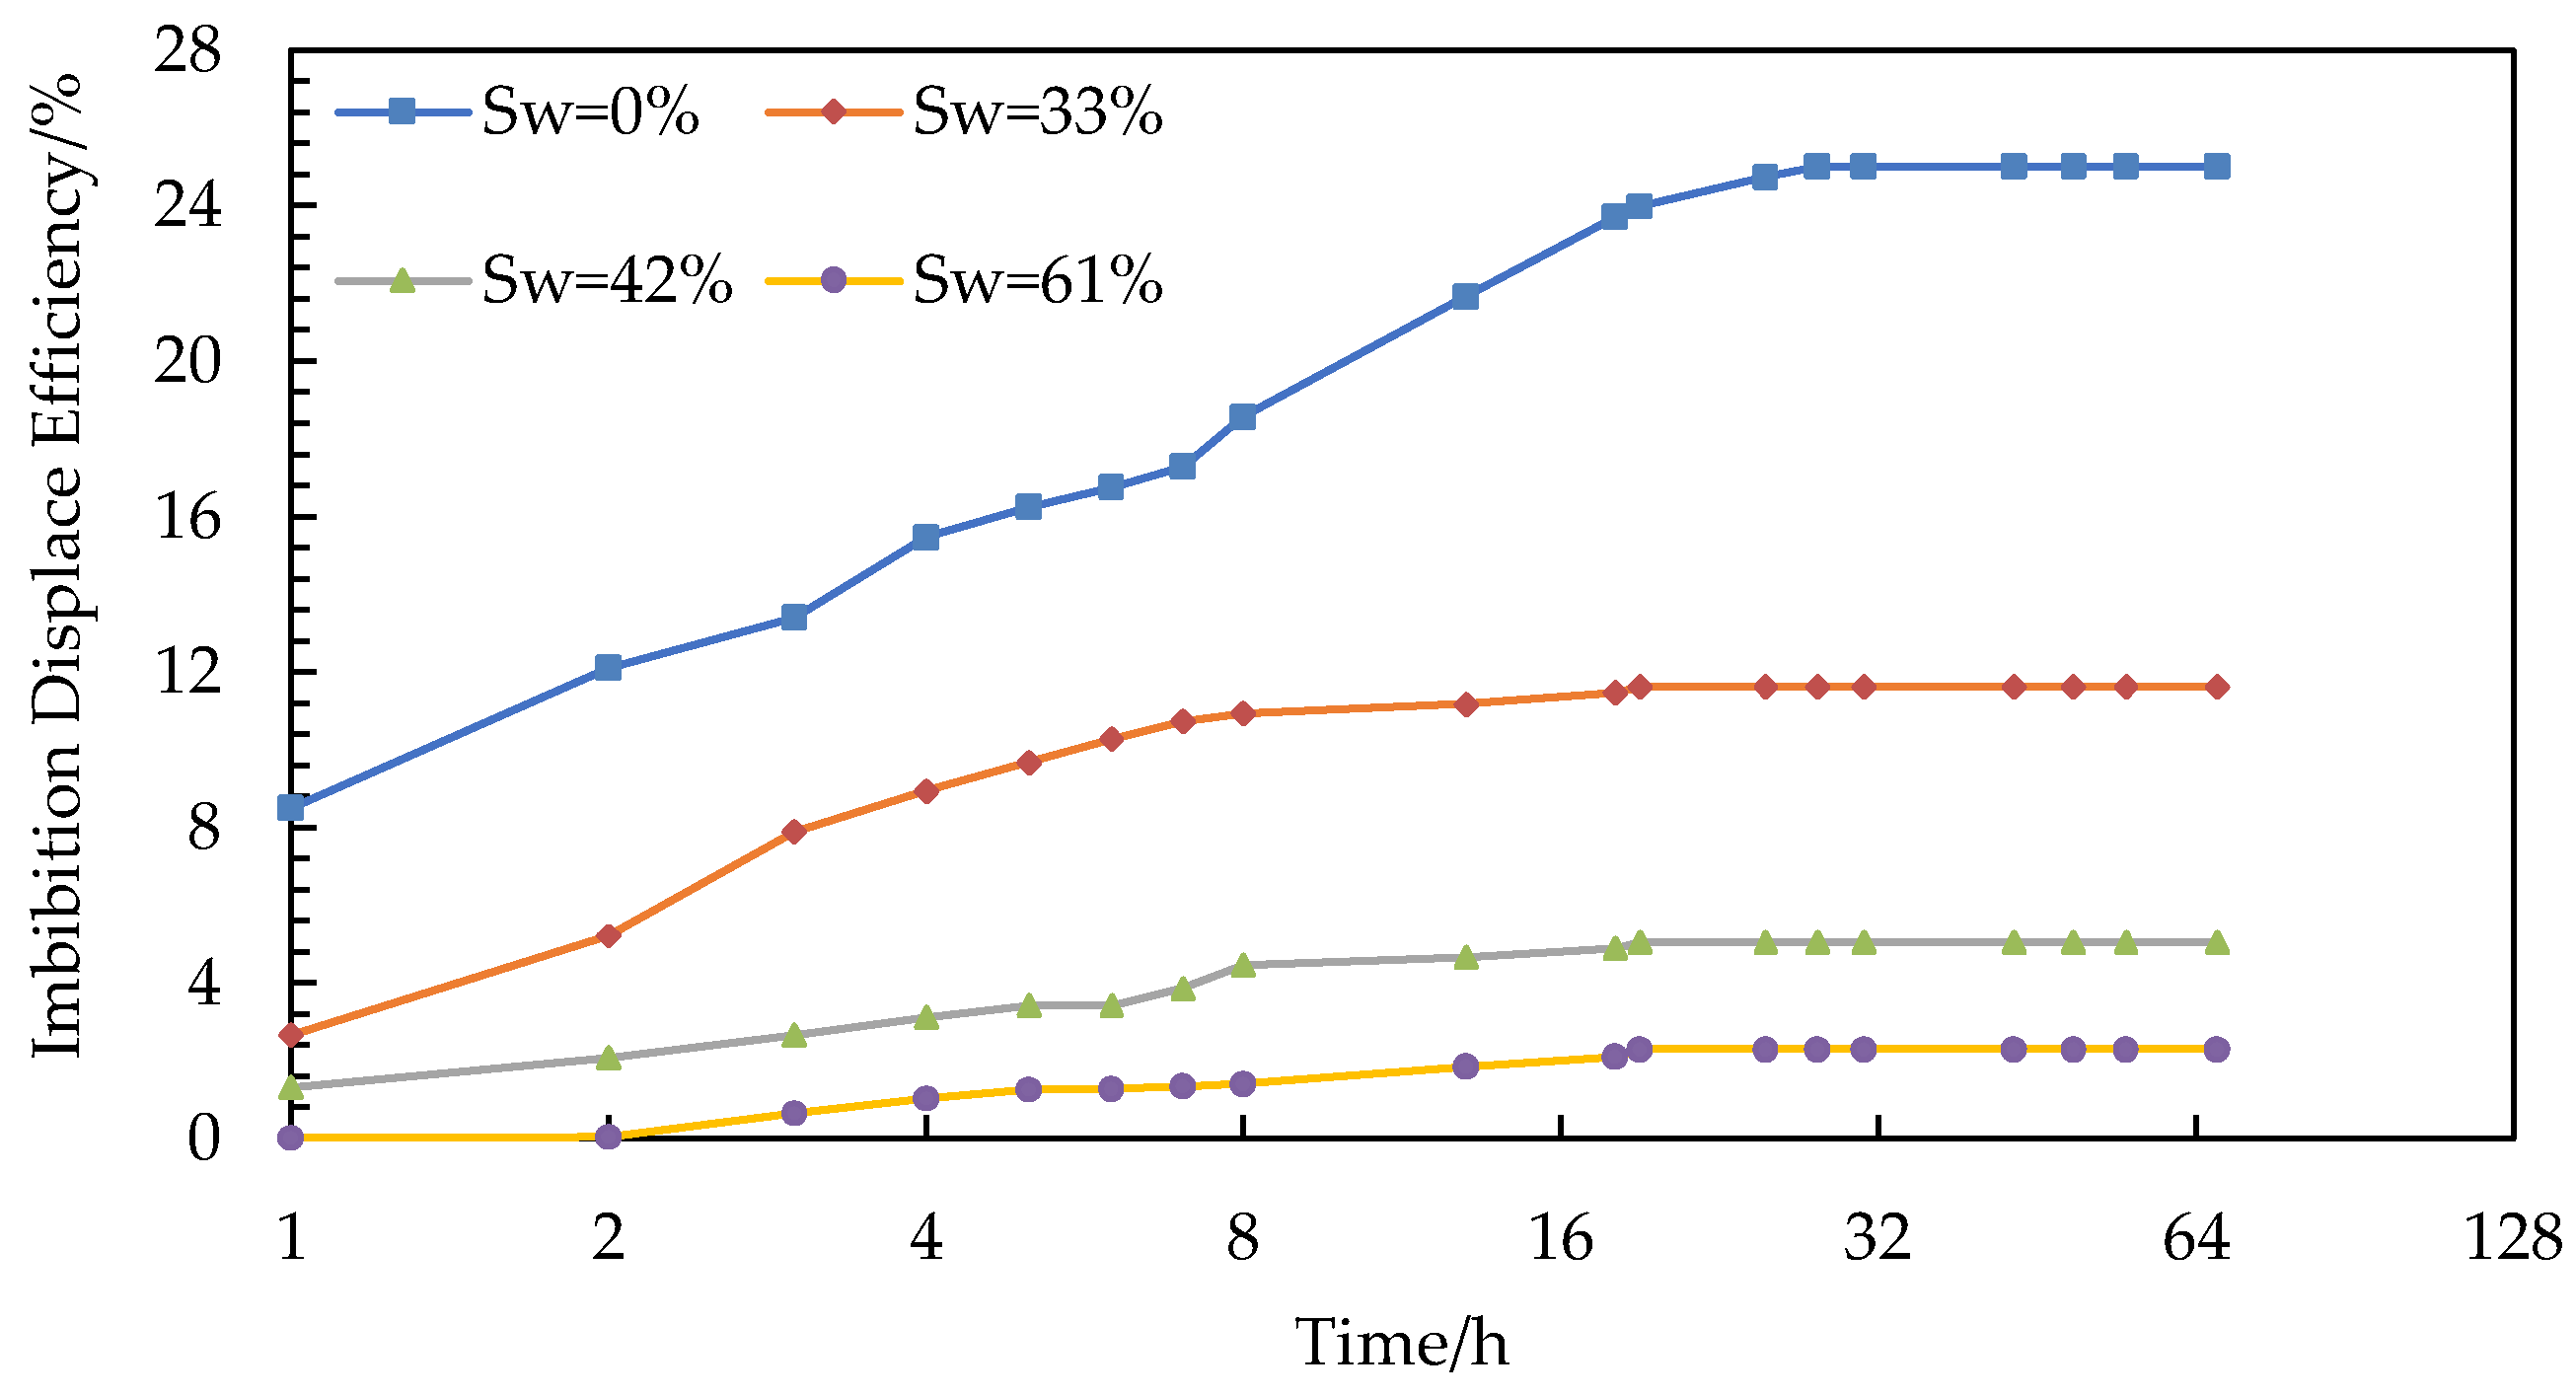
2.4.5. Effects of the Initial Oil Saturation

Figure 7 depicts the imbibition results for testing the effects of the initial oil saturation. The water saturation of T-1 core is Sw = 0%, Sw = 33%, Sw = 42%, and Sw = 61%, and the final oil imbibition displacement efficiencies are 25.01%, 11.63%, 5.06%, and 2.30%, respectively. The increase of the initial water saturation can lead the system to reach a stable state faster and lower the recovery factor and production rate.
Figure 7. Displacement efficiency curve of imbibition for investigating the initial oil saturation.
Energies 14 07093 g007

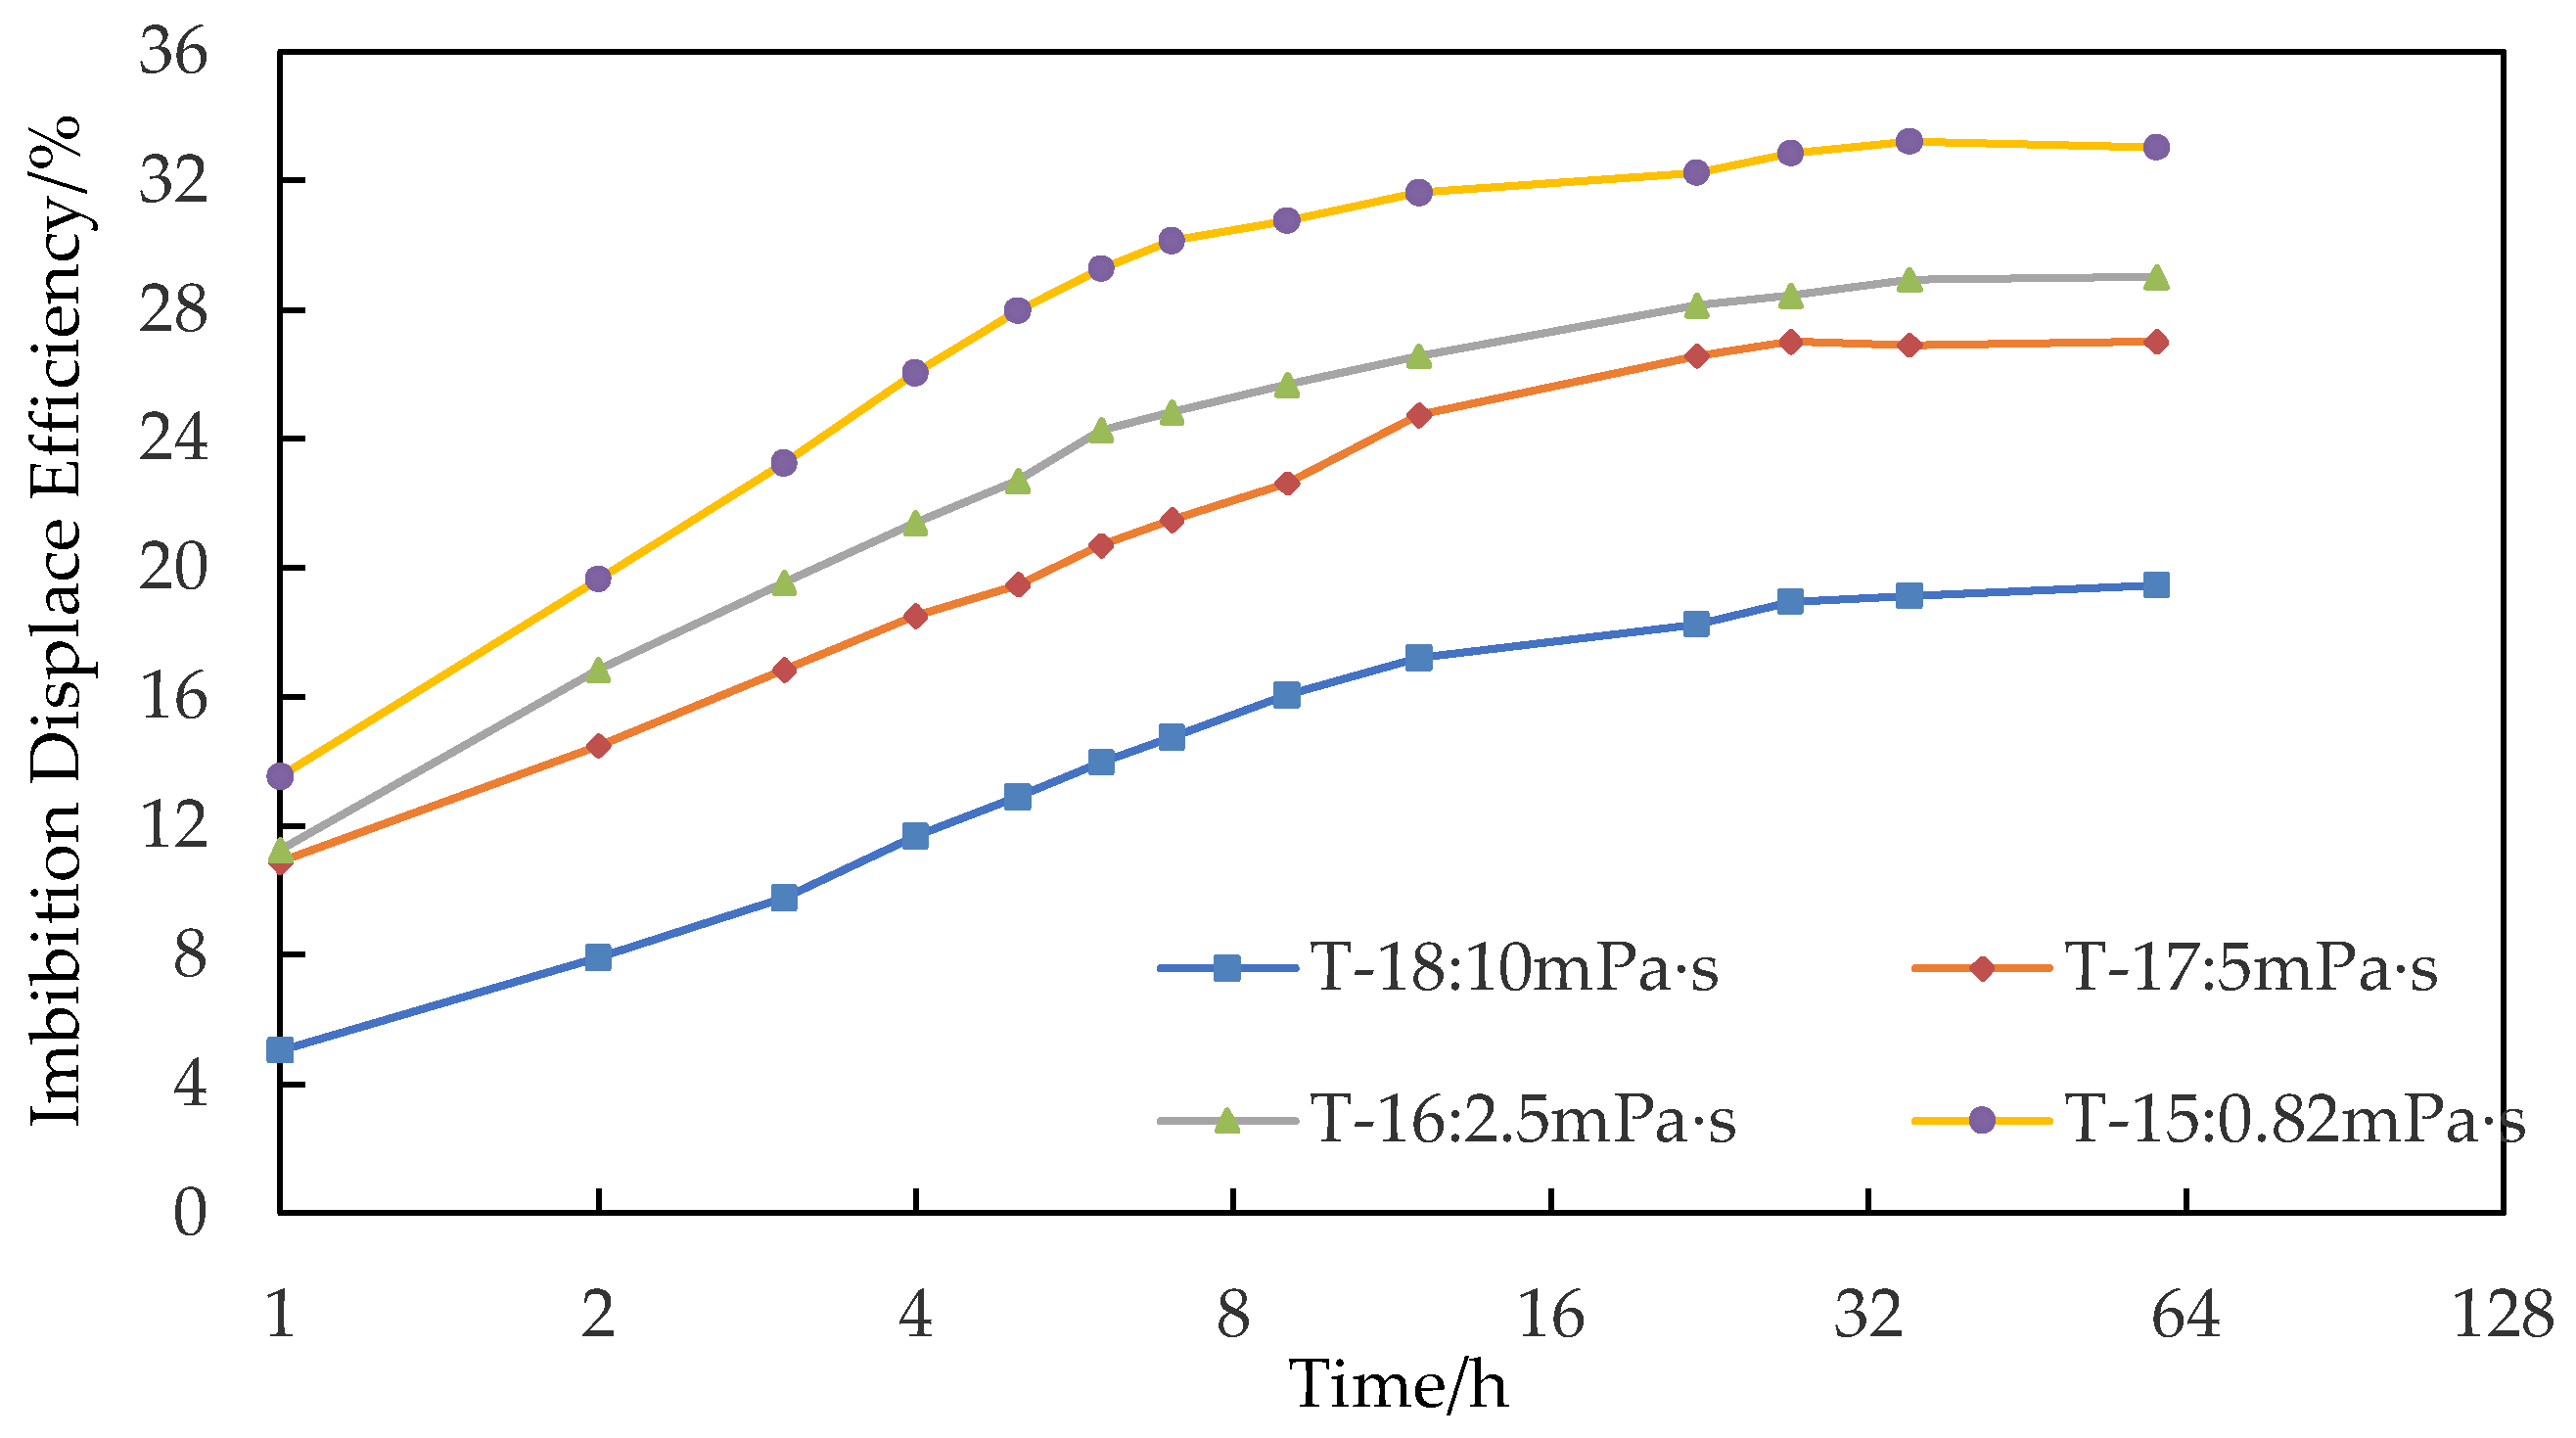
2.4.6. Effects of Oil Viscosity

Figure 8 depicts the imbibition results for testing the effects of oil viscosity. The oil viscosity parameters used in the four cores of T-15, T-16, T-17, and T-18 are 0.82 mPa·s, 2.50 mPa·s, 5.00 mPa·s, and 10.00 mPa·s, respectively. The corresponding final oil recovery is 33.02%, 29.00%, 26.99%, and 19.48%, respectively. The reduction of the oil viscosity can significantly increase the imbibition recovery factor.
Figure 8. Displacement efficiency curve of imbibition for investigating the viscosity of crude oil.
Energies 14 07093 g008

3. Discussion of Controlling Factors at Different Imbibition Stages

3.1. Dimensionless Time Scale Model

To compare the effects of the core shape, fluid viscosity, interfacial tension, rock permeability, and porosity, and boundary conditions and sizes on imbibition performance, many scholars have developed dimensionless time-scale theory to explain the experimental results in the imbibition process under oil–water systems [35,36]. In 1955, Rapoport first developed the basic theory of scaling experimental data to oilfield conditions. Then, Mattax and Kyte [5] proposed the scale equation (MK model) for investigating the imbibition processes in fractured oil reservoirs. In their study, dimensionless time is defined as
t D = α σ k / ϕ μ w L 2 t
where σ is the interfacial tension between oil and water, ϕ is the reservoir porosity, k is the reservoir permeability, μ w is the water viscosity, t is the imbibition time, L is the length of a core, and α is the unit transformation factor (3.16 × 10⁴).
After the MK model, many other different dimensionless time expressions are proposed. Mason et al. [13] pointed out that the effective relative permeability in some natural permeability models did not depend on the two-phase viscosity ratio. As a result, many relevant models are only applicable to the imbibition data with a finite viscosity ratio. A new scale model of spontaneous imbibition is proposed:
t D = 2 L c 2 k ϕ σ ( 1 S w ) n μ w ( 1 + μ m / μ w ) t
where μ o is the viscosity of oil and Lc is the characteristic length of core samples. For fully immersed cylindrical cores, the equation of characteristic length is shown below.
L c = r L 2 1 r 2 + 2 L 2
where L is the length of core samples and r is the radius of core samples.
By using Equation (3), the dimensionless time equation for our experiments in Table 1 can be calculated, which is listed in Table 4.

3.2. Analysis of Controlling Factors at Different Imbibition Stages

Based on the above time-scale models, the importance degree of each parameter is characterized by the degree of dispersion of the imbibition displacement efficiency in a dimensionless time. The standard deviation is introduced, which is expressed as follows:
σ = 1 N i = 1 n ( r x i ) 2
where N (i.e., n − 1) is the degree of freedom, r is the average value of samples, and x i is the value of the i sample. The physical meaning is to calculate the dispersion degree of the corresponding oil recovery of the tested imbibition experiments for each experimental parameter in a dimensionless scale. The greater the degree of dispersion is, the greater the importance of the controlling factor is.
Figure 9 shows the discreteness of the controlling factors with the dimensionless time. According to the strength of controlling factors, the imbibition processes are divided into three stages: the early stage, middle stage, and later stage. It can be seen from the figure that the standard deviations of the controlling factors are inconsistent at different imbibition stages. In the early stage, the controlling factors affecting the efficiency of imbibition and displacement are sorted as the interfacial characteristics > salinity > initial oil saturation/RQI > oil viscosity > core length. For the middle stage, controlling factors are sorted as the interfacial characteristics > initial oil saturation/RQI > oil viscosity > salinity > core length. For the late stage, the important sequences of controlling factors are as follows: the initial oil saturation > RQI > interfacial characteristics > oil viscosity > salinity > core length.

4. Discussion with a Comparative Analysis Model

4.1. Analytic Hierarchy Process

The Analytic Hierarchy Process (AHP) was proposed in the 1970s by Saaty, who is an operations research scientist at the University of Pittsburgh [37]. The weight of each factor to the target is determined to form a judgment matrix [38,39]. The comparison parameters are, respectively, the rows and columns of the matrix. Through a unified scale, they are compared in pairs to determine the value of the scale. In the AHP, a judgment scale (see Table 5) is introduced to quantitatively display the importance of each factor.

4.1.1. Construction of Judgement Matrix

By comparing the importance degree of each factor with the target, the judgment matrix is constructed as follows:
A = ( a i j ) n × n = [ a 11 a 12 a 1 n a 21 a 22 a 2 n a n 1 a n 2 a n n ]

4.1.2. Calculate the Weight of Each Parameter and Check the Procedure Consistency

Because matrix A is an orthogonal matrix (see Equation (1)), the vectors of the matrix are geometrically averaged and normalized to form the weight vectors [13]. The calculation steps are shown below. The geometric average of each vector of A matrix is as follows:
W ¯ i = j = 1 n a i j n
Normalization processing ( W ¯ i ) can be carried out:
W i = W ¯ i k = 1 N W ¯ k
Therefore, W = [ W 1 , W 2 , W n ] T is the weight of each controlling factor on the previous level. Then, the maximum characteristic root of the judgment matrix A is calculated.
λ max = i = 1 n ( A W ) i n W i
The AHP method formalizes the expression and processing of people’s supervisor judgment and gradually eliminates the subjectivity as much as possible. Therefore, the consistency test of the judgment matrix is an indispensable step [20]. The test method is as follows:
C I = λ max n n 1
C R = C I R I < 0.10
where CI is the consistency index of the judgment matrix, CR is the random consistency ratio, and RI is the consistency index. As long as CR < 0.10, the judgment matrix can be considered to have satisfactory consistency; otherwise, the judgment matrix should be adjusted until it has satisfactory consistency. The relationship between the consistency index RI and n is listed in Table 6.

4.1.3. Establishment and Discussion of the Comparative Model

To further discuss the weight of the controlling factors, a comparative model is established to measure the ability of each controlling factor on oil recovery. The model can greatly reduce human factors and improve accuracy. According to the imbibition stages, three judgment matrices (i.e., A1, A2, and A3) are constructed by including six controlling factors. The six controlling factors—the core length, RQI, salinity, interfacial characteristics, initial oil saturation, oil viscosity—are denoted as C1, C2, C3, C4, C5, and C6 in the judgment matrixes, respectively. The three matrices can refer to Equations (11)–(13).
A 1 = C 1 C 2 C 3 C 4 C 5 C 6 [ 1 1 / 3 1 / 4 1 / 7 1 / 3 1 / 3 3 1 1 / 2 1 / 5 1 2 4 2 1 1 / 3 2 3 7 5 3 1 5 6 3 1 1 / 2 1 / 5 1 2 3 1 / 2 1 / 3 1 / 6 1 / 2 1 ]
A 2 = C 1 C 2 C 3 C 4 C 5 C 6 [ 1 1 / 4 1 / 2 1 / 5 1 / 4 1 / 3 4 1 3 1 / 2 1 2 2 1 / 3 1 1 / 2 1 / 3 1 / 2 5 2 4 1 2 3 4 1 3 1 / 2 1 2 3 1 / 2 2 1 / 3 1 / 2 1 ]
A 3 = C 1 C 2 C 3 C 4 C 5 C 6 [ 1 1 / 7 1 / 2 1 / 6 1 / 9 1 / 4 7 1 5 2 1 / 3 4 2 1 / 5 1 1 / 5 1 / 8 1 / 3 6 1 / 2 5 1 1 / 4 3 9 3 8 4 1 5 4 1 / 4 3 1 / 3 1 / 5 1 ]
The corresponding eigenvectors are listed as follows:
W 1 = [ 0.041 , 0.112 , 0.194 , 0.468 , 0.112 , 0.072 ] T
W 2 = [ 0.049 , 0.185 , 0.067 , 0.305 , 0.185 , 0.109 ] T
W 3 = [ 0.029 , 0.235 , 0.043 , 0.165 , 0.445 , 0.084 ] T
Therefore, the random consistency ratios can be calculated for the three imbibition stages. The results are: CR1 = 0.0237, CR2 = 0.0133, and CR1 = 0.0443. Since all CR values are less than 0.1, the three judgment matrices all satisfy the consistency criteria. According to the corresponding feature vectors, the weights of the importance for each controlling factor on the imbibition recovery are shown in Figure 10 according to the imbibition stages.

4.2. Analysis of the Controlling Factors at Different Stages of Imbibition Processes in a Field

The selected target formation is the Chang 6 reservoir in the Zichang area. The petrophysical properties are: the average porosity is 10%, the average permeability is 0.8 md, the water viscosity is 0.72 mPa·s, the oil viscosity is 5.20 mPa·s, and the oil–water interfacial tension is 28.50 mN/m. We assume that the shape of the formation is a cube with the above-mentioned properties. Five different cube side lengths—which are 1 m, 2 m, 3 m, 4 m, and 5 m—are tested. The influence of core length (C1), RQI (C2), and crude oil viscosity (C6) are deleted from the judgment matrices as constant values are set. Then, the new matrices are obtained as follows:
A e a r l y = C 3 C 4 C 5 [ 1 1 / 4 2 4 1 5 1 / 2 1 / 5 1 ]
A m i d d l e = C 3 C 4 C 5 [ 1 1 / 4 1 / 3 4 1 2 3 1 / 2 1 ]
A l a t e = C 3 C 4 C 5 [ 1 1 / 4 1 / 6 4 1 1 / 3 6 3 1 ]
The corresponding eigenvectors are as follows:
W e a r l y = [ 0.200 , 0.683 , 0.117 ] T
W m i d d l e = [ 0.122 , 0.558 , 0.320 ] T
W l a t e = [ 0.085 , 0.271 , 0.644 ] T
The random consistency ratios can be calculated for the three imbibition stages in the field scenario. The results show that C R e a r l y = 0.0212 < 0.1 , C R m i d d l e = 0.0158 < 0.1 , and C R l a t e = 0.0462 < 0.1 , respectively. Since all CR values are less than 0.1, all three judgment matrices satisfy the consistency criterion. According to the average reservoir parameters and the scale model of permeability time (Equation (2)), the specific time in the early, middle, and late periods of the corresponding side length cube can be calculated. Table 7 summarizes the importance weights of the controlling factors and periods of imbibition stages in different formation sizes. Figure 11 depicts the periods of imbibition stages. The calculation results are shown in Table 7 and Figure 11.
According to Figure 11 and Table 7, the rock blocks with side lengths of 1 m, 2 m, 3 m, 4 m, and 5 m are, respectively, 0~0.27 years, 0~1.10 years, 0~2.46 years, 0~4.39 years, 0~6.94 years for the early stage, 0.27~0.99 years, 1.10~5.06 years, 2.46~11.35 years, 4.39~20.24 years, 6.94~31.95 years for the middle stage, 0.99 years, 5.06 years, 11.35 years, 20.24 years, and 31.95 years for the late stage. The importance weights of the controlling factors at the early stage of imbibition are ordered from strong to weak: interfacial characteristics (68.3%) > salinity (20.0%) > initial oil saturation (11.7%). The result indicates that the interfacial characteristics should be given priority at the early stage of the imbibition process. The interfacial tension should be controlled within 0.70 mN/m with a contact angle lower than 10.8°. For water salinity, the smaller the salinity is, the better the imbibition performance is. From strong to weak, the importance weights of the controlling factors at the middle stage are ordered as: interfacial characteristics (55.8%) > initial oil saturation (32.0%) > salinity (12.2%). The interfacial characteristics should be given priority at the middle stage. The interfacial tension should be controlled within 0.70 mN/m with a contact angle lower than 10.8°. For the initial oil saturation, the reservoir with a high initial oil saturation should be selected for imbibition development. The importance of salinity is weak at the middle stage. At the late stage, the importance weights of the controlling factors are ordered from strong to weak: initial oil saturation (64.4%) > interfacial characteristics (27.1%) > salinity (8.5%). The layers with high initial oil saturation should be selected as the priorities for imbibition developments. On this basis, the interfacial characteristics and the salinity of the injected water should be optimized.

5. Conclusions

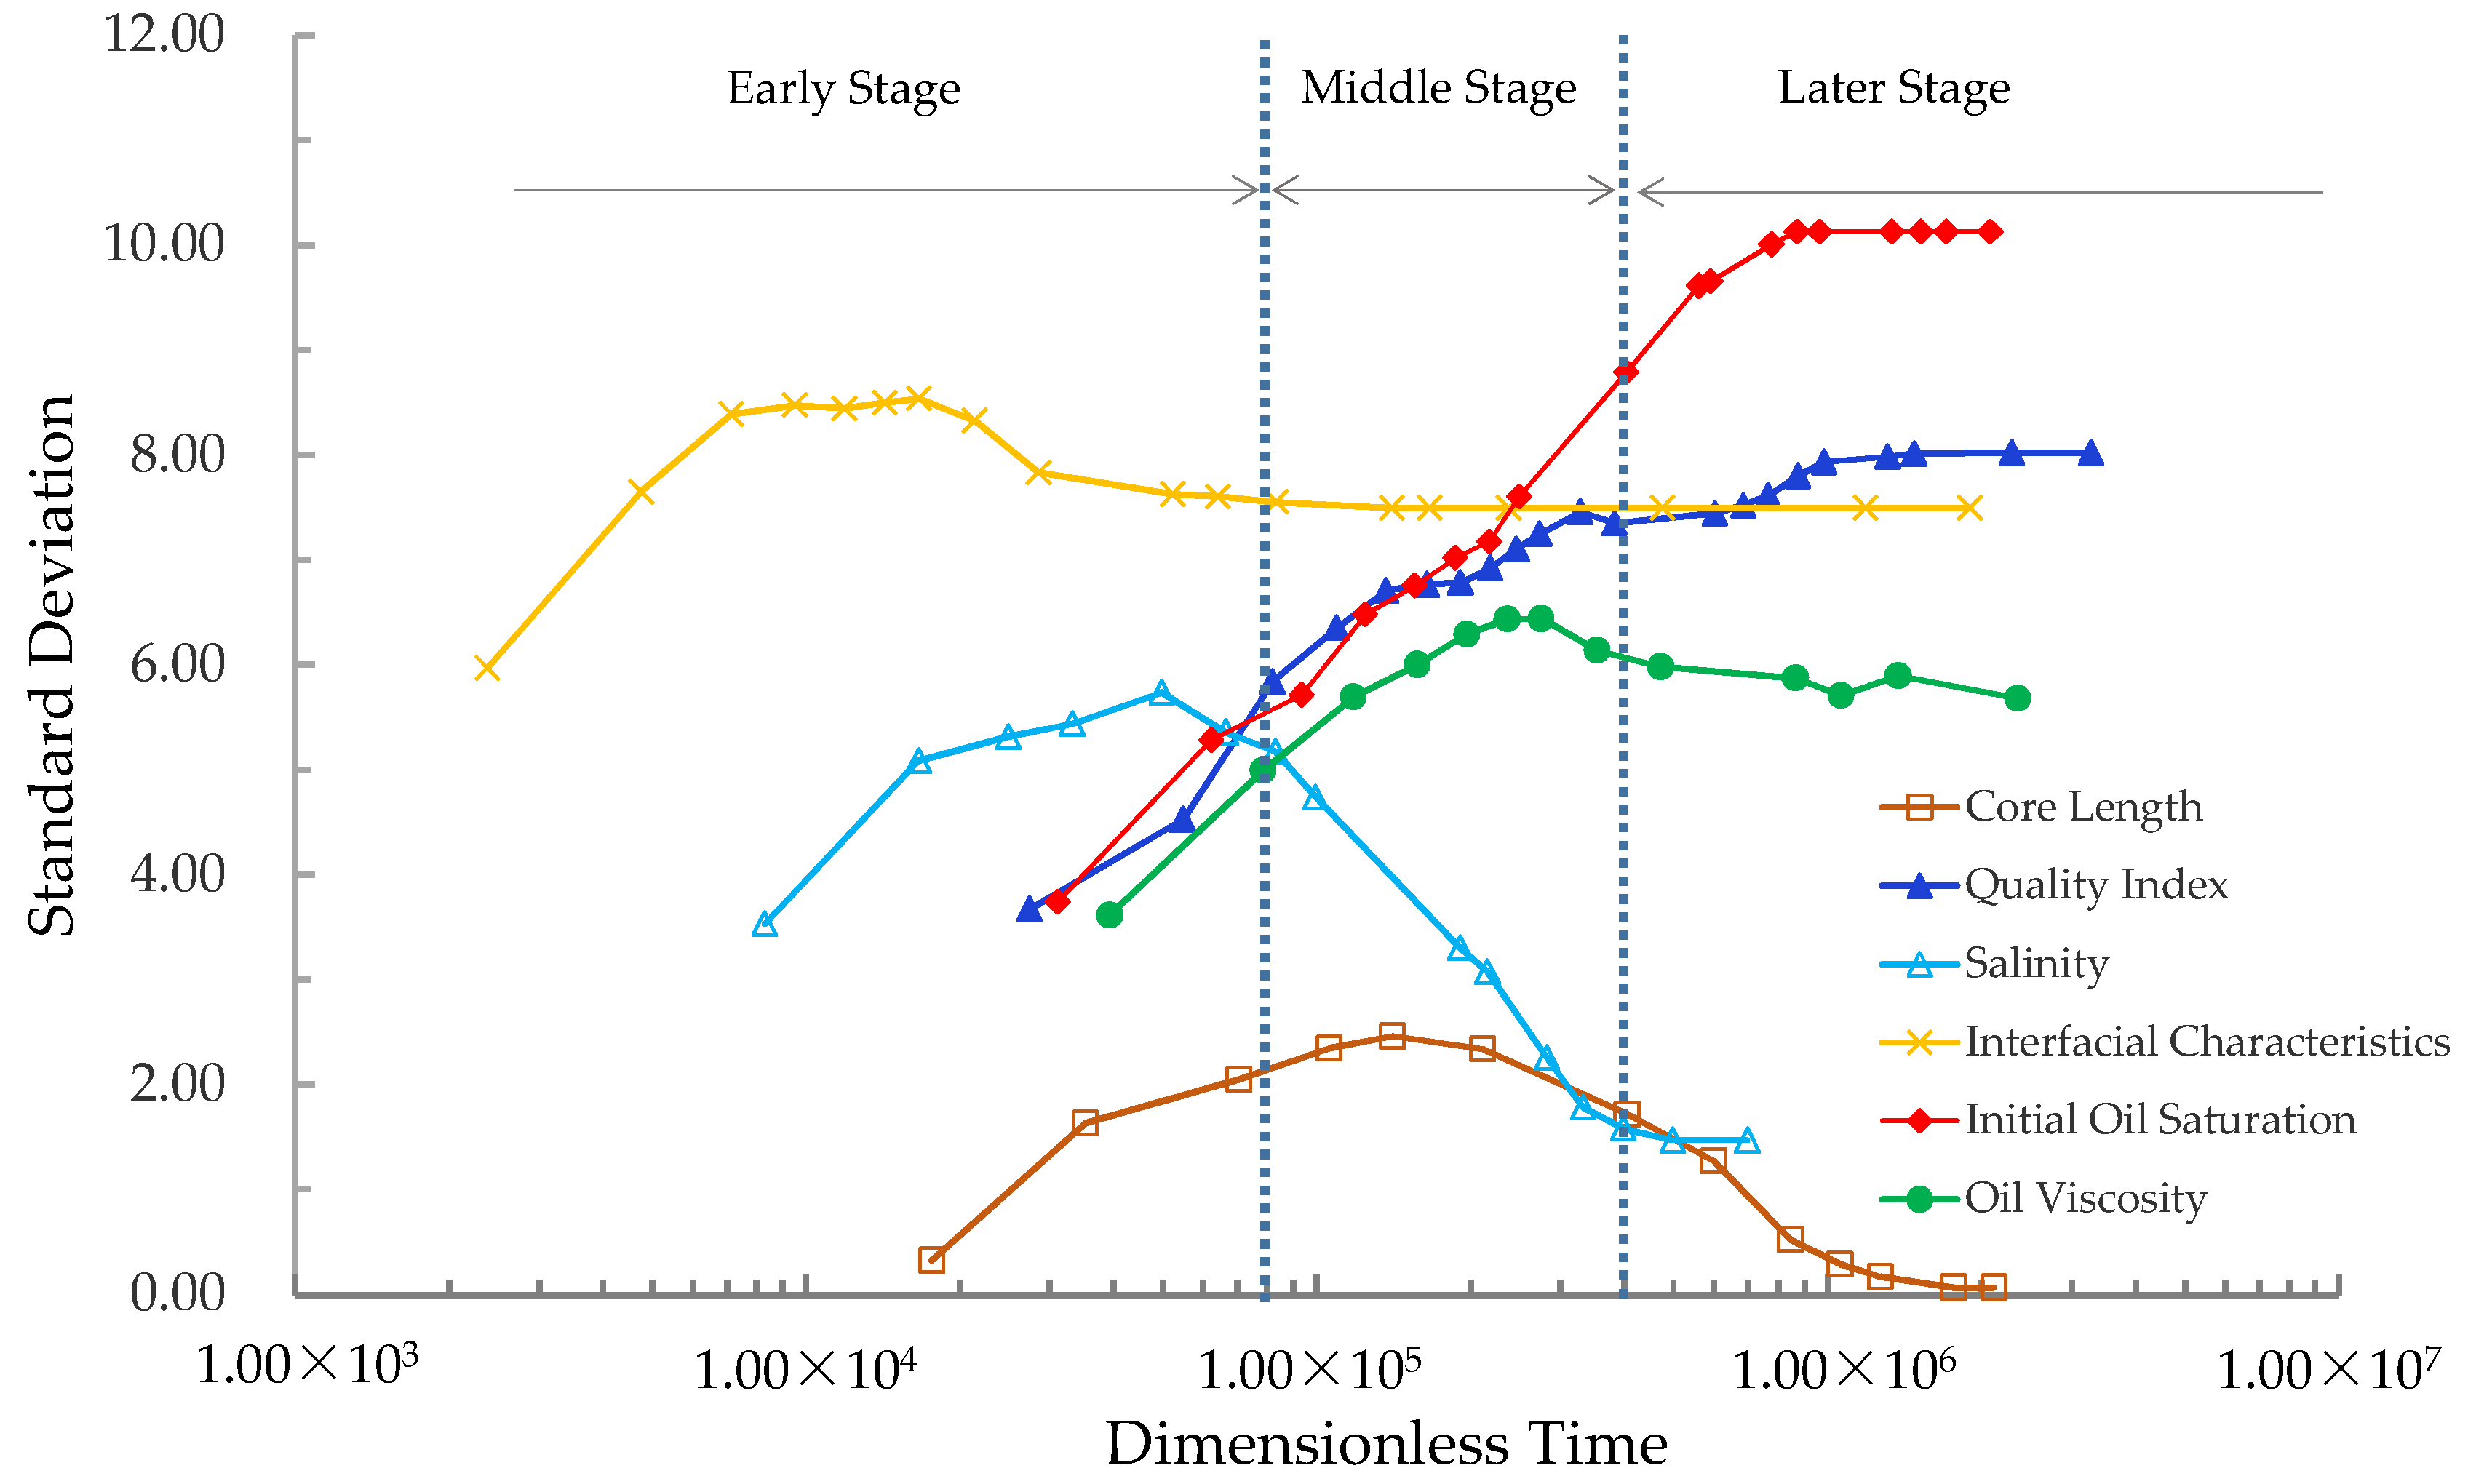
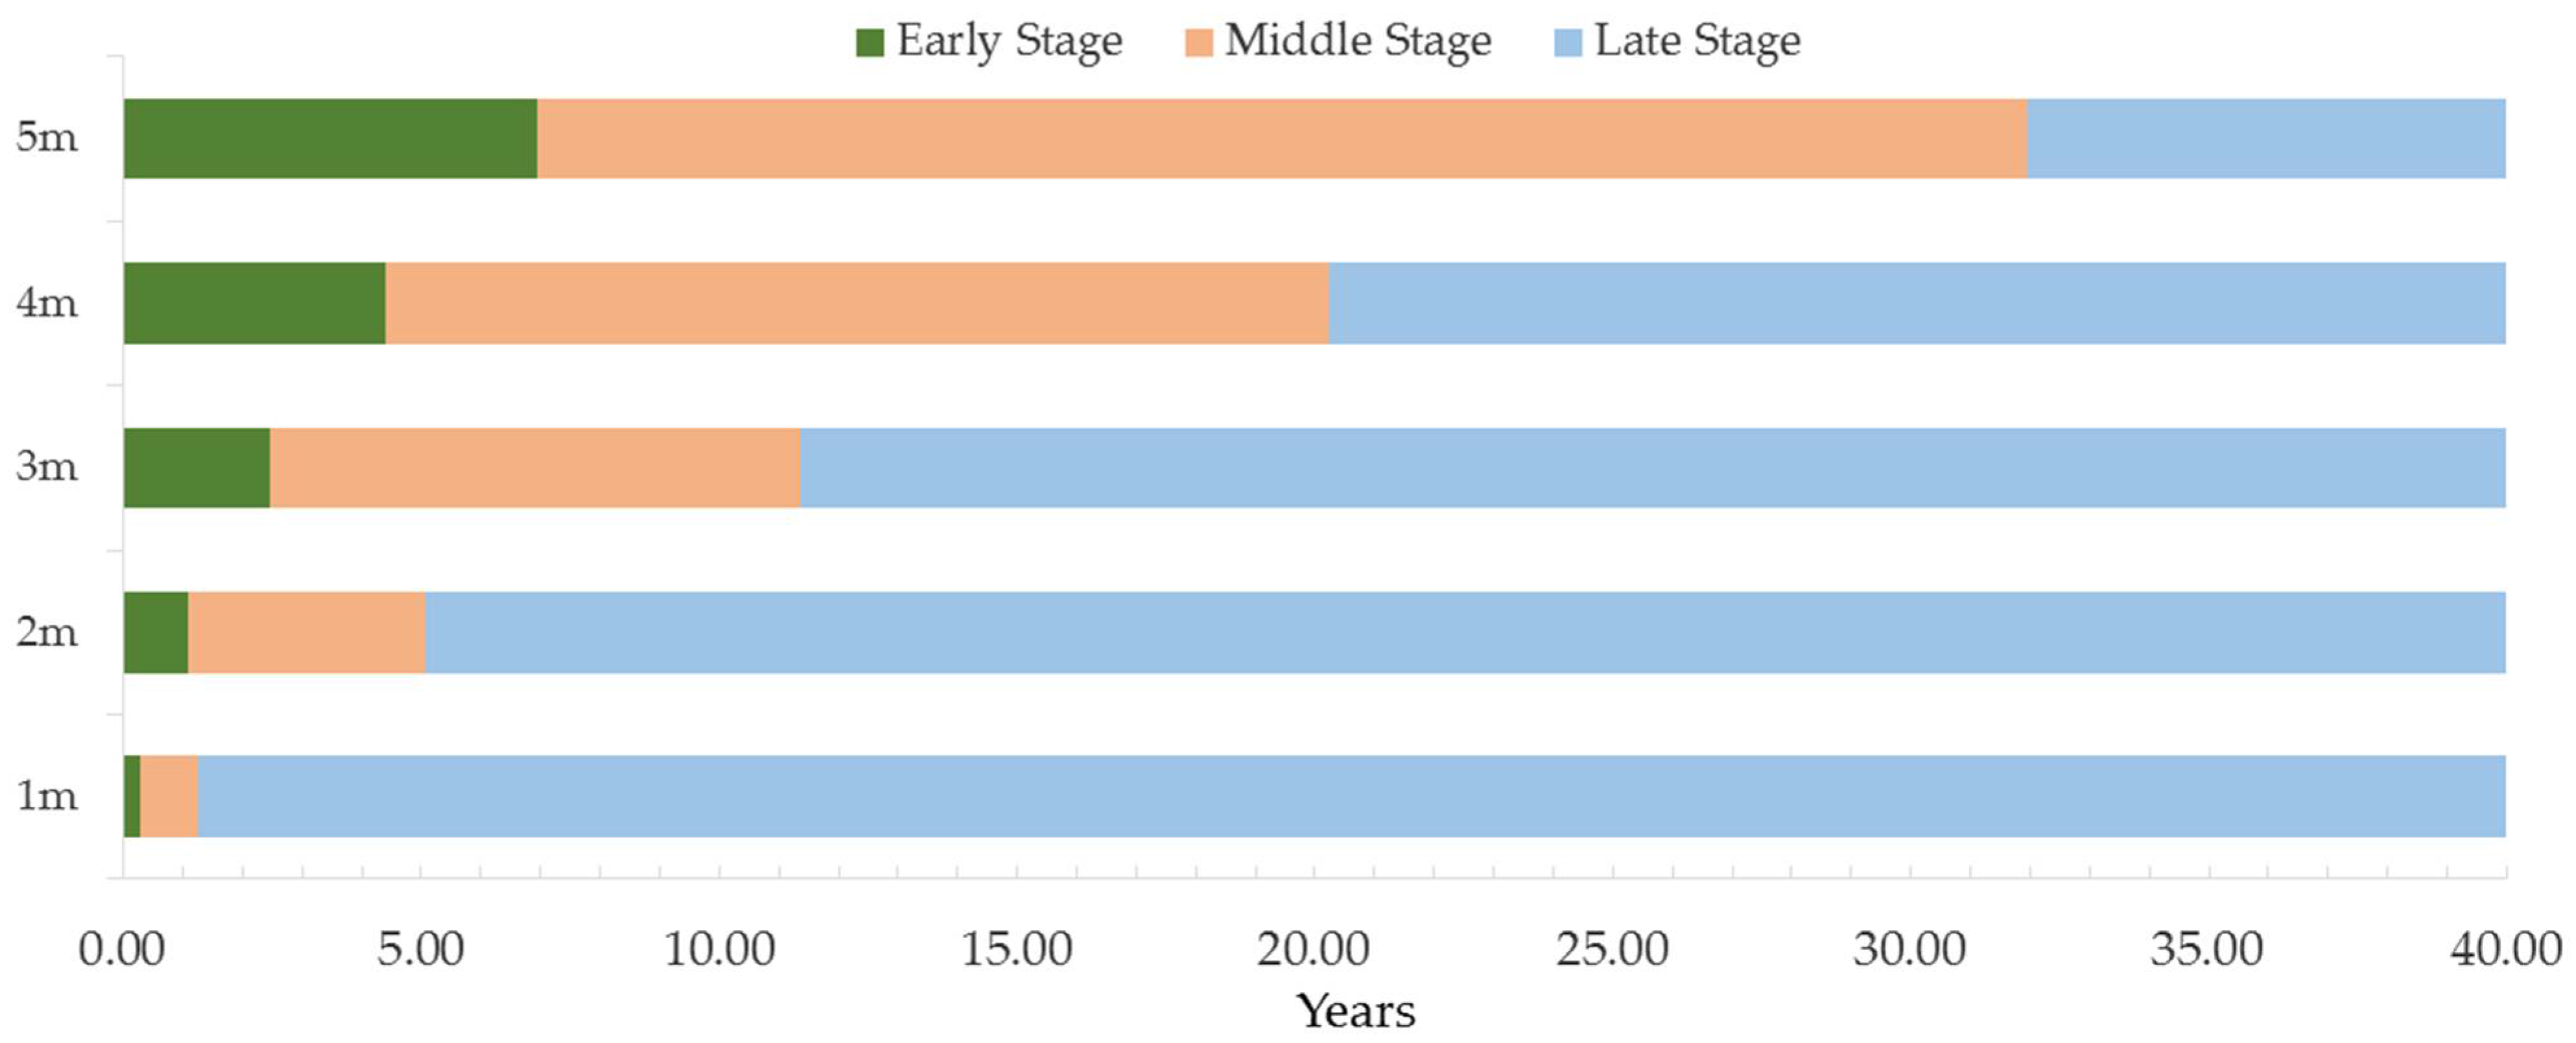
  • By calculating the standard deviation of the dimensionless time and oil displacement efficiency for each controlling factor, the imbibition processes can be divided into three stages (i.e., the early stage, middle stage, and late stage) according to the strength of the main control factors.
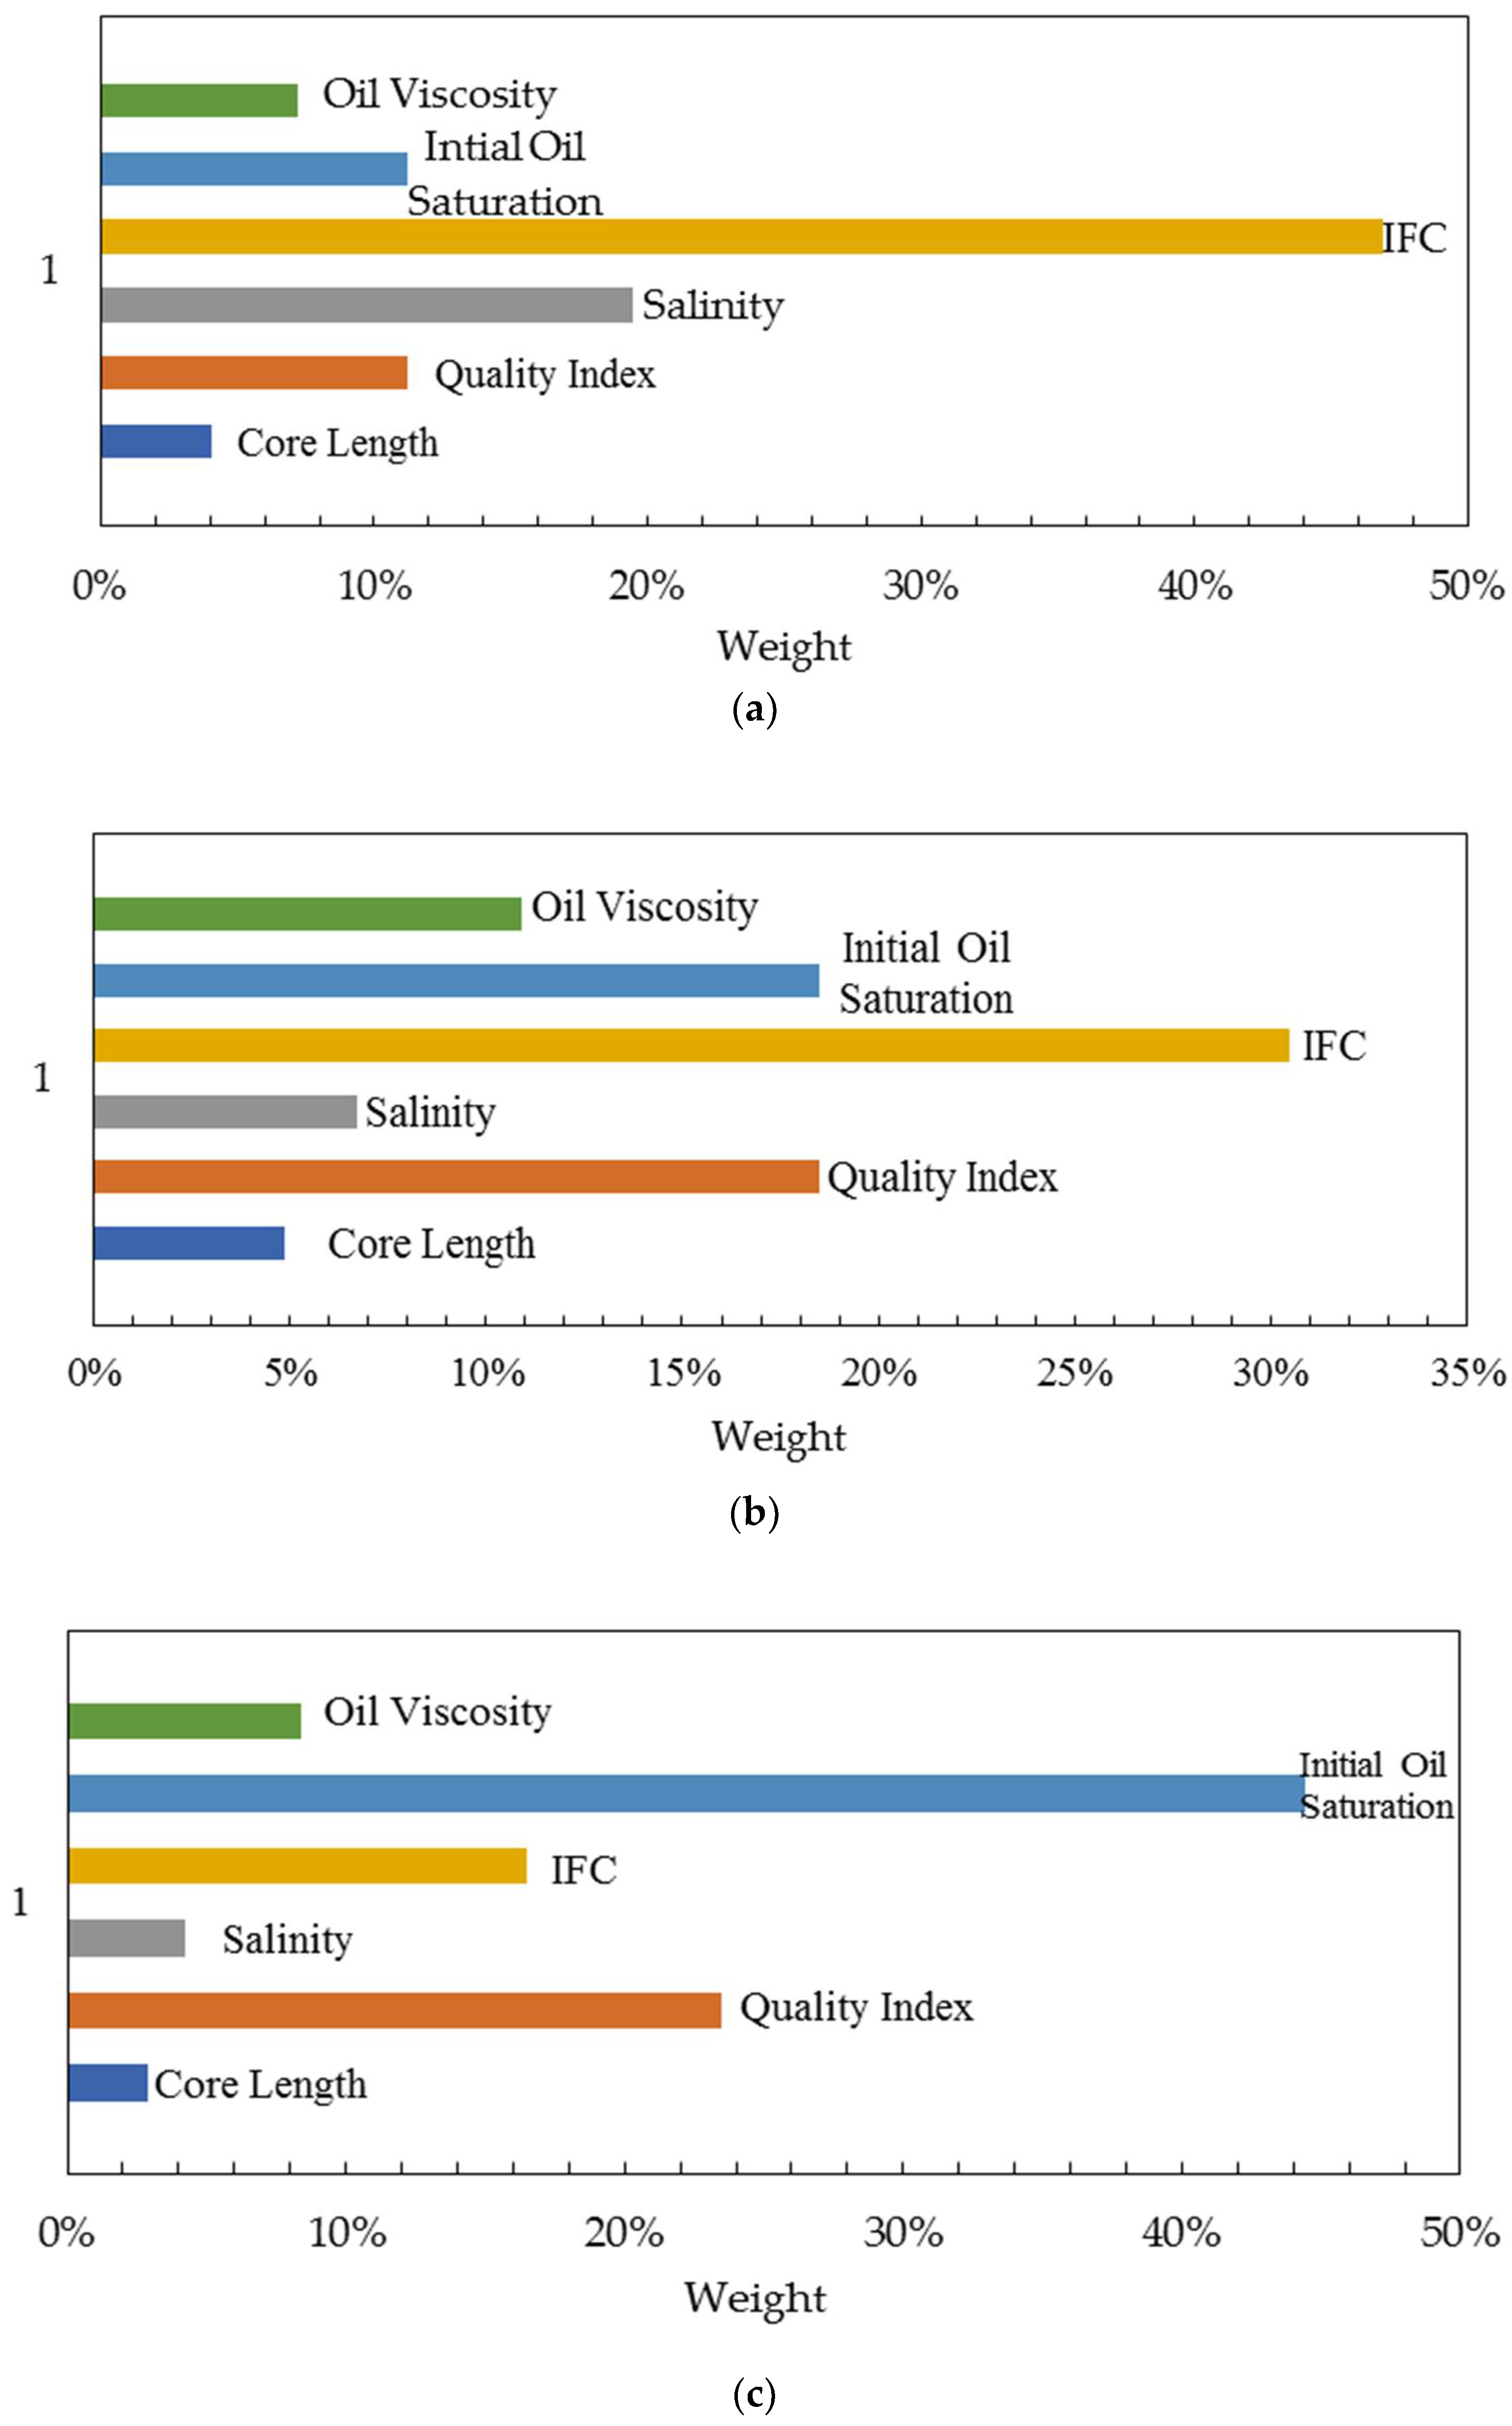
  • By using the analytic hierarchy process, the importance weights of controlling factors are quantitatively calculated for the three imbibition stages. The most significant controlling factor at the early imbibition stage and middle imbibition are both interfacial characteristics. For the later stage, the most significant controlling factor is initial oil saturation.
  • Based on the experiments, the theoretical model is established to evaluate the controlling factors during the imbibition process for dual-porosity formation in the Chang 6 reservoir.
  • From the field case study, it can be concluded that at the early imbibition stage of imbibition, the interfacial tension and contact angle play an important role. In consideration of reducing reservoir damage, the salinity of water injection should be reduced. At the middle imbibition stage, the interfacial characteristics should be given priority. At the late imbibition stage, oil displacement with a high initial oil saturation should be selected as the priority for imbibition processes.
  • This study provides theoretical support to guide the water injection in ultra-low-permeability reservoirs during different imbibition processes.

Author Contributions

Data curation, H.D., B.H. and X.W.; Formal analysis, H.J., T.G. and C.W.; Investigation, H.D., B.H., X.W. and T.G.; Methodology, H.D., H.J., X.W. and C.L.; Project administration, C.W.; Resources, H.J., B.H., T.G. and C.L.; Supervision, C.W.; Validation, H.J. and C.L.; Visualization, H.D.; Writing—original draft, H.D.; Writing—review and editing, H.D., H.J. and C.L. All authors have read and agreed to the published version of the manuscript.

Funding

This research received no external funding.

Institutional Review Board Statement

Not applicable.

Informed Consent Statement

Not applicable.

Data Availability Statement

Not applicable.

Conflicts of Interest

The authors declare no conflict of interest.

Nomenclature

σ interfacial tension between oil and water.
ϕ reservoir porosity.
k reservoir permeability.
μ w water viscosity.
t time.
L length of a core sample.
α unit transformation factor (3.16 × 10⁴).
μ o oil viscosity.
L c characteristic length of core samples.
r radius of a core sample or average value of samples.
N degree of freedom.
x i value of the i sample.
W ¯ i normalization processing.
C I consistency index of the judgment matrix.
C R random consistency ratio.
R I consistency index.

References

  1. Wang, X.; Peng, X.; Zhang, S.; Du, Z.; Zeng, F. Characteristics of oil distributions in forced and spontaneous imbibition of tight oil reservoir. Fuel 2018, 224, 280–288. [Google Scholar] [CrossRef]
  2. Wang, J.; Liu, Y.; Chen, M.; Li, L.; Gao, J. Experimental study on dynamic imbibition mechanism of low permeability reservoirs. Pet. Explor. Dev. 2009, 36, 86–90. [Google Scholar]
  3. Hua, F.-Q.; Gong, C.-L.; Xiong, W.; Wang, Q.-Y. Low permeability sandstone reservoir imbibition law research. Pet. Geol. Oilfield Dev. Daqing 2003, 22, 50–52. [Google Scholar]
  4. Aronofsky, J.; Masse, L.; Natanson, S. A Model for the Mechanism of Oil Recovery from the Porous Matrix Due to Water Invasion in Fractured Reservoirs. Trans. AIME 1958, 213, 17–19. [Google Scholar] [CrossRef]
  5. Mattax, C.C.; Kyte, J. Imbibition oil recovery from fractured, water-drive reservoir. Soc. Pet. Eng. J. 1962, 2, 177–184. [Google Scholar] [CrossRef]
  6. Warren, J.; Root, P. The Behavior of Naturally Fractured Reservoirs. Soc. Pet. Eng. J. 1963, 3, 245–255. [Google Scholar] [CrossRef] [Green Version]
  7. Kazemi, H.; Merrill, L.S. Numerical Simulation of Water Imbibition in Fractured Cores. Soc. Pet. Eng. J. 1979, 19, 175–182. [Google Scholar] [CrossRef]
  8. Kazemi, H.; Gilman, J.; Elsharkawy, A. Analytical and Numerical Solution of Oil Recovery From Fractured Reservoirs With Empirical Transfer Functions (includes associated papers 25528 and 25818). SPE Reserv. Eng. 1992, 7, 219–227. [Google Scholar] [CrossRef]
  9. Wang, X.; Peng, X.; Zhang, S.; Liu, Y.; Peng, F.; Zeng, F. Guidelines for Economic Design of Multistage Hydraulic Fracturing, Yanchang Tight Formation, Ordos Basin. Nat. Resour. Res. 2019, 29, 1413–1426. [Google Scholar] [CrossRef]
  10. Abd, A.S.; Elhafyan, E.; Siddiqui, A.R.; Alnoush, W.; Blunt, M.; Alyafei, N. A review of the phenomenon of counter-current spontaneous imbibition: Analysis and data interpretation. J. Pet. Sci. Eng. 2019, 180, 456–470. [Google Scholar] [CrossRef]
  11. Fang, W.; Jiang, H.; Li, J.; Wang, Q.; Killough, J.; Li, L.; Peng, Y.; Yang, H. A numerical simulation model for multi-scale flow in tight oil reservoirs. Pet. Explor. Dev. 2017, 44, 446–453. [Google Scholar] [CrossRef]
  12. Xu, R.; Yang, S.; Xiao, Z.; Jin, Y. Quantitatively study on imbibition of fracturing fluid in tight sandstone reservoir under high temperature and high pressure based on NMR technology. J. Pet. Sci. Eng. 2021, 109623. [Google Scholar] [CrossRef]
  13. Mason, G.; Fischer, H.; Morrow, N.; Ruth, D. Correlation for the effect of fluid viscosities on counter-current spontaneous imbibition. J. Pet. Sci. Eng. 2010, 72, 195–205. [Google Scholar] [CrossRef]
  14. Guo, J.; Li, M.; Chen, C.; Tao, L.; Liu, Z.; Zhou, D. Experimental investigation of spontaneous imbibition in tight sandstone reservoirs. J. Pet. Sci. Eng. 2020, 193, 107395. [Google Scholar] [CrossRef]
  15. Tong, K.; Liu, H.; Zhang, Y.; Wang, J.; Ge, L.; Dai, W.; Hong, C.; Meng, Q. Three-Dimensional physical modeling of waterflooding in metamorphic fractured reservoirs. Pet. Explor. Dev. 2015, 42, 589–596. [Google Scholar] [CrossRef]
  16. Ghasemi, F.; Ghaedi, M.; Escrochi, M. A new scaling equation for imbibition process in naturally fractured gas reservoirs. Adv. Geo-Energy Res. 2020, 4, 99–106. [Google Scholar] [CrossRef] [Green Version]
  17. Wang, X.; Dang, H.; Gao, T. Method of moderate water injection and its application in ultra-low permeability oil reservoirs of Yanchang Oilfield, NW China. Pet. Explor. Dev. 2018, 45, 1094–1102. [Google Scholar] [CrossRef]
  18. Li, K.; Horne, R.N. Characterization of Spontaneous Water Imbibition Into Gas-Saturated Rocks. SPE J. 2001, 6, 375–384. [Google Scholar] [CrossRef] [Green Version]
  19. Li, K.; Horne, R.N. An Analytical Scaling Method for Spontaneous Imbibition in Gas/Water/Rock Systems. SPE J. 2004, 9, 322–329. [Google Scholar] [CrossRef]
  20. Li, K.; Horne, R.N. A General Scaling Method for Spontaneous Imbibition. In Proceedings of the SPE Annual Technical Conference and Exhibition, San Antonio, TX, USA, 29 September–2 October 2002. [Google Scholar] [CrossRef]
  21. Li, K.; Chow, K.; Horne, R.N. Effect of Initial Water Saturation on Spontaneous Water Imbibition. In Proceedings of the SPE Western Regional/AAPG Pacific Section Joint Meeting, Anchorage, AL, USA, 20–22 May 2002. [Google Scholar] [CrossRef]
  22. Li, K.; Horne, R.N. Extracting capillary pressure and global mobility from spontaneous imbibition data in oil-water-rock systems. SPE J. 2005, 10, 458–465. [Google Scholar] [CrossRef]
  23. Li, S.; Liu, W.; Zhang, H.; Xiao, H. Experimental study of spontaneous imbibitions in low-permeability reservoir. Acta Pet. Sin. 2007, 28, 109. [Google Scholar]
  24. Meng, Q.; Cai, J. Recent advances in spontaneous imbibition with different boundary conditions. Capillarity 2018, 1, 19–26. [Google Scholar] [CrossRef] [Green Version]
  25. Babadagli, T.; Zeidani, K. Evaluation of Matrix-Fracture Imbibition Transfer Functions for Different Types of Oil, Rock and Aqueous Phase. In Proceedings of the SPE/DOE Symposium on Improved Oil Recovery, Tulsa, OK, USA, 17–21 April 2004. [Google Scholar] [CrossRef]
  26. Arihara, N. Analysis of spontaneous capillary imbibition for improved Oil Recovery. In Proceedings of the SPE Asia Pacific Oil and Gas Conference and Exhibition, Perth, WA, USA, 18–20 October 2004. [Google Scholar] [CrossRef]
  27. Hatiboglu, C.; Babadagli, T. Experimental analysis of primary and secondary oil recovery from matrix by counter-current diffusion and spontaneous imbibition. In Proceedings of the SPE Annual Technical Conference and Exhibition, Houston, TX, USA, 26–29 September 2004. [Google Scholar] [CrossRef]
  28. Cai, J.; Jin, T.; Kou, J.; Zou, S.; Xiao, J.; Meng, Q. Lucas–Washburn Equation-Based Modeling of Capillary-Driven Flow in Porous Systems. Langmuir 2021, 37, 1623–1636. [Google Scholar] [CrossRef] [PubMed]
  29. Gao, L.; Yang, Z.; Shi, Y. Experimental study on spontaneous imbibition characteristics of tight rocks. Adv. Geo Energy Res. 2018, 2, 292–304. [Google Scholar] [CrossRef]
  30. Wang, R.; Yue, X.; Tan, X.; Liu, X.-Z. Influence of pressure sensitivity on imbibition for low permeability reservoir rocNs. J. Southwest Pet. Univ. 2008, 30, 173–175. [Google Scholar]
  31. Cheng, Z.; Ning, Z.; Yu, X.; Wang, Q.; Zhang, W. New insights into spontaneous imbibition in tight oil sandstones with NMR. J. Pet. Sci. Eng. 2019, 179, 455–464. [Google Scholar] [CrossRef]
  32. Zhou, H.; Zhang, Q.; Dai, C.L.; Li, Y.; Lv, W.; Wu, Y.; Cheng, R.; Zhao, M. Experimental investigation of spontaneous imbibition process of nanofluid in ultralow permeable reservoir with nuclear magnetic resonance. Chem. Eng. Sci. 2019, 201, 212–221. [Google Scholar] [CrossRef]
  33. Cuiec, L.; Bourbiaux, B.; Kalaydjian, F. Oil Recovery by Imbibition in Low-Permeability Chalk. SPE Form. Eval. 1994, 9, 200–208. [Google Scholar] [CrossRef]
  34. Liang, Y.; Lai, F.; Dai, Y.; Shi, H.; Shi, G. An experimental study of imbibition process and fluid distribution in tight oil reservoir under different pressures and temperatures. Capillarity 2021, 4, 66–75. [Google Scholar] [CrossRef]
  35. Ji, B.; Chen, J.; Zhou, X. Mathematical model of imbibition in fractured low permeability reservoirs. J. Tsinghua Univ. 2002, 42, 711–713. [Google Scholar]
  36. Jing, W.; Huiqing, L.; Jing, X.; Yuetian, L.; Cheng, H.; Qingbang, M.; Yang, G. Mechanism simulation of oil displacement by imbibition in fractured reservoirs. Pet. Explor. Dev. 2017, 44, 805–814. [Google Scholar]
  37. Karatas, M. Hydrogen energy storage method selection using fuzzy axiomatic design and analytic hierarchy process. Int. J. Hydrog. Energy 2019, 45, 16227–16238. [Google Scholar] [CrossRef]
  38. Lu, C.; Jiang, H.; You, C.; Wang, Y.; Ma, K.; Li, J. A novel method to determine the thief zones in heavy oil reservoirs based on convolutional neural network. J. Pet. Sci. Eng. 2021, 201, 108471. [Google Scholar] [CrossRef]
  39. Zeng, W.; Li, H. Weighted triangular approximation of fuzzy numbers. Int. J. Approx. Reason. 2007, 46, 137–150. [Google Scholar] [CrossRef] [Green Version]
Figure 1. The schematic/workflow of the experiment.
Energies 14 07093 g001
Figure 2. The process of spontaneous imbibition in the tests investigating salinity effects after 4 h (a), 8 h (b), 18 h (c) and 28 h (d).
Energies 14 07093 g002
Figure 3. Displacement efficiency curve of imbibition for investigating the core length.
Energies 14 07093 g003
Figure 9. Relation curve of dimensionless time and discreteness of the controlling factors.
Energies 14 07093 g009
Figure 10. Importance weights of the controlling factors at the early stage (a), middle stage (b) and late stage (c).
Energies 14 07093 g010
Figure 11. Periods of imbibition stages for different formation sizes.
Energies 14 07093 g011
Table 1. Petrophysical properties of cores and controlling factors of imbibition.
Core#Length
cm
Diameter
cm
Porosity
%
Permeability
×10−3 μm2
Controlling Factors
Z-173.392.538.010.081Core length (cm)3.39
Z-185.002.538.190.0815.00
Z-196.012.538.040.0846.01
Z-208.112.528.200.0768.11
Q-98.052.4511.020.812RQI (μm)0.0858
Z-128.082.539.570.5030.0725
Z-138.072.548.530.2120.0499
Z-148.092.537.560.1100.0381
Z-158.062.545.220.0520.0316
Z-167.952.543.540.0110.0176
Z-107.982.549.680.041Salinity (g/L)0
Z-248.292.537.940.01630
Z-218.162.548.060.01260
Q-228.142.547.920.01191
Q-238.002.537.910.015120
Q-57.952.549.620.035182
Q-18.032.4310.600.179Interfacial tension (mN/m) and contact angle11.64 mN/m; 58.3°
Q-28.042.4510.420.1513.27 mN/m; 38.5°
Q-38.042.4211.330.2432.24 mN/m; 30.3°
Q-48.102.4211.360.2661.68 mN/m; 28.7°
Q-58.102.4211.270.1861.23 mN/m; 18.8°
Q-68.072.4210.720.1821.02 mN/m; 14.3°
Q-78.022.4510.600.1910.77 mN/m; 11.2°
Q-88.132.4310.680.1570.70 mN/m; 10.8°
T-15.212.5210.700.33Initial water saturation (%)0
33.0
42.0
61.0
T-154.532.5014.060.55Oil viscosity (mPa·s)0.82
T-164.502.4813.220.532.50
T-174.522.5013.480.515.00
T-184.502.5113.290.5810.00
Table 2. Imbibition results for testing effects of the number index.
Core#RQI, µmFinal Imbibition Efficiency
Q-90.085827.49%
Z-120.072525.80%
Z-130.049923.22%
Z-140.038121.15%
Z-150.031616.40%
Z-160.01765.61%
Table 3. Imbibition results for testing effects of salinity.
Core#Salinity, g/mLFinal Imbibition Efficiency
Z-10026.29%
Z-243025.76%
Z-216024.79%
Z-229123.43%
Z-2312023.13%
Q-518222.76%
Table 4. The dimensionless time equation for each controlling factor.
Controlling Factors
(The Corresponding Tests Can Refer to Table 1)
Time Scale Model
Core lengthtD = 4.893 t
RQItD = 7.598 t
Salinity testtD = 2.305 t
Interfacial characterstD = 0.660 t
Initial oil saturationtD = 10.919 t
Oil viscositytD = 4.893 t
Table 5. The scale of the AHP.
ScaleMeaning
1The ith factor has the same effect as the jth factor
3The influence of the ith factor is slightly stronger than that of the jth factor
5The influence of the ith factor is stronger than that of the jth factor
7The influence of the ith factor is significantly stronger than that of the jth factor
9The influence of the ith factor is absolutely stronger than that of the jth factor
2, 4, 6, 8Represents the intermediate value of the above adjacent judgment
aij: aii = 1, aij = 1/aij
Table 6. The relationship between the consistency index (RI) and n.
n123456789
RI0.000.000.580.901.121.241.321.411.45
Table 7. Differentiation of imbibition stages of bedrock blocks with different side lengths.
Cube Side Length/mEarly Stage/YearsMiddle Stage/YearsLater Stage/Years
1<0.270.27~0.99>0.99
2<1.101.10~5.06>5.06
3<2.462.46~11.35>11.35
4<4.394.39~20.24>20.24
5<6.946.94~31.95>31.95
Weight of the controlling factorSalinity20.0%12.2%8.5%
Interfacial characteristics68.3%55.8%27.1%
Initial oil saturation11.7%32.0%64.4%
Publisher’s Note: MDPI stays neutral with regard to jurisdictional claims in published maps and institutional affiliations.

