
Coopetitive Platform: Common Benefits in Electricity and Gas Distribution


1
Department of Strategic Management, Jagiellonian University, Gołębia 24, 31-007 Kraków, Poland
2
Department of Management, WSB University, Cieplaka 1c, 41-300 Dąbrowa Górnicza, Poland
3
Faculty of Electrical Engineering, Częstochowa University of Technology, Armii Krajowej 17, 42-200 Częstochowa, Poland
*
Author to whom correspondence should be addressed.
Energies 2021, 14(21), 7113; https://0-doi-org.brum.beds.ac.uk/10.3390/en14217113
Submission received: 21 September 2021
/
Revised: 22 October 2021
/
Accepted: 25 October 2021
/
Published: 1 November 2021
(This article belongs to the Special Issue Managing Energy Sector Enterprises: Challenges, Methods and Research Trends)
Abstract
:Simultaneous collaboration and competition, or coopetition, has so far been studied among firms or non-profit organizations, leaving the public arena largely unexplored. This study focuses on identifying and measuring common benefit generation by local government actors in coopetition. We purposefully choose a metropolis composed of 41 municipalities setting to identify and measure those effects of coopetition that cannot be achieved by individual actors alone. We use real data and tariffs to run simulations that identify common and individual benefits generated in gas and electricity distribution. We find that savings can be achieved by mutualizing energy procurement, even though the distribution of savings is not equal among municipalities. We substantiate that energy communities can act as coopetitive platforms to optimize energy costs of municipalities.
1. Introduction
Coopetition refers to the simultaneous occurrence of cooperation and competition between two or more involved parties [1]. The competing parties adopt strategies in which there is a partial congruence of interests and a combination of efforts because the synergistic benefits of cooperation are greater than the benefits of operating on one’s own. Jointly created value is often the result of cooperation of many participants in the value chain, including competitors. Moreover, it would be impossible for the parties involved to achieve separately. We follow the initial understanding, offered by M. Bengtsson and S. Kock, that coopetition is the cooperation of competitors, and the same cooperation and competition can take place in various fields of coopetitors activities [2]. We complement this original take with two additional conditions: (1) the intent to create value, both private and common, and (2) the presence of paradoxical tensions between involved actors [3]. Taken together, those three characteristics make it clear that coopetition can provide benefits that would be otherwise unavailable, but they are often cognitively demanding [4] and challenging to reap [5]. Therefore, firms coopete to various degrees across industries [6].
Despite an impressive progress in conceptual [7] and empirical research, there are several conceptual and empirical issues that still need to be addressed [8]. For instance, it is still not clear how benefits can be identified and measured when it comes to common and private benefits, which may also include privately captured public value [9]. Prior studies have focused on such effects as market share, i.e., relative to other market players [10], or to innovation, i.e., in a binary way [11]. However, with very few exceptions, financial metrics are available to gauge the extent to which coopetition benefits all involved parties, as well as each one of them individually [12]. Our study takes on the challenge to advance common benefit generation in coopetition financial measurement.
While coopetition has been empirically studied for actors such as firms [13], their divisions [14], tourism destinations [15], nonprofit sports clubs [16], humanitarian organizations [17], or hospitals [18], no study, to our best knowledge, has addressed coopetition between public actors such as governments, regional authorities, or municipalities. This is surprising because the interdependence of such public actors has received significant attention in recent decades. While local governments can obviously collaborate, a vast stream of literature finds that strategic interactions between governments can involve competition [19]. Competitive tensions between governments can, in particular, be horizontal, i.e., involve public bodies of the same governance level, or vertical, i.e., involve bodies in a hierarchical dependence. Scholars argue that horizontal relationships can involve (a) spillover effects, where choices made by one jurisdiction affect another, or (b) resource-flow effects, where decisions made by jurisdictions affect the quantity and quality of resources they may enjoy locally [20]. Vertical interdependencies may, in turn, involve impacts of such decisions as taxation across jurisdictions. All in all, the emerging map of knowledge about coopetition leaves important blank areas referring to public actors’ coopetition. Our study aims to fill this gap.
The aim of this study is to examine the benefits available when coopeting with other municipalities that are impossible to achieve by involved public actors (cities) individually. Due to the fact that the relationship between more than two market players will be analyzed, we study network coopetition.
It should be emphasized that both the approach to optimizing the costs of energy and gas distribution, but above all, an attempt to pay attention to the use of local communities, can be used to impress actions aimed at increasing the effectiveness of activities as well as building local energy self-sufficiency.
In order to address our research question, we purposefully choose the Metropolis GZM in Poland. It has become a successful coopetition platform between municipalities that compete with each other in various fields. The Act dedicated to the establishment and functioning of the GZM Metropolis [21] gave them the opportunity to achieve common goals, which is in line with the deliberate coopetition assumptions [22,23]. Metropolis GZM is the only metropolis in Poland established under a dedicated Act [21]. It stands out from other metropolises in the world due to the fact that there is no one dominant center here. The Metropolis is divided into five sub-regions, and thus, it can be said that it has five main internal centers. However, individual goals of member cities are often put first by participating cities. Finding some compromise, and implementing an effective common approach, reveals itself to be quite challenging. Our analysis is carried out through simulations, based on real data, in two incremental steps. First, we look into energy distribution costs optimization, which result from a project coordinated by the Metropolis GZM entitled “Rationalization of electricity and gas distribution costs for GZM member communes”. Secondly, we look at additional possibilities of reducing the costs of electricity distribution with the use of Energy Communities.
The awareness of the municipalities of the Metropolis GZM, in terms of rights, obligations, and the possibility of functioning in the liberalized energy market, is very high. This maturity materializes as part of activities aimed at rationalizing the costs of energy and gas contracting, as well as adjusting the energy demand profile to the appropriate tariff groups. The use of the TPA (Third Party Access) principle brings measurable savings each year, and this effect is additionally strengthened by group contracting of energy utilities.
Our analysis focuses on the effects of competitors’ cooperation, which constitutes an added value and would not be achievable individually. Our results are noteworthy for two reasons. Firstly, our case provides evidence of effective collaboration between competing jurisdictions, thus filling a gap in coopetition research, so far, focused on businesses or non-profit organizations. Secondly, the search for benefits, taking into account the use of the Energy Communities application, is novel, as it is a new legal regulation. Thirdly, we substantiate savings, which accrue to participants, by pursuing a procurement mutualization strategy. Our evidence clearly indicates that common value can effectively be created by optimizing electricity and gas distribution costs.
2. Materials and Methods
The article presents a case study of a project, conducted by Metropolis GZM, in order to optimize the costs of electricity and gas distribution, which was created as a continuation of activities, related to the joint purchase of electricity and gas by the member communes of GZM [24,25]. We purposefully select this, case following the i-criterion [26], to study participants of coopetition between public local government, with transparent and reliable data access. The Metropolis GZM in Poland was established on 1 July 2017 and began operating on 1 January 2018. It has been officially formalized thanks to the Government Act [21] dedicated to the Metropolis GZM. The organization brings together 41 cities and municipalities inhabited by a total of nearly 2.3 million people [27]. The creation of the Metropolis is the result of many years of efforts of local government officials, who have often proved that they want to cooperate with each other. They were aware that one, even the largest and wealthiest, city functioning independently would not be as effective and would not have as much to offer as the synergy of the potentials of more cities and municipalities.
The aforementioned projects of purchasing groups, carried out by GZM, are the largest projects of this type in Poland on the scale of the entire market and all sectors—private and public. The contracted volume of electricity was approximately 1 TWh and approximately 225 GWh of gas purchased for two years [28]. Analyses carried out under these projects showed the potential to optimize distribution costs, which led to the establishment of another project aimed at in-depth analysis and indicating areas for improvement.
The analyses were carried out on the basis of data covering a minimum period of 12 months, as well as calculation of savings made by comparing the annual costs of energy distribution for facilities within GZM municipalities before and after rationalization. The basis for the cost comparison was the 12-month amount of energy (electricity or gas) consumed in the period before rationalization, pre-rationalization, and post-rationalization contractual capacities and distribution fees applicable in 2020. The participation of cities in the project was voluntary. There were 25 cities that participated in the part concerning electricity and 21 in the area of gas. In addition, the authors present the second step of the analysis, showing what additional benefits could be achieved if municipalities decided to create the Energy Community (EC), with the aim of achieving energy self-sufficiency [29]. The energy community is defined in the Renewable Energy Directive REDII [30], focusing on the area of renewable energy, including the Renewable Energy Community. Citizens Energy Community (CEC) [31], which is implemented within the so-called Market Directive, is the second form of activity that could possibly be adopted. Both of these concepts serve the development of distributed energy in the local dimension, have legal personality, and are characterized by voluntary and open participation. The main goal of their operation is to run activities that bring sustainable benefits in the local and regional dimensions, which are aimed at building self-sufficiency and energy independence.
2.1. Optimization of Electricity Costs
Electricity distribution in Poland is carried out by overhead and cable networks with voltages from 0.4 kV to 110 kV, connected with each other through transformation systems. The distribution network is connected to the 220 kV and 400 kV transmission network, forming a part of the pan-European transmission-distribution system. In this article, we focus on the costs associated with the distribution of electricity. The reason for the research was the data analysis carried out as a part of the purchasing group’s project [24], where opportunities related to the achievement of potential opportunities in the distribution part were initially noticed. Therefore, this range has been analyzed in depth.
Municipalities often lack expert competences to look at this process, analyze it, and draw appropriate conclusions while proposing effective solutions. The powers ordered for a given Electricity Consumption Point (ECP), separately reflecting each of the connections metered with the electricity meter (the point of contact of the customer’s electrical installation with the distribution network), some years ago are not adequate to today’s needs. This situation concerns all the municipalities that took part in the project, which means that even large municipalities with the greatest potential did not see the problem. GZM, looking for improvements in the functioning of municipalities and looking from a supra-local perspective, noticed the possibilities of achieving savings in this area. The conducted analyses and proposed solutions are simulations based on real data. The implementation of solutions is already the responsibility of each of the municipalities, which, representing all the entities (office buildings, kindergartens, schools, hospitals, etc.), is decisive in contacts with the distribution network operator and coordinates the related formal issues. The purchase of electricity as a commodity and the distribution service for municipal subsidiaries are centralized and implemented at the municipal level. The possibilities of optimizing the costs of electricity distribution involve several groups of costs related either to the differentiation of fee rates or to technical conditions occurring in individual objects. We examine optimization possibilities in the following groups:
- Change of the tariff group, including the change from C2x to C1x, requiring investment outlays for the reconstruction of the measurement system.
- In Poland, the distribution of electricity is regulated by the Energy Regulatory Office. The electricity supply takes place at various voltage levels, which are reflected in the letter of the tariff group symbol. The letter “C” means connecting the consumer to the low voltage network. Marking 1 or 2 reflects the level of the ordered power: (i) 1—up to 40kW, (ii) 2—over 40kW. The symbol “x” in practice means 1, 2, or 3—the number of zones with different rates for the distribution of energy;
- Change of contracted capacity;
- Installation of devices for reactive power compensation divided into devices for compensation of inductive reactive power and capacitive reactive power.
Methodology for Calculating Electricity Distribution Cost Savings
Charges related to energy distribution relate to active and reactive energy and are also constant, depending on the level of installed power, and variable, depending on the amount of electricity consumed. The method of calculating the distribution cost for active energy is described in relation (1).
where:
- CostD—cost of energy distribution; (PLN)
- t—number of tariff zone; t = 1 or 2 or 3 or 4
- c—number of customers (c = 1, 2, … n)
- d—number of days
- m—number of months
- VEt—volume of energy consumption; (kWh)
- PDtT—price of energy distribution (variable component of the network fee) in tariff zone ‘t’ for tariff group ‘T’; (PLN/kWh)
- PowerI—contracted power (kW)
- PItT—price of energy distribution (fixed component of the network fee) in tariff zone ‘t’ for tariff group ‘T’; (PLN/kW/month)
The method of calculating charges for the reactive power consumed is described in the Tariff for electricity distribution approved by the President of the Energy Regulatory Office.
The search for savings is, therefore, reduced to the search for and change of the tariff group to the one that gives a lower cost for the total energy consumption, limiting the level of contracted capacity with simultaneous assessment of the risk of exceeding the power and related costs, as well as adjusting the load to a different voltage level and minimizing reactive power consumed.
The key assumptions of calculation methodology are indicated below:
- The current distribution costs were determined on the basis of the rates applicable in the Tauron Distribution (Distribution System Operator, DSO) tariff in 2020 and the amount of electricity consumed by individual ECP (Electricity Consumption Point) in 2019 [32]. The amount of electricity and contracted capacity for each ECP were obtained from the eBOK service (online customer service) run by the DSO or from copies of invoices obtained from municipalities.
- The activities related to the change of the tariff group recommended for implementation are shown if the annual saving for ECP is more than PLN 200.
- The investment activities recommended for implementation are shown if the simple payback periods are shorter than: 1 year for “Change from C2x to C1x”, 2 years for power compensation devices and 5 years for “Power supply change to medium voltage”.
- Changing the way the facility is powered, i.e., switching to medium voltage power supply, which requires the construction of its own transformer station.
Our analysis was limited to invoices for electricity distribution and did not include technical analysis related to on-site inspections and auditing of facilities.
2.2. Optimization of Gas Costs
Actions related to electricity may also apply to costs related to gas distribution. The reason for conducting the research was the data analysis carried out as part of the project of the blue fuel purchasing group [25]. Therefore, this range has been analyzed in depth. The capacity ordered for a given gas consumption point (GCP) some years ago may no longer correspond adequately to current needs.
In this case, the analyses and proposed solutions are also simulations based on real data. The implementation of solutions is already the responsibility of each of the municipalities.
The possibilities of optimizing the costs of gas fuel distribution refer to the costs related to the contracted capacity ordered for the facility or to the change of the tariff group from the groups settled for the contracted capacity to the groups in which the monthly flat rate is applied. We examined the possibilities in the following cost groups:
- Change of the tariff group from W-5 or higher to W-4 or lower;
- Change of the tariff group from W-4 or higher to W-5 in the event of an amount of gaseous fuel consumed;
- Change of contracted capacity;
- Increasing the contractual capacity in order to avoid paying fees for exceeding the contractual capacity.
Methodology for Calculating Gas Distribution Cost Savings
The key assumptions of calculation methodology are indicated below:
- The current distribution costs were determined on the basis of the rates applicable in the tariff No. 8 of PSG Sp. z o. o. o/Zabrze (gas distribution operator) biding in 2020 and the amount of gas collected by individual GCP (Gas Consumption Point) in the period covered by invoices provided by individual municipalities.
- Recommendation to change the tariff group from W-4 to W-5 occurs when the annual consumption of gaseous fuel exceeds 250,000 kWh.
- The recommendation to change the tariff group from W-5 to W-4 occurs when the maximum power consumed in the analyzed period is lower than 110 kWh/h. In these situations, two savings arise: (1) Reduction of the contracted capacity to 110 kW; (2) Change of the tariff group.
- If the invoices include costs related to exceeding the contractual capacity, they are shown in a separate item. If the number of billing periods in which the capacity was exceeded is lower than five, the recommended capacity is in the amount of the current contracted capacity. If the number of these periods is five or more, in order to minimize costs, the recommended capacity is increased in relation to the contracted capacity.
The structure of gas distribution costs, and the method of their calculation, are the same as in the case of electricity. The research was limited to invoices for the supply of gas, and it did not include technical analysis related to on-site inspections and auditing of facilities.
2.3. Energy Communities
Another area of optimization of electricity distribution costs is related to the possibility of aggregating recipients under two forms of energy communities (EC) permitted under Polish law.
The first form of supporting local energy communities, and the longest existing in Polish legislation, are energy clusters [33]. The cluster has no legal personality, as it is a civil law contract concluded between consumers and producers in order to build energy self-sufficiency at the local and regional level. The participation of communes in the existing cluster structures is common, which makes it possible to build broad energy self-sufficient structures even at the higher administrative level (powiat). The solution, designed and submitted to public consultations to support the establishment and operations of energy clusters, assumes lowering the costs of electricity distribution for entities operating within these structures. It is worth emphasizing that the REDII Directive [30], indicating the need to build energy communities, has not yet been fully implemented into Polish law, hence other forms of building energy communities, in particular the so-called virtual prosumer [34] along with elements of neighborhood exchange [35], which are being analyzed further.
The second form of energy communities are energy cooperatives, whose activity may be carried out in the area of a rural or urban-rural commune, or in no more than three such communes directly adjacent to each other. The main goal of an energy cooperative is to generate electricity from renewable energy sources, as well as to maximize the effect of local energy independence. An energy cooperative has been defined in Polish law as a prosumer, i.e., a recipient of energy that is, at the same time, producing and consuming it for its own needs. A characteristic feature is also the so-called discount model of using the distribution network, thanks to which it becomes an electricity deposit, facilitating the balancing of supply and demand within a given settlement period. The electricity seller settles accounts with the energy cooperative only for the difference between the amount of electricity introduced to the distribution network and the amount of electricity taken from this network by the cooperative. Electricity is consumed at any time within the adopted billing period, and cost-free electricity consumption is only 60% of the electricity fed into the grid. The difference between the electricity imported and taken from the grid is resold on the free market by the electricity supplier, serving the given cooperative. Revenue from sales is intended to cover the costs of electricity distribution and sales related to the operation of the discount model. In other words, for each unit of electricity produced by the cooperative and not used by its members at a given moment, 0.6 units of electricity can be taken from the distribution network at no cost. In addition to the benefits of electricity as a commodity, the key from the perspective of this paper is the preferential operation of the discount model with respect to electricity distribution. An energy cooperative is not charged with variable distribution fees—depending on the volume of electricity consumption—for electricity used as part of self-consumption, electricity consumption directly at the time of its generation, and for electricity collected from the network deposit. This factor can be an important source of savings in the area of electricity distribution and is the subject of further analyses and presentation of their results.
It should be emphasized that the creation of energy communities is an activity that positively influences the development of distribution networks [36], the quality of their work, and characteristic indicators [37], as evidenced by the results of the analyses carried out and presented in the article.
Methodology for Calculating Electricity Distribution Cost Savings
The second stage of our study presents the coopetitive nature of energy communities. Implementation and functioning of EC may have an additional beneficial effect on the optimization of energy costs. An important element of the analysis is to indicate the managerial, coopetitive nature of the strategies implemented within the energy communities. Their members, while operating in a competitive environment, simultaneously cooperate in order to achieve common benefits. Our simulations are based on actual data of recipients and producers, i.e., members of EC. The analyses clearly indicate the scale of both private and common benefits available within the EC.
The key assumptions of calculation methodology are indicated below:
- The total capacity of renewable energy sources, included in energy cooperatives, must cover at least 70% of the cooperative’s own needs and may not exceed 10 MW (30 MW for heat). Energy must be produced for the own needs of the cooperative and its members.
- An energy co-operative may be located in the area of up to three neighboring communes. For the purposes of the calculation, it was assumed that each rural or rural-urban commune participating in the cost optimization project creates its own cooperative. At the same time, this assumption makes it possible to meet the criterion of the maximum number of cooperatives. According to the act, the maximum number of cooperative members is 999.
- The analysis of the benefits, resulting from the establishment of an energy cooperative and associated local government units, only takes into account the aspect of minimizing the costs of energy distribution, which fits in with the continuing scenarios of searching for savings by communes. Other benefits resulting, for example, from the possibility of optimizing the generation structure [36], physical energy storage [38], minimizing power charges [36], and dedicated government support [39] have not been analyzed. Energy cooperatives may be established in urban-rural or rural communes. Therefore, some commune municipalities, having no possibility to create energy cooperatives, also have no possibility of obtaining additional savings.
- The assessment of benefits comes down to the calculation of variable costs of distribution, taking into account the individual affiliation of individual recipients to tariff groups and current distribution rates [32]. The calculations and results relate to the annual time horizon and are dimensioned based on the actual tariff rates applicable in 2020.
3. Results
3.1. Optimization of Electricity Distribution Costs
The in-depth analysis covered the electricity consumption facilities administered by organizational units of 25 cities and communes, according to the table below (Table 1). In total, 5516 electricity consumption points participated in the optimization, the total contractual capacity of which was 118 MW, the annual electricity consumption in 2019 was 152,151 MWh, and the total gross annual cost of electricity distribution reached the value of PLN 34.7 million.
Table 2 presents the results of the optimization calculations, according to the assumptions mentioned in Section 2.1, presented in aggregate to the city/commune. The costs of exceeding the capacity have been included in the total savings.
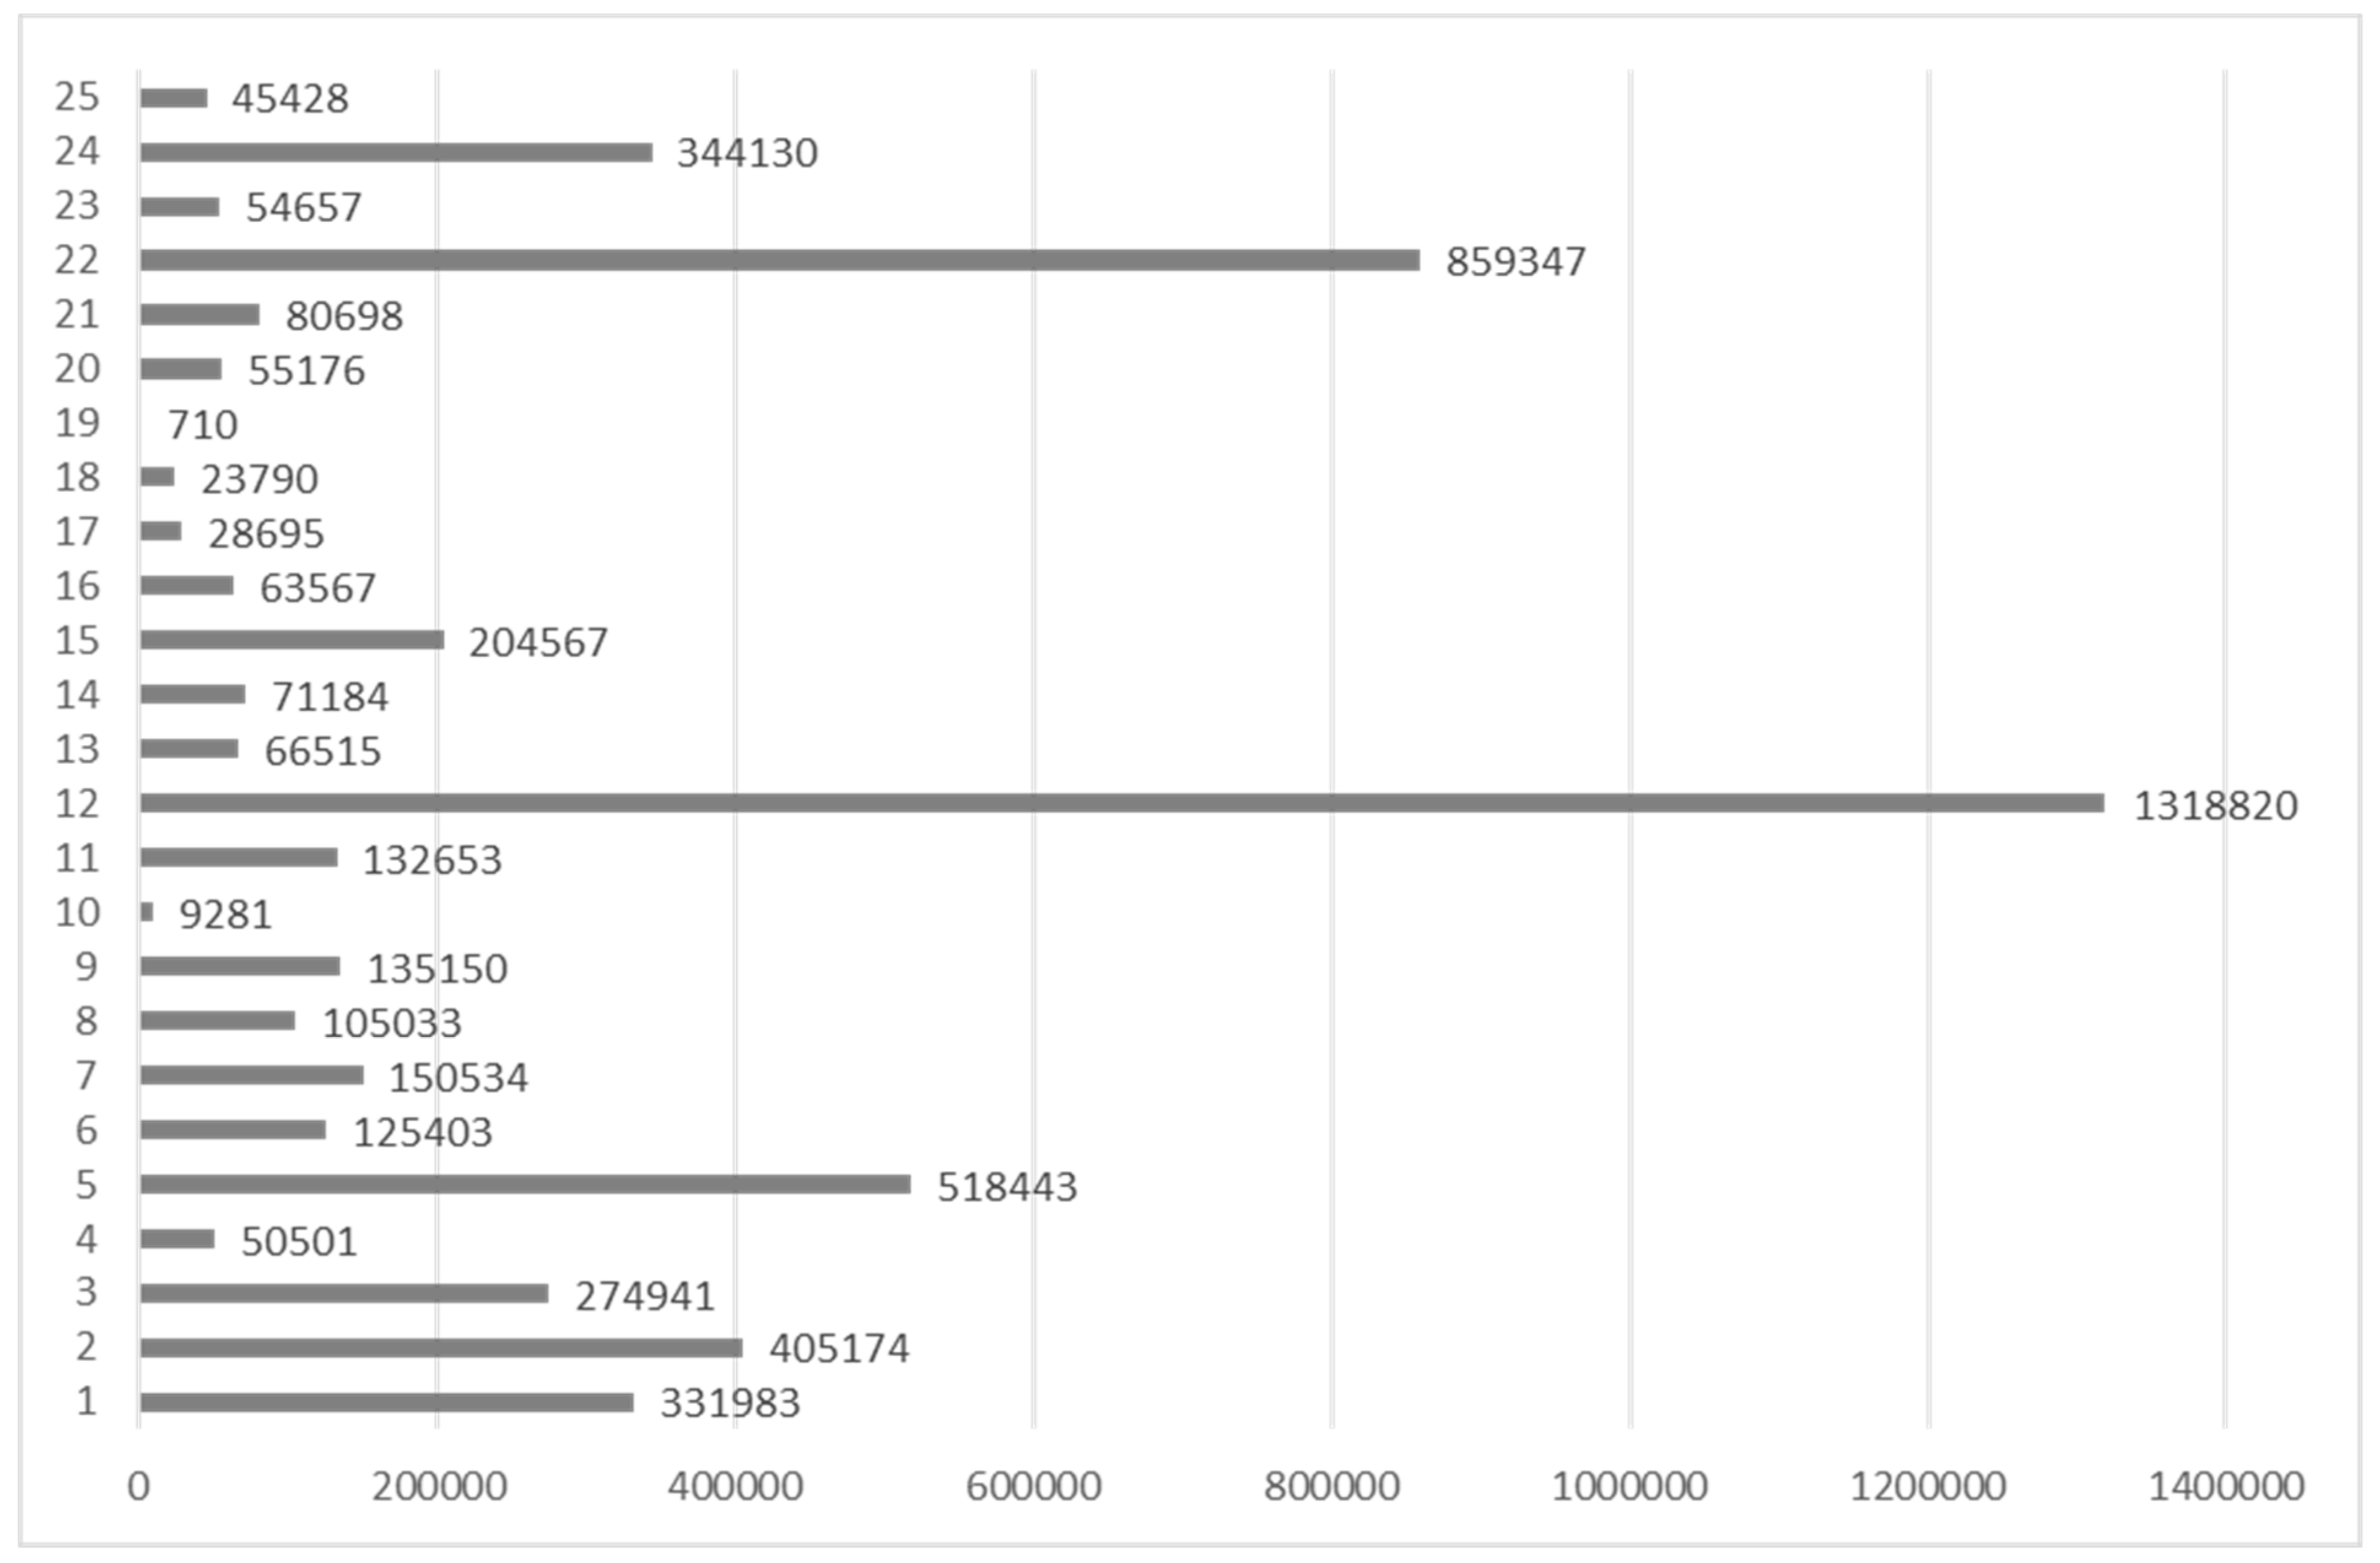
The total amount of possible savings is almost PLN 5.5 million annually, which is on average 15.7% of incurred distribution costs. The minimum and maximum average level of benefits amounted to 0.1% and 44.5%, respectively. These levels, broken down into individual categories of savings, are presented in Figure 1.
The group of costs related to contracted capacity has the largest share in the total amount. Savings in this group amount to PLN 3.056 million, the second largest group of savings is the group of costs related to changing the tariff group (PLN 0.7 million), and the next group of savings is related to the installation of equipment for the compensation of reactive power (PLN 0.662 million). The savings that can be obtained in individual communes are presented below (Figure 2).
The analysis of the above results shows that, in individual situations, there are quite different conditions and there is no one universal recipe for reducing distribution costs. The structure of possible savings varies across participants in the Metropolis GZM. Additional actions need to be taken by participants to actually achieve the simulated amount of savings. The sequence of actions may result from the ranking of individual groups of savings from the largest to the smallest. Where there are predominant groups of savings related to incurring capital expenditures, decisions should be made whether to invest one’s own funds and buy equipment or use the option of looking for a partner who will finance the investment in the ESCO (Energy Saving Company) formula (from the savings obtained). In the group of savings related to the change of contracted capacity, a number of cases’ information was provided, so a technical audit is required to confirm the savings. As this analysis did not include such activities, audits should be performed by individual facility administrators as the next stage of activities.
3.2. Optimization of Gas Distribution Costs
The gaseous fuel consumption facilities, administered by the organizational units of 23 Cities and Communes, according to the Table 3 below, were optimized. In total, 635 gas consumption points participated in the optimization, whose total annual gas fuel consumption in 2019 amounted to 72,118 MWh, and the total annual gross cost of gas distribution amounted to PLN 4.36 million.
Table 4 presents the results of the optimization calculations, according to the assumptions mentioned in point 2.2., presented in aggregate with the city/commune.
The total amount of possible savings is PLN 583.8 thousand annually, which is, on average, 13.4% distribution costs incurred. The minimum and maximum average level of benefits amounted to 0.0% and 27.9%, respectively. These levels, broken down into individual categories of savings, are presented in Figure 3.
The group of costs related to contracted capacity has the largest share in the total amount. Savings in this group amount to PLN 519 thousand, and the second largest of savings is the group of costs related to the change of the tariff group to W-4 (PLN 59 thousand). The savings that can be obtained in individual communes are presented below (Figure 4).
Our analysis shows substantial benefits of optimizing gas distribution costs for individual municipalities in various proportions. Differences in proportions of savings result from various initial situations of particular members. This means that the members in the analysis had certain assumptions when signing distribution contracts at a given time. The situation could change over the duration of the contracts. New points (e.g., construction of a new point or development of existing ones) could be added, or existing ones could be resigned from. In addition, consumption could be limited for specific reasons. As a consequence, the ordered power was inadequate to the consumed power, as shown by the differences in possible savings.
3.3. Energy Communities—Coopetition Platforms
The in-depth analysis covers the electricity consumption facilities administered by organizational units of 11 communes, which, in accordance with applicable law, may be part of an energy cooperative, according to the table below (Table 5).
When discussing the simulation results, we underline that the savings obtained in stage 1, and illustrated in detail in Table 2, do not require any investment outlays. This is because cost optimization includes, in particular, the adjustments of the ordered power and of the tariff group to the current consumption profile. Only the voltage adjustment of the connections of some facilities and reactive power compensation require minor investments. This activity is a one-time saving.
Stage 2 reveals itself to be more difficult to implement. The complexity and difficulty of building energy cooperatives is caused by the lack of frameworks proven and tested in practice and the lack of implementations that could serve as a model to be followed. As of 11 September 2021, there is only one entity in the register of energy cooperatives, which was registered on 11 May 2021.
Establishing the structures of energy cooperatives requires both formal and consensual work, as well as large investments in generation sources. Formal issues focus on: (i) development of the statutes of the cooperative, which will have an individual character reflecting the needs of each participant, (ii) registration with the registry court, which may take up to 12 months due to the innovative nature of the subject of the notification, (iii) application of the cooperative to the National Center for Agricultural Support, (iv) development of the settlement model, which, due to the lack of an executive regulation to the act constituting an energy cooperative, must take into account the process of negotiation and arrangements not only at the level of cooperative members, but also with the Distribution Network Operator, (v) arrangements with the Distribution System Operator in the field of technical and billing, particularly communication and exchange of measurement data, (vi) signing a distribution agreement, which is a process that may last from a few to several months, and (vii) signing a commercial balancing agreement, which is related to the process of market research and obtaining the best offer. These activities are time consuming but do not result in capital expenditure. On the other hand, outlays materialize when investing in generation sources, the total capacity of which must cover at least 70% of the cooperative’s needs. The selection of production and storage sources is presented in [36,40].
4. Discussion
Our study aimed at examining the benefits available through coopetition and unavailable to individual municipalities when acting alone. By focusing on the Metropolis GZM, we substantiate that competing municipalities can reap substantial savings in energy and gas distribution by establishing various cooperative agreements. Our pioneering simulations, reflecting the specific setting of the operation of Energy Communes, are based on actual data and substantiate coopetition in two different forms: mutual procurement by competing actors and a coopetition platform for both power production and consumption, which can bring substantial benefits to its participants.
The analysis of electricity and gas distribution costs show that the main possibility of savings is the optimization of the contracted capacity. In some individual cases, there are savings opportunities by changing tariff groups, but, in the case of gas, the total scale of these savings is only 10% of the total savings. In the group of savings related to the change of contracted capacity, there is one more element that was not tested because it is related to the technical audit of the facility which was out of the scope in this research. This element is related to the algorithms controlling heating systems, which, when properly configured, allow a reduction in the power consumed in the GCP and thus enable a further reduction in the contracted gas.
Our analysis also shows that the implementation of energy cooperatives in communes, where it is legally possible, may bring substantial benefits. This action allows them to avoid variable costs of electricity distribution which, depending on the receiving structure in the commune, amount to between 66–86% of the total distribution costs.
The measurability of possible benefits and the existing limitations (maximum 999 beneficiaries within one cooperative) imply the creation of a competitive space. In particular, it focuses on: (i) the selection of the location of the cooperative, i.e., the area of up to three adjacent rural or rural-urban municipalities, which is affected by the existence of production infrastructure, the existence of spatial development plans, the amount of taxes on land and real estate, implying the development of local economies and (ii) selection of cooperative participants in a way that allows adjustment to the production profile and maximization of energy consumption within the energy cooperative.
It is worth noting that the communes analyzed in stage 2 had customers belonging to both single and multi-zone tariff groups, connected at low and medium voltage, for which energy was supplied by several types of tariff groups: B23, B21, B22, C11, C12a, C12b, C21, C22a, C22b, G11, G12, G13, R, O12. Allocation to different tariff groups, differences in the profiles and levels of energy consumption, and the processes of electricity consumption rationalization, carried out so far, affect the unequal distribution of benefits both at stage 1 and stage 2. Additionally, it should be emphasized that the construction of energy cooperatives gives a replicative effect. The benefits for this scenario are centered on lower distribution fees every year.
From the project participants’ perspective, the investment recommendations, aimed at minimizing distribution costs in the long term, were also significant. This group of activities includes (i) optimal selection of connection voltage—giving a total benefit of 365.7 kPLN/year (1.1% of all distribution costs), (ii) reactive power compensation—giving a total benefit of 662 kPLN/year (1.9% of all distribution costs), and (iii) construction of own generation sources and energy storage in order to create local energy communities. Establishing EC comes down to obtaining additional savings by the municipalities forming the cooperatives at the level of PLN 2.49 million/year, which translates into a 64% reduction in costs for municipalities and beneficiaries as well as a 7.2% reduction in costs in relation to the total cost for all 25 municipalities.
5. Conclusions
Taking all possible pro-saving measures, both non-investment and related to outlays, results in savings of PLN 7.94 million/year, which is 22.9% compared to the total distribution costs of PLN 34.69 million/year. Hence, the primary theoretical contribution of our study is that we add to the list of coopetition benefits discussed in literature [5] a relevant category of operational efficiency increase. Prior studies, with very few exceptions [9,12,41] deal, rather, with revenue increase, market share growth, or new intellectual property creation, than with aggregate cost savings. Using mutual procurement and energy community, we demonstrate how much municipalities can actually save both collectively, and at an individual level, when it comes to distribution costs. The second theory contribution is that we extend the scope of coopetition analysis beyond businesses and non-profit organizations to include public actors. While this is a less evident actor in the strategy literature, horizontal interdependence between jurisdictions [20] encourages further studies on when and how municipalities can effectively collaborate, even if competing, in other arenas. The third theory contribution takes account of a regulated environment of energy distribution. It is important to examine regulatory environments in search of coopetition opportunities created for the greater social and public benefit. This opens ways for further scrutiny of reasons why various categories of actors: business, non-profit, and public, refrain from engaging into coopetitive platforms. Our results encourage adopting a global optimization logic when considering coopetitive platforms, where increases in the number of involved participant numbers can translate into substantial benefits. Lastly, we introduce the term of coopetitive platform, a novelty in the coopetition literature. The energy communes are value co-creating platforms [42] that can effectively work within a public environment and possibly spin beyond to the business realm.
Our study has far-reaching implications for practice. Our simulations are based on real data, tariffs, and regulations, which substantiate low-hanging fruits in terms of energy distribution savings. Municipalities across Poland, and across similarly regulated power distribution markets, can establish coopetition and reduce costs. This process is challenging due to capabilities needed, and the ability to successfully address tensions likely to emerge between potential participants. Therefore, municipality authorities are encouraged to develop coopetition capabilities, which may include: (1) the political will to engage into collaboration with others with regards to energy and gas distribution cost; (2) a mindset oriented toward clearly identifying benefits and addressing barriers to coopetition; (3) organizational capabilities needed to handle highly specialized contracts and regulations; (4) procedures relative to monitoring the benefits from coopetition. Our novel approach helps estimate those benefits.
Moreover, our study contributes to an increase in the sustainability of power generation industry. Indeed, by looking at alternative ways of procuring electricity and gas, such as alternatives that are more efficient in financial and technical terms, municipalities help increasing energy market efficiency. Therefore, we encourage policymakers to incorporate energy communities and coopetition platforms into the set of institutional arrangements supported under sustainability policy. Finally, a policy implication of our study is that municipalities should be encouraged to collaborate in various arenas. While legal frameworks help in establishing such collaboration, managerial capabilities and experience are needed to successfully embrace coopetition among public actors. This encourages experimental or pilot coopetition in order to substantiate benefits, identify challenges, and provide compelling exemplars.
The limitations to this study may be divided into two groups: (i) limitation regarding stage 1 analysis—this is a documentary analysis, i.e., based on invoices for the supply of energy (electricity and gas), without including technical analysis related to on-site inspections and auditing of facilities; (ii) limitation to stage 2 analysis—here, the limitation may be attributed to selective case study presentation. Additionally, this study does not have exhaustive ambitions as far as government coopetition is concerned. Therefore we strongly encourage further scrutiny of coopetition in the public arena.
Author Contributions
Conceptualization, K.M.-K., M.S., W.C.; methodology, K.M.-K., M.S.; software, K.M.-K., M.S.; validation, K.M.-K., M.S.; formal analysis, K.M.-K., M.S.; investigation, K.M.-K., M.S.; resources, K.M.-K., M.S.; data curation, K.M.-K., M.S.; writing—original draft preparation, K.M.-K., M.S., W.C.; writing—review and editing, K.M.-K., W.C.; visualization, K.M.-K., M.S.; supervision—W.C.; project administration K.M.-K.; funding acquisition, K.M.-K. All authors have read and agreed to the published version of the manuscript.
Funding
The project is funded under the program of the Minister of Science and Higher Education titled “Regional Initiative of Excellence” in 2019–2022, project number 018/RID/2018/19, the amount of funding PLN 10788423,16.
Institutional Review Board Statement
Not applicable.
Informed Consent Statement
Not applicable.
Data Availability Statement
The data presented in this study are available on request from the corresponding author.
Conflicts of Interest
The authors declare no conflict of interest.
References
- Brandenburger, A.M.; Nalebuff, B.J. Co-Opetition; Doubleday Currency: New York, NY, USA, 1996. [Google Scholar]
- Bengtsson, M.; Kock, S. Cooperation and competition in relationships between competitors in business networks. J. Bus. Ind. Mark. 1999, 14, 178–194. [Google Scholar] [CrossRef]
- Czakon, W.; Srivastava, M.K.; Le Roy, F.; Gnyawali, D. Coopetition strategies: Critical issues and research directions. Long Range Plan. 2020, 53, 101948. [Google Scholar] [CrossRef]
- Czakon, W.; Klimas, P.; Mariani, M. Behavioral antecedents of coopetition: A synthesis and measurement scale. Long Range Plan. 2020, 53, 101875. [Google Scholar] [CrossRef]
- Le Roy, F.; Czakon, W. Managing coopetition: The missing link between strategy and performance. Ind. Mark. Manag. 2016, 53, 3–6. [Google Scholar] [CrossRef]
- Klimas, P.; Czakon, W.; Fredrich, V. Strategy frames in coopetition: An examination of coopetition entry factors in high-tech firms. Eur. Manag. J. 2021, 39, 5. [Google Scholar] [CrossRef]
- Gnyawali, D.R.; Ryan Charleton, T. Nuances in the interplay of competition and cooperation: Towards a theory of coopetition. J. Manag. 2018, 44, 2511–2534. [Google Scholar] [CrossRef] [Green Version]
- Gernsheimer, O.; Kanbach, D.K.; Gast, J. Coopetition research—A systematic literature review on recent accomplishments and trajectories. Ind. Mark. Manag. 2021, 96, 113–134. [Google Scholar] [CrossRef]
- Volschenk, J.; Ungerer, M.; Smit, E. Creation and appropriation of socio-environmental value in coopetition. Ind. Mark. Manag. 2016, 57, 109–118. [Google Scholar] [CrossRef] [Green Version]
- Le Roy, F.; Sanou, F.H. Does coopetition strategy improve market performance? An empirical study in mobile phone industry. J. Econ. Manag. 2014, 17, 64–92. [Google Scholar]
- Bouncken, R.B.; Fredrich, V.; Ritala, P.; Kraus, S. Coopetition in New Product Development Alliances: Advantages and Tensions for Incremental and Radical Innovation. Br. J. Manag. 2018, 29, 391–410. [Google Scholar] [CrossRef]
- Czakon, W.; Mucha-Kuś, K.; Sołtysik, M. Coopetition strategy—What is in it for all? A study of common benefits in the Polish energy balancing market. Int. Stud. Manag. Organ. 2016, 46, 80–93. [Google Scholar]
- Gnyawali, D.R.; Park, B.-J.R. Co-opetition between giants: Collaboration with competitors for technological innovation. Res. Policy 2011, 40, 650–663. [Google Scholar] [CrossRef]
- Amata, R.; Dagnino, G.B.; Minà, A.; Picone, P.M. Managing coopetition in diversified firms: Insights from a qualitative case study. Long Range Plan. 2021, 54, 102128. [Google Scholar] [CrossRef]
- Della Corte, V.; Aria, M. Coopetition and sustainable competitive advantage. The case of tourist destinations. Tour. Manag. 2016, 54, 524–540. [Google Scholar] [CrossRef]
- Wemmer, F.; Emrich, E.; Koenigstorfer, J. The impact of coopetition-based open innovation on performance in nonprofit sports clubs. Eur. Sport Manag. Q. 2016, 16, 341–363. [Google Scholar] [CrossRef]
- Fathalikhani, S.; Hafezalkotob, A.; Soltani, R. Cooperation and coopetition among humanitarian organizations: A game theory approach. Kybernetes 2018, 48, 1642–1663. [Google Scholar] [CrossRef]
- Albert-Cromarias, A.; Dos Santos, C. Coopetition in healthcare: Heresy or reality? An exploration of felt outcomes at an intra-organizational level. Soc. Sci. Med. 2020, 252, 112938. [Google Scholar] [CrossRef]
- Salmon, P. Yardstick Competition among Governments: Accountability and Policymaking When Citizens Look Across Borders; Oxford University Press: New York, NY, USA, 2019. [Google Scholar]
- Brueckner, J.K. Strategic Interaction Among Governments: An Overview of Empirical Studies. Int. Reg. Sci. Rev. 2003, 26, 175–188. [Google Scholar] [CrossRef] [Green Version]
- The Act of March 9, 2017 on the Metropolitan Union in the Silesian Voivodeship. Available online: https://isap.sejm.gov.pl/isap.nsf/DocDetails.xsp?id=WDU20170000730 (accessed on 18 May 2021).
- Robert, F.; Marques, P.; Le Roy, F. Coopetition Between SMEs: An Empirical Study of French Professional Football. Int. J. Entrep. Small Bus. 2009, 8, 23–43. [Google Scholar] [CrossRef]
- Meade, W.; Hyman, M.; Blank, L. Promotions as Coopetition in the Soft Drink Industry. Acad. Mark. Stud. J. 2009, 13, 105–133. [Google Scholar]
- Mucha-Kuś, K. One for all, all for one Metropolitan Electricity Purchasing Group—Case Study. In Proceedings of the 34th Inter-national Business Information Management Association Conference (IBIMA), Madrid, Spain, 13–14 November 2019; pp. 9037–9045. [Google Scholar]
- Mucha-Kuś, K. Measurable Effects of Metropolitan Gas Purchasing Group in the Light of Gas Market Functioning in Poland. Resources 2020, 9, 36. [Google Scholar] [CrossRef] [Green Version]
- Palinkas, L.A.; Horwitz, S.M.; Green, C.A.; Wisdom, J.P.; Duan, N.; Hoagwood, K. Purposeful Sampling for Qualitative Data Collection and Analysis in Mixed Method Implementation Research. Adm. Policy Ment. Health Ment. Health Serv. Res. 2015, 42, 533–544. [Google Scholar] [CrossRef] [PubMed] [Green Version]
- The Socio-Economic Potential of Metropolis GZM. PwC Advisory Sp. Z O.o. Sp.k., Report. 2019. Available online: http://metropoliagzm.pl/wp-content/uploads/2019/02/GZM_raport.pdf (accessed on 18 May 2021).
- Metropolis GZM Purchasing Groups. Available online: https://metropoliagzm.pl/en/grupa-zakupowa/ (accessed on 19 May 2021).
- Mucha-Kuś, K.; Sołtysik, M.; Zamasz, K.; Szczepańska-Woszczyna, K. Coopetitive Nature of Energy Communities—The Energy Transition Context. Energies 2021, 14, 931. [Google Scholar] [CrossRef]
- Directive (EU) 2018/2001 of the European Parliament and of the Council of 11 December 2018 on the Promotion of the Use of Energy from Renewable Sources; European Union: (OJ L 328). 21 December. Available online: http://data.europa.eu/eli/dir/2018/2001/oj (accessed on 19 May 2021).
- Citizens Energy Communities: Recommendations for a Successful Contribution to Decarbonization; Eurelectric Position Pa-per—Dépôt Légal: D/2019/12.105/13. 2019. Available online: https://www.apren.pt/contents/publicationsothers/eurelectric--citizens-energy-communities.pdf (accessed on 19 May 2021).
- Tariff for Electricity TAURON Dystrybucja for 2020, S.A. for 2020. Available online: https://www.tauron-dystrybucja.pl/-/media/offer-documents/dystrybucja/archiwum-taryf/2020/taryfa-td-sa-2020.ashx (accessed on 25 June 2021).
- The Act of 20 February 2015 on Renewable Energy Sources (Journal of Laws of 2015, Item 478). Act on Renewable Energy Sources (‘RES Act’, Dz.U. 2015 poz. 478)-Poland-Climate Change Laws of the World. Available online: https://climate-laws.org/geographies/poland/laws/act-on-renewable-energy-sources-res-act-dz-u-2015-poz-478 (accessed on 19 May 2021).
- Espe, E.; Potdar, V.; Chang, E. Prosumer Communities and Relationships in Smart Grids: A Literature Review, Evolution and Future Directions. Energies 2018, 11, 2528. [Google Scholar] [CrossRef] [Green Version]
- Wróbel, J.; Sołtysik, M.; Rogus, R. Selected elements of the Neighborly Exchange of Energy—profitability evaluation of the functional model. Polityka Energetyczna Energy Policy J. 2019, 22, 53–64. [Google Scholar] [CrossRef]
- Jasiński, J.; Kozakiewicz, M.; Sołtysik, M. Determinants of Energy Cooperatives’ Development in Rural Areas—Evidence from Poland. Energies 2021, 14, 319. [Google Scholar] [CrossRef]
- Janiszewski, P.; Sawicki, J.; Kurpas, J.; Mróz, M. Practical ways to Improve SAIDI and SAIFI Power Supply Indicators in an MV Grid. Acta Energ. 2018, 34, 45–50. [Google Scholar] [CrossRef]
- Andrychowicz, M. Comparison of the use of energy storages and energy curtailment as an addition to the allocation of re-newable energy in the distribution system in order to minimize development costs. Energies 2020, 13, 3746. [Google Scholar] [CrossRef]
- Olczak, P.; Kryzia, D.; Matuszewska, D.; Kuta, M. “My Electricity” Program Effectiveness Supporting the Development of PV Installation in Poland. Energies 2021, 14, 231. [Google Scholar] [CrossRef]
- Jasiński, J.; Kozakiewicz, M.; Sołtysik, M. The Effectiveness of Energy Cooperatives Operating on the Capacity Market. Energies 2021, 14, 3226. [Google Scholar] [CrossRef]
- Trapp, A.C.; Harris, I.; Rodrigues, V.S.; Sarkis, J. Maritime container shipping: Does coopetition improve cost and environ-mental efficiencies? Transp. Res. Part D Transp. Environ. 2020, 87, 102507. [Google Scholar] [CrossRef]
- Aarikka-Stenroos, L.; Ritala, P. Network management in the era of ecosystems: Systematic review and management frame-work. Ind. Mark. Manag. 2017, 67, 23–36. [Google Scholar] [CrossRef]
Figure 1.
Minimum, average, and maximum level of savings within a given category—electricity.

Figure 2.
Total savings per city–electricity distribution costs (PLN).

Figure 3.
Minimum, average, and maximum level of savings within a given category—gas.

Figure 4.
Total savings per city—gas distribution costs (PLN).


Table 1.
Electricity distribution costs analysis—summary of input data.
| City | Number of ECP Electricity Consumption Points | Capacity (kW) | Annual Electricity Consumption (kWh) | Gross Distribution Cost (PLN) |
|---|---|---|---|---|
| 1 | 189 | 6422.25 | 6,490,526 | 1,582,786 |
| 2 | 502 | 12,375.68 | 21,016,409 | 4,211,311 |
| 3 | 143 | 5663.40 | 6,220,114 | 1,576,171 |
| 4 | 105 | 1630.45 | 2,518,609 | 574,785 |
| 5 | 399 | 15,731.20 | 21,197,498 | 4,397,902 |
| 6 | 82 | 1436.40 | 2,026,439 | 488,716 |
| 7 | 138 | 2729.20 | 2,804,807 | 730,786 |
| 8 | 153 | 1844.00 | 3,606,311 | 774,971 |
| 9 | 77 | 1036.30 | 1,156,845 | 303,690 |
| 10 | 44 | 584.00 | 452,333 | 100,013 |
| 11 | 125 | 2500.60 | 1,569,595 | 450,864 |
| 12 | 663 | 20,365.10 | 30,521,752 | 7,032,177 |
| 13 | 53 | 725.00 | 1,246,638 | 280,736 |
| 14 | 147 | 2064.30 | 2,301,232 | 486,988 |
| 15 | 176 | 3753.05 | 4,552,192 | 1,067,264 |
| 16 | 138 | 1368.00 | 1,608,394 | 378,699 |
| 17 | 97 | 847.60 | 1,152,053 | 242,014 |
| 18 | 96 | 1142.30 | 1,798,630 | 338,222 |
| 19 | 275 | 4109.40 | 4,330,734 | 898,081 |
| 20 | 99 | 1347.50 | 1,824,627 | 367,330 |
| 21 | 94 | 2236.00 | 1,647,000 | 404,005 |
| 22 | 469 | 12,480.90 | 14,229,483 | 3,955,790 |
| 23 | 75 | 2319.80 | 2,379,585 | 518,937 |
| 24 | 1056 | 12,149.42 | 12,996,739 | 3,000,791 |
| 25 | 121 | 1164.10 | 2,502,689 | 528,835 |
| Total | 5516 | 118,025.95 | 152,151,234 | 34,691,865 |
Table 2.
Electricity distribution costs analysis—results (PLN).
| City | Savings—Changing the Tariff Group | Savings—Changing Contracted Capacity | Savings—Change from C2 to C1 | Savings in MV Power Supply | Savings on Power Compensation | Cost of Exceeding the Contracted Capacity | Total Savings |
|---|---|---|---|---|---|---|---|
| 1 | 51,912 | 166,881 | 36,931 | 12,171 | 47,980 | 16,108 | 331,983 |
| 2 | 60,583 | 240,183 | 14,444 | 2562 | 72,999 | 14,404 | 405,174 |
| 3 | 25,195 | 141,531 | 34,979 | 40,505 | 20,312 | 12,419 | 274,941 |
| 4 | 25,904 | 19,411 | 4162 | 0 | 0 | 1024 | 50,501 |
| 5 | 74,639 | 287,330 | 78,363 | 25,303 | 16,587 | 36,221 | 518,443 |
| 6 | 12,148 | 29,260 | 6879 | 77,116 | 0 | 0 | 125,403 |
| 7 | 24,018 | 81,786 | 12,865 | 0 | 28,197 | 3668 | 150,534 |
| 8 | 49,937 | 46,386 | 978 | 0 | 0 | 7732 | 105,033 |
| 9 | 7113 | 28,680 | 6404 | 61,375 | 12,660 | 18,920 | 135,150 |
| 10 | 0 | 9281 | 0 | 0 | 0 | 0 | 9281 |
| 11 | 15,354 | 84,401 | 9698 | 0 | 22,401 | 799 | 132,653 |
| 12 | 43,503 | 778,830 | 66,268 | 0 | 258,703 | 171,516 | 1,318,820 |
| 13 | 10,208 | 20,943 | 2422 | 0 | 15,520 | 17,422 | 66,515 |
| 14 | 18,340 | 47,429 | 5415 | 0 | 0 | 0 | 71,184 |
| 15 | 36,044 | 97,086 | 6901 | 41,815 | 21,351 | 1370 | 204,567 |
| 16 | 15,070 | 19,537 | 8715 | 3090 | 2334 | 14,822 | 63,567 |
| 17 | 14,031 | 10,747 | 0 | 3916 | 0 | 0 | 28,695 |
| 18 | 434 | 8941 | 0 | 0 | 14,416 | 0 | 23,790 |
| 19 | 207 | 60,888 | 3351 | 5907 | 0 | 662 | 710 |
| 20 | 18,198 | 30,890 | 6088 | 0 | 0 | 0 | 55,176 |
| 21 | 18,974 | 60,081 | 636 | 0 | 0 | 1006 | 80,698 |
| 22 | 113,087 | 550,873 | 65,603 | 0 | 128,540 | 1244 | 859,347 |
| 23 | 22,548 | 32,109 | 0 | 0 | 0 | 0 | 54,657 |
| 24 | 18,633 | 187,985 | 43,077 | 88,497 | 0 | 5938 | 344,130 |
| 25 | 23,675 | 14,066 | 4204 | 3483 | 0 | 0 | 45,428 |
| Total | 699,755 | 3,055,535 | 418,383 | 365,740 | 662,000 | 325,275 | 5,455,670 |
Table 3.
Gas distribution costs analysis—summary of input data.
| City | Number of GCP Gas Consumption Points | Annual Gas Consumption (kWh) | Gross Distribution Cost (PLN) |
|---|---|---|---|
| 1 | 11 | 509,253 | 27,996 |
| 2 | 51 | 5,038,592 | 314,743 |
| 3 | 2 | 329,780 | 19,131 |
| 4 | 5 | 627,569 | 51,006 |
| 5 | 16 | 2,075,764 | 116,852 |
| 6 | 62 | 3,426,418 | 189,666 |
| 7 | 11 | 1,018,930 | 58,788 |
| 8 | 20 | 1,332,516 | 100,328 |
| 9 | 29 | 2,231,016 | 148,099 |
| 10 | 26 | 1,720,483 | 87,991 |
| 11 | 6 | 543,269 | 39,409 |
| 12 | 20 | 6,215,056 | 313,790 |
| 13 | 22 | 3,015,312 | 171,235 |
| 14 | 15 | 1,667,667 | 106,779 |
| 15 | 22 | 3,201,976 | 210,849 |
| 16 | 78 | 8,836,631 | 502,694 |
| 17 | 15 | 2,315,612 | 134,826 |
| 18 | 17 | 1,898,571 | 131,225 |
| 19 | 53 | 5,958,230 | 382,758 |
| 20 | 29 | 3,372,835 | 204,520 |
| 21 | 125 | 16,782,546 | 1,051,101 |
| Total | 635 | 72,118,026 | 4,363,786 |
Table 4.
Gas distribution costs analysis—results (PLN).
| City | Savings—Changing Contracted Capacity | Savings—Change to W-4 | Savings—Change to W-5 | Total Savings |
|---|---|---|---|---|
| 1 | 0 | 0 | 0 | 0 |
| 2 | 35,046 | 1395 | 1145 | 37,586 |
| 3 | 2935 | 0 | 0 | 2935 |
| 4 | 11,682 | 2532 | 0 | 14,214 |
| 5 | 7788 | 0 | 0 | 7788 |
| 6 | 30,571 | 0 | 0 | 30,571 |
| 7 | 6171 | 0 | 0 | 6171 |
| 8 | 13,479 | 5285 | 0 | 18,764 |
| 9 | 13,839 | 5589 | 0 | 19,428 |
| 10 | 5991 | 73 | 0 | 6064 |
| 11 | 7069 | 0 | 0 | 7069 |
| 12 | 19,063 | 2237 | 0 | 21,300 |
| 13 | 19,425 | 0 | 0 | 19,425 |
| 14 | 10,244 | 0 | 0 | 10,244 |
| 15 | 51,730 | 1104 | 0 | 52,834 |
| 16 | 80,576 | 10,392 | 0 | 90,968 |
| 17 | 1618 | 2631 | 0 | 4249 |
| 18 | 24,862 | 1892 | 0 | 26,753 |
| 19 | 60,207 | 11,525 | 0 | 71,733 |
| 20 | 23,484 | 1510 | 1918 | 26,911 |
| 21 | 93,277 | 12,910 | 2614 | 108,801 |
| Total | 519,057 | 59,076 | 5677 | 583,810 |
Table 5.
Electricity distribution costs analysis including participation in an energy cooperative.
| City | Gross Distribution Cost (PLN) | Stage 1 Savings—Results of Costs Analysis | Stage 2 Savings—Results of Participation in an Energy Cooperative | Total | |||
|---|---|---|---|---|---|---|---|
| (PLN) | (%) | (PLN) | (%) | (PLN) | (%) | ||
| (1) | (2) | (3) | (4) | (5) | (6) | (7) | |
| 1 | 1,582,786 | 331,983 | 21% | – | – | 331,983 | 21% |
| 2 | 4,211,311 | 405,174 | 10% | – | – | 405,174 | 10% |
| 3 | 1,576,171 | 274,941 | 17% | – | – | 274,941 | 17% |
| 4 | 574,785 | 50,501 | 9% | – | – | 50,501 | 9% |
| 5 | 4,397,902 | 518,443 | 12% | – | – | 518,443 | 12% |
| 6 | 488,716 | 125,403 | 26% | – | – | 125,403 | 26% |
| 7 | 730,786 | 150,534 | 21% | – | – | 150,534 | 21% |
| 8 | 774,971 | 105,033 | 14% | – | – | 105,033 | 14% |
| 9 | 303,690 | 135,150 | 45% | 127,872 | 42% | 263,022 | 87% |
| 10 | 100,013 | 9281 | 9% | 72,144 | 72% | 81,425 | 81% |
| 11 | 450,864 | 132,653 | 29% | 211,145 | 47% | 343,798 | 76% |
| 12 | 7,032,177 | 1,318,820 | 19% | – | – | 1,318,820 | 19% |
| 13 | 280,736 | 66,515 | 24% | 163,367 | 58% | 229,882 | 82% |
| 14 | 486,988 | 71,184 | 15% | 320,393 | 66% | 391,577 | 80% |
| 15 | 1,067,264 | 204,567 | 19% | – | – | 204,567 | 19% |
| 16 | 378,699 | 63,567 | 17% | 265,750 | 70% | 329,317 | 87% |
| 17 | 242,014 | 28,695 | 12% | 183,513 | 76% | 212,208 | 88% |
| 18 | 338,222 | 23,790 | 7% | 248,571 | 73% | 272,361 | 81% |
| 19 | 898,081 | 710 | 0% | – | – | 710 | 0% |
| 20 | 367,330 | 55,176 | 15% | 243,118 | 66% | 298,294 | 81% |
| 21 | 404,005 | 80,698 | 20% | 250,803 | 62% | 331,501 | 82% |
| 22 | 3,955,790 | 859,347 | 22% | – | – | 859,347 | 22% |
| 23 | 518,937 | 54,657 | 11% | – | – | 54,657 | 11% |
| 24 | 3,000,791 | 344,130 | 11% | – | – | 344,130 | 11% |
| 25 | 528,835 | 45,428 | 9% | 400,257 | 76% | 445,685 | 84% |
| Total | 34,691,865 | 5,455,670 | 16% | 2,486,931 | 7% | 7,943,311 | 23% |
Publisher’s Note: MDPI stays neutral with regard to jurisdictional claims in published maps and institutional affiliations. |
© 2021 by the authors. Licensee MDPI, Basel, Switzerland. This article is an open access article distributed under the terms and conditions of the Creative Commons Attribution (CC BY) license (https://creativecommons.org/licenses/by/4.0/).
Share and Cite
MDPI and ACS Style
Czakon, W.; Mucha-Kuś, K.; Sołtysik, M. Coopetitive Platform: Common Benefits in Electricity and Gas Distribution. Energies 2021, 14, 7113. https://0-doi-org.brum.beds.ac.uk/10.3390/en14217113
AMA Style
Czakon W, Mucha-Kuś K, Sołtysik M. Coopetitive Platform: Common Benefits in Electricity and Gas Distribution. Energies. 2021; 14(21):7113. https://0-doi-org.brum.beds.ac.uk/10.3390/en14217113
Chicago/Turabian StyleCzakon, Wojciech, Karolina Mucha-Kuś, and Maciej Sołtysik. 2021. "Coopetitive Platform: Common Benefits in Electricity and Gas Distribution" Energies 14, no. 21: 7113. https://0-doi-org.brum.beds.ac.uk/10.3390/en14217113
Note that from the first issue of 2016, this journal uses article numbers instead of page numbers. See further details here.