Article

Solid Digestate—Physicochemical and Thermal Study

by
Krzysztof Dziedzic
1,*,
Bogusława Łapczyńska-Kordon
2,
Michał Jurczyk
3,*,
Marta Arczewska
4,
Marek Wróbel
2,
Marcin Jewiarz
2,
Krzysztof Mudryk
2 and
Tadeusz Pająk
3
1
R&D Department, Cheminstal S.A., Wyrska 15a, 43-175 Łaziska Górne, Poland
2
Department of Mechanical Engineering and Agrophysics, University of Agriculture in Krakow, 120 Balicka St., 30-149 Kraków, Poland
3
Department of Power Engineering and Environmental Protection, AGH University of Science and Technology, 30 Adama Mickiewicza Al., 30-059 Krakow, Poland
4
Department of Biophysics, Faculty of Environmental Biology, University of Life Sciences in Lublin, 13 Akademicka St., 20-950 Lublin, Poland
*
Authors to whom correspondence should be addressed.
Submission received: 3 September 2021 / Revised: 22 October 2021 / Accepted: 27 October 2021 / Published: 2 November 2021
(This article belongs to the Special Issue Biomass Pretreatment and Optimisation of Biofuel Production Processes)

Abstract

:
Biogas production is an important component of sustainable energy management. In addition to energy-rich biogas, this process also generates solid waste in the form of digestate. The management of this stream has been problematic for many years. One promising method of utilizing this fraction seems to be incineration under controlled conditions. This paper presents an analysis of mixtures of different digestates to assess their suitability for incineration. Four digestates based on corn silage CS and apple pomace AP were used as test fuel. The ultimate and proximate analysis showed that this fuel deviates from the standards accepted for pure biomass, but was found in other fuels, especially those treated as waste. This materials can be a valuable source of energy, but combustion needs be undertaken in special units. Moisture content of investigated digestate-type ranges from 11.9–12.2% and ash content ranges from 8.2% to 11.6%. This could lead to ash sintering and slugging problems, which are problematic, especially because it is not designed for such types of fuel boilers. The study showed correlations between the elemental composition and the course of basic combustion processes. The ultimate analysis of all mixtures shows that the shares of major elements looks similar. These results are connected with the thermogravimetric analysis TGA, which shows similar thermal decomposition for all four mixtures. It is valuable information because, in this special case, when we have mixtures of corn silage and apple pomace originated digestates, the changes in the ratio CS:AP will not affect combustion significantly.

1. Introduction

The process of anaerobic digestion of organic waste produces a gas mixture called “biogas”, composed of approximately 50% methane (CH4) and 50% carbon dioxide (CO2). This process also generates waste in the form of a digestate [1,2]. The resulting biogas after purification is most often used at the place of its generation to produce electricity with the use of internal combustion engines [3]. An average biogas plant with an installed capacity of 500 kW produces about 1000 tons of dry matter of digestate per year [4]. The digestate consists of a liquid and a solid fraction. The liquid fraction contains a high proportion of nutrients, while the solid fraction has properties that have a positive effect on the formation of humus. Due to the properties of the digestate, thus far, it has been used mainly for fertilizing purposes. This is often combined with the use of biocarbon produced from other agricultural products and residues [5,6]. Due to the construction of numerous biogas plants in Poland, in recent years—from 8 in 2008 to 93 in 2016 (the Energy Regulatory Office), there has also been a significant increase in the mass of digestate to be managed. Currently, the dry amount of digestate produced is estimated at 172,000 tons per year. This amount of digestate cannot be managed locally. The research conducted thus far [7] shows that it is economically unprofitable to transport the digestate over a distance of more than 10 km from the place of its formation if it is to be used for fertilization. Conversely, the liquid and solid fractions of the digestate contain a high level of nitrogen, both in organic and inorganic form [8]. This limits the possibility of dosing the digestate to the soil in accordance with the European Nitrates Directive (1991) [9], which sets the annual nitrogen dose limit at the level of 170 kg per hectare of plantation. This limits the profits of agricultural biogas plants using slurry (the main source of nitrogen in the post-fermentation) as an inhibitor of the methane fermentation process. They are forced to pay the recipient for the disposal of the resulting post-fermentation mass or to lease sufficiently large areas in order to distribute the digestate while maintaining the limit fertilizer doses. Therefore, an interesting alternative seems to be the possibility of using the digestate as a solid biofuel, e.g., in the form of pellets or briquettes. In order to reduce transport costs, the digestate could be dried directly on site. The waste heat generated in the biogas plant can be used to dry the digestate such that the dry matter content in the finished product is 80–90%. The material, after agglomeration into pellets or briquettes, would be easier to store and transport. The ash generated in the combustion process (after being cleaned of heavy metals) can be used for fertilization [10].
The possibility of using digestate for energy purposes was presented in research [11]. The authors tested two mixtures of digestate in the form of pellets. In this research, they determined the course of the process, the emission of pollutants into the environment during digestate combustion. The possibility of burning the digestate was analyzed [12] in order to increase the efficiency of the system associated with a biogas plant. The possibility of using fermented manure for the production of thermal energy was presented in work [13]. It has been proposed to use the fermented biomass for energy purposes after prior drying and pelletizing [14]. In their research, the authors presented the application of the produced fuel, burning it in a grate boiler and comparing the obtained efficiency with a model wood pellet and meeting the requirements of ENplus, A1 quality class. Further studies in the field of digestate combustion are described in the literature [15,16,17].
The objectives of this work were to verify whether digestate from biogas plants is suitable as a solid biomass fuel. This was accomplished by comparing the composition of the four digestate test fuels based on mixing corn silage CS and apple pomace AP. The conducted research will allow understanding of the advantages of the solid biomass as fuel and help create more precise mathematical models.

2. Materials and Methods

2.1. Test Fuel

Four digestates based on corn silage CS and apple pomace AP were used as test fuel. Feedstock composition is presented in Table 1.
The origin of all digestates were laboratory installations for biogas production located in Poland, Krakow at Agricultural University (Department of Mechanical Engineering and Agrophysics). The samples underwent mechanical dewatering according to the methodology contained in [18]. All samples for analysis were prepared according to EN ISO 14780 [19]. The methods applied for the analysis are presented in Table 2.

2.2. Fuel Characterization Analyses

The moisture content (Mad) before pyrolysis was determined based on EN ISO 18134-3 [20]. The oven drying method was used: material (1 g sample) was dried (SLN 160, Pol-Eko, Wodzisław Śląski, Poland) at temperature 105 °C. The moisture content was obtained as a difference between weight before and after drying [20].
The ash content (Ad) was obtained using EN ISO 18122:2016-01 [21] by calculating weight of the residue after combustion (SNOL 3/1100, Labindex, Warsaw, Poland) in an air atmosphere, under controlled temperature and time (550 ± 10 °C). The weight of the residual ash was compared with the initial weight [21].
The volatile matter content (Vd) was obtained using EN ISO 18123:2016-0 [22]. Sample used in the analysis was heated with ambient air at 900 ± 10 °C for 7 min in furnace SNOL 3/1100. The percentage of volatile matter was obtained by calculating the loss in weight after deducting the loss in weight due to moisture [22].
Gross calorific value (higher heating value, HHV) was obtained using EN ISO 18125:2017-07 [23] in an isoperibol calorimeter (C 6000 Isoperibol, IKA). The calorific value was obtained using equations specified in the standard [23] and introduced into the software of the device. Net calorific value (lower heating value, LHV) was obtained using the relation between the heat of combustion and gross calorific value. The calorific value due to the moisture content was reduced by the value of the heat used for its evaporation. This parameter was obtained using a software operation of the calorimeter, according to equations in [23].
The specific density (SD) was determined according to EN ISO 17828:2016-02 [24]. The absolute density (AD) was determined using laboratory’s own procedure and ASTM B923—16 standard [25] with helium piknometer apparatus (AccuPyc 1340, Micromeritics, Syl&Ant Instruments, USA). Porosity, p of the material is estimated according to the following equation:
p % = SD AD · 100

2.3. Chemical Analyzes

The analysis (Cd, Hd, Nd, Sd) was made using the CHNS analyzer (Vario EL Cube, Elementar, Germany) by using standards [26,27]. Total Od was obtained according to DIN 51733:2008-12 [28]. The total contents of heavy metals concentration in tested materials were determined according to [29,30].

2.4. Fuel Value Index

Based on data from proximate and ultimate analysis of the investigated materials, fuel value index (FVI) was introduced to determine their suitability for energy production. This parameter includes values obtained in the proximate analysis to establish the energy effect of combustion per specific density of the material. Calculations were made using equation [31]:
FVI = HHV · SD A d · M ad
where: HHV—higher heating value, J g−1, SD—specific density, g cm−3, Ad—ash content in dry state, %, Mad—moisture content, %

2.5. Thermogravimetric Analysis

Combustion properties of samples were analyzed by a thermogravimetric analyzer (STA 409 PG Luxx, Netzsch, Krakow, Poland). The TG/DTG analysis was carried out in an air atmosphere with three heating rates (3, 10(+MS), 30 °C min−1) in a temperature range from 40 to 1100 °C. Thermogravimetric analyzer was connected with mass spectrometer (QMS Aeolos Netzsch, Krakow, Poland).

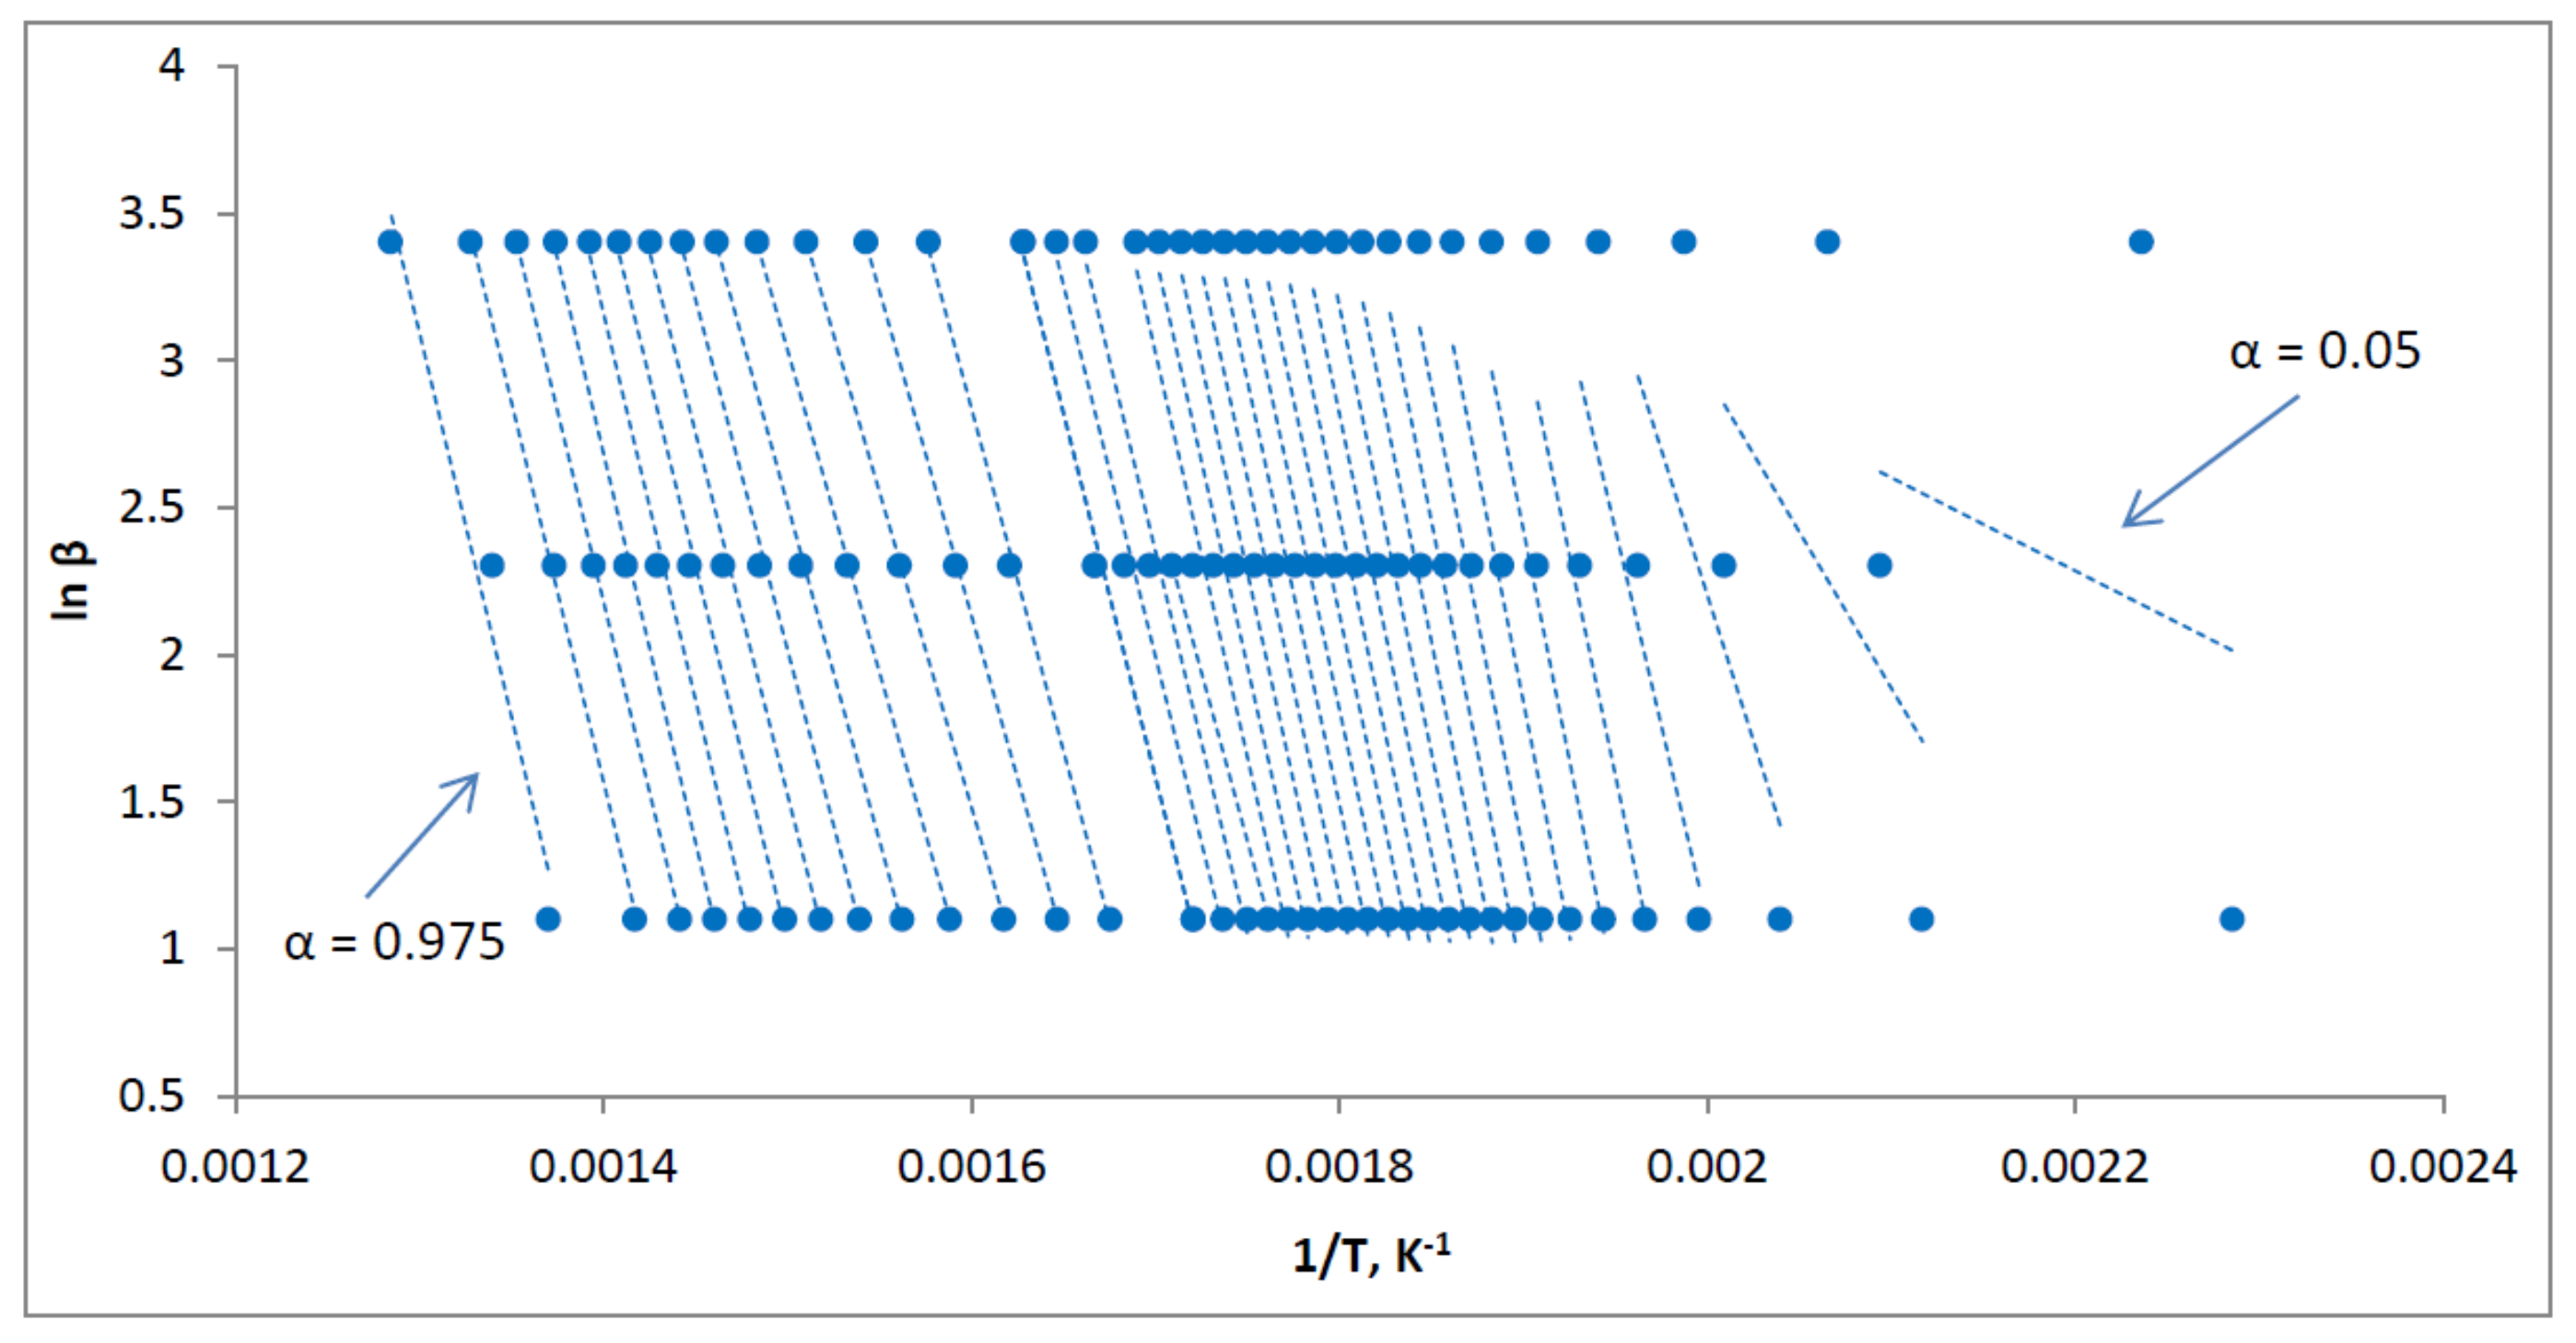
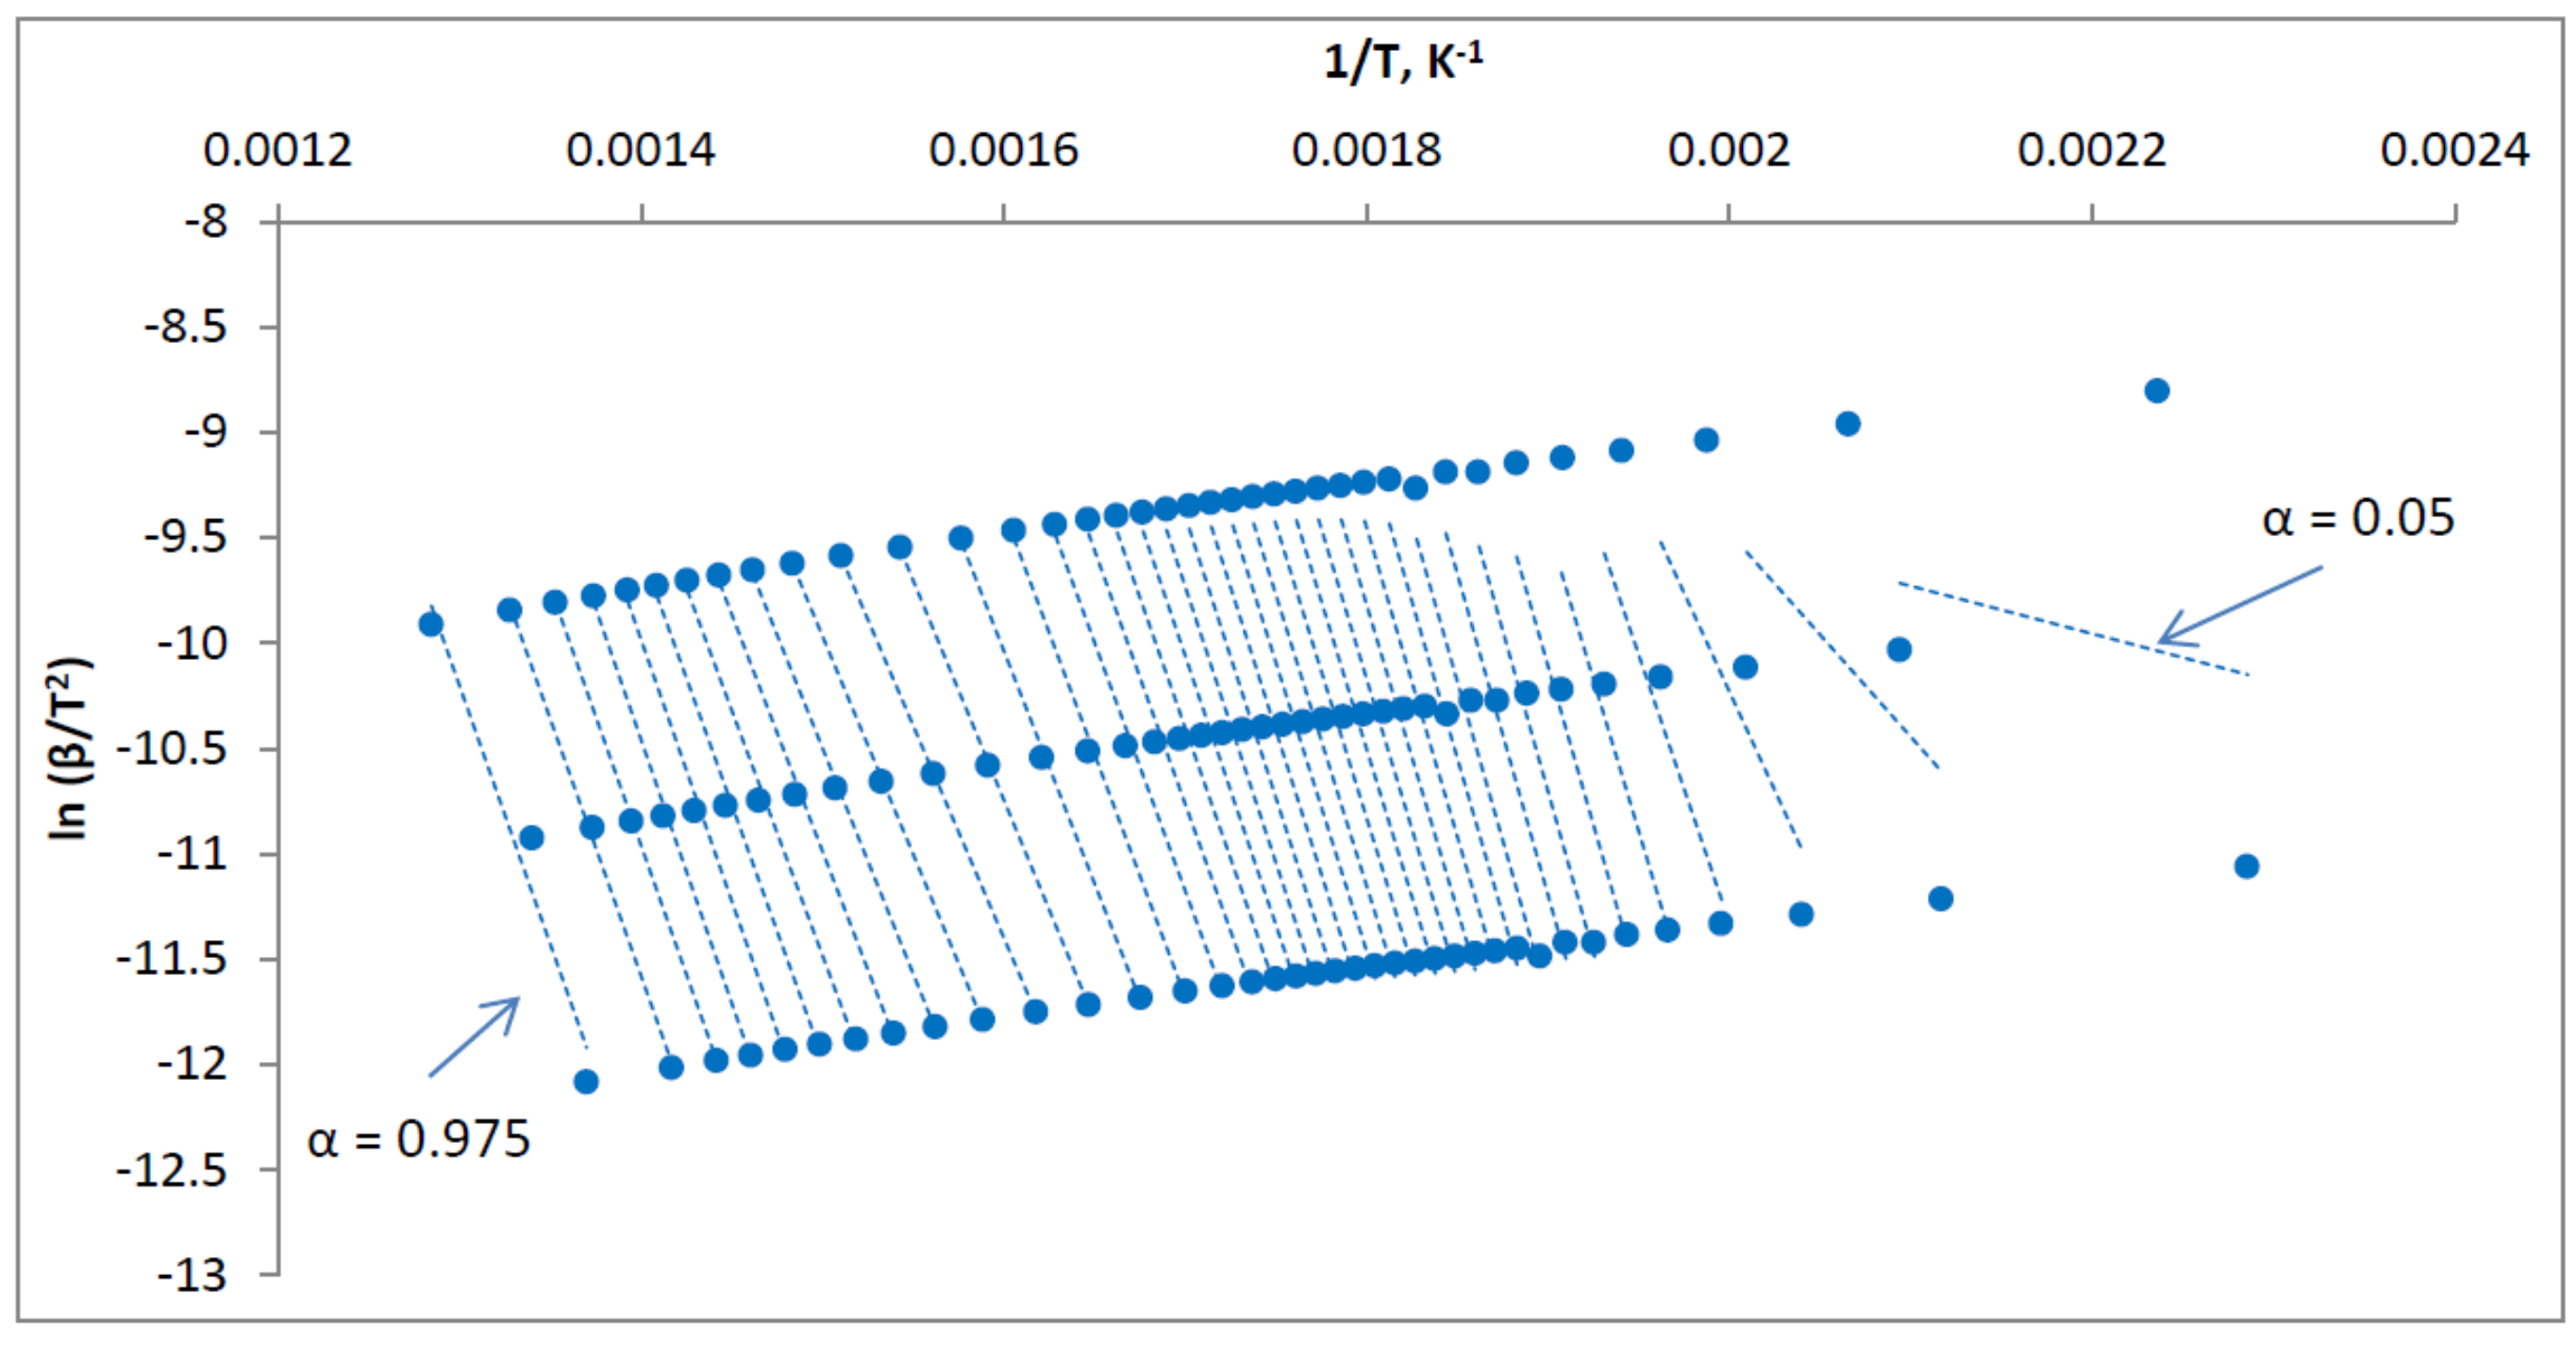
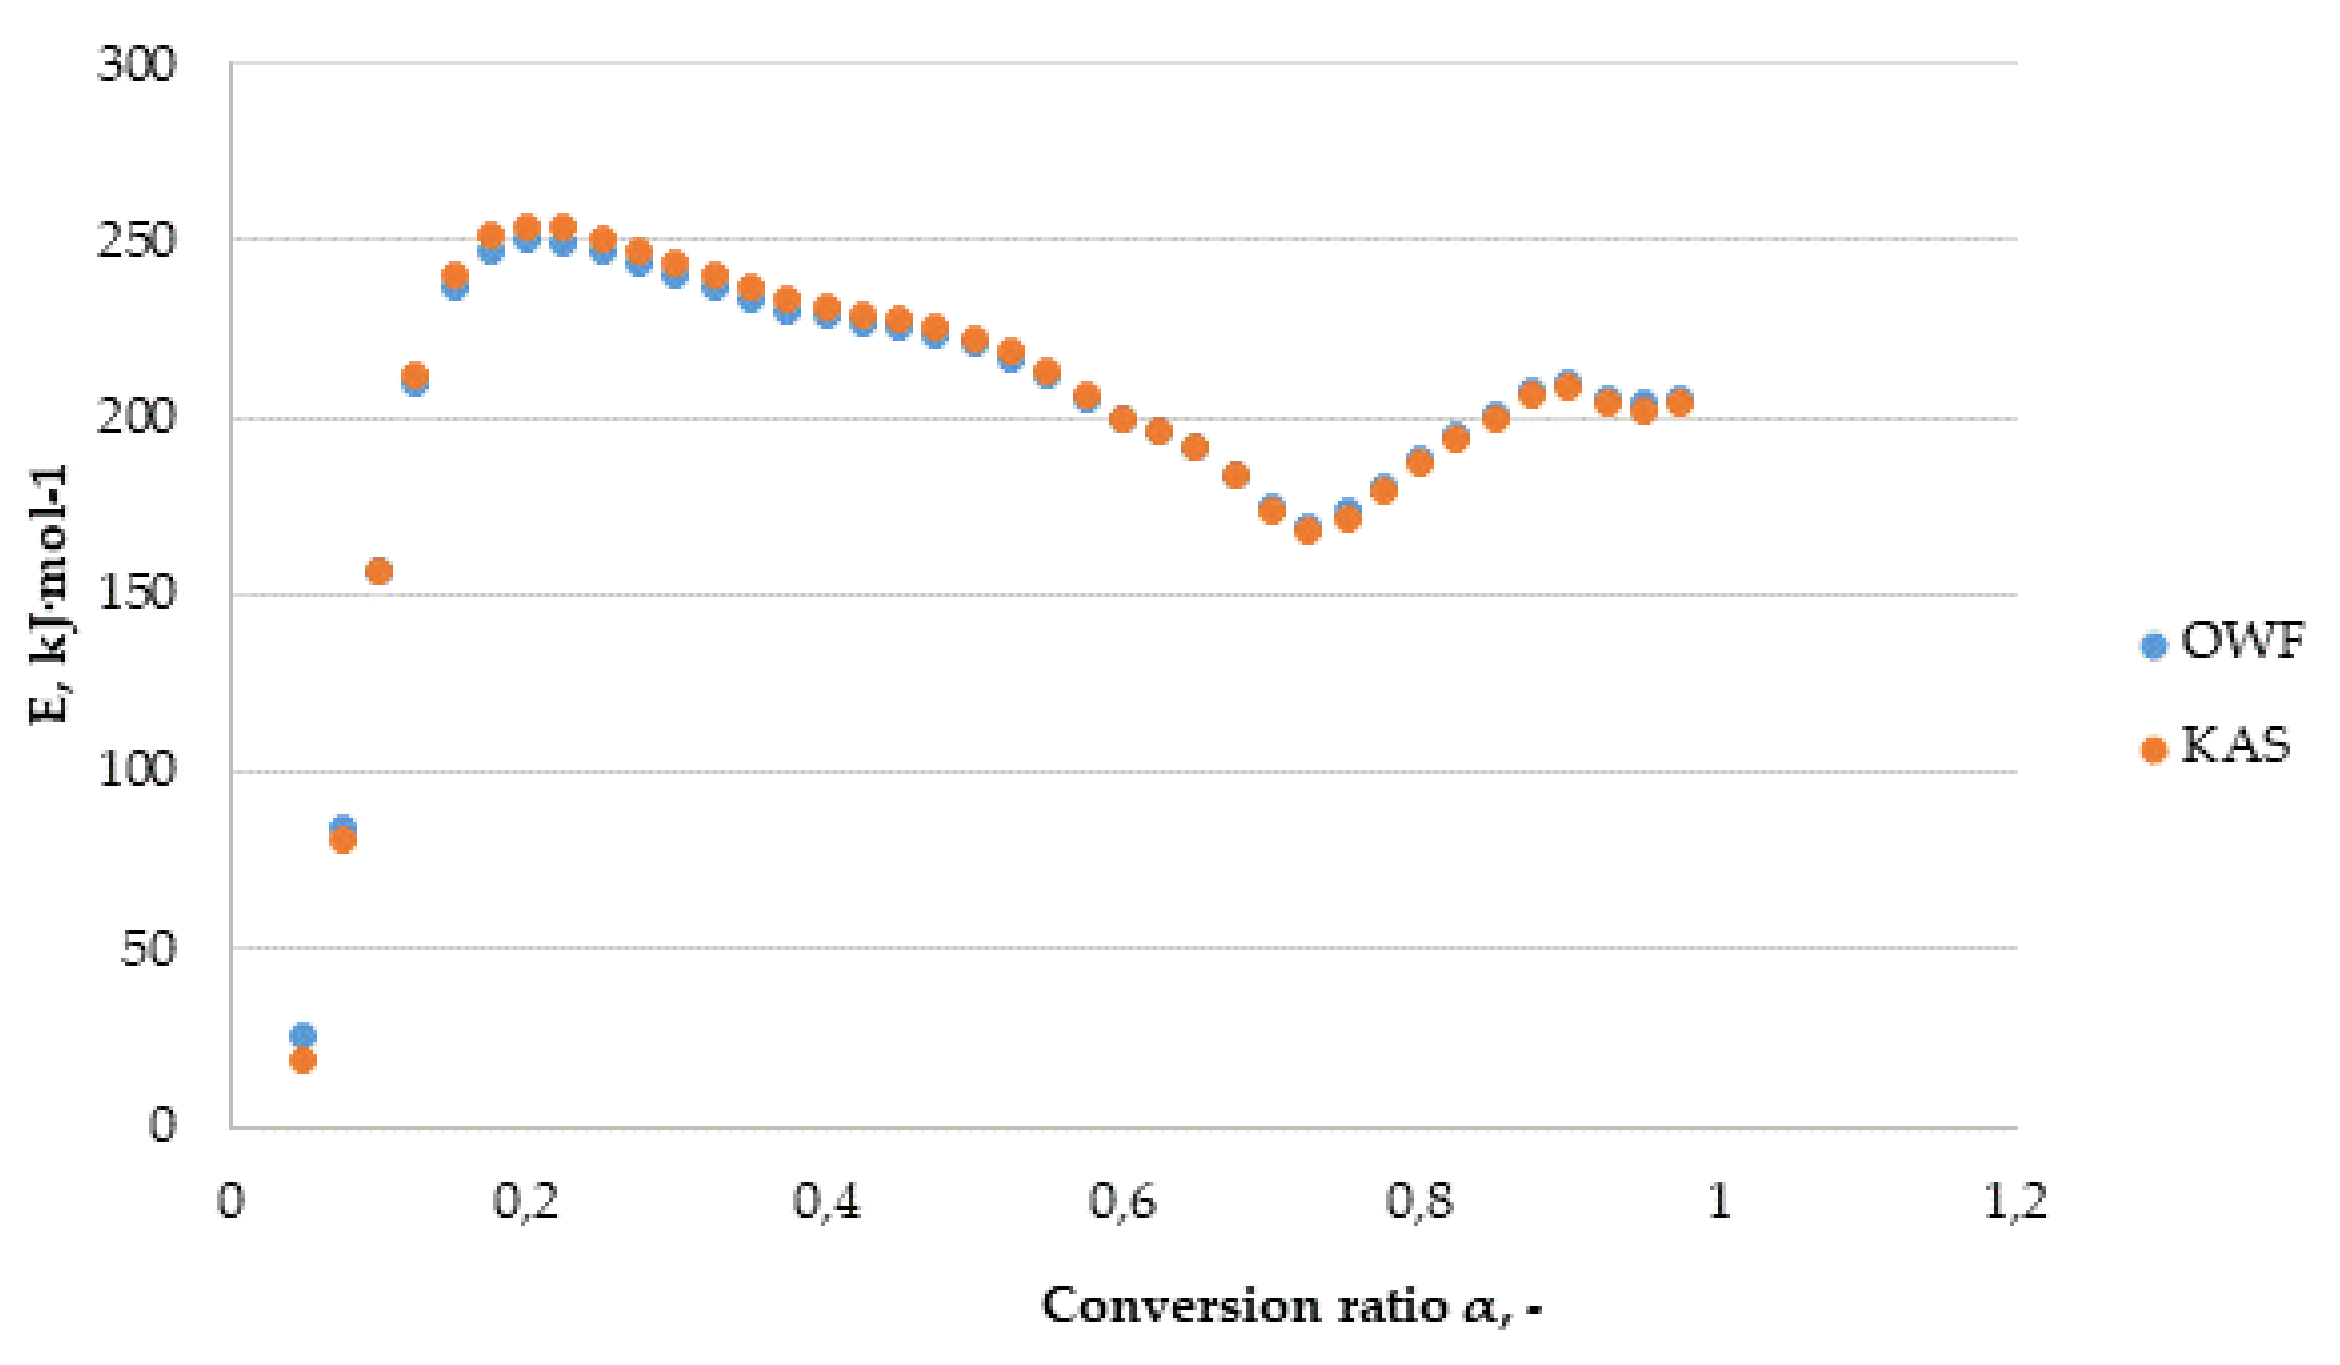
2.6. Calculations of Kinetic Parameters

Calculations of kinetic parameters were performed using the Ozawa-Wall-Flynn (OWF) [32,33] and Kissinger-Akahira-Sunose (KAS) [34,35] methods. This methodology assumes calculations of the activation energy and the pre-exponential factor using isoconversional methods, which is particularly recommended, and largely applies to the present case, for complex reactions in which there is a change in the reaction mechanism.

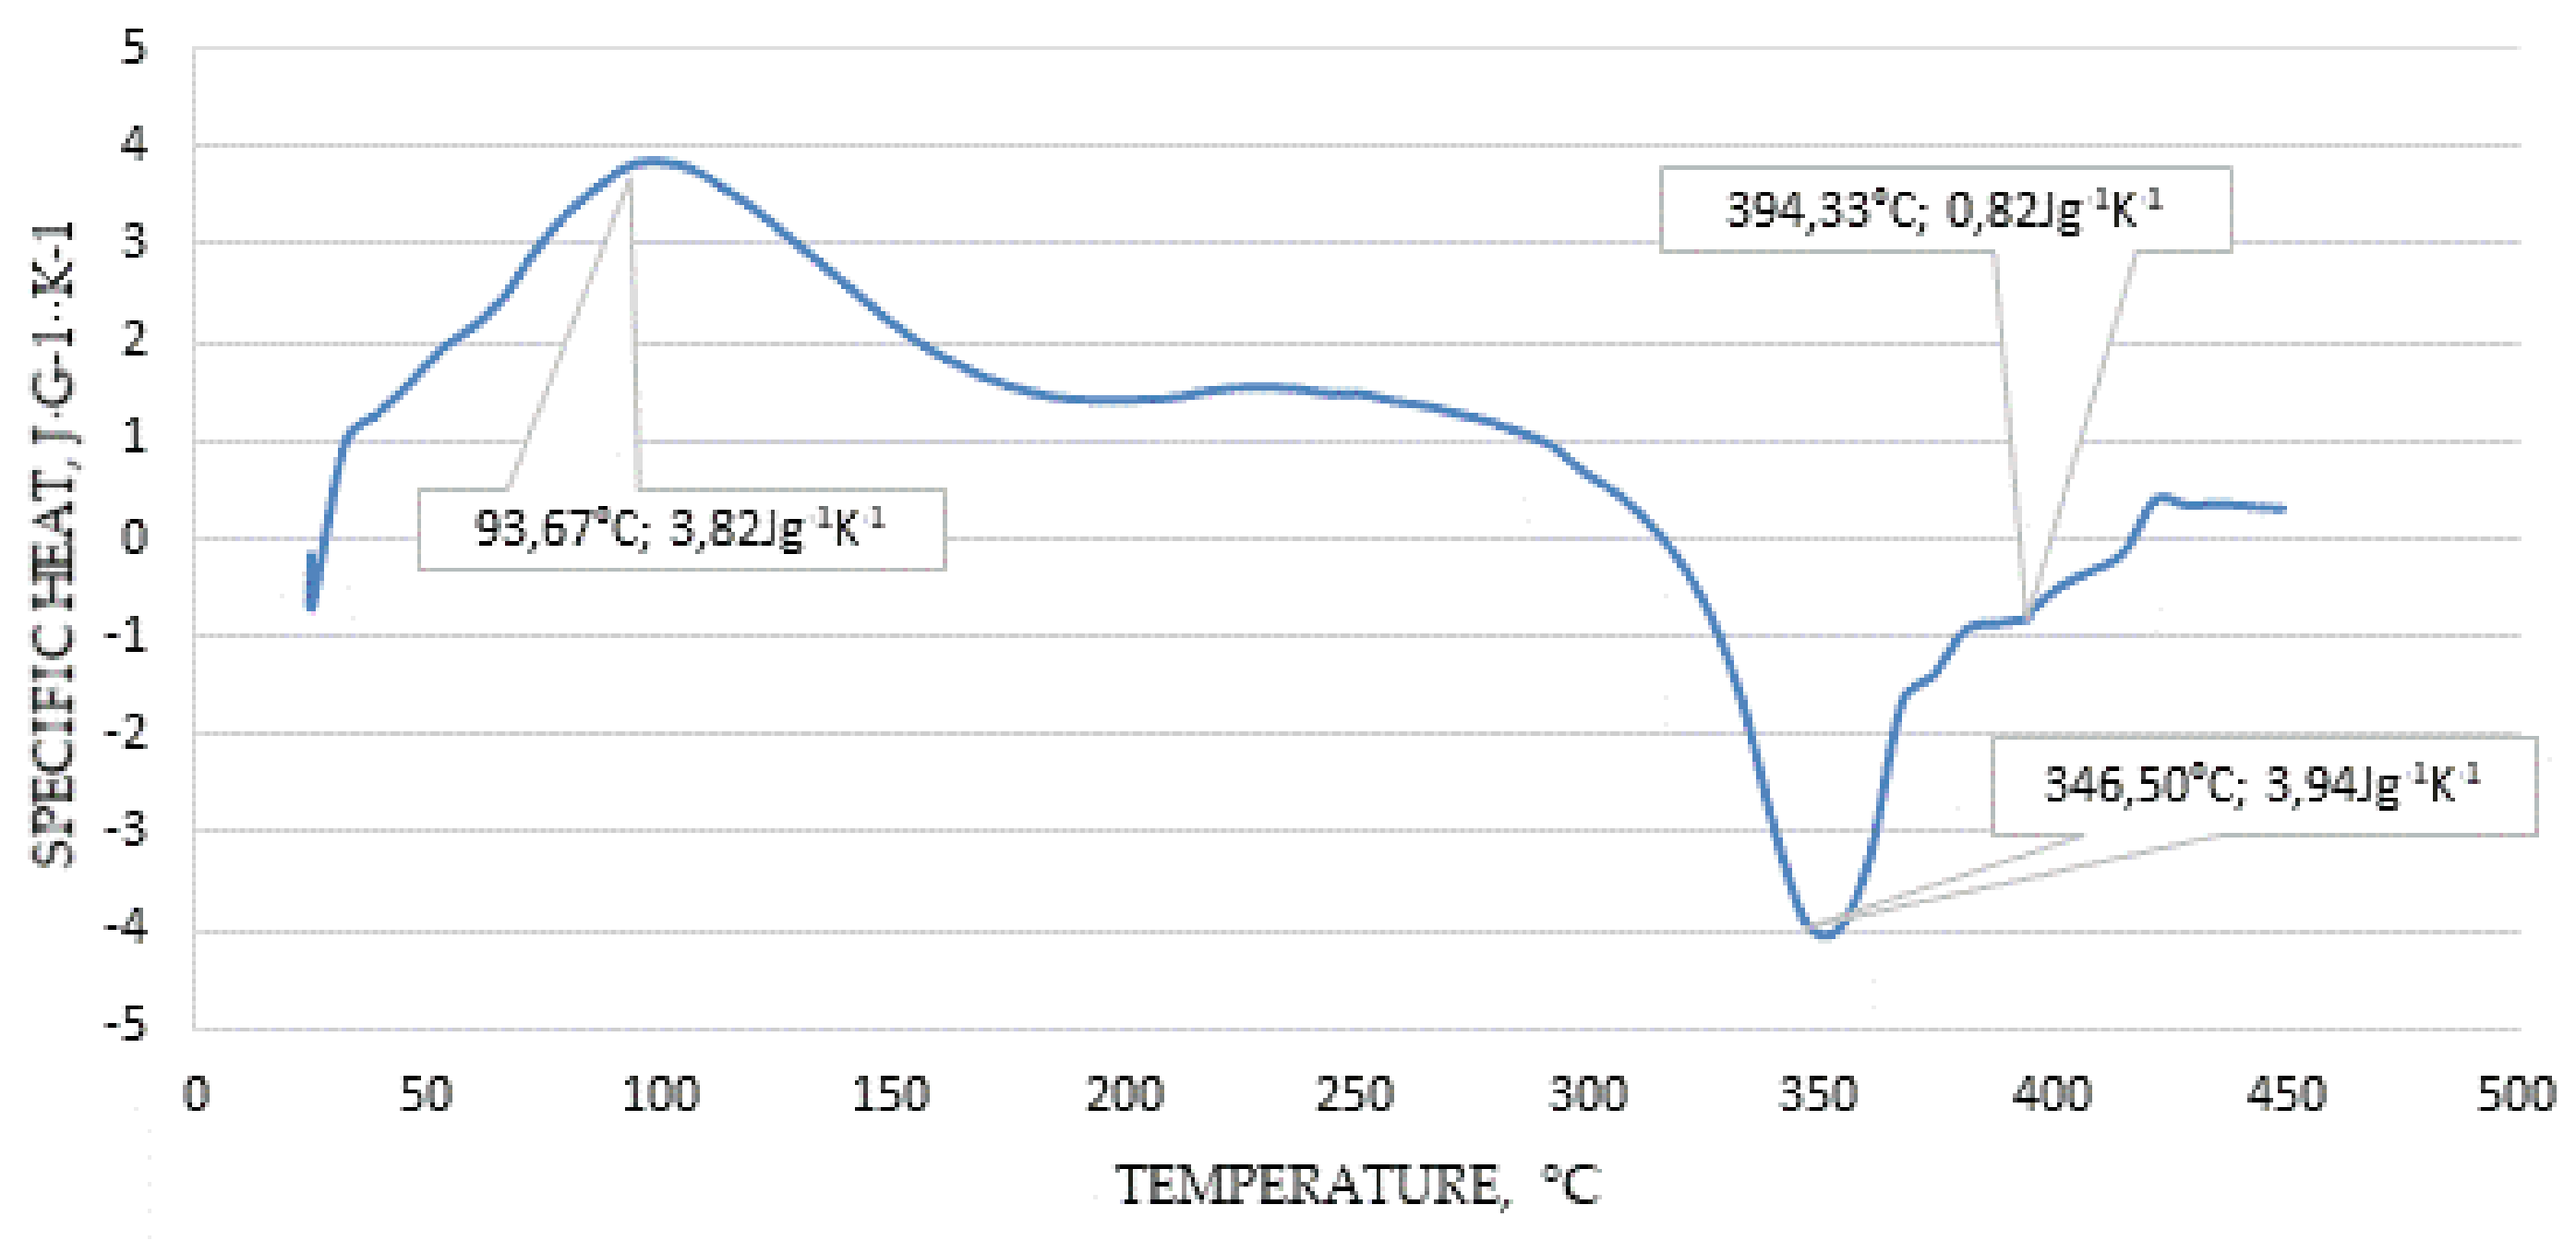
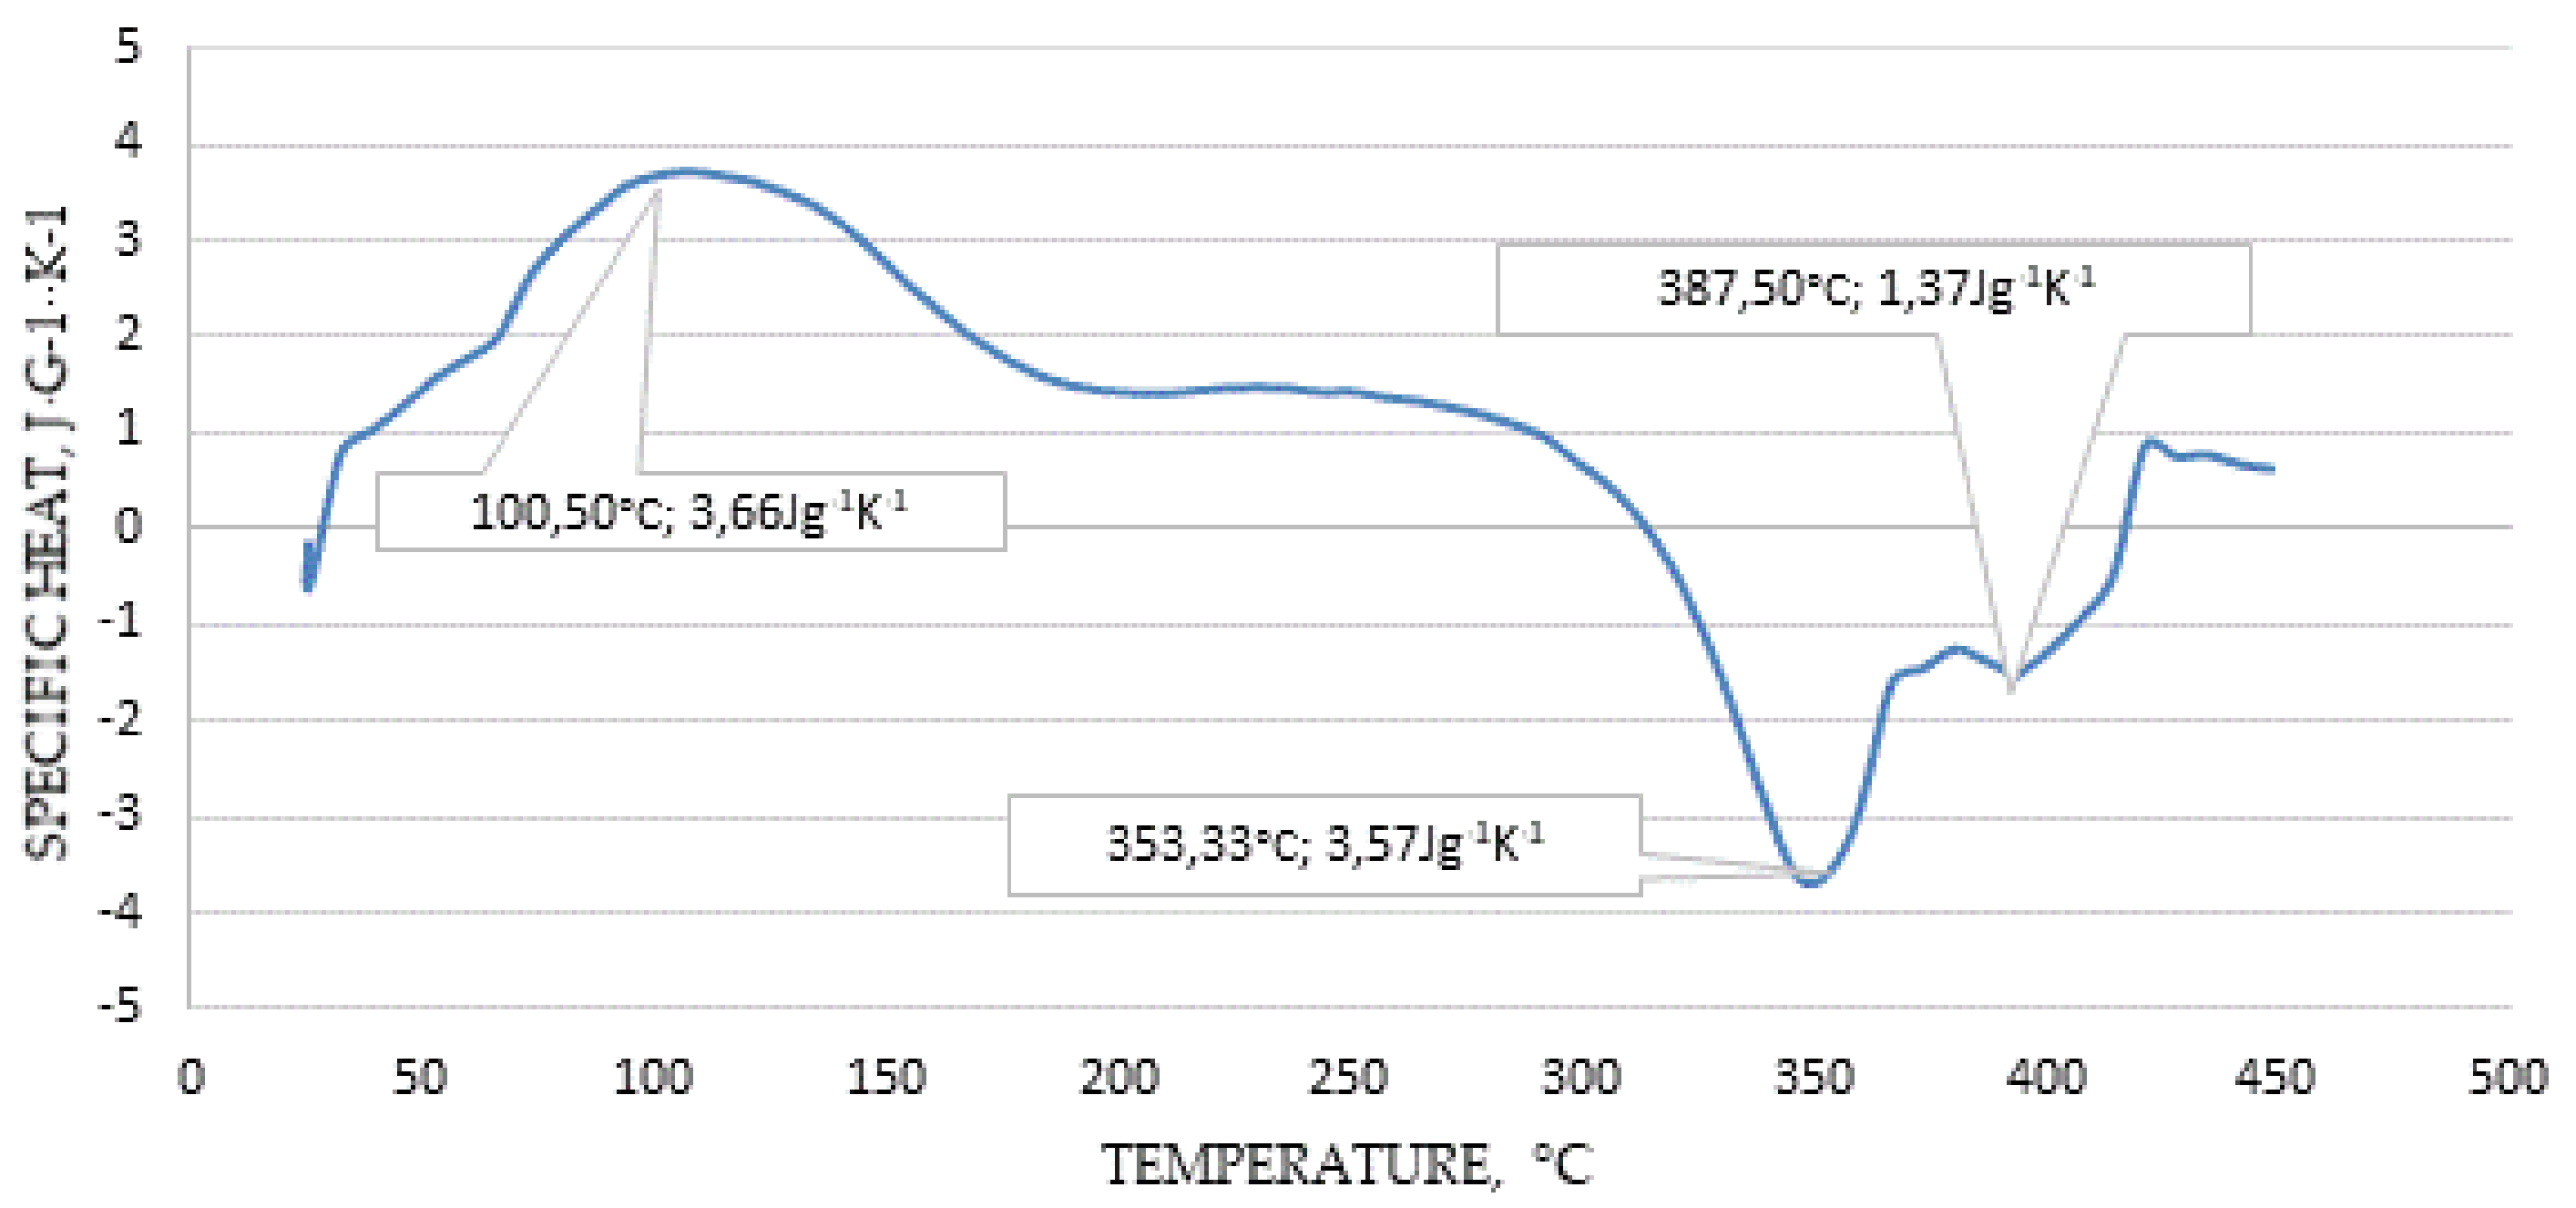
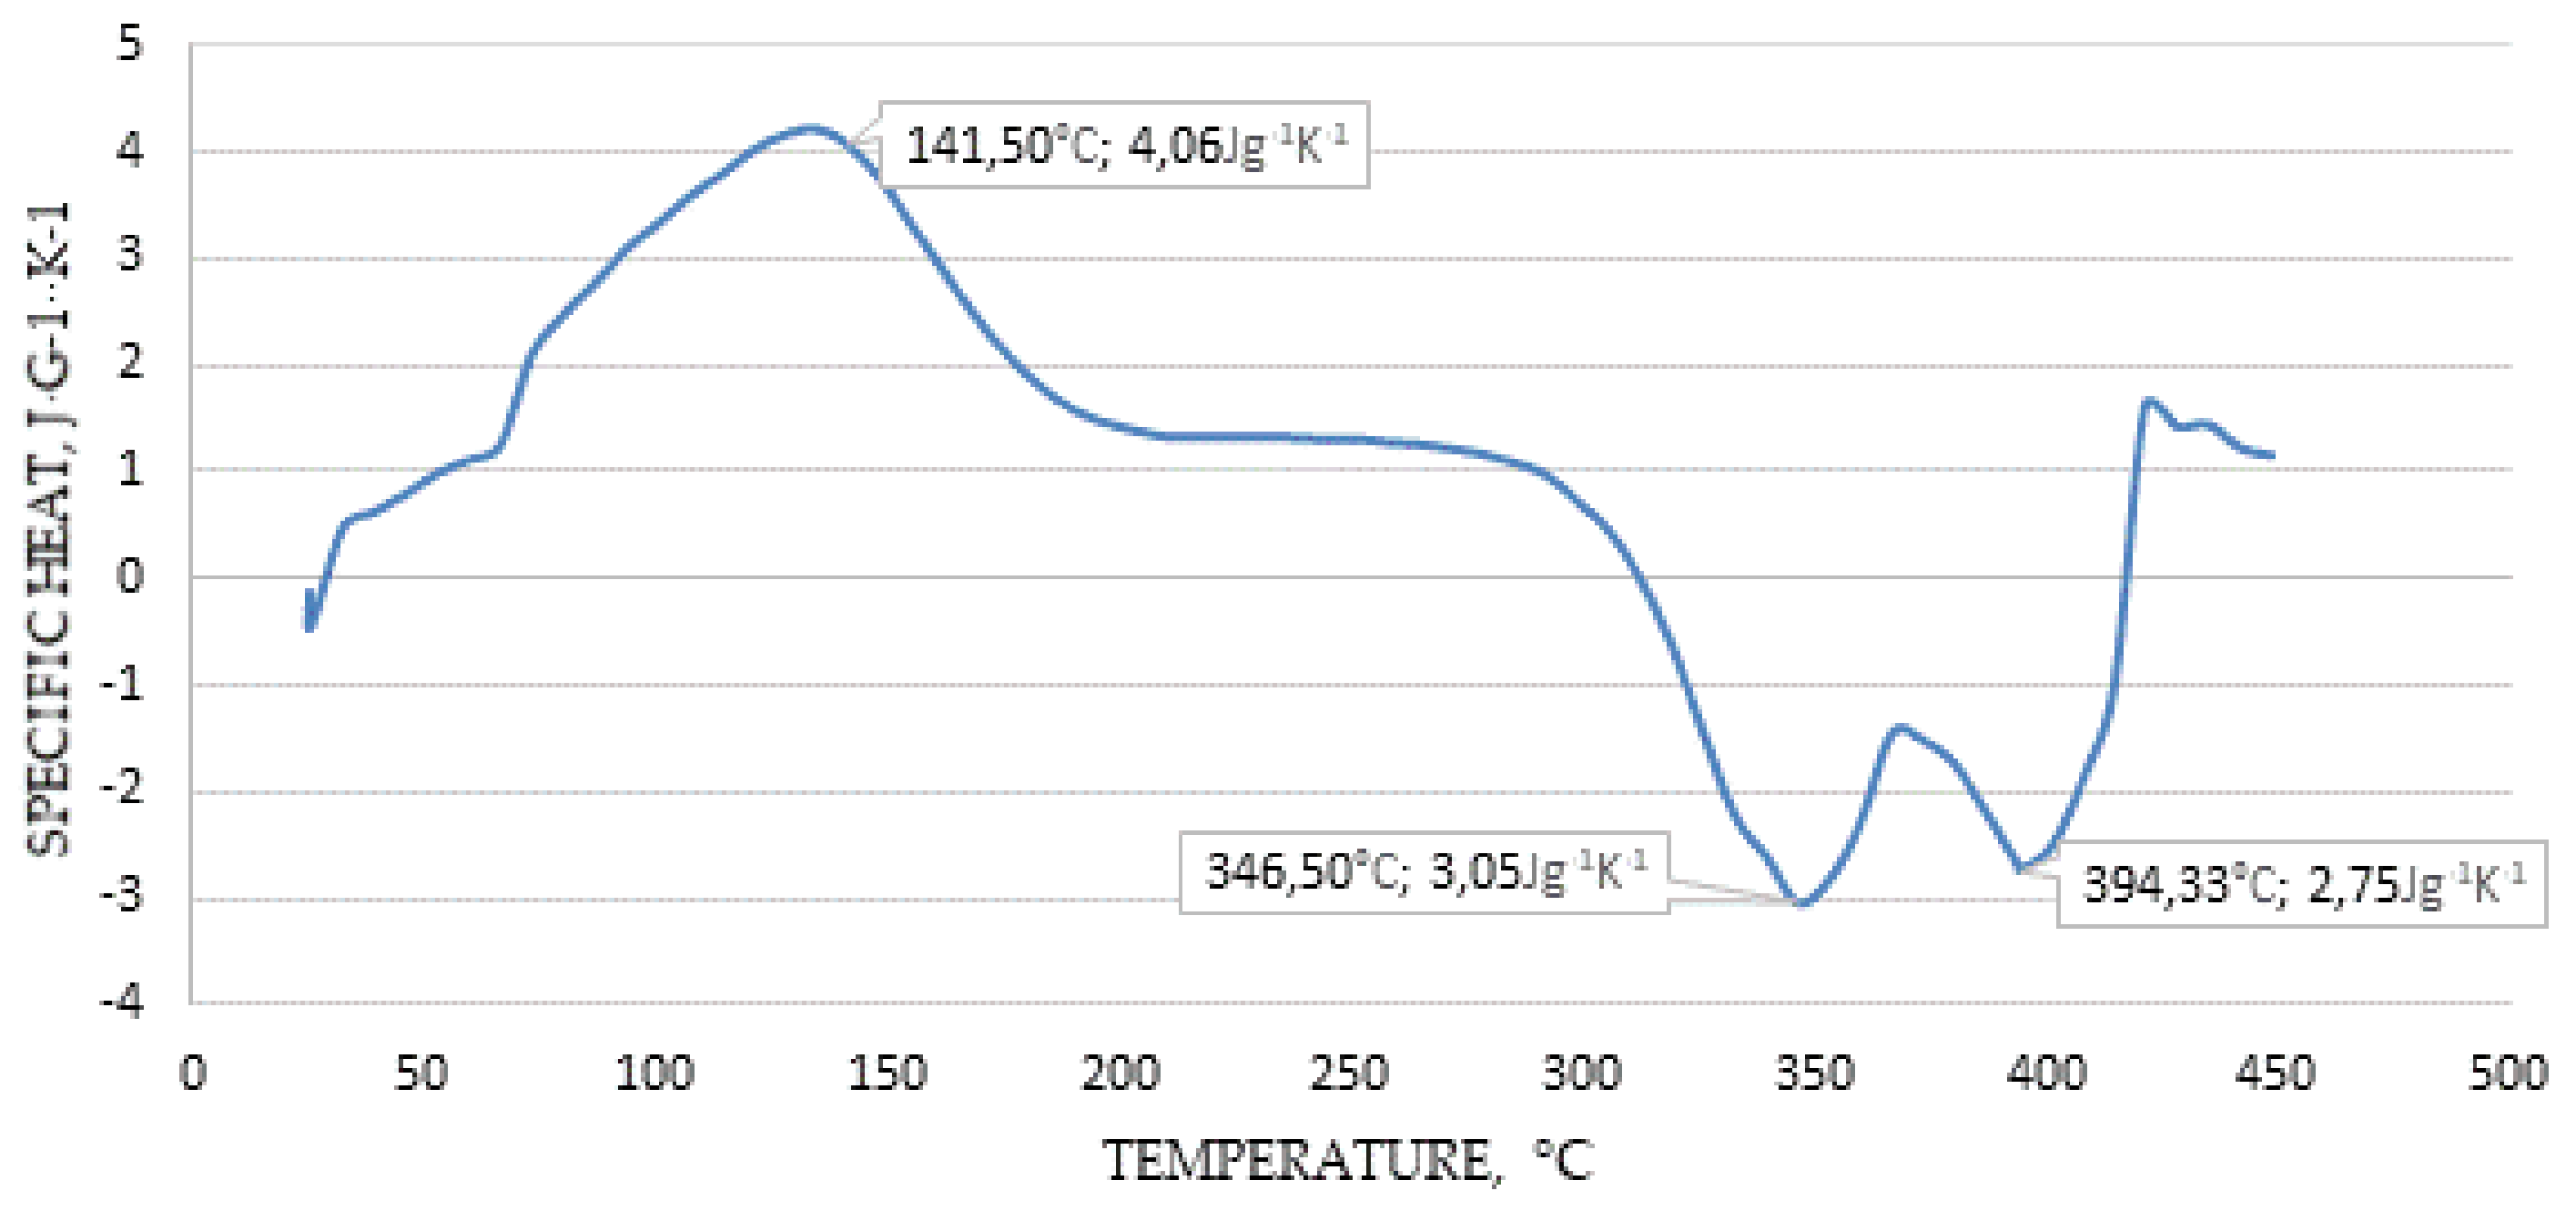
2.7. Differential Scanning Calorimetry

Differential scanning calorimetry (DSC) analysis was obtained using a DSC1 STAR instrument, Mettler Toledo. Experimental runs were performed under a dry nitrogen atmosphere with a gas flow rate of 50 mL min−1. The experiments were conducted in the temperature range of 25–500 °C at four different heating rates as 5, 10, 15, and 25 °C min−1. DSC scans were recorded against an empty crucible as a reference sample. The final thermogram of the samples were obtained after the baseline subtraction. Experiments were performed twice to ensure repeatability.
The conventional three-step technique for the determination of heat capacity was performed. Value of cp was measured on the basis of the difference in heat flow between a blank (empty crucible), a sample and a calibration substance (α-Al2O3 with purity over 99.9%) runs under identical conditions.
Measuring specific heat capacity cp
c p = HF · m sap m · HF sap · c p , sap
where: cp—specific heat capacity of samples, J g−1 K−1; msap—mass of reference materials (rm); HF—displacement difference on DSC curve between samples and rm; m—mass of samples, mg; cp,sap—specific heat capacity of rm. DSC processing software supporting the experiment has specific heat capacities of standard reference content, α-Al2O3.

3. Results and Discussion

3.1. Physical and Chemical Characteristics

Moisture content of investigated digestate-type ranged from 11.9–12.2% (Table 3). In the case of the examined digestate mixtures, the ash content ranged from 8.2 to 11.6%. The highest ash content (11.6%) was found in the mixture containing 75% of maize silage and 25% of apple pomace (Table 3). Such a high ash content most likely resulted from the technology of obtaining maize biomass for biogas production. Often, during the harvesting process, the maize is contaminated with mineral substances. The achieved values were significantly lower than studies conducted by [11], where the ash content exceeded 18% and [14], where the ash content exceeded 13%.
Content of volatile matter plays an important role, which affects the combustion process [31]. Data found in literature describes it as up to 2.5 times more volatile than coal, in terms of ignition and combustion [36], combustion of fuel content volatile matter, and release of flammable substances (low hydrocarbons, monocyclic aromatic hydrocarbons and CO), which are revealed by higher flames. Complete burnout of these products is provided by additional air [36,37]. In the case of the analyzed post-fermentation biomass mixtures, the volatile matter content ranged from 78.8% for the 75CS25AP sample to 89.8% for the 25CS75AP mixture.
The calorific values of the analyzed mixtures ranged from 15.34 (75CS25AP) to 18.41 MJ kg−1 (10CS90AP). At the same time, it was observed that the mixture with the lowest calorific value had the highest ash content. The increase in ash content reduced the calorific value and heat of combustion, as ash is the fuel ballast.
Specific density of all analyzed samples ranged from 0.82 to 0.89 g cm−3, which is higher than typical biomass fuels. The achieved values were significantly lower than studies conducted by [14], where the specific density was 1.26 g cm−3. Absolute density of analyzed samples reached between 1.53–1.56 g cm−3. Such results are typical for biomass pellets and similar to results presented in literature work [14].
The FVI for the 10CS90AP (173.80) was large for the 75CS25AP (105.90). The FVI results were similar to the results presented in the literature for wood biomass [38].
Table 4 presents the results of the elemental composition analysis of the examined mixtures of post-fermentation biomass.
Fuel properties can also be predicted by elemental composition. Generally, fuels with more carbon content are expected to release more energy per unit mass during combustion. A good quality fuel is therefore expected to have low O/C and H/C ratios. Table 4 shows that the H/C ratio of all analyzed samples is similar (0.14). The O/C ratio is in range from 0.66 to 0.73, which was slightly lower than the results presented in [39].
The carbon content in the analyzed biomass ranged from 44.4% to 45.9%, in research work [14], it was noted that the content of the carbon element in the examined digestates at the level of 32.2% was much lower than in the analyzed mixtures. This explains the lower value of the combustion heat of the examined post-fermentation materials noted by Pedrazi [14], which did not exceed 14.1%. A similar relationship can be observed in the case of hydrogen content. In the analyzed samples, it reached values ranging from 6.1% to 6.4%, which was a higher result than the data presented in the literature: 4.8% [14].
Organically bound oxygen is released from the fuel during thermal decomposition and partially covers the oxygen demand of the combustion process. The rest of the oxygen necessary for the combustion process is supplied through the air stream. The carbon element present in the biomass occurs in a partially oxidized form, which explains the lower value of the heat of combustion compared to fossil fuels, e.g., coal [38].
The nitrogen content in the tested biomass mixtures ranged from 0.9% (10CS90AP) to 1.5% (75CS25AP). Research conducted in Europe has shown that there is a logarithmic relationship between the formation of nitrogen oxides (NOx) during the combustion process and the N content of the fuel biomass. Moreover, the research showed an increase in nitrogen oxides formed during the combustion process, with an increase in the amount of air supplied to the combustion chamber [40].
Chlorine almost completely evaporates during the combustion process to form HCl, Cl2 and metal chlorides. As the temperature of the combustion process decreases, the alkaline chlorides condense on the surface of the fly ash. Then, part of Cl is bound to fly ash (40–85%), and the remainder, in the form of HCl, is a component of the flue gas. The chlorine content in the tested biomass mixtures, depending on the mixture, ranged from 0.29% (25CS75AP) to 0.36% (75CS25AP).
Sulfur, which is a component of biomass, forms during the combustion process from gaseous components of exhaust gases such as SO2 and SO3. In addition, metal sulphates are formed which, as in the case of metal chlorides, are combined with fly ash. The analysis showed that 40% to 90% of the sulfur contained in the fuel was combined with the ash and that the remainder was included in the exhaust gas. In the case of the examined digestates, the sulfur content did not exceed 0.2%.
Calcium, magnesium, potassium, sodium and phosphorus are the main elements of the ash formed after the combustion of biomass. Considering the fact that these components are extremely important for plant growth, ash after biomass combustion can be used as a potential fertilizer.
The content of calcium and magnesium increases the softening and melting point and ash flow. Sodium and potassium reduce these temperatures. In combination with sodium and potassium, silicon lowers the melting point of fly ash generated during the biomass combustion process. This process is important because it avoids sintering and melting of ash on the boiler grate, but it can lead to slag deposition on the boiler walls and heat exchanger [41].
In addition, chlorine and sulfur, as well as potassium and sodium, play major roles during the combustion process in the corrosion mechanism. These elements partially evaporate during the combustion process to form metal chlorides, which condense on the surface of the heat exchangers and react with the flue gases to form sulphates and release chlorine. Chlorine has been shown to have catalytic properties, which leads to active oxidation of the heat exchanger material, even at low temperatures (100–150 °C) [42,43]. Consequently, the lower the amounts of K and Na in the fuel, the better.
Heavy metals (e.g., Fe, Mn, Zn, Cd) are bound in the ash after the combustion process. An exception to this is mercury, which is partially atomized into the flue gas. From the point of view of ecology, it is important to reduce the concentration of Cd and Zn, which in the tested material did not exceed 0.01 and 8.47 mg·kg−1, respectively. It is possible to significantly reduce the concentration of these heavy metals and concentrate them in a small ash fraction, which can be separately collected and disposed of or used industrially [44,45].

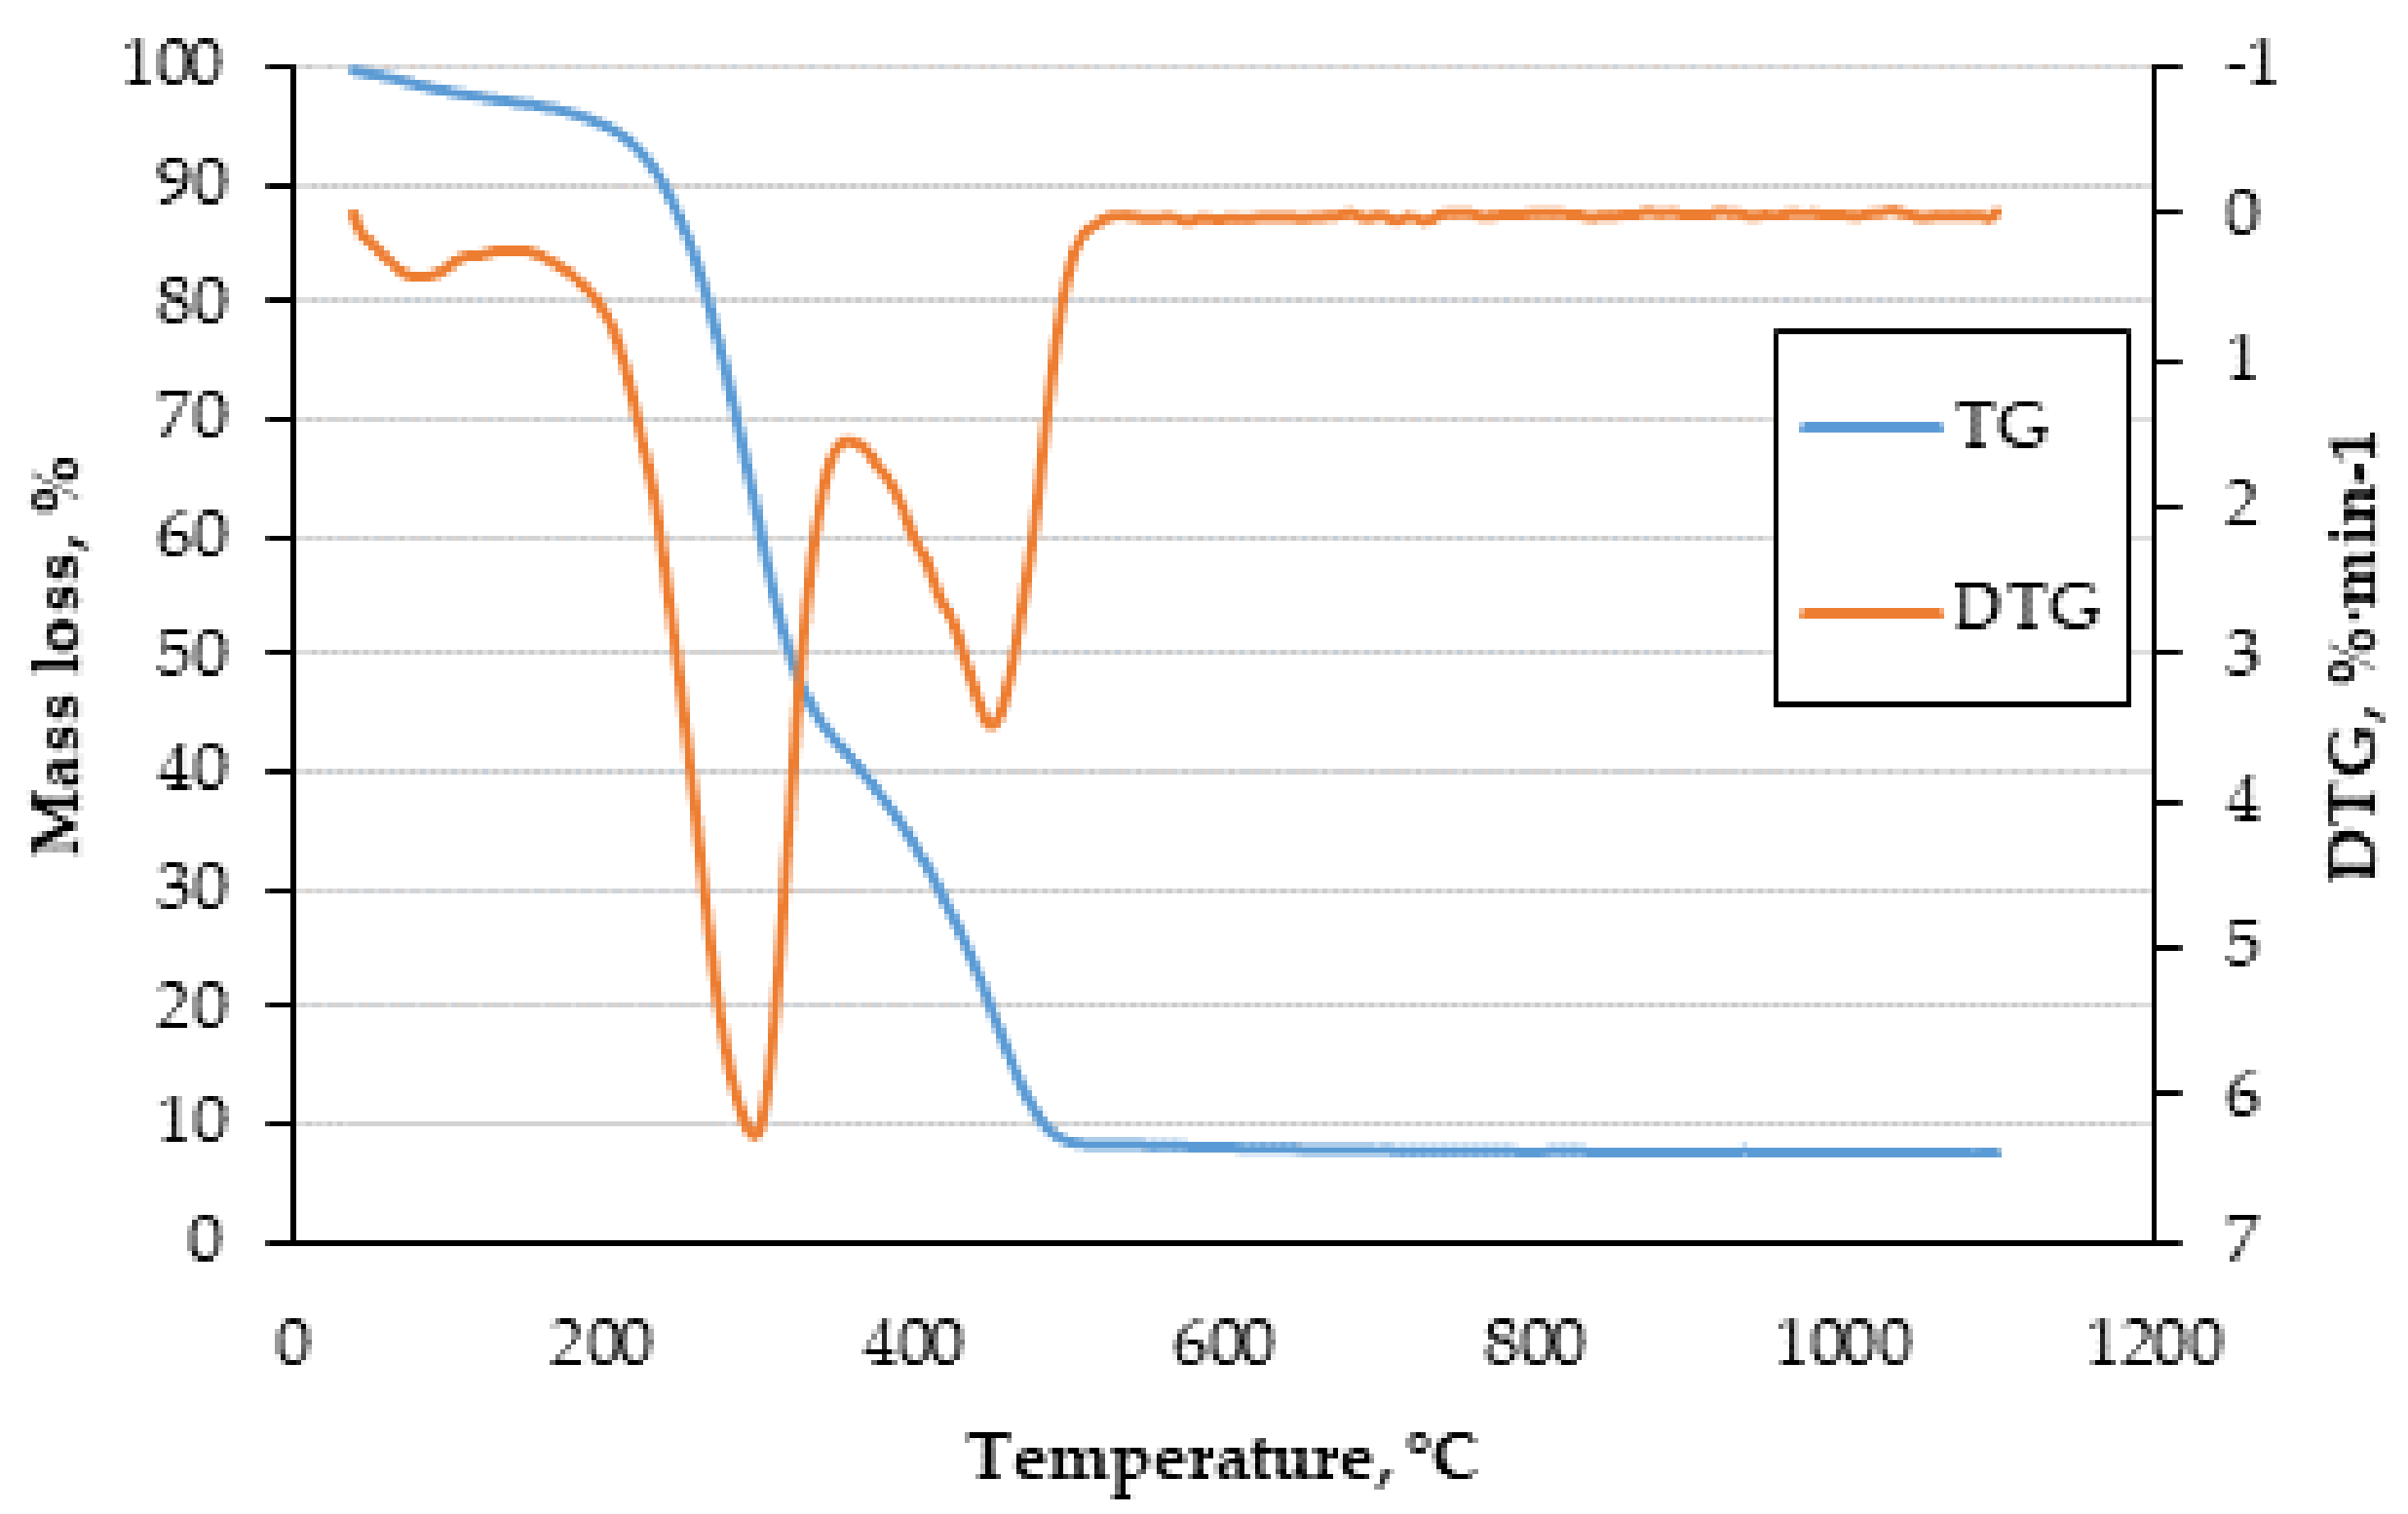
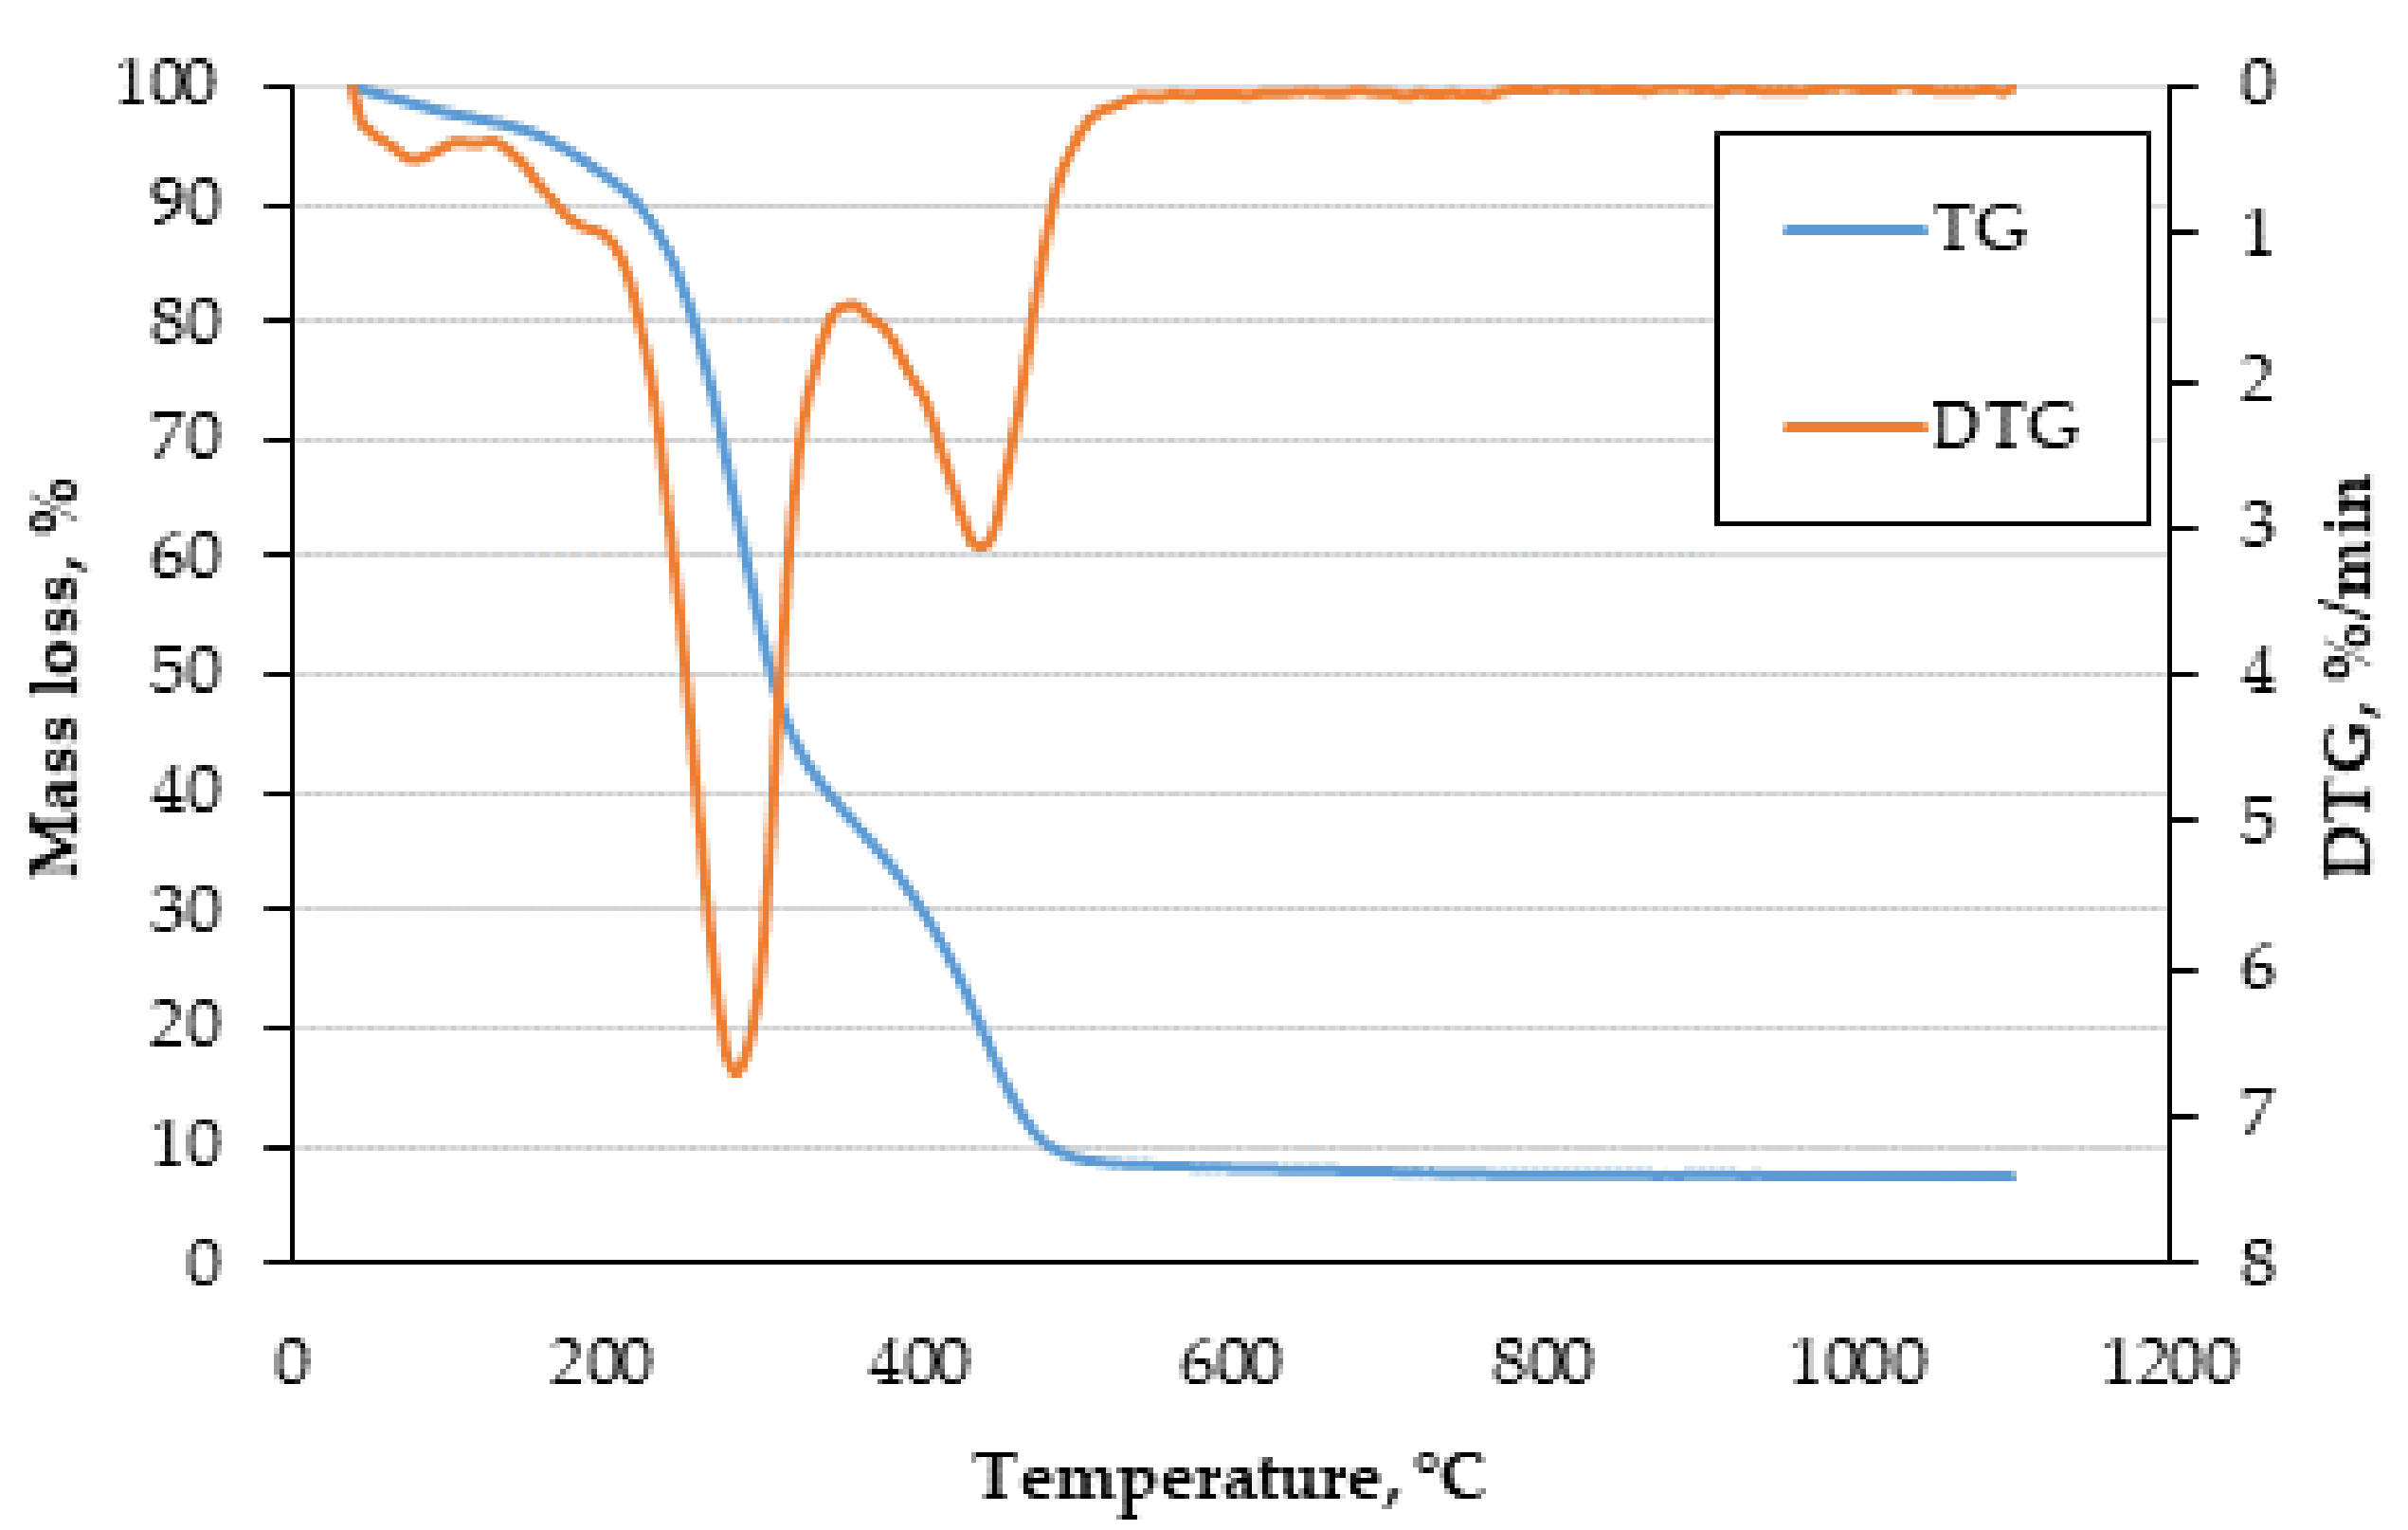
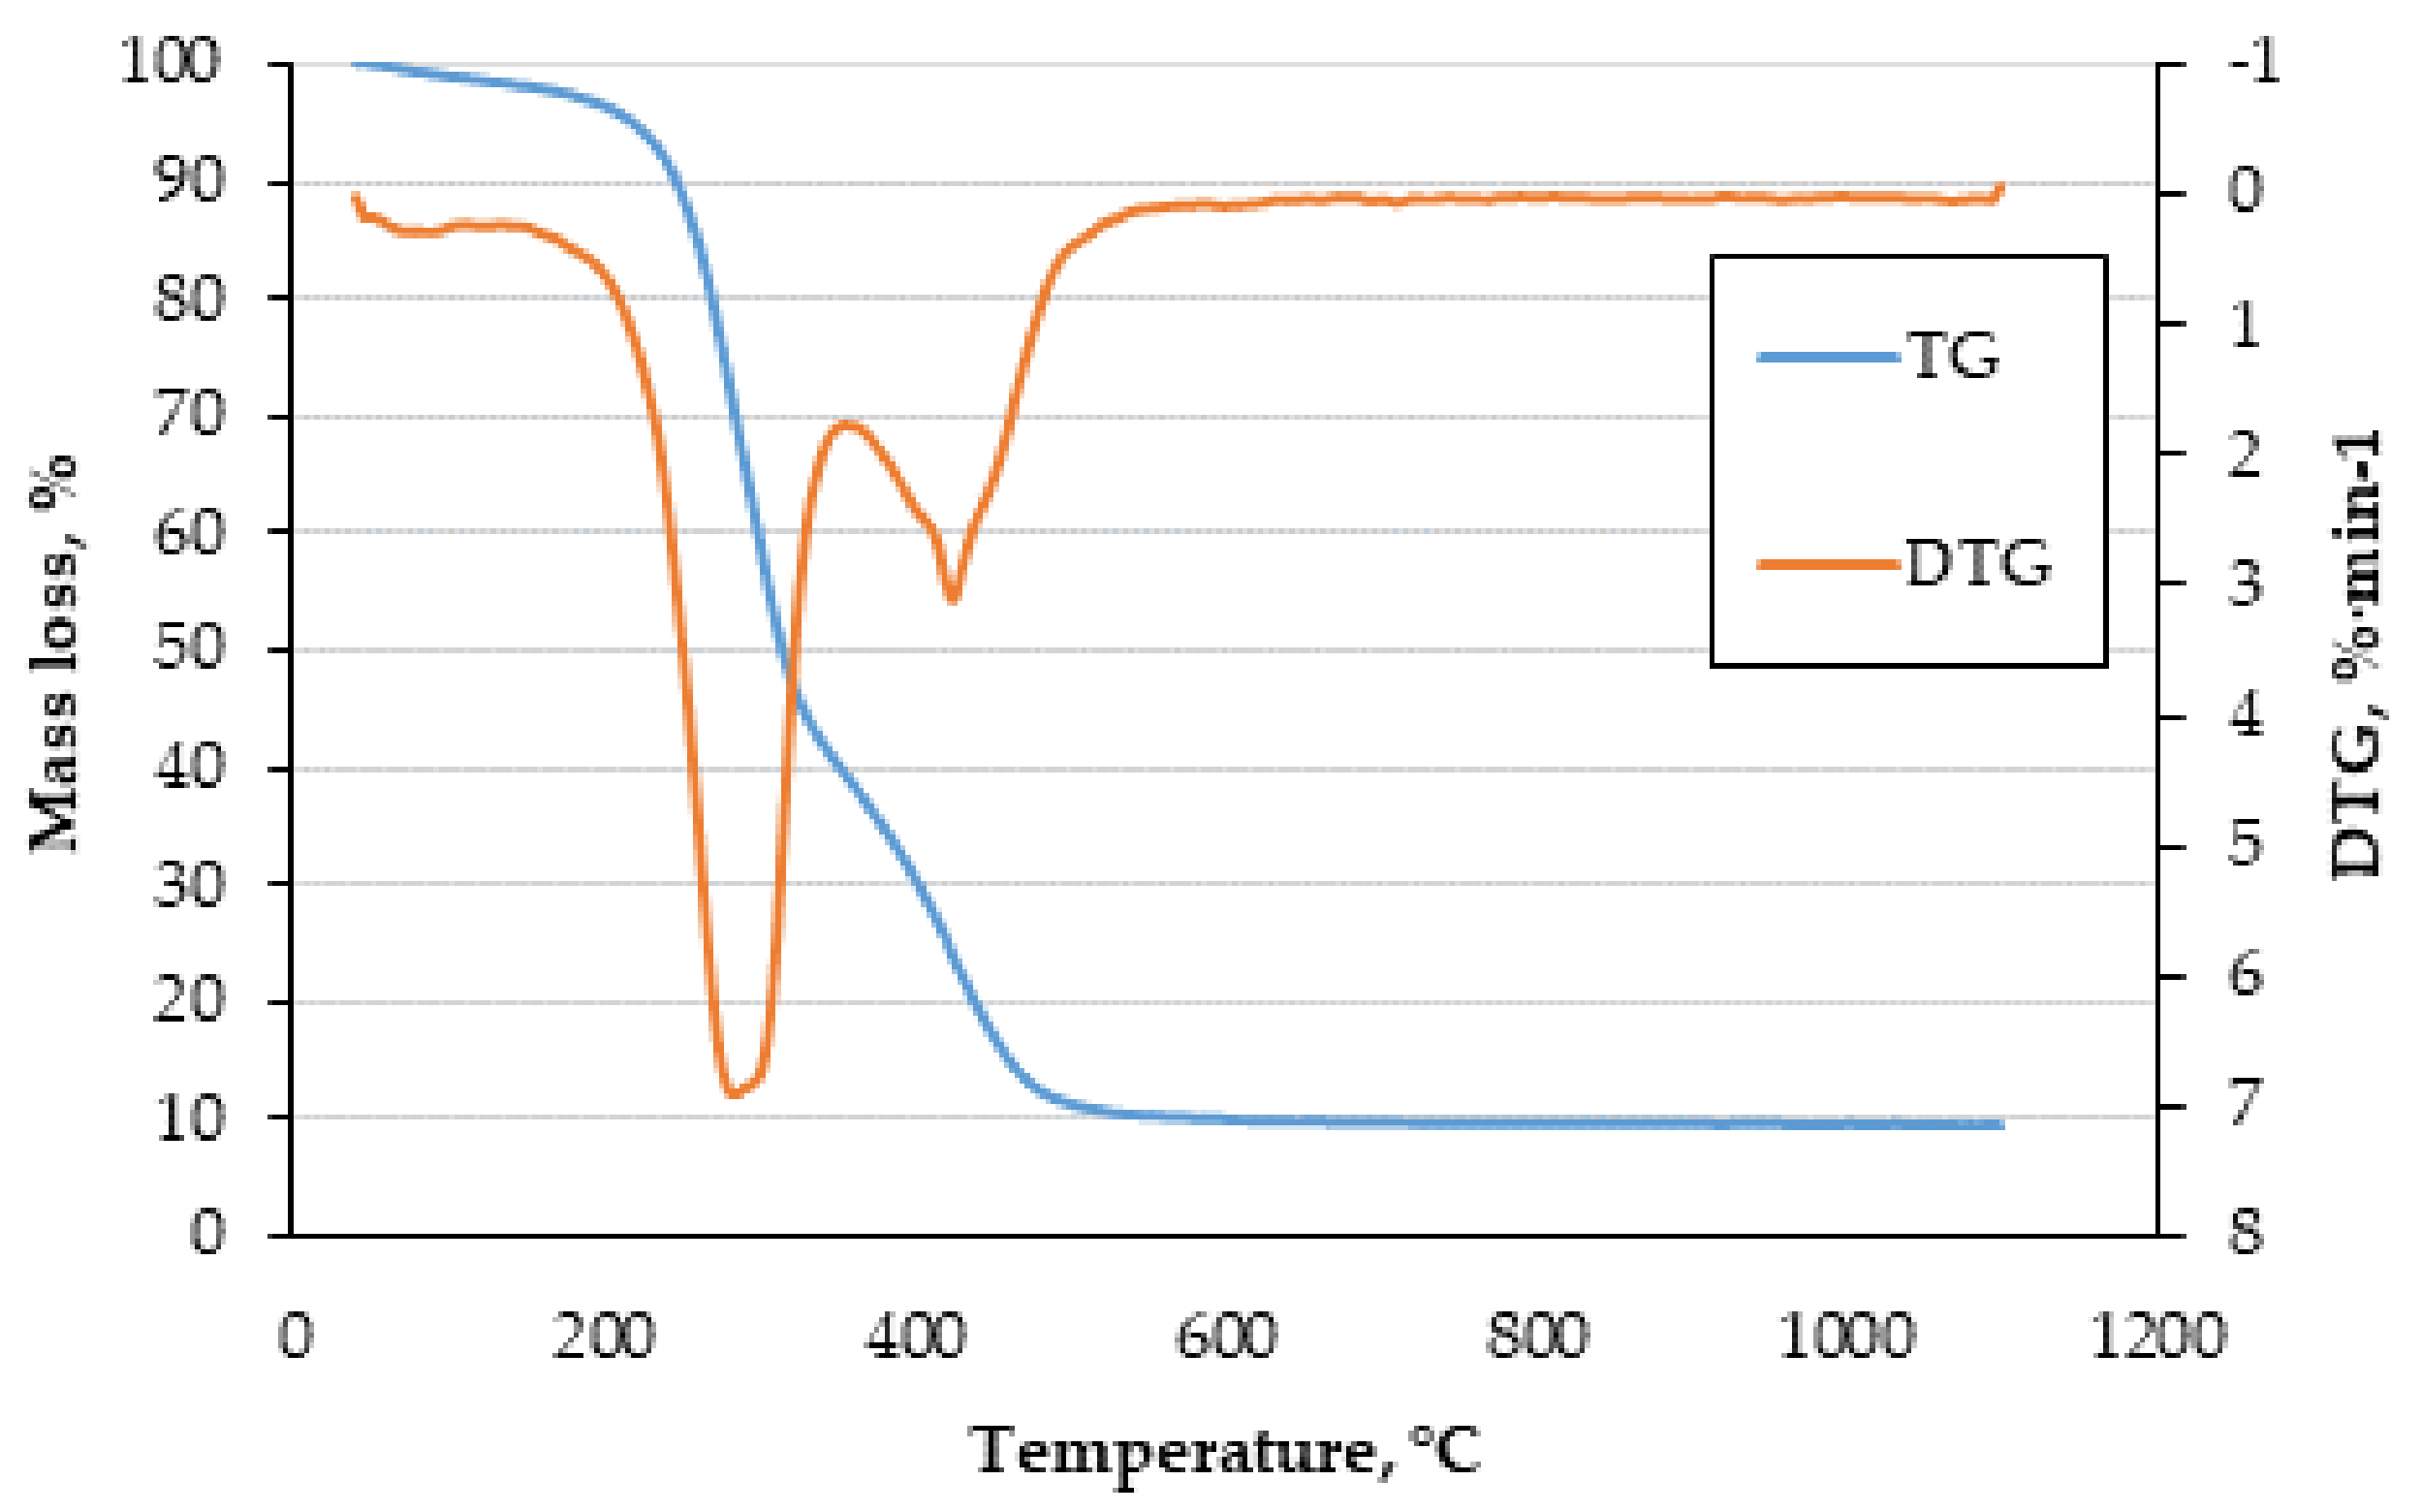
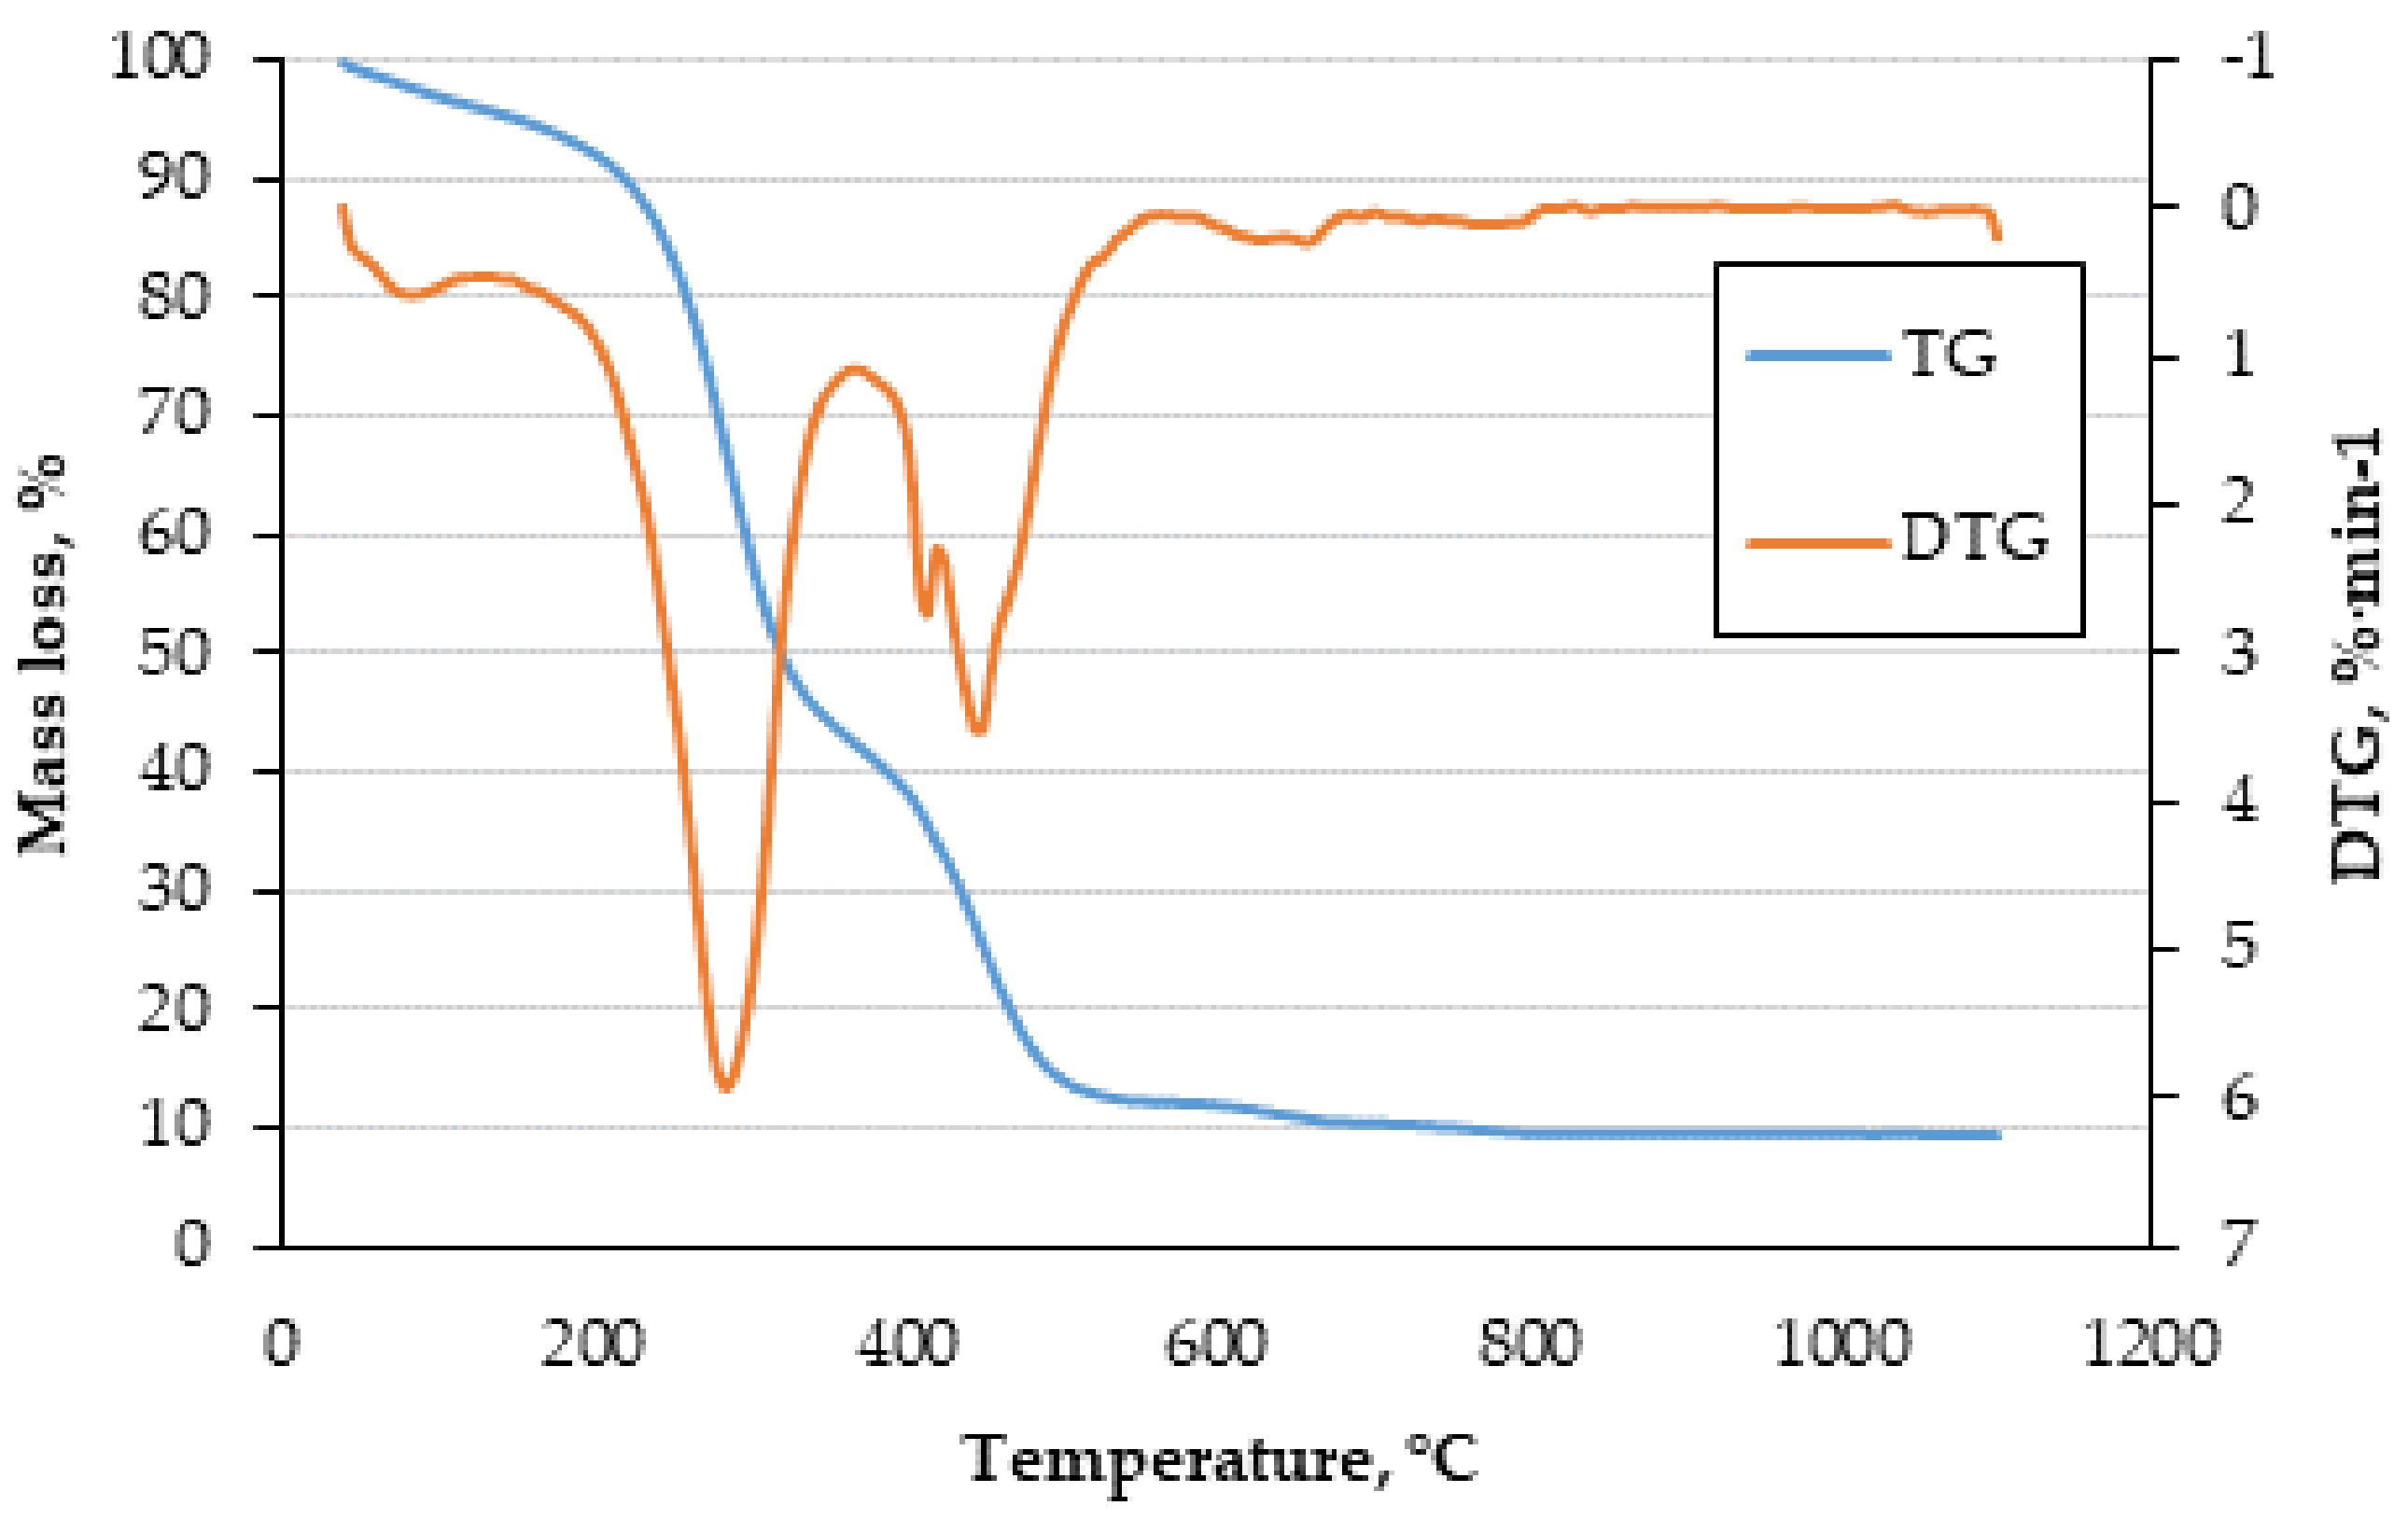
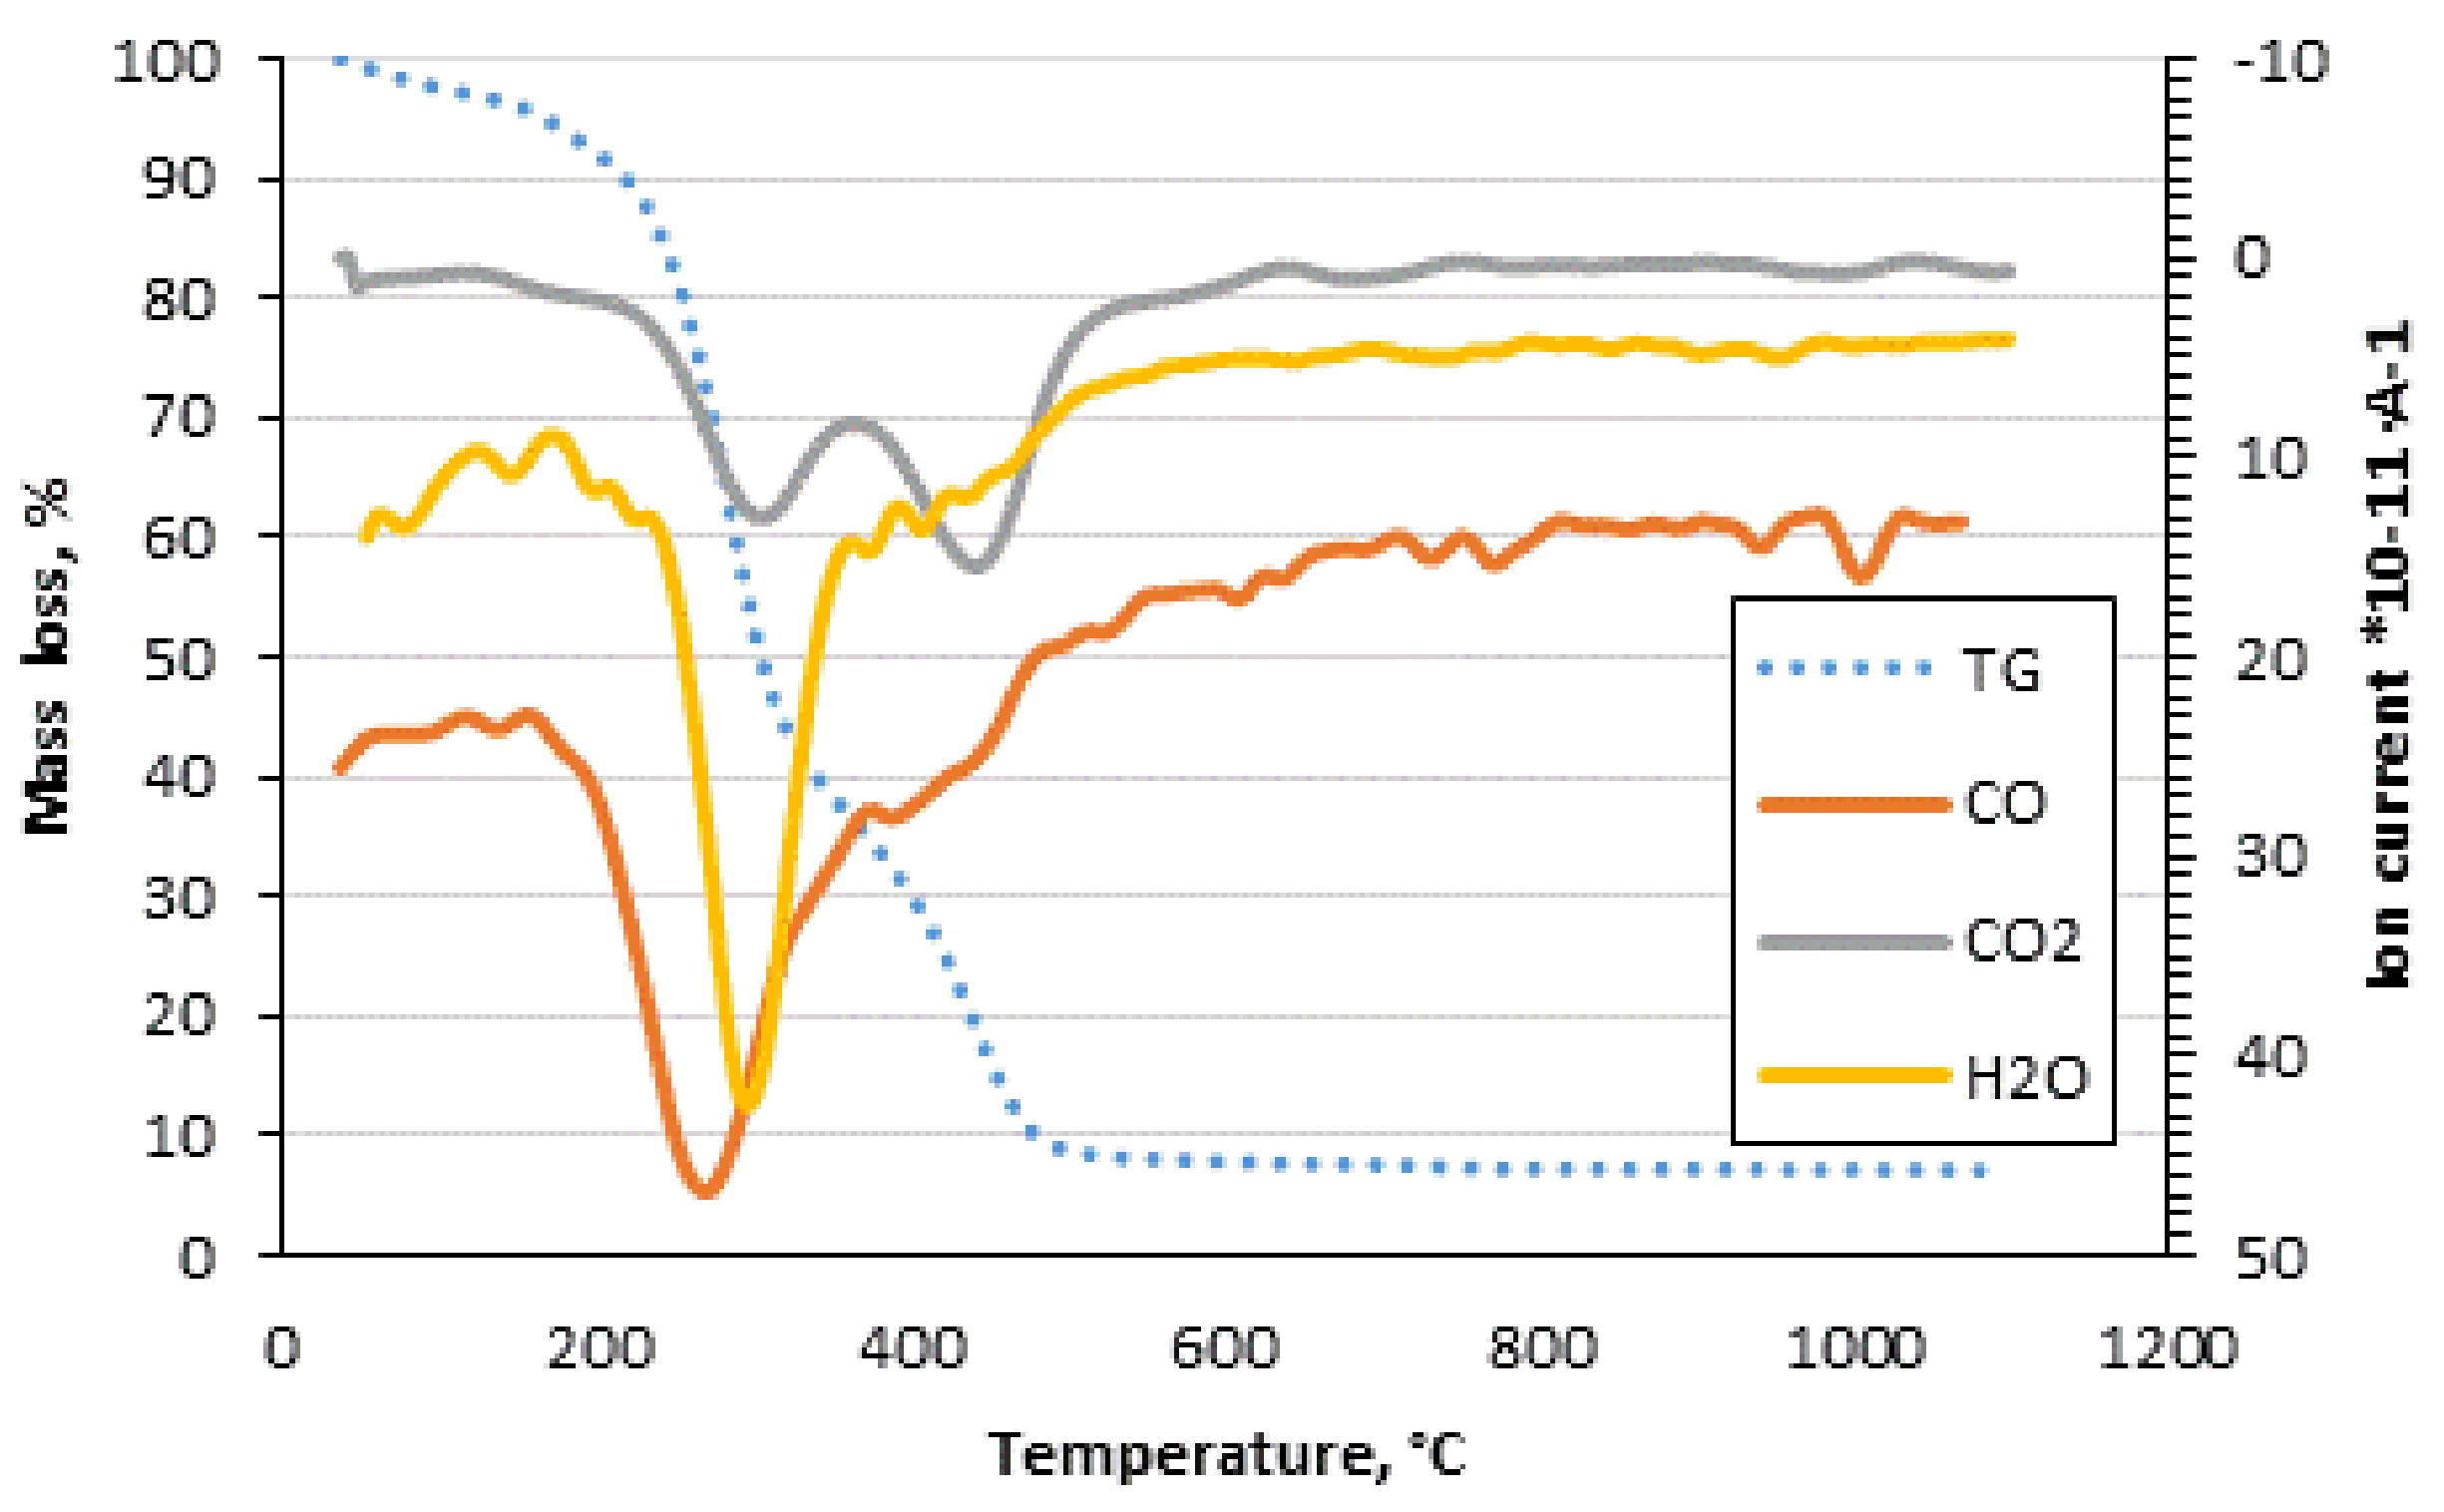
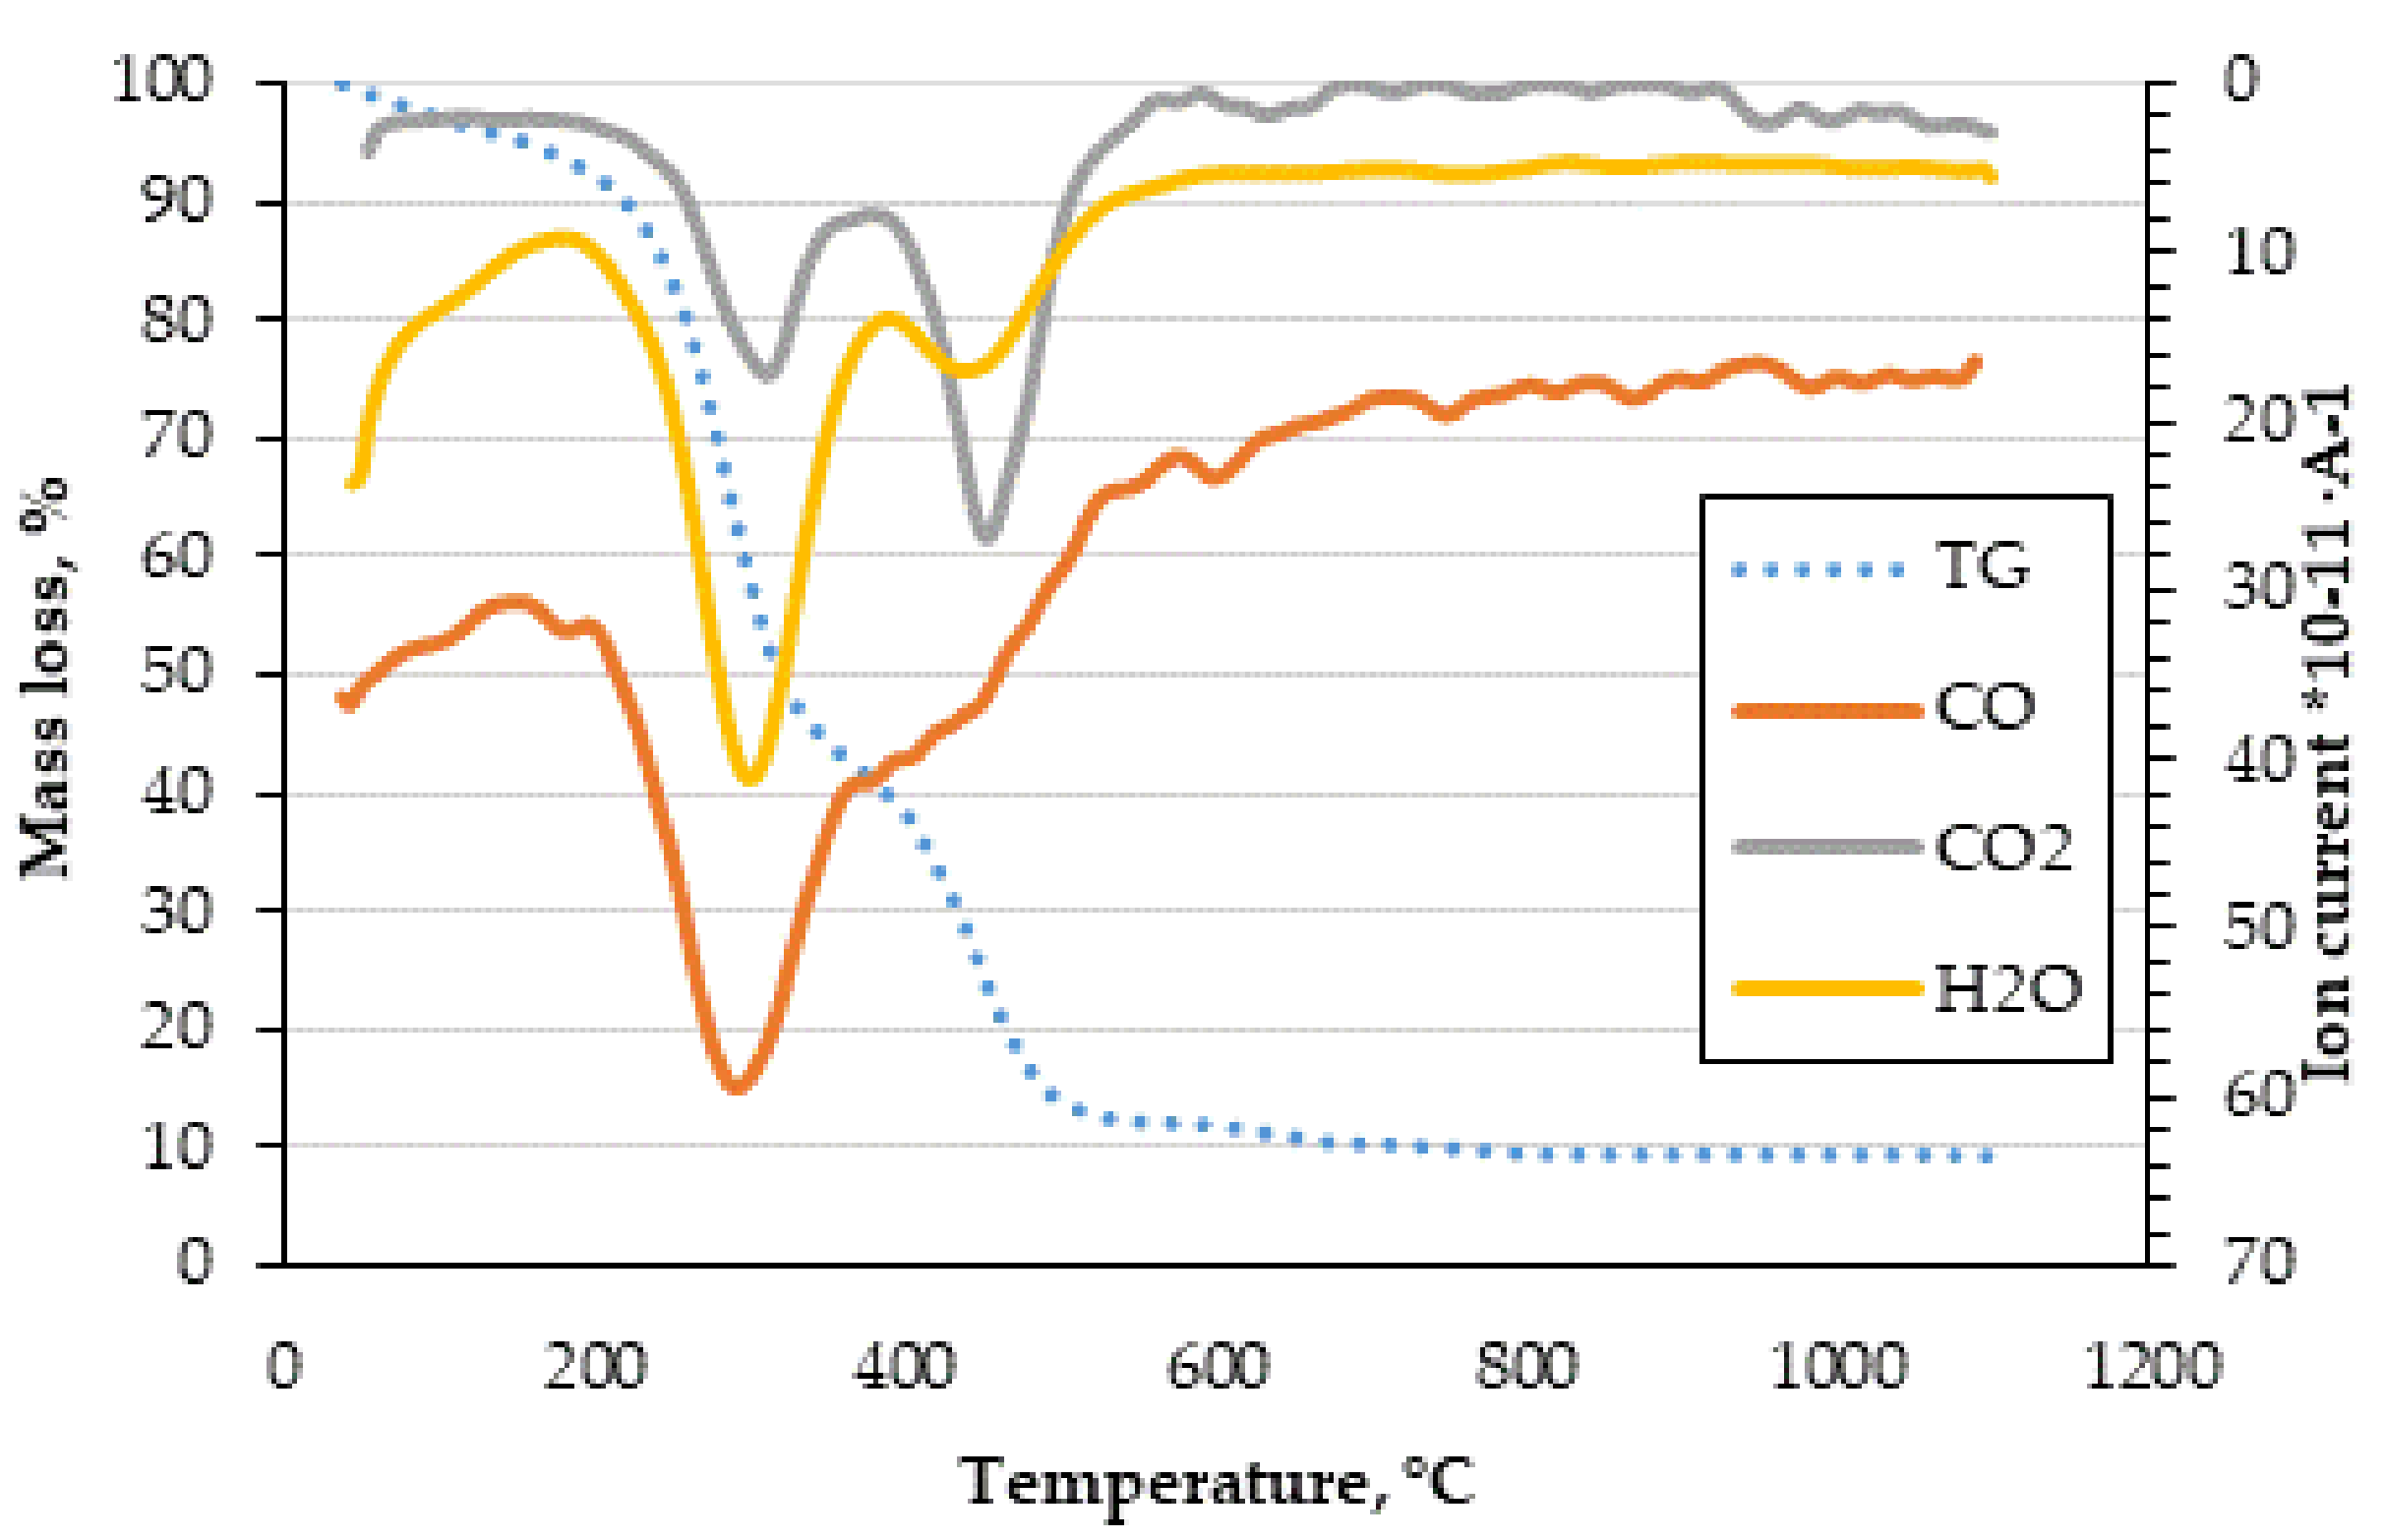
3.2. Combustion Behavior of Tested Samples

The TG and DTG profiles of the combusted samples (at the heating rate of 10 °C min−1) are presented in Figure 1, Figure 2, Figure 3 and Figure 4. The results of the analyses show that, regardless of the composition of the biomass being studied, the combustion process occurred in two stages. The first stage was the devolatilization of volatile matter compounds and second was char oxidation.
The graphs clearly show these two stages visualized by two peaks. The first stage ran until the combustion temperature reached a value of approx. 330 °C, and the second stage lasted until the combustion temperature reached approx. 500 °C. On the basis of the DTG curves, it was found that in the first stage of the process, the thermal decomposition of the samples occurred at a maximum rate of approx. 6–7% min−1 and that more than 50% of the sample mass was decomposed. It was observed that the highest rate of weight loss in the first stage occurred in the temperature range from 286 °C for 75CS25AP, 50CS50AP and for 25CS75AP to 298 °C for 10CS90AP. However, in the second stage, the maximum rate of weight loss occurred, respectively, for each of the tested samples, at the following temperatures: 424 °C for 50CS50AP, 441 °C for 25CS75AP J, 450 °C for 75CS25AP and 10CS90AP. The final weights of the samples after the combustion process related to the initial mass were: 7.26% for 25CS75AP, 7.82% for 10CS90AP J, 9.33% for 50CS50AP and 9.45% for 75CS25AP. The observed course of the kinetics of thermal decomposition of waste after methane fermentation of plant material, referring to the temperature range, was similar to the described decomposition of wood and straw [27,28].
Results of the analysis of the composition of the gases emitted during the combustion process are shown in Figure 5, Figure 6, Figure 7 and Figure 8.
The analysis of the measurements carried out showed that, in the first stage of combustion, mainly steam and CO were released, while the amount of CO2 emitted depended on the ratio of biomass in the mixtures tested. The maximum CO emissions were found around 296 °C, while the maximum CO2 emissions around 300 and 440 °C. Analyzing the ionic currents corresponding to the molecular ion of water, it can be noticed that there was a great similarity in their nature, and the maximum of their release occurred at a temperature of 293 °C. The ratio of these peaks was different for different biomass samples.
Based on the conducted studies of thermal decomposition of the biomass, calculations of kinetic parameters were performed according to the procedure recommended by the International Committee of Thermal Analysis and Calorimetry. This methodology assumes carrying out calculations of the activation energy and the pre-exponential factor using isoconversional methods, which is particularly recommended and largely applicable to the present case, for complex reactions in which there is a change in the reaction mechanism. The reaction rate is generally described by the equation as follows:
d α dt = k T f α
where k(T) relates to Arrhenius law:
k T = Ae E RT
For the case when non-isothermal conditions are used and the sample is heated under conditions of linear temperature rise (for a heating rate of β = dT/dt), then Equation (4) can be written as:
d α dT = k T f α β
implementing Arrhenius Equation (5):
d α dT = A β e E RT f α
Integrating Equation (7):
g α = A T β e e RT dt
or as
g α = AE R β e x x 0 e x x dx = AE R β p x
where:
x = E RT
Using the Kissinger-Akahira-Sunose (KAS) methods where:
p x = e x x 2
Kinetic parameters can be determined using the equation:
ln β i T α , i 2 ln A α R E α lng α E α RT α , i
Determination of the activation energy value is carried out by finding the slope of the straight line dependence of the left side of Equation (12) on the reciprocal of the absolute temperature for a constant conversion rate for the βi heating rate. The Ozawa-Flynn-Wall method uses the Doyle approximation, described by the equation:
lnp x = 5.3305 1.052 x
The linear form of the equation (OFW) is as follows:
ln β i ln A α E α R lng α 5.3305 1.052 E α RT α , i
Similarly, as in the case of the KAS method, for the OFW method, the determination of the activation energy value is carried out by searching for the slope coefficient of the simple dependence (of the left side of the Equation (14)) on the inverse of the absolute temperature for a constant conversion rate for the i-th heating rate βi. In order to determine the pre-exponential coefficient, it is necessary to adopt an appropriate reaction model. Based on the acquired knowledge, a model classified as R2 (shrinking core) was selected, the differential form of which is presented by the equation:
f α = 3 1 α 2 3
After integrating, the equation becomes:
g α = 1 1 α 1 3
Figure 9 and Figure 10 show the lines representing the OFW and KAS dependence for the degree of conversion in the range α from 0.05 to 0.975, in steps of 0.025.
Analyzing the dependence shown in Figure 9 and Figure 10, it can be seen that a simple adjustment to the experimental points varies considerably with the degree of conversion. If there is an increase and the degree of conversion of α below 0.3, then the fit is good, similarly, for higher degrees of conversion. It is most likely related to the considerable heterogeneity of the sample, which contains both small particles and particles with a size of a few mm. Hence, it is possible that the particles will have a different surface area and/or have a different moisture release mechanism and the initial stage of pyrolysis.
To develop a generalized mathematical model of the waste particle combustion process, the activation energy and the pre-exponential coefficient for the three heating speeds: 3, 10 and 30 K min−1, were determined for the mixture 50CS50AP using the methods: OWP and KAS.
Table 5 presents the values of the activation energy determined with the use of both OFW and KAS methods together with the values of the determination coefficient R2, which speaks of the quality of fitting regression lines to the experimental points.
Changes in the activation energy values obtained using both methods are shown in Figure 11. It can be seen that the influence of the method on the estimated activation energy values was negligible. Values were also visible in the individual stages of the reaction (drying, pyrolysis and burning the resulting char).
The specific heat as a function of temperature was determined on the basis of the results obtained from the DSC analyses of the analyzed waste after methane fermentation. The results of the analyses together with characteristic peaks are shown in Figure 12, Figure 13, Figure 14 and Figure 15.
On the DSC curves (for all mixtures of the tested biomass) presented in the graphs, an endothermic peak can be observed in the first phase of the process, the maximum of which fell at temperatures from 90 to 141 °C. This peak is responsible for the drying stage of the fresh material, where energy must be supplied to the process. After exceeding the temperature of 250 °C, the first exothermic peak appeared in the second phase, responsible for the release of volatile parts from the fuel and the formation of a solid product in the form of char. Its maximum fell at temperatures between 339 and 353 °C. Next, at a temperature of about 390 °C, a second exothermic peak can be observed, which represents the after-burning of the char formed at an earlier stage of the process. Identification of the characteristic points during the combustion of samples of post-fermentation waste made it possible to calculate the heat specific to subsequent forms of biomass, resulting from the physico-chemical changes occurring during combustion. The value of specific heat changed from approx. 5000 J kg−1 K−1 for dry substance to approx. 2500 J kg−1 K−1 for char.

4. Conclusions

This research was carried out to analyze the waste from methane fermentation in terms of suitability for energy purposes and the course of combustion kinetics. Waste from methane fermentation of a mixture of apple pomace and maize silage, with different percentages in the charge, were tested.
Based on the presented results, it can be easily stated that digestate from agricultural biogas plants, which are fed by residues from agricultural or food production, can be treated as a valuable renewable energy source. For many reasons, such a fuel is more valuable than feedstock, which was initially treated by biogas plants. First of all, digestate is biologically more stable, which is especially important when we use residues from fruit processing. The quality of the digestate can vary with the batch, which is why paper deals with mixtures of digestate from different feedstock. In such a way, the final quality of the fuel can be easily controlled to develop the best possible combustion quality.
Proximate and ultimate analyses of the proposed mixtures show that this material can be a valuable source of energy, but combustion need be undertaken in special units. Moisture content of the investigated digestate-type ranges from 11.9–12.2%, but the problems occur with ash content, which in our case, was from 8.2% to 11.6%. This could lead to ash sintering and slugging problems, which are problematic issues, especially in boilers not designed for such a type of fuel, which can be source of lower heat transfer efficiency or serious system failures. This is why higher ash content needs to be considered in this part. The calorific values of the analyzed mixtures ranged from 15.34 MJ kg−1 (75CS25AP) to 18.41 MJ kg−1 (10CS90AP). At the same time, it was observed that the mixture with the lowest calorific value had the highest ash content. Other parameters such as LHV seem promising and are not “far away” from the values observed for other types of biomass. As the digestate from apple pomace has higher ash content, the LLV is lower; thus, the combustion of pure digestate would be not as profitable due to lower overall output of the combustion unit.
The ultimate analysis of all mixtures shows that the shares of major elements are similar. This results are connected with the TGA analysis, which shows that the thermal decomposition looks similar for all four mixtures. This is valuable information because, in this special case, with mixtures of corn silage- and apple pomace-originated digestates, the changes in the ratio CS:AP will not affect the combustion significantly. In addition, changes of the specific heat during combustion does not vary with the change of the fuel mixture. This seems to be also connected with the results of the ultimate analysis.
In conclusion, the presented research is a contribution to further considerations on the possibility of the energetic use of residues from the process of biogas production in agricultural installations. A detailed analysis of the combustion process in real units seems to be a natural step toward a comprehensive evaluation of this type of fuel.

Author Contributions

Conceptualization, K.D., M.J. (Michał Jurczyk), T.P. and B.Ł.-K.; methodology, K.D., M.J. (Michał Jurczyk), B.Ł.-K. and M.J. (Marcin Jewiarz); investigation, T.P., K.M., M.A., M.W. and M.J. (Marcin Jewiarz); formal analysis B.Ł.-K. and T.P.; resources, K.D. and M.A.; data curation, M.A., M.W. and K.M.; writing—original draft preparation, K.D., M.J. (Michał Jurczyk), M.A., K.M. and M.W.; writing—review and editing, K.D., M.W., M.J. (Michał Jurczyk) and M.J. (Marcin Jewiarz); visualization, T.P.; supervision, M.J. (Marcin Jewiarz) and M.J. (Michał Jurczyk); project administration, K.D.; software B.Ł.-K. and K.M. All authors have read and agreed to the published version of the manuscript.

Funding

This research was supported by Ministry of Science and Higher Education of the Republic of Poland.

Institutional Review Board Statement

Not applicable.

Informed Consent Statement

Not applicable.

Data Availability Statement

The data presented in this study are available on request from the corresponding author.

Conflicts of Interest

The authors declare no conflict of interest.

References

  1. Bavutti, M.; Guidetti, L.; Allesina, G.; Libbra, A.; Muscio, A.; Pedrazzi, S. Thermal stabilization of digesters of biogas plants by means of optimization of the surface radiative properties of the gasometer domes. Energy Procedia 2014, 45, 1344–1353. [Google Scholar] [CrossRef] [Green Version]
  2. Grinzi, G.; Guidetti, L.; Allesina, G.; Libbra, A.; Martini, P.; Muscio, A. Increase of net power generation of biogas plants by reduction of heat loss. In Proceedings of the 20th European Biomass Conference and Exhibition, Milano, Italy, 18–22 June 2012; ETA-Florence Renewable Energies: Munich, Germany, 2012. [Google Scholar]
  3. Negri, M.; Bacenetti, J.; Brambilla, M.; Manfredini, A.; Cantore, A.; Bocchi, S. Biomethane production from different crop systems of cereals in Northern Italy. Biomass Bioenergy 2014, 63, 321–329. [Google Scholar] [CrossRef]
  4. Lootsma, A.; Raussen, T. Aktuelle verfahren zur aufbereitung und verwertung von gärresten. Witzenhausen-Institut GmbH (Hrsg.) 2008, 20, 559–576. [Google Scholar]
  5. Szufa, S.; Piersa, P.; Adrian, Ł.; Czerwińska, J.; Lewandowski, A.; Lewandowska, W.; Sielski, J.; Dzikuć, M.; Wróbel, M.; Jewiarz, M.; et al. Sustainable Drying and Torrefaction Processes of Miscanthus for Use as a Pelletized Solid Biofuel and Biocarbon-Carrier for Fertilizers. Molecules 2021, 26, 1014. [Google Scholar] [CrossRef]
  6. Szufa, S.; Wielgosiński, G.; Piersa, P.; Czerwińska, J.; Dzikuć, M.; Adrian, Ł.; Lewandowska, W.; Marczak, M. Torrefaction of straw from oats and maize for use as a fuel and additive to organic fertilizers—TGA analysis, kinetics as products for agricultural purposes. Energies 2020, 13, 2064. [Google Scholar] [CrossRef] [Green Version]
  7. Dohler, H.; Schliebner, P. Verfahren und Wirtschaftlichkeit der Garrestaufbereitung. KTBL SCHRIFT 2006, 444, 199. [Google Scholar]
  8. Vismara, R.F.; Canziani, R.; Malpei, F.; Piccinini, S. Biogas da Agrozootecnia e Agroindustria; Dario Flaccovio: Milano, Italy, 2011. [Google Scholar]
  9. European Commission. Council Directive 91/676/EEC of 12 December 1991 concerning the protection of waters against pollution caused by nitrates from agricultural sources. Off. J. Eur. Communities 1991, 375, 1–8. [Google Scholar]
  10. Härdtlein, M.; Eltrop, L.; Thrän, D. Voraussetzung zur Standardisierung Biogener Festbrennstoffe; Schriftenreihe “Nachwachsende Rohstoffe” der Fachagentur Nachwachsende Rohstoffe, Landwirtschaftsverlag GmBH: Münster, Germany, 2004; Volume 23. [Google Scholar]
  11. Kratzeisen, M.; Starcevic, N.; Martinov, M.; Maurer, C.; Müller, J. Applicability of biogas digestate as solid fuel. Fuel 2010, 89, 2544–2548. [Google Scholar] [CrossRef]
  12. Li, H.; Lindmark, J.; Nordlander, E.; Thorin, E.; Dahlquist, E.; Zhao, L. Using the solid digestate from a wet anaerobic digestion process as an energy resource. Energy Technol. 2013, 1, 94–101. [Google Scholar] [CrossRef]
  13. Gudde, J. Manure Digestate Combustion for Decentralized Energy Production: Research About the Feasibility of the Manure Digestate Combustion Processing Route; Internship Report (Master); Twence B.V. Afval en energie: Hengelo, The Netherlands, 2012. [Google Scholar]
  14. Pedrazzi, S.; Allesina, G.; Belló, T.; Rinaldini, C.A.; Tartarini, P. Digestate as bio-fuel in domestic furnaces. Fuel Process. Technol. 2015, 130, 172–178. [Google Scholar] [CrossRef]
  15. Barfuss, I.; Gwavuya, S.; Abele, S.; Müller, J. Biogas production vs. dung combustion as household energy in rural Ethiopia. In Proceedings of the CIGR International Symposium on Sustainable Bioproduction—Water, Energy and Food, Stuttgart, Germany, 2013; Available online: http://opus.uni-hohenheim.de/volltexte/2013/816/pdf/Barfuss_2011a.pdf (accessed on 15 October 2021).
  16. Thorin, E.; Guziana, B.; Song, H.; Jääskeläinen, A.; Szpadt, R.; Vasilic, D.; Ahrens, T.; Anne, O.; Lõõnik, J. Potential Future Waste-to-Energy Systems. REMOWE Reports; Report no: 4.1.3; Mälardalen University: Västerås, Sweden, 2012; Available online: http://mdh.diva-portal.org/smash/get/diva2:583809/FULLTEXT01.pdf (accessed on 15 October 2021).
  17. Wiśniewski, D.; Gołaszewski, J.; Białowiec, A. The pyrolysis and gasification of digestate from agricultural biogas plant/Piroliza i gazyfikacja pofermentu z biogazowni rolniczych. Arch. Environ. Protection. 2015, 42, 70–75. [Google Scholar] [CrossRef] [Green Version]
  18. Mudryk, K.; Frączek, J.; Jewiarz, M.; Wróbel, M.; Dziedzic, K. Analysis of mechanical dewatering of digestate. Agric. Eng. 2016, 20, 157–166. [Google Scholar] [CrossRef] [Green Version]
  19. EN ISO 14780:2017-07. Solid Biofuels—Sample Preparation; European Committee for Standardization: Geneva, Switzerland, 2017. [Google Scholar]
  20. EN ISO 18134-3:2015-11. Solid Biofuels—Determination of Moisture Content—Oven Dry Method—Part 3: Moisture in General Analysis Sample; European Committee for Standardization: Geneva, Switzerland, 2015. [Google Scholar]
  21. EN ISO 18122:2016-01. Solid Biofuels—Determination of Ash Content; European Committee for Standardization: Geneva, Switzerland, 2016. [Google Scholar]
  22. EN ISO 18123:2016-0. Solid Biofuels—Determination of the Content of Volatile Matter; European Committee for Standardization: Geneva, Switzerland, 2016. [Google Scholar]
  23. EN ISO 18125:2017-07. Solid Biofuels—Determination of Calorific Value; European Committee for Standardization: Geneva, Switzerland, 2017. [Google Scholar]
  24. EN ISO 17828:2016-02. Solid Biofuels—Determination of Bulk Density; European Committee for Standardization: Geneva, Switzerland, 2016. [Google Scholar]
  25. ASTM B923—16. Standard Test Method for Metal Powder Skeletal Density by Helium or Nitrogen Pycnometry; ASTM International: West Conshohocken, PA, USA, 2016. [Google Scholar]
  26. EN ISO 16948:2015-07. Solid Biofuels—Determination of Total Content of Carbon, Hydrogen and Nitrogen—Instrumental Methods; European Committee for Standardization: Geneva, Switzerland, 2015. [Google Scholar]
  27. EN ISO 16994:2015-06. Solid Biofuels—Determination of Total Content of Sulfur and Chlorine; European Committee for Standardization: Geneva, Switzerland, 2015. [Google Scholar]
  28. DIN 51733:2008-12. Testing of Solid Mineral Fuels—Ultimate Analysis and Calculation of Oxygen Content; German Institute for Standardization: Berlin, Germany, 2008. [Google Scholar]
  29. Faithfull, N.T. Methods in Agricultural Chemical Analysis: A Practical Handbook; Cabi Publishing: New York, NY, USA, 2002. [Google Scholar]
  30. Oleszczuk, N.; Castro, J.T.; da Silva, M.M.; Maria das Graças, A.K.; Welz, B.; Vale, M.G.R. Method development for the determination of manganese, cobalt and copper in green coffee comparing direct solid sampling electrothermal atomic absorption spectrometry and inductively coupled plasma optical emission spectrometry. Talanta 2007, 73, 862–869. [Google Scholar] [CrossRef]
  31. Goel, V.L.; Behl, H.M. Fuelwood quality of promising tree species for alkaline soil sites in relation to tree age. Biomass Bioenergy 1996, 10, 57–61. [Google Scholar] [CrossRef]
  32. Flynn, J.H.; Wall, L.A. General treatment of the thermogravimetry of polymers. Journal of research of the National Bureau of Standards. Sect. A Phys. Chem. 1966, 70, 487. [Google Scholar]
  33. Ozawa, T. A new method of analyzing thermogravimetric data. Bull. Chem. Soc. Jpn. 1965, 38, 1881–1886. [Google Scholar] [CrossRef] [Green Version]
  34. Kissinger, H.E. Reaction kinetics in differential thermal analysis. Anal. Chem. 1957, 29, 1702–1706. [Google Scholar] [CrossRef]
  35. Akahira, T.; Sunose, T. Method of determining activation deterioration constant of electrical insulating materials. Res. Rep. Chiba Inst. Technol. (Sci. Technol.) 1971, 16, 22–31. [Google Scholar]
  36. Holtmeyer, M.L.; Li, G.; Kumfer, B.M.; Li, S.; Axelbaum, R.L. The impact of biomass cofiring on volatile flame length. Energy Fuels 2013, 27, 7762–7771. [Google Scholar] [CrossRef]
  37. Brewer, C.E.; Chuang, V.J.; Masiello, C.A.; Gonnermann, H.; Gao, X.; Dugan, B.; Driverc, L.E.; Panzacchide, P.; Zygourakisb, K.; Daviese, C.A. New approaches to measuring biochar density and porosity. Biomass Bioenergy 2014, 66, 176–185. [Google Scholar] [CrossRef]
  38. Niemczyk, M.; Kaliszewski, A.; Jewiarz, M.; Wróbel, M.; Mudryk, K. Productivity and biomass characteristics of selected poplar (Populus spp.) cultivars under the climatic conditions of northern Poland. Biomass Bioenergy 2018, 111, 46–51. [Google Scholar] [CrossRef]
  39. Pahla, G.; Mamvura, T.A.; Ntuli, F.; Muzenda, E. Energy densification of animal waste lignocellulose biomass and raw biomass. S. Afr. J. Chem. Eng. 2017, 24, 168–175. [Google Scholar] [CrossRef]
  40. Koppejan, J.; Van Loo, S. (Eds.) The Handbook of Biomass Combustion and Co-Firing; Routledge: London, UK, 2012. [Google Scholar]
  41. Miles, T.R. Alkali Deposits Found in Biomass Power Plants; Research Report NREL/TP-433-8142 SAND96-8225; National Renewable Energy Laboratory: Oakridge, BC, Canada, 1996; Volumes I and II. [Google Scholar]
  42. Riedl, R.; Obernberger, I. Corrosion and fouling in boilers of biomass combustion plants. In Proceedings of the 9th European Bioenergy Conference, Copenhagen, Denmark, 24–27 June 1996; Elsevier Science: Oxford, UK, 1996; Volume 2. [Google Scholar]
  43. Spiegel, M.; Grabke, H.J. Hochtemperaturkorrosion des 2.25 Cr-1Mo-Stahls unter simulierten Müllverbrennungsbedingungen. Mater. Corros. 1995, 46, 121–131. [Google Scholar] [CrossRef]
  44. Obernberger, I.; Biedermann, F.; Kohlbach, W. FRACTIO—Fraktionierte Schwermetallabscheidung in Biomasseheizwerken, Annual Report for a Research Project Funded by the ITF and the Bund-Bundesländerkooperation; Institute of Chemical Engineering, Graz University of Technology: Graz, Austria, 1995. [Google Scholar]
  45. Ruckenbauer, P.; Obernberger, I.; Holzner, H. Erforschung der 52 The Handbook of Biomass Combustion and Co-firing Verwendungsmöglichkeiten von Aschen aus Hackgut-und Rindenfeuerungen, Final Report; Part II Research Project No. StU 48, Bund-Bundesländerkooperation; Institute of Plant Breeding and Plant Growing, University for Agriculture and Forestry: Vienna, Austria, 1996. [Google Scholar]
Figure 1. TG and DTG curves for sample 10CS90AP.
Energies 14 07224 g001
Figure 2. TG and DTG curves for sample 25CS75AP.
Energies 14 07224 g002
Figure 3. TG and DTG curves for sample 50CS50AP.
Energies 14 07224 g003
Figure 4. TG and DTG curves for sample 75CS25AP.
Energies 14 07224 g004
Figure 5. TG and the composition of the gases curves for sample 10CS90AP.
Energies 14 07224 g005
Figure 6. TG and the composition of the gases curves for sample 25CS75AP.
Energies 14 07224 g006
Figure 7. TG and the composition of the gases curves for sample 50CS50AP.
Energies 14 07224 g007
Figure 8. TG and the composition of the gases curves for sample 75CS25AP.
Energies 14 07224 g008
Figure 9. Isoconversion lines representing OFW relationships.
Energies 14 07224 g009
Figure 10. Isoconversion lines representing KAS relationships.
Energies 14 07224 g010
Figure 11. Change of the activation energy determined with the OFW and KAS methods as a function of the conversion degree.
Energies 14 07224 g011
Figure 12. Change of specific heat as a function of temperature—sample 10CS90AP.
Energies 14 07224 g012
Figure 13. Change of specific heat as a function of temperature—sample 25CS75AP.
Energies 14 07224 g013
Figure 14. Change of specific heat as a function of temperature—sample 50CS50AP.
Energies 14 07224 g014
Figure 15. Change of specific heat as a function of temperature—sample 75CS25AP.
Energies 14 07224 g015
Table 1. Feedstock composition of digestates used as test fuels (mass % of fresh matter).
Test Fuel SymbolFeedstock CompositionShare of Fresh Matter
10CS90APCS10
AP90
25CS75APCS25
AP75
50CS50APCS50
AP50
75CS25APCS75
AP25
Table 2. Methods applied for characterization and analysis of test fuels.
ParameterMethod
Sample preparationEN ISO 14780:2017-07
Carbon, hydrogen, nitrogen contentEN ISO 16948:2015-07
Sulfur and chlorine contentEN ISO 16994:2016-10
Oxygen contentDIN 51733:2008-12
Ash contentEN ISO 18122:2016-01
Volatile matter contentEN ISO 18123:2016-01
Calorific valueEN ISO 18125:2017-07
Moisture contentEN ISO 18134-1:2015-11
DensityEN ISO 18847:2016-11
Na, Mg, K, Ca, P, Cr, Mn, Fe, Ni, Cu, Zn, Cd, Pb[18]
Table 3. Physical properties of tested mixtures of post-fermentation biomass.
ParameterUnitDigestate Type
10CS90AP25CS75AP50CS50AP75CS25AP
Mad%12.1012.2011.9011.90
Ad%8.208.4010.1011.60
Vd%83.1089.8079.7078.80
HHVJ g−119,60018,55018,31016,420
LHVJ g−118,41017,14017,11015,340
SDg cm3 0.880.880.820.89
ADg cm31.53 1.551.561.53
p%42.5043.2047.1041.80
FVI-173.80159.30124.90105.90
Mad—moisture content; Ad—ash content; Vd—volatile content; HHV—higher heating value; LHV—lower heating value; SD—specific density; AD—absolute density; p—porosity; FVI—fuel value index
Table 4. Ultimate analysis of tested fuels.
ParameterUnitDigestate Type
10CS90AP25CS75AP50CS50AP75CS25AP
C% 44.70044.60045.90044.400
H%6.1006.3006.4006.300
N%0.9001.4001.4001.500
O%29.60032.60031.40032.400
S%0.1000.1000.2000.200
Cl%0.3100.2900.34000.360
H/C-0.1400.1400.1400.140
O/C-0.6600.7300.6800.730
Namg kg−14.44899.90064.84049.110
Mgmg kg−145.330112.300110.900111.700
Kmg kg−1536.900871.300789.800726.100
Camg kg−177.1002271.0001607.000998.200
Pmg kg−1100.900205.000239.700241.200
Crmg kg−10.0260.4030.1080.0790
Mnmg kg−11.003-47.61036.460
Femg kg−12.66517.90017.46012.770
Nimg kg−10.0608.3600.2920.062
Cumg kg−10.2720.4020.8380.756
Znmg kg−10.4988.4704.0077.710
Cdmg kg−10.0040.0160.0100.008
Pbmg kg−10.5150.9460.2480.326
Table 5. Activation energy values obtained using the OFW and KAS methods together with the determination coefficients R2.
αOFWKAS
E kJ mol−1R2E kJ mol−1R2
0.05025.1000.07518.8000.040
0.07584.2000.24880.5000.214
0.100156.4000.462156.3000.436
0.125210.1000.644212.5000.626
0.150236.4000.765240.1000.752
0.175247.2000.838251.4000.829
0.200250.1000.885254.1000.879
0.225249.6000.915253.7000.910
0.250247.1000.936250.2000.933
0.275243.7000.951247.4000.947
0.300240.4000.961243.8000.958
0.325236.8000.967240.0000.965
0.350233.8000.973236.8000.971
0.375230.6000.975233.3000.973
0.400228.6000.978231.2000.976
0.425227.1000.979229.5000.978
0.450225.3000.981227.7000.979
0.475223.5000.982225.7000.981
0.50220.6000.984222.6000.983
0.525216.9000.986218.5000.985
0.550211.5000.988212.8000.987
0.575205.0000.991205.9000.989
0.600199.5000.993200.1000.993
0.625195.7000.996195.9000.995
0.650191.9000.998191.8000.997
0.675183.9000.999183.3000.999
0.700174.7000.999173.3000.999
0.725169.4001.000167.6001.000
0.750173.4000.999171.6000.999
0.775180.4000.999178.7000.999
0.800188.2000.998186.9000.998
0.825194.6000.997193.5000.996
0.850201.1000.996200.1000.996
0.875207.6000.996206.8000.996
0.900209.2000.998208.4000.998
0.925204.8000.999203.6000.999
0.950203.7000.998202.1000.998
0.975205.6000.963203.8000.958
OWF—Ozawa-Wall-Flynn, KAS—Kissinger-Akahira-Sunose
Publisher’s Note: MDPI stays neutral with regard to jurisdictional claims in published maps and institutional affiliations.

