1. Introduction
In recent years producing the energy from renewable sources has become a priority for many countries around the world. In 2020 renewable energy use increased by 3% and demand for all other fuels declined. Almost 7% growth in electricity generation from renewable sources has been noted [
1]. Share of renewables in global electricity generation increased to 29% in 2020 from 27% in 2019. More and more countries are investing in the development of new, clean technologies that will reduce the negative impact of human activities on the environment. Such solutions must be effective and efficient at the same time. In the case of renewable energy, especially solar, wind, and hydro, climatic conditions play a crucial role. In this respect, countries differ significantly from each other. This is one of the reasons for the notable discrepancies between the shares of renewable energy sources (RES) in each country. Other reasons are political, economic, technological, awareness-related, and related to the natural resource base [
2,
3].
Continuity and steadiness play the most important roles in energy production. Production of energy from renewable sources carries the risk of discontinuity, resulting from its dependency on changing weather conditions. Moreover, significant differences between the periodic energy demand and its production from RES are often being observed [
4]. It can happen that relying on energy production from RES will not meet all energy needs–there are so-called blackouts. Then, it is necessary to use the energy from other sources–conventional ones. On the other hand, there can be opposite situations in which energy production exceeds demand. They are not favourable. For this reason, basing on energy production only from renewable sources is problematic, especially in the countries with changing weather conditions [
5]. Energy storage is one of the solutions to solve this problem.
2. State of the Arts
There are many methods for energy storage. Smart Energy International [
6] divides the different types of energy storage into the following technology categories:
Batteries;
Thermal;
Mechanical;
Pumped hydro;
Hydrogen.
Use of batteries is the most common way of energy storage. There are lithium-ion, lead-acid, nickel-cadmium, sodium-sulphur and zinc-air batteries as well as flow batteries with liquid electrolyte. Thermal energy storage involves the capture and release of heat or cold in a solid, liquid, or air. Mechanical storage uses kinetic forces of rotation or gravitation to store energy. It can include a system based on flywheels, compressed air, and gravity. Energy storage with pumped hydro systems require water cycling between two large reservoirs at different levels. Energy is stored in the water in the upper reservoir, which is released when the water is discharged into the lower reservoir. Energy storage with hydrogen involves its conversion from electricity via electrolysis for storage in tanks. From there it can undergo either re-electrification or supply to emerging applications [
6,
7].
Energy storage technology is a relatively new direction in the energy industry but the key one in terms of benefits. Applying energy storage can improve the energy system’s effectiveness, increase the use of renewables, and enhance grid stability. In practice, various energy storage solutions are applied around the world. Examples of practically applied solutions are described below.
The British start-up Gravitricity (Edinburgh, UK) has developed an energy storage technology that is based on the use of gravity. It can be described as an extended version of the existing technology used in pumped storage power plants. The Gravitricity system is based on a winch system, used to store potential energy. It uses large loads pulled into the shaft area. Electrical power is generated or absorbed by lowering or lifting the weight up. The potential energy of weights is converted into kinetic energy, which is then converted into electric energy. Charging a gravity-based battery is lifting the weight up the shaft, and discharging it–lowering the weight. The service life of Gravitricity is at least 50 years and it is estimated to provide 80–90% efficiency. Gravitricity is able to generate electricity with a power of 1 to even 20 MW in the time interval from 15 min to 8 h. Its energy storage system can provide power to more than 13,000 households for two hours. If necessary–it can provide a short-term impulse of very high power. At present, the Gravitricity creators are working on a demo platform in Scotland. The 16-meter-high structure is connected to the local power network. Its total output is 250 kW. Subsequently, they will build the prototype of energy storage facilities in South Africa, Australia, and European countries [
8].
Mountain Gravity Energy Storage (MGES) is another example of an energy storage system based on gravity. It is based on lifting a certain mass during charging and lowering it during discharging. This solution uses sand, gravel, or other material located on a mountain peak. It works by transporting sand or gravel from a lower storage site to an upper level. It stores potential energy from the upward travel and releases it on the way back down. MGES is also suggested to be combined with hydropower in the case of river streams on a top–then, in periods of high availability, water could replace sand and gravel in the storage vessels.
On the other hand, using sand, brings many benefits, especially economic. Firstly, sand is inexpensive. Secondly, unlike water, it does not evaporate. It means that potential energy is not being lost, and sand can be reused again and again. It is also a promising solution for dry regions. MGES can extend over 5000 meters, allowing for long-term storage. The cost of MGES ranges from 50–100 USD/MWh of installed capacity [
9,
10].
The Swiss energy storage company Energy Vault (Lugano, Switzerland) uses solutions that are similar to Gravitricity. However, it uses concrete blocks as weights. The construction is a six-arm crane on top of a 33-story tower. It is worth noticing that use of software that automates the process, controls cranes, and manages energy resources depending on the current demand is an important element of the system [
11].
The Rehau solution is an example of thermal energy storage. The Swiss company Rehau (Rehau, Germany) uses the road infrastructure as a source of thermal energy. Rehau uses the systems of thermal collectors that are built into the surface. The collectors are connected with PE-Xa probes. In summer, solar heat is being recovered from the asphalt surface and stored underground. Afterwards, the heat is used in winter to remove snow and de-icing the road. A similar system can be installed in tunnel cases. The heat from the collectors is being transferred to the heat pumps and used for other purposes. This type of thermal energy storage has been successfully implemented in the Jenbach tunnel in Austria. The energy output ranged from 10 to 15 W/m
2. The stored energy was used to heat buildings above the tunnel [
12].
Many studies on the use of abandoned mines for energy storage are described in the literature. For example, they refer to thermal energy storage [
13,
14], compressed air energy storage [
15,
16,
17], underground pumped hydroelectric energy storage [
16,
18,
19,
20,
21,
22,
23], and gravity energy storages with suspended weights in mine shafts [
24].
Poland also has considerable, but not fully recognized, potential for the use of mechanical energy storage in mine shafts. The infrastructure of many mines, that are not operated, can be used as the basis for building energy storage systems. Some mines have been merged within the process of restructuring the Polish mining industry [
25]. When one of the merged mines remains out of use, it cannot be shut down because of technical and organizational reasons, in particular those related to pumping water and ventilation [
26]. It is worth noting that the shafts are shut down by filling them with material, aproperly selected for the hydrogeological conditions [
27]. Then, the shafts of a closed mine are left unused. The lack of possibility for further underground mining or backfilling the shaft/s causes an “impasse”. However, they show great potential for energy storage. Based on this premise, the article presents the issue of using mining shafts in Poland for energy storage.
3. Test Objects–Shafts
In the area of Upper Silesia, hard coal mining on an industrial scale began in the second half of the 18th century, namely in 1748, when the first mines were established near Ruda (now Ruda Śląska) and Murcki (southern part of Katowice). Coal mining usually began at the outcrop of the seam using the open-pit method, and when shallow coal was extracted, vertical shafts were developed as early as 1818, some shafts reaching up to 70 m depth. In the second half of the 19th century, deeper deposits of hard coal began to be extracted, so the depth of the shafts increased, and in 1911 a 774 m deep shaft was opened in the Karsten-Zentrum mine, while in the interwar period (1918–1939) the deepest shaft in Poland reached a depth of 800 m [
28]. Since the beginning of the economic transformation in Poland, a downward trend has been noticeable in the volume of extraction, and thus also in the number of coal mining plants and eventually, in the number of operating mining shafts. Between 1990 and 2002, 102 shafts (32 mining, 38 ventilation, 32 exit and auxiliary shafts) were shut down in Poland.
In the last decade in Europe (especially in the European Union countries) there has been a noticeable trend of abandoning mining and coal-based energy. In 2012, 128 million tons of hard coal and 433 million tons of brown coal and lignite were mined in the countries of Euracoal, while hard coal was imported at the level of 211 million tons [
29]. The effect of the EU policy of supporting renewable energy sources (RES) as well as the CO
2 emission allowance trading system (an increase from less than €10 per ton of CO
2 in 2012 to over €50 per ton of CO
2 in 2021) is the decision of the Polish authorities to close all steam coal mines by 2049. This creates an opportunity to implement a gravitational energy storage system, which is also being considered in Poland. Only within the structure of Polska Grupa Górnicza, the largest mining company in Europe, there are 70 shafts, the vast majority of them deeper than 300 m, which is the minimum depth necessary to implement the Gravitricity system.
Table 1 lists shafts with a depth of more than 1000 m along with the planned date of liquidation of a given Movement.
Due to the possible further development of energy storage technologies, shafts belonging to mines to be liquidated in the coming years, as well as shafts currently within the structures of the Mine Restructuring Company, are particularly important for the implementation of the gravity energy storage system in Poland. This year, SRK (Spółka Restrukturyzacji Kopalń, Bytom, Poland) received the transfer of Ruch “Pokój”, which is part of the KWK “Ruda” coal mine with three shafts with a depth of 624 to 847 m. In 2028, the “Bolesław Śmiały” mine is planned to be decommissioned (4 shafts), and in 2029 the “Sośnica” mine (six shafts). The coming years may also see the decommissioning of one of the Tauron Wydobycie S.A. mines, which has 16 shafts, of which 14 are deeper than 300 m-at the time of writing, there is no agreed schedule for the company’s decommissioning. Before a decision about the implementation of a gravitational energy storage system in the shafts of these mines, it is necessary to assess their technical condition-the construction of an energy storage system requiring a major shaft renovation will probably prove to be economically ineffective.
4. Determination of Functionality Correctness
For the purposes of the case study of the implementation of gravity energy storage system, the Budryk KWK “Centrum” shaft, a property of the Mine Restructuring Company (SRK) located in Bytom was selected.
The beginning of mining at the site dates back to the late 1850s, when, after the end of calamine mining, hard coal was mined at the “Karsten” and “Centrum” mines. In the years 1950–1990 the mine operated under the name “Dimitrov”. On 1 September 1993, the Centrum mine merged with the Szombierki mine, thus creating the Centrum-Szombierki Hard Coal Mine. Decommissioning of KWK “Centrum-Szombierki” mine was a two-stage process. First, in 1996, the operation of the “Szombierki” division was ended, and then on 9 May 2015, pursuant to a resolution of Kompania Węglowa, division Ruch “Centrum” was put into liquidation, at the same time transferring the plant’s assets to SRK as a division of KWK “Centrum”.
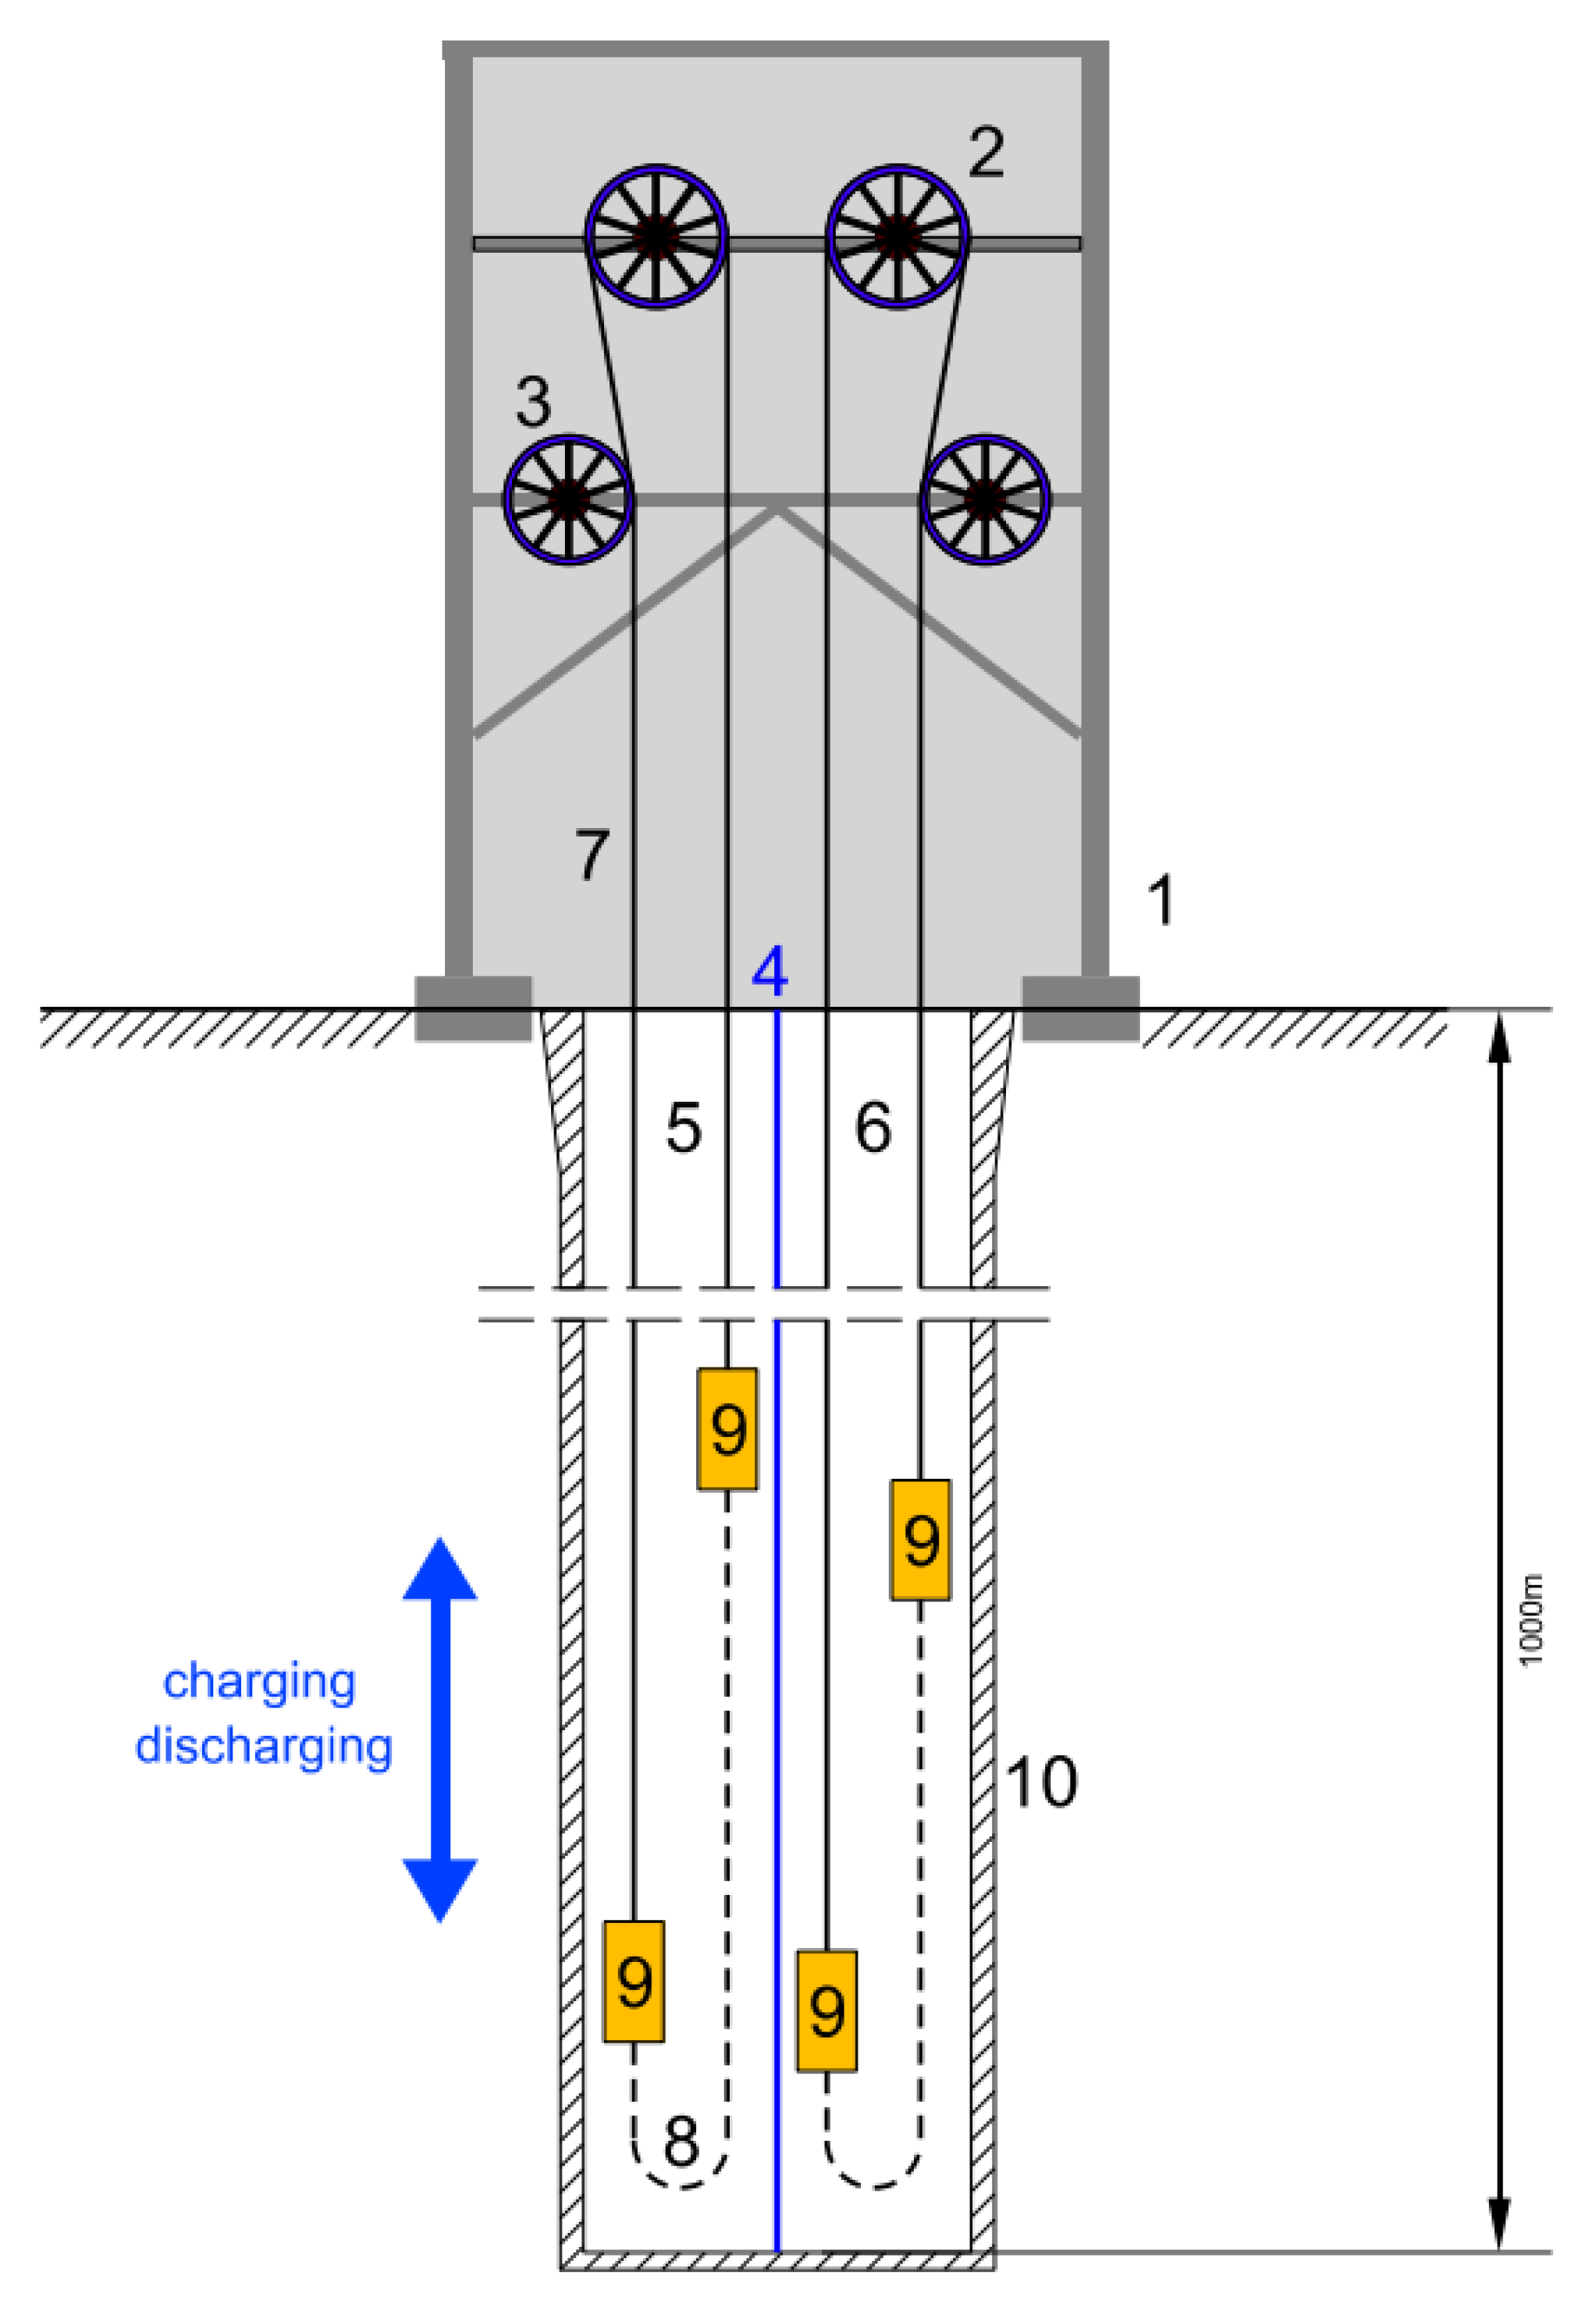
The Budryk shaft (
Figure 1) is located in the city of Bytom-the first (western) section of the shaft was put into operation in 1969 (up to the level of 774 m), and the second (eastern) section in 1973, (up to the level of 930 m). The total length of the shaft is 983.3 m with a diameter from 7.6 to 7.84 m. The Budryk shaft tower is a free-standing, tower structure erected between 1966–1968 to a height of +64.8 m. The hoisting machine was located at the +48 m level. The Budryk shaft together with the adjacent Staszic shaft, according to the plans of SRK, are to be transformed into the central pumping station, draining the eastern wing of the Bytom Basin by the end of 2021 [
30]. This pumping station will protect the last active coal mine in the area belonging to Węglokoks Kraj-KWK “Bobrek”, which, according to the approved schedule, will be closed in 2040. The technical specifications of the shaft are presented in
Table 2.
The establishment of the central pumping station assumes technical maintenance of the Budryk shaft (including water pumping costs) on the side of SRK at least until 2040. According to these assumptions, it can be assumed that the investment costs or operating costs for the use of the shaft as a gravitational energy storage are negligible.
5. Initial Calculations
Total energy that can be stored for one pass in a skip cage corresponds to the difference of potential energy of transported mass between the lower and upper positions in the given shaft. The basic assumptions for the calculations are presented in
Figure 2 and
Table 3.
The difference in potential energy of a conveyance loaded with mass Q = 12,500 kg over the path H = 929.14 m
Taking into account efficiency of the motor η = 0.9, energy that can be stored in one cycle is:
6. Calculations of Generated Power and Travel Time
The assumed speed of lowering the loaded conveyance is
v = 3 m/s -rotational speed of the motor is calculated.
For the purposes of estimating the expected motor power, the angular velocity is calculated:
and the static moment on the shaft:
The expected motor power will be
Estimated travel time for one cycle takes into account acceleration and deceleration during starting and braking at
a = 3 m/s
2. The time of starting and stopping will be
t1 =
t2 =
t = 1 s. With such assumptions, the distance travelled by the conveyance during starting and braking was calculated according to the following formula:
Time the conveyance travels at a constant speed is:
For the calculated expected motor power and travel time, the energy that can be stored in one cycle will be:
7. Conditions of Energy Market
Energy storage is one of the ways of responding to energy market demand. This demand can be identified by current energy prices, which represent a balance between energy supply and demand. However, it should be noted that energy prices also take into account factors other than demand/supply, not analysed in this work, such as the accuracy of energy demand forecasts in different perspectives.
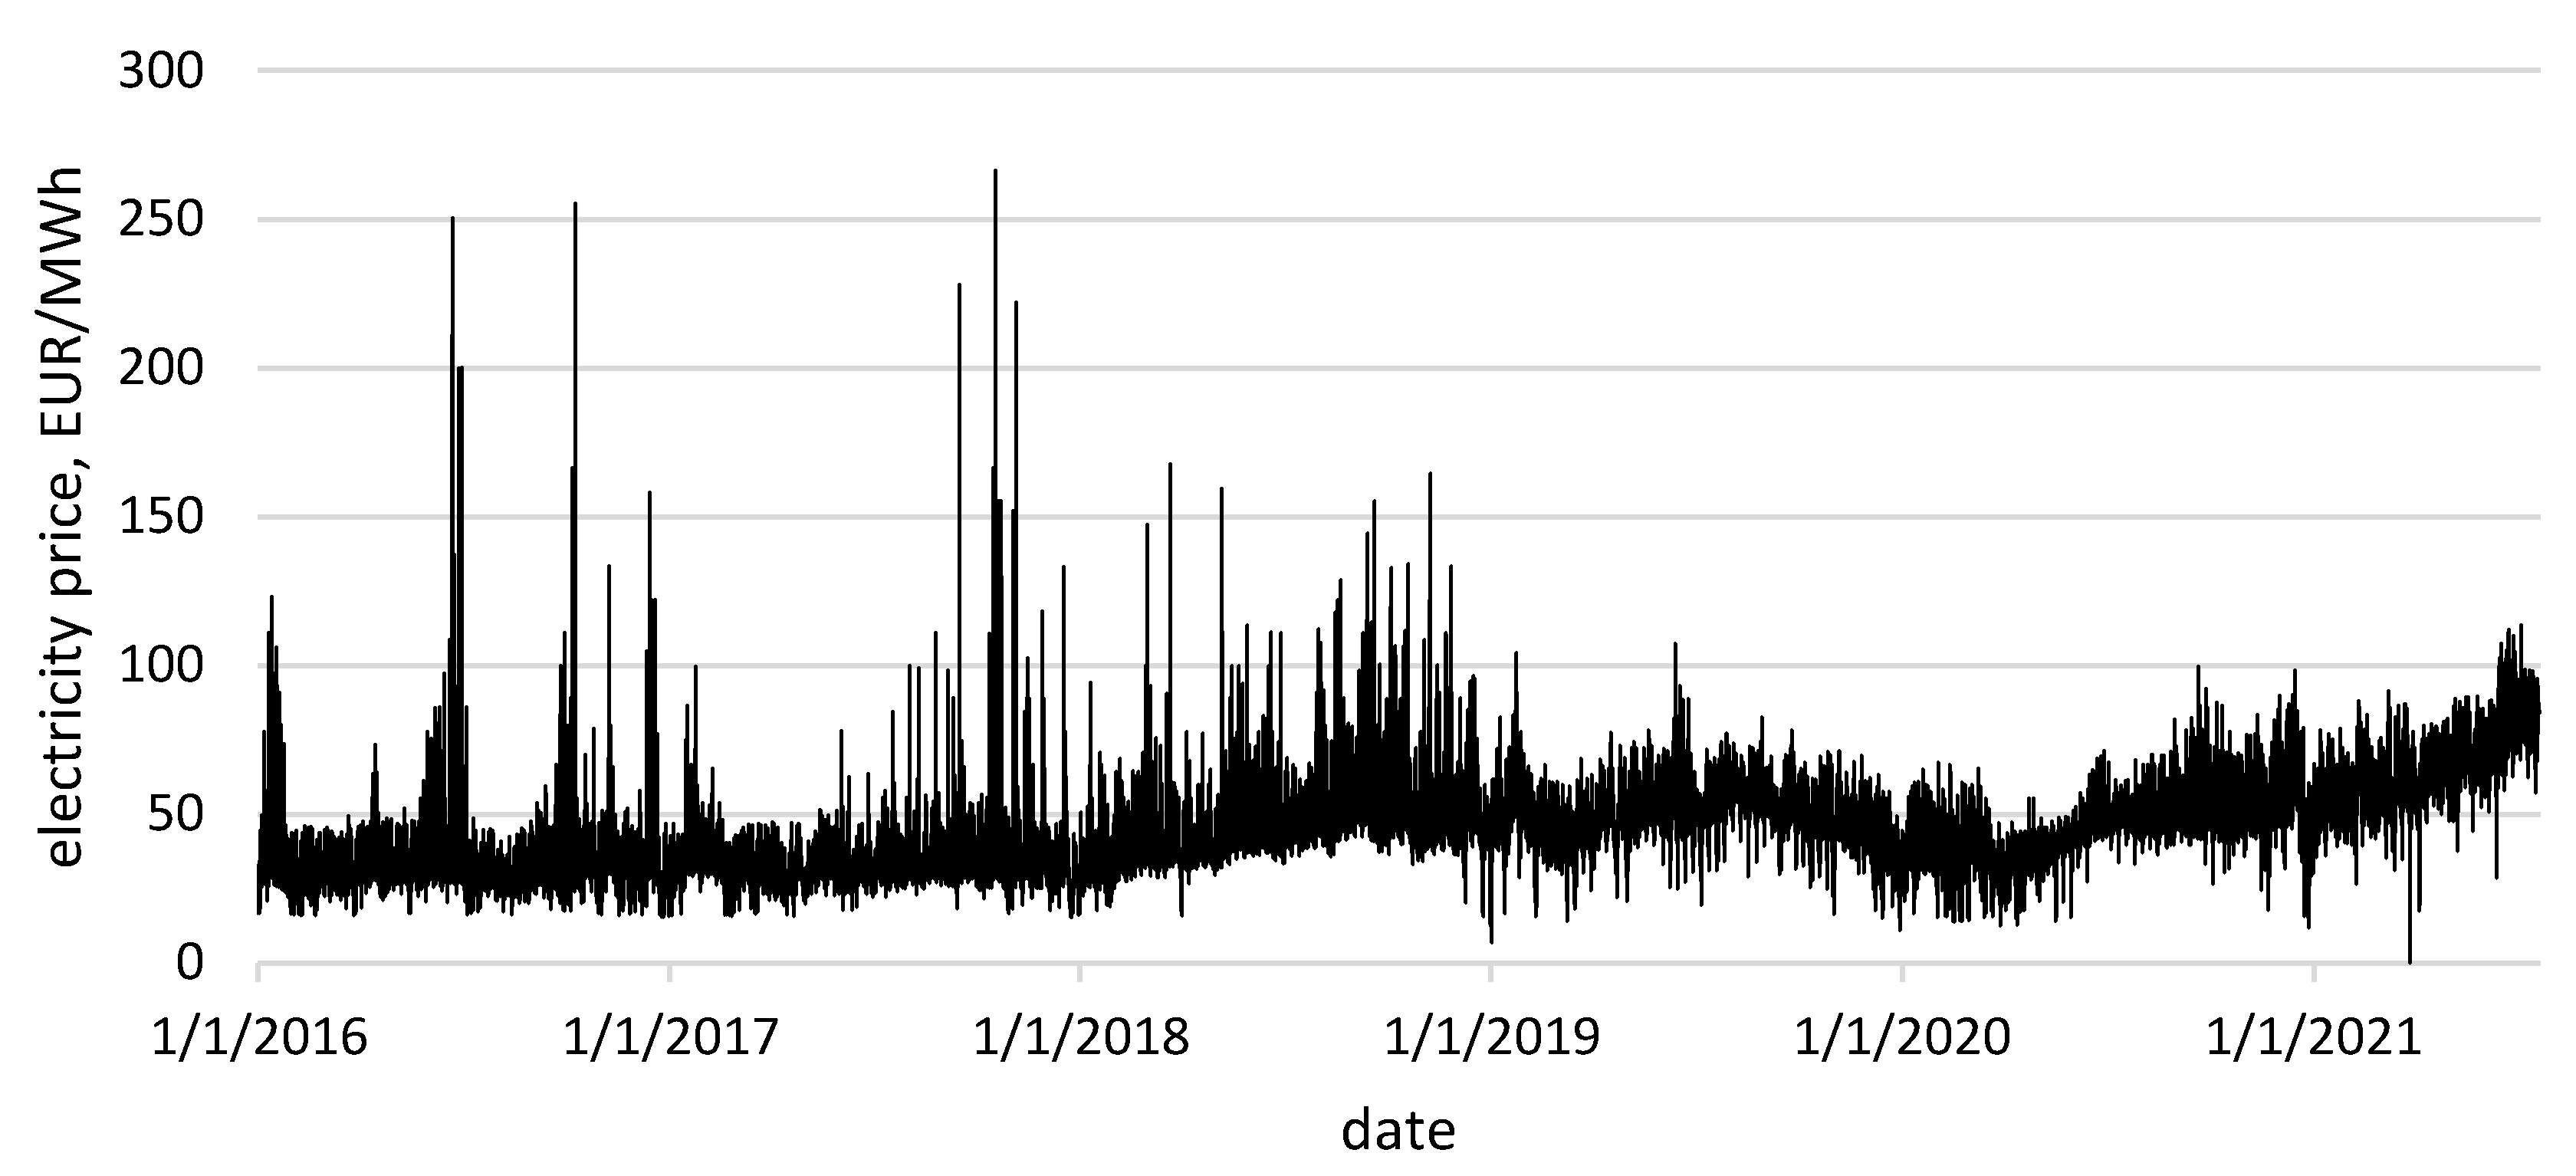
In Polish conditions, energy prices fluctuate on an hourly basis at most, and e.g., in Germany on a 15-min basis. The main electricity trading market in Poland is Towarowa Giełda Energii—TGE (Polish Power Exchange), and the primary measure (largest volume) of prices on an hourly basis is the day-ahead market (DAM). Historical DAM prices from the beginning of 2016 are presented in
Figure 3.
In 2020, COVID-19 contributed to relatively low energy prices. From the turn of 2020/2021, energy prices are strongly influenced by the cost of CO
2 emission rights, as 1 MWh of electricity in Polish conditions involves an average emission of about 0.75 Mg of CO
2. At current prices, emission rights alone are worth at least 40 EUR per 1 tonne of emitted CO
2 (July 2020), i.e., about half of the monetary value of energy. In addition, energy prices are affected by the introduction of the capacity market in Poland [
32,
33].
For the above reasons, considering the prices on the energy market prior to 2021 was insignificant. A detailed price was analysed in the period from 5 April 2021 in the scope of day-ahead and intraday market. These prices are shown in
Figure 4. and additionally, prices on the German market were taken into account to show the scale of possible price changes in the future on the basis of a market with a higher RES share (Poland is aiming for a higher RES share in the energy mix) [
32,
34].
Energy prices in Poland in the analysed period were practically never lower than 40 EUR/MWh (with minor exceptions), while in Germany prices were negative on several occasions. Detailed ordered price values are presented in
Figure 5.
The smaller amount of data with IDM prices is due to the fact that there was no trading every hour in the analysed period. It can also be noticed that the price changeability on the German market is much greater in the range −70 to 150 EUR/MWh than in Poland, i.e., for DAM 22-113 EUR/MWh. Due to the lack of data, the DSR market was not included in the calculations contained in the article.
8. Economic Analysis
Table 4 presents an analysis of the energy storage efficiency in a shaft. The basic assumptions of this analysis were as follows:
The conveyance performed only two cycles a day to take advantage of the effect of low prices at night and high prices during peak hours,
Prices-fixing 1 at the Polish Commodity Power Exchange (POLPX),
Cost of energy purchased: the product of the energy required to lift the weight and the minimum price during the previous day (night hours),
Cost of energy sold: product of the energy [MWh] generated as a result of lowering the weight in the shaft and the maximum price in peak hours.
In the calculation of the economic effect, it was assumed that energy would be purchased at minimum prices (between 3 and 5 am) and sold at maximum prices during peak hours. This approach is an approximation of the maximum effect that can be achieved for the analyzed case of energy storage in the shaft.
Figure 6 presents changeability of the economic effect (profit) for approx. 380 observations, in the July 2020–July 2021 perspective. The right side of this figure is a histogram-the distribution of economic effects converted into 365 days a year. It can be seen that there are 90% of all observations between 150 Euro and 716 Euro. The average value was 401 EUR. It can also be seen (left side of
Figure 6) that the economic effect is of high periodic changeability, resulting from the difference between the minimum and maximum market energy prices.
In turn, in
Table 4 statistics of purchased and sold energy are compiled, which are the basis for estimating the daily and annual economic effect broken down by the consecutive months of the analyzed period. The minimum and maximum values are the daily values of the lowest energy prices at night and the highest during the day for a given month, respectively. The value of purchased energy was determined for the minimum value and the value of energy sold for the maximum value of the price. The economic effect is presented both on a daily and annual basis.
Analysing the results, the following can be concluded:
the positive economic effect is only the result of speculative transactions on the energy price market, and the process itself does not generate an energy surplus,
the effects show a cyclical tendency, with the growing trend of energy prices on the POLPX,
the maximum annual effect of 550–770 Euro is visible for the winter months, due to the highest differences in energy prices during the day,
the economic effect of averaging the daily minimum and maximum prices over the year was EUR 348.
The achieved economic effects (profit), resulting solely from the difference in energy prices on the market, are insignificant. In the case of other shafts of a closed mine (not used by SRK)-additional costs should also be taken into account, in particular, the costs related to maintenance of the shaft and the hoisting machine as well as pumping the water. If these costs were taken into account, however, the positive economic effects would be canceled out altogether.
In order to expand the scope of the analyzed research problem, two scenarios were simulated, in which the spread between extreme prices on the energy market was increased. In the first scenario (HigherBenefits), it was assumed that the minimum prices may be even 20% lower and the maximum prices 40% higher than the daily prices observed in subsequent periods. In the scenario of maximum effects (MaxBenefits), it was assumed that the minimum price will constitute 50% of the price from a given calculation period (based on historical prices), and the maximum will be twice as high (
Table 5).
On the basis of the results presented in
Table 5, it can be concluded that the effect achieved with a very large spread between the minimum prices at night and the maximum prices during peak hours is still not great. The average effect in scenario 1 is approximately 1146 EUR and in the MaxBenefits scenario 2344 EUR per year, respectively. The maximum economic effects in these scenarios are EUR 1737 and EUR 3217, respectively.
To sum up, the obtained economic effects (potential profits) of the analyzed solution are small and do not justify activities related to the implementation of such an undertaking on a shaft not functioning for other needs, due to the excessive costs of its maintenance.
9. Conclusions
The assessment of the gravity energy storage system implementation possibility with the use of existing mine infrastructure was the subject of analysis. The authors focused on the case of one shaft located within the structures of SRK and maintained to dewater an adjacent hard coal deposit that is still in operation.
The attached economic analysis showed that the positive economic effect is only the result of speculative transactions on the Polish Commodity Power Exchange (POLPX), and the process of storing energy in the shaft in the presented experiment does not generate energy surplus. The effects show a cyclical tendency, with electricity prices rising over the last year at the POLPX. The maximum economic effect, calculated per calendar year, varied from 550–770 EUR was recorded for the winter months when the greatest differences in energy prices during the day were recorded. The economic effect resulting from averaging the daily minimum and maximum energy prices on the POLPX calculated per year amounted to EUR 348.
The accompanying scenario analysis showed that even with a very large spread between the minimum prices at night and maximum prices during peak hours, the economic effect (profit) in such an experiment remains relatively low. Assuming a two-times increase in the maximum price and a two-times decrease in the minimum price, the economic effect reaches EUR 3217 per year. Therefore, there is no economic justification for taking activities related to the practical implementation of the presented solution, taking into account the current price conditions.
Despite the fact that in the literature and practice, the solutions on energy storage are applied, the case described in the article differs from others. It refers to the significant problem of using mining shafts, which stopped being utilized for mining purposes. Currently, Poland searches for new scientific and practical solutions in this area. It should be highlighted that the studied case is characterized by the lack of investment inputs. In assumptions, this case was favorable due to the negligible operating and investment costs which resulted from using existing infrastructure.
In practice, when assessing the technical and economic efficiency, additional costs should also be taken into account, in particular those related to the maintenance of the shaft and the hoisting machine as well as pumping water out. Taking these costs into account, however, would cancel out the positive economic effects.
It is worth emphasizing that from the scientific point of view, the results of the analysis provide new content and are the basis for further research in this area. The authors plan further tests in the field of:
Intensification of energy capacity per day in the above-mentioned modified solution;
Economic results if more shafts are used for energy storage;
Synergy effects in cooperation with other types of electricity storage.
Author Contributions
Conceptualization, J.K., P.O., P.K., D.P. and P.M; methodology, M.K., J.K. and D.P.; validation, P.K., J.K.; formal analysis, J.K., K.S. and D.K.; investigation, P.O., M.K. and J.K.; resources, J.K., P.O. and P.K.; writing—original draft preparation, J.K., M.K., P.O., K.S. and P.M.; writing—review and editing, K.S., J.K.; visualization, J.K., M.K.; supervision, J.K., P.M.; project administration, P.K., J.K., D.K. and P.M. All authors have read and agreed to the published version of the manuscript.
Funding
This research project received no external funding.
Institutional Review Board Statement
Not applicable.
Informed Consent Statement
Not applicable.
Conflicts of Interest
The authors declare no conflict of interest.
References
- International Energy Agency Global Energy Review 2021. Renewables. Available online: https://www.iea.org/reports/global-energy-review-2021/renewables (accessed on 27 July 2021).
- Stecuła, K.; Brodny, J. Decision-making possibilities in the field of excavated material quality shaping in terms of environmental protection, i.e., how to be greener in mining. In Proceedings of the International Multidisciplinary Scientific GeoConference Surveying Geology and Mining Ecology Management, SGEM, Albena, Bulgaria, 30 June–9 July 2018; Volume 18, pp. 243–250. [Google Scholar]
- Stecuła, K.; Brodny, J. Role and meaning of coal mining in poland. In Proceedings of the International Multidisciplinary Scientific GeoConference Surveying Geology and Mining Ecology Management, SGEM, Albena, Bulgaria, 30 June–9 July 2018; Volume 18, pp. 801–808. [Google Scholar]
- Olczak, P.; Jaśko, P.; Kryzia, D.; Matuszewska, D.; Fyk, M.I.; Dyczko, A. Analyses of duck curve phenomena potential in polish PV prosumer households’ installations. Energy Rep. 2021, 7, 4609–4622. [Google Scholar] [CrossRef]
- Stecuła, K. Decision-making Dilemmas in Mining Enterprise and Environmental Issues, i.e., Green Thinking in Mining. In Proceedings of the 18th International Multidisciplinary Scientific GeoConference Surveying Geology and Mining Ecology Management, SGEM, Albena, Bulgaria, 30 June–9 July 2018; pp. 357–364. [Google Scholar]
- Smart Energy International. The Different Types of Energy Storage and Their Opportunities. Available online: https://www.smart-energy.com/industry-sectors/storage/the-different-types-of-energy-storage-and-their-opportunities/ (accessed on 28 July 2021).
- Lepszy, S. Analysis of the storage capacity and charging and discharging power in energy storage systems based on historical data on the day-ahead energy market in Poland. Energy 2020, 213, 118750. [Google Scholar] [CrossRef]
- Gravitricity. Available online: https://gravitricity.com/ (accessed on 27 July 2021).
- Davies, R. Peak Performance: Could Mountains Create Long-Term Energy Storage? Power Technologies. Available online: https://www.power-technology.com/features/peak-performance-could-mountains-create-long-term-energy-storage/ (accessed on 11 September 2021).
- Hunt, J.D.; Zakeri, B.; Falchetta, G.; Nascimento, A.; Wada, Y.; Riahi, K. Mountain Gravity Energy Storage: A new solution for closing the gap between existing short- and long-term storage technologies. Energy 2020, 190, 116419. [Google Scholar] [CrossRef]
- Husseini, T. Tower of Power: Gravity-Based Storage Evolves beyond Pumped Hydro. Available online: https://www.power-technology.com/features/gravity-based-storage/ (accessed on 23 July 2021).
- REHAU. Underground Thermal Energy Storage. In Improving Efficiency Through Seasonal Heat Storage; Rehau: Burlington, ON, Canada, 2011. [Google Scholar]
- Ramos, E.P.; Falcone, G. Recovery of the Geothermal Energy Stored in Abandoned Mines. In Clean Energy Systems in the Subsurface: Production, Storage and Conversion; Hou, M.Z., Xie, H., Were, P., Eds.; Springer: Berlin/Heidelberg, Germany, 2013; pp. 143–155. [Google Scholar]
- Michel, F. Utilization of abandoned mine workings for thermal energy storage in Canada. Proceedings Effstock 2009 Paper 105, Session 11_1. Available online: https://talon.stockton.edu/eyos/energy_stud-ies/content/docs/effstock09/Session_11_1_Case%20studies_Overviews/105.pdf (accessed on 30 September 2021).
- Lutyński, M. An overview of potential benefits and limitations of Compressed Air Energy Storage in abandoned coal mines. IOP Conf. Ser. Mater. Sci. Eng. 2017, 268, 012006. [Google Scholar] [CrossRef]
- Menéndez, J.; Ordóñez, A.; Álvarez, R.; Loredo, J. Energy from closed mines: Underground energy storage and geothermal applications. Renew. Sustain. Energy Rev. 2019, 108, 498–512. [Google Scholar] [CrossRef]
- Xu, Y.; Zhou, S.; Xia, C.; Zhao, H.; Xue, X. Three-dimensional thermo-mechanical analysis of abandoned mine drifts for underground compressed air energy storage: A comparative study of two construction and plugging schemes. J. Energy Storage 2021, 39, 102696. [Google Scholar] [CrossRef]
- Shang, D.; Pei, P.; Zuo, Y. Techno-Economic Feasibility Analysis of Pumped Storage Hydroelectricity in Abandoned Underground Coal Mines. J. Energy Resour. Technol. 2020, 142, 122001. [Google Scholar] [CrossRef]
- Menéndez, J.; Schmidt, F.; Konietzky, H.; Bernardo Sánchez, A.; Loredo, J. Empirical Analysis and Geomechanical Modelling of an Underground Water Reservoir for Hydroelectric Power Plants. Appl. Sci. 2020, 10, 5853. [Google Scholar] [CrossRef]
- Shang, D.; Pei, P. Analysis of Influencing Factors of Modification Potential of Abandoned Coal Mine Into Pumped Storage Power Station. J. Energy Resour. Technol. 2021, 143, 112003. [Google Scholar] [CrossRef]
- Menéndez, J.; Loredo, J.; Fernandez, J.M.; Galdo, M. Underground pumped-storage hydro power plants with mine water in abandoned coal mines. In Proceedings of the IMWA 13th International Congress, Lappeenranta, Finland, 25–30 June 2017; pp. 6–13. [Google Scholar]
- Madlener, R.; Specht, J.M. An Exploratory Economic Analysis of Underground Pumped-Storage Hydro Power Plants in Abandoned Coal Mines. Energies 2020, 13, 5634. [Google Scholar] [CrossRef]
- Kitsikoudis, V.; Archambeau, P.; Dewals, B.; Pujades, E.; Orban, P.; Dassargues, A.; Pirotton, M.; Erpicum, S. Underground Pumped-Storage Hydropower (UPSH) at the Martelange Mine (Belgium): Underground Reservoir Hydraulics. Energies 2020, 13, 3512. [Google Scholar] [CrossRef]
- Morstyn, T.; Chilcott, M.; McCulloch, M.D. Gravity energy storage with suspended weights for abandoned mine shafts. Appl. Energy 2019, 239, 201–206. [Google Scholar] [CrossRef]
- Kicki, J.; Jarosz, J.; Dyczko, A.; Paszcza, H. The economic and technical aspects of mine closure in Poland. In Proceedings of the 14th International Symposium on Mine Planning and Equipment Selection, MPES 2005 and the 5th International Conference on Computer Applications in the Minerals Industries, CAMI 2005, Banff, AB, Canada, 1–3 November 2005; pp. 625–631. [Google Scholar]
- Wichur, A.; Frydrych, K.; Kamiński, P. Static calculations of mine shaft linings in poland (selected problems); Vertical and decline shaft sinking—good practices in technique and technology. In Proceedings of the International Mining Forum 2015, Cracow, Poland, 23–27 February 2015. [Google Scholar]
- Bukowski, P.; Buchta, M.; Małaszuk, T.; Kura, K.; Augustyniak, I.; Niedbalska, K. Zarys zasad planowania likwidacji kopalń podziemnych w Górnośląskim Zagłębiu Węglowym w świetle uregulowań prawnych. Biul. Państwowego Inst. Geol. 2019, 475, 27–34. [Google Scholar] [CrossRef]
- Frużyński, A. Zarys Dziejów Górnictwa Węgla Kamiennego w Polsce; Muzeum Górnictwa Węglowego: Zabrze, Poland, 2012; ISBN 978-83-935614-4-5. [Google Scholar]
- European Association for Coal and Lignite. EURACOAL STATISTICS. Available online: https://euracoal.eu/info/euracoal-eu-statistics/ (accessed on 21 July 2021).
- SRK.S.A. Co Dalej z Kopalnia Centrum. Available online: https://srk.com.pl/media/aktualnosci/Co-dalej-z-kopalnia-Centrum/idn:34 (accessed on 21 July 2021).
- Energy Instrat 2021. Available online: Energy.instrat.pl (accessed on 21 July 2021).
- Komorowska, A.; Benalcazar, P.; Kaszyński, P.; Kamiński, J. Economic consequences of a capacity market implementation: The case of Poland. Energy Policy 2020, 144, 111683. [Google Scholar] [CrossRef]
- Komorowska, A.; Kamiński, J. A review of the 2018 Polish capacity market auctions. Energy Policy J. 2019, 22, 75–88. [Google Scholar] [CrossRef]
- Jasiński, J.; Kozakiewicz, M.; Sołtysik, M. Determinants of Energy Cooperatives’ Development in Rural Areas—Evidence from Poland. Energies 2021, 14, 319. [Google Scholar] [CrossRef]
- TGE SA Polish Day-Ahead Market. Available online: https://tge.pl/electricity-dam (accessed on 21 July 2021).
| Publisher’s Note: MDPI stays neutral with regard to jurisdictional claims in published maps and institutional affiliations. |
© 2021 by the authors. Licensee MDPI, Basel, Switzerland. This article is an open access article distributed under the terms and conditions of the Creative Commons Attribution (CC BY) license (https://creativecommons.org/licenses/by/4.0/).


 ,
, 


