
Paleoenvironment and Organic Matter Accumulation Mechanism of Marine–Continental Transitional Shales: Outcrop Characterizations of the Carboniferous–Permian Strata, Ordos Basin, North China

 ,
,
Abstract
:1. Introduction
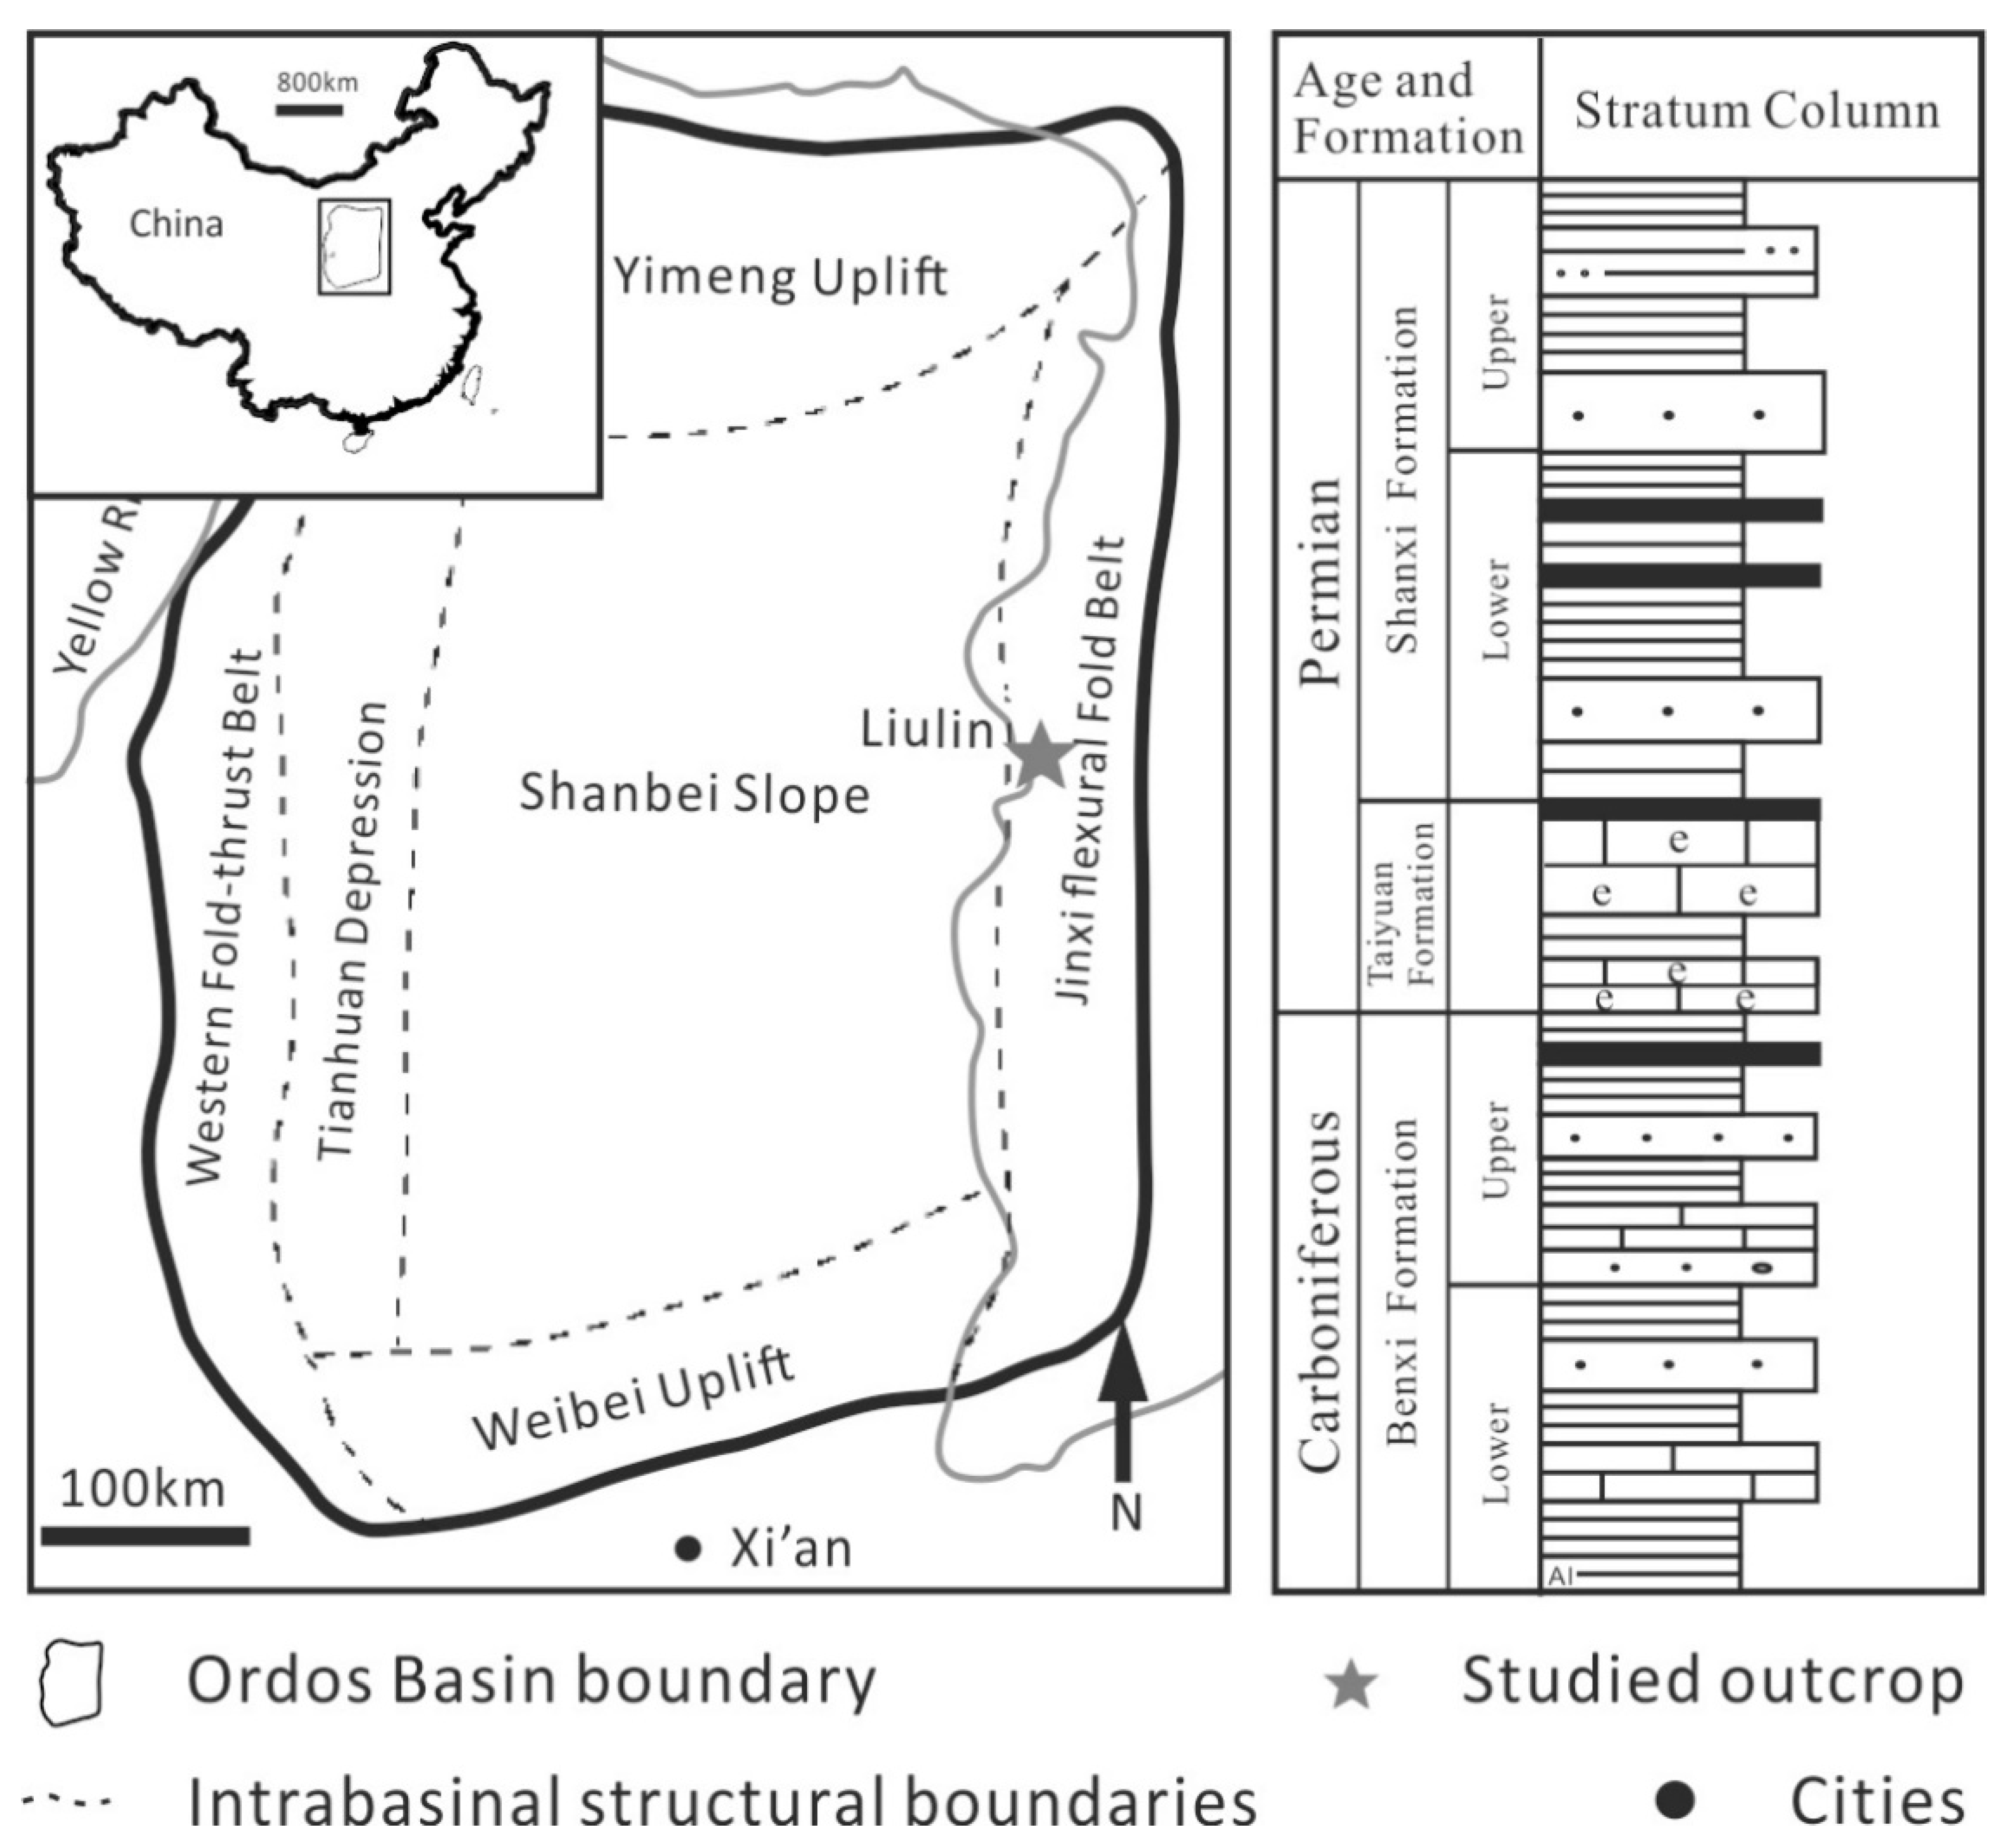
2. Geological Setting
3. Methods and Samples
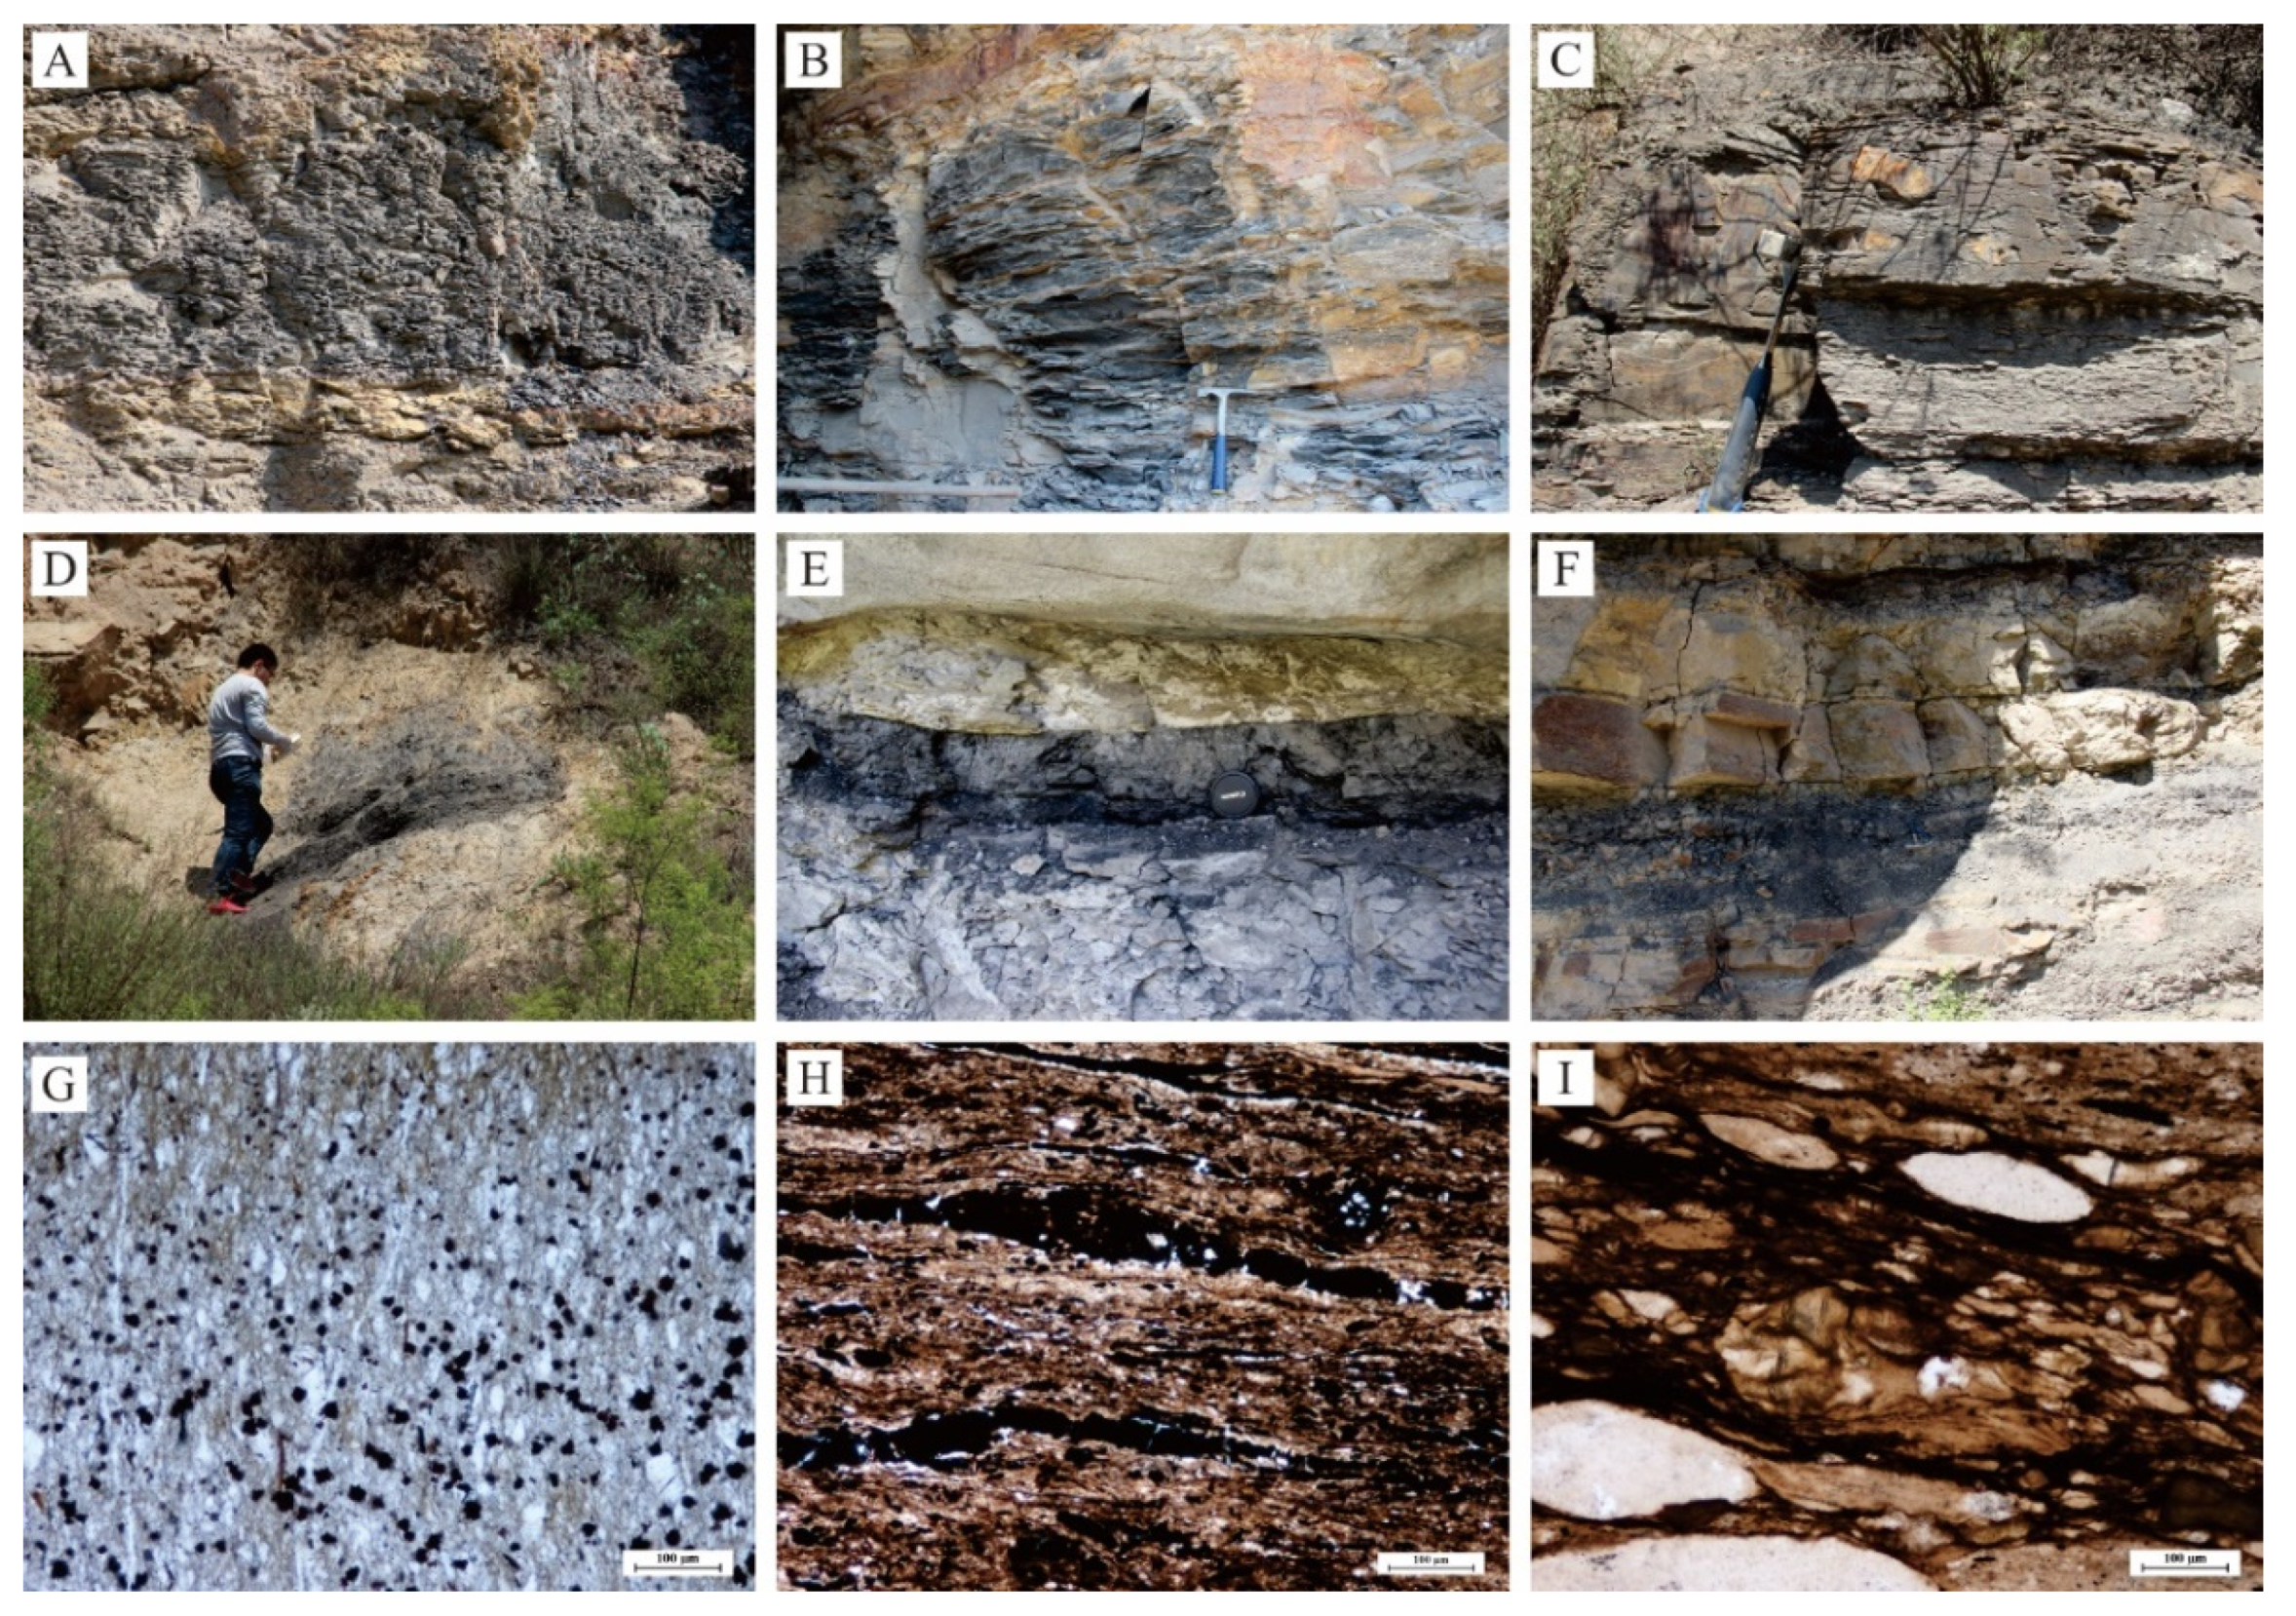
3.1. Sedimentological Characterization
3.2. Organic Matter Contents Analysis
3.3. Geochemical Analysis
3.4. Mineralogical Analysis
4. Results
4.1. TOC Content Characteristics
4.2. Mineralogy
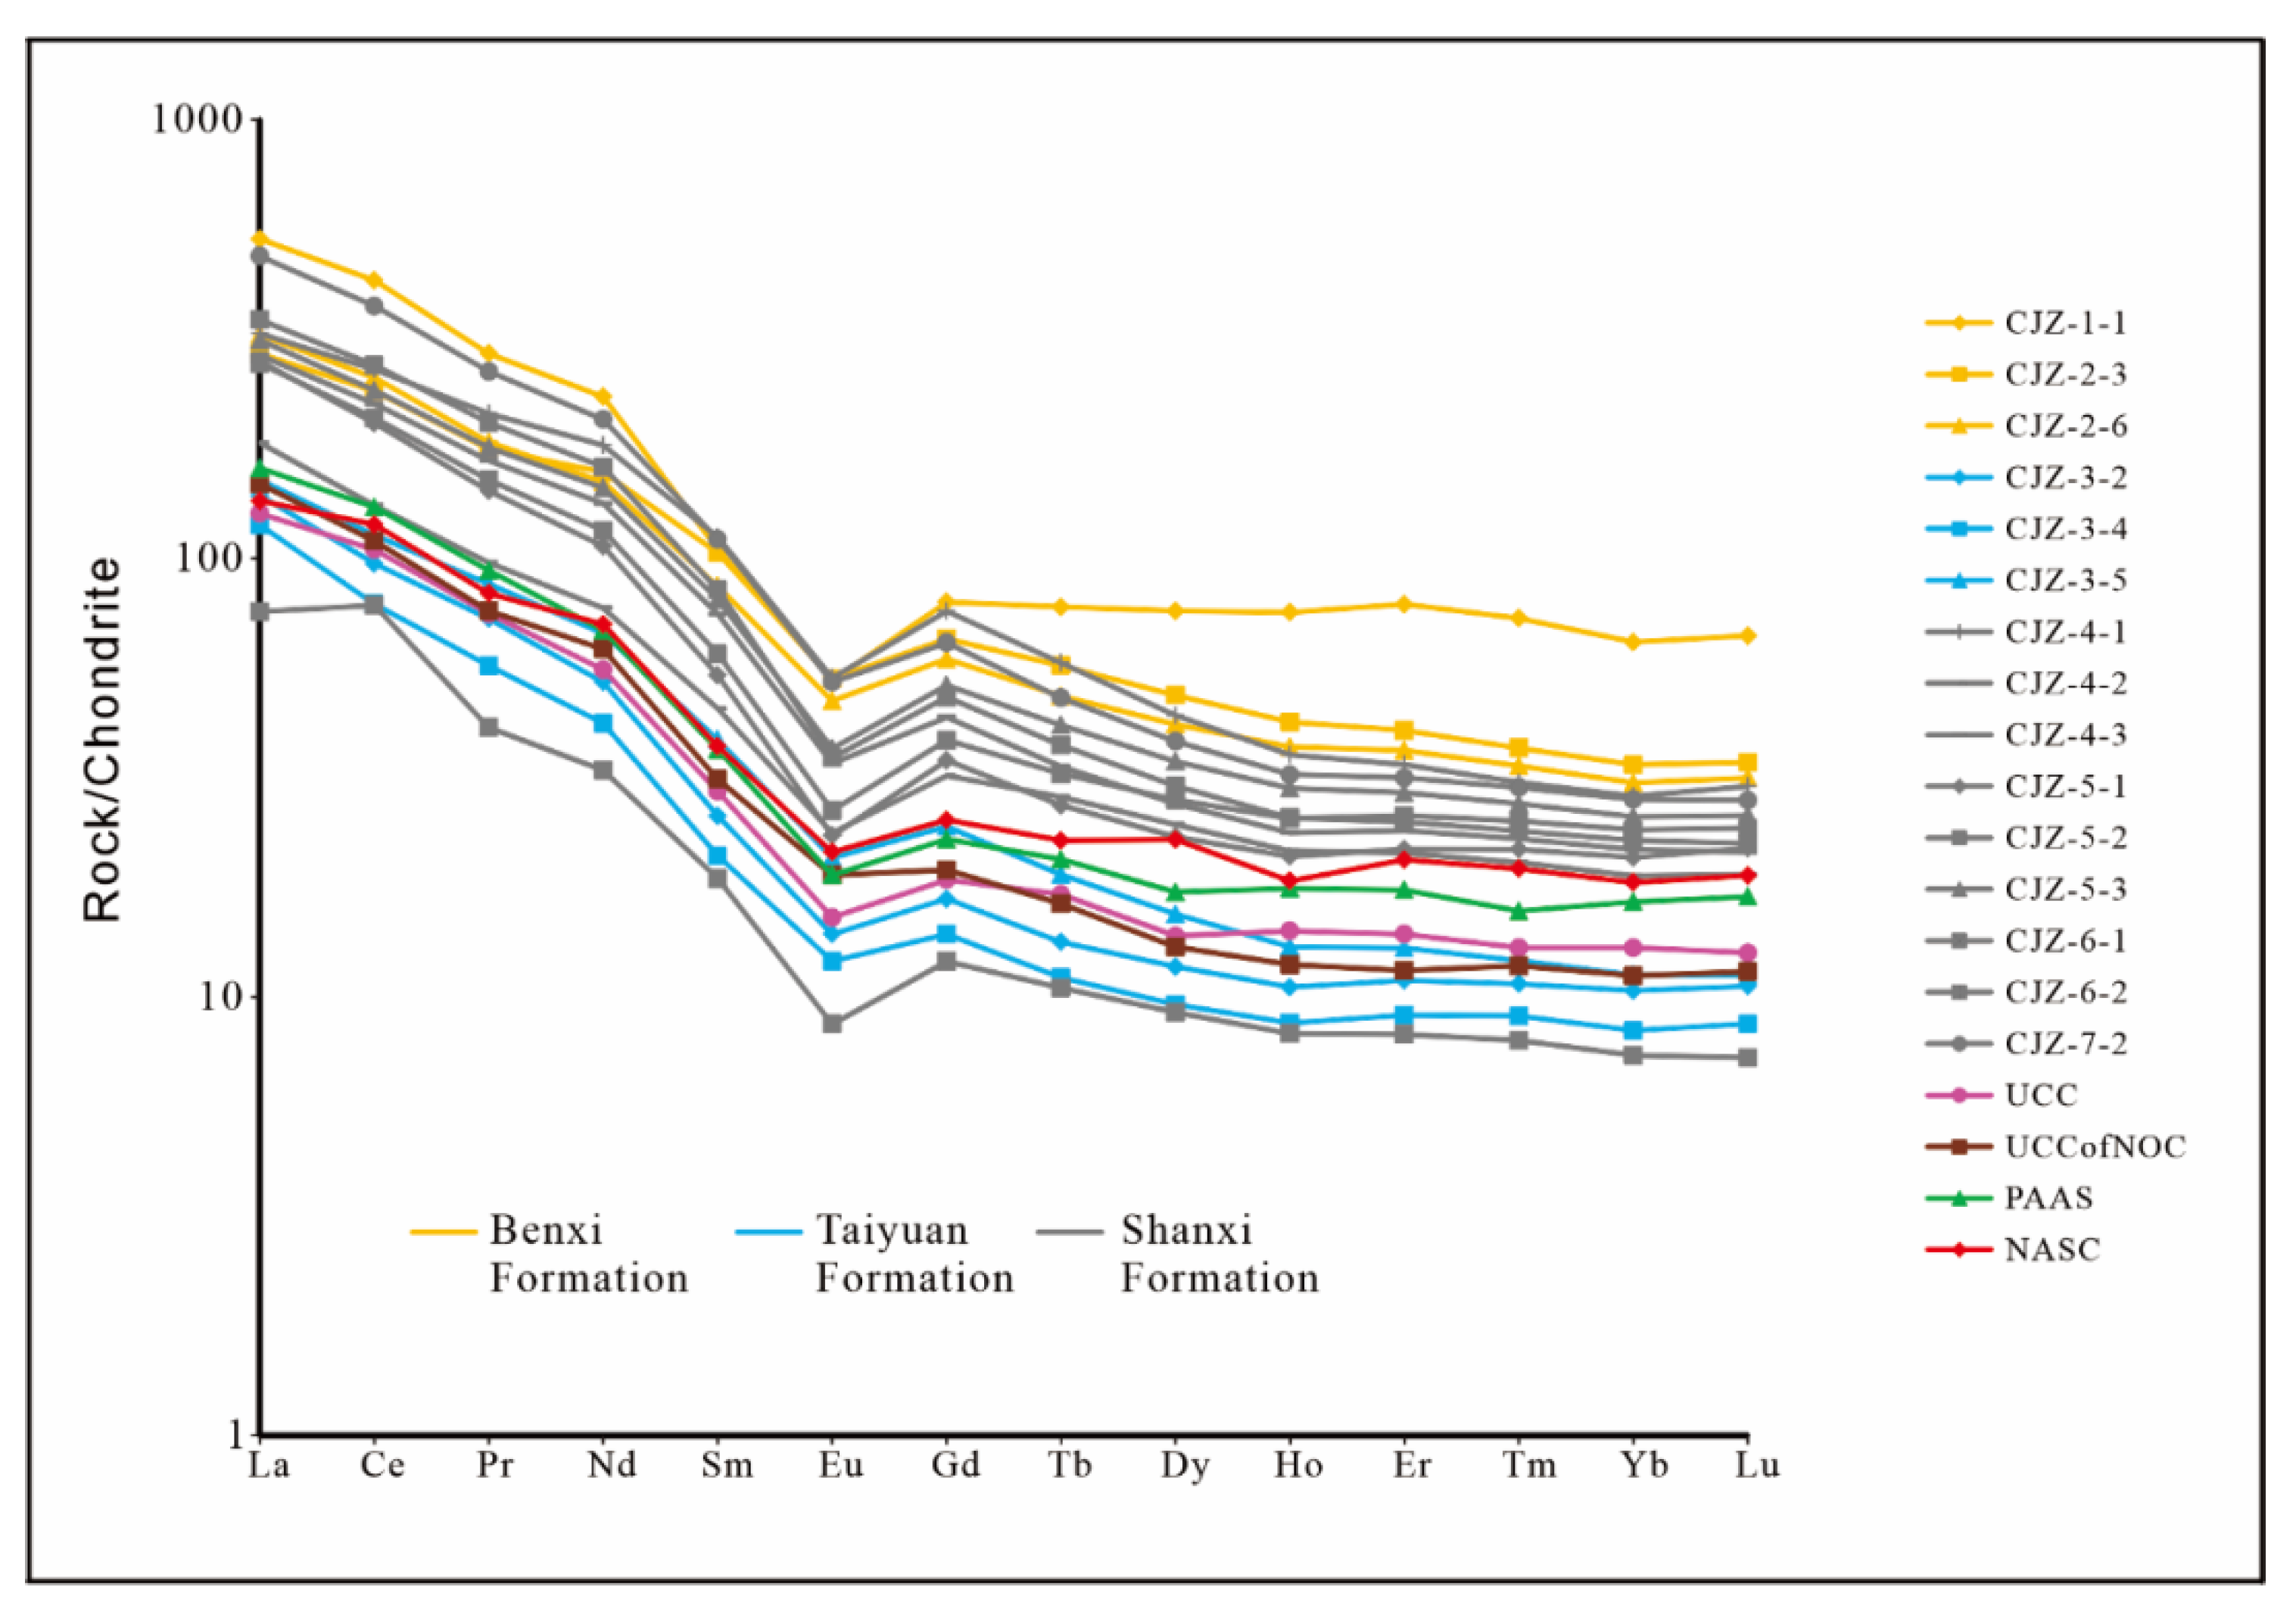
4.3. Geochemistry
5. Discussion
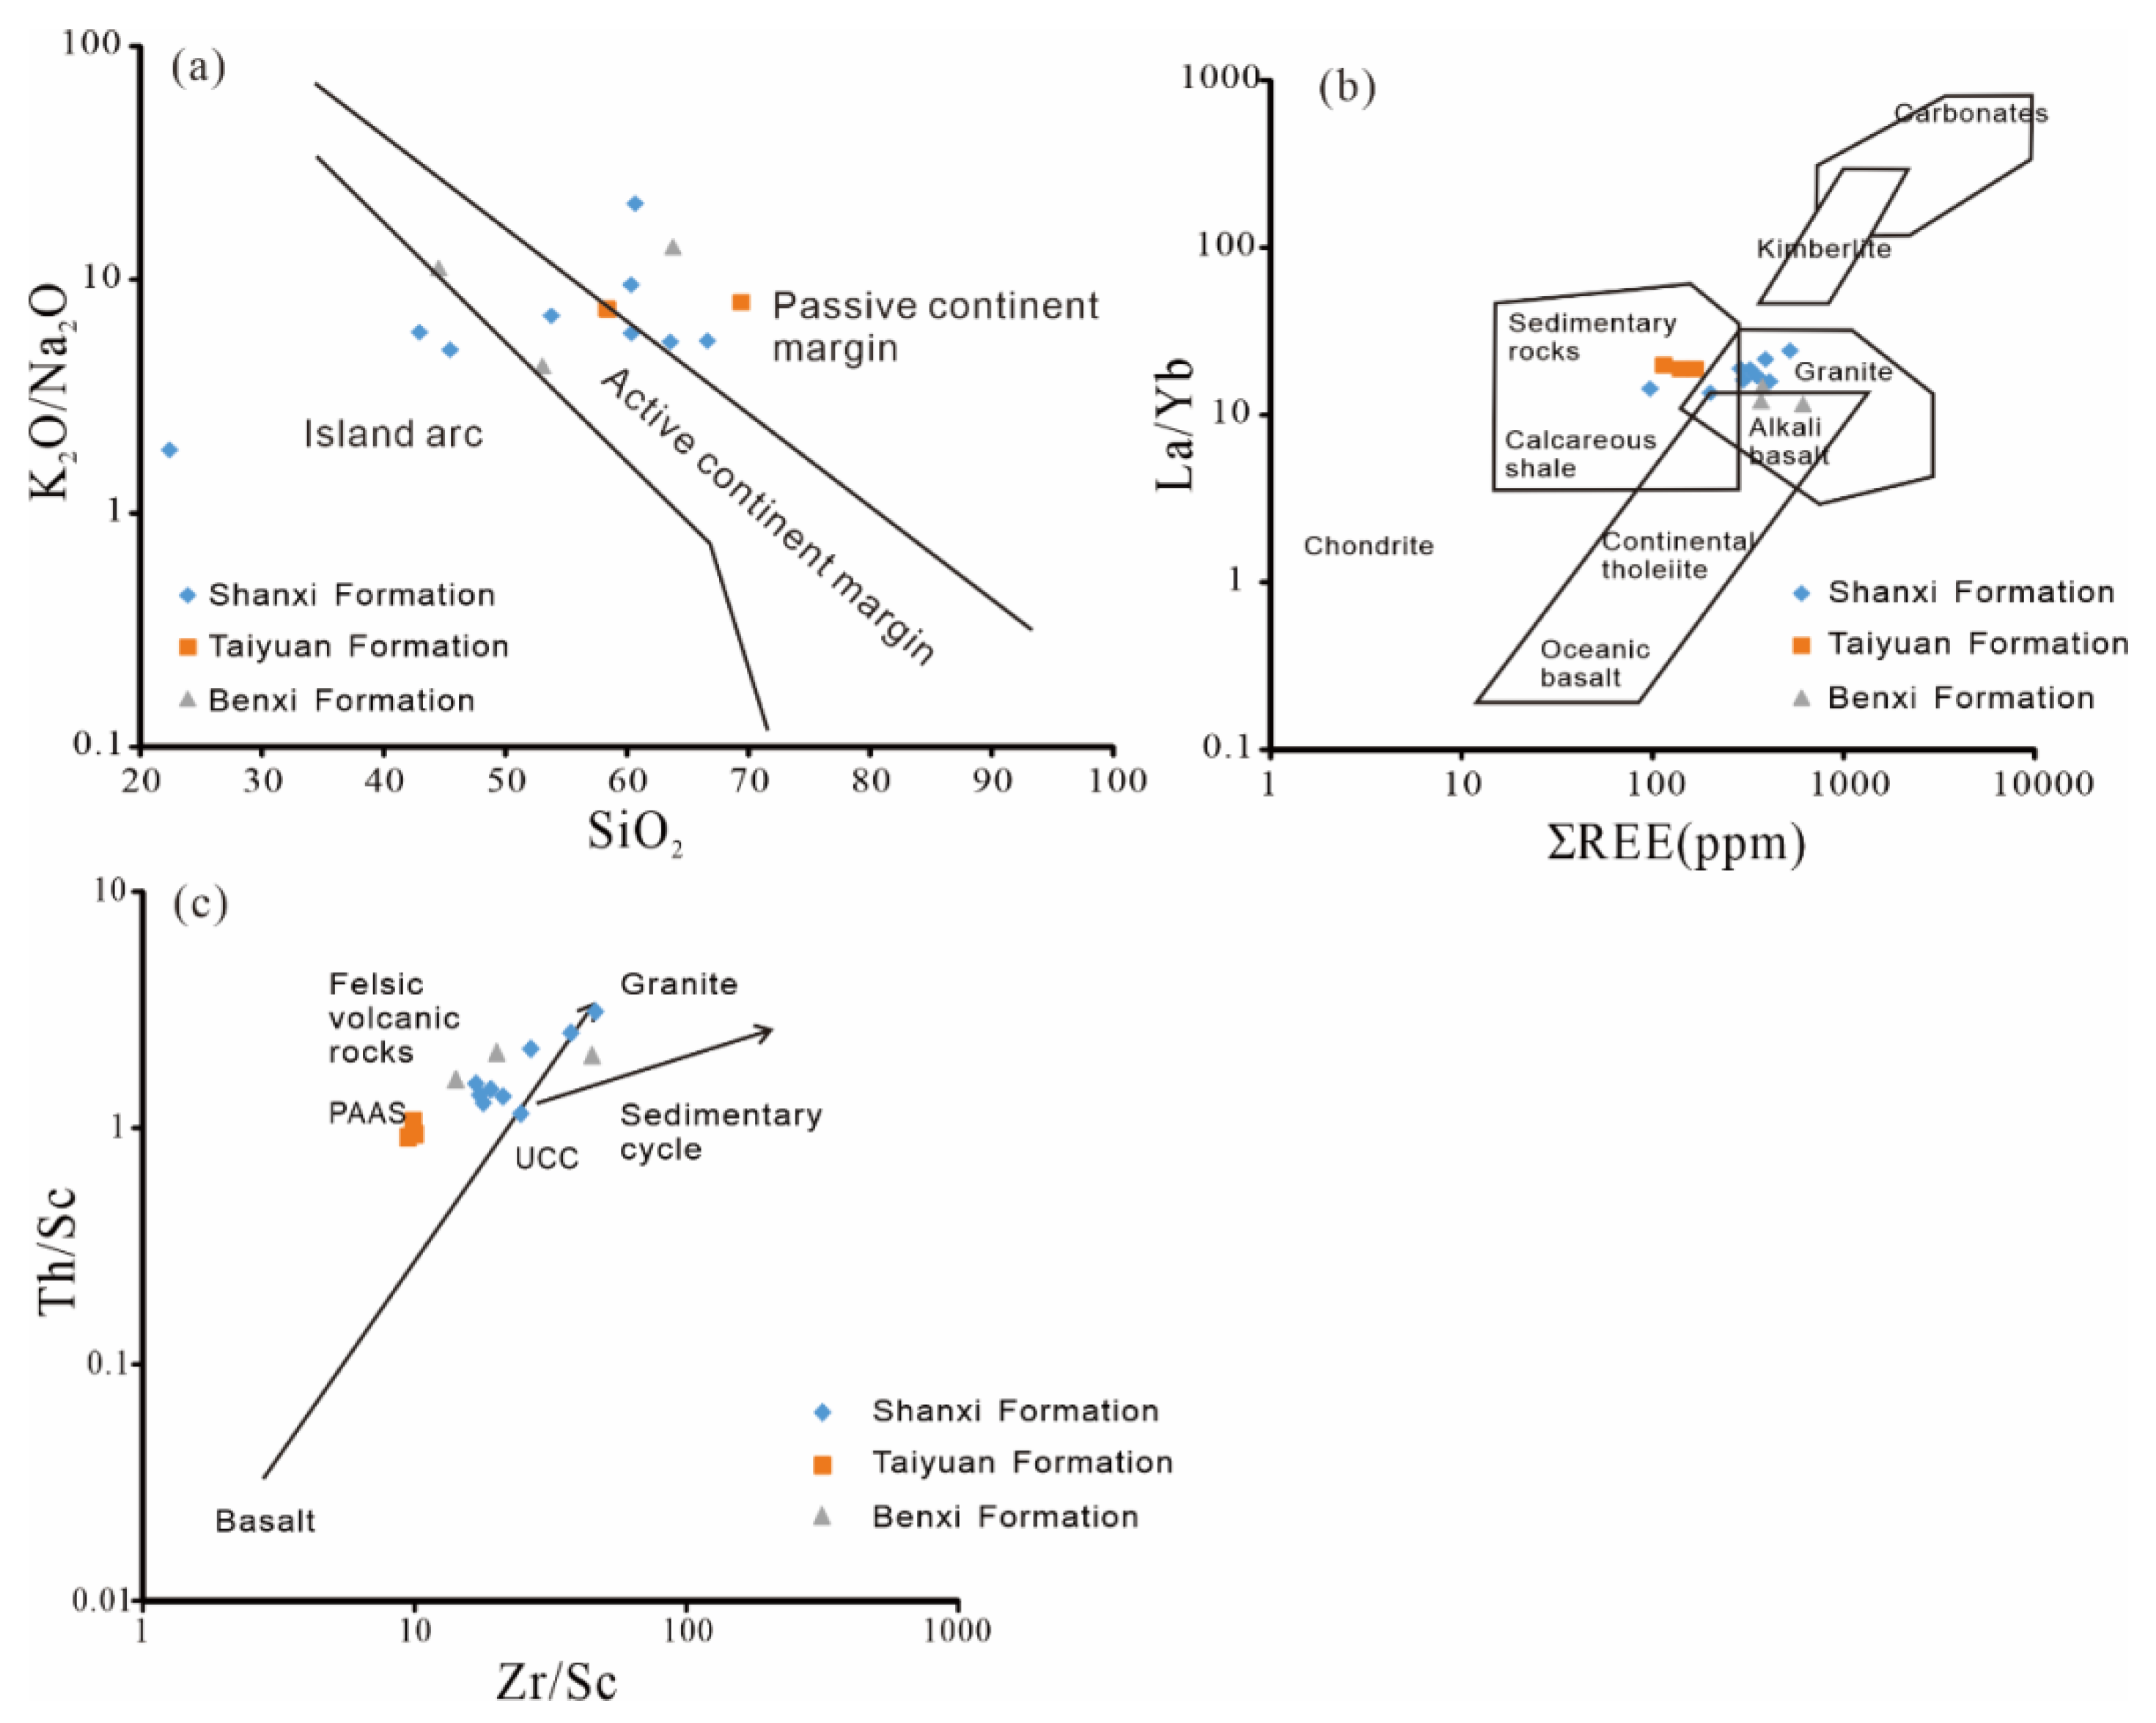
5.1. Structural Background and Sediment Source
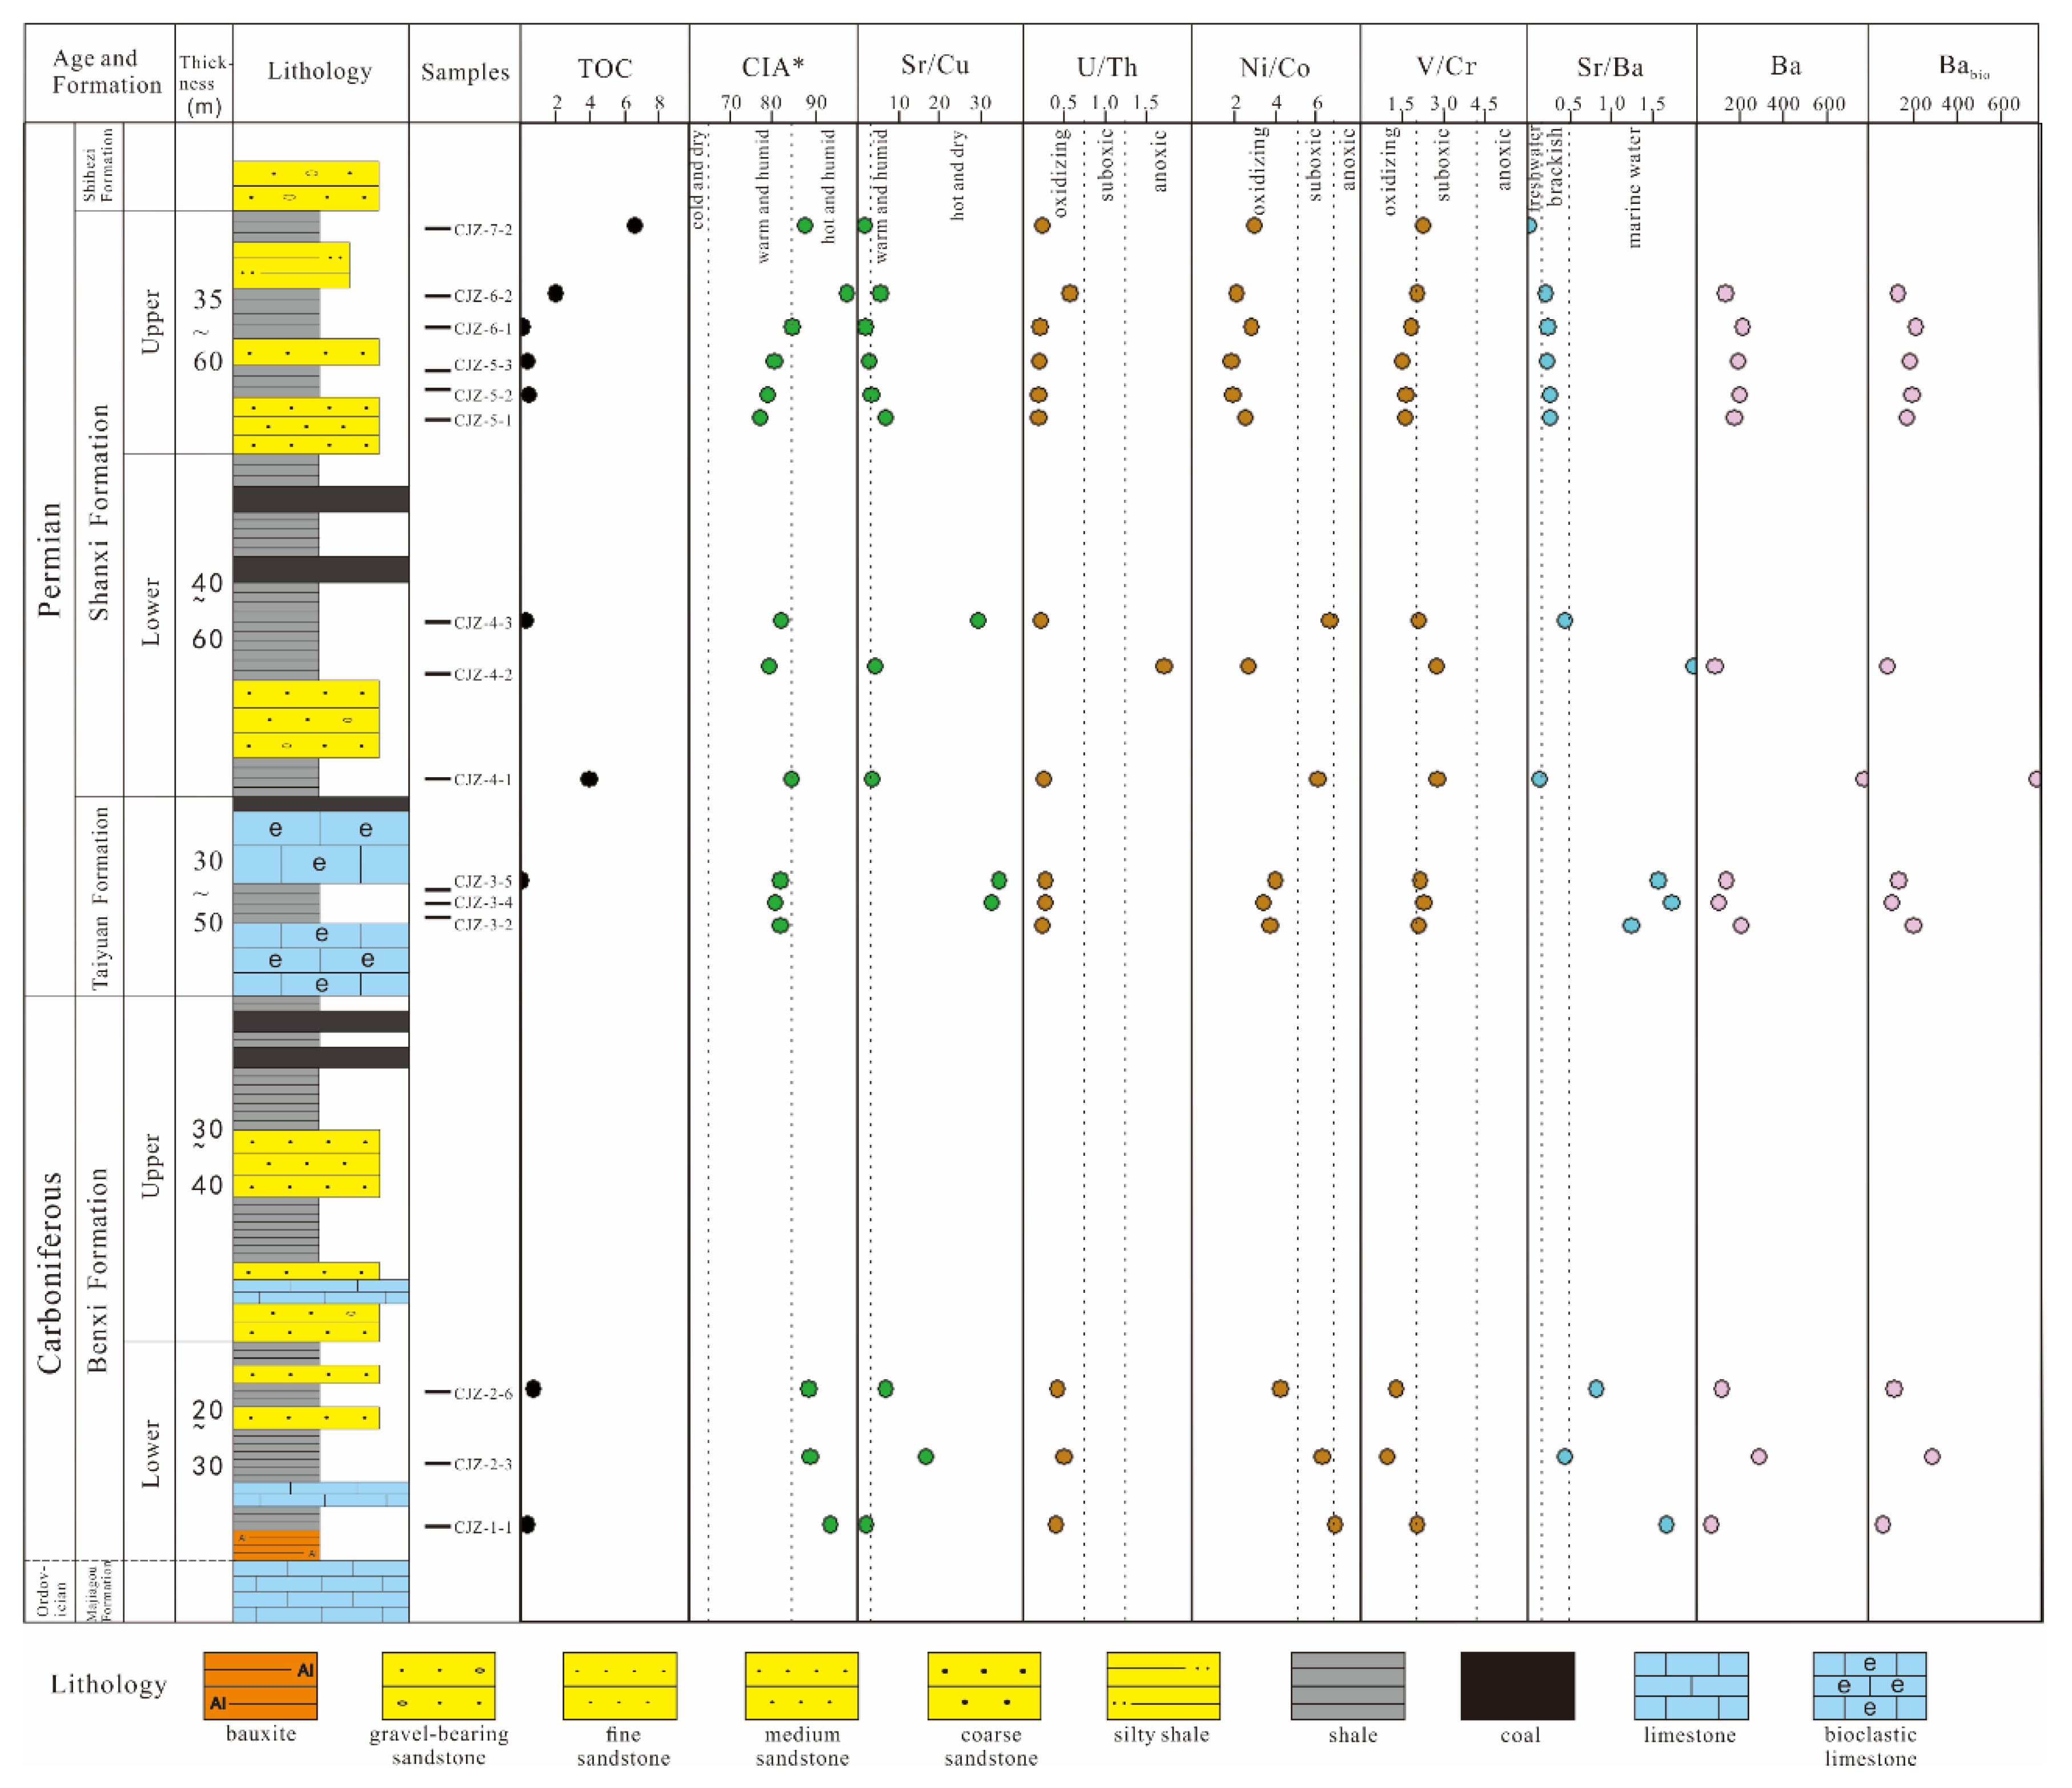
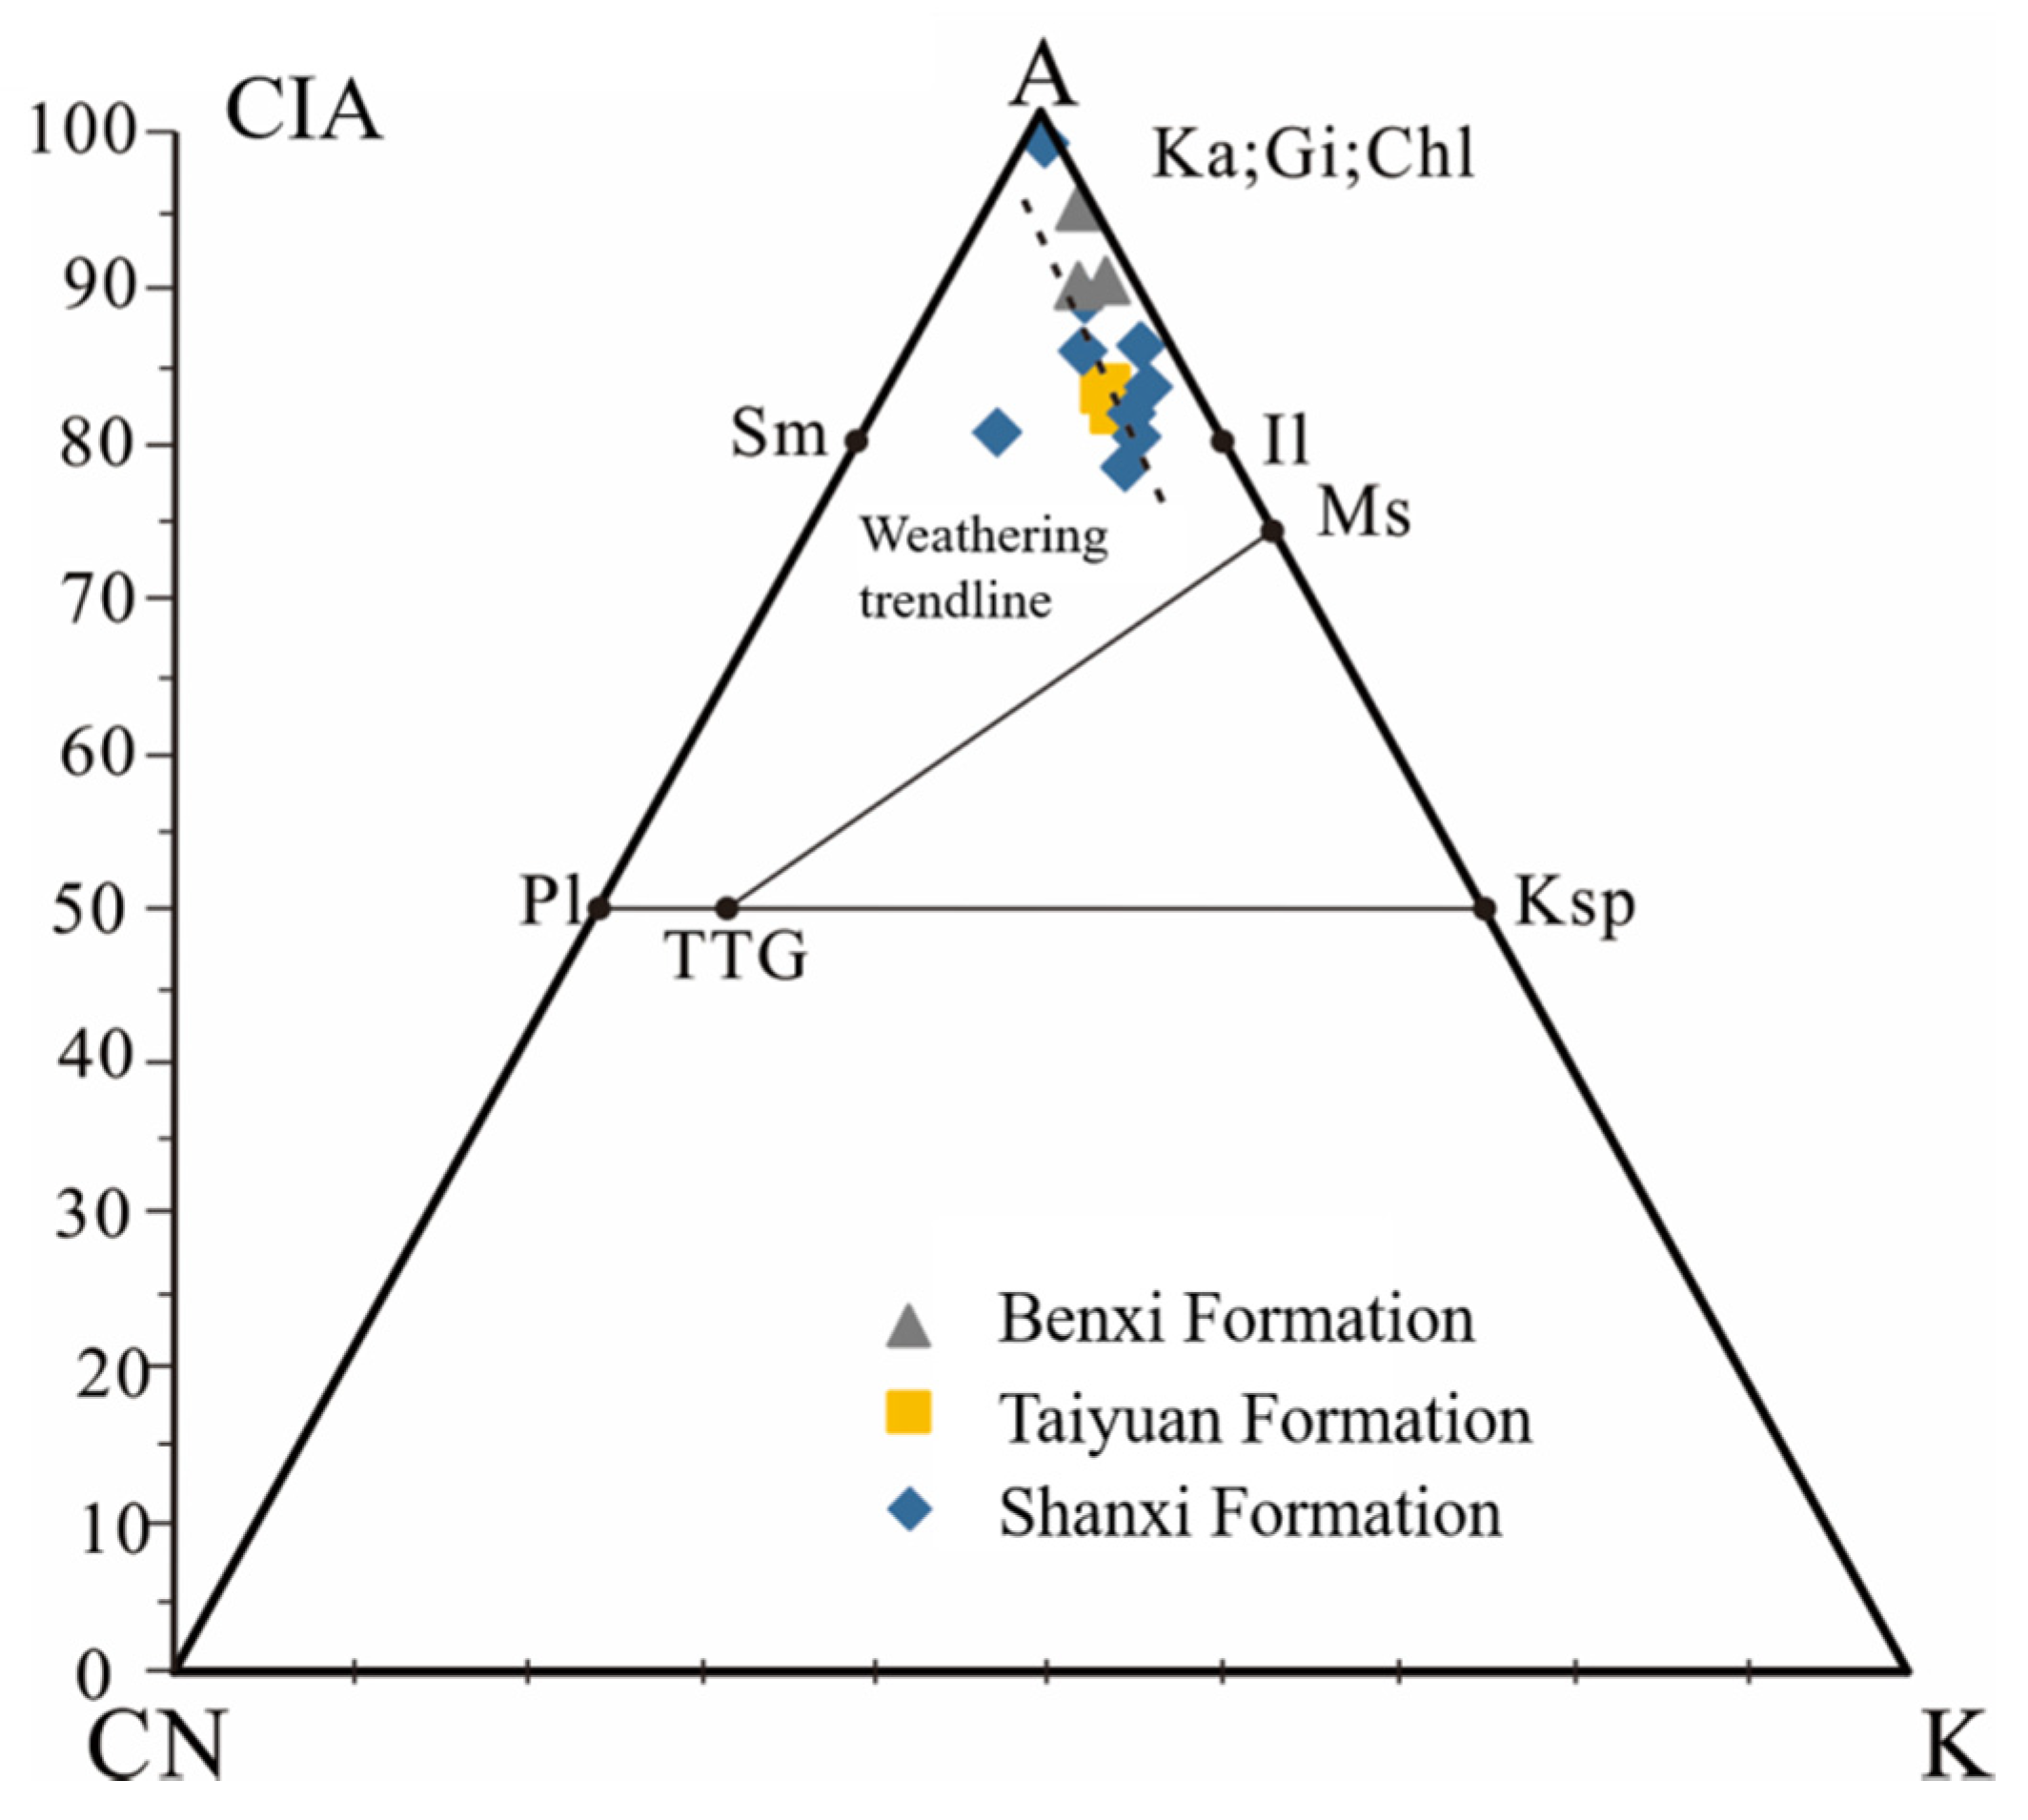
5.2. Paleoclimate Conditions
5.3. Paleo-Water Salinity
5.4. Paleoredox Conditions
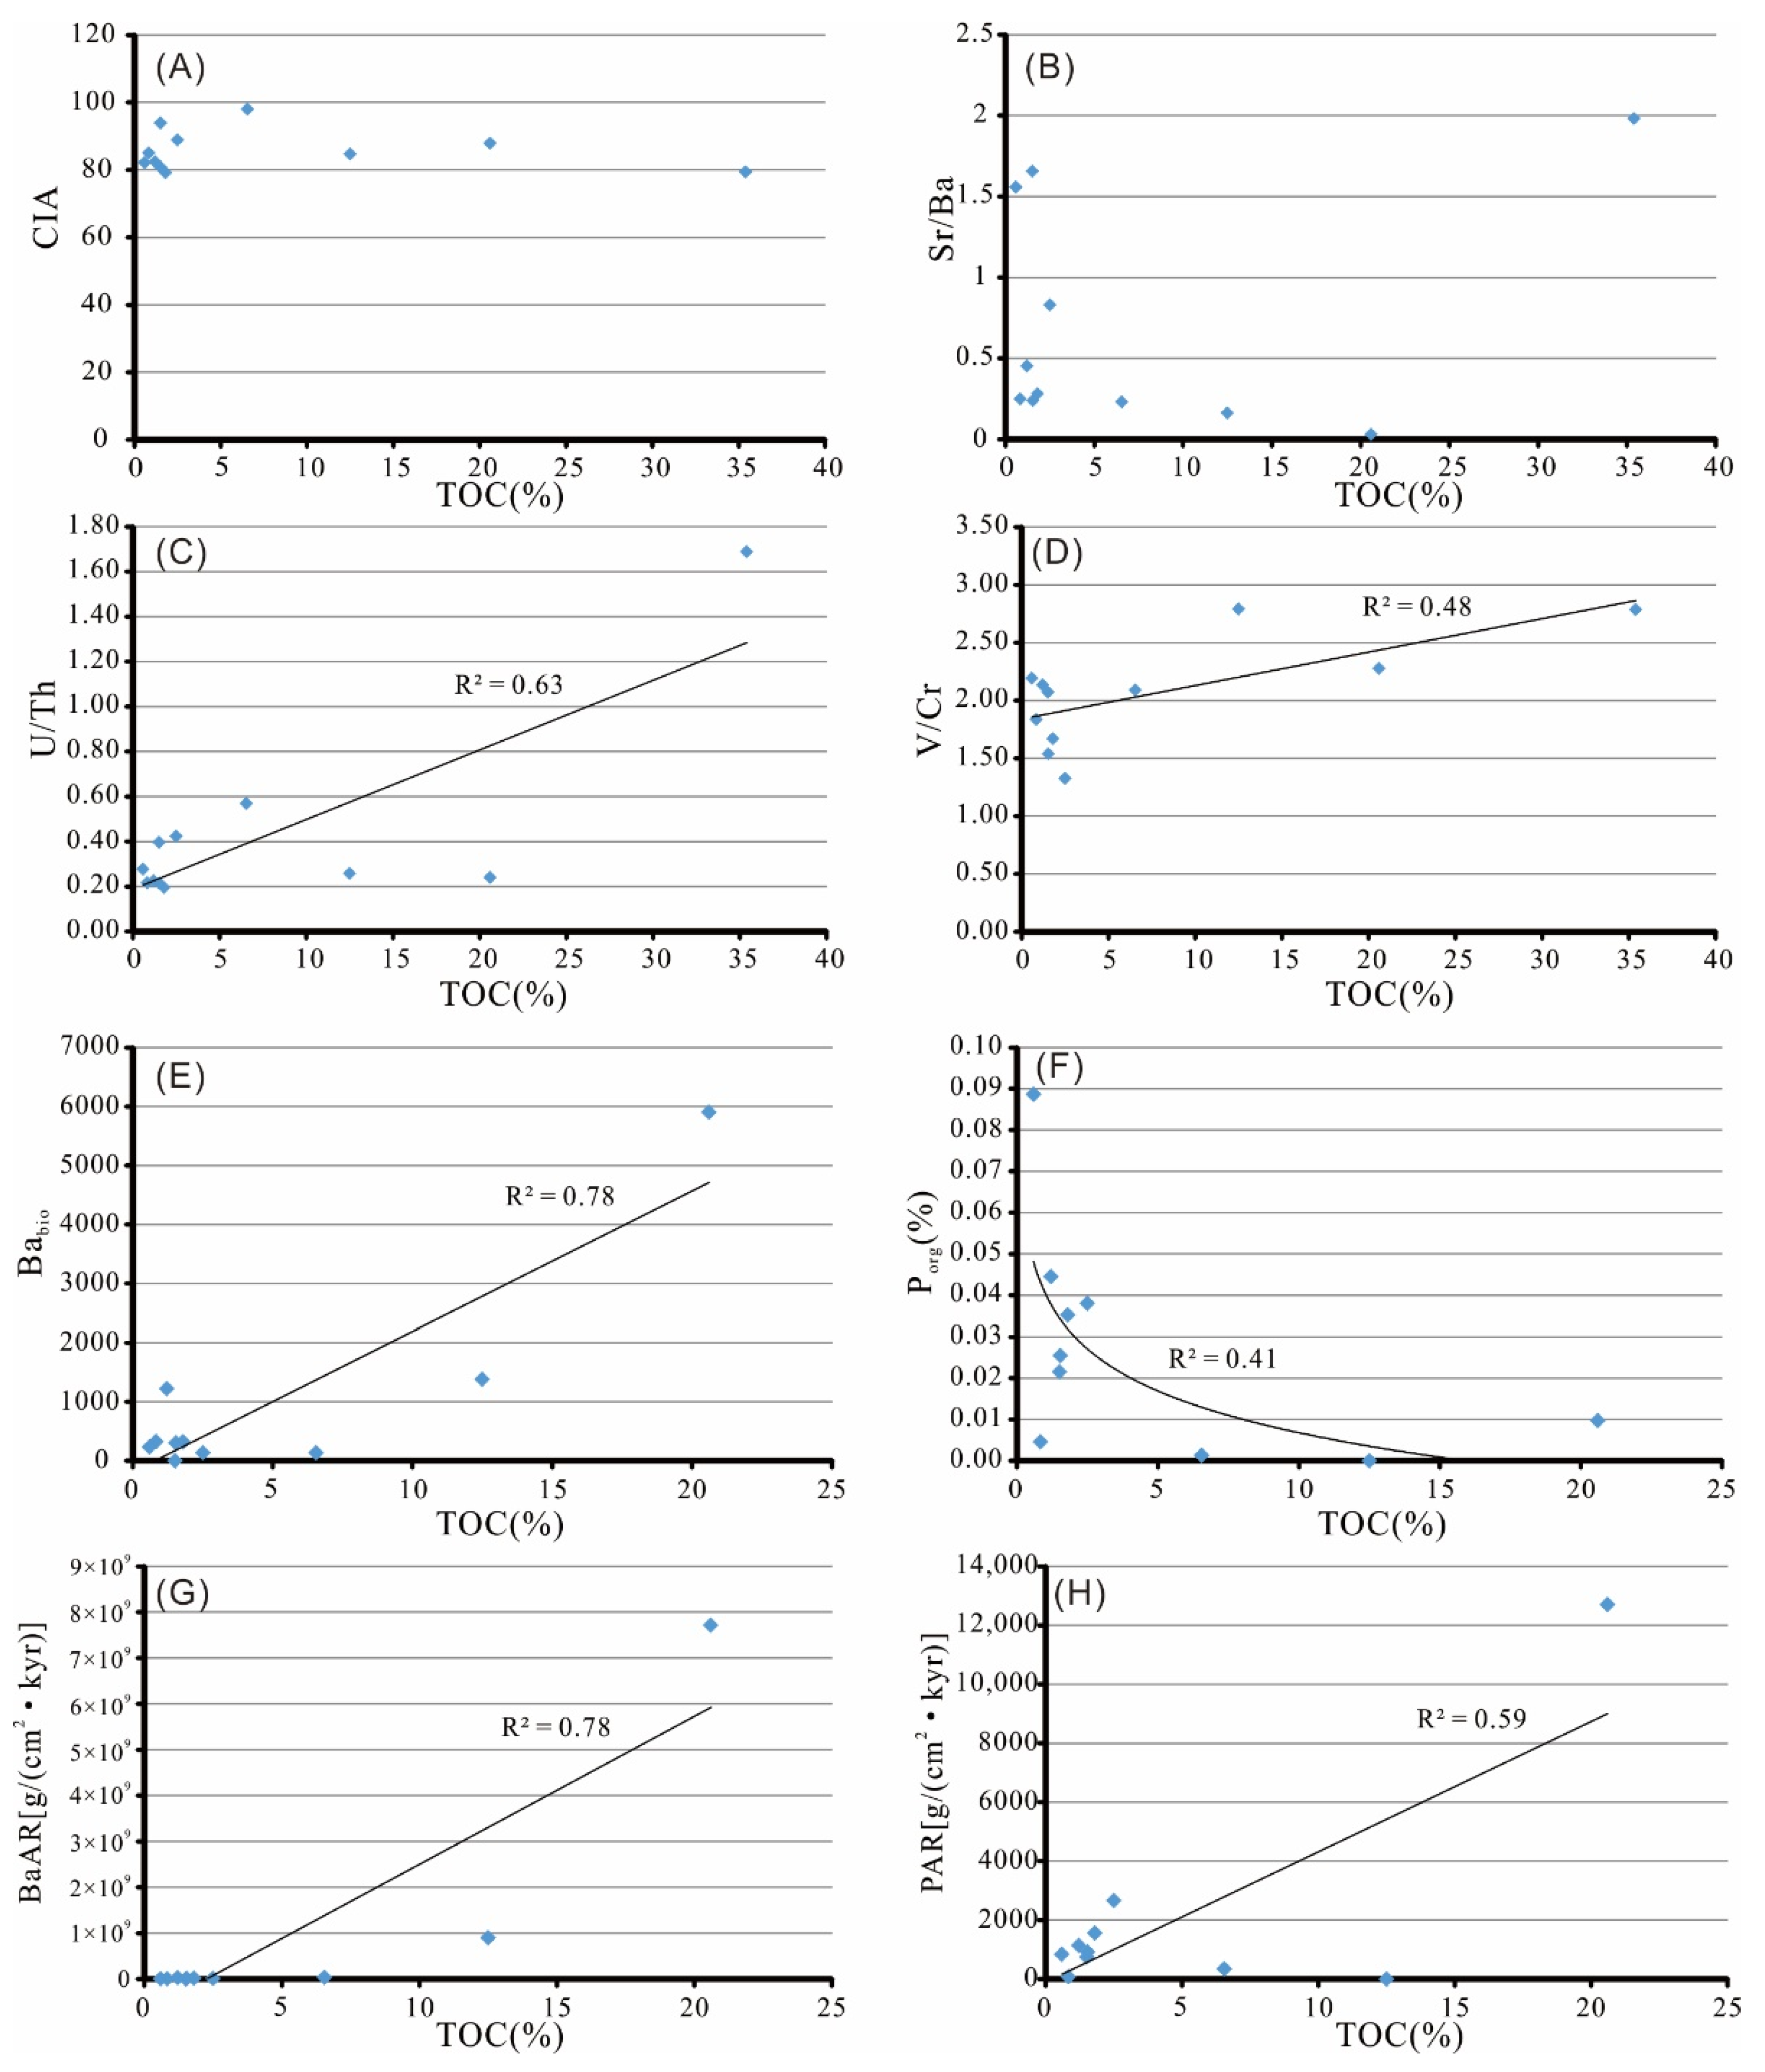
5.5. Paleo-Productivity
5.6. Controlling Factors of Organic Matter Accumulation
6. Conclusions
- (1)
- The Benxi Formation is a barrier island-lagoon facies composed of carbonaceous shales interbedding tidal channel sandstones and coals. The Taiyuan Formation is a tidal flat-shelf facies composed of bioclastic limestones interbedding black shales and coals. The Shanxi Formation is a tidal flat-lagoon facies composed of grey sandstones and dark grey−black shales with occasional coals. The Shanxi Formation has the highest TOC contents, ranging from 0.59–35.4%, with an average of 7.32%.
- (2)
- Geochemical proxies suggest that the Shanxi Formation is sourced from intermediate-acid rocks, perhaps felsic igneous rocks and granites from the Yinshan Oldland in the northwest. From the Benxi to Taiyuan depositional period, the climate changed from hot and humid to warm and humid with continuously increasing humidity. In the late period of the Shanxi Formation, the climate changed to hot and humid again, and the depositional environment was characterized by oxidizing conditions with relatively high paleo-productivity.
- (3)
- Black shales in the Shanxi Formation and Benxi Formation were controlled by the paleoredox conditions and paleoproductivity. Despite the oxic-suboxic conditions, the lower part of the Shanxi Formation was developed in a marine–continental transitional environment, with large quantity of detrital influx, and sedimentation rate was rather fast. A warm and humid climate favored the weathering process, resulting in higher productivity in the water column as well as thriving of inferior aquatic organisms. All these factors provide the material basis for the accumulation of organic matter.
Author Contributions
Funding
Institutional Review Board Statement
Informed Consent Statement
Data Availability Statement
Conflicts of Interest
References
- Zou, C.N.; Dong, D.Z.; Wang, Y.; Li, X.; Huang, J.; Wang, S.; Guan, Q.; Zhang, C.; Wang, H.; Liu, H. Shale gas in China: Characteristics, challenges and prospects(I). Pet. Explor. Dev. 2015, 42, 689–701. [Google Scholar] [CrossRef]
- Dong, D.; Zou, C.; Dai, J.; Huang, S.; Zheng, J.; Gong, J.; Wang, Y.; Li, X.; Guan, Q.; Zhang, C. Suggestions on the development strategy of shale gas in China. J. Nat. Gas Geosci. 2016, 27, 397–406. [Google Scholar] [CrossRef] [Green Version]
- Kuang, L.; Dong, D.; Wenyuan, H.E.; Wen, S.; Zhang, S. Geological characteristics and development potential of transitional shale gas in the east margin of the Ordos Basin, NW China. Pet. Explor. Dev. 2020, 47, 471–482. [Google Scholar] [CrossRef]
- Qiu, Z.; Zou, C.N. Unconventional Petroleum Sedimentology: Connotation and prospect. Acta Sedimentol. Sin. 2020, 38, 1–29. [Google Scholar]
- Zhang, J.C.; Jiang, S.L.; Tang, X.; Zhang, P.X.; Tang, Y.; Jing, T.Y. Accumulation types and resources characteristics of shale gas in China. Nat. Gas Ind. 2009, 29, 109–114. [Google Scholar]
- Zou, C.N.; Dong, D.Z.; Yang, H.; Wang, Y.; Huang, J.; Wang, S.; Fu, C. Conditions of shale gas accumulation and exploration practices in China. Nat. Gas Ind. 2011, 31, 26–39. [Google Scholar]
- Dong, D.Z.; Zou, C.N.; Li, J.Z.; Wang, S.J.; Huang, J.L. Resource potential, exploration and development prospect of shale gas in the whole world. Geol. Bull. China 2011, 30, 324–336. [Google Scholar]
- Guo, X.; Hu, D.; Liu, R.; Wei, X.; Wei, F. Geological conditions and exploration potential of Permian marine–continent transitional facies shale gas in the Sichuan Basin. Nat. Gas Ind. 2019, 6, 198–204. [Google Scholar] [CrossRef]
- Arthur, M.A.; Sageman, B.B. Marine Black Shales: Depositional Mechanisms and Environments of Ancient Deposits. Annu. Rev. Earth Planet. Sci. 1994, 22, 499–551. [Google Scholar] [CrossRef]
- Algeo, T.J.; Lyons, T.W. Mo–total organic carbon covariation in modern anoxic marine environments: Implications for analysis of paleoredox and paleohydrographic conditions. Paleoceanography 2006, 21, 16–23. [Google Scholar] [CrossRef]
- Jiang, S.Y.; Zhao, H.X.; Chen, Y.Q.; Tao, Y.; Yang, J.H.; Ling, H.F. Trace and rare earth element geochemistry of phosphate nodules from the lower Cambrian black shale sequence in the Mufu Mountain of Nanjing, Jiangsu province, China. Chem. Geol. 2007, 244, 584–604. [Google Scholar] [CrossRef]
- Pi, D.H.; Liu, C.Q.; Shields-Zhou, G.A.; Jiang, S.Y. Trace and rare earth element geochemistry of black shale and kerogen in the early Cambrian Niutitang Formation in Guizhou province, South China: Constraints for redox environments and origin of metal enrichments. Precambrian Res. 2013, 225, 218–229. [Google Scholar] [CrossRef]
- Sweere, T.; van den Boorn, S.; Dickson, A.J.; Reichart, G.J. Definition of new trace-metal proxies for the controls on organic matter enrichment in marine sediments based on Mn, Co, Mo and Cd concentrations. Chem. Geol. 2016, 441, 235–245. [Google Scholar] [CrossRef]
- Zhang, H.F.; Xinsong, W.U.; Wang, B.; Duan, Y.J.; Yang, Q.U.; Chen, D.F. Research Progress of the Enrichment Mechanism of Sedimentary Organics in Lacustrine Basin. Acta Sedimentol. Sin. 2016, 34, 463–477. [Google Scholar]
- Qiu, Z.; Lu, B.; Chen, Z.H.; Zhang, R.; Dong, D.Z.; Wang, H.Y.; Qiu, J.L. Discussion of the Relationship between Volcanic Ash Layers and Organic Enrichment of Black Shale: A case study of the Wufeng-Longmaxi gas shales in the Sichuan Basin. Acta Sedimentol. Sin. 2019, 37, 1296–1308. [Google Scholar]
- Lin, F.; Fu, X.G.; Wang, J.; Song, C.Y. Mechanism of organic matter accumulation in a marine-terrestrial transitional residual bay environment: A case of Early Cretaceous organic-rich shales in the Qiangtang Basin, Tibet. Geol. China 2021, 1–20, Accepted Online. [Google Scholar]
- He, J.W.; Xie, Y.; Liu, J.Q.; He, L. Mechanism of organic matter enrichment of fine-grained sedimentary rocks in the Southwest margin of Upper Yangtze: A case study of the Niuzhai section, Yanjin. Acta Sedimentol. Sin. 2021, 39, 656–671. [Google Scholar]
- Ding, J.H.; Zhang, J.C.; Shi, G.; Shen, B.J.; Tang, X.; Yang, Z.H.; Li, X.Q.; Li, C.X. Sedimentary environment and organic matter enrichment mechanisms of the Upper Permian Dalong Formation shale, southern Anhui Province, China. Oil Gas Geol. 2021, 42, 158–172. [Google Scholar]
- Zhang, L.F.; Dong, D.; Qiu, Z.; Wu, C.; Pan, S. Sedimentology and geochemistry of Carboniferous-Permian marine-continental transitional shales in the eastern Ordos Basin, North China. Palaeogeogr. Palaeoclimatol. Palaeoecol. 2021, 571, 110389. [Google Scholar] [CrossRef]
- Luo, J.L.; Wei, X.S.; Yao, J.L.; Liu, X.S.; Liu, X.H. Provenance and depositional facies controlling on the Upper Paleozoic excellent natural gas-reservoir in northern Ordos basin, China. Geol. Bull. China 2010, 29, 811–820. [Google Scholar]
- Dong, D.Z.; Qiu, Z.; Zhang, L.F.; Li, S.X.; Zhang, Q.; Li, X.T.; Zhang, S.R.; Liu, H.L.; Wang, Y.M. Progress on sedimentology of transitional facies shales and new discoveries of shale gas. Acta Sedimentol. Sin. 2021, 39, 29–45. [Google Scholar]
- Yang, Y.; Li, W.; Ma, L. Tectonic and stratigraphic controls of hydrocarbon systems in the Ordos basin: A multicycle cratonic basin in central China. AAPG Bull. 2005, 89, 255–269. [Google Scholar] [CrossRef]
- Zhao, Z.Y.; Guo, Y.R.; Wang, Y.; Lin, D.J. Study progress in tectonic evolution and paleogeography of Ordos Basin. Spec. Oil Gas Reserv. 2012, 19, 15–20. [Google Scholar]
- Yang, X.C.; Qu, Z.H.; Jiang, B.; Zhou, K.; Zhang, J.K. Mesozoic-Cenozoic structural features and their evolution in Daning-Jixian area, Shanxi. Coal Geol. China 2013, 25, 1–6. [Google Scholar]
- Zhao, K.Y.; Guo, S.B. Characteristics and main controlling factors of shale gas reservoirs in transitional facies: A case study of Upper Paleozoic in Ordos Basin. Pet. Geol. Exp. 2015, 37, 141–149. [Google Scholar]
- Qu, H.J.; Han, X.; Chen, S.; Yang, B.; Du, M.Y.; Dong, Y.Y.; Zhao, C. U-Pb Dating of Detrital Zircon from the Upper Paleozoic Clastic Rocks and Basin-mountain Coupling of the Northeastern Ordos Basin. Geotecton. Metallog. 2020, 44, 501–527. [Google Scholar]
- Nesbitt, H.W.; Young, G.M. Early Proterozoic climates and plate motions inferred from major element chemistry of lutites. Nature 1982, 299, 715–717. [Google Scholar] [CrossRef]
- Velbel, P. Chemical weathering indices applied to weathering profiles developed on heterogeneous felsic metamorphic parent rocks. Chem. Geol. 2003, 202, 397–416. [Google Scholar]
- Ma, K.; Hu, S.; Wang, T.; Zhang, B.; Qin, S.; Shi, S.; Wang, K.; Qingyu, H. Sedimentary environments and mechanisms of organic matter enrichment in the Mesoproterozoic Hongshuizhuang Formation of northern China. Palaeogeogr. Palaeoclimatol. Palaeoecol. 2017, 475, 176–187. [Google Scholar] [CrossRef]
- Masuda, A. Regularities in variation of relative abundances of lanthanide elements and an attempt to analyse separation index patterns of some minerals. J. Earth Sci. 1962, 10, 173–187. [Google Scholar]
- Coryell, C.D.; Chase, J.W.; Winchester, J.W. A procedure for geochemical interpretation of terrestiral rare-earth abundance patterns. Geophys. Res. 1963, 68, 559–566. [Google Scholar] [CrossRef]
- Roser, B.P.; Korsch, R.J. Determination of tectonic setting of sandstone-mudstone suites using SiO2 content and K2O/Na2O ratio. J. Geol. 1986, 94, 635–650. [Google Scholar] [CrossRef]
- Qu, H.J.; Ma, Q.; Gao, S.L. On Provenance of the Permian in the Southeastern Ordos Basin. Acta Geol. Sin. 2011, 85, 979–986. [Google Scholar]
- Bock, B.; Mclennan, S.M.; Hanson, G.N. Geochemistry and provenance of the Middle Ordovician Austin Glen Member (Normanskill Formation) and the Taconian Orogeny in New England. Sedimentology 2010, 45, 635–655. [Google Scholar] [CrossRef]
- Fedo, C.M.; Wayne Nesbitt, H.; Young, G.M. Unraveling the effects of potassium metasomatism in sedimentary rocks and paleosols, with implications for paleoweathering conditions and provenance. Geology 1995, 23, 921. [Google Scholar] [CrossRef]
- Sensarma, S.; Rajamani, V.; Tripathi, J.K. Petrography and geochemical characteristics of the sediments of the small River Hemavati, Southern India: Implications for provenance and weathering processes. Sediment. Geol. 2008, 205, 111–125. [Google Scholar] [CrossRef]
- Yandoka, B.S.; Abdullah, W.H.; Abubakar, M.B.; Hakimi, M.H.; Adegoke, A.K. Geochemical characterisation of Early Cretaceous lacustrine sediments of Bima Formation, Yola Sub-basin, Northern Benue Trough, NE Nigeria: Organic matter input, preservation, paleoenvironment and palaeoclimatic conditions. Mar. Pet. Geol. 2015, 61, 82–94. [Google Scholar] [CrossRef]
- Wang, Y.Y.; Guo, W.Y.; Zhang, G.D. Application of Some Geochemical Indicators in Determining of Sedimentary Environment of the Funing Group (Paleogene), Jin-Hu Depression, Kiangsu Province. J. Tongji Univ. 1979, 7, 51–60. [Google Scholar]
- Wolgemuth, K.; Broecker, W.S. Barium in sea water. Earth Planet. Sci. Lett. 1970, 8, 372–378. [Google Scholar] [CrossRef]
- Chegrouche, S.; Mellah, A.; Barkat, M. Removal of strontium from aqueous solutions by adsorption onto activated carbon: Kinetic and thermodynamic studies. Desalination 2009, 235, 306–318. [Google Scholar] [CrossRef]
- Wei, W.; Algeo, T.J. Elemental proxies for paleosalinity analysis of ancient shales and mudrocks. Geochim. Et Cosmochim. Acta 2019, 287, 341–366. [Google Scholar] [CrossRef]
- Algeo, T.J.; Tribovillard, N. Environmental Analysis of Paleoceanographic Systems Based on Molybdenum–Uranium Covariation. Chem. Geol. 2009, 268, 211–225. [Google Scholar] [CrossRef]
- Tribovillard, N.; Bout-Roumazeilles, V.; Algeo, T.; Lyons, T.W.; Baudin, F. Paleodepositional conditions in the Orca Basin as inferred from organic matter and trace metal contents. Mar. Geol. 2012, 254, 62–72. [Google Scholar] [CrossRef]
- Riquier, L.; Tribovillard, N.; Averbuch, O.; Devleeschouwer, X.; Riboulleau, A. The Late Frasnian Kellwasser horizons of the Harz Mountains (Germany): Two oxygen-deficient periods resulting from different mechanisms. Chem. Geol. 2006, 233, 137–155. [Google Scholar] [CrossRef]
- Wignall, P.B. Black Shales; Oxford University Press: New York, NY, USA, 1994; pp. 23–24. [Google Scholar]
- Calvert, S.E.; Pedersen, T.F.; Thunell, R.C. Geochemistry of the surface sediments of the Sulu and South China Seas. Mar. Geol. 1993, 114, 207–211, 217–231. [Google Scholar] [CrossRef]
- Algeo, T.J.; Maynard, J.B. Trace-element behavior and redox facies in core shales of Upper Pennsylvanian Kansas-type cyclothems. Chem. Geol. 2004, 206, 289–318. [Google Scholar] [CrossRef]
- Huested, E. Ocean anoxia and the concentrations of molybdenum and vanadium in seawater. Mar. Chem. 1991, 34, 177–196. [Google Scholar]
- Schoepfer, S.D.; Shen, J.; Wei, H.; Tyson, R.V.; Ingall, E.; Algeo, T.J. Total organic carbon, organic phosphorus, and biogenic barium fluxes as proxies for paleomarine productivity. Earth-Sci. Rev. 2015, 149, 23–52. [Google Scholar] [CrossRef]
- Xing, P.; Zwa, B.; Qla, B.; Jia, G.; Lza, B.; Wla, B. Sedimentary environments and mechanism of organic matter enrichment of dark shales with low TOC in the Mesoproterozoic Cuizhuang Formation of the Ordos Basin: Evidence from petrology, organic geochemistry, and major and trace elements. Sci. Direct Mar. Pet. Geol. 2020, 122, 104695. [Google Scholar]
- Ibach, L.J. Relationship between sedimentation rate and total organic carbon content in ancient marine sediments. Am. Assoc. Pet. Geol. 1980, 66, 170–188. [Google Scholar]
- Yan, D.; Wang, H.; Fu, Q.; Chen, Z.; He, J.; Gao, Z. Geochemical characteristics in the Longmaxi Formation (Early Silurian) of South China: Implications for organic matter accumulation. Mar. Pet. Geol. 2015, 65, 290–301. [Google Scholar] [CrossRef]


| No. | Lithology | Strata | TOC | SiO2 | TiO2 | Al2O3 | TFe2O3 | MnO | MgO | CaO | Na2O | K2O | P2O5 | K2O/Na2O | CIA |
|---|---|---|---|---|---|---|---|---|---|---|---|---|---|---|---|
| CJZ-7-2 | Carbonaceous shale | 1st Member, Shanxi Fm. | 20.6 | 53.76 | 0.73 | 22.40 | 1.49 | <0.01 | 0.57 | 0.30 | 0.29 | 2.03 | 0.06 | 7.00 | 87.93 |
| CJZ-6-2 | Black shale | 1st Member, Shanxi Fm. | 0.83 | 60.67 | 1.06 | 23.37 | 2.74 | 0.01 | 1.02 | 0.18 | 0.16 | 3.38 | 0.05 | 5.00 | 97.98 |
| CJZ-6-1 | Black shale | 1st Member, Shanxi Fm. | 6.55 | 45.44 | 1.33 | 33.72 | 1.94 | <0.01 | 0.36 | 0.27 | 0.08 | 0.40 | 0.06 | 21.13 | 84.98 |
| CJZ-5-3 | Black shale | 1st Member, Shanxi Fm. | 1.54 | 63.55 | 0.89 | 18.94 | 4.29 | 0.01 | 1.40 | 0.15 | 0.60 | 3.24 | 0.09 | 5.40 | 80.63 |
| CJZ-5-2 | Black shale | 1st Member, Shanxi Fm. | 1.8 | 60.36 | 0.74 | 17.69 | 8.25 | 0.11 | 1.57 | 0.24 | 0.56 | 3.30 | 0.11 | 5.89 | 79.13 |
| CJZ-5-1 | Black shale | 1st Member, Shanxi Fm. | 66.59 | 0.69 | 18.52 | 3.21 | 0.01 | 1.14 | 0.42 | 0.66 | 3.61 | 0.12 | 5.47 | 77.20 | |
| CJZ-4-3 | Black shale | 2nd Member, Shanxi Fm. | 1.21 | 60.32 | 0.82 | 22.98 | 2.30 | <0.01 | 0.85 | 0.21 | 0.41 | 3.89 | 0.14 | 9.49 | 82.33 |
| CJZ-4-2 | Carbonaceous shale | 2nd Member, Shanxi Fm. | 35.4 | 22.39 | 0.47 | 11.89 | 14.97 | <0.01 | 0.89 | 1.40 | 0.58 | 1.08 | 0.11 | 1.86 | 79.44 |
| CJZ-4-1 | Carbonaceous shale | 2nd Member, Shanxi Fm. | 12.5 | 42.91 | 0.66 | 23.63 | 1.58 | <0.01 | 0.95 | 0.95 | 0.44 | 2.62 | 0.04 | 5.95 | 84.65 |
| CJZ-3-5 | Silty shale | Taiyuan Fm. | 0.59 | 58.45 | 0.43 | 10.96 | 4.79 | 0.16 | 1.73 | 8.61 | 0.21 | 1.56 | 0.22 | 7.43 | 82.16 |
| CJZ-3-4 | Silty shale | Taiyuan Fm. | 69.41 | 0.40 | 9.60 | 3.42 | 0.18 | 0.84 | 5.55 | 0.19 | 1.52 | 0.09 | 8.00 | 80.87 | |
| CJZ-3-2 | Silty shale | Taiyuan Fm. | 58.34 | 0.44 | 11.07 | 4.11 | 0.15 | 1.61 | 9.59 | 0.21 | 1.58 | 0.09 | 7.52 | 82.18 | |
| CJZ-2-6 | Black shale | Benxi Fm. | 2.5 | 53.04 | 1.10 | 25.72 | 3.70 | 0.02 | 0.78 | 0.26 | 0.49 | 2.09 | 0.13 | 4.27 | 88.84 |
| CJZ-2-3 | Black shale | Benxi Fm. | 2.8 | 63.76 | 1.31 | 20.20 | 4.10 | 0.18 | 0.56 | 0.19 | 0.14 | 1.93 | 0.09 | 13.79 | 89.19 |
| CJZ-1-1 | Black shale | Benxi Fm. | 1.51 | 44.52 | 1.24 | 36.07 | 2.17 | 0.00 | 0.55 | 0.15 | 0.17 | 1.90 | 0.11 | 11.18 | 93.89 |
| Sample | Clay | Quartz | k-Feldspar | Plagioclase | Halite | Siderite | Hematite | Goethite |
|---|---|---|---|---|---|---|---|---|
| CJZ-1-1 | 95.1 | 4.9 | \ | \ | \ | \ | \ | \ |
| CJZ-2-6 | 72.3 | 25.6 | 0.5 | 0.8 | 0.1 | 0.7 | \ | \ |
| CJZ-4-1 | 80.3 | 18.7 | \ | \ | \ | 0.5 | 0.5 | \ |
| CJZ-4-2 | 80.7 | 16.7 | \ | \ | \ | \ | \ | 2.6 |
| CJZ-4-3 | 67.9 | 30.4 | \ | 1.2 | \ | 0.5 | \ | \ |
| CJZ-5-3 | 55.6 | 39.7 | \ | 4.5 | \ | 0.2 | \ | \ |
| CJZ-6-1 | 89.2 | 10.8 | \ | \ | \ | \ | \ | \ |
| CJZ-6-2 | 72.4 | 26.5 | \ | 0.9 | \ | 0.2 | \ | \ |
| No. | La | Ce | Pr | Nd | Sm | Eu | Gd | Tb | Dy | Ho | Er | Tm | Yb | Lu | δCeN | (La/Yb)N | (La/Sm)N | (Gd/Yb)N | δEu |
|---|---|---|---|---|---|---|---|---|---|---|---|---|---|---|---|---|---|---|---|
| CJZ-7-2 | 115.66 | 229.93 | 25.30 | 96.73 | 16.90 | 3.03 | 13.19 | 1.80 | 9.72 | 1.82 | 5.23 | 0.77 | 4.79 | 0.71 | 1.04 | 17.32 | 4.42 | 2.28 | 0.60 |
| CJZ-6-2 | 82.91 | 168.51 | 19.34 | 75.41 | 12.97 | 2.04 | 9.90 | 1.40 | 7.69 | 1.45 | 4.15 | 0.61 | 3.87 | 0.57 | 1.03 | 15.38 | 4.13 | 2.12 | 0.53 |
| CJZ-6-1 | 17.90 | 47.82 | 3.91 | 15.35 | 2.84 | 0.50 | 2.48 | 0.39 | 2.34 | 0.47 | 1.36 | 0.20 | 1.25 | 0.18 | 1.40 | 10.26 | 4.06 | 1.64 | 0.57 |
| CJZ-5-3 | 74.42 | 147.65 | 16.98 | 67.57 | 12.32 | 2.14 | 10.55 | 1.56 | 8.74 | 1.69 | 4.83 | 0.70 | 4.38 | 0.66 | 1.02 | 12.19 | 3.90 | 1.99 | 0.56 |
| CJZ-5-2 | 65.79 | 127.64 | 14.34 | 54.01 | 9.26 | 1.54 | 7.90 | 1.21 | 7.15 | 1.44 | 4.29 | 0.64 | 4.09 | 0.62 | 1.02 | 11.54 | 4.59 | 1.60 | 0.54 |
| CJZ-5-1 | 66.64 | 124.33 | 13.53 | 49.71 | 8.27 | 1.35 | 7.11 | 1.02 | 5.89 | 1.18 | 3.59 | 0.55 | 3.54 | 0.55 | 1.02 | 13.52 | 5.20 | 1.66 | 0.53 |
| CJZ-4-3 | 68.81 | 137.62 | 15.87 | 62.16 | 11.41 | 1.97 | 8.92 | 1.25 | 7.00 | 1.34 | 3.96 | 0.59 | 3.68 | 0.54 | 1.02 | 13.40 | 3.89 | 2.00 | 0.58 |
| CJZ-4-2 | 43.39 | 80.75 | 9.28 | 35.98 | 6.94 | 1.37 | 6.57 | 1.07 | 6.28 | 1.22 | 3.52 | 0.52 | 3.21 | 0.48 | 0.99 | 9.70 | 4.04 | 1.69 | 0.61 |
| CJZ-4-1 | 77.07 | 164.83 | 20.31 | 84.51 | 17.09 | 3.10 | 15.56 | 2.16 | 11.13 | 2.02 | 5.60 | 0.79 | 4.87 | 0.77 | 1.02 | 11.34 | 2.91 | 2.64 | 0.57 |
| CJZ-3-5 | 35.78 | 69.03 | 8.29 | 31.51 | 5.90 | 1.20 | 5.03 | 0.71 | 3.92 | 0.74 | 2.14 | 0.31 | 1.91 | 0.28 | 0.98 | 13.44 | 3.91 | 2.18 | 0.66 |
| CJZ-3-4 | 28.21 | 48.09 | 5.40 | 19.63 | 3.21 | 0.70 | 2.86 | 0.41 | 2.44 | 0.49 | 1.50 | 0.23 | 1.43 | 0.22 | 0.96 | 14.20 | 5.68 | 1.66 | 0.69 |
| CJZ-3-2 | 32.95 | 59.48 | 6.92 | 24.37 | 3.95 | 0.81 | 3.44 | 0.50 | 2.98 | 0.60 | 1.80 | 0.27 | 1.76 | 0.27 | 0.97 | 13.45 | 5.38 | 1.62 | 0.65 |
| CJZ-2-6 | 76.51 | 157.70 | 17.47 | 69.73 | 13.20 | 2.74 | 12.10 | 1.81 | 10.62 | 2.10 | 6.04 | 0.86 | 5.22 | 0.80 | 1.06 | 10.50 | 3.74 | 1.92 | 0.65 |
| CJZ-2-3 | 69.27 | 146.99 | 16.83 | 73.39 | 15.74 | 3.08 | 13.45 | 2.13 | 12.37 | 2.39 | 6.70 | 0.94 | 5.75 | 0.87 | 1.06 | 8.64 | 2.84 | 1.93 | 0.63 |
| CJZ-1-1 | 126.56 | 263.09 | 27.80 | 109.02 | 16.03 | 3.05 | 16.32 | 2.90 | 19.26 | 4.26 | 13.00 | 1.86 | 10.94 | 1.69 | 1.09 | 8.30 | 5.10 | 1.23 | 0.57 |
| UCC of NOC | 35.00 | 67.00 | 7.20 | 29.00 | 4.80 | 1.10 | 4.00 | 0.61 | 3.30 | 0.67 | 1.90 | 0.30 | 1.90 | 0.29 | / | / | / | / | / |
| UCC | 30.00 | 64.00 | 7.10 | 26.00 | 4.50 | 0.88 | 3.80 | 0.64 | 3.50 | 0.80 | 2.30 | 0.33 | 2.20 | 0.32 | / | / | / | / | / |
| PAAS | 38.00 | 80.00 | 8.90 | 32.00 | 5.60 | 1.10 | 4.70 | 0.77 | 4.40 | 1.00 | 2.90 | 0.40 | 2.80 | 0.43 | / | / | / | / | / |
| NASC | 32.00 | 73.00 | 7.90 | 33.00 | 5.70 | 1.24 | 5.20 | 0.85 | 5.80 | 1.04 | 3.40 | 0.50 | 3.10 | 0.48 | / | / | / | / | / |
| No. | Element Concentration/10−6 | Ratios | ||||||||||||||||
|---|---|---|---|---|---|---|---|---|---|---|---|---|---|---|---|---|---|---|
| Sc | V | Cr | Co | Ni | Cu | Sr | Zr | Ba | Th | U | U/Th | V/Cr | Ni/Co | Sr/Cu | Sr/Ba | Th/Sc | Zr/Sc | |
| CJZ-7-2 | 12.05 | 128.18 | 56.33 | 5.73 | 17.57 | 88.62 | 184.15 | 323.46 | 5987.15 | 25.99 | 6.22 | 0.24 | 2.28 | 3.06 | 2.08 | 0.03 | 2.16 | 26.84 |
| CJZ-6-1 | 5.28 | 43.84 | 20.98 | 8.13 | 17.97 | 10.39 | 61.64 | 244.23 | 266.71 | 16.38 | 9.32 | 0.57 | 2.09 | 2.21 | 5.93 | 0.23 | 3.10 | 46.27 |
| CJZ-6-2 | 13.94 | 117.32 | 63.90 | 8.52 | 24.71 | 44.17 | 104.35 | 266.58 | 416.75 | 20.31 | 4.39 | 0.22 | 1.84 | 2.90 | 2.36 | 0.25 | 1.46 | 19.12 |
| CJZ-5-3 | 15.41 | 90.22 | 58.67 | 16.47 | 31.95 | 27.42 | 89.63 | 326.20 | 374.06 | 20.90 | 4.48 | 0.21 | 1.54 | 1.94 | 3.27 | 0.24 | 1.36 | 21.17 |
| CJZ-5-2 | 14.81 | 83.61 | 50.11 | 13.32 | 26.95 | 29.43 | 109.23 | 265.67 | 387.40 | 18.90 | 3.70 | 0.20 | 1.67 | 2.02 | 3.71 | 0.28 | 1.28 | 17.94 |
| CJZ-5-1 | 10.63 | 57.71 | 35.02 | 5.02 | 13.17 | 13.54 | 98.12 | 399.76 | 344.41 | 26.74 | 5.35 | 0.20 | 1.65 | 2.62 | 7.24 | 0.28 | 2.52 | 37.61 |
| CJZ-4-3 | 13.58 | 148.84 | 69.75 | 1.91 | 12.59 | 20.13 | 594.63 | 228.62 | 1311.06 | 20.88 | 4.72 | 0.23 | 2.13 | 6.60 | 29.53 | 0.45 | 1.54 | 16.84 |
| CJZ-4-2 | 15.32 | 139.58 | 50.13 | 7.99 | 22.10 | 75.17 | 348.11 | 376.93 | 175.66 | 17.57 | 29.67 | 1.69 | 2.78 | 2.77 | 4.63 | 1.98 | 1.15 | 24.60 |
| CJZ-4-1 | 15.34 | 148.55 | 53.22 | 2.74 | 16.53 | 62.17 | 239.37 | 266.91 | 1471.23 | 21.12 | 5.45 | 0.26 | 2.79 | 6.03 | 3.85 | 0.16 | 1.38 | 17.39 |
| CJZ-3-5 | 9.96 | 97.62 | 44.55 | 8.75 | 35.45 | 12.31 | 424.44 | 100.01 | 272.60 | 9.36 | 2.59 | 0.28 | 2.19 | 4.05 | 34.49 | 1.56 | 0.94 | 10.04 |
| CJZ-3-4 | 8.61 | 95.98 | 41.28 | 19.52 | 67.68 | 11.08 | 361.56 | 81.64 | 210.59 | 7.83 | 2.20 | 0.28 | 2.32 | 3.47 | 32.63 | 1.72 | 0.91 | 9.49 |
| CJZ-3-2 | 9.39 | 93.68 | 43.68 | 10.69 | 40.44 | 10.94 | 503.35 | 92.95 | 403.79 | 10.02 | 2.42 | 0.24 | 2.14 | 3.78 | 46.01 | 1.25 | 1.07 | 9.90 |
| CJZ-2-6 | 15.44 | 146.97 | 110.85 | 12.84 | 55.03 | 26.78 | 194.35 | 219.45 | 233.88 | 24.75 | 10.50 | 0.42 | 1.33 | 4.28 | 7.26 | 0.83 | 1.60 | 14.22 |
| CJZ-2-3 | 11.00 | 121.94 | 123.00 | 8.61 | 53.77 | 14.80 | 250.52 | 495.73 | 559.30 | 22.32 | 11.26 | 0.50 | 0.99 | 6.25 | 16.93 | 0.45 | 2.03 | 45.05 |
| CJZ-1-1 | 13.49 | 206.09 | 99.48 | 11.16 | 76.45 | 90.15 | 231.24 | 270.85 | 139.67 | 28.10 | 11.14 | 0.40 | 2.07 | 6.85 | 2.56 | 1.66 | 2.08 | 20.08 |
| No. | TOC | Babio | Porg | BAR | PAR | BaAR |
|---|---|---|---|---|---|---|
| CJZ-7-2 | 20.60 | 5900.41 | 0.01 | 1,307,622.10 | 12,705.22 | 7.72 × 10⁹ |
| CJZ-6-2 | 6.55 | 136.14 | 0.00 | 266,277.91 | 342.18 | 3.63 × 10⁷ |
| CJZ-6-1 | 0.83 | 326.26 | 0.00 | 15,110.37 | 69.41 | 4.93 × 10⁶ |
| CJZ-5-3 | 1.54 | 300.72 | 0.03 | 35,654.32 | 908.95 | 1.07 × 10⁷ |
| CJZ-5-2 | 1.80 | 318.90 | 0.04 | 44,280.43 | 1559.75 | 1.41 × 10⁷ |
| CJZ-4-3 | 1.21 | 1222.07 | 0.04 | 25,506.23 | 1134.63 | 3.12 × 10⁷ |
| CJZ-4-1 | 12.50 | 1379.74 | 0.00 | 653,360.38 | 0.11 | 9.01 × 10⁸ |
| CJZ-3-5 | 0.59 | 230.16 | 0.09 | 9406.01 | 833.72 | 2.16 × 10⁶ |
| CJZ-2-6 | 2.50 | 134.29 | 0.04 | 69,881.32 | 2658.53 | 9.38 × 10⁶ |
| CJZ-1-1 | 1.51 | 0.00 | 0.02 | 34,693.31 | 747.11 | 6.11 |
Publisher’s Note: MDPI stays neutral with regard to jurisdictional claims in published maps and institutional affiliations. |
© 2021 by the authors. Licensee MDPI, Basel, Switzerland. This article is an open access article distributed under the terms and conditions of the Creative Commons Attribution (CC BY) license (https://creativecommons.org/licenses/by/4.0/).
Share and Cite
Zhang, L.; Zhao, Q.; Peng, S.; Qiu, Z.; Feng, C.; Zhang, Q.; Wang, Y.; Dong, D.; Zhou, S. Paleoenvironment and Organic Matter Accumulation Mechanism of Marine–Continental Transitional Shales: Outcrop Characterizations of the Carboniferous–Permian Strata, Ordos Basin, North China. Energies 2021, 14, 7445. https://0-doi-org.brum.beds.ac.uk/10.3390/en14217445
Zhang L, Zhao Q, Peng S, Qiu Z, Feng C, Zhang Q, Wang Y, Dong D, Zhou S. Paleoenvironment and Organic Matter Accumulation Mechanism of Marine–Continental Transitional Shales: Outcrop Characterizations of the Carboniferous–Permian Strata, Ordos Basin, North China. Energies. 2021; 14(21):7445. https://0-doi-org.brum.beds.ac.uk/10.3390/en14217445
Chicago/Turabian StyleZhang, Leifu, Qun Zhao, Sizhong Peng, Zhen Qiu, Congjun Feng, Qin Zhang, Yuman Wang, Dazhong Dong, and Shangwen Zhou. 2021. "Paleoenvironment and Organic Matter Accumulation Mechanism of Marine–Continental Transitional Shales: Outcrop Characterizations of the Carboniferous–Permian Strata, Ordos Basin, North China" Energies 14, no. 21: 7445. https://0-doi-org.brum.beds.ac.uk/10.3390/en14217445