1. Introduction
As a result of lightning strikes, pollution, and ice, overhead distribution wires might be short-circuited and trip [
1]. As a result, researchers have developed a new lightning protection composite insulator [
2,
3]. Lightning accidents can be avoided by using the new insulator. In practical use, it can replace ordinary insulators and lightning arresters at the same time. In terms of length and installation, it is the same as a conventional insulator, but with the added benefits of low cost and ease of installation. However, worries have been raised about its pollution and icing performance. Large-scale power outages caused by pollution-induced flashover accidents might harm social–economic growth [
4,
5,
6]. In addition, as a unique form of pollution, the harm of insulator surface icing to the power systems is prominent [
7,
8,
9].
Many research investigations have been carried out on power line insulators to determine their icing [
10,
11,
12,
13] and pollution [
14,
15,
16,
17] performance. First and foremost, the pollution level has a significant impact on the flashover performance of composite insulators. A negative power function connection between pollution failure voltage and salt deposit density (SDD) is also discovered [
15]. Namely, the flashover voltage decreases with the increase of pollution degree. Because of the narrower distance between composite sheds, icicles may cross it more efficiently, resulting in poor insulation and even power outages [
18,
19,
20]. In addition, some literature has studied the relationship between electric field and icing [
21,
22]. The ice accretion performance of 220 kV composite insulators with two shed configurations on occasions of different electric field distributions is analyzed in the study [
21]. The test results indicate that the intensity and homogeneous distribution of electric fields positively affect the ice’s appearance, density, and weight. In the study [
22], based on a kind of 10 kV composite insulator computation model, the electric field distribution magnitude of composite insulator coated by different icicle lengths were calculated, respectively, under icing and de-icing conditions. It could be found that the electric field strength around the icicle increases along with the increasing of the length of the icicle.
The above research has important guiding significance for selecting external insulation of ordinary insulators under pollution and icing conditions. However, there are few studies on the flashover characteristics of this novel lightning protection composite insulator under icing and pollution. Only the literature has made a preliminary study [
1,
23,
24,
25]. In one study [
24], the new composite insulator’s AC flashover performance was examined in detail. Tests were done at the Natural Ice Test Base to determine the effect of icing thickness on AC flashover performance. Next, to calculate AC flashover voltage, an empirical equation was developed. Literature [
25] studied the failure arc paths of the novel insulator. The findings indicate that low, medium, and heavy pollutions caused different arcing under AC voltage. In addition, the arc path was affected by both the pollution level and impulse voltage amplitude. Based on the test results recorded by a high-speed camera, 14 types of arc paths were defined and analyzed. However, the above literature does not consider AC breakdown characteristics of polluted novel lightning protection insulators under icing conditions. In addition, the electric field distribution characteristics on the surface of this novel insulator under icing conditions have not been studied.
Based on the above, this paper studies the electric field distribution and AC breakdown characteristics of polluted novel lightning protection insulators under icing conditions, based on the finite element and field test method. The research results of this paper have a specific guiding role for the selection of the external insulation of transmission lines and the structural optimization of novel insulators.
2. Samples and Methods
2.1. Samples
A novel lightning-protection composite insulator was used as an experimental sample (
Figure 1). Its physical drawing is shown in
Figure 1a, and its sectional illustration is shown in
Figure 1b. An arrester and insulator are combined in this 10 kV lightning protection composite insulator. As shown in
Figure 1b, ① (disk-shaped metal electrode) and ② (a pin electrode with a spherical end) constitute the air gap. ③ and ④ are silicone rubber sheds. ⑤ and ⑥ are a zinc oxide resistor and an acid, and high-temperature resistant mandrel. Their geometrical characteristics are shown in
Table 1.
d1 is the arrester section’s big-shed diameter,
d2 is the insulation section’s big-shed diameter,
l is the leakage distance, and
d3 is the gap distance between ① and ②.
H is the height.
2.2. Electric Field Calculated Methods
This was conducted by building 1:1 two-dimensional models of the clean lightning protection insulator and one with an ice coating on its surface, to determine how the electric field distribution changed under the icing. The state of the ice layer can be divided into two cases, one with icicles and the other without icicles. As for the case with the icicle, seven icicles are set in the model, of which two are 33 mm long, two are 15 mm long, and three are 25 mm long. The icicle is a cone with a circular arc at the tip. FEM is also used to determine the electric potential and field distribution. The auto-generation method divides the computational domain into refined triangular meshes in this model [
1]. For the air, a silicone rubber shed, icing layer, zinc oxide resistor, and relative dielectric constants of 1, 3.5, 81, and 600 were utilized in the electric field simulations.
where
ρ is charge density,
U is the potential,
D is the electric flux density,
E is the electric field strength, and
ε0 is the absolute dielectric constant of the vacuum,
ε1 is the relative dielectric constant.
2.3. Flashover Test Devices and Methods
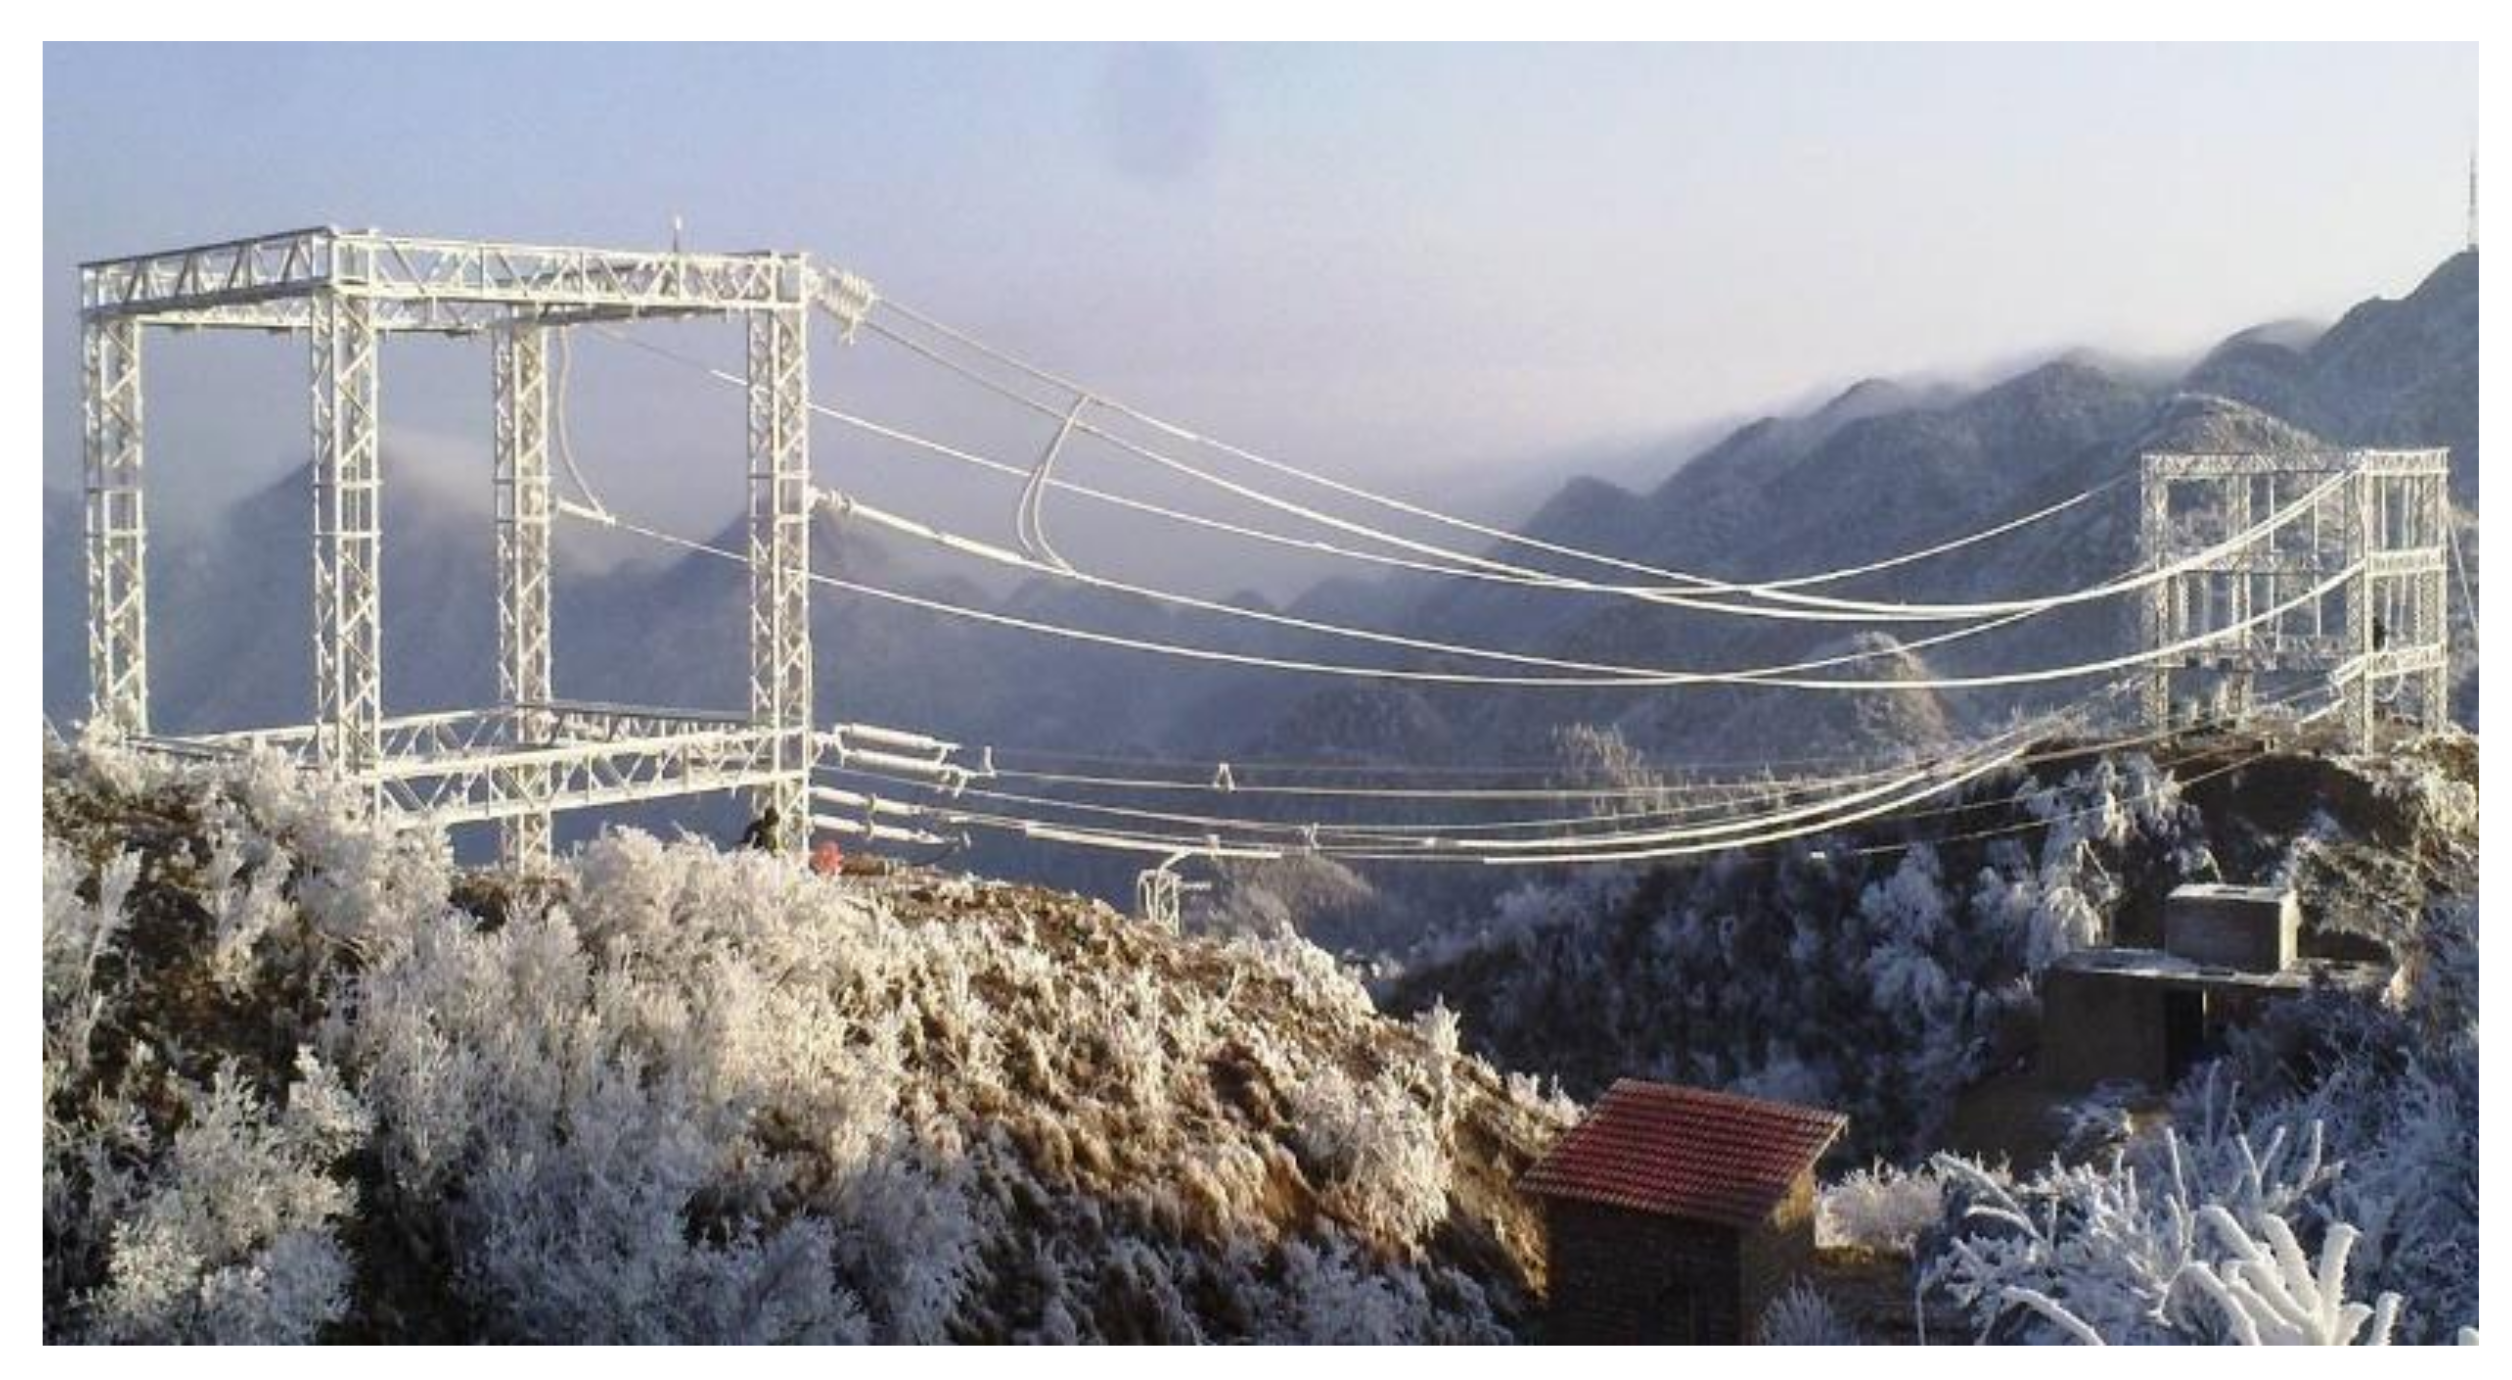
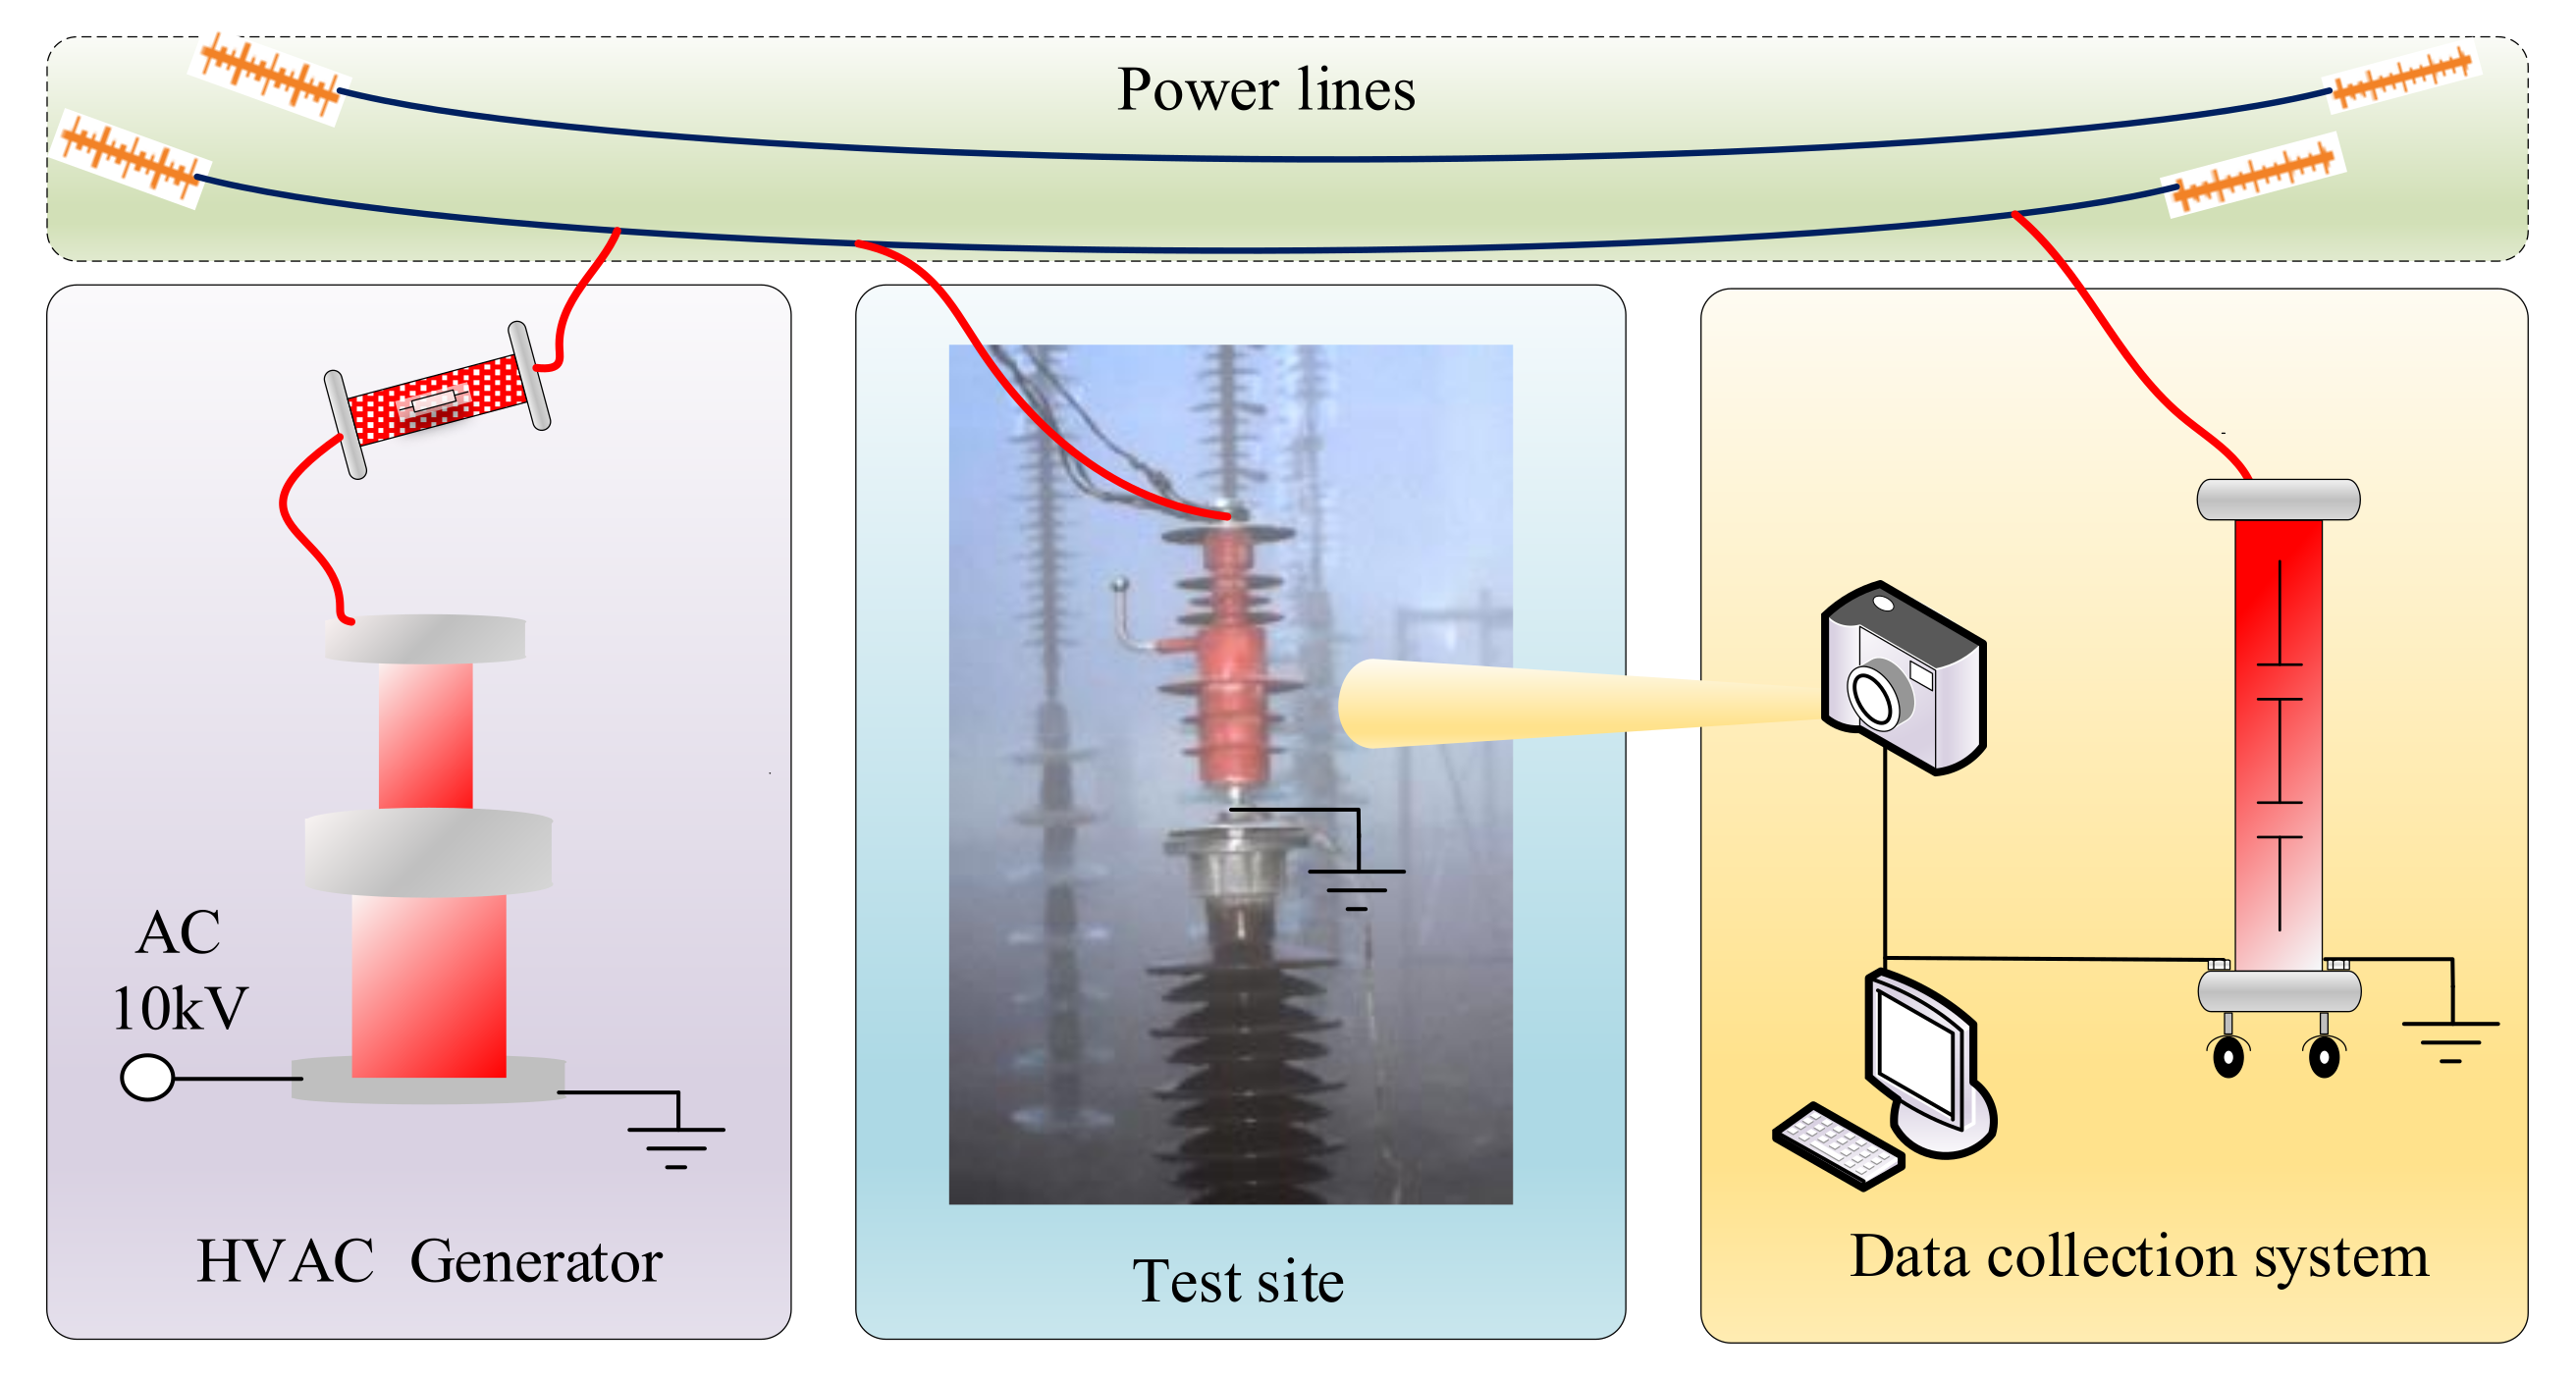
According to
Figure 2, the testing was conducted at the Natural Icing Test Base.
Figure 3 depicts the test circuit. The previous paper [
22] describes the experimental site and test device parameters in detail. According to the IEC (International Electrotechnical Commission), the power supply satisfies all requirements.
As illustrated in
Figure 4, the natural icing test technique is outlined. An initial step was to remove dirt and oil from the composite lightning protection insulators by cleaning them with Na
2PO
3. A solid layer pollution approach was used to pre-treat all lightning protection composite insulators to replicate the surface state of the insulators on running power lines. Insulator surfaces were contaminated with
NaCl and diatomite to create a corrosive environment. The quality of each was measured, as in (2),
where
Mdiatomite is the mass of diatomite,
MNaCl is the mass of
NaCl, and
S is the surface area of composite insulators.
ESDD and
NSDD have equivalent salt deposit density and non-soluble deposit density, respectively.
Figure 2.
Natural Icing Test Base.
Figure 2.
Natural Icing Test Base.
Figure 3.
Schematic diagram of natural icing test.
Figure 3.
Schematic diagram of natural icing test.
Lightning protection composite insulators are installed on the post insulation after it has been contaminated. Then, the test was performed to determine the AC flashover voltage. Lightning protection composite insulators were subjected to at least 10 AC flashover tests under the same conditions. Therefore, it was possible to calculate
Uf and
Re (relative standard deviation error), as in,
where
Ui is the applied voltage,
ni is the number of tests, and
N is “valid” tests.
3. Results
3.1. Electric Field Distribution of the Insulator
The calculation results of the electric field are shown in
Figure 5, from which the following conclusions can be obtained.
(1) The electric field distribution of this novel insulator is different from that of a conventional insulator. The locations with sizeable electric fields are located in the insulation section, and the electric field in the arrester section is tiny.
(2) Both the ice layer and icicle affect the electric field distribution on the insulator surface. Specifically, the presence of ice and icicles on the insulator surface increases the electric field intensity on the insulator surface.
(3) When the ice layer is attached to the insulator surface, the icicle will further increase the electric field on the surface. In particular, the electric field of the air gap of the insulator is increased.
To more accurately describe the surface electric field of the insulator, the surface electric field curve along the left side of the insulator is counted in this paper, as shown in
Figure 6. In addition, the electric field on the surface of the pin electrode is also counted, as shown in
Figure 7.
As can be observed in
Figure 6, the electric field peaks of the three conditions on the left side of the insulator surface are located at the creepage distance of 50 mm, and the electric field peaks are 2.17 kV/cm, 3.23 kV/cm, and 3.17 kV/cm, respectively. Compared with the dry conditions, when there is an ice layer and icicle, it increases by 48.85% and 46.08%, respectively. In addition, when there is an icicle on the surface ice layer, an electric field peak (2.78 kV/cm) appears at the tip of the icicle, as shown in
Figure 6, at the creepage distance of 125 mm.
As observed in
Figure 7, electric field peaks on the surface of the pin electrode vary. The electric field peaks of the conditions with icicles are the largest, reaching 1.92 kV/cm, followed by the dry and icing conditions (1.45 kV/cm and 1.52 kV/cm). Compared with the dry conditions, when there is an ice layer and icicle, it increases by 4.83% and 32.41%, respectively.
Figure 6.
Electric field distribution of the left side.
Figure 6.
Electric field distribution of the left side.
Figure 7.
Electric field distribution of the pin electrode.
Figure 7.
Electric field distribution of the pin electrode.
In sum, when the insulator surface is covered with ice, there is an increase in the electric field along the surface and pin electrode. With icicles in particular, there is a prominent electric field peak at the tip of the icicle. In addition, it can be seen from the calculation results that icing affects the electrical performance of the insulators; therefore, the icing flashover test of insulators is carried out in this paper.
3.2. AC Breakdown Characteristics under Icing Conditions
In the AC flashover test, as is shown in
Figure 8, there are three types of arc paths.
Figure 8a shows the flashover arc path when ESDD is 0.01–0.02 mg/cm
2 (low pollution). The flashover arc path is between the disk and pin metal gap of the insulation section.
Figure 8b shows the flashover arc path when ESDD is 0.03–0.05 mg/cm
2 (medium pollution). The flashover arc path is along the surface of the silicone rubber umbrella skirt of the insulation section.
Figure 8c shows the flashover arc path when ESDD is 0.07–0.15 mg/cm
2 (heavy pollution). The flashover arc path is through the whole lightning protection composite insulator, which means that the arrester section composed of zinc oxide resistor did not work in the flashover process.
When the insulator surface is covered with ice, the flashover voltage under different pollution degrees is shown in
Figure 9. As observed in
Figure 9, the following conclusions can be obtained.
(1) The Uf varies greatly in different pollution levels under icing conditions. The value for Uf (ESDD = 0.01 mg/cm2) ranks the highest, standing at 41.3 kV. On the contrary, Uf (ESDD = 0.15 mg/cm2) is the lowest with nearly 15.3 kV. The maximum flashover voltage is 2.70 times more than the minimum. What is more, Uf shows a downward trend with the increase of pollution levels.
(2) With the increase of pollution level, the flashover voltage does not decrease linearly. There is a negative power function relationship between insulator ESDD and flashover voltage under icing conditions for traditional insulators. However, due to the diversification of arc paths during the flashover, the relationship between insulator ESDD and flashover voltage should be discussed again for this novel lightning protection insulator.
In addition, the pollution flashover test of the novel insulator (without the ice layer) was carried out. The tested pollution flashover voltage is 36.9 kV, which is 3.7 kV higher than the insulator with the ice layer (ESDD = 0.03 mg/cm2). The simulation results show that the electric field at the creepage distance of the insulator with the ice layer is more extensive. Therefore, the electric field of the insulator with the ice layer is easier to reach the air breakdown electric field, resulting in the decrease of the flashover voltage. This tested result is consistent with the findings of the electric field simulation.
4. Discussion
Under the conditions of pollution and icing, the accurate empirical formula of flashover voltage is essential for the design of external insulation. Four fitting methods are proposed in this paper about the calculation formula of flashover voltage of conventional insulators. They are negative power function, quadratic function, negative power function with the constant term, and piecewise function. The functional form is shown in Equations (5)–(8).
The fitting results between
Uf and ESDD, according to Equations (5)–(8), are shown in
Figure 10.
Figure 10a–d are the fitting results using negative power function, quadratic function, negative power function with the constant term, and piecewise function, respectively. It can be seen from the fitting results in
Figure 10 that the fitting method (negative power function) of the conventional insulator has the lowest goodness of fit (R
2 = 0.9037). The fitting methods of a quadratic function and negative power function with the constant term are better, and the goodness of fit is 0.9798 and 0.9885, respectively. As for the piecewise function, the goodness of fit is also acceptable, which are 0.9537 and 0.9583, respectively.
According to the above fitting results, the traditional negative power function is not recommended to calculate the flashover voltage of novel insulators under icing conditions in different pollution levels in this paper. In addition, although the fitting result of the piecewise function is good, it has high requirements for data points, which increases the number of tests required for fitting data. When there are few data points, for example, ESDD is between 0.01 and 0.02, and fitting cannot be performed.
In this paper, the quadratic function and negative power function with the constant term are recommended as empirical formulas for calculating the flashover voltage of novel insulators under icing conditions in different pollution levels. When the icing thickness is between 2.6–2.9 mm, the empirical formula for flashover voltage recommended in this paper is as follows:
5. Conclusions
Electric field distribution and AC breakdown characteristics of polluted novel lightning protection insulators under icing conditions are investigated. Compared with traditional insulators, we have made some new discoveries. From the findings, the following conclusion can be drawn.
(1) The electric field distribution of this novel insulator is different from that of a conventional insulator. When the insulator surface is covered with ice, there is an increase in the electric field along the surface and pin electrode. Especially with icicles, there is a prominent electric field peak at the tip of the icicle. Compared with dry conditions, when there is an ice layer and icicle, electric field peaks increase by 48.85% and 46.08%, respectively.
(2) Three arc paths in different pollution levels were discovered in the AC flashover test. The arc paths are related to ESDD under icing conditions.
(3) The Uf varies significantly in different pollution levels under icing conditions. Specifically, Uf shows a downward trend with the increase of pollution levels. The maximum flashover voltage is 2.70 times more than the minimum.
(4) This paper puts forward two more accurate empirical formulas. Specifically, after comparing the goodness of fit of different functions, the quadratic function and negative power function with the constant term are recommended as empirical formulas for calculating the flashover voltage of novel insulators under icing conditions.
Author Contributions
Conceptualization, J.L., J.H. and Z.F.; methodology, Z.Z.; investigation, X.Q.; resources, J.H.; writing—original draft preparation, X.Q.; writing—review and editing, Z.Z.; software, X.Q.; validation, Z.Z.; supervision, Z.Z. All authors have read and agreed to the published version of the manuscript.
Funding
This research was funded by State Key Laboratory of Disaster Prevention & Reduction for Power Grid Transmission and Distribution Equipment, grant number [SGHNFZ00ZHJLJS1900208].
Acknowledgments
The authors would like to express their gratitude to Chongqing University for their assistance with this research.
Conflicts of Interest
The authors declare no conflict of interest.
References
- Qiao, X.; Zhang, Z.; Raji, S.; Jiang, X.; Hu, J.; Fang, Z. AC Breakdown Characteristics of Polluted 10-kV Post Insulator with Concentric Externally Gapped Line Arrester. IEEE Trans. Power Deliv. 2021. [Google Scholar] [CrossRef]
- Jiang, Z.; Wu, W.; Wang, B.; Xie, P.; Li, H.; Lin, F. Design and test of 500-kV lightning protection insulator. IEEE Access 2019, 7, 135957–135963. [Google Scholar] [CrossRef]
- Wang, B.; Lu, J.; Fang, Z.; Jiang, Z.; Hu, J. Development of antithunder composite insulator for distribution line. IEEJ Trans. Electr. Electron. Eng. 2020, 15, 100–107. [Google Scholar] [CrossRef]
- Zhang, D.; Chen, S. Intelligent Recognition of Insulator Contamination Grade Based on the Deep Learning of Ultraviolet Discharge Image Information. Energies 2020, 13, 5221. [Google Scholar] [CrossRef]
- Zhang, D.; Xu, H.; Liu, J.; Yang, C.; Huang, X.; Zhang, Z.; Jiang, X. Research on the Non-Contact Pollution Monitoring Method of Composite Insulator Based on Space Electric Field. Energies 2021, 14, 2116. [Google Scholar] [CrossRef]
- Zhang, M.; Wang, R.; Li, L.; Jiang, Y. Size Distribution of Contamination Particulate on Porcelain Insulators. Coatings 2018, 8, 339. [Google Scholar] [CrossRef] [Green Version]
- Li, X.; Zhou, M.; Luo, Y.; Wang, G.; Jia, L. Effect of Ice Shedding on Discharge Characteristics of an Ice-Covered Insulator String during AC Flashover. Energies 2018, 11, 2440. [Google Scholar] [CrossRef] [Green Version]
- Liu, Y.; Li, Q.; Farzaneh, M.; Du, B.X. Image Characteristic Extraction of Ice-Covered Outdoor Insulator for Monitoring Icing Degree. Energies 2020, 13, 5305. [Google Scholar] [CrossRef]
- Xu, J.; Yin, F.; Li, L.; Wen, Q.; Wang, H.; Liu, S.; Jia, Z.; Farzaneh, M. Wet Snow Flashover Characteristics of 500-kV AC Insulator Strings with Different Arrangements. Appl. Sci. 2019, 9, 930. [Google Scholar] [CrossRef] [Green Version]
- Farzaneh, M. Research activities related to insulator flashover and selection criteria under icing conditions. In Proceedings of the 2006 IEEE Power Engineering Society General Meeting, Montreal, QC, Canada, 18–22 June 2006; p. 2. [Google Scholar]
- Porkar, B.; Farzaneh, M. In DC flashover performance of an inclined insulator string under heavy icing conditions. In Proceedings of the 2015 IEEE 11th International Conference on the Properties and Applications of Dielectric Materials (ICPADM), Sydney, Australia, 19–22 July 2015; pp. 648–651. [Google Scholar]
- Xu, T.; Nan, J.; Wan, X. In Research on icing flashover characteristic of different shed type composite insulators. In Proceedings of the 2014 International Conference on Information Science, Electronics and Electrical Engineering, Sapporo, Japan, 26–28 April 2014; pp. 191–194. [Google Scholar]
- Liu, Y.; Farzaneh, M.; Du, B.X. Nonlinear characteristics of leakage current for flashover monitoring of ice-covered suspension insulators. IEEE Trans. Dielectr. Electr. Insul. 2016, 23, 1242–1250. [Google Scholar] [CrossRef]
- Chihani, T.; Mekhaldi, A.; Beroual, A.; Teguar, M.; Madjoudj, D. Model for polluted insulator flashover under AC or DC voltage. IEEE Trans. Dielectr. Electr. Insul. 2018, 25, 614–622. [Google Scholar] [CrossRef]
- Lan, L.; Zhang, G.; Wang, Y.; Wen, X.; Wang, W.; Pei, H. The Influence of Natural Contamination on Pollution Flashover Voltage Waveform of Porcelain Insulators in Heavily Polluted Area. IEEE Access 2019, 7, 121395–121406. [Google Scholar] [CrossRef]
- Maadjoudj, D.; Mekhaldi, A.; Teguar, M. Flashover process and leakage current characteristics of insulator model under desert pollution. IEEE Trans. Dielectr. Electr. Insul. 2018, 25, 2296–2304. [Google Scholar] [CrossRef]
- de Santos, H.; Sanz-Bobi, M.Á. A Cumulative Pollution Index for the Estimation of the Leakage Current on Insulator Strings. IEEE Trans. Power Deliv. 2020, 35, 2438–2446. [Google Scholar] [CrossRef]
- Qiao, X.; Zhang, Z.; Jiang, X.; Sundararajan, R.; Ma, X.; Li, X. AC failure voltage of iced and contaminated composite insulators in different natural environments. Int. J. Electr. Power Energy Syst. 2020, 120, 105993. [Google Scholar] [CrossRef]
- Li, P.; Fan, J.; Li, W.; Su, Z.; Zhou, J. Flashover Performance of HVDC Iced Insulator Strings. IEEE Trans. Dielectr. Electr. Insul. 2007, 14, 1334–1338. [Google Scholar] [CrossRef]
- Jiang, X.; Chao, Y.; Zhang, Z.; Hu, J.; Shu, L. DC flashover performance and effect of sheds configuration on polluted and ice–covered composite insulators at low atmospheric pressure. IEEE Trans. Dielectr. Electr. Insul. 2011, 18, 97–105. [Google Scholar] [CrossRef]
- Hu, Q.; Yuan, W.; Shu, L.; Jiang, X.; Wang, S. Effects of electric field distribution on icing and flashover performance of 220 kV composite insulators. IEEE Trans. Dielectr. Electr. Insul. 2014, 21, 2181–2189. [Google Scholar]
- Zhou, X.; Xiong, J. Computation of a kind of electric field distribution of 10kV composite insulator coated by ice. In Proceedings of the 2008 China International Conference on Electricity Distribution, Guangzhou, China, 10–13 December 2008; pp. 1–5. [Google Scholar]
- Lu, J.; Hu, J.; Fang, Z.; Qiao, X.; Zhang, Z.; Jiang, X. AC Flashover Performance and Insulation Coordination of Novel Lightning Protection Composite Insulator. In Proceedings of the 2021 International Conference on Electrical Materials and Power Equipment (ICEMPE), Chongqing, China, 11–15 April 2021; pp. 1–4. [Google Scholar]
- Qiao, X.; Hu, J.; Sundararajan, R.; Zhang, Z.; Fang, Z.; Jiang, X. AC Flashover Performance of 10 kV Novel Composite Insulators under Icing Conditions in Natural Environment. In Proceedings of the 2020 IEEE Conference on Electrical Insulation and Dielectric Phenomena (CEIDP), East Rutherford, NJ, USA, 18–30 October 2020; pp. 172–175. [Google Scholar]
- Qiao, X.; Zhang, Z.; Sundararajan, R.; Jiang, X.; Hu, J.; Fang, Z. The failure arc paths of the novel device combining an arrester and an insulator under different pollution levels. Int. J. Electr. Power Energy Syst. 2021, 125, 106549. [Google Scholar] [CrossRef]
| Publisher’s Note: MDPI stays neutral with regard to jurisdictional claims in published maps and institutional affiliations. |
© 2021 by the authors. Licensee MDPI, Basel, Switzerland. This article is an open access article distributed under the terms and conditions of the Creative Commons Attribution (CC BY) license (https://creativecommons.org/licenses/by/4.0/).


