
Research on a Solar Hybrid Trigeneration System Based on Exergy and Exergoenvironmental Assessments


1
Department of Mechanical Engineering, Federal University of Rio Grande do Norte (UFRN), Natal 59072-970, Brazil
2
Department of Renewable Energy Engineering, Federal University of Paraíba (UFPB), João Pessoa 58051-900, Brazil
*
Author to whom correspondence should be addressed.
Energies 2021, 14(22), 7560; https://0-doi-org.brum.beds.ac.uk/10.3390/en14227560
Submission received: 17 September 2021
/
Revised: 21 October 2021
/
Accepted: 1 November 2021
/
Published: 12 November 2021
(This article belongs to the Topic Exergy Analysis and Its Applications)
Abstract
:The environmental performance of a combined cooling, heating, and power system is analyzed in this study at a component-level using a SPECO-based exergoenvironmental analysis. The engine consumes natural gas and produces 168.6 kW net power. The waste heat is recovered by a LiBr-H2O absorption chiller and a heat exchanger, which are used for cooling and heating purposes. The energy system is assisted by a solar field. An environmental Life Cycle Assessment quantifies the environmental impacts of the system, and these data are combined with exergy evaluations. The highest total environmental impact rate, 23,740.16 mPt/h, is related to the internal combustion engine, of which pollutant formation is the primary source of environmental impact. Compared with a non-renewable energy system, the solar-assisted trigeneration system decreased the environmental impact per exergy unit of chilled water by 10.99%. Exergoenvironmental performance can be further improved by enhancing the exergy efficiency of the solution pump and high-pressure generator (HG), and by employing a treatment to remove nitrogen oxides in the reciprocating engine.
1. Introduction
The growing environmental awareness in society has motivated the development of more efficient and integrated energy systems. Examples of these energy systems include the cogeneration concept, in which the cascading use of energy enables the transfer of energy between subsystems, increasing cost and environmental efficiencies. In the case of trigeneration systems, the main products are usually electricity, heat, and cooling. Considering that the electricity consumption of the Brazilian residential sector amounts to 29.6% [1], and that a significant share is related to air conditioning, the trigeneration concept can be employed, coupling thermally activated absorption technologies that can harness waste heat to produce cooling.
In addition, solar thermal energy is an intelligent alternative to help meet rising electricity demands and to mitigate greenhouse gas (GHG) emissions of the industrial and residential sectors. Clean energy technologies can help achieve global objectives related to climate change and more sustainable development [2]. More specifically, hybrid energy systems have become promising alternatives to reduce GHG emissions and address the variability and intermittence associated with renewable resources.
An exergy analysis can be considered superior to a conventional energy analysis, due to its ability to identify the irreversibilities within energy conversion processes. However, decision-making based on exergy values alone might lead to unsuitable energy systems when considering economic and environmental goals and needs. To this end, several combinations of exergy concepts with economic and ecological concerns have been proposed over the last decades. The merging of economic principles with exergy analysis has been explored since the 1930s [3,4], but the combination of second law analysis for environmental purposes only emerged in the late 20th century [5]. Examples of the latter include the exergoecological analysis, which is based on cumulative exergy consumption (CExC) [6], and the accountancy of external environmental costs of any useful forms of energy [7]. In 2009, the exergoenvironmental assessment was developed [8] to understand and track the formation of environmental impacts in energy conversion systems, using environmental data obtained via a Life Cycle Assessment (LCA).
The LCA is standardized using ISO 14040 (2006) [9] and ISO 14044 (2006) [10]. Ab LCA is utilized to quantify the potential environmental loads of energy systems, to evaluate their performance, and to help compare alternatives at the design and operation stages. In 2010, [11] reported a systematic method to decrease the life cycle impact of cooling applications, employing an optimization model that considered economic and environmental perspectives. Considerable reductions in environmental loads were obtained when solar collectors were implemented as part of the optimal solution. More recently, [12] conducted a comparative environmental analysis between an experimental solar absorption air-conditioning system and a commercial cooling system. The case study was developed in Mexico, and 80% GHG emission savings were obtained for the solar cooling system, along with an 85% and a 20% decreases in fossil fuel depletion and ecotoxicity, respectively. Spanish district heating and cooling systems were the focus of the LCAs in [13], whereby the authors studied different types of thermal energy storage and verified that the non-renewable energy system always presented the highest emissions due to the consumption of fossil fuel (natural gas).
Energy conversion systems have attracted attention, with recent studies focusing on the analysis and optimization of these systems. Exergoeconomic and exergoenvironmental analyses were applied to an integrated solar hybrid cogeneration system [14]. It was verified that the integration of a solar field reduced the environmental impact per exergy unit of electricity by 3.8%. A cradle-to-use LCA was conducted by [15] on industrial solar thermal systems. The results were site-dependent, with significant energy and emission savings verified for large-scale applications (35–70 GJ/kWth and 2–5 t CO2/kWth, respectively). The environmental impacts of a solar-based trigeneration plant located in Italy were assessed by [16]. When varying the solar field area from 50 m2 to 100 m2, the payback time reduced by almost six years, with environmental impacts reducing from 140 μPt/kWh to 104 μPt/kWh. An Organic Rankine Cycle (ORC)-based trigeneration system was proposed by [17], with solar energy and a water-LiBr double-effect absorption chiller. The results of the advanced exergy-based environmental analysis showed that the genset presented the highest total environmental impact (37.05 mPts/h)—if the exergy dissipation of the genset is reduced, the exergoenvironmental performance can be improved. Furthermore, [18] presented an exergoenvironmental assessment for a genset-coupled municipal solid waste digestion plant, concluding that environmental performance could be enhanced by minimizing the irreversibility rate of the genset. The authors of [19] carried out an exergoenvironmental assessment of an absorption refrigeration system for low-temperature applications and identified that the rectifier presented the highest environmental impact rate (6455.96 mPts/h), with the exergy-related environmental impact dominating the overall system.
However, only a few studies have been carried out on the evaluation of the environmental burden of solar-assisted trigeneration systems that include a natural gas engine and Li-Br absorption chiller. Therefore, the present study investigates the exergy and exergoenvironmental performance of a natural gas-based trigeneration system assisted by evacuated solar collectors. The hotspots of exergy inefficiencies are identified, and the formation process of environmental impacts throughout the system is unraveled. The objective is to quantify and track the environmental impacts of each component throughout the energy system and determine the environmental loads per exergy unit of the final products of the system (electricity, chilled water, and hot water). The main contributions of this paper are as follows: (i) the development of an efficiency model evaluating solar tubes for Northeast Brazil; (ii) an evaluation of the energy and exergy performance of an absorption cooling system; (iii) the assessment of the exergy and exergoenvironmental parameters of each component and the global system and (iv) a comparison of the specific environmental impacts of the three energy products with literature data.
2. Materials and Methods
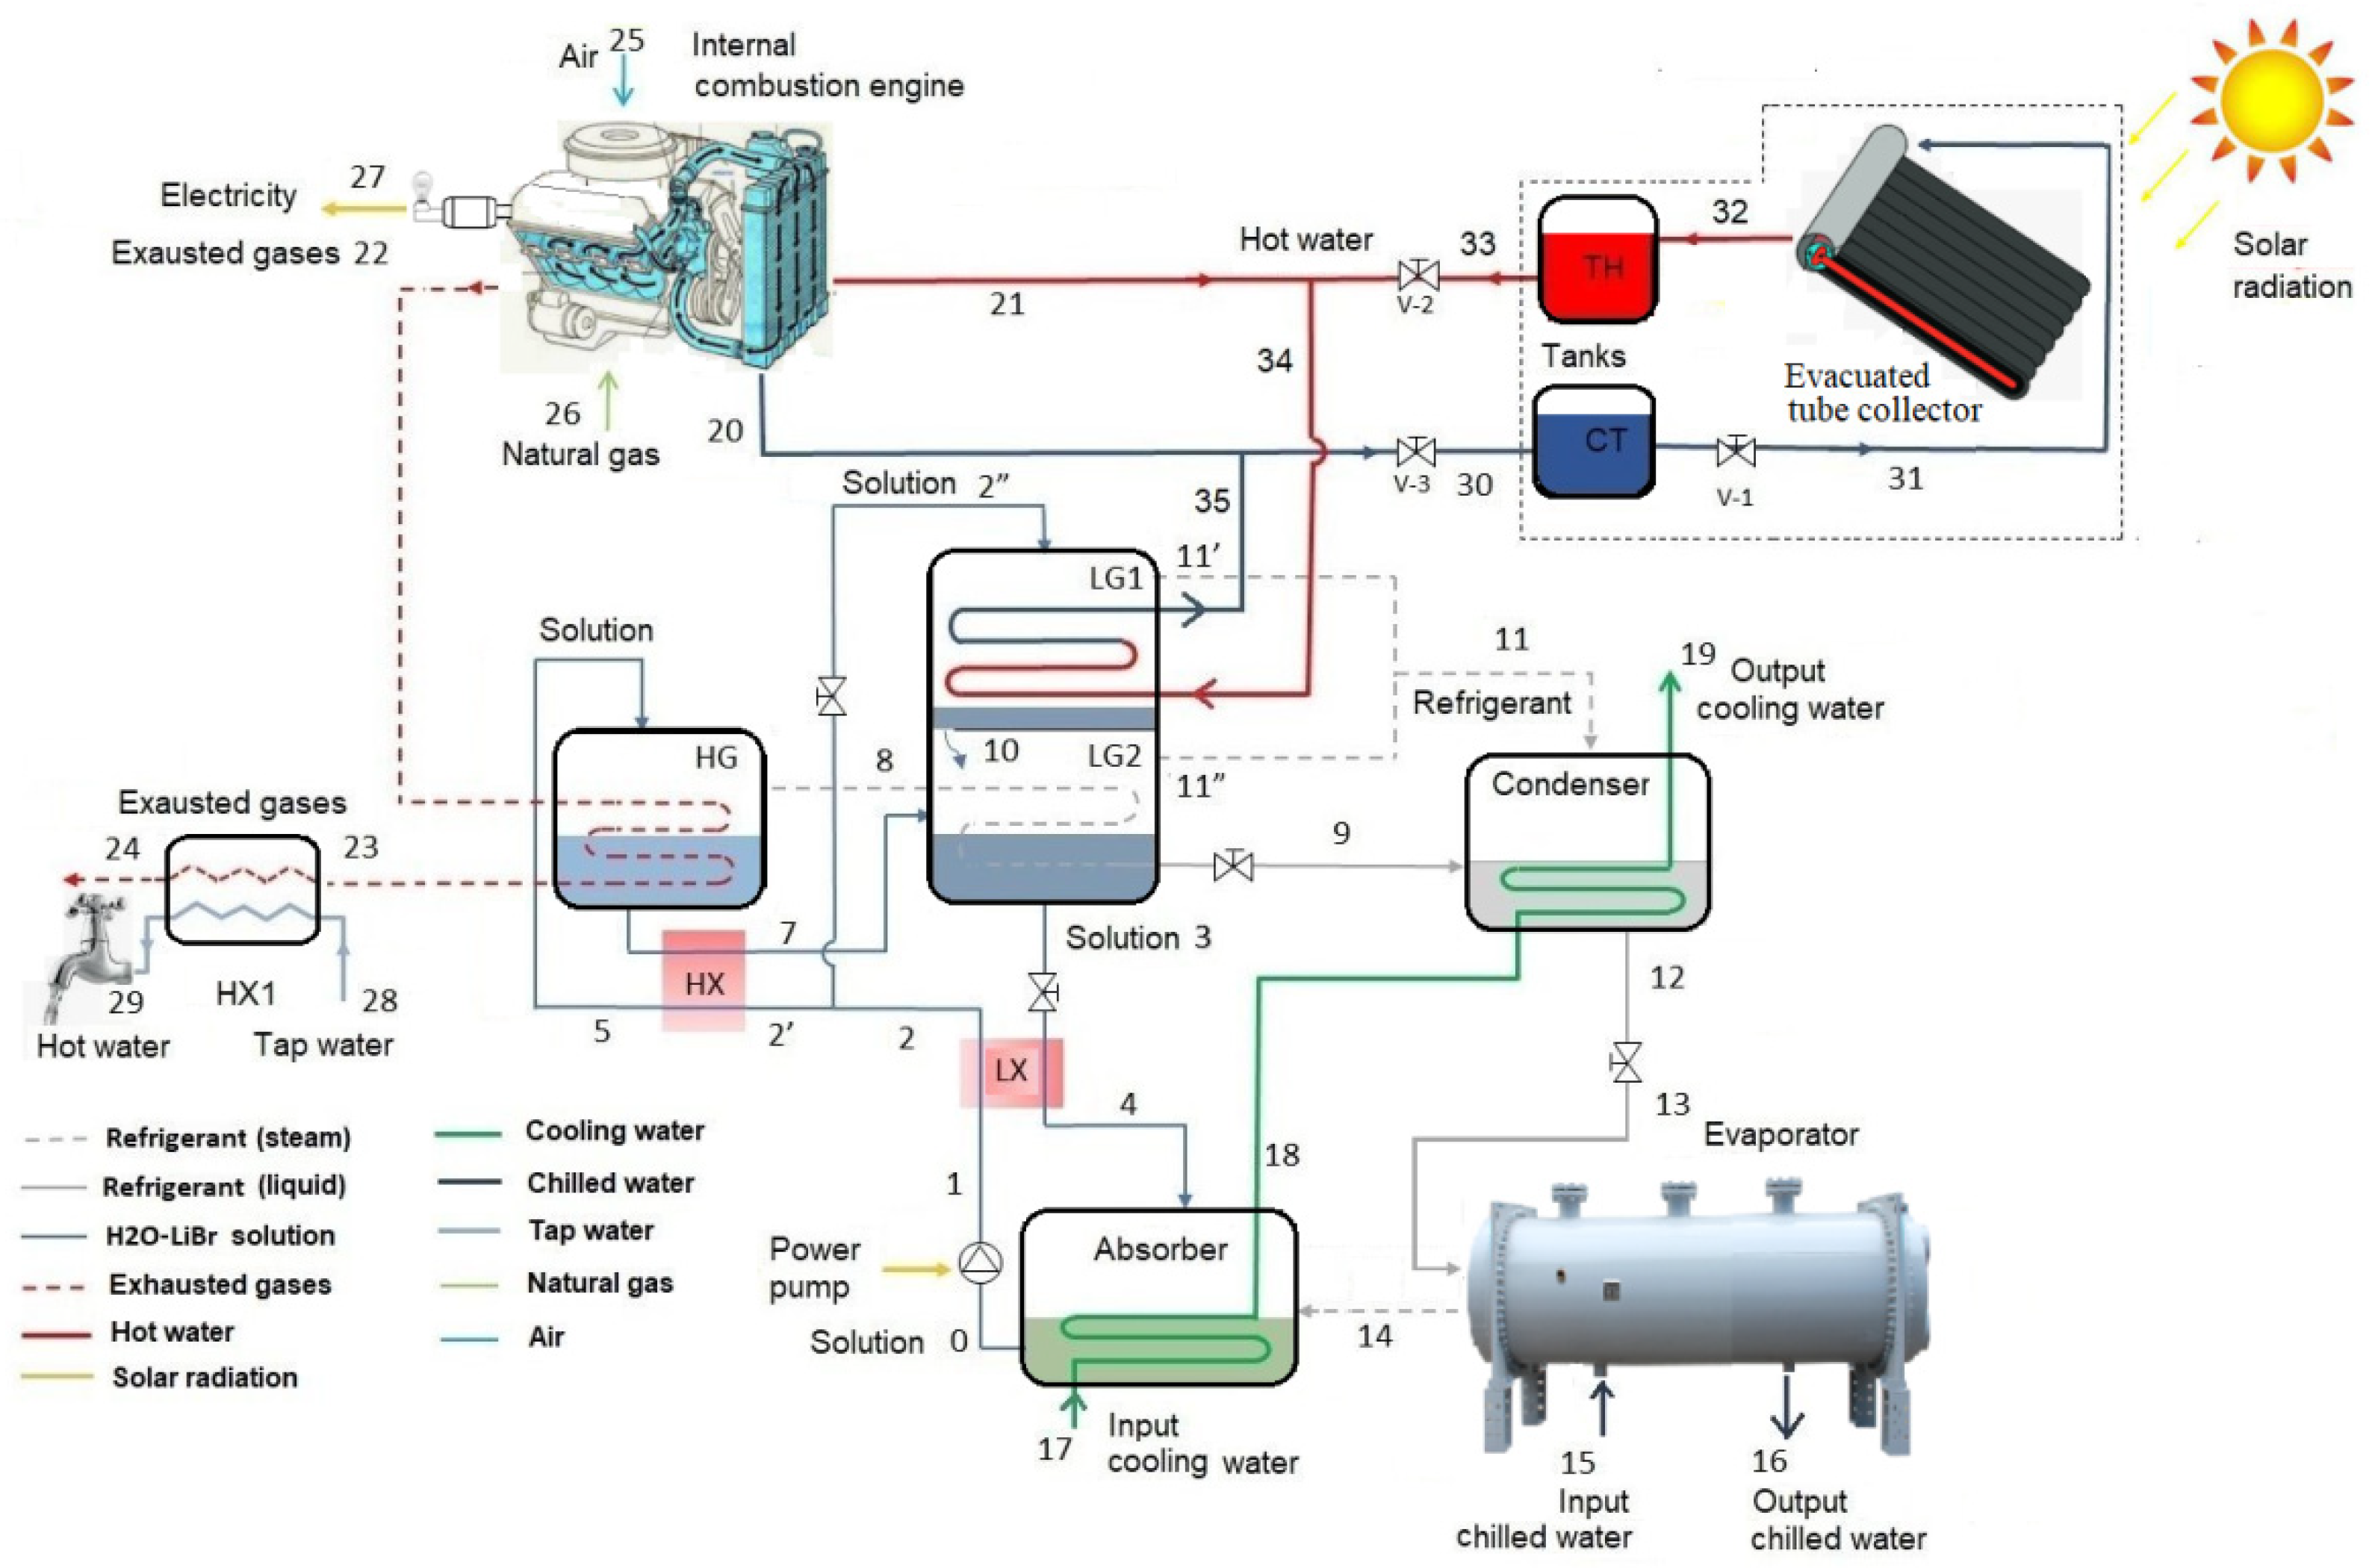
Figure 1 shows a schematic diagram of the solar-assisted trigeneration system. The outputs of the energy system are electricity, heat (hot water), and chilled water (air-conditioning purposes). The complete details on the operation of this system can be found in [20].
At full load conditions, the natural gas engine generates 168.8 kW of electricity. Following [20], the mixed-effect chiller uses three pressure stages (high, intermediate, and low). The first circuit refers to the High-Pressure Generator (HG). The second circuit refers to the low-pressure generators (LG1/LG2) and condenser, and the third circuit refers to the evaporator and absorber. H2O and LiBr is the working fluid for this subsystem. Most commercial absorption systems use the working fluids H2O/NH3 or H2O/BrLi. The former reaches lower temperatures (below 0 °C) and is utilized for ice production, and the latter does not reach temperatures under 0 °C and is therefore used for air conditioning purposes. H2O/BrLi requires a lower temperature from the steam generator, of around 85 °C, and therefore this system presents higher efficiency than H2O/NH3, which requires a steam generator temperature of 120 °C. Consequently, the system with H2O/BrLi fluid is more advantageous for air conditioning applications.
Thermal energy shares from the exhaust gases (737.2 °C) and jacket water (85 °C) are delivered to the high- and low-pressure generators (HG and LG, respectively) to drive the desorption process.
A solar field provides supplementary heat to the chiller. The solar field has a 97.28 m2 aperture area, is based on evacuated tube solar collectors, and uses water at 101.3 kPA as the heat transfer fluid. The output water flow through the collectors′ manifold is delivered at 85.6 °C, according to the hourly average irradiation (Natal, Northeast Brazil—5.83° S, 35.21° O). More details on the solar energy model can be found in [20]. A thermal energy storage tank stores hot water and supplies a constant hot water flow to the chiller throughout the day (24 h). The chiller also received a contribution of jacket water from the engine.
2.1. Mathematical Modeling and Exergy Assessment
This section is based on [20] and presents an overview for clarification.
The combustion reaction is considered incomplete combustion, with the formation of CO and NO. According to [23], the mole fraction of moist ambient air is 20.59% of O2, 77.48% of N2, 1.90% of H2O, and 0.3% of CO2.
The composition of natural gas is 88.82% of CH4, 8.41% of C2H6, 0.55% of C3H8, 1.62% of N2, and 0.6% of CO2, with a Lower Heating Value (LHV) of 47,574 kJ/kg.
The mass flow rate of the exhaust gases from the internal combustion engine was calculated using the stoichiometric coefficients of gaseous products, which were predicted through the process of chemical equilibrium regarding the equilibrium constants of dissociation of carbon dioxide and nitrogen oxidation reactions.
The mathematical model of the chiller considered mass conservation, chemical species mass conservation, and energy balances for each component of the refrigeration system. Its thermodynamics properties were based on the mixed-effect chiller evaluated by [22]. The enthalpy of the H2O/LiBr solution was evaluated by the correlations of [24], and the entropy of the binary solution was obtained from [25].
Exergy is a thermodynamic property of the system, relative to its surroundings, and can be stated as the maximum theoretical useful work produced by a mass or energy flow until it reaches total equilibrium with the reference environment. In systems where the chemical composition changes, e.g., when chemical reactions occur, more accurate results can be provided by separating the exergy forms [26]. The specific exergy value (e) of a mass stream (i) is the sum of the physical () and chemical portions () (kinetic and potential exergies not considered).
The specific chemical exergies of pure species streams were calculated from the standard chemical exergy reference from Model II of [27]. For mixture streams, the molar chemical exergy followed Equation (1) [28]).
Chemical activity is different for ideal and real solutions and can depend on the molar fraction. For ideal solutions γ = 1. The chemical exergy of the H2O/LiBr solution adds the standard chemical exergy of the solution components plus the exergy destruction from the dissolution process. The standard chemical exergy values () for water and Lithium Bromide were calculated from [29] and from the Gibbs molar function proposed by [28], yielding 900 kJ⋅kmol−1 and 101,600 kJ⋅kmol−1, respectively
Regarding solar energy, the exergy of absorbed radiation is given by Equation (2).
Ta is the ambient temperature and Ts is the sun surface temperature of 5770 K. is the absorbed radiation thermal rate on the area of the collector.
After assigning exergy rates to the streams, product and fuel definitions are applied to each system element, following the SPECO method. All exergy removals of the flows within the system refer to the fuel, and all exergy increases are associated with the product.
The exergy efficiency of a component (ε) is stated in Equation (3). It is the ratio between the exergy flow rates of product and fuel ( and , respectively).
The exergy destruction () within a component is a measure of the real inefficiencies of a thermodynamic process. It is defined by Equation (4).
2.2. Exergoenvironmental Assessment
Beginning with the exergy analysis, the exergoenvironmental assessment goes a step further by carrying out an environmental assessment of the equipment and energy flows with the LCA methodology and develops exergoenvironmental cost accounting by connecting the results of the exergy analysis with LCA data [8]. The Eco-indicator 99 method is used for the environmental impact assessment [30], expressing the environmental impacts in terms of points or mili-points (Pts or mPts). More details on the LCA calculation procedure for the Eco-indicator 99 method can be reviewed in [31].
Different exergy forms are also considered separately in the exergoenvironmental assessment, and the environmental impact rate of exergy streams () can be divided into their physical and chemical components. The specific environmental impact of both the physical and chemical exergy (biPH,biCH) must be known to calculate .
The environmental impact balance of a component considers that the environmental impact rate associated with the product () is equal to the environmental impact rate associated with the fuel () plus the environmental impact rate of the component () and the environmental impact rate due to the formation of pollutants (), as shown in Equation (6).
The environmental impact rate of each component () is calculated by Equation (7).
The lifetime (ny) of all system components is 25 years, with 8000 h of operation per year (nh). For the solar field, the yearly operation time is defined by the hours of sunlight per year (herein 3000 annual hours for solar collector field and storage tanks).
For the equipment, the component-related environmental impact refers to the material composition and includes the weight of materials, their manufacture, and their transportation. The dimensional and operational parameters of equipment followed [14]. The environmental impact of each component was calculated in agreement with its weight and its specific environmental impact, as given by [14,32].
The environmental impact rate due to the formation of pollutants () accounts for the operation phase of the energy system (e.g., combustion of fuel and the associated emissions). The environmental impact rate is negative when the mass flow of pollutants decreases within the component (i.e., carbon capture technologies). Only the following air pollutants are considered herein: carbon dioxide (CO2), carbon monoxide (CO), and nitrogen oxide (NO). The Eco-indicator 99 values of the per mass unit of compounds discharged into the atmosphere were obtained by [33].
Auxiliary equations are required when the number of unknowns exceeds the number of equations. These auxiliary equations are formulated following the F and P principles for exergoeconomic balances. Table 1 presents the exergoenvironmental balances for each component. Exergoeconomic and exergoenvironmental assessments assign monetary values and environmental impacts to exergy streams in conversion systems. Both approaches are based on specific exergy costing (SPECO) to provide component-level balances and auxiliary equations.
The condenser and throttling valves are considered to be dissipative components, as they destroy exergy from a stream without producing a product, i.e., no thermodynamic gain occurs when they are considered in isolation. Exergy destruction can be considered by assigning a fictitious environmental impact rate and then allocating impacts to the device that is served by the dissipative component.
The average specific environmental impacts per exergy unit of product () and fuel () are shown in Equations (8) and (9).
The environmental impact rate associated with the destroyed exergy () refers to the environmental impacts resultant of the irreversibilities, represented by Equation (10).
For components supplied with renewable energy streams (e.g., solar collectors), the environmental impact rate of destroyed exergy () can be interpreted as the environmental impact associated with the loss of product, for a given amount of fuel. This is expressed by Equation (11).
For renewable energy streams, the average environmental impact per exergy unit of fuel is null.
Exergoenvironmental variables are additional parameters to evaluate the performance of a system or process. The relative difference of environmental impacts, (), represents the potential for reducing component-related environmental impacts, as represented in Equation (12).
The exergoenvironmental factor (fb,k) is the ratio between non-exergy-related environmental impacts and the overall environmental impacts and indicates which type of impact is dominant. fb,k is calculated by Equation (13).
The LCA of natural gas was calculated with the aid of software SimaPro 9.1.1.1 [34], using the Ecoinvent 3.6 database [35] and Eco-indicator 99 (EI99) version 2.10 (within SimaPro). The system model allocation is based on the cut-off approach, and the hierarchist perspective was employed, with an average weighting set (H/A). The selected process represents natural gas at a service station (1–5 bar) (Ecoinvent, [35]). This data set includes the exploitation and production of natural gas (13% out of combined oil gas production, of which natural gas is assumed to be 20% sour). The leakage in exploitation is estimated at 0.38% and for production it is estimated at 0.12%. Around 30% of the produced water is discharged into surface water. Water emissions are differentiated between combined oil and gas production. In the service station, the electricity requirements and emissions from losses are included. Combustion is not considered, as its impacts are accounted for separately within the formation of pollutants as previously mentioned. Table 2 shows the disaggregated environmental impacts associated with natural gas.
3. Results
The dead state is 10 °C with atmospheric pressure (101.3 kPa). This low temperature is in accordance with the low temperature and pressure conditions of the absorption refrigeration system. Following [23], the exergy associated with workflows is negative when P < P0, providing negative values for physical exergy.
Therefore, the physical exergy of the steam at the evaporator (points 13 and 14, input and output) is negative when the dead state temperature is 25 °C. The lower pressure and temperature at these points result in a high entropy value. Therefore, streams under dead state pressure could present negative physic exergies, which leads to a negative environmental impacts rating in the exergoenvironmental analysis, which is inconsistent.
Table 3 lists the thermodynamics and exergoenvironmental parameters of each stream within the system. Streams 31 and 32 refer to inlet and outlet water flows of the solar collectors and were not considered in exergy and exergoenvironmental analyses because the collector field and storage tanks were evaluated jointly. Thus, exergy and exergoenvironmental parameters are not presented.
The engine produces 168.8 kW net power at point 27 and the exiting flows of hot water and exhaust gases supply the mixed-effect absorption chiller, which produces 460.6 kW of chilled water at point 16. Heat from the exhaust gases is harnessed within a hot water heat exchanger to produce 5.47 kW of hot domestic water at point 29.
Dissipative losses were allocated within the exergoenvironmental balances. The fictitious environmental impacts of the solution expansion valve and the condenser throttle valve were assigned to the chilled water. The fictitious environmental impact of the condenser was apportioned to the steam generators (LG1, LG2 and HG), using the entropy difference as a weighting factor.
The environmental impacts per exergy unit of products are 39.651 mPt/MJ (or 142.909 mPt/kWh) for electricity, 2.258 mPt/MJ for chilled water and 3.204 mPt/MJ for hot water. Other studies in the scientific literature have found higher environmental impact rates associated with cooling, because cooling is usually produced after power generation and carries the exergy destruction of the components, such as in [36,37]. Although the chilled water and hot water production are subsequent to power generation, the EI of electricity is higher.
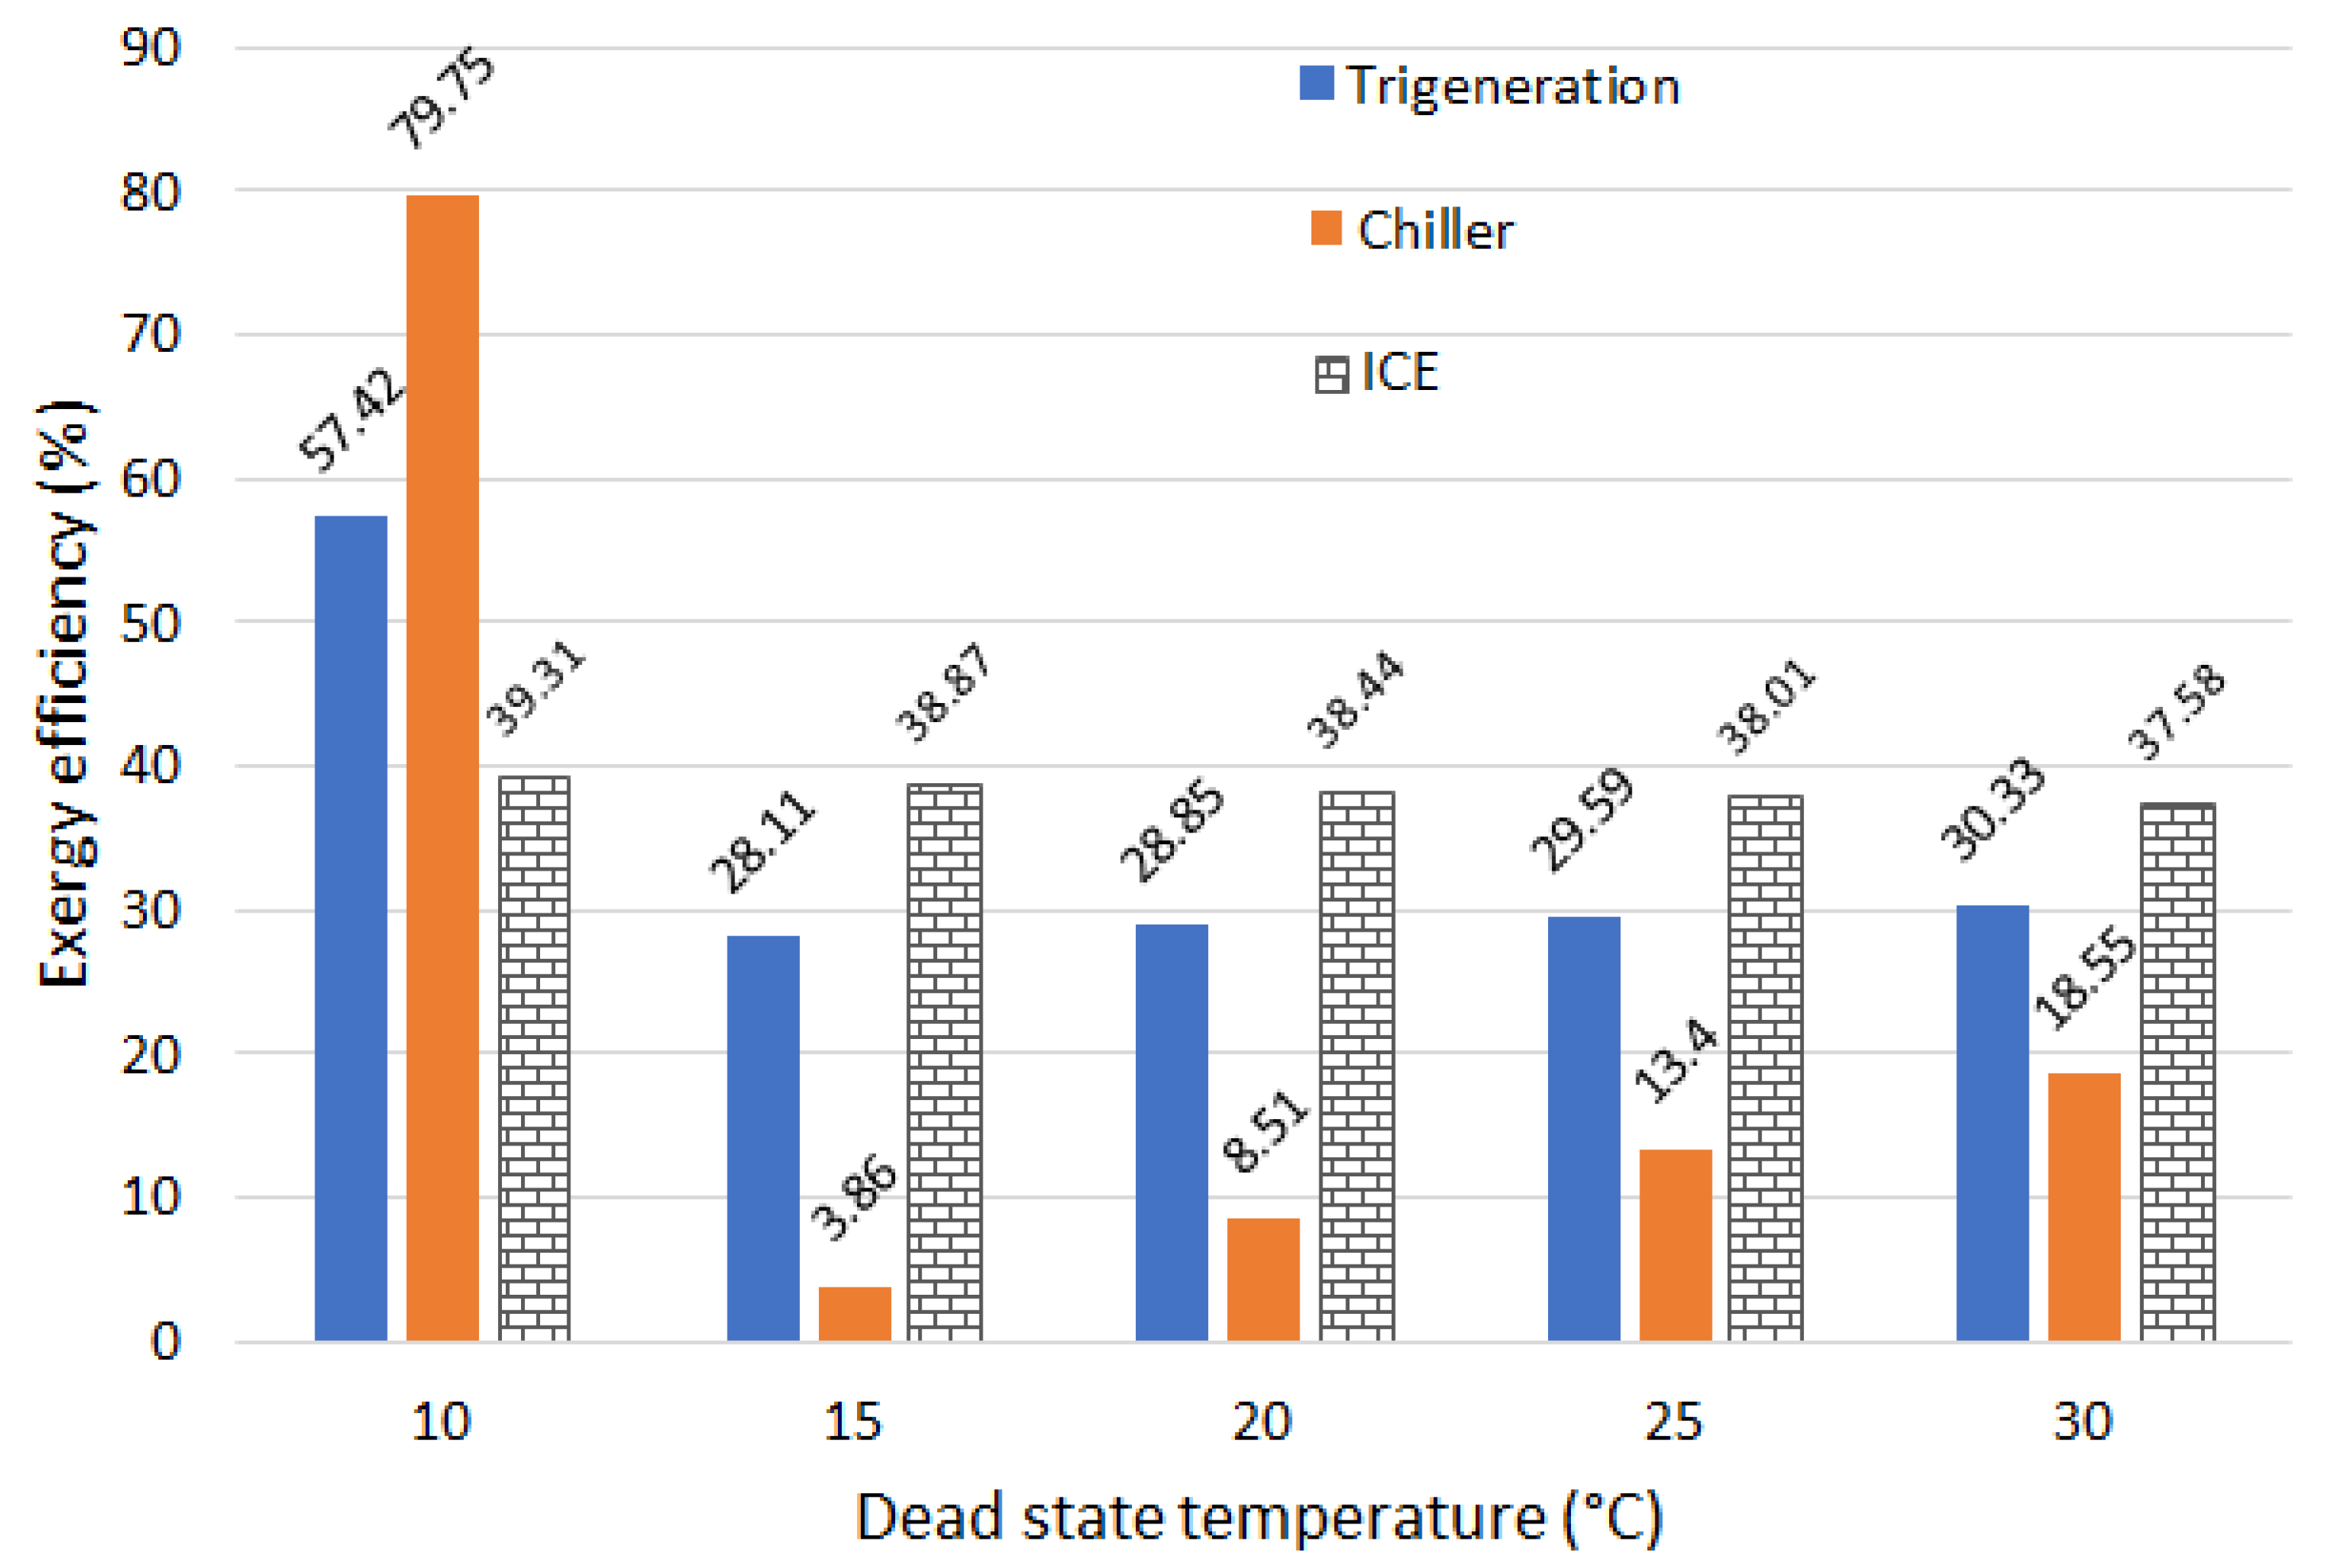
Figure 2 shows the variation of exergy efficiency when the dead state temperature varies from 10 °C to 30 °C.
In Figure 2, it is observed that the exergy efficiency of the internal combustion engine is reduced with dead state temperature, as it changes from 39.31% to 37.58%. All temperatures within the engine are above the dead state temperature. According to the SPECO approach [26,38], the definition of fuel and product for heat exchangers depends on the temperature of the inlet and outlet exergy streams. When all temperatures are above the dead state temperature, the fuel and product definitions use the exergy difference. The products of the engine are the exergy rate of hot water, plus electricity and exhaust gases (. The fuels used for the engine are the natural gas and environment air . Similar results have been reported by [39], in which the exergy efficiency of an internal combustion engine changed from 32.9% to 29.9%. These values are lower because [39] has only one product whereas in this study we focus on a trigeneration system.
The exergy efficiency of the absorption chiller increases with a dead state temperature. This occurs between 15 °C and 30 °C. All of the hot water and exhaust gas temperatures of the chiller are above the dead state temperature. The fuels of the chiller are the hot water and exhaust gases . The product of the chiller is the exergy rate variation of chilled water (. Both water temperatures are below the dead state temperature. As the dead state temperature increases, the increment of the product exergy rate of the chiller (difference in the exergy rates of points 16 and 15) also increases. When the dead state temperature is 10 °C, the temperature of point 15 is 14 °C (above the dead state temperature). According to [38], the purpose of the heat exchanger dictates that the cool fluid input (#15) belongs to the fuel, and therefore the exergy rate of the cool fluid input is accounted for within the fuel principle as . Please refer to [40] for a detailed explanation on the interactions and possibilities of inlet and outlet flows of heat exchangers.
The dead state temperature of 10 °C is above the temperature of point 16 and below the temperature of point 15. Therefore, the exergy rate of the chilled water exiting the evaporator is the product exergy rate, rather than the difference between these two points. The inlet chilled water of the evaporator is considered in the fuel exergy rate, according to the SPECO approach. Such a change in the definition of fuel and product leads to a higher exergy efficiency of the absorption chiller (79.75%, orange column in Figure 2). The exergy efficiency of the overall trigeneration system correlates with the absorption chiller.
For a dead state temperature of higher than 15 °C, the product definition accounts for the exergy rate of chilled water, hot tap water and electricity: (. The fuel definition includes the natural gas and the environment air . When the dead state temperature is 10 °C, the exergy rate of point 15 becomes part of the fuel and its product definition changes to ( and the fuel definition is . The efficiency reaches 57.42% at the lowest reference temperature (see the blue column in Figure 2). At higher temperatures, the exergy efficiency is around 29%.
Figure 3 shows the effect of the dead state temperature on the exergy destruction rate.
The exergy destruction rate in the chiller and overall system increases slightly as the dead state temperature reduces, as depicted in Figure 3. This occurs because the exergy rate of fuel increases, and the exergy rate of product decreases with a reduction of the dead state temperature. The exergy destruction rates of the reciprocating engine, solar field and hot water heat exchanger did not present significant changes with varying dead state temperatures. This fact can be demonstrated by Equation (4). The exergy destruction is the difference between the exergy rates of fuel and product. The exergy destruction of the trigeneration system is − (. For lower dead state temperatures, it is − (. The efficiency reaches 57.42% at the lowest reference temperature (blue column, in Figure 2). At higher temperatures, the exergy efficiency is about 29%.
The exergy destruction rate in the internal combustion engine decreases slightly as the dead state temperature is reduced. As dead state temperature is reduced, the exergy rate of product is slightly increased. The exergy rate of fuel is constant. Therefore, the exergy destruction rate is slightly reduced. The effect of different dead states on exergy efficiency and exergy destruction rates has been explored in the scientific literature. Caliskan et al. [39] have demonstrated the variation of exergy efficiency and exergy destruction rates for an internal combustion engine with different reference values of the dead state temperature. In [39], the same behavior is observed- as the dead state temperature is reduced, the exergy efficiency decreases. It must be emphasized that the methodology has not been altered to address different dead state temperatures: the SPECO approach is followed, but due to the differences between dead state and ambient temperatures, the definitions of fuel and product change [38].
Table 4 shows the exergy parameters, and the results indicate that the highest fuel exergy rates are located, firstly, in the internal combustion engine, and secondly in the evaporator. The engine is fed by natural gas with a high chemical exergy content (49,347 kJ/kg), which is then converted into the thermal energy of combustion gases. The evaporator has a high fuel exergy rate due to its fuel definition. The fuel exergy rate must consider the inlet chilled water with ad high exergy rate (point 15) because the dead state temperature value is located within the inlet and outlet temperatures (points 15 and 16). For the same reason, the evaporator has the highest product exergy rate as the chilled water flow at point 16 is considered in the product definition. The engine also presents a high product exergy rate due to the high exergy rate of the electrical power converted by the shaft power in combustion.
The total exergy destruction within the trigeneration system is 449.80 kW, and the internal combustion engine contributes 64.36% (289.50 kW) of the overall amount. The high exergy destruction rate within the engine occurs because of the combustion (resource degradation associated with the chemical reaction). The HG has the highest exergy destruction rate among the chiller components, at 39.91 kW, or 8.87%. This results from the occurrence of heat transfer across a significant temperature difference between the heat source (exhaust gases) and the working fluid (LiBr-water solution). The highest exergy destruction rates were attributable to the ICE and steam generator of the refrigeration system in [36], of 87.80% and 7.90%, respectively. This was also one of the conclusions of [41], in which the authors studied a multigeneration scheme with waste heat recovery and verified that improvement efforts should be initially directed to the engine, to decrease costs and environmental loads.
The solution pump and solar field are the components that possess the lowest exergy efficiencies of the system. At the pump, the electricity that is supplied is used to increase the pressure of the solution, and therefore flows to LG1 and HG. As the pressure has little influence on the enthalpy and entropy of compressed liquids, the exergy gain of the solution along the pump is minimal. At the evacuated tube collector, solar radiation is converted into thermal energy to transfer heat to the water flow. Then, the high availability of solar irradiation is used to obtain a slight gain at the exergy of the product, leading to a low exergy efficiency.
The composition of the combustion gases was obtained via chemical equilibrium. Table 5 displays the volumetric fraction of the combustion products, mass flow and environmental impact rate due to pollutant formation. The environmental impact rate due to pollutant formation in the gas engine is 5.292 mPt/s, for which NO emissions are 5.119 mPt/s (96.73%), CO2 emissions are 0.140 mPt/s (2.65%), and CO emissions are 0.033 mPt/s (0.62%). The major contribution of NO is a result of its high specific environmental impact (4216.74 mPt/kg), despite its low mass flow at point 22. In the work of Cavalcanti [37], NO emissions represented 92% of the environmental impact rate associated with pollutant formation in the gas-diesel fueled engine. SO2 and unburned hydrocarbon emissions were also considered in [37].
Figure 4 shows a Sankey diagram for the environmental impact rates throughout the trigeneration system. The environmental impacts of inlets were the inputs to the exergoenvironmental balances. No environmental impacts were associated with tap water (point 28), chilled water (point 15), cooling water (point 17), atmospheric air (point 25) and solar radiation (point 36).
Table 6 lists the exergoenvironmental parameters for each component. The condenser and the LG2 have the highest average environmental impacts per exergy of fuel. The highest average environmental impact per exergy of product occurs at the solution pump. This high value is due to the low exergy rate of product, as the pump has the purpose of increasing pressure, and the solution stream at point 0 has only a slight gain in exergy.
Regarding exergy destruction, the highest environmental impacts are located at the ICE, followed by the absorber and HG. High values of the exergy destruction rates are located in the internal combustion engine and the HG. The absorber is a dissipative component as it destroys exergy (cools solution to 30 °C) to guarantee steam absorption.
The results show that the environmental impact rate of component () has only a slight effect on the total environmental impact (), as shown in Table 6. The solar field is the component with the highest (about 12.75%) due to the large amount of material used to manufacture the collectors, which are mainly copper and glass. Furthermore, the environmental impact of the solar field is annualized over a shorter lifetime, resulting in a higher environmental impact rate. Despite the major contribution of the solar field on component-related environmental impacts of the system, its contribution to the overall environmental impact is irrelevant, at around 1%.
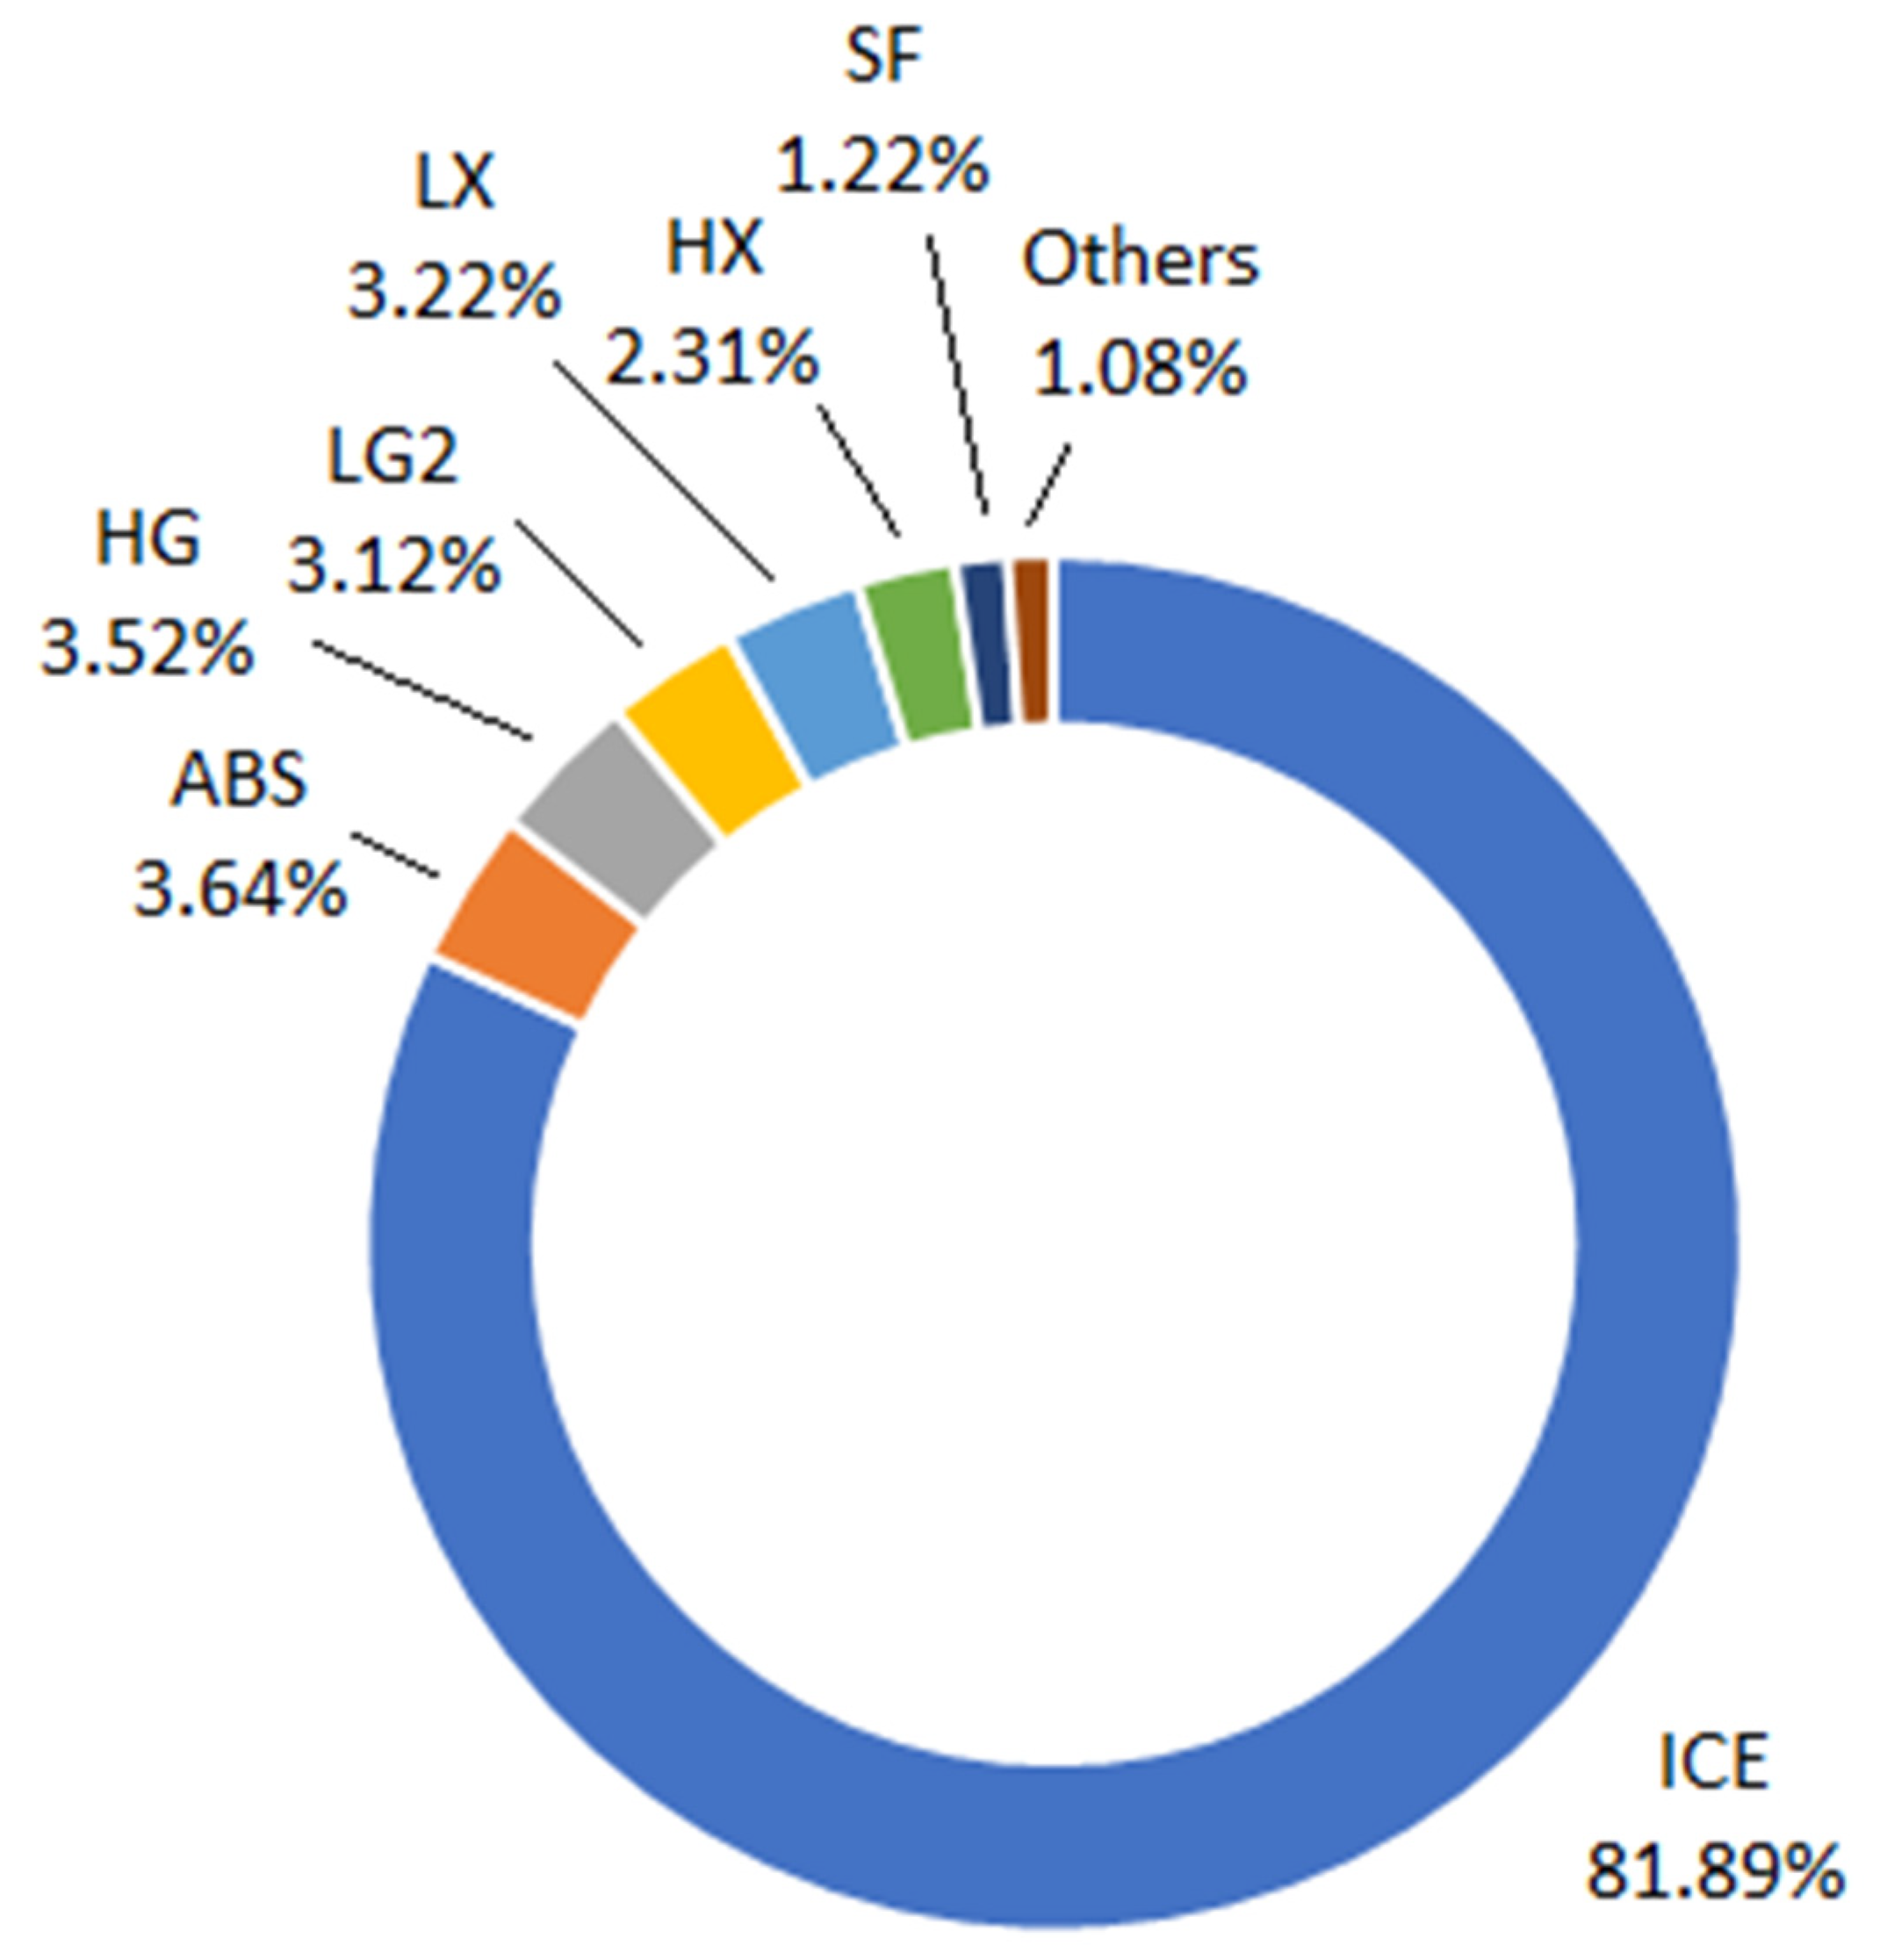
Figure 5 shows the composition of the overall environmental impacts. The gas engine presents the highest total environmental impact (23,740.16 mPt/h), at 81.89% of total environmental impact of the overall system. This is because of the formation of pollutants during combustion (about 65.71% of total environmental impact). NOx has a harmful effect on human health (respiratory system) and to ecosystem quality (related to acidification and eutrophication). Thus, an activated carbon filter panel is an appropriate method by which to reduce the level of contaminants such as oxides of nitrogen.
The exergoenvironmental factors in Table 6 indicate the contribution of non-exergy related environmental impacts to the total environmental impacts of components. Usually, the environmental impacts associated with the life cycle of components contributes less than 1% to the overall value.
The engine and solar field present the highest exergoenvironmental factors due to the formation of pollutants and the high level of environmental impacts related to the component life cycles, respectively. Aiming at the enhancement of exergoenvironmental performance, components with lower factors must be optimized.
The solution pump, the LG2 and HG present the lowest level of exergoenvironmental factors, and the exergy destruction constitutes the main source of the environmental impacts. The solution pump presents the lowest exergy efficiency, and its environmental performance can be improved by increasing its efficiency. Reducing the heat source temperature in HG can act as an alternative to reduce exergy destruction and improve its environmental performance. Despite its low fk value, the condenser is a dissipative component and does not contain a thermodynamic product besides heat dissipation—therefore, it must not be modified as exergy is destroyed for the regular operation of the system.
Figure 6 presents the relative difference of specific environmental impacts per component.
The solution pump, followed by the ICE, present the highest relative differences within the trigeneration system, indicating that less effort is required for these elements to decrease the environmental impact of the product.
The high rb value (959.45%) in the solution pump is mainly due to its low exergy efficiency. The product carries the component irreversibilities, so a lower exergy efficiency results in a higher environmental impact per exergy unit of product. In the ICE, as previously mentioned, the formation of pollutants is the major contributor to the total environmental impact rate, which increases the average environmental impact of the product by 781.29% relative to fuel. The relative differences of the condenser and solar field were not considered.
The effect of solar field integration was investigated, and Table 7 presents the cooling rate, COP, exergy efficiency and the specific environmental impact of chilled water for the natural gas fueled system and the hybrid system.
The evacuated tube collectors and thermal storage tanks are coupled to the trigeneration system to supply heat to LG1 at point 33. Without the solar field, the system operates only with natural gas. The hot water LG1 originates only from the jacket water of the engine (point 20 and 21). As less hot water is provided to the steam generator, less refrigerant is separated from the solution and transferred to condenser. Hence, the cooling capacity is reduced.
The COP of the chiller slightly increases in the non-renewable system due to the lower amount of hot water in LG1. The heat source ratio (exhausted gas to hot water) in the mixed-effect absorption chiller affects its thermal performance. The chiller demonstrates better performance when the exhaust gases are the primary heat source [22], as the latent heat of the desorbed refrigerant in HG is used to desorb water from the solution in LG2.
The integrated solar field leads to higher exergy rates in the hybrid system without implicating considerable environmental impacts to the exergy streams. The environmental impact per exergy unit of fuel is negligible (solar radiation), and the component-related environmental impact rate is not significant within the exergoenvironmental balances of the solar field. Thus, the environmental impact per exergy unit of chilled water is reduced from 2.537 mPt/MJ to 2.258 mPt/MJ.
It must be highlighted that the exergy rate of the product is equal to the exergy rate of chilled water ( in the evaporator. This high value reduces the specific environmental impact of chilled water, as verified by the evaporator balance. The environmental impact associated with the input chilled water (b_15) is null as the analysis does not account for the heating, ventilation and air conditioning system fed by chilled water.
Table 8 shows a comparison of results obtained from similar studies.
The environmental impact per exergy unit of electricity obtained in this study is higher than the value obtained by [36], in which a different approach was followed for the formation of pollutants (these were embedded in the consumption of natural gas and carried throughout the energy system, following [43]). The natural gas considered by [36] presented a low content of hydrogen sulfides, mercaptans, and elemental sulfur.
The high environmental impacts of electricity that were obtained derive mostly from NO emissions. When [37] replaced pure diesel with gas-diesel fuel in a marine engine, the environmental impact rate related to pollutant formation reduced from 64.72 to 47.15 mPt/s. Although the substitution with gas-diesel fuel reduced the energy and exergy efficiencies of the trigeneration system, it proved beneficial for controlling gaseous emissions. In [17], the power generated in an Organic Rankine Cycle (ORC) used solar energy and yielded low environmental impacts for electricity (1.412 mPts/MJ). In [42] bituminous coal was used as fuel, and although the system registered high emissions, the integration of exhaust gas treatment equipment (e.g., particulate removal, gas desulphurization, removal of nitrogen oxides) could result in environmental benefits. The choice of primary energy consumed, and the efficiency of the technologies employed within energy systems strongly influence the results of exergoenvironmental and exergoeconomic assessments.
Finally, combined energy strategies (which include trigeneration) are becoming an integration practice and can employ renewable and non-renewable heat sources—the former are frequently incorporated to enhance the performance of energy systems. Although it is expected that the adoption of renewable energy sources yields economic and environmental benefits, this hypothesis can only be verified through thorough assessments. Sometimes (as reported by [44], renewable energy fuels produce higher environmental impacts than their fossil-originated counterparts. This only highlights the importance of exergy- and LCA-based assessments, which identify the hotspots or margins for improvement. In the case studies of [44,45], fertilization and agricultural management practices strongly influenced the outcomes of LCAs. This means that refined soybean oil and corn, which could be employed in producing biodiesel and ethanol, for example, present high embedded environmental impacts that could outweigh the benefits of using the renewable fuel produced. Exergoenvironmental assessments can determine the responsibility of each subsystem to assess the overall environmental impact, identifying the causes of these impacts and tracking their formation throughout the system. In 2020, the COVID-19 pandemic affected the globe and for the remainder of 2021, countries will still have to address their response to the crisis. Hopefully, 2022 will shift the focus to economic recovery, which should consider climate goals. The combination of exergy- and LCA- assessments can help inform a consumer or decision-maker of the environmental impacts associated with the consumption of each energy service and smooth the process of integrating renewables within existing energy schemes.
4. Conclusions
Exergy and exergoenvironmental assessments were developed for a hybrid solar-assisted combined cycle, based on the SPECO method. The system′s environmental performance at a component level was evaluated by combining a life cycle assessment with the exergy model.
The highest exergy efficiency values for the absorption chiller and overall trigeneration system (79.75% and 57.42%, respectively) were achieved when the dead state temperature was the lowest, at 10 °C. The exergy rates of product and fuel for the absorption chiller are different for higher dead state temperatures, according to the SPECO approach. This occurs because the dead state temperature is between that of the inlet and outlet temperatures of chilled water.
The highest average environmental impact per exergy of fuel was obtained at the condenser, while the highest average environmental impact per exergy of product was obtained at the solution pump. The highest environmental impact associated with exergy destruction is located in the internal combustion engine, followed by the high-pressure generator.
The main contributors to the overall environmental impacts within the system were exergy destruction and pollutant formation. The highest total environmental impact rate occurred in the internal combustion engine at 6.594 mPt/s (81.89% of total impacts). The environmental impact rate of pollutant formation was 5.292 mPt/s of which 96.73% was due to NO emissions.
The environmental impacts per exergy unit of products were 39.651 mPt/MJ for electricity, 2.258 mPt/MJ for chilled water and 3.204 mPt/MJ for hot water. When the solar field was integrated, the environmental impact per exergy unit of chilled water decreased by 10.99%—this occurred at the expense of the COP of the absorption chiller and the overall exergy efficiency. The environmental impact per exergy unit of electricity and heat did not change.
This study highlighted the relevance of environmental issues and considerations, which have resulted in progressively more stringent restrictions in the planning and management of energy systems.
Author Contributions
Conceptualization, E.J.C.C.; Methodology, E.J.C.C. and J.V.M.F.; Writing—original draft, E.J.C.C. and J.V.M.F.; Data curation, J.V.M.F.; Formal analysis, J.V.M.F.; Writing—review & editing, M.C.; Visualization, M.C.; LCA—Conceptualization, M.C. All authors have read and agreed to the published version of the manuscript.
Funding
The authors wish to acknowledge the support of the National Council for Scientific and Technological Development (CNPq, Brazil), for the Research Productivity grant nº 307394/2018-2 and the MSc. Scholarship. This study was financed in part by the Coordenação de Aperfeiçoamento de Pessoal de Nível Superior-Brasil (CAPES)-Finance Code 001.
Institutional Review Board Statement
Not applicable.
Informed Consent Statement
Not applicable.
Data Availability Statement
Data is available upon request.
Conflicts of Interest
The authors declare no conflict of interest.
References
- Ministério de Minas e Energias. EPE Brazilian Energy Balance Year 2019. Available online: https://www.epe.gov.br/pt/publicacoes-dados-abertos/publicacoes/balanco-energetico-nacional-2020 (accessed on 3 November 2021).
- Guillén-Lambea, S.; Carvalho, M. A critical review of the greenhouse gas emissions associated with parabolic trough concentrating solar power plants. J. Clean. Prod. 2021, 289, 125774. [Google Scholar] [CrossRef]
- Keenan, J.H. A steam chart for second law analysis. Mech. Eng. 1932, 54, 195–204. [Google Scholar]
- Tribus, M.; Evans, R.L. Thermoeconomics of Seawater Conversion; Report No. 62–63; UCLA: Los Angeles, CA, USA, 1962. [Google Scholar]
- Szargut, J. Minimization of the consumption of natural resources. Bull. Pol. Acad. Sci. Tech. Sci. 1978, 26, 41–46. [Google Scholar]
- Valero, A. Thermoeconomics as a Conceptual Basis for Energy—Ecological Analysis. In Proceedings of the First International WorkShop on Advances in Energy Studies, Portovenere, Siena, Italy, 26–30 May 1998; pp. 415–444. Available online: https://www.researchgate.net/profile/Antonio-Valero-2/publication/254337577_Thermoeconomics_as_a_conceptual_basis_for_energy-ecological_analysis/links/54d9c4440cf2970e4e7cb85d/Thermoeconomics-as-a-conceptual-basis-for-energy-ecological-analysis.pdf (accessed on 3 November 2021).
- Frangopoulos, C.A.; Caralis, Y.C. A method for taking into account environmental impacts in the economic evaluation of energy systems. Energy Convers. Manag. 1997, 38, 1751–1763. [Google Scholar] [CrossRef]
- Meyer, L.; Tsatsaronis, G.; Buchgeister, J.; Schebek, L. Exergoenvironmental analysis for evaluation of the environmental impact of energy conversion systems. Energy 2009, 34, 75–89. [Google Scholar] [CrossRef]
- International Organization for Standardization. Environmental Management—Life Cycle Assessment—Principles and Framework; ISO 14040:2006; ISO: Geneva, Switzerland, 2006. [Google Scholar]
- International Organization for Standardization. Environmental Management—Life Cycle Assessment—Requirements and Guidelines; ISO 14044:2006; ISO: Geneva, Switzerland, 2006. [Google Scholar]
- Gebreslassie, B.H.; Guillén-Gosálbez, G.; Jiménez, L.; Boer, D. A systematic tool for the minimization of the life cycle impact of solar assisted absorption cooling systems. Energy 2010, 35, 3849–3862. [Google Scholar] [CrossRef]
- Solano–Olivares, K.; Romero, R.J.; Santoyo, E.; Herrera, I.; Galindo–Luna, Y.R.; Rodríguez–Martínez, A.; Santoyo-Castelazo, E.; Cerezo, J. Life cycle assessment of a solar absorption air-conditioning system. J. Clean. Prod. 2019, 240, 118206. [Google Scholar] [CrossRef]
- Guillén-Lambea, S.; Carvalho, M.; Delgado, M.; Lazaro, A. Sustainable enhancement of district heating and cooling configurations by combining thermal energy storage and life cycle assessment. Clean Technol. Environ. Policy 2021, 23, 857–867. [Google Scholar] [CrossRef]
- Cavalcanti, E.J.C. Exergoeconomic and exergoenvironmental analyses of an integrated solar combined cycle system. Renew. Sustain. Energy Rev. 2017, 67, 507–519. [Google Scholar] [CrossRef]
- Kylili, A.; Fokaides, P.; Ioannides, A.; Kalogirou, S. Environmental assessment of solar thermal systems for the industrial sector. J. Clean. Prod. 2017, 176, 99–109. [Google Scholar] [CrossRef]
- Cioccolanti, L.; Hamedani, S.R.; Villarini, M. Environmental and energy assessment of a small-scale solar Organic Rankine Cycle trigeneration system based on Compound Parabolic Collectors. Energy Convers. Manag. 2019, 198, 111829. [Google Scholar] [CrossRef]
- Montazerinejad, H.; Ahmadi, P.; Montazerinejad, Z. Advanced exergy, exergo-economic and exergo-environmental analyses of a solar based trigeneration energy system. Appl. Therm. Eng. 2019, 152, 666–685. [Google Scholar] [CrossRef]
- Aghbashlo, M.; Tabatabaei, M.; Soltanian, S.; Ghanavati, H. Biopower and biofertilizer production from organic municipal solid waste: An exergoenvironmental analysis. Renew. Energy 2019, 143, 64–76. [Google Scholar] [CrossRef]
- Mousavi, S.A.; Mehrpooya, M. A comprehensive exergy-based evaluation on cascade absorption compression refrigeration system for low temperature applications—Exergy, exergoeconomic, and exergoenvironmental assessments. J. Clean. Prod. 2020, 246, 119005. [Google Scholar] [CrossRef]
- Cavalcanti, E.J.; Ferreira, J.V.M.; Carvalho, M. Exergy assessment of a solar-assisted combined cooling, heat and power system. Sustain. Energy Technol. Assess. 2021, 47, 101361. [Google Scholar]
- Wang, J.; Li, S.; Zhang, G.; Yang, Y. Performance investigation of a solar-assisted hybrid combined cooling, heating and power system based on energy, exergy, exergo-economic and exergo-environmental analyses. Energy Convers. Manag. 2019, 196, 227–241. [Google Scholar] [CrossRef]
- Wang, J.; Wu, J. Investigation of a mixed effect absorption chiller powered by jacket water and exhaust gas waste heat of internal combustion engine. Int. J. Refrig. 2015, 50, 193–206. [Google Scholar] [CrossRef]
- Bejan, A.; Tsatsaronis, G.; Moran, M. Thermal Design and Optimization; John Wiley & Sons: New York, NY, USA, 1996; p. 542. [Google Scholar]
- Pátek, J.; Klomfar, J. A computationally effective formulation of the thermodynamic properties of LiBr—H2O solutions from 273 to 500K over full composition range. Int. J. Refrig. 2006, 29, 566–578. [Google Scholar] [CrossRef]
- Kim, D.S.; Infante, C.A. A Gibbs energy equation for LiBr aqueous solutions. Int. J. Refrig. 2006, 29, 36–46. [Google Scholar] [CrossRef]
- Lazzaretto, A.; Tsatsaronis, G. SPECO: A systematic and general methodology for calculating efficiencies and costs in thermal systems. Energy 2006, 31, 1257–1289. [Google Scholar] [CrossRef]
- Szargut, J.; Morris, D.R.; Steward, F.R. Exergy Analysis of Thermal, Chemical, and Metallurgical Processes; Hemisphere: New York, NY, USA, 1988. [Google Scholar]
- Kotas, T.J. The Exergy Method of Thermal Plant Analysis; Krieger Publishing Company: Malabar, FL, USA, 1985; p. 324. [Google Scholar]
- Szargut, J. Chemical exergies of the elements. Appl. Energy 1989, 32, 269–286. [Google Scholar] [CrossRef]
- Goedkoop, M.; Effting, S.; Collignon, M. The Eco-Indicator 99: A Damage Oriented Method for Life-Cycle Impact Assessment: Manual for Designers; Ministry of Housing, Spatial Planning and the Environment: Hague, The Netherlands, 2000.
- Carvalho, M.; Serra, L.M.; Lozano, M.A. Optimal synthesis of trigeneration systems subject to environmental constraints. Energy 2011, 36, 3779–3790. [Google Scholar] [CrossRef] [Green Version]
- Carlsson, B.; Persson, H.; Meir, M.; Rekstad, J. A total cost perspective on use of polymeric materials in solar collectors—Importance of environmental performance on suitability. Appl. Energy 2014, 125, 10–20. [Google Scholar] [CrossRef]
- Hong, X.; Chen, J.; Lyu, H.; Sheng, D.; Li, W.; Li, H. Advanced exergoenvironmental evaluation for a coal-fired power plant of near-zero air pollutant emission. Appl. Therm. Eng. 2018, 128, 1139–1150. [Google Scholar] [CrossRef]
- PRé Sustainability. Simapro Software Version 9.1.1.1. 2021. Available online: http://www.simapro.nl (accessed on 25 May 2021).
- ECOINVENT. Database, Version 3.6. 2019. Available online: http://www.ecoinvent.org/ (accessed on 25 May 2021).
- Marques, A.S.; Carvalho, M.; Ochoa, A.A.; Abrahão, R.; Santos, C.A. Life cycle assessment and comparative exergoenvironmental evaluation of a micro-trigeneration system. Energy 2020, 216, 119310. [Google Scholar] [CrossRef]
- Cavalcanti, E.J. Energy, exergy and exergoenvironmental analyses on gas-diesel fuel marine engine used for trigeneration system. Appl. Therm. Eng. 2021, 184, 116211. [Google Scholar] [CrossRef]
- Zhao, P. A Computer Program for the Exergoeconomic Analysis of Energy Conversion Plants; Technische Universitaet: Berlin, Germany, 2015. [Google Scholar]
- Çalişkan, H.; Tat, M.E.; Hepbasli, A. Performance assessment of an internal combustion engine at varying dead (reference) state temperatures. Appl. Therm. Eng. 2009, 29, 3431–3436. [Google Scholar] [CrossRef]
- Cavalcanti, E.J.C.; Carvalho, M. Tackling Dissipative Components Based on the SPECO Approach: A Cryogenic Heat Exchanger Used in Natural Gas Liquefaction. Energies 2021, 14, 6850. [Google Scholar] [CrossRef]
- Lourenço, A.B.; Carvalho, M. Exergoeconomic and exergoenvironmental analyses of an off-grid reverse osmosis system with internal combustion engine and waste heat recovery. Chem. Eng. J. Adv. 2020, 4, 100056. [Google Scholar] [CrossRef]
- Rocha, D.H.D.; Silva, R.J. Exergoenvironmental analysis of a ultra-supercritical coal-fired power plant. J. Clean. Prod. 2019, 231, 671–682. [Google Scholar] [CrossRef]
- Morosuk, T.; Tsatsaronis, G.; Koroneos, C. On the effect of eco-indicator selection on the conclusions obtained from an exergoenvironmental analysis. In Proceedings of the ECOS 2012—The 25th International Conference on Efficiency, Cost, Optimization, Simulation and Environmental Impact of Energy Systems, Perugia, Italy, 26–29 June 2012. [Google Scholar]
- Carvalho, M.; Silva, E.S.; Andersen, S.L.; Abrahão, R. Life cycle assessment of the transesterification double step process for biodiesel production from refined soybean oil in Brazil. Environ. Sci. Pollut. Res. 2016, 23, 11025–11033. [Google Scholar] [CrossRef] [PubMed]
- Abrahão, R.; Carvalho, M.; Causapé, J. Greenhouse gas emissions associated with four types of fertilization for corn crops in a Mediterranean basin. Environ. Prog. Sustain. Energy 2021, 40, e13681. [Google Scholar] [CrossRef]
Figure 1.
Scheme of the solar-assisted trigeneration system.

Figure 2.
Dead state temperature vs. exergy efficiency.

Figure 3.
Dead state temperature vs. exergy destruction.

Figure 4.
Sankey diagram of environmental impact rates in trigeneration system. Values in mPt/s.

Figure 5.
Distribution of total environmental impacts.

Figure 6.
Relative difference of specific environmental impact per component.


Table 1.
Environmental impact rates of product and fuel, with auxiliary equations.
| Component | Environmental Impact Rate per Exergy of Product | Environmental Impact Rate per Exergy of Fuel | Auxiliary Equation |
|---|---|---|---|
| ICE | (P) (F) | ||
| Abs. | (F) (F) | ||
| HG | ) | ) | (F) (P) (F) |
| LG1 | (P) (F) (F) | ||
| LG2 | (F) (F) (F) | ||
| Cond. | (F) | ||
| Evap. | (F) | ||
| LX | (F) | ||
| HX | (F) | ||
| Solution Pump | - | ||
| Chiller | - | ||
| HX1 | (F) | ||
| Solar system | |||
| Overall | - |
Table 2.
Environmental impacts of the consumed natural gas.
| Damage Category | Unit Per kg Fuel | Normalized Damage Factor | EI99 Damage |
|---|---|---|---|
| Human Health | 6.13 × 10⁻⁷ DALY | 6.99 × 10⁻⁵ | 28 mPts/kg |
| Ecosystem Quality | 0.0293 PDF m2 yr | 5.13 × 10⁻⁶ | 2.1 mPts/kg |
| Resources | 7.26 MJ surplus | 9.6 × 10⁻⁴ | 192 mPts/kg |
| Total | 222.1 mPts/kg |
Table 3.
Exergoenvironmental parameters of the trigeneration system.
| Point | Stream | [°C] | [kPa] | [kg/s] | [kW] | [mPt/s] | [mPt/MJ] |
|---|---|---|---|---|---|---|---|
| 0 | H2O/LiBr | 30.0 | 0.82 | 2.552 | 1347.5 | 24.150 | 17.922 |
| 1 | H2O/LiBr | 30.0 | 92.00 | 2.552 | 1347.5 | 24.157 | 17.927 |
| 2 | H2O/LiBr | 67.5 | 92.00 | 2.552 | 1372.5 | 24.695 | 17.999 |
| 3 | H2O/LiBr | 81.4 | 6.63 | 2.444 | 1411.5 | 25.306 | 17.922 |
| 4 | H2O/LiBr | 43.6 | 0.82 | 2.444 | 1383.6 | 24.769 | 17.922 |
| 5 | H2O/LiBr | 126.5 | 92.00 | 0.684 | 385.6 | 6.998 | 18.149 |
| 6 | H2O/LiBr | 154.0 | 92.00 | 0.640 | 404.9 | 7.257 | 17.922 |
| 7 | H2O/LiBr | 87.3 | 6.63 | 0.640 | 383.7 | 6.877 | 17.922 |
| 8 | Steam | 143.8 | 92.00 | 0.044 | 28.7 | 0.521 | 18.149 |
| 9 | Water | 38.0 | 6.63 | 0.044 | 3.4 | 0.062 | 18.149 |
| 10 | H2O/LiBr | 77.7 | 6.63 | 1.840 | 1018.1 | 18.628 | 18.299 |
| 11 | Steam | 77.8 | 6.63 | 0.065 | 18.5 | 1.774 | 95.782 |
| 12 | Water | 38.0 | 6.63 | 0.109 | 6.0 | 0.504 | 83.764 |
| 13 | Water | 5.0 | 0.87 | 0.109 | 5.2 | 0.433 | 83.764 |
| 14 | Steam | 5.0 | 0.87 | 0.109 | 0.7 | 0.057 | 83.764 |
| 15 | Chilled Water | 14.0 | 101.30 | 8.720 | 436.7 | 0.000 | 0.000 |
| 16 | Chilled Water | 7.0 | 101.30 | 8.720 | 436.2 | 0.985 | 2.258 |
| 17 | Water | 25.0 | 101.30 | 8.486 | 437.8 | 0.000 | 0.000 |
| 18 | Water | 35.1 | 101.30 | 8.486 | 461.8 | 1.528 | 3.399 |
| 19 | Water | 40.0 | 101.30 | 8.486 | 477.2 | 1.580 | 3.399 |
| 20 | Water | 70.0 | 101.30 | 1.544 | 113.3 | 3.869 | 34.150 |
| 21 | Water | 85.0 | 101.30 | 1.544 | 132.1 | 4.615 | 34.933 |
| 22 | Exhaust gas | 737.2 | 101.30 | 0.211 | 114.3 | 0.514 | 4.498 |
| 23 | Exhaust gas | 170.0 | 101.30 | 0.211 | 26.4 | 0.119 | 4.498 |
| 24 | Exhaust gas | 120.0 | 101.30 | 0.211 | 22.5 | 0.101 | 4.498 |
| 25 | Air | 25.0 | 101.30 | 0.199 | 0.1 | 0.000 | 0.000 |
| 26 | Natural gas | 25.0 | 101.30 | 0.012 | 591.4 | 2.661 | 4.499 |
| 27 | Electricity | - | - | - | 168.8 | 6.693 | 39.651 |
| 28 | Tap water | 25.0 | 101.30 | 0.082 | 4.2 | 0.000 | 0.000 |
| 29 | Tap water | 60.0 | 101.30 | 0.082 | 5.5 | 0.018 | 3.204 |
| 30 | Water | 70.0 | 101.30 | 0.291 | 21.4 | 0.730 | 34.150 |
| 31 | Water | 70.0 | 101.30 | - | - | ||
| 32 | Water | 85.6 | 101.30 | - | - | ||
| 33 | Water | 85.0 | 101.30 | 0.291 | 24.9 | 0.742 | 29.824 |
| 34 | Water | 85.0 | 101.30 | 1.835 | 156.9 | 5.357 | 34.143 |
| 35 | Water | 70.0 | 101.30 | 1.835 | 134.7 | 4.599 | 34.143 |
| 36 | Solar radiation | - | 27.7 | 0.000 | 0.000 | ||
| 37 | Electricity | 30.0 | - | 2.552 | 0.2 | 0.007 | 39.651 |
| 38 | Electricity | - | - | - | 168.6 | 6.686 | 39.651 |
Table 4.
Results of exergy analysis considering dead state temperature of 10 °C.
| Components | [kW] | [kW] | [kW] | [%] |
|---|---|---|---|---|
| ICE | 477.10 | 187.60 | 289.50 | 39.32 |
| Abs. | 86.83 | 74.60 | 12.23 | 85.92 |
| HG | 108.60 | 68.69 | 39.91 | 63.25 |
| LG1 | 35.97 | 35.28 | 0.69 | 98.08 |
| LG2 | 13.10 | 7.82 | 5.28 | 59.69 |
| Cond. | 15.89 | 15.36 | 0.53 | 96.66 |
| Evap. | 441.20 | 436.20 | 5.00 | 98.87 |
| LX | 29.52 | 24.99 | 4.53 | 84.65 |
| HX | 21.21 | 17.90 | 3.31 | 84.39 |
| Solution pump | 0.18 | 0.02 | 0.16 | 9.44 |
| Hot water HE | 3.88 | 1.23 | 2.65 | 31.80 |
| Solar field | 27.15 | 3.53 | 23.62 | 13.00 |
| Trigeneration | 1056.00 | 606.20 | 449.80 | 57.41 |
Table 5.
Combustion products composition.
| Component | Molar (Mass) Fraction [%] | Mass Rate [kg/h] | Specific EI of Emission [mPt/kg] | EI Rate [mPt/s] |
|---|---|---|---|---|
| CO2 | 7.63 (12.30) | 93.42 | 5.45 | 0.140 |
| H2O | 19.69 (12.99) | 98.69 | 0 | 0 |
| N2 | 69.52 (71.33) | 541.80 | 0 | 0 |
| CO | 1.85 (1.89) | 14.42 | 8.36 | 0.033 |
| NO | 0.52 (0.57) | 4.34 | 4216.74 | 5.119 |
| O2 | 0.78 (0.91) | 6.94 | 0 | 0 |
| Total | 1.00 (1.00) | 759.61 | - | 5.292 |
Table 6.
Exergoenvironmental variables.
| Components | [mPt/MJ] | [mPt/MJ] | [mPt/h] | [mPt/s] | [mPt/h] | [mPt/h] | [%] |
|---|---|---|---|---|---|---|---|
| ICE | 4.499 | 39.651 | 4689.10 | 5.292 | 1.506 | 23,740.16 | 80.248 |
| Abs. | 23.870 | 27.795 | 1050.95 | - | 3.244 | 1054.19 | 0.308 |
| HG | 7.100 | 16.812 | 1020.11 | - | 1.795 | 1021.90 | 0.176 |
| LG1 | 27.589 | 28.630 | 68.53 | - | 1.504 | 70.03 | 2.147 |
| LG2 | 47.567 | 192.573 | 904.33 | - | 1.388 | 905.72 | 0.153 |
| Cond. | 83.765 | - | 159.82 | - | 0.002 | 159.83 | 0.001 |
| Evap. | 0.853 | 2.258 | 15.36 | - | 0.752 | 16.11 | 4.669 |
| LX | 18.214 | 21.536 | 297.03 | - | 1.864 | 933.40 | 0.624 |
| HX | 17.914 | 21.244 | 213.46 | - | 1.151 | 670.60 | 0.536 |
| Solution pump | 39.651 | 420.084 | 23.05 | - | 0.001 | 23.08 | 0.003 |
| Hot water HE | 4.498 | 14.214 | 42.85 | - | 0.309 | 43.33 | 0.717 |
| Solar field | 0.000 | 3.550 | 308.51 | - | 45.081 | 353.59 | 12.750 |
Table 7.
Comparison between hybrid and non-renewable trigeneration (without solar field).
| Parameter | Hybrid Trigeneration (Solar-Assisted) | Natural Gas-Fueled Trigeneration |
|---|---|---|
| Cooling rate () | 255.5 kW | 244.6 kW |
| COP | 0.96 | 0.99 |
| Exergy efficiency | 57.42% | 58.21% |
| Environmental impact per exergy unit of chilled water () | 2.258 mPt/MJ | 2.537 mPt/MJ |
Table 8.
Specific environmental impact for products of generation systems.
| Reference | Plant/System | Fuel | Specific Environmental Impact (mPt/MJ) | ||
|---|---|---|---|---|---|
| This work | Combined cooling, heat, and power | Natural gas + solar | 39.65 | 2.26 | 3.20 |
| Marques et al. [36] | Combined cooling, heat, and power | Natural gas | 9.49 | 47.90 | 5.44 |
| Cavalcanti [37] | DF engine powered CCHP | Natural gas + diesel | 17.20 | 31.27 | 9.89 |
| Montazerinejad et al. [17] | Organic Rankine Cycle integrated Absorption Chiller | Solar | 1.41 | 25.08 | 2.75 |
| Rocha and Silva [42] | USC coal-fired | Coal | 11.32 | - | - |
Publisher′s Note: MDPI stays neutral with regard to jurisdictional claims in published maps and institutional affiliations. |
© 2021 by the authors. Licensee MDPI, Basel, Switzerland. This article is an open access article distributed under the terms and conditions of the Creative Commons Attribution (CC BY) license (https://creativecommons.org/licenses/by/4.0/).
Share and Cite
MDPI and ACS Style
Cavalcanti, E.J.C.; Ferreira, J.V.M.; Carvalho, M. Research on a Solar Hybrid Trigeneration System Based on Exergy and Exergoenvironmental Assessments. Energies 2021, 14, 7560. https://0-doi-org.brum.beds.ac.uk/10.3390/en14227560
AMA Style
Cavalcanti EJC, Ferreira JVM, Carvalho M. Research on a Solar Hybrid Trigeneration System Based on Exergy and Exergoenvironmental Assessments. Energies. 2021; 14(22):7560. https://0-doi-org.brum.beds.ac.uk/10.3390/en14227560
Chicago/Turabian StyleCavalcanti, Eduardo J. C., João Victor M. Ferreira, and Monica Carvalho. 2021. "Research on a Solar Hybrid Trigeneration System Based on Exergy and Exergoenvironmental Assessments" Energies 14, no. 22: 7560. https://0-doi-org.brum.beds.ac.uk/10.3390/en14227560
Note that from the first issue of 2016, this journal uses article numbers instead of page numbers. See further details here.