
Determinants of Electrical and Thermal Energy Consumption in Hospitals According to Climate Zones in Poland


1
Faculty of Economics, University of Warmia and Mazury in Olsztyn, 10-917 Olsztyn, Poland
2
College of Economics and Social Sciences, Warsaw University of Technology, 09-400 Plock, Poland
*
Authors to whom correspondence should be addressed.
Energies 2021, 14(22), 7585; https://0-doi-org.brum.beds.ac.uk/10.3390/en14227585
Submission received: 30 September 2021
/
Revised: 4 November 2021
/
Accepted: 6 November 2021
/
Published: 12 November 2021
(This article belongs to the Special Issue Transformation of Energy Markets: Description, Modeling of Functioning Mechanisms and Determining Development Trends)
Abstract
:Energy use in hospitals is higher than in other public buildings, so improving energy efficiency in healthcare buildings is a significant challenge in this sector of engineering. For this, it is necessary to know the various determinants of energy consumption. Until now, the main factor affecting energy consumption in healthcare facilities studied in the literature was hospital capacity. However, the commonly used variables connected with hospital size and the number of beds do not take into account the medical activities carried out in these buildings. Assuming that energy consumption in hospitals is multiple and shaped by many factors that overlap, not only on an individual level but also on a higher scale level, this study devises a more integrated approach to its determinants. This study aims to investigate the determinants of electrical energy costs (EEC) and thermal energy costs (TEC) in Polish hospitals with regard to factors related to their size, work intensity and climate zones. The analysis was carried out using financial and resource data from all Polish hospitals for the years 2010–2019. The study used a multivariate backward stepwise regression analysis. In order to use climate as a moderating variable, a sample of Polish hospitals from 16 Polish NUTS 2 was divided into four climate zones. This article provides new empirical evidence on the determinants of electricity consumption in Polish hospitals related to their size and medical activity, taking into account climate zone as a moderating variable. The results of the analysis show that both electricity and heat consumption in hospitals are positively related to the number of doctors, beds and the number of medical operations performed. As expected, larger hospitals seem to use more energy. Moreover, there is regional heterogeneity in energy consumption in hospitals related to the climatic zone in which they operate. The conducted analysis shows that Polish hospitals located in the warmest climatic zone are characterized by higher energy consumption than hospitals in the coldest zone. It especially regards EEC in surgery hospitals. The warmer the climate zones, the higher intensity in terms of the number of surgeries, the higher EEC. In terms of nonsurgical hospitals, the influence of climate zone on EEC was not observed. Knowing the factors influencing energy consumption in hospitals can facilitate the correct adoption of an energy-saving strategy in the health sector, which is a reasonable response to climate change and supports a healthy and sustainable future.
1. Introduction
The issue of energy consumption, in general, attracts a lot of attention, especially with regard to energy efficiency and its benefits for climate change [1]. Currently increases in energy consumption generate a continuous increase in the cost of electricity and heat and have a significant negative impact on the environment, resulting from the emission of greenhouse gases into the atmosphere [2]. In recent decades, researchers have paid much attention to energy analysis and consumption optimization in various industries and buildings. Some of them proposed new methods that are very helpful in assessing different options for thermal insulation investments [3]. In this context, healthcare facilities (especially for hospitals due to their large size) are of particular interest. Due to rising energy prices, the lack of natural resources for energy production and standards based on sustainable development to reduce CO2 emissions, it is necessary to analyze the factors influencing energy consumption by these systems. As more than half of the energy consumption in healthcare systems is in hospitals [4,5], this study mainly focuses on data on energy consumption in hospitals. The implementation of sustainable energy systems is one of the main goals of the European Union (EU) energy policy, and experience in the hospital sector can be very useful in achieving this [6].
Among healthcare facilities, hospitals are among the most energy-intensive buildings due to their constant energy consumption patterns and different activities. They must operate 24 h a day, 365 days a year, so in the construction sector, hospitals are the buildings with the highest energy use [7]. On average, a hospital complex consumes 2.5 times more energy than a public building, e.g., an office. This is mainly due to the operation of a complex building, utility systems to accommodate energy-intensive medical equipment and the unique requirements for air quality and disease control. In addition, the fact that they are more energy-consuming than other buildings in the service sector is due to the constant need for powering medical devices and special requirements for air quality and patient health monitoring [8].
The highest costs of energy consumption are incurred by specialist hospitals, which use energy-intensive tomographs, x-rays, or the best-equipped operating theaters. Most expensive is the operation of the operating theater and the performance of specialist examinations. Currently, the expenditure of public hospitals on electricity in Poland accounts for an average of almost 2% of their total operating costs, which, given tight budgets, is a significant burden. Energy expenditure is a small percentage of hospital budgets, but almost all of them want to increase energy efficiency and invest in renewable energy sources to improve their financial situation in connection with rising energy prices [9]. The use of renewable energy sources in Polish hospitals is very important in the context of the energy transformation of the national economy because it affects the creation of modern technologies and increases the competitiveness and innovation of the country. The research carried out so far shows that solar, wind and biomass have the greatest development opportunities in Poland [10].
Energy demand in Polish hospitals is. Therefore, high, so understanding the factors influencing energy consumption in hospitals could be important not only for scientists and practitioners, but also for policymakers aiming to encourage and promote wise, efficient, and sustainable energy use through a variety of policies, schemes, and measures.
Despite great interest in determinants of energy consumption in the healthcare sector, the results of previous studies are inconclusive and need further investigation. This can be explained by the fact that energy consumption in hospitals is shaped by many different factors, not only at the individual level but also at a higher scale level, e.g., the region. So far, empirical research on energy consumption in the health sector has put a lot of effort into examining the relationship mainly between energy consumption and hospital capacity rather than hospital activity, and little research to date has been conducted in the healthcare sector in countries of central and eastern Europe. Climate zone as moderating variable has not been investigated so far in this region. It is difficult to determine climate zone impacts on demand for energy consumption, and which determinants of energy consumptions connected with medical size and hospital activity are significant in various climate zones. This means that the area is full of ambiguities, and our goal is therefore to reduce this research gap.
This study aims to investigate the determinants of electrical energy costs (EEC) and thermal energy costs (TEC) in Polish hospitals, taking into account not only their size but also medical activity and with climate zone as a moderating variable. The analysis was carried out using data from hospital reports regarding financial data and medical activity for the years 2010 to 2019. The study used a multivariate backward stepwise regression analysis on a sample of all Polish hospitals from 16 Polish NUTS 2, which were divided into four climate zones. The constructed models test new determinants of the considered endogenous variables according to the climatic zones, which develops a more integrated approach to studying the drivers of energy consumption in hospitals at the regional level. This shows that there are common, universal determinants of energy consumption, regardless of the climatic zone and those that depend on these zones. This article is the first study that collects and analyzes data on energy costs in all hospitals in Poland. As far as we know, no previous research on this topic has focused on such a large sample of hospitals.
The study assumes that energy consumption in hospitals is determined by the size of the hospital and its medical activity and differs among climatic zones. Therefore, our research hypotheses are as follows:
Hypothesis 1 (H1).
The size of the hospital has a positive impact on electrical energy costs.
Hypothesis 2 (H2).
The size of the hospital has a positive impact on thermal energy costs.
Hypothesis 3 (H3).
The activity of the hospital has a positive impact on electrical energy costs.
Hypothesis 4 (H4).
The activity of the hospital has a positive impact on thermal energy costs.
Hypothesis 5 (H5).
The electrical energy costs in hospitals differ among climate zones.
Hypothesis 6 (H6).
The thermal energy costs in hospitals differ among climate zones.
The rest of the article is structured as follows. Section 2 presents a literature review. Section 3 presents the econometric methodology, variables, and data used. Section 3 discusses the empirical results and discussion. Finally, the last three sections present the concluding remarks, limitations and further research.
2. Literature Review
The literature lists three groups of features that affect energy consumption in hospitals. The first group concerns the capacity of the hospital, which is primarily determined by the total area of hospital rooms and the number of beds. Additional measures of capacity include the number and size of operating theaters and intensive care units, as well as the amount of high-energy medical equipment. The second group concerns the medical activities of the hospital. Energy consumption in hospitals should increase with the provision of more medical services. A medical product can be tracked by a variety of metrics, including days of hospitalization, admission or discharge, and the number of patients. The third group includes the location in a specific climatic zone, which determines the limits for thermal and lighting conditions [8]. These factors influence overall energy consumption regardless of performance and should, therefore, be taken into account in this research.
The majority of earlier studies analyzed energy consumption at a microeconomic level, combining energy demand with room characteristics in buildings [11,12]. The literature emphasizes that the most significant predictor of energy consumption by these facilities is the size of the facility (area), types of services, number of employees and number of beds [4,13]. The capacity of the hospital can also be measured by the surface of the hospital rooms (m2), bed days in inpatient-departments and in out-patient-departments, and the number of staff members [14]. A regression analysis of energy consumption was carried out in the Spanish banking sector, and among independent variables, in addition to the number of employees, the area and number of energy-consuming devices (in this case, ATMs) were taken into account [15]. Another study conducted on the basis of data from 20 Spanish hospitals determined average final energy consumption by calculating energy efficiency indicators as a function of several functional indicators, i.e., building area, number of beds and number of employees [16].
Studies in Brazilian hospitals found that variability in energy consumption was due not only to the size of facilities, the number of beds and covered area, but also to the complexity of the services offered, energy standards, and the efficiency of the medical equipment used [17]. Other studies also took into account the impact of hospital activity indicators, which can be represented by the number of annual discharges, rescue operations, hospitalizations, operations, laboratory tests, births, and endoscopy [18]. However, studies regarding the impact of hospital activity on energy consumption are rare. The number of surgical operations can be an especially important factor influencing energy consumption due to the fact that surgery is a resource-hungry medical activity that requires expensive equipment, sterilization procedures, advanced operational technologies, and compulsory life-support systems. These activities consume significant amounts of energy [19]. In addition, there has been a discussion for several years about ventilation systems in operating rooms that can be the main factor affecting the electric energy consumptions in the hospitals [20].
An important factor influencing energy consumption may also be the degree of use of medical devices, especially in areas directly related to diagnostics and treatment. The demand for electricity is growing in hospitals due to more sophisticated medical devices. An interesting observation can be made in terms of the relationship between the energy consumed during use and the hours of inactivity. Linear accelerators, CT scanners and MRI scanners require 36, 64 and 47% of weekly energy requirements, respectively, when not in use [20].
In the literature, there are studies of energy consumption that combine energy demand with climatic and environmental indicators [21,22,23], as well as with geographic location [13]. Some authors also highlighted weather conditions as essential determinants of energy consumption [24,25]. The empirical literature in this field is oriented to the national research level, using, in most cases, a dataset at the micro-level. It is worth adding that several studies carried out at the subnational level in the EU showed that regional climatic differences do have an impact on energy consumption, although these studies were related to households (e.g., in the case of Germany [26]; and Austria [27]). Other studies looked at the impact of climate change on energy consumption in hospital buildings, e.g. looking at six different cities located in six countries in the Indian Ocean region [28].
There is agreement that the climate has a significant impact on the energy consumption of buildings [29]. Climate is usually treated as an independent parameter in energy efficiency regressions [30]. Climate can influence energy consumption in several ways because of a non-linear pattern of energy use in response to climate change. In a warmer climate zone, a greater demand for cooling could be expected, which would lead to increased consumption of electricity. On the other hand, fewer frosty winter days would result in a lower heating demand, which would lower the demand for natural gas, oil and electricity [31,32,33]. Research conducted in the US found that consumers in warmer locations rely relatively more on electricity than on natural gas, oil and other fuels. In winter, they use less heating fuel, and in summer they install more cooling power and buy much more electricity. The model estimated in these studies suggests that fuel selection component may be an important aspect of climate change adaptation. In warmer climates, electricity is selected for heating and cooling. Electricity is, therefore, more attractive than combining electricity with other heating fuels in areas where heating is less important [34]. Some USA studies have quantified heat-attributable healthcare expenditure based on counts of hospital admissions [35,36]. The use of the climate zone as a moderating variable in the study allowed research to be carried out at the regional level, which is the most crucial level for the design and implementation of EU policy. Climatic zones make it possible to determine the basic calculation parameters of the outside air. Therefore, the calculation parameters of the outside atmosphere have a direct impact on the parameters of the power of cooling, ventilation and air-conditioning devices of buildings and for determining the heat load design of buildings [37]. Each climate zone has a different outside temperature, wind strength and direction, and sunlight. Designers adjust building materials to this and define the parameters of heating the building under maximum conditions. Property managers and administrators take this into account when ordering power to heat the building. Currently, Poland is divided into climatic zones according to the PN-EN 12831 standard [38,39].
In winter, there are five general climatic zones in Poland, of which Vth zone is characterized by the lowest temperatures, and the firstone the highest. The temperature of the outside air in the zones ranges from −16 degrees Celsius (coastal areas) to −24 degrees Celsius (mountain areas, Suwalki region). The outside designed temperature in five climatic zones for winter in Poland is presented in Table 1.
For the purposes of the study, the climatic zones of Poland were adapted to the NUTS classification, which refers to the hierarchical division of the EU economic area into three main NUTS levels: NUTS 1, NUTS 2 and NUTS 3. The first level applies to the entire country, while the second and third levels in Poland are voivodeships and counties [40]. Taking into account the NUTS 2 level required merging of the fourth and fifth zones and assignment of Polish voivodships to the four climatic zones shown in Figure 1.
The climate of Poland is characterized by great variability of weather and significant fluctuations in the course of the seasons. Poland is crossed by the border between a warm and rainy (oceanic) climate and a boreal, snow-forest (continental) climate. There is a significant difference in air temperature between the north-eastern (fourth zone) and north-western (first zone) regions of Poland. In the east, in zone IV, winters are colder than in the rest of Poland, which is the result of the influence of continental climate. In zone I, in the west of the country, winters are warmer than in the rest of Poland because of the influence of air masses from the Atlantic Ocean and the mitigating effect of the Baltic Sea. Therefore, the lowest average annual air temperatures occur in north-eastern Poland (6.5 °C). The average number of frosty days is lower in zone I (less than 25 days a year) than in zone IV (up to 65 days in the Suwałki Lake District).
The main type of energy consumed by hospitals is electricity. Therefore, the results of the study regarding the relationship between climatic zone and energy consumption can be applied to power design requirements in the energy sector, fuel consumption for electricity generation, end-use space heating and cooling [41].
3. Materials and Methods
The methodology of the study involves a two-stage approach: (i) estimation of a linear regression model to examine the impact of identified independent variables on electrical and thermal energy costs in hospitals according to the climate zones in Poland, (ii) estimation to what extent the electrical and thermal energy unit costs differ according to the climate zones in Poland.
Quantitative data ae shown as mean (standard deviation, SD) and median (interquartile range, IQR). Categorical data are expressed as percentages. Independent predictors of EEC and TEC were analyzed using stepwise backward regression analyses. A p-value of <0.05 was considered statistically significant.
To measure the hospital electrical and thermal energy costs, we used the variables electric energy cost (EEC), electric energy cost per patient (EECP), electric energy cost per hospitalization day (EECD), electric energy cost per surgery (EECS), thermal energy cost (TEC), thermal energy cost per patient (TECP), thermal energy cost per hospitalization day (TECD), and thermal energy cost per surgery (TECS). To measure the hospital size, we used the number of beds (BEDS), nurses (NURS) and doctors (DOC) as variables. Based on bed numbers, we classified the hospitals into four categories as follows: small hospitals (number of beds lower than 100); medium (number of beds lower than 300 and above 101), big (number of beds lower than 600 and above 301) and large (number of beds above 601). To measure the hospital activity, we used: the number of surgeries (SURG), the number of hospitalization days (DAYS), and the number of patients (PAT). To analyze the influence of hospital profile (in terms of surgery intensity), we classified the hospitals based on the surgery index (SI). We calculated SI as the relationship between numbers of surgeries to admitted patients and based on this we classified the hospitals into four categories as follows: non-surgical hospitals (with SI = 0—non-surgeries in hospital); low-intensity surgery hospital (0 < SI < 0.3); medium-intensity surgery hospital (0.31 < SI < 0.6) and high-intensity surgery hospital (0.61 < SI).
3.1. Data and Sample
Electrical and thermal energy costs were thoroughly analyzed in order to perform a comparison of energy consumptions in hospitals in terms of hospitals activity in different climate zones. Financial data were obtained from the E-Health Center, which is a state budget unit established by the Minister of Health. Data on energy consumption costs came from the MZ-03 reports on the finances of independent public healthcare institutions. On the other hand, data on the activities of each hospital (the number of patients, the number of operations, the number of beds, the number of medical personnel) were obtained from the annual reports of the MZ-29-report on the activities of the general hospital. The analysis considered hospital data from 2010 to 2019 for 376 hospitals. Finally, our research covered 3289 hospital years.
3.2. Key Variables
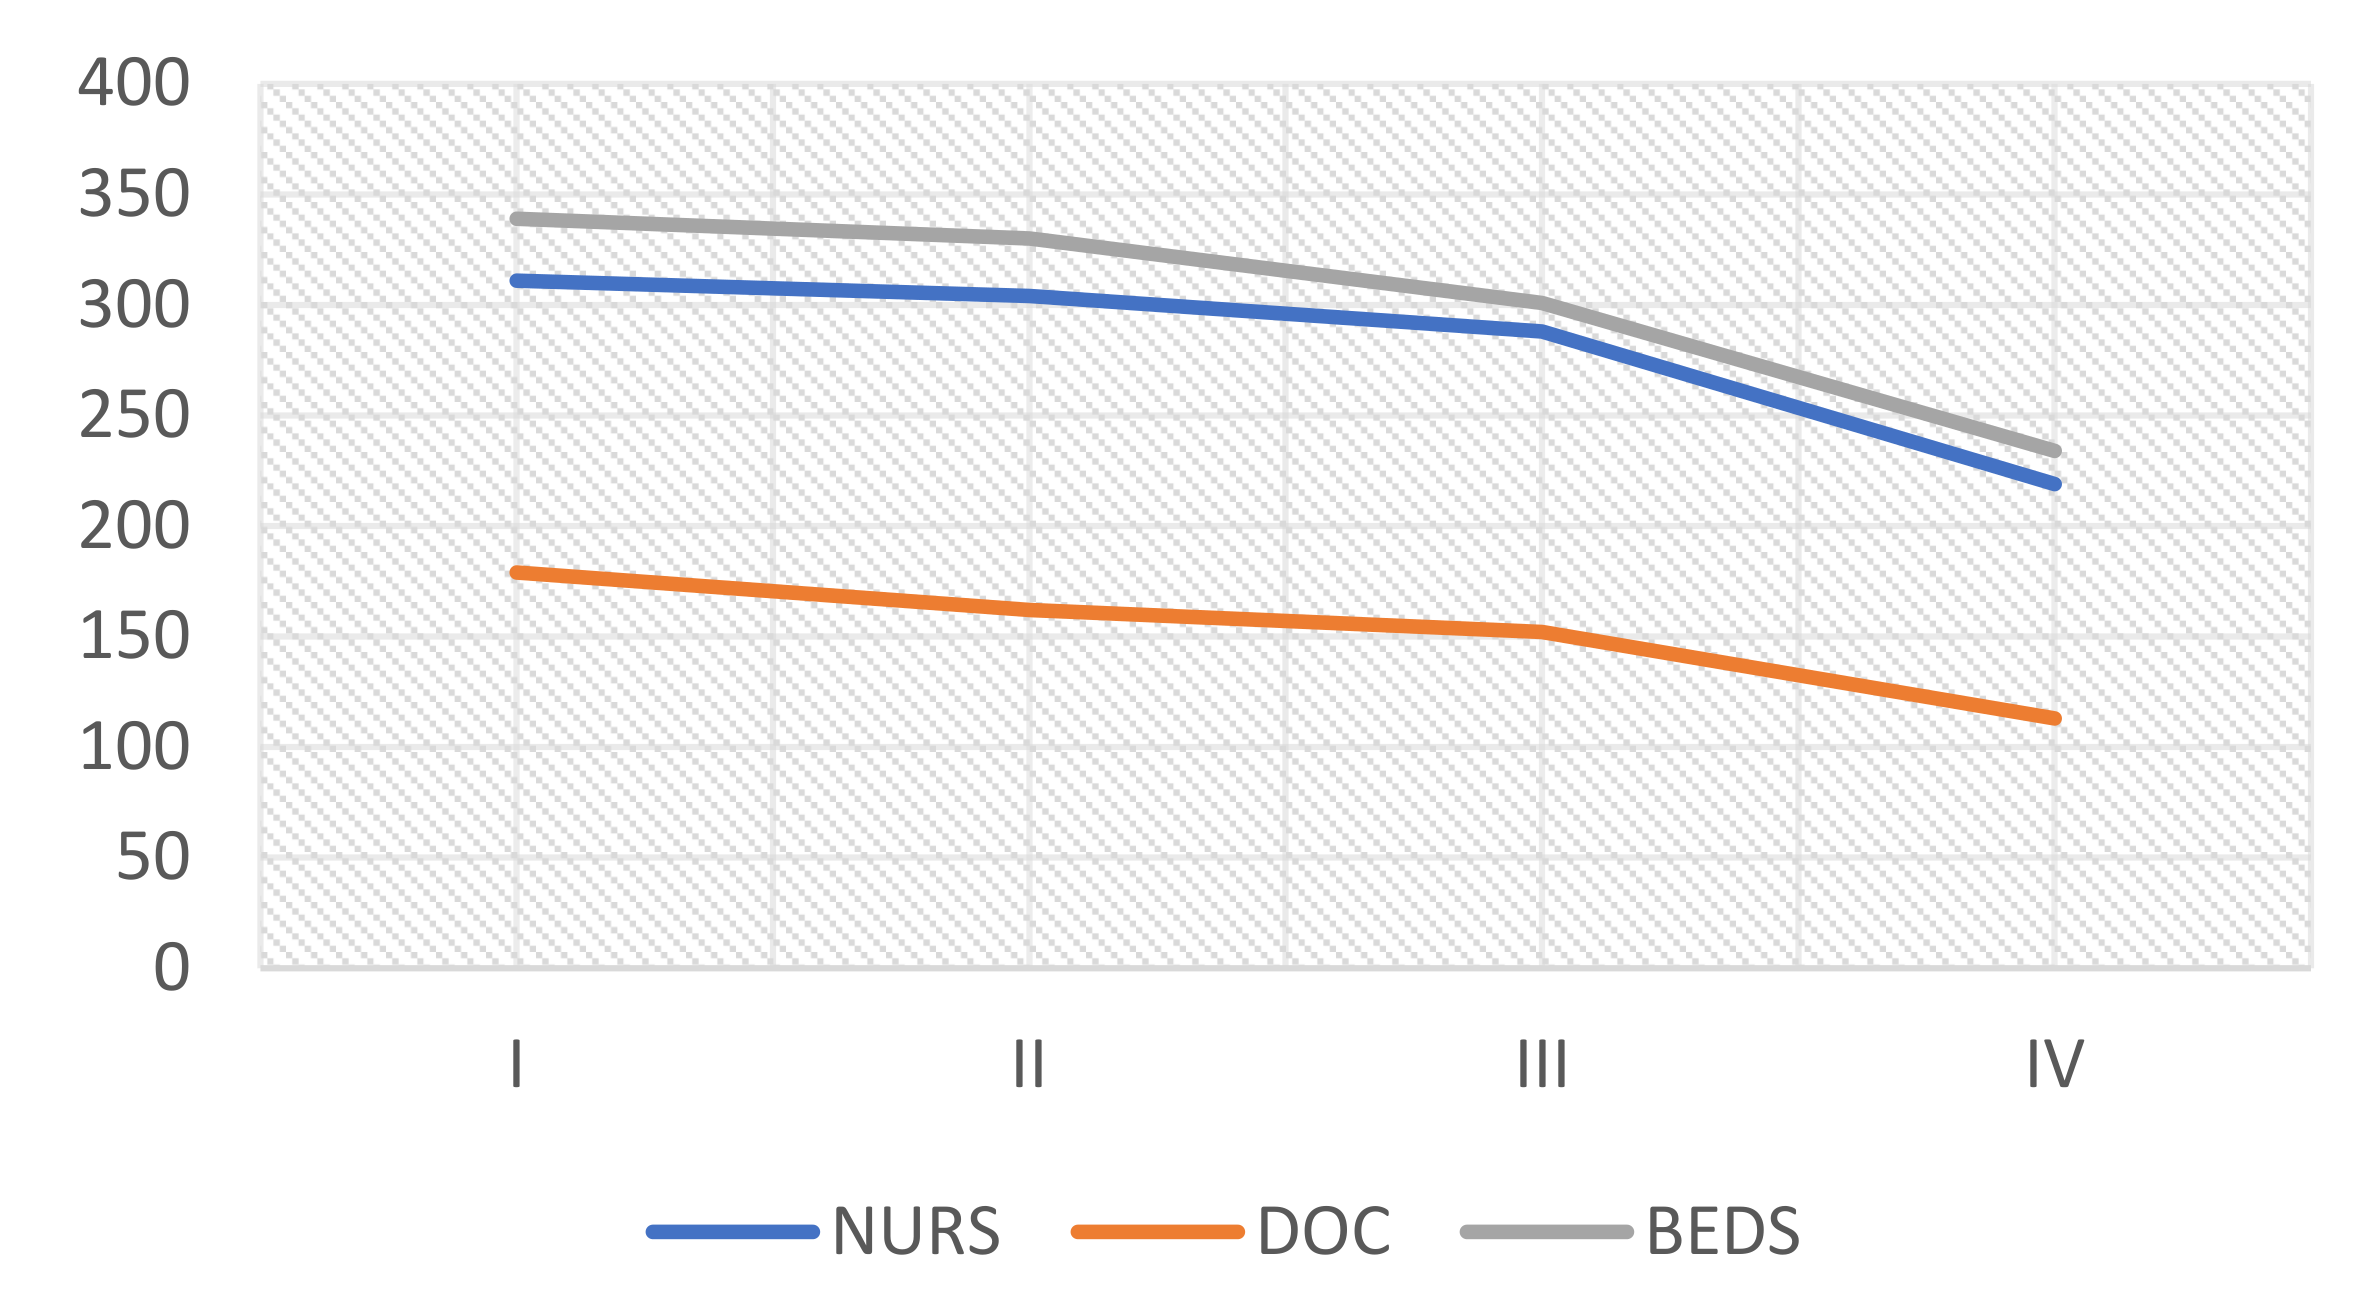
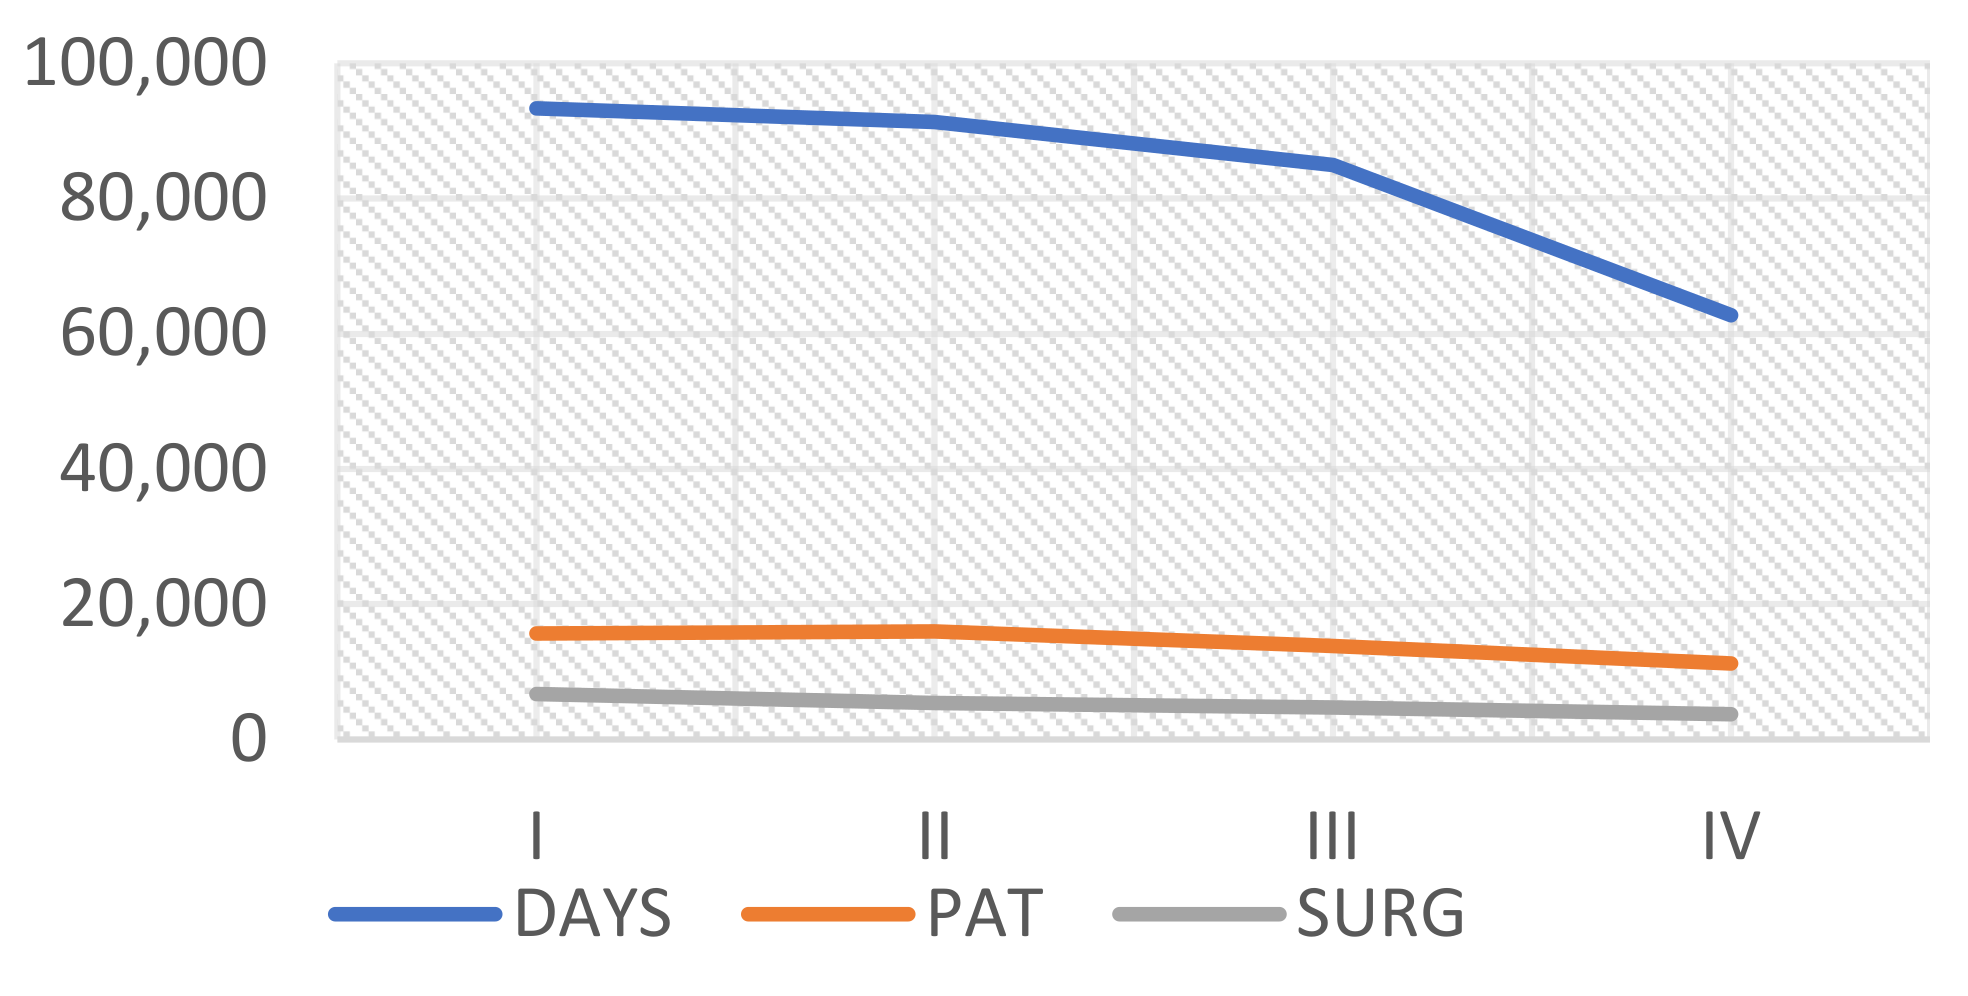
The characteristics of analyzed hospitals according to the climate zone in Poland are presented in Table 2, and Figure 2 and Figure 3.
Most of the hospitals are located in the third climate zone, which covers the most extensive area of Poland. More than 60% of hospital beds are located in this climate zone, which accompanies the highest percentage of treated patients (60.60%) and performed surgeries (59.70%). Accordingly, more than 61% of nurses and doctors take care of patients in hospitals located in the third climate zone.
3.3. Research Model
In the first stage of our research, we specified and estimated linear models in order to examine the impact of hospital size and its activity on electrical and thermal energy costs. The models are specified as follows:
EEC = β0 + β1(DAYS) + β2(BEDS) +β3(PAT) + β4(SURG) + β5(NURS) + β6(DOC)+ e
TEC = β0 + β1(DAYS) + β2(BEDS) +β3(PAT) + β4(SURG) + β5(NURS) + β6(DOC)+ e
To analyze whether the influence of the identified variables is the same in all the climate zones, we built the EEC and TEC models separately for each Polish climate zone as follows:
where i is the climate zone in Poland
EECi = β0 + β1(DAYSi) + β2(BEDSi) +β3(PATi) + β4(SURGi) + β5(NURSi) + β6(DOCi)+ e
TECi = β0 + β1(DAYSi) + β2(BEDSi) +β3(PATi) + β4(SURGi) + β5(NURSi) + β6(DOCi)+ e
3.4. Kruskal–Wallis One-Way Analysis of Variance
We used a nonparametric method for testing whether samples originated from the same distribution. We used the Kruskal–Wallis one-way analysis of variance to analyze to what extent the climate zone had a statistically significant influence on the electrical and thermal energy unit cost. A p-value of less than 0.05 was considered statistically significant.
For the statistical analysis, we used STATISTICA, TIBCO Software INC., Poland, Statsoft Polska, version 13.3.
4. Results and Discussion
4.1. Descriptive Statistics
In order to evaluate the influence of climate on hospital energy costs, we identified models of determinants of energy consumption in Polish hospitals, taking into account the climate zones determined at the NUTS 2 level. In addition, we checked whether the climate zones moderate other factors of energy consumption in hospitals connected with their size and type. Table 3 and Figure 4, Figure 5 and Figure 6 provide a view of descriptive statistics (means, standard deviations, medians and interquartile ranges) for all independent variables separately for each climate zone.
The highest average electrical and thermal energy costs are in hospitals located in the first climate zone and the lowest in the fourth one. On average, in hospitals located in the first climate zone, thermal energy costs are higher by nearly 40% and electrical energy costs are 1.5 times higher than in hospitals located in the fourth climate zone.
Based on the analysis, in the first climate zone, the hospitals are the biggest, and in the fourth one, the smallest. In terms of the number of beds, the number of doctors and nurses, hospitals located in the first climate zone is respectively more than 44, 58, and 42% bigger than in the fourth climate zone. According to the level of hospital activity, measured by the number of patients, hospitalization days, and the number of surgeries, hospitals in the first climate zone are respectively 1.40, 1.49, and 1.80 times higher than in the fourth one.
4.2. Linear Regression Models
First, the multivariate regression analysis took into account various factors relating to the hospital’s capacity and its medical activities. To analyze the indicators affecting EEC and TEC, we used linear regression models. The regression statistics of Equations (1) and (2) are given in Table 4.
The best subsets and the resulting backward stepwise regression models are:
EEC = −89,543.40 + 660.10(BEDS) + 23.00(SURG) + 437.90(NURS) + 3389.20(DOC) (5)
TEC = −99,791.80 + 1793.30(BEDS) − 13.70(PAT) + 18.00(SURG)+ 2797.40 (DOC) (6)
The dependent variables were EEC and TEC. In terms of EEC, the regression model demonstrated that a number of beds, surgeries, nurses, and doctors were found to be statistically significant. In terms of TEC, the number of beds, patients, surgeries and doctors. were found to be statistically significant.
The standard error (SE) for each regression coefficient was less than the value of the B coefficient. Otherwise, there would have been a large confidence interval, indicating a low significance of including the corresponding variable in the regression model. The most significant variable in both models was DOC, with a p-value <0.001. More doctors employed results in higher consumption of electricity and heat, which is related to the total energy consumption. The annual energy consumption is also influenced to a great extent by the number of beds occupying a particular area that is to be heated in winter. If the number of beds increases, so does energy consumption. In other studies, regarding factors connected with the medical activity, there was also a clear correlation between the number of hospitalizations and the annual energy consumption. Hospitals with less than 20,000 hospital admissions per year use less energy per bed than hospitals with more than 20,000 hospital stays. Hospitals with less than 20,000 annual stays have also been found to use less energy per discharge [18].
The next stage of the analysis consisted of grouping these factors according to the moderating variables represented by four climatic zones. We analyzed the influence of the identified variables describing hospital size and activity according to the climate zones by building the EEC and TEC models separately for each Polish climate zone (Table 5 and Table 6). We found that the number of hospitalization days (DAYS) and the number of doctors (DOC) were factors influencing the level of EEC independently from the climate zone. In terms of TEC, only the number of doctors (DOC) was the factor affecting analyzed costs independently from the climate zone. Observing the equations for models assigned to four climate zones, it can be concluded that the DOC variable had a significant impact on the annual energy consumption in all zones.
The uncertainty of these models is acceptable considering that other factors influence energy consumption, which were not controlled in the study [42]. It is important to emphasize that regression models are only valid within the range of values that determine the independent variables under consideration, and there is no assurance that successful results will be obtained when this range of values is exceeded [15].
The results obtained with multiple regression models confirm that energy consumption is determined by various factors related to the size and medical activity of hospitals. Among them, both for electricity and thermal energy, the most important factors connected with hospital size were the number of beds and the number of doctors. Our results are consistent with other studies. For example, in studies conducted in a German hospital on the factors influencing the average annual energy consumption, three indicators were analyzed (built-up area, number of employees and number of beds). The number of beds was shown to be the most appropriate as a reference indicator for quantifying the average energy consumption in a hospital [13]. In our study, the number of physicians turned out to be the most significant factor influencing the consumption of both electricity and heat. Knowledge of the importance of this factor makes us aware that subsequent analyses of the planned demand for electricity in the healthcare sector should refer to employment forecasts in the medical profession [43,44,45,46].
Other previous studies on the effect of hospital size on energy consumption showed a low correlation between the number of beds and the average annual heat energy and electricity consumption. These studies, carried out in private Spanish hospitals, also found a weak correlation between the number of employees and the average yearly heat energy consumption, as well as a high correlation with total and electric energy consumption. However, according to the study, hospitals with less than 275 employees used less energy per bed than hospitals with more than 275 employees, and hospitals with less than 100 beds used less energy per surgery [18]. In studies conducted in 45 hospitals in Thailand, no relationship was established between energy consumption and hospital capacity. This capacity was measured with the surface of air-conditioning area (m2), the surface of the non-air-conditioning area (m2), bed days in in-patient-departments, bed-days in out-patient-departments and number of staff members [14].
From the point of view of energy conservation, it would be appropriate to indicate the most effective size of the hospital. According to previous studies, this size varies from 200 to 300 beds, as this size allows the centralization of energy-producing equipment and the use of economies of scale, using more advanced facilities with higher capacity. On the other hand, it should be borne in mind that larger hospitals have higher energy consumption, and the great number of patients and medical workers hamper the implementation of appropriate policies to optimize energy consumption [18].
4.3. The Influence of Climate Zone on Energy Unit Costs by Hospital Activities
The results presented in Table 7 illustrate the average annual energy consumption per individual unit, expressing the size or effects of medical activity. The unit costs were calculated according to the individual hospital measures. These results show that energy consumption is more significant in areas with milder winter climates, which is mainly in the first climate zone. In this climatic area, the annual consumption of electricity and heat per patient and treatment per night is higher than in climatic zones with harsher winters.
According to our research, in the first climate zone EECD is nearly 19% higher than in the fourth zone, and TECS are more than three times higher in comparison to the third climate zone. TECP in the first zone is nearly 16% higher in relation to the fourth climate zone. The difference in EECP and EECS was not found statistically different according to the climate zones in Poland. In terms of the TECD, the differences between the climate zones were statistically significant, but the size of these differences was not meaningful.
In the first climatic zone, both the size of the hospital (number of doctors) and its medical activity (number of operations) has a positive effect on electricity consumption. The number of beds also has a significant influence on the consumption of thermal energy in this zone. In colder regions, no significant impact of medical activity (number of operations) on electricity and thermal energy consumption was noticed. In these regions, there is much less hospital activity and a much higher cost of electricity per operation.
According to our results, Polish hospitals operating in the fourth (coldest) climatic zone use less electricity and thermal energy than hospitals in the first climatic zone (the warmest). We presume that this is caused by the higher demand for cooling systems in the warmer zone [47]. It can, therefore, be concluded that the hospitals in the fourth climate zone, which perform the least operations per year and where the average annual hospital stay is shorter, manage energy better than the hospitals with more significant health care activity in the first zone. Other researchers from China evaluated that annual electricity consumption for hospitals in a frozen zone is 67.9% lower than for hospitals located in hot summer and warm winter zones. They concluded that annual electricity consumption is higher in the southern area in China than in the northern area because of use of air conditioning systems in summer. This is in line with our research, where the electrical energy costs in the hospitals located in the coolest zone (IV) are more than 64% lower than in the warmest climate zone (I). The influence of the climate on energy consumption was confirmed by other studies where the influence of temperatures on energy consumption was analyzed throughout the whole year [48,49]. These studies showed that higher needs for cooling systems between May and November result in a greater need for energy use at higher temperatures.
The better energy efficiency in hospitals from colder regions can also be associated with the health status of the patients in the regions and higher risks of some diseases in higher temperature regions [33]. Other researchers reported, for instance, that a one-degree Celsius increase in maximum monthly average temperature was associated with a 0.34 increase in heat-stress illness hospitalization rate per 100,000 population in thinly populated counties compared with 0.02 per 100,000 in highly urbanized counties [35]. Another study calculated that the annual excess days of hospitalizations and costs in 14 geographic regions of New York State for temperatures above a certain threshold, and estimated that respiratory diseases attributable to extreme heat at baseline in NYS resulted in 100 hospital admissions, US$644,069 in direct hospitalization costs, and 616 days of hospitalization per year [50]. Our analysis showed that the hospitals located in the fourth climate zone have fewer patients and perform fewer surgical operations. As a result, less intensive medical activity is carried out in these regions.
Another reason why the hospitals from colder regions use less energy is the fact that lower energy consumption in the hospitals from the IV zone is due to the poorer economic situation of these regions. The results of other studies show that the economic situation in a region may be a factor influencing energy consumption. For example, using the example of eastern Europe post-communist economies, it was shown that GDP growth is a key factor in increasing both energy efficiency and energy consumption [51,52,53]. In subsequent studies, it would be worth checking the relationship between energy consumption in hospitals and the economic situation of the region in which these hospitals operate.
We also analyzed the energy cost consumption in terms of the size of the hospitals measured by the number of beds.
According to Figure 7, the highest average EEC was among large hospitals located in the I climate zone and the lowest in the IV one. Among the big hospitals, the highest EEC was observed in the II climate zone. We didn’t observe a significant difference in average EEC in terms of medium and small hospitals. The highest variation in terms of EEC can be observed among large hospitals, especially in the IV climate zone.
In terms of TEC (Figure 8), the differences between large hospitals according to the climate zones were not significant. The most significant difference in TEC was seen among big hospitals, where the lowest TEC was in the first climate zone and the highest in the IV one. The influence of climate zone on TEC was not observed among small and medium-sized hospitals.
When comparing the energy efficiency of a group of hospitals, it was appropriate to calculate this consumption in relation to variables regarding healthcare activities, as different hospitals have different workloads and healthcare needs. Including activity variables prevents the most efficient hospitals from being penalized and promotes more efficient management. Taking into account hospital activity, we also analyzed to what extent the influence of climate zone on energy costs can depend on surgical or non-surgical hospital profile. The results are presented in Figure 9 and Figure 10.
We found that the warmer climate zones, the higher intensity in terms of surgeries, and the higher EEC. In terms of non-surgical hospitals, the influence of climate zone on EEC was not observed. In terms of TEC, the observations were similar. The difference in the level of TEC was observed for high and medium-intensity hospitals. However, the most noticeable difference was observed for high-intensity hospitals between the I-II climate zone and III-IV zone. There was no significant difference for non-surgical and low-intensity surgery hospitals.
In our study, we found that the number of surgery operations is an important variable related to the activity of hospitals that affects energy costs. This was observed especially for medium and high-intensity surgery hospitals in terms of TEC in the first and second climate zone. A high correlation between the average annual energy consumption and hospital activity indicators was also observed in studies carried out in Spain. Health indicators were represented by the number of annual discharges, the number of rescue operations and the number of hospitalizations. A direct link to the annual energy consumption per employee was also shown by the number of annual operations, laboratory tests, births, and endoscopies [18].
The number of surgical operations is an important factor influencing energy consumption due to the fact that operating theaters are characterized by an exceptionally high energy demand in hospitals. The operating theaters were found to be three to six times more energy-intensive than the hospital as a whole, mainly due to heating, ventilation and air conditioning requirements [19]. Hospitals with less than 3000 operations per year had lower energy consumption per bed than hospitals with more than 3000 operations. In addition, it was observed that hospitals with fewer than 2500 operations per year used less energy per hospital discharge [18]. It turns out that operating theaters use far more energy per area than other types of hospital areas. As lighting uses between one-third and almost half of the energy demand, this should encourage the use of more efficient types of lamps in hospitals, lower brightness levels, and encourage staff to switch lights off more consistently. In addition, there has been a discussion for several years about the time of using ventilation in operating rooms when no surgical operations are performed [20]. There is no certainty among medical personnel whether disabling this involves high risk.
The number of surgical operations also turned out to be a significant variable in a model used to forecast electricity from hospital air conditioners using an artificial neural network. Other variables included in this model were temperature, relative humidity, and electricity from the previous hour, time of day. This model was used not only to control the operation of the air-conditioning system but also to forecast hot water production using the hospital’s reheating system [54].
Our research does not confirm other studies, according to which energy consumption is higher in facilities operating in colder climatic zones. For example, in studies of fifty-one high-performance buildings around the world, it was found that the energy consumption in the hot zone was lower than in the rest of the zones. It was considered that the reason for this was the probable lack of space heating and the widespread use of natural ventilation in this climatic zone. However, the differences in energy consumption were influenced not only by the climate but also by the size of the building, efficient technologies, human behavior, and operations and maintenance practices (O&M) [55].
As the exact factors that influence a building’s energy consumption remain unclear, energy-saving strategies should take into account all the elements that can affect the actual energy consumption of a specific hospital. For example, climate can only affect cooling and heating loads, and the use of daylight and natural ventilation. In turn, the number of medical doctors employed affects a building’s operational schedule, and thus energy consumption in hospitals is influenced by other factors connected with human behavior regarding energy-saving habits [55].
To reduce energy consumption in the building sector, where most of the energy is used for heating and cooling applications, as it is in climate zone I hospitals, different strategies to reduce energy consumption should be implemented. One of them can be the Passive House (PH) concept [42,56]. The PH concept employs continuous insulation throughout the entire building envelope without any thermal bridging. The building envelope is extremely airtight, preventing infiltration of outside air and loss of conditioned air. In some countries, PH standards have been used to design hospital buildings [57,58]. Air conditioning energy consumption can account for 20–40% of a building’s energy consumption. Replacing energy-intensive mechanical ventilation with natural ventilation can therefore reduce energy consumption in hospitals in warmer climates [59]. Other studies analyzed utilizing thermal insulation as a passive strategy for reducing cooling and heating energy consumption in hospitals. Results showed that the use of an envelope of thermal insulation in hospitals allowed a reduction in energy consumption for cooling and heating while increasing the thermal comfort within the hospital [28] used to assess the performance of the HVAC system. The thermal comfort perceived by the staff inside is related to the indoor air quality of the operating theatres and the risk of nosocomial infection [60]. For this purpose, the “predicted average vote” and the “predicted percentage of dissatisfied” derived from Fanger’s comfort equation are usually calculated [61]. It is worth remembering, however, that in operating theaters, medical and surgical criteria must prevail over the criteria of thermal comfort. Another criterion for assessing the performance of an HVAC system is the rate of surgical site infections (SSI) for the total number of surgical operations performed in a given room [62].
Passive strategies to improve the energy performance of buildings were also assessed at three locations in the Baltic region (Kaunas, St. Petersburg and Warsaw). Results showed that total energy consumption varied by 27.4% between the most energy-intensive (coldest) and the least energy-consuming (warmest) region in the same climatic zone, strongly dominated by heating. The properties of the walls are able to reduce (or increase) energy consumption significantly. Overall, insulation has been essential in all three locations in the Baltic region [63].
We presume that the different influences of the climate zone on energy costs in Poland can also be associated with different levels of renewable energy production. Basically, all of Poland is suitable for air-to-water heat pumps and solar-powered energy sources. However, according to previous studies, depending on the climate zone, the profitability of those investments is different [64]. Because of intense solar radiation and lower outside air temperatures over the year in the south of Poland, the performance of renewable energy sources is best in the coldest regions. The exception is in the northeast part of Poland, where the temperature and solar radiation are both low [65]. It would be worth analyzing to what extent the hospital energy costs depend on the level of renewable energy production. It is worth noting that due to the high growth of the renewable energy sector, new financing channels are now available. A review of investment trends revealed that investors see great potential in renewable energy [66,67,68].
Other studies that considered European climatic zones showed that cities with cooler climates have energy consumption partially mitigated by the good thermophysical properties of the building envelope. On the other hand, for cities with warmer climates, an air treatment center can bring significant energy benefits. This is mainly due to the efficiency of the air conditioning unit’s heat exchanger, which processes warmer outside air in cities with milder climates [69]. Another study on the weather characteristics of European regions aimed to outline energy-saving climate strategies based on human thermal comfort. Strategies have been aligned with conceptual technologies such as glazing, shading and insulation. It turned out that in the northern climatic zone in which Poland belongs, the most influential strategies were ventilation with heat recovery (about 20% reduction from the initial base), improvement of glazing (reduction by 10–12% from the initial base) and improvement of insulation (10–5% reduction from the initial base). The effects of ventilation with heat recovery were more evident in the Nordic colder countries due to the savings in the pre-heating necessary for introducing outside air at very low temperatures. Locations with a warmer climate closer to the southern climate zone benefit from the use of efficient shading devices [70]. According to studies carried out in Spain, the energy demand of buildings located in similar climatic zones but in different countries is the same [71]. It is, therefore, necessary to gradually coordinate various national laws enacted to implement the Energy Performance of Buildings Directive (EPBD). This can contribute to reducing energy consumption in European buildings by sharing knowledge and best practices on energy efficiency and energy savings between all EU member states and Norway [72].
5. Conclusions and Implications
Energy consumption in the Polish healthcare sector, and particularly in hospitals, is very high compared to other commercial industries in the country. In order to take appropriate measures to optimize the energy consumption of these units, it is first necessary to understand the factors that influence this consumption. In this study, we assumed that energy consumption in Polish hospitals is manifold, shaped by many interrelated factors that overlap not only on an individual level but also at a higher level. The aim of the article was to investigate the determinants of electricity and heat consumption in Polish hospitals related to their size and medical activity, taking into account climate zone as a moderating variable. Our intention was, therefore, to investigate whether there are differences in the determinants of energy consumption between hospitals from different climatic zones. We used data from M-03 financial statements and M-29 activity reports from all Polish hospitals for 2010 to 2019 and applied backward stepwise regression analysis to their analysis.
The results confirmed that variables related to hospital size (number of doctors, number of beds) and variables related to their medical activity (number of surgical operations) are important determinants of energy consumption, regardless of the type of energy. Additionally, in the EEC model, the number of nurses turned out to be a statistically significant variable, and in the TEC model, the number of patients. The most essential variable in both models was the number of physicians. More doctors employed resulted in higher consumption of electricity and heat energy, which is related to the total energy consumption. In subsequent studies, it would be worth considering their behavior in the context of energy-saving activities.
In order to investigate the determinants of energy consumption in Polish hospitals operating in various climatic conditions, four models covering four climatic zones divided according to NUTS 2 regions were additionally examined. The result showed that the climate zone influences energy consumption in hospitals. The only variable that had a significant impact on the annual energy consumption in all climate zones was the number of doctors. Additionally, irrespective of the climatic zone, the level of electricity consumption was influenced by the number of days of hospitalization, and the level of thermal energy by the number of beds. In addition, energy consumption was more significant in areas with milder winters than in areas with harsher winters. This was especially true for surgical hospitals; he warmer the climatic zones, the greater the intensity of surgical procedures, the higher the EEC. In the case of non-surgical hospitals, no influence of the climatic zone on the EEC was observed.
The results of this study contribute in several ways to the literature on energy consumption in hospitals. First, the study develops a more integrated approach to studying the drivers of energy consumption in hospitals at the regional level, examining not only variables connected with hospital capacity but also medical activity variables that have proven to be important determinants. These variables have not been taken into account in previous studies on this topic. This study shows which factors can be considered universally relevant determinants of energy consumption, regardless of the location of hospitals.
Secondly, this study demonstrates the advantages of including the climatic zone as a moderating variable in analyzing the impact of hospital size and activity on electricity and heat consumption. The analysis showed that the context presented by the regional level, and especially the climate, can play an important role in making decisions about energy consumption.
Third, while the energy sector has a significant environmental and social impact, no empirical cross-sectional study specific to the healthcare sector has been carried out so far with such a large hospital base from one country. This article is the first study to collect and analyze data on energy costs in all hospitals in Poland. As far as we know, no previous research on this topic has focused on such a large sample of hospitals.
The present study, therefore, adds new evidence to the existing literature on the factors influencing energy consumption in the health sector. The impact of such related variables on energy consumption in the health sector has not yet been investigated.
Empirical findings can be useful in designing energy-saving policies at the national as well as regional levels. They can also be useful in other countries with a similar level of development as Poland. Researching the factors influencing energy use in healthcare facilities allows us to look for effective ways to implement improvements in energy management. Optimizing these factors may allow for a reduction in energy consumption, which will not only reduce greenhouse gas emissions but also reduce plant operating costs.
The results of our research describing the influence of climate zone on energy costs can also be used when designing the construction of new hospital buildings or modernization of existing ones.
Moreover, when designing heating systems for hospitals in the first climate zone, particular attention should be paid to the integrated heating and cooling system. Additional research still requires checking what other factors cause differences in energy consumption between individual regions of Poland, and especially to what extent the greater energy consumption in the western regions than in the eastern regions results from the influence of a humid, warmer climate on greater morbidity in these regions, or from a better economic situation in these regions.
6. Limitation and Future Research
The study has several limitations, which should be considered when evaluating the results. The study did not take into account the source of energy used by hospitals and their energy efficiency for all major fuels: (e.g., electricity, natural gas, fuel oil, and district heat.). However, other studies conducted in Polish hospitals show that electricity costs account for almost half (46%) of the energy costs used by hospitals. In second place is natural gas (35%), which hospitals use to generate heat. Hospitals spend significantly less on thermal energy from external sources (17%). The low oil expenditure (2%) with 24% of the plants that indicated it as one of their energy sources may be due to the fact that the units used fuel for company cars. As hospitals do not use energy from biomass/biogas/biofuels, they do not spend money on these types of fuel [73]. Other studies show that the main types of energy used in hospitals are natural gas and electricity. Natural gas is mainly used for space and water heating and cooking. Electricity is mainly used for cooling purposes [4]. In Poland, energy is mainly produced in utility power plants. In 2020, the production volume in these facilities amounted to 82.8% of the total production. For Poland, which has an economy based on coal, the most important fuel used to generate electricity was hard coal, with a share of 47.0%, and lignite with a share of 24.9%. The share of coal is systematically decreasing in favor of green sources, which, in 2020, accounted for 10.75% [74].
Another limitation of the study is the lack of an analysis of the cost of energy consumption, taking into account renewable energy sources. It is unclear how quickly Polish hospitals are switching to alternative renewable energy sources. The importance of the problem is increasing because, in accordance with the assumptions of the Europe 2010 strategy [75], it is necessary to take measures to reduce CO2 emissions by 20% by 2020, increase energy efficiency by 20% compared to 1990 and increase the share of renewable energy sources (RES) up to 20% in the entire European Union. Renewable energy is wind energy, solar radiation, aerothermal, geothermal and hydrothermal energy, ocean energy and hydropower, the energy obtained from biomass, gas from excavations, sewage treatment plants and biological sources. It is worth noting, however, that the sector of renewable energy sources (other than wind) in Poland recorded the highest growth in the last year. In September 2021, this sector recorded an increase of 88.73 percent compared to the previous year. In wind farms, production has increased by 15.67 percent on an annual basis. Since 2000, 36% of hospitals have installed solar panels, and 2% of hospitals invested in geothermal energy and photovoltaic installations. Solar installations are the most frequently indicated among the planned investments (44%). No hospital has used heat pumps so far, but their installation is declared by 16% of hospitals [73].
The article also does not take into account where hospitals consume energy. Hospitals have a high energy demand due to continuous operation, mainly heating, ventilation and air conditioning [76]. Unfortunately, this survey does not show the breakdown of energy consumption by these activities. The most energy-intensive activities in hospitals are typically ventilation, cooling and lighting, while the main uses of natural gas are space heating [4]. About 61% to 79% of a hospital’s energy consumption is generated by the production of lighting, heating, cooling and hot water [77]. Similar results can be found in literature studies that found that HVAC systems are the main consumers of electricity consumption in hospitals [78,79]. For example, air and room heating in UK hospitals used 44% of total energy [80]. In India, HVAC systems are also the main consumers of electricity, followed by lighting and water pumps [81]. In Thailand, HVAC systems accounted for more than half of the total energy consumption [14]. Therefore, energy-saving efforts in hospitals should focus on managing the HVAC system.
Consideration of these aspects should be taken into account in subsequent studies regarding Polish hospitals, as these buildings have many energy-intensive activities such as laundries, use of medical and laboratory equipment, sterilization, use of computers and servers, catering and refrigeration.
Author Contributions
Conceptualization, M.C. and M.K.-A.; methodology, M.C. and M.K.-A.; validation, M.C. and M.K.-A.; formal analysis, M.C. and M.K.-A.; investigation, M.C. and M.K.-A.; resources, M.C. and M.K.-A.; data curation, M.C.; writing—original draft preparation, M.C. and M.K.-A.; writing—review and editing, M.C. and M.K.-A.; visualization, M.C. and M.K.-A.; supervision, M.C. and M.K.-A.; project administration, M.C. and M.K.-A.; funding acquisition M.C. All authors have read and agreed to the published version of the manuscript.
Funding
This research received no external funding.
Institutional Review Board Statement
Not applicable.
Informed Consent Statement
Not applicable.
Data Availability Statement
The data was provided by the E-Health Center (Poland) in the mode of access to public information.
Acknowledgments
The authors would like to thank the E-Health Center (Poland) for preparing the data for this research work. The authors would also like to thank the anonymous reviewers for their constructive comments.
Conflicts of Interest
The authors declare no conflict of interest.
References
- Knoop, K.; Lechtenböhmer, S. The potential for energy efficiency in the EU Member States—A comparison of studies. Renew. Sustain. Energy Rev. 2017, 68, 1097–1105. [Google Scholar] [CrossRef] [Green Version]
- Deng, Y.Y.; Blok, K.; van der Leun, K. Transition to a fully sustainable global energy system. Energy Strateg. Rev. 2012, 1, 109–121. [Google Scholar] [CrossRef]
- Dylewski, R.; Adamczyk, J. Study on ecological cost-effectiveness for the thermal insulation of building external vertical walls in Poland. J. Clean. Prod. 2016, 133, 467–478. [Google Scholar] [CrossRef]
- Bawaneh, K.; Nezami, F.G.; Rasheduzzaman, M.; Deken, B. Energy Consumption Analysis and Characterization of Healthcare Facilities in the United States. Energies 2019, 12, 3775. [Google Scholar] [CrossRef] [Green Version]
- Brown, L.H.; Buettner, P.G.; Canyon, D.V. The Energy Burden and Environmental Impact of Health Services. Am. J. Public Health 2012, 102, e76. [Google Scholar] [CrossRef] [PubMed]
- Sala, M.; Alcamo, G.; Nelli, L.C. Energy-Saving Solutions for Five Hospitals in Europe. In Mediterranean Green Buildings & Renewable Energy; Sel. Pap. from World Renew. Energy Network’s Med Green Forum; Springer: Cham, Switzerland, 2017; pp. 1–17. [Google Scholar] [CrossRef]
- Bujak, J.W. Production of waste energy and heat in hospital facilities. Energy 2015, 91, 350–362. [Google Scholar] [CrossRef]
- Singer, B.C. Hospital Energy Benchmarking Guidance—Version 1.0; Ernest Orlando Lawrence Berkeley National Laboratory: Berkeley, CA, USA, 2009. [Google Scholar] [CrossRef] [Green Version]
- Gwiazda, M.; Kolbowska, A. Polacy o Zmianach Klimatu; Centrum Badania Opinii Społecznej: Warsaw, Poland, 2009. [Google Scholar]
- Pietrzak, M.B.; Igliński, B.; Kujawski, W.; Iwański, P. Energy Transition in Poland—Assessment of the Renewable Energy Sector. Energies 2021, 14, 2046. [Google Scholar] [CrossRef]
- Yohanis, Y.G.; Mondol, J.D.; Wright, A.; Norton, B. Real-life energy use in the UK: How occupancy and dwelling characteristics affect domestic electricity use. Energy Build. 2008, 40, 1053–1059. [Google Scholar] [CrossRef]
- Wiesmann, D.; Lima Azevedo, I.; Ferrão, P.; Fernández, J.E. Residential electricity consumption in Portugal: Findings from top-down and bottom-up models. Energy Policy 2011, 39, 2772–2779. [Google Scholar] [CrossRef]
- González, A.G.; García-Sanz-Calcedo, J.; Salgado, D.R. Evaluation of Energy Consumption in German Hospitals: Benchmarking in the Public Sector. Energies 2018, 11, 2279. [Google Scholar] [CrossRef] [Green Version]
- Thinate, N.; Wongsapai, W.; Damrongsak, D. Energy Performance Study in Thailand Hospital Building. Energy Procedia 2017, 141, 255–259. [Google Scholar] [CrossRef]
- Aranda, A.; Ferreira, G.; Mainar-Toledo, M.D.; Scarpellini, S.; Sastresa, E.L. Multiple regression models to predict the annual energy consumption in the Spanish banking sector. Energy Build. 2012, 49, 380–387. [Google Scholar] [CrossRef]
- González González, A.; García-Sanz-Calcedo, J.; Salgado, D.R. A quantitative analysis of final energy consumption in hospitals in Spain. Sustain. Cities Soc. 2018, 36, 169–175. [Google Scholar] [CrossRef]
- Salem Szklo, A.; Soares, J.B.; Tolmasquim, M.T. Energy consumption indicators and CHP technical potential in the Brazilian hospital sector. Energy Convers. Manag. 2004, 45, 2075–2091. [Google Scholar] [CrossRef]
- García-Sanz-Calcedo, J.; Gómez-Chaparro, M.; Sanchez-Barroso, G. Electrical and thermal energy in private hospitals: Consumption indicators focused on healthcare activity. Sustain. Cities Soc. 2019, 47, 101482. [Google Scholar] [CrossRef]
- MacNeill, A.J.; Lillywhite, R.; Brown, C.J. The impact of surgery on global climate: A carbon footprinting study of operating theatres in three health systems. Lancet Planet. Heal. 2017, 1, e381–e388. [Google Scholar] [CrossRef] [Green Version]
- Christiansen, N.; Kaltschmitt, M.; Dzukowski, F. Electrical energy consumption and utilization time analysis of hospital departments and large scale medical equipment. Energy Build. 2016, 131, 172–183. [Google Scholar] [CrossRef]
- Chong, H. Building vintage and electricity use: Old homes use less electricity in hot weather. Eur. Econ. Rev. 2012, 56, 906–930. [Google Scholar] [CrossRef] [Green Version]
- Blázquez, L.; Boogen, N.; Filippini, M. Residential electricity demand in Spain: New empirical evidence using aggregate data. Energy Econ. 2013, 36, 648–657. [Google Scholar] [CrossRef]
- Mirasgedis, S.; Sarafidis, Y.; Georgopoulou, E.; Kotroni, V.; Lagouvardos, K.; Lalas, D.P. Modeling framework for estimating impacts of climate change on electricity demand at regional level: Case of Greece. Energy Convers. Manag. 2007, 48, 1737–1750. [Google Scholar] [CrossRef]
- Ekonomou, L. Greek long-term energy consumption prediction using artificial neural networks. Energy 2010, 35, 512–517. [Google Scholar] [CrossRef] [Green Version]
- Moustris, K.P.; Nastos, P.T.; Bartzokas, A.; Larissi, I.K.; Zacharia, P.T.; Paliatsos, A.G. Energy consumption based on heating/cooling degree days within the urban environment of Athens, Greece. Theor. Appl. Climatol. 2014, 122, 517–529. [Google Scholar] [CrossRef]
- Rehdanz, K. Determinants of residential space heating expenditures in Germany. Energy Econ. 2007, 29, 167–182. [Google Scholar] [CrossRef]
- Hill, D.R. Regional determinants of residential energy expenditures and the principal-agent problem in Austria. REGION 2015, 2, Y1–Y16. [Google Scholar] [CrossRef]
- Kameni Nematchoua, M.; Yvon, A.; Kalameu, O.; Asadi, S.; Choudhary, R.; Reiter, S. Impact of climate change on demands for heating and cooling energy in hospitals: An in-depth case study of six islands located in the Indian Ocean region. Sustain. Cities Soc. 2018, 44, 629–645. [Google Scholar] [CrossRef]
- Romero-Jordán, D.; Peñasco, C.; Del Río, P. Analysing the determinants of household electricity demand in Spain. An econometric study. Int. J. Electr. Power Energy Syst. 2014, 63, 950–961. [Google Scholar] [CrossRef]
- Hong, T.; Chang, W.K.; Lin, H.W. A fresh look at weather impact on peak electricity demand and energy use of buildings using 30-year actual weather data. Appl. Energy 2013, 111, 333–350. [Google Scholar] [CrossRef] [Green Version]
- Auffhammer, M.; Mansur, E.T. Measuring climatic impacts on energy consumption: A review of the empirical literature. Energy Econ. 2014, 46, 522–530. [Google Scholar] [CrossRef] [Green Version]
- Bessec, M.; Fouquau, J. The non-linear link between electricity consumption and temperature in Europe: A threshold panel approach. Energy Econ. 2008, 30, 2705–2721. [Google Scholar] [CrossRef] [Green Version]
- Li, J.; Yang, L.; Long, H. Climatic impacts on energy consumption: Intensive and extensive margins. Energy Econ. 2018, 71, 332–343. [Google Scholar] [CrossRef]
- Mansur, E.T.; Mendelsohn, R.; Morrison, W. Climate change adaptation: A study of fuel choice and consumption in the US energy sector. J. Environ. Econ. Manage. 2008, 55, 175–193. [Google Scholar] [CrossRef]
- Schmeltz, M.T.; Petkova, E.P.; Gamble, J.L. Economic Burden of Hospitalizations for Heat-Related Illnesses in the United States, 2001–2010. Int. J. Environ. Res. Public Health 2016, 13, 894. [Google Scholar] [CrossRef] [PubMed] [Green Version]
- Jagai, J.S.; Grossman, E.; Navon, L.; Sambanis, A.; Dorevitch, S. Hospitalizations for heat-stress illness varies between rural and urban areas: An analysis of Illinois data, 1987–2014. Environ. Health 2017, 16, 1–10. [Google Scholar] [CrossRef] [Green Version]
- Narowski, P.G. Parametry obliczeniowe powietrza zewnętrznego i strefy klimatyczne Polski do obliczania mocy w systemach chłodzenia, wentylacji i klimatyzacji budynków. Instal 2020, 3, 21–30. [Google Scholar] [CrossRef]
- Strzeszewski, M.; Wereszczyński, P. Norma PN–EN 12831 Nowa Metoda Obliczania Projektowego. Poradnik; Rettig Heating Sp. z o.o.: Warsaw, Poland, 2009. [Google Scholar]
- Narowski, P. Ewolucja kryteriów wyboru i wartości temperatury obliczeniowej powietrza zewnętrznego dla ogrzewnictwa w Polsce. Fiz. Budowli Teor. Prakt. 2011, 6, 61–67. [Google Scholar]
- Borozan, D. Regional-level household energy consumption determinants: The European perspective. Renew. Sustain. Energy Rev. 2018, 90, 347–355. [Google Scholar] [CrossRef]
- Fazeli, R.; Ruth, M.; Davidsdottir, B. Temperature response functions for residential energy demand—A review of models. Urban Clim. 2016, 15, 45–59. [Google Scholar] [CrossRef]
- Tzikopoulos, A.F.; Karatza, M.C.; Paravantis, J.A. Modeling energy efficiency of bioclimatic buildings. Energy Build. 2005, 37, 529–544. [Google Scholar] [CrossRef]
- Tatarczak, A.; Boichuk, O. The multivariate techniques in the evaluation of unemployment analysis of Polish regions. Oeconomia Copernic. 2018, 9, 361–380. [Google Scholar] [CrossRef]
- Rollnik-Sadowska, E.; Dąbrowska, E. Cluster analysis of effectiveness of labour market policy in the European Union. Oeconomia Copernic. 2018, 9, 143–158. [Google Scholar] [CrossRef]
- Gajdos, A.; Arendt, L.; Balcerzak, A.P.; Pietrzak, M.B. Future trends of labour market polarisation in Poland. The Pperspective of 2025. Trans. Bus. Econ. 2020, 19, 114–135. [Google Scholar]
- Chocholatá, M.; Furková, A. The analysis of employment rates in the context of spatial connectivity of the EU regions. Equilibrium. Q. J. Econ. Econ. Policy 2018, 13, 181–213. [Google Scholar] [CrossRef]
- Ji, R.; Qu, S. Investigation and Evaluation of Energy Consumption Performance for Hospital Buildings in China. Sustainability 2019, 11, 1724. [Google Scholar] [CrossRef] [Green Version]
- Teke, A.; Zor, K.; Timur, O. A simple methodology for capacity sizing of cogeneration and trigeneration plants in hospitals: A case study for a university hospital. J. Renew. Sustain. Energy 2015, 7, 053102. [Google Scholar] [CrossRef]
- Raymundo, A.V.; Twomey, J. Climate Effects on Hospitals’ Energy Consumption. McNair Sch. Progr. J. Res. Progr. 2013, 19, 91–94. [Google Scholar]
- Lin, S.; Hsu, W.-H.; Van Zutphen, A.R.; Saha, S.; Luber, G.; Hwang, S.-A. Excessive Heat and Respiratory Hospitalizations in New York State: Estimating Current and Future Public Health Burden Related to Climate Change. Environ. Health Perspect. 2012, 120, 1571. [Google Scholar] [CrossRef] [PubMed]
- Wang, Y.; Liu, Y.; Ye, D.; Li, N.; Bi, P.; Tong, S.; Wang, Y.; Cheng, Y.; Li, Y.; Yao, X. High temperatures and emergency department visits in 18 sites with different climatic characteristics in China: Risk assessment and attributable fraction identification. Environ. Int. 2020, 136, 105486. [Google Scholar] [CrossRef] [PubMed]
- Zinecker, M.; Doubravský, K.; Balcerzak, A.P.; Pietrzak, M.B.; Dohnal, M. The Covid-19 disease and policy response to mitigate the economic impact in the EU. Technol. Econ. Dev. Econ. 2021, 27, 742–762. [Google Scholar] [CrossRef]
- Kiseľáková, D.; Šofranková, B.; Onuferová, E.; Čabinová, V. The evaluation of competitive position of EU-28 economies with using global multi-criteria indices. Equilibrium. Q. J. Econ. Econ. Policy 2019, 14, 441–462. [Google Scholar] [CrossRef]
- Chen, C.R.; Shih, S.C.; Hu, S.C. Short-term electricity forecasting of air-conditioners of hospital using artificial neural networks. In Proceedings of the 2005 IEEE/PES Transmission & Distribution Conference & Exposition: Asia and Pacific, Dalian, China, 18 August 2005; Volume 2005, pp. 1–5. [Google Scholar] [CrossRef]
- Li, C.; Hong, T.; Yan, D. An insight into actual energy use and its drivers in high-performance buildings. Appl. Energy 2014, 131, 394–410. [Google Scholar] [CrossRef] [Green Version]
- Fernandez-Antolin, M.-M.; del Río, J.M.; Costanzo, V.; Nocera, F.; Gonzalez-Lezcano, R.-A. Passive Design Strategies for Residential Buildings in Different Spanish Climate Zones. Sustainability 2019, 11, 4816. [Google Scholar] [CrossRef] [Green Version]
- Grann, B. A Building Information Model (BIM) Based Lifecycle Assessment of a University Hospital Building Built to Passive House Standards. Master’s Thesis, Institutt for Energi-og Prosessteknikk, Trondheim, Norway, 2012. [Google Scholar]
- Koch, C.; Buser, M. Creating State of the Art? A Passive House University Hospital North of the Polar Circle. In Proceedings of the Cold Climate HVAC 2018, Kiruna, Sweden, 12–15 March 2018; Springer: Cham, Switzerland, 2018; pp. 1065–1073. [Google Scholar]
- Kong, X.; Ren, Y.; Ren, J.; Duan, S.; Guo, C. Energy-saving performance of respiration-type double-layer glass curtain wall system in different climate zones of China: Experiment and simulation. Energy Build. 2021, 252, 111464. [Google Scholar] [CrossRef]
- Mora, R.; English, M.J.M.; Athienitis, A.K. Assessment of thermal comfort during surgical operations. Discussion. ASHRAE Trans. 2001, 101, 52. [Google Scholar]
- Fanger, P.O. Thermal Comfort. Analysis and Applications in Environmental Engineering; Danish Technical Press: Copenhagen, Denmark, 1970. [Google Scholar]
- Sánchez-Barroso, G.; Sanz-Calcedo, J.G. Evaluation of HVAC Design Parameters in High-Performance Hospital Operating Theatres. Sustainability 2019, 11, 1493. [Google Scholar] [CrossRef] [Green Version]
- Sabūnas, A. Estimation of the Impact of Different Residential Building Parameters and Climate Change for Energy Consumption in Kaunas, Lithuania; VDU—Vytauto Didžiojo Universitetas: Kaunas, Lithuania, 2017. [Google Scholar]
- Sineviciene, L.; Sotnyk, I.; Kubatko, O. Determinants of energy efficiency and energy consumption of Eastern Europe post-communist economies. Energy Environ. 2017, 28, 870–884. [Google Scholar] [CrossRef]
- Kantola, M.; Saari, A. Renewable vs. traditional energy management solutions—A Finnish hospital facility case. Renew. Energy 2013, 57, 539–545. [Google Scholar] [CrossRef]
- Bobinaite, V.; Tarvydas, D. Financing instruments and channels for the increasing production and consumption of renewable energy: Lithuanian case. Renew. Sustain. Energy Rev. 2014, 38, 259–276. [Google Scholar] [CrossRef]
- Zinecker, M.; Skalicka, M.; Balcerzak, A.P.; Pietrzak, M.B. Business angels in the Czech Republic: Characteristics and a classification with policy implications. Econ. Res. Istraživanja 2021, ahead of print. 1–26. [Google Scholar] [CrossRef]
- Zinecker, M.; Skalicka, M.; Balcerzak, A.P.; Pietrzak, M.B. Identifying the impact of external environment on business angel activity. Econ. Res. Istraživanja 2021, ahead of print. 1–23. [Google Scholar] [CrossRef]
- De Rubeis, T.; Falasca, S.; Curci, G.; Paoletti, D.; Ambrosini, D. Sensitivity of heating performance of an energy self-sufficient building to climate zone, climate change and HVAC system solutions. Sustain. Cities Soc. 2020, 61, 102300. [Google Scholar] [CrossRef]
- Capeluto, I.G.; Ochoa, C.E. Simulation-based method to determine climatic energy strategies of an adaptable building retrofit façade system. Energy 2014, 76, 375–384. [Google Scholar] [CrossRef]
- Bienvenido-Huertas, D.; Oliveira, M.; Rubio-Bellido, C.; Marín, D. A Comparative Analysis of the International Regulation of Thermal Properties in Building Envelope. Sustainability 2019, 11, 5574. [Google Scholar] [CrossRef] [Green Version]
- López-Ochoa, L.M.; Las-Heras-Casas, J.; Olasolo-Alonso, P.; López-González, L.M. Towards nearly zero-energy buildings in Mediterranean countries: Fifteen years of implementing the Energy Performance of Buildings Directive in Spain (2006–2020). J. Build. Eng. 2021, 44, 102962. [Google Scholar] [CrossRef]
- Kautsch, M.; Lichon, M.; Sobieralaska, S. Energia odnawialna w szpitalach w Polsce. Przedsiębiorczość Zarządzanie 2013, 14, 193–203. [Google Scholar]
- GUS Data Produkcja Energii Elektrycznej w Polsce, Rynek Elektryczny. Available online: https://www.rynekelektryczny.pl/produkcja-energii-elektrycznej-w-polsce/ (accessed on 30 October 2021).
- European Commission. EUROPE 2020 A Strategy for Smart, Sustainable and Inclusive Growth; OPOCE: Brussels, Belgium, 2020. [Google Scholar]
- Karliner, J.; Slotterback, S.; Boyd, R.; Ashby, B.; Steele, K.; Wang, J. Health care’s climate footprint: The health sector contribution and opportunities for action. Eur. J. Public Health 2020, 30, ckaa165.839. [Google Scholar] [CrossRef]
- Teke, A.; Timur, O. Overview of Energy Savings and Efficiency Strategies at the Hospitals. Int. J. Econ. Manag. Eng. 2014, 8, 242–248. [Google Scholar]
- Buonomano, A.; Calise, F.; Ferruzzi, G.; Palombo, A. Dynamic energy performance analysis: Case study for energy efficiency retrofits of hospital buildings. Energy 2014, 78, 555–572. [Google Scholar] [CrossRef]
- Teke, A.; Timur, O. Assessing the energy efficiency improvement potentials of HVAC systems considering economic and environmental aspects at the hospitals. Renew. Sustain. Energy Rev. 2014, 33, 224–235. [Google Scholar] [CrossRef]
- Fifield, L.J.; Lomas, K.J.; Giridharan, R.; Allinson, D. Hospital wards and modular construction: Summertime overheating and energy efficiency. Build. Environ. 2018, 141, 28–44. [Google Scholar] [CrossRef]
- Franco, A.; Shaker, M.; Kalubi, D.; Hostettler, S. A review of sustainable energy access and technologies for healthcare facilities in the Global South. Sustain. Energy Technol. Assessments 2017, 22, 92–105. [Google Scholar] [CrossRef]
Figure 1.
Map of climate zones in Poland.

Figure 2.
Hospital size measures according to climate zones.

Figure 3.
Hospital activity measured according to climate zones.

Figure 4.
Mean EEC and TEC according to climate zones.

Figure 5.
Mean hospital size measurements according to climate zones.

Figure 6.
Mean hospital activity measurements according to climate zones.

Figure 7.
EEC by the size of the hospitals relative to the climate zones in Poland.

Figure 8.
TEC by the size of the hospitals related to climate zones in Poland.

Figure 9.
EEC by hospital surgery intensity related to climate zones in Poland.

Figure 10.
TEC by hospital surgery intensity related to climate zones in Poland.


Table 1.
The outside designed temperature in five climatic zones for winter in Poland.
| Climate Zone | Temperature |
|---|---|
| I | −16 |
| II | −18 |
| III | −20 |
| IV | −22 |
| V | −24 |
Table 2.
The characteristics of analyzed hospitals according to the climate zone in Poland.
| Variables | Climate Zone | Total | |||
|---|---|---|---|---|---|
| I | II | III | IV | ||
| n (%) | |||||
| Hospital years * | 249 (7.57) | 679 (20.64) | 2047 (62.24) | 314 (9.55) | 3289 |
| DAYS | 20,160,208 (8.17) | 55,261,425 (22.40) | 153,752,238 (62.33) | 17,504,144 (7.10) | 246,678,015 |
| BEDS | 73,282 (8.29) | 199,434 (22.55) | 546253 (61.77) | 65388 (7.39) | 884,357 |
| PAT | 3,596,544 (8.63) | 9,697,673 (23.26) | 25,266,118 (60.60) | 3,134,437 (7.52) | 41,694,772 |
| SURG | 1,672,340 (10.38) | 3,647,777 (22.65) | 9,614,112 (59.70) | 117,0610 (7.27) | 16,104,839 |
| NURS | 71,208 (8.42) | 184,516 (21.83) | 528,267 (62.50) | 61,286 (7.25) | 845,277 |
| DOC | 41,056 (9.14) | 98,309 (21.88) | 278,273 (61.95) | 31,577 (7.03) | 449,215 |
* A sample of 3289 hospital-years contains data of the 376 hospitals for the period 2010–2019.
Table 3.
Characteristics of analyzed hospitals according to the climate zones in Poland.
| Variables | Climate Zone | Total | |||
|---|---|---|---|---|---|
| I | II | III | IV | ||
| Mean (SD) Median (Q1–Q3) | |||||
| EEC (PLN) | 1,034,553 (122,6397) 659,786 (306,546–1,201,155) | 1,025,393 (980,078) 717,520 (318,689–1,407,173) | 910,042 (1,177,533) 598,957 (338,093–1,028,006) | 665,117 (779,879) 389,828 (244,459–828,121) | 919,899 (1,114,355) 597,540 (315,505–1,114,377) |
| TEC (PLN) | 975,732 (1,302,336) 491,888 (244,066–1,063,739) | 922,536 (1,018,291) 545,981 (252,885–1,255,279) | 821,019 (1,023,326) 515,932 (240,081–1,032,906) | 701,529 (726,990) 435,569 (314,578–862,438) | 842,282 (1,023,982) 505,367 (253,492–1,055,089) |
| DAYS | 93,334 (83,881) 64,880 (28,156–140,736) | 91,341 (69,644) 68,910 (34,060–134,650) | 84,946 (64,884) 69,227 (36,910–111,610) | 62,738 (52,114) 47,767 (29,282–77,934) | 84,769 (66,825) 66,627 (34,276–115,936) |
| BEDS | 339 (292) 260 (110–434) | 330 (266) 243 (136–488) | 301 (240) 256 (121–408) | 234 (200) 176 (105–311) | 303 (248) 243 (123–419) |
| PAT | 15,705 (13,958) 11,021 (5612–25,441) | 15,976 (11,547) 12,313 (6457–24,156) | 13,806 (11,333) 11,382 (5987–17,635) | 11,234 (97,707) 7968 (5044–16,585) | 14,157 (11,537) 11,021 (5932–19,004) |
| SURG | 6716 (9392) 2866 (694–8756) | 5372 (6274) 2787 (1114–8986) | 4696 (6142) 2718 (631–6356) | 3728 (4771) 2035 (366–4471) | 4896 (6392) 2667 (705–6858) |
| NURS | 311 (316) 187 (101–423) | 304 (253) 220 (116–454) | 288 (267) 218 (102–379) | 219 (204) 154 (89–286) | 287 (264) 206 (106–395) |
| DOC | 179 (211) 102 (50–234) | 162 (155) 113 (51–238) | 152 (157) 107 (53–195) | 113 (131) 64 (39–153) | 152 (160) 101 (50–202) |
Table 4.
Backward stepwise regression analysis with EEC and TEC as the dependent variable.
| Variables | EEC | TEC | ||||||
|---|---|---|---|---|---|---|---|---|
| B | SE | t | p-Value | B | SE | t | p-Value | |
| (Constant) | −89,543.40 | 20,655.90 | −4.335 | p < 0.001 | −99,791.80 | 21,668.51 | −4.605 | p < 0.001 |
| BEDS | 660.10 | 115.63 | 5.708 | p < 0.001 | 1793.30 | 131.46 | 13.641 | p < 0.001 |
| PAT | −13.70 | 3.16 | −4.321 | p < 0.001 | ||||
| SURG | 23.00 | 3.24 | 7.096 | p < 0.001 | 18.00 | 3.56 | 5.067 | p < 0.001 |
| NURS | 437.90 | 99.14 | 4.416 | p < 0.001 | ||||
| DOC | 3389.20 | 169.77 | 19.964 | p < 0.001 | 2797.40 | 171.69 | 16.293 | p < 0.001 |
| R2 | 0.710 | 0.630 | ||||||
Table 5.
Backward stepwise regression analysis with EEC as dependent variable according to the climate zones in Poland.
Table 5.
Backward stepwise regression analysis with EEC as dependent variable according to the climate zones in Poland.
| Climate Zone | I | II | III | IV | ||||||||||||
|---|---|---|---|---|---|---|---|---|---|---|---|---|---|---|---|---|
| Variables | B | SE | t | p-Value | B | SE | t | p-Value | B | SE | t | p-Value | B | SE | t | p-Value |
| (Constant) | 54,723.96 | 45,449.20 | 1.204 | NS | 56,628.14 | 40,665.19 | 1.392 | NS | −173,399 | 29,507.34 | −5.876 | p<0.001 | −78,941.9 | 32,153.37 | −2.455 | p < 0.01 |
| DAYS | 5.85 | 1.17 | 5.013 | p < 0.001 | 5.03 | 0.73 | 6.875 | p < 0.001 | −5 | 1.26 | −4.283 | p < 0.001 | 4.8 | 0.87 | 5.484 | p < 0.001 |
| BEDS | 2057 | 352.99 | 5.827 | p < 0.001 | ||||||||||||
| PAT | −39.86 | 7.18 | −5.553 | p < 0.001 | ||||||||||||
| SURG | 28.65 | 7.03 | 4.076 | p < 0.001 | 28.49 | 7.18 | 3.967 | p < 0.001 | 19 | 4.47 | 4.242 | p < 0.001 | ||||
| NURS | 471 | 134.65 | 3.495 | p < 0.001 | ||||||||||||
| DOC | 4714.66 | 433.29 | 10.881 | p < 0.001 | 2117.82 | 330.45 | 6.408 | p < 0.001 | 3854 | 237.13 | 16.254 | p < 0.001 | 4045.2 | 337.29 | 11.993 | p < 0.001 |
| R2 | 0.903 | 0.677 | 0.688 | 0.868 | ||||||||||||
Table 6.
Backward stepwise regression analysis with TEC as dependent variable according to the climate zones in Poland.
Table 6.
Backward stepwise regression analysis with TEC as dependent variable according to the climate zones in Poland.
| Climate Zone | I | II | III | IV | ||||||||||||
|---|---|---|---|---|---|---|---|---|---|---|---|---|---|---|---|---|
| Variables | B | SE | t | p-Value | B | SE | t | p-Value | B | SE | t | p-Value | B | SE | t | p-Value |
| (Constant) | −29,521.6 | 88,032.76 | −0.335 | NS | −143,060 | 45,072.70 | −3.173 | p < 0.01 | −151,998 | 28,734.94 | −5.289 | p < 0.001 | 10,781.47 | 35,420.74 | 0.304 | NS |
| DAYS | −6 | 1.23 | −5.097 | p < 0.001 | 5.70 | 0.96 | 5.941 | p < 0.001 | ||||||||
| BEDS | 4241.0 | 657.95 | 6.445 | p < 0.001 | 1710 | 186.60 | 9.165 | p < 0.001 | 3015 | 329.19 | 9.160 | p < 0.001 | ||||
| PAT | −93.5 | 13.43 | −6.960 | p < 0.001 | ||||||||||||
| SURG | 42.4 | 12.16 | 3.487 | p < 0.001 | 38 | 7.34 | 5.155 | p < 0.001 | ||||||||
| NURS | −1290.5 | 406.47 | −3.174 | p < 0.01 | ||||||||||||
| DOC | 5616.9 | 772.39 | 7.272 | p < 0.001 | 1234 | 348.20 | 3.543 | p < 0.001 | 3200 | 183.67 | 17.420 | p < 0.001 | 3086.73 | 371.56 | 8.307 | p < 0.001 |
| R2 | 0.740 | 0.657 | 0.608 | 0.813 | ||||||||||||
Table 7.
Electrical and thermal energy unit costs according to climate zones in Poland.
| Variables | Climate Zone | p | |||
|---|---|---|---|---|---|
| I | II | III | IV | ||
| Mean (SD) Median (Q1–Q3) | |||||
| EECP (PLN/pateint) | 85.68 (169.29) 56.29 (43.89–75.53) | 73.40 (82.77) 54.79 (40.89–74. 70) | 84.15 (174.46) 54.57 (42.05–77.11) | 60.57 (30.35) 52.51 (39.31–69.02) | NS |
| EECD (PLN/day) | 12.13 (9.76) 10.21 (7.65–13.90) | 11.34 (7.12) 9.68 (7.63–12.20) | 13.10(39.46) 9.01 (6.58–12.54) | 10.21 (5.47) 8.84 (6.84–11.64) | p < 0.001 |
| EECS (PLN/surgery) | 1338.04 (16,068.53) 158.07 (103.77–253.68) | 1299.32 (13,898.40) 170.78 (122.16–251.48) | 264.44 (887.92) 168.30 (113.38–263.94) | 2249.96 (30,949.91) 153.37 (109.23–232.67) | NS |
| TECP (PLN/pateint) | 80.59 (143.44) 60.48 (35.05–89.08) | 76.04 (197.24) 53.12 (34.11–77.01) | 80.25 (153.91) 54.76 (34.22–80.84) | 69.53 (38.70) 59.55 (48.53–77.14) | p< 0.001 |
| TECD (PLN/day) | 11.81 (8.17) 10.85 (5.91–16.15) | 10.21 (9.38) 9.381 (5.95–13.00) | 11.61 (29.80) 8.74 (5.46–12.57) | 11.97 (7.10) 10.25 (8.01–13.77) | p< 0.001 |
| TECS (PLN/surgery) | 1 632.21 (19902.77) 161.75 (43.89 –278.65) | 543.39 (4355.41) 151.78 (92.01–257.51) | 252.72 (987.43) 153.68 (83.20–265.71) | 1496.19 (18,335.59) 177.87 (120.75–278.32) | p< 0.001 |
Publisher’s Note: MDPI stays neutral with regard to jurisdictional claims in published maps and institutional affiliations. |
© 2021 by the authors. Licensee MDPI, Basel, Switzerland. This article is an open access article distributed under the terms and conditions of the Creative Commons Attribution (CC BY) license (https://creativecommons.org/licenses/by/4.0/).
Share and Cite
MDPI and ACS Style
Cygańska, M.; Kludacz-Alessandri, M. Determinants of Electrical and Thermal Energy Consumption in Hospitals According to Climate Zones in Poland. Energies 2021, 14, 7585. https://0-doi-org.brum.beds.ac.uk/10.3390/en14227585
AMA Style
Cygańska M, Kludacz-Alessandri M. Determinants of Electrical and Thermal Energy Consumption in Hospitals According to Climate Zones in Poland. Energies. 2021; 14(22):7585. https://0-doi-org.brum.beds.ac.uk/10.3390/en14227585
Chicago/Turabian StyleCygańska, Małgorzata, and Magdalena Kludacz-Alessandri. 2021. "Determinants of Electrical and Thermal Energy Consumption in Hospitals According to Climate Zones in Poland" Energies 14, no. 22: 7585. https://0-doi-org.brum.beds.ac.uk/10.3390/en14227585
Note that from the first issue of 2016, this journal uses article numbers instead of page numbers. See further details here.