
Relationship among Economic Growth (GDP), Energy Consumption and Carbon Dioxide Emission: Evidence from V4 Countries


Department of Economics and Accounting, Faculty of Economics, West Pomeranian University of Technology, 70-310 Szczecin, Poland
*
Author to whom correspondence should be addressed.
Energies 2021, 14(22), 7734; https://0-doi-org.brum.beds.ac.uk/10.3390/en14227734
Submission received: 15 October 2021
/
Revised: 2 November 2021
/
Accepted: 5 November 2021
/
Published: 18 November 2021
(This article belongs to the Special Issue The Role of Spatial Policy Tools in Renewable Energy Investment)
Abstract
:The main objective of the research was to determine the long-term and short-term correlation between CO2 emissions per capita, energy consumption per capita, and the level of economic growth of GDP per capita in the V4 countries. These countries, being EU members since 2004 and previously being in the sphere of influence of the Soviet Union, have introduced a number of economic reforms, but in the area of climate protection, including decarbonization, they struggle with many problems, as their economies are largely dependent on energy from non-renewable resources. The results of the research are varied, but the authors confirmed, especially in the case of Poland, the long-term correlations between the studied variables. In the short term, such interdependencies also occurred, especially between the level of energy consumption per capita and the level of CO2 emissions.
1. Introduction
The economic development of any country in the world is conditioned by sufficient and constant access to relatively inexpensive energy [1,2,3]. On the other hand, the energy sector is one of the main sources of greenhouse gas emissions, including CO2, and therefore requires significant investment outlays to ensure climate protection and pursue a policy of sustainable development [4]. The problem of global warming, as well as sustainable development, has received a lot of attention in recent years in political, economic and scientific circles, and has also become the subject of discussions within international institutions.
Climate change caused by excessive CO2 emissions has also become one of the greatest challenges and priorities of the European Union, being an area of interest for the EU’s energy policy. Since greenhouse gas emissions, including carbon dioxide (CO2), are considered the key source of global warming, the United Nations (UN), the European Union (EU), and countries of the world are taking different measures to reduce CO2 emissions [5,6,7].
In the last decade, the long-term policy of the EU has revealed tendencies related to the pursuit of increasing energy efficiency and climate protection, combined with the expectations of sustainable economic development. These actions are to be implemented by changing the share of fossil fuel energy production in favor of renewable sources (RES) [8,9].
Guaranteeing climate-neutral energy security is of great importance, especially in the new EU member states, where the energy transformation began later than in Western Europe. On the one hand, states that joined the EU after 2004 are trying to get closer to economically with countries such as Germany, France, and Denmark, however, climate challenges may result in the need for significant investments and a slowdown in economic growth.
The group of countries facing the challenge of energy transformation includes, inter alia, countries of the Visegrad Group (V4), which are characterized by comparable development conditions [10,11]. Their level of sustainable energy development differs greatly from that of other Member States of the EU. Achieving the goals of the EU climate strategy requires these countries to meet a number of capital-intensive activities and changes in the socioeconomic area [12]. This is due to the significant dependence of the V4 economies on energy produced from fossil fuels, and the transformation to other energy sources is a very big financial challenge for them [13].
The V4 energy sector is based mainly on fossil fuels due to historical aspects, including the significant availability of coal, especially in the Czech Republic and Poland. Political changes started at the end of the 1980s to leave the sphere of Soviet influence and transform from a centrally planned economy to a market economy [14].
This process not only reunited these countries with Western Europe through the EU and NATO integration structures, but also influenced the rapid rate of economic development, which brought them to the sixth economic power in Europe [15].
Geopolitical changes, neighborhood cooperation, and similar economic goals allowed the V4 countries to expand into new markets and take advantage of international trade [16], which directly increased the value of foreign trade [17,18]. These countries are characterized by high dynamics of economic growth, the level of which is subject to economic fluctuations [19,20]. It should also be noted that along with the economic changes made in the last 30 years, the economies of the V4 countries also recorded a drop in emissions (more than three times less than in 1991). Despite this, the emissivity of their economies is still 35% higher than the average emissivity of the EU-15 countries [15].
However, the process of reducing greenhouse gas emissions was not motivated by environmental aspects but by economic changes and the bankruptcy of enterprises, mainly in the heavy industry sector. However, the changes indicated did not solve the problem of CO2 emissions and decarbonization in the V4 countries [21]. Nevertheless, as indicated [22], although there are significant discrepancies between the energy strategies of the V4 countries, these countries have many common features that largely coincide with the EU’s goals. At the same time, the progress in the transformation of the energy sector.
In 2020, the V4 countries, according to the World Energy Council (WEC) report, were recognized as one of the safer energy countries [23]. Among the V4 countries, in terms of the ability to provide sustainable energy, according to the Trilemma Index 2020 for 128 countries, Poland ranked 41st, Hungary 12th, the Czech Republic 13th, and Slovakia 20th. The share of energy from renewable sources (RES) in the V4 countries is also important for energy transformation. The share of RES in these countries strongly differs from countries in the so-called old EU. Although from 1992 to 2019 this share increased (by 631.11% in Slovakia, 615.81% in Poland, 320.11% in Hungary, and 282.11% in the Czech Republic), it is still lower by 10.30% than in the countries that joined the EU before 2004 (Figure 1). At the same time, the average annual growth rate of the share of RES in the individual V4 countries was similar for all V4 countries and amounted to an average of 6.71%, compared to 3.43% in the countries of the old EU. However, despite the higher pace of growth, the V4 countries still obtain significantly less energy from renewable sources, which will be a major challenge in meeting the conditions of the European Green Deal and will also require huge financial resources to achieve climate neutrality by 2050.
Taking into account the above premises, it has become justified to analyze, taking into account quantitative methods, the extent to which the energy transformation will affect the economic situation (economic growth and development) and the level of the reduction of CO2 emissions and energy security of the V4 countries. The answer to this question requires defining detailed relationships between the rate of economic and development growth, the level of energy consumption, and environmental pollution. The formulated conclusions may constitute the basis for future activities within the V4, as well as for the formulation of strategies for the implementation of the Green Deal.
The article’s main aim was to investigate the cointegration and long-term and short-term interdependencies between CO2 emissions, energy consumption, and level of economic growth (GDP) in the V4 countries in 1992–2015 and to indicate future prospects. In order to assess the relationships between these three variables, the autoregressive distributed lag (ARDL) was used to determine the nature of the relationship, and the VAR (short-term) and VECM (long-term) models were estimated, indicating the direction of the variables. The authors assumed the following hypotheses:
Hypothesis 1 (H1).
In the long run, there were uni-directional or bi-directional relationships between GDP per capita and carbon dioxide emissions per capita.
Hypothesis 2 (H2).
In the long run, there were uni-directional or bi-directional relationships between GDP per capita and of energy consumption per capita.
Hypothesis 3 (H3).
In the long run, there were uni-directional or bi-directional relationships between the level of energy consumption per capita and carbon dioxide emissions per capita.
Hypothesis 4 (H4).
In the short run, there were uni-directional or bi-directional relationships between the level of energy consumption per capita and carbon dioxide emissions per capita.
The article is divided into four parts. In the first section, the literature in the analyzed area was reviewed. The second part presents the research methods and the data used. The third part presents the results of the research and discusses the obtained results. The last part is a conclusions.
2. Literature Review
Regardless of the well-known theories of economic growth, which aim to search for factors generating this growth, contemporary research on the interdependencies between these factors should be carried out with the use of econometric modeling. Econometric estimation of causality between economic variables has more than fifty years of history if the turning point is the publication of Granger [24].
As noted by Vera J. and Kristjanpoller W., since the beginning of the 1970s, numerous studies have shown a relationship between energy consumption and various economic categories, such as the volume of imports or changes in GDP [25] (. Pioneering research in this area includes, among others, the analyses made by Balass Kraft J. and Kraft A. and Feder [26,27,28].
Additionally, authors such as Akarca and Long [29], Yu and Choi [30], Abosedra and Baghestani [31], and Hwang and Gum [32] have presented new methods and evidence regarding the relationship between the level of energy consumption and the rate of economic growth for various world economies. As the econometric methods were improved, further studies were developed to analyze the relationship between GDP and energy, including studies conducted by Glasure and Lee [33], Stern [34], and Bhattacharya and Paul [35].
Since the first publications in the 1970s, the interdependencies between the level of energy consumption and the dynamics of economic growth have become the subject of interest in many studies and scientific publications. A review of numerous articles in this area has been prepared and classified by Payne J.E. [36,37]. On the other hand, Menegaki A.N. presented a meta-analysis of 51 studies in this area, which included all the significant results published over the last two decades, and compared them with global data from 1949. As part of the conclusions of the analyzes, he emphasized that the long-term elasticity of GDP growth in relation to energy consumption was influenced by has the econometric method used, the type of data used, and the number and type of variables. In addition, the results of the research indicated that there is still a need for research in this area, especially in developing countries, and the selection of a larger number of variables for the models [38]. In this regard, the constructed models also began to include a variable related to CO2 emissions, which was to illustrate the relationship between economic development and climate change. This was due to the development of the Kuznets Environmental Curve concept, which assumed a non-linear relationship between the level of CO2 emissions and the change in GDP [39,40]. The relationships between economic growth, energy, and environmental pollution were the subject of research in the following years, including Ang [41], Soytas [42], Jalil and Mahmud [43], Zhang and Cheng [44], Chang [45], Shahbaz and Lean [46].
Subsequent studies that were published focused on the interaction between economic growth, energy consumption, and CO2 emissions. The development of scientific research in the discussed area also contributed to the extension of the research apparatus with more and more complex econometric models. As a result, numerous scientific publications appeared, among which these works deserved attention: Apergis and Payne [47], Bartleet and Gounder [48], Arouri et al. [49], Papiez [50], Jóźwik, Gavryshkiv and Gruszecki [21], and Litavcová and Chovancová [51]. Econometric analyses of the interrelationships of variables such as GDP, CO2 emissions, and energy consumption have been carried out all over the world, covering different countries, time periods, and using more and more refined econometric methods.
New conclusions were also developed by studies conducted by Acaravci and Oztruk, on the basis of which, using Granger causality tests, a bi-directional relationship between the level of energy consumption and the level of CO2 emissions was demonstrated. An additional effect of these studies was to show that scientific interests were tilted towards the role of energy as a factor responsible for stimulating economic growth and also to study the direction of causality between these analyzed variables [52]. In addition, Kalimeris P., Richardson C., and Bithas K. have pointed to new evidence explaining the complex relationship between energy consumption and the rate of economic growth using Granger causality analysis [53]. A novelty was the research carried out by Menyah and Wolde-Rufael, who used a modified version of the Granger causality test in their works. As a result of the analysis, the authors found that there was both a short-term and long-term relationship between the studied variables, while there was a positive and statistically significant relationship between the emission of pollutants and the rate of economic growth. An additional conclusion from the research was the confirmation of the existence of uni-directional Granger causality from pollutant emissions to the level of economic growth and from energy consumption to the level of economic growth and from energy consumption was the cause of CO2 emissions [54]. Odugbesan and Rjoub, on the other hand, in addition to economic growth, CO2 emissions, energy consumption, also included the urbanization variable in examining the interdependencies in the MINT countries (Mexico, Indonesia, Nigeria, and Turkey) for econometric modeling. All of those countries showed a long-run cause-and-effect relationship from economic growth, energy consumption, and CO2 emissions to urbanization [55].
Other researchers, using data for different countries and economic areas, through the use of methods related to the study of causality in the Granger sense, showed the existence of couplings of different directions of action, between economic growth, energy consumption, and CO2 emissions [56,57,58,59,60].
The presented review of the current state of research shows that there is a fairly large collection of studies and analyses related to the issues raised, developed from the use of different data sets, econometric methodology, research periods, and countries and regions of the world. At the same time, a limited number of studies conducted for the Visegrad Group countries is noticeable. The review of the current state of considerations indicates that only single papers dealing with the V4 countries have been published, which include, inter alia, articles by the authors Krkošková [61], Streimikiene and Kasperowicz [62], Simionescu [63]. Papież, using the data for the years 1992–2010, showed the existence of long-term relationships between the level of economic growth, CO2 emissions, and the level of energy consumption (panel analysis) [50].
Therefore, it became justified to examine the multidirectional relationships between the level of economic growth, energy consumption, and CO2 emissions in the V4 countries using econometric models and using relatively up-to-date data. This is due to the fact that the traditional econometric models used in the literature review often did not take into account the interdependence of the variables (bi-directional relationship). In order to capture the indicated interdependencies, a new research approach was applied, which so far has been rarely used for the Visegrad Group countries.
For this purpose, the following model was used in this study: VECM and VAR (vector auto regressive) developed, among others by Ch. A. Sims [64], which are an alternative to the classical multi-equation model with interdependent equations. The methods used are based on the work of Sims, who indicated that VAR models could be used in three different areas:
- (1)
- forecasting economic time series;
- (2)
- construction and evaluation of economic models;
- (3)
- assessing the consequences of alternative economic policy actions.
In addition, this work supplements the current state of research with new results for the countries included in the Visegrad Group. These countries, due to their historical, economic and political conditions, after joining the EU (2004), faced the conditions of the market economy and, to a varying degree, coped with these changes.
3. Data and Methods
As part of the research, the relationship between economic growth (GDP per capita), CO2 emissions per capita, and the level of energy consumption per capita in the V4 countries were analyzed. Time series for the surveyed countries covered the period 1992–2015, which was imposed by the availability of data for V4 countries (N = 24 for each country). The data used for the analysis was published annually, which was related to the frequency of the statistical information provided. The beginning of the research period was determined by the availability of data for the countries in question. The first values of the variables used were published in 1992, while the last complete set covered 2015 at the time of preparing the publication.
The source of the data used in the analysis were the resources of the OECD database. Statistical data analysis was prepared using the R language and Rstudio software, version 1.4.1106, while the stationary tests, VAR and VECM models were prepared using the Gertl software, version 2021b.
In the first stage of the research, the basic descriptive statistics for the tested time series were compiled (Table 1). The analysis of basic statistics showed that the obtained results were varied, which proved different conditions in the countries studied. These differences were demonstrated by the high value of the standard deviation obtained for the analyzed data.
The first analyzed variable was CO2 emission (in metric tons per capita), the time series of which is presented in Figure 2. In the group of analyzed countries, the largest producers of CO2 per capita were the Czech Republic and Poland. The lowest CO2 emission among the V4 countries was recorded in Hungary. At the same time, there was a noticeable decrease in CO2 emissions over the studied period in all analyzed countries. In the period 1992–2015, CO2 emissions per capita decreased to the greatest extent in Slovakia (a decrease by 30.75%), while the lowest in Poland (decrease by 18.68%). The smaller drop in CO2 emissions in Poland was related to the fact that it is the only country in the study that does not have a nuclear power plant and generates energy from burning fossil fuels, mainly coal. In the remaining countries of the V4 group, nuclear power plants were operated in the analyzed period, while RES had a similar share in the energy balance.
In the analyzed period, the Czech Republic remained the largest consumer of energy per capita (kg of oil equivalent per capita), and Poland the smallest. In the years 1992–2015, the highest decrease in energy consumption in the analyzed countries was recorded in Slovakia (by 11.93%), while the lowest was in Hungary (a decrease by 1.95%). At the same time, in the long term, a downward trend was noticeable in all countries (Figure 3).
Among the surveyed countries, the highest increase in gross domestic product per capita was recorded in Poland (an increase of 154.64% in 1992–2015) and Slovakia (an increase of 145.44%). GDP per capita in Hungary and the Czech Republic increased in the analyzed period by 171.89 and 174.18%, respectively. Selected countries in the years 1992–2015 were characterized by stable growth of GDP per capita. The most stable rate of GDP growth was in Poland, where the average annual growth rate was 4.16% and in Slovakia 4.03% annually. The lowest GDP growth took place in Hungary, where the average annual rate was 2.42% (Figure 4).
Data on the correlation between the studied variables are presented in Table 2 and visualized in Figure 5. The results show that there is a relationship between the studied variables. For the CO2 variable and GDP per capita data, the correlation coefficient took negative values. Additionally, a negative correlation occurred in the case of energy consumption and GDP per capita in Slovakia, which was the only such observation in the analyzed group of countries. There was also a positive correlation between the level of energy consumption and CO2 emissions; in the Czech Republic, the index had the lowest value (0.265), while the highest value was the index for Poland (0.655) and Slovakia (0.759).
4. Methodology
According to the works of Odugbesan and Rjoub [55] and Litavcová and Chovancová [51], the variables GDP per capita and the level of energy consumption were logarithmized and the following abbreviations used: l_Country_GDP, l_Country_E, and the level of CO2 consumption, as Country_CO2 (where Country was a prefix for the analyzed country: (CZ, Czech Republic; PL, Poland; SL, Slovakia; HU, Hungary).
In the first stage, the analyzed variables were tested for stationarity. According to the review of the available literature, long-term versions of economic models should correspond to the stationary state [65,66].
The a priori presupposition that the studied variables are stationary may be connected with the problem of apparent regression, as the time series of economic quantities are usually non-stationary. Time series stationarity was tested using many statistical tests. The authors used the extended Dickey-Fuller test (ADF) and the Kwiatkowski–Phillips– Schmidt– Shin (KPSS) test [67,68,69].
According to the ARDL limit test proposed by Pesaran et al. [70], the authors ensured that none of the series used in the study were integrated I (2) by carrying out stationarity tests.
In order to determine the cointegration between the analyzed variables, the ARDL (p, q1, q2) model was used, which was written as:
where “” is a vector, the variables are allowed to be i(0) or i(1) or cointegrated; β and δ are coefficients; γ is the constant; i = 1,…, k; p and q are optimal lag orders; ∈it is a vector of the error terms.
For each of the V4 countries, we estimated three ARDL models, for each of the three variables: l_GDP, CO2, and l_E in the position of the explained variable. In a situation where there is cointegration according to Pesaran, the model could be written as follows [70]:
If the cointegration relationship is confirmed, the model can be analyzed by an error correction model [71]. The error-correction form of the ARDL model separates the adjustment coefficient to deviations from long-run equilibrium, long-run coefficients, and short-run coefficients.
After determining the type of dependence, the authors, using VAR and VECM modeling in Gretl, estimated the equations and developed dependency schemes.
5. Results and Discussion
Despite the strong relationship between the variables, the authors calculated the stationarity of the analyzed data to ignore the apparent regression. Information on the level of data integration was necessary for the application of the ARDL model because the study of long-term relationships with this model is based on the assumption that the variables should be first degree I(1) or zero degree I(0) integrated series. The results of the Augmented Dickey–Fuller (ADF) and Kwiatkowski–Phillips–Schmidt–Shin (KPSS) tests are presented in Table 3 and Table 4.
The results of the two tests confirm that the analyzed variables (except for the KPSS test for the variables l_HU_E and l_PL_E) were integrated in the first degree I(1). Stationarity tests enabled the use of ARDL model analysis (bound testing). The Pesaran, Shin, and Smith Cointegration Test was used to verify the hypothesis. For the purposes of the test, the following hypotheses were adopted:
Hypothesis 5 (H5).
There is no cointegration between the dependent variable.
Hypothesis 6 (H6).
There is a cointegration between the dependent variable and the independent variables.
As part of the indicated test, the critical values of the regressors I(0) and I(1) were estimated at the significance level of 0.05. Where the value of the F > I(1) statistic, the hypothesis H0 should be rejected. For each of the studied countries, it was checked whether the H0 hypothesis was true when individual variables were dependent variables. Table 5 contains the results of the F-test and the lower and upper critical value of the F-statistic at the level of 5% (according to the methodology of Kripfganz and Schneider [72,73].
The obtained results indicated that cointegration occurred in the case of the studied variables for Poland and Hungary. For Poland, the test showed the existence of a relationship when the dependent variable was the level of CO2 emissions per capita and the other independent variables. In the second case, cointegration occurred when energy consumption was the dependent variable, and CO2 and GDP were the independent variables.
In the case of Hungary, cointegration occurred only when the dependent variable was the level of CO2 emissions, and the exogenous variables were GDP and energy consumption per person. The conducted test showed only short-term relations in the case of the Czech Republic and Slovakia.
In the next stage of the study, the long-term connection between individual variables was estimated. The long-term connection was investigated within the vector model of the VECM error correction s.
The results of the estimation are presented in Table 6 and Figure 6. Among the analyzed variables that contributed to economic growth in the V4 countries, only in the case of Poland, CO2 emissions per capita and energy consumption per capita had a long-term relationship with economic growth. No long-term causality was identified for Slovakia; The ECT was −0.04, but the parameter is not statistically significant. CO2 emissions per capita did not affect GDP in the Czech Republic, and in the case of Hungary, only the level of energy consumption per capita had an impact on the GDP level.
The ECT coefficient defined as a coefficient of a stable long-term relationship for Poland was negative; it was −0.09 and was significant at 0.01, which indicates the convergence of the model to the long-term equilibrium. ECT was 9% and this represents the speed of the adjustment. Therefore, this implies that the GDP per capita for Poland converged to the long-term equilibrium by 9% in one period with the speed adjustment via the CO2 per capita and energy consumption. In the case of Poland, a uni-directional short-term relationship was also shown, indicating the impact of the variables: energy consumption per capita and CO2 emissions on the level of GDP per capita.
Given the results obtained, a prudent economic policy should be pursued to reduce energy consumption and CO2 emissions without detriment to economic growth. The Polish economy, which is highly dependent on energy production from fossil fuels (mainly hard coal and lignite), contributes to significant CO2 emissions.
However, it should be noted that this result is below the OECD average, where it averaged 10 tonnes per capita in 2021. In 2012, Poland exceeded the OECD average in terms of renewable energy production—in Poland it was around 8.5 percent of all generated energy, and in the entire OECD—about 8 percent, but it is below the average for the EU countries.
The results indicate that the decarbonization of the Polish economy will be a huge challenge requiring numerous expensive investments, because natural conditions are not conducive to the production of energy from water turbines, and the number of sunny hours is only 1.4–1.9 thousand annually. An additional factor complicating the transformation are the small natural gas deposits.
Taking into account geopolitical factors and the need to diversify sources, this will have an impact on the increase in the cost of obtaining the raw material [74].
Poland also does not have any nuclear power plants, which is a difference compared to other V4 countries. Despite many attempts to build nuclear energy in Poland, all projects are still in the concept phase. All these factors mean that the Polish energy sector is the worst in terms of the use of ecological resources compared to the countries of the V4. In 2018, the share of coal in electricity production exceeded 77% (in 2020, 73%), compared to 7% obtained from natural gas combustion. Wind, solar and other renewable energy sources together accounted for 13%, and other sources for 3%. Emissions in Poland arise mainly in five sectors and areas of the economy: industry, transport, buildings (e.g., heating), agriculture, and energy. Achieving carbon neutrality will require additional investments, the value of which over the next 30 years will cost nearly EUR 380 billion (EUR 10–13 billion annually), representing 1–2% of GDP [74].
However, decarbonization may be an opportunity for the Polish economy, mainly by improving the trade balance, creating new jobs (development of infrastructure, low-emission technologies), and in the long term, it may increase the innovativeness of the economy. It should also be noted that the Polish government adopted a resolution: “Energy Policy of Poland until 2040”, which provides, inter alia, commissioning of a nuclear power plant with a capacity of approx. 1–1.6 GW by 2033, and the energy transformation framework is based on three pillars: a fair transition, a zero-emission energy system, and good air quality.
In the case of Hungary, only the long-term relationship was confirmed, suggesting the impact of the energy level per capita on economic growth. ECT was −0.07, which represents the speed of the adjustment. This means that Hungary’s per capita GDP converged to the long-run equilibrium by 7% in one period with the speed adjustment via the energy consumption. For a short period of time, for Hungary and Slovakia, the impact of CO2 and energy consumption on the level of GDP per capita was not confirmed, while the conclusions were completely different in the case of the Czech Republic, where both analyzed variables had an impact on the level of economic growth.
The results of the study also showed interesting relationships between the interaction of the level of energy consumption and CO2 emissions. In the long run, only in the case of Poland was the bi-directional correlation confirmed. The ECT coefficient (endogenous CO2 variables) was −1.17 and was significant at 0.01, which indicates the model’s convergence to long-term equilibrium. ECT was 117%, and this represents the speed of the adjustment. Therefore, this implies that CO2 per capita for Poland converged to the long-term equilibrium by 117% in one period with the speed adjustment via the GDP per capita and energy consumption.
The ECT coefficient (endogenous E variable) was −0.12 and was significant at 0.01, indicating the model’s convergence to long-term equilibrium. The error correction term (ECT) was 12%, and this represents the speed of the adjustment. Therefore, this implies that EC per capita for Poland converged to the long-term equilibrium by 12% in one period with the speed adjustment via the GDP per capita and CO2. In the short term, correlations between CO2 levels and energy consumption were confirmed for the three analyzed countries: Poland, Hungary, and Slovakia. For the Czech Republic, only a uni-directional correlation from CO2 to E has been demonstrated.
The obtained results are influenced by the structure of energy production in individual countries. In Hungary, the RES accounts for a small share of electricity generation and is dominated by biomass producers. Unlike Poland and the Czech Republic, conventional electricity generation comes mainly from nuclear power (49.3%), natural gas (about 25%), and coal (8.5%) [75]. In addition, Hungary obtains approximately 10% of the electricity it produces from renewable energy sources (2018). Hungary has the sixth-lowest greenhouse gas emissions per capita in the EU due to a favorable energy mix, including nuclear energy, gas, and a high rate of electricity imports [76].
As for the impact of the level of economic growth on CO2 and E, the results presented in Table 6 show that only in the case of Poland did economic growth have an impact on CO2 and E in the long term. No long-term causality was identified for Hungary and Slovakia. Economic growth had a long-term effect on CO2 emissions in the Czech economy. This economy also showed a short-term, uni-directional relationship in terms of the impact of the GDP variable on the variables: CO2 and E. The Czech Republic also had the highest CO2 production per capita (over 9.7 tonnes in 2016) and the highest energy generated per capita (3.86 kg per capita). The value of the indicated variables was related to the highest level of GDP per capita among V4 countries.
In terms of the structure of electricity production, the Czech Republic, like Poland, based its energy mix on energy derived from the combustion of fossil fuels (hard coal and lignite), which generated 47% of the energy produced. Nuclear energy accounted for 35%, and renewable energy for 12%. At the same time, the plans assumed by the Czech government focus on wind energy, which should cover 1/3 of the country’s electricity demand by 2030 [77].
Thus, as in the case of the Polish economy, the Czech Republic will have to deal with the closure of coal-fired power plants, the decommissioning of mining, and significant investments in renewable energy in the coming years [78].
Slovakia, like the Czech Republic, is considered to be one of the most energy-consuming economies in the EU countries. However, unlike Poland and the Czech Republic, Slovakia covers 55% of its electricity needs through nuclear power plants, 21% through coal-fired power plants, 14.4% hydroelectric power plants, and 8.9% through the use of renewable sources [79].
6. Conclusions
For the most improving countries, and in fact, all countries that need to grow better both energy access and affordability, deploying the right strategies and making the suitable energy investments to support economic growth is crucial.
The results of the analysis using the ARDL model indicate long-term relationships between carbon dioxide emissions per capita and other model variables (GDP per capita, energy consumption per capita) only in the case of Poland and Hungary, and the long-dated relationship between the energy level and other variables only in case of Poland.
In addition, the results of the research after the evaluation of the VECM model are different, which proves that the analyzed economies of the V4 countries and their energy policy are significantly differentiated. Although these countries had a similar economic structure after 1989, they were characterized by a different diversification of energy production sources. Poland, which is the largest of the V4 countries in terms of area and population, has not built a nuclear power plant. In other V4 countries, nuclear energy was already present before 1989, so after the economic transformation, these countries were able to base energy production mainly on the basis of this technology. Poland, on the other hand, still had to base the generation of electricity on the basis of conventional, and at the same time, highly polluting sources. These factors meant that only for Poland is there a bi-directional long-dated correlation between the analyzed variables.
The results obtained in the study confirmed the assumed hypotheses for Poland: H1, H2, and H3. In the short term, bi-directional causality has been found between CO2 and E, while uni-directional causality is from energy consumption and CO2 emissions towards economic upturn. Hence, the H4 hypothesis was also confirmed.
Estimating the long-term causation for the Czech Republic shows a long-term uni-directional causal relationship from economic growth to CO2. Thus, the H1 hypothesis was confirmed. The hypotheses H2 and H3 were not confirmed. At the same time, a short-term uni-directional causality running from E and CO2 to GDP and from CO2 to E was found, confirming the H4 hypothesis.
In the case of Hungary, only a uni-directional long period relationship from E to economic growth (GDP per capita) was found. Thus, confirming the assumed hypothesis H2. At the same time, a short-term bidirectional causality between E and CO2 was found, as confirmed by the H4 hypothesis.
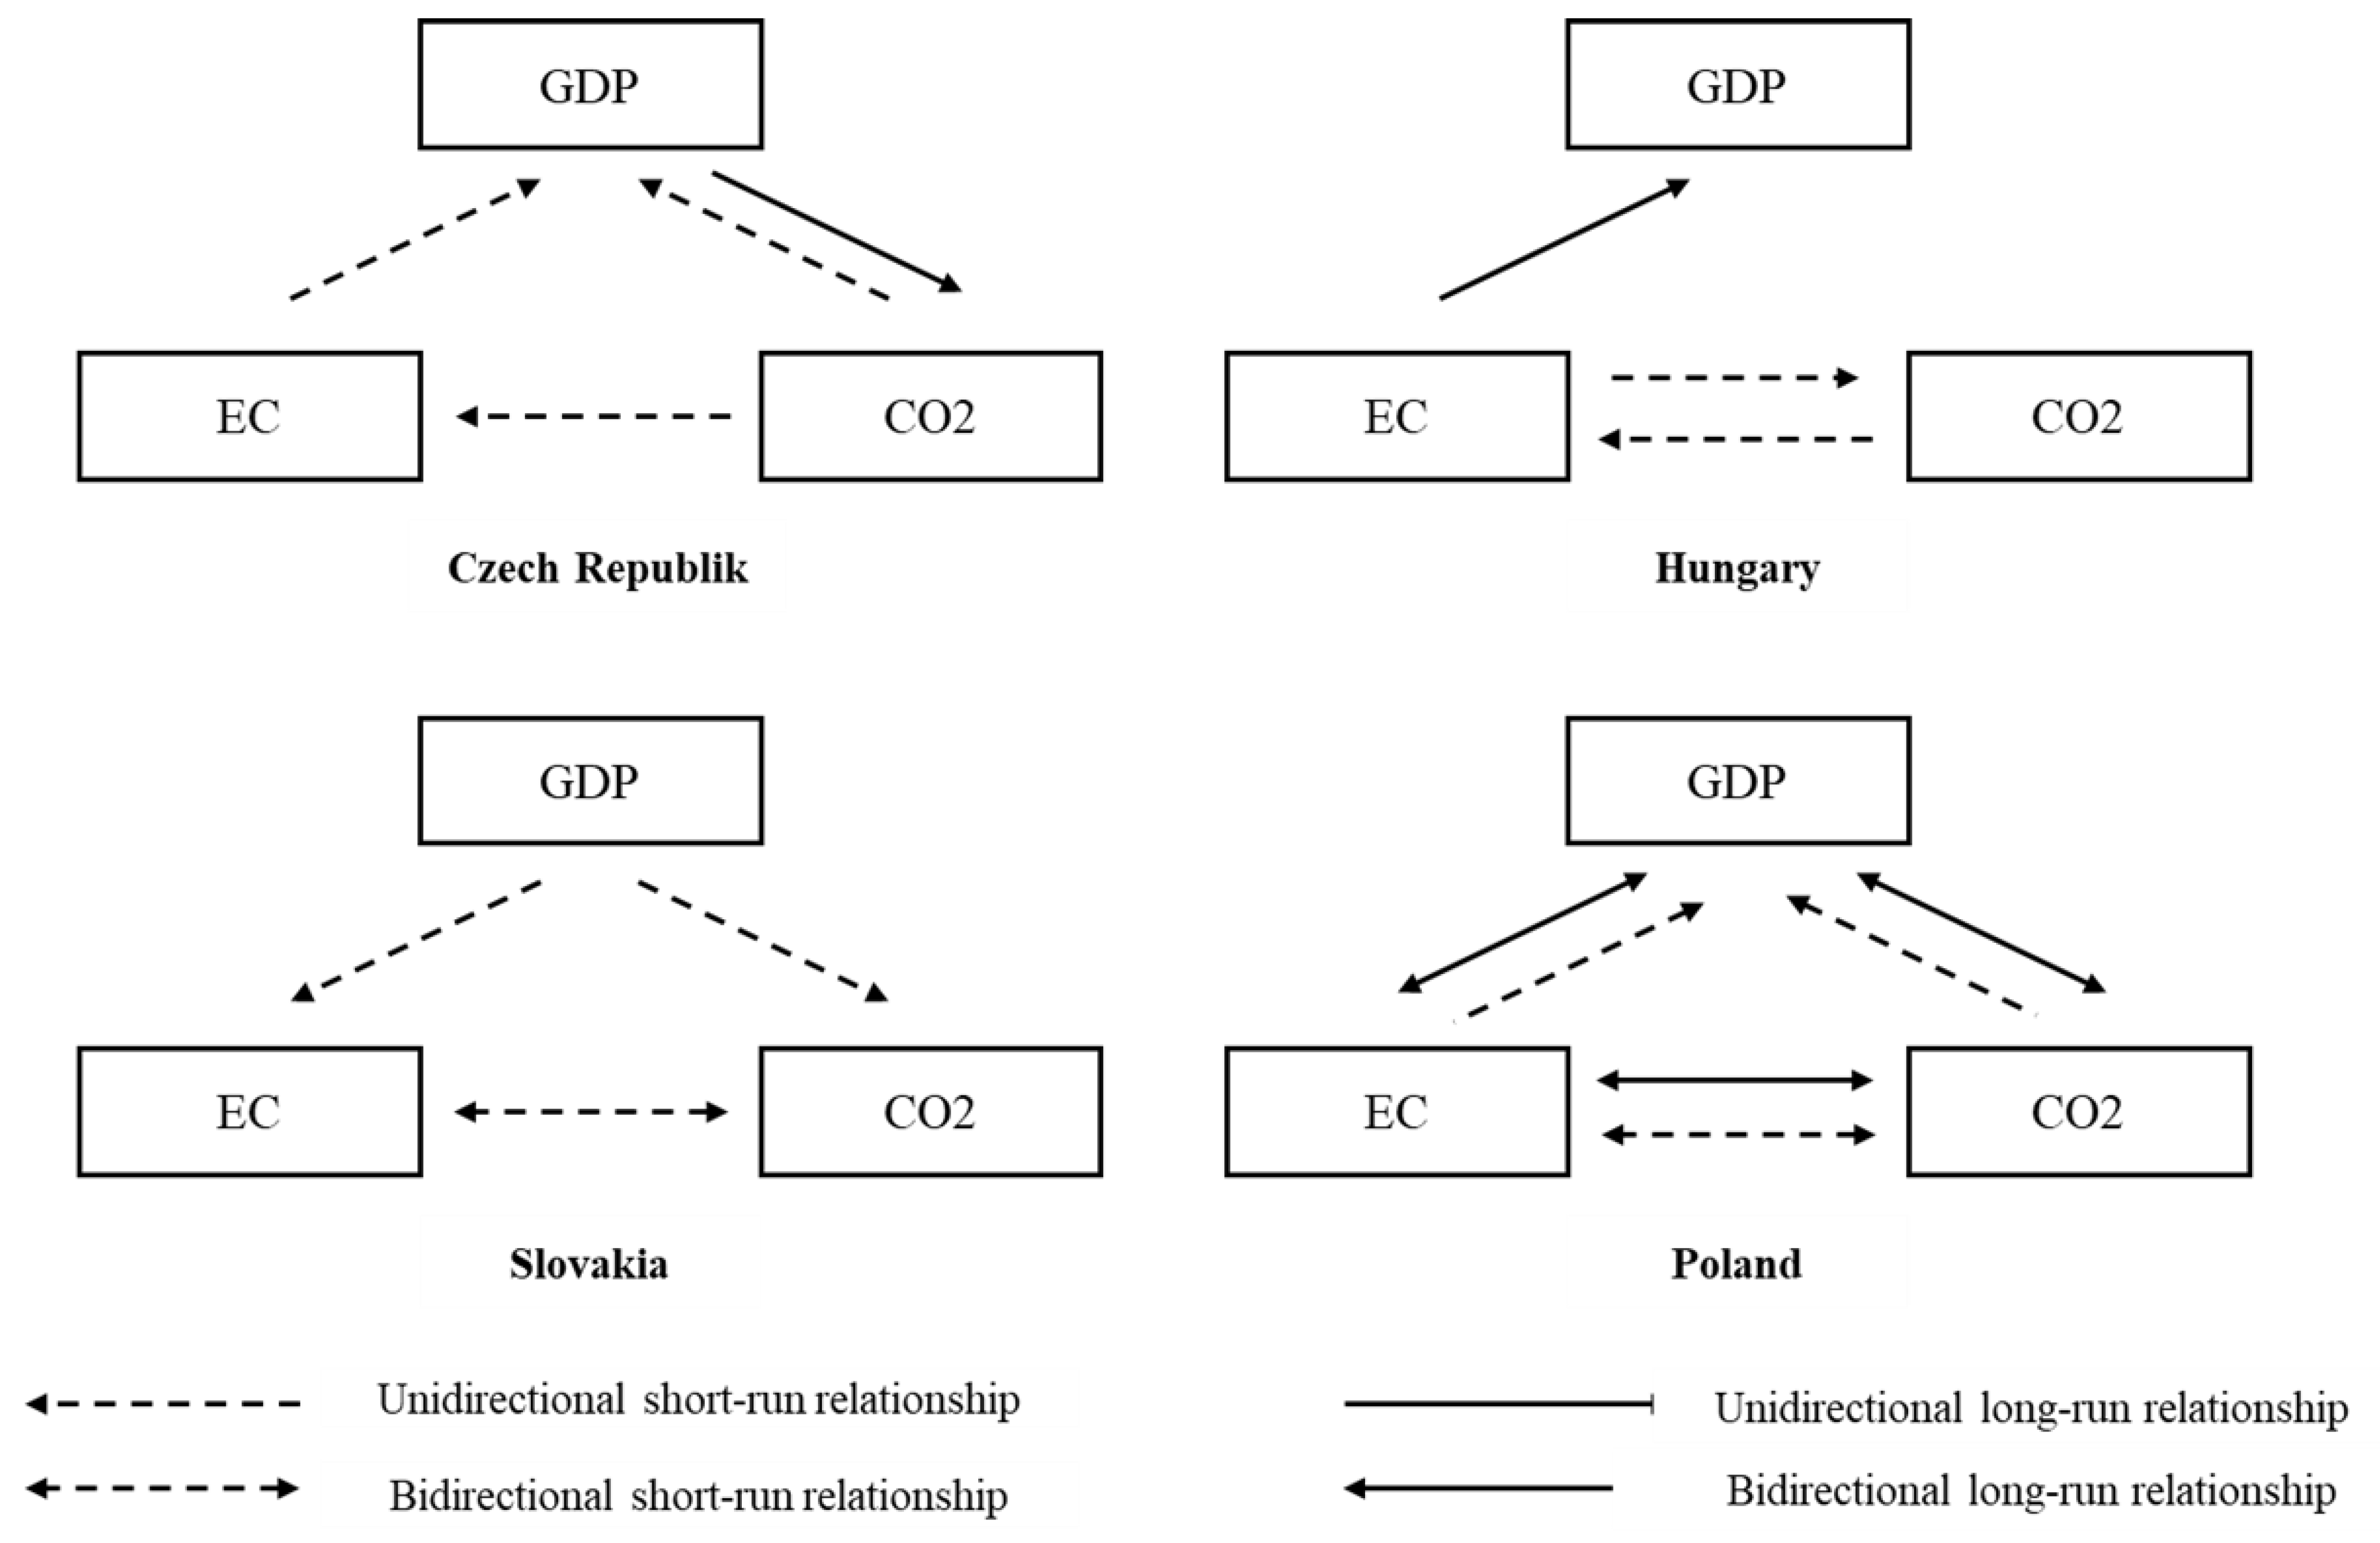
For Slovakia, no long duration relationship was found between the studied variables. At the same time, a short-term bidirectional causality between E and CO2 and a uni-directional causality from GDP to E and CO2 was found. Therefore, only hypothesis H4 was confirmed. The range of long-run and short-run relationships for individual countries is presented in Figure 6.
Summarizing the results of the research conducted by the authors on economic upturn, the level of energy consumption per capita and environmental degradation expressed as the level of CO2 consumption per capita in the V4 countries, allowed for the formulation of the following conclusions: the differentiation in both the level of economic growth and the interdependence between the studied variables was shown; the economic growth of countries resulted, inter alia, from changes in the structures of economies and integration with the EU, where in recent years it was higher than the countries of the “old” Union; V4 countries still have high CO2 emissions compared to other EU Member States and the EU average; long-term cointegration connection between CO2 emissions and GDP were confirmed in the case of Poland (bi-directional relationship) and the Czech Republic (uni-directional relationship), while the relationships between the E level and GDP in the case of Poland (bi-directional relationship) and Hungary (uni-directional relationship) may determine both the economic growth to transformation in the energy sector, but also the desire to reduce greenhouse gas emissions may affect the rate of economic growth. In the long term, for Poland, there was also a bi-directional relationship between CO2 and E; studies of the short-term impact of GDP per capita on CO2 emissions per capita and GDP per capita on energy consumption per capita indicate a causal relationship only in the case of Slovakia. In the case of Poland and the Czech Republic, the short-term relationship runs from CO2 to GDP per capita and from E to GDP per capita. No short-term relationship has been confirmed for Hungary; the short-term bi-directional correlation between the level of CO2 emissions and the level of energy per capita was confirmed for three V4 countries (Poland, Slovakia, Hungary). In the case of the Czech Republic, a uni-directional relationship was confirmed, in which CO2 emissions influenced the consumption of electricity.
The varied results of the research for the V4 countries, in relation to other authors, indicate the need for further analyzes, also with the inclusion of additional variables and the latest statistical data. The results obtained should also be constantly confronted with the changing goals of climate policy, the decarbonization process, and the global conditions for the functioning of economies. It is also particularly important to monitor changes related to the economic recovery resulting from the elimination of the effects of the global COVID-19 pandemic. These transformations may affect the obtained results in the future, therefore, research in the area discussed in this article should be constantly developed.
The results lead to the conclusion that solving the problem of environmental degradation while ensuring a high rate of economic growth requires individualized policies in individual countries, as each country has developed its priorities, which are the result of its geographical location, the abundance of mineral resources (large coal resources in the Czech Republic and Poland), the structure of the economy, etc.
The issue of reducing energy consumption and achieving the goals of decarbonization with a relatively high rate of economic growth is that it directly affects all EU Member States. Despite the regional differentiation of the V4 countries, it is necessary to formulate and implement an (also) integrated policy that emphasizes the economic prosperity of the EU, but at the same time gives an opportunity to protect the environment and an efficient energy system. There are also large variations in renewable energy across the countries studied. In nations such as the Czech Republic and Hungary, the environmental awareness of the inhabitants is high, which translates into an increase in pro-ecological investments. In Poland and Slovakia, public opinion is less favorable to investments in renewable energy, which contributes to the strong position of the mining industry [80].
A chance for the V4 countries are the EU funds for investments. The decarbonization policy will require not only significant investments, but also the complete elimination of hard coal and lignite mining. In the short term, this will shift into a slowdown in economic growth and an increase in the cost of living of households. Therefore, it is important to prepare appropriate strategies in advance, which will reduce the negative effects of the transformation. The V4 countries, being EU members, should therefore use the potential to change and diversify energy sources. As shown by the data relating to Western European countries, the long-term energy transformation contributes to the improvement of energy efficiency, modernization of infrastructure, and development of renewable energy sources. At the same time, these changes can be a driving force for the next decades, ensuring long-term economic growth through sustainable development.
The most limiting factor in that article was the short time of the time series. In addition, due to the fact that the authors used the data of official statistics, it was possible to obtain complete and comparable data for the analyzed countries to 2015. In the future, as longer time series become available, it would be desirable to conduct research covering longer periods. Future research should also take into account other factors that have emerged in recent years and whose impact on the data will not be visible until the future.
Author Contributions
Conceptualization, data curation, writing—original draft preparation, supervision, J.M. and B.S.; methodology, J.M.; software, validation, formal analysis, J.M. and B.S.; investigation, resources, writing—review and editing, J.M., B.S.; visualization, B.S. All authors have read and agreed to the published version of the manuscript.
Funding
This research received no external funding.
Institutional Review Board Statement
Not applicable.
Informed Consent Statement
Not applicable.
Conflicts of Interest
The authors declare no conflict of interest.
References
- Fuso Nerini, F.; Tomei, J.; To, L.S.; Bisaga, I.; Parikh, P.; Black, M.; Borrion, A.; Spataru, C.; Castán Broto, V.; Anandarajah, G.; et al. Mapping synergies and trade-offs between energy and the Sustainable Development Goals. Nat. Energy 2018, 3, 10–15. [Google Scholar] [CrossRef] [Green Version]
- Mulugetta, Y.; ben Hagan, E.; Kammen, D. Energy access for sustainable development. Environ. Res. Lett. 2019, 14. [Google Scholar] [CrossRef] [Green Version]
- Pueyo, A.; Maestre, M. Linking energy access, gender and poverty: A review of the literature on productive uses of energy. Energy Res. Soc. Sci. 2019, 53, 170–181. [Google Scholar] [CrossRef]
- Albrecht, J.; Gronwald, M.; Karl, H.D.; Pfeiffer, J.; Röpke, L.; Mitarbeit von Lippelt, J. Bedeutung der Energiewirtschaft für die Volkswirtschaf. Studie im Auftrag der RWE AG. Bedeutung der Energiewirtschaft für die Volkswirtschaft: Studie im Auftrag der RWE AG. Available online: https://www.cesifo.org/DocDL/ifo_Forschungsberichte_50.pdf (accessed on 2 November 2021).
- Pao, H.T.; Tsai, C.M. Multivariate Granger causality between CO2 emissions, energy consumption, FDI (foreign direct investment) and GDP (gross domestic product): Evidence from a panel of BRIC (Brazil, Russian Federation, India, and China) countries. Energy 2011, 36, 685–693. [Google Scholar] [CrossRef]
- Iwata, H.; Okada, K.; Samreth, S. A note on the environmental Kuznets curve for CO2: A pooled mean group approach. Appl. Energy 2011, 88, 1986–1996. [Google Scholar] [CrossRef]
- Tang, C.F.; Tan, B.W. The impact of energy consumption, income and foreign direct investment on carbon dioxide emissions in Vietnam. Energy 2015, 79, 447–454. [Google Scholar] [CrossRef]
- European Commission. 2030 Climate Target Plan Impact Assessment. Available online: https://eur-lex.europa.eu/legal-content/EN/TXT/?uri=CELEX:52020SC0176 (accessed on 2 November 2021).
- European Commission. What is the European Green Deal? Available online: https://ec.europa.eu/commission/presscorner/api/files/attachment/859152/What_is_the_European_Green_Deal_en.pdf.pdf (accessed on 2 November 2021).
- Mata Pérez, M.D.L.E.; Scholten, D.; Smith Stegen, K. The multi-speed energy transition in Europe: Opportunities and challenges for EU energy security. Energy Strategy Rev. 2019, 26, 100415. [Google Scholar] [CrossRef]
- Bajan, B.; Łukasiewicz, J.; Mrówczyńska-Kamińska, A. Energy consumption and its structures in food production systems of the visegrad group countries compared with eu-15 countries. Energies 2021, 14, 3945. [Google Scholar] [CrossRef]
- Brodny, J.; Tutak, M. The comparative assessment of sustainable energy security in the Visegrad countries. A 10-year perspective. J. Clean. Prod. 2021, 317, 128427. [Google Scholar] [CrossRef]
- Kochanek, E. The energy transition in the visegrad group countries. Energies 2021, 14, 2212. [Google Scholar] [CrossRef]
- Solorio, I. Bridging the gap between environmental policy integration and the EU’s energy policy: Mapping out the “green europeanisation” of energy governance. J. Contemp. Eur. Res. 2011, 7, 396–415. [Google Scholar]
- Ambroziak, Ł.; Chojna, J.; Gniadek, J.; Juszczak, A.; Miniszewski, M.; Strzelecki, J.; Szpor, A.; Śliwowski, P.; Święcicki, I.; Wąsiński, M. Grupa Wyszehradzka—30 lat Transformacji, Integracji i Rozwoju; Polski Instytut Ekonomiczny: Warszawa, Poland, 2020. [Google Scholar]
- Cieślik, E. Looking for the sectoral interdependence: Evidence from the Visegrad countries and China. Qual. Quant. 2019, 53, 2041–2062. [Google Scholar] [CrossRef] [Green Version]
- Łącka, I.; Myszczyszyn, J.; Gołąb, S.; Będzik, B.; Suproń, B. Correlation between the Level of Economic Growth and Foreign Trade: The Case of the V4 Countries. Eur. Res. Stud. J. 2020, 3, 657–678. [Google Scholar] [CrossRef]
- Drews, A. Comparison of the economic business conditions in the countries of the Visegrad Group. Acta Univ. Nicolai Copernici. Zarządzanie 2016, 1, 89–101. [Google Scholar] [CrossRef] [Green Version]
- Hadas-Dyduch, M.; Koutsky, J.; Meluzinova, J.; Balcerzak, A.P.; Pietrzak, M.B. Multi Resolution Analysis of the Global Financial Crisis Influence on the GDP Growth in Visegrad Countries. IBIMA 2018. Available online: http://0-www-scopus-com.brum.beds.ac.uk/inward/record.url?eid=2-s2.0-85074062940&partnerID=MN8TOARS (accessed on 2 November 2021).
- Gillman, M. Macroeconomic trends among Visegrad Countries, EU, balkans, and the U.S., 1991–2021. Cent. Eur. Bus. Rev. 2021, 10, 1–20. [Google Scholar] [CrossRef]
- Jóźwik, B.; Gavryshkiv, A.; Gruszecki, L. Relacje Wzrostu Gospodarczego i Emisji Dwutlenku Węgla w Państwach Europy Środkowej. Prace Instytutu Europy Środkowej 2020. Available online: https://ies.lublin.pl/wp-content/uploads/2020/10/prace_ies_2020-016-1.pdf (accessed on 2 November 2021).
- Dyduch, J.; Skorek, A. Go South! Southern dimension of the V4 states’ energy policy strategies—An assessment of viability and prospects. Energy Policy 2020, 140, 111372. [Google Scholar] [CrossRef]
- World Energy Trilemma Index. World Energy Council in Partnership with Oliver Wyman (World_Energy_Trilemma_Index_2020_-_REPORT.pdf (2020)). Available online: https://www.oliverwyman.com/content/dam/oliver-wyman/global/en/2016/june/Trilemma_PR_2016.pdf (accessed on 2 November 2021).
- Granger, C.W.J. Investigating Causal Relationships by Econometric Models and Cross-Spectral Methods. Econometrica 1969, 36, 424–438. [Google Scholar] [CrossRef]
- Vera, J.; Kristjanpoller, W. Causalidad de Granger entre composición de las exportaciones, crecimiento económico y producción de energía eléctrica:evidencia empírica para Latinoamérica. Lecturasde Economía 2017, 86, 25–62. [Google Scholar] [CrossRef] [Green Version]
- Balassa, B. Exports and economic growth: Further evidence. J. Dev. Econ. 1978, 5, 181–189. [Google Scholar] [CrossRef]
- Kraft, J.; Kraft, A. Relationship between energy and GNP. J. Energy Dev. 1978, 3, 401–403. [Google Scholar]
- Feder, G. On exports and economic growth. J. Dev. Econ. 1983, 12, 59–73. [Google Scholar] [CrossRef]
- Akarca, A.; Long, T. Relationship between energy and GNP: A reexamination. J. Energy Dev. 1980, 5, 326–331. [Google Scholar]
- Yu, E.; Choi, J.-Y. The causal relationship between energy and GNP: An International Comparison. J. Energy Dev. 1985, 10, 249–272. [Google Scholar]
- Abosedra, S.; Baghestani, H. New Evidence on the Causal Relationship between United States Energy Consumption and Gross National Product. J. Energy Dev. 1989, 14, 285–292. [Google Scholar]
- Hwang, D.; Gum, B. The causal relationship between energy and GNP: The case of Taiwan. J. Energy Dev. 1991, 16, 19–226. [Google Scholar]
- Glasure, Y.; Lee, A.-R. Cointegration, error-correction, and the relationship between GDP and energy: The case of South Korea and Singapore. Resour. Energy Econ. 1998, 20, 17–25. [Google Scholar] [CrossRef]
- Stern, D. A multivariate cointegration analysis of the role of energy in the US macroeconomy. Energy Econ. 2000, 22, 267–283. [Google Scholar] [CrossRef] [Green Version]
- Bhattacharya, R.; Paul, S. Causality between energy consumption and economic growth in India: A note on conflicting results. Energy Econ. 2004, 26, 977–983. [Google Scholar] [CrossRef]
- Payne, J.E. A survey of the electricity consumption-growth literature. Appl. Energy 2010, 87, 723–731. [Google Scholar] [CrossRef]
- Payne, J.E. Survey of the international evidence on the causal relationship between energy consumption and growth. J. Econ. Stud. 2010, 37, 53–95. [Google Scholar] [CrossRef]
- Menegaki, A.N. On energy consumption and GDP studies; A meta-analysis of the last two decades. Renew. Sustain. Energy Rev. 2014, 29, 31–36. [Google Scholar] [CrossRef]
- Holtz-Eakin, D.; Selden, T. Stoking the fires? CO2 emissions and economic growth. J. Public Econ. 1995, 1, 85–101. [Google Scholar] [CrossRef] [Green Version]
- Stern, D.I.; Common, M.S.; Barbier, E.B. Economic growth and environmental degradation: The environmental Kuznets curve and sustainable development. World Dev. 1996, 24, 1151–1160. [Google Scholar] [CrossRef]
- Ang, J.B. CO2 emissions, energy consumption, and output in France. Energy Policy 2007, 35, 4772–4778. [Google Scholar] [CrossRef]
- Soytas, U.; Sari, R.; Ewing, B.T. Energy consumption, income, and carbon emissions in the United States. Ecol. Econ. 2007, 62, 482–489. [Google Scholar] [CrossRef]
- Jalil, A.; Mahmud, S.F. Environment Kuznets curve for CO2 emissions: A cointegration analysis for China. Energy Policy 2009, 37, 5167–5172. [Google Scholar] [CrossRef] [Green Version]
- Zhang, X.-P.; Cheng, X.-M. Energy consumption, carbon emissions, and economic growth in China. Ecol. Econ. 2009, 68, 2706–2712. [Google Scholar] [CrossRef]
- Chang, C.C. A multivariate causality test of carbon dioxide emissions, energy consumption and economic growth in China. Appl. Energy 2010, 87, 3533–3537. [Google Scholar] [CrossRef]
- Shahbaz, M.; Lean, H.H. Does financial development increase energy consumption? The role of industrialization and urbanization in Tunisia. Energy Policy 2012, 40, 473–479. [Google Scholar] [CrossRef] [Green Version]
- Apergis, N.; Payne, J. Renewable energy consumption and economic growth: Evidence from a panel of OECD countries. Energy Policy 2010, 38, 656–660. [Google Scholar] [CrossRef]
- Bartleet, M.; Rukmani, G. Energy consumption and economic growth in New Zealand: Results of trivariate and multivariate models. Energy Policy 2010, 38, 3508–3517. [Google Scholar] [CrossRef]
- Arouri, M.; Youssef, A.; M’henni, H.; Rault, C. Energy consumption, economic growth and CO2 emissions in Middle East and North African countries. Energy Policy 2012, 45, 342–349. [Google Scholar] [CrossRef] [Green Version]
- Papież, M. CO2 emissions, energy consumption and economic growth in the Visegrad Group countries: A panel data analysis, in materials. In Proceedings of the 31st International Conference on Mathematical Methods in Economics, Jihlava, Czech Republic, 11–13 September 2013. [Google Scholar]
- Litavcová, E.; Chovancová, J. Economic Development, CO2 Emissions and Energy Use Nexus 2—Evidence from the Danube Region Countries. Energies 2021, 14, 3165. [Google Scholar] [CrossRef]
- Acaravci, A.; Ozturk, I. On the relationship between energy consumption, CO2 emissions and economic growth in Europe. Energy 2010, 35, 5412–5420. [Google Scholar] [CrossRef]
- Kalimeris, P.; Richardson, C.; Bithas, K. A meta-analysis investigation of the direction of the energy-GDP causal relationship: Implications for the growth-degrowth dialogue. J. Clean. Prod. 2014, 67, 1–13. [Google Scholar] [CrossRef]
- Menyah, K.; Wolde-Rufael, Y. Energy consumption, pollutant emissions and economic growth in South Africa. Energy Econ. 2010, 32, 1374–1382. [Google Scholar] [CrossRef]
- Odugbesan, J.A.; Rjoub, H. Relationship among Economic Growth, Energy Consumption, CO2 Emission, and Urbanization: Evidence from MINT Countries. Sage Open 2020. [Google Scholar] [CrossRef] [Green Version]
- Iwata, H.; Okada, K.; Samreth, S. Empirical study on the environmental Kuznets curve for CO2 in France: The role of nuclear energy. Energy Policy 2010, 38, 4057–4063. [Google Scholar] [CrossRef] [Green Version]
- Shahbaz, M.; Lean, H.H. The dynamics of electricity consumption and economic growth: A revisit study of their causality in Pakistan. Energy Policy 2012, 39, 146–153. [Google Scholar] [CrossRef] [Green Version]
- Shahbaz, M.; Lean, H.H.; Shabbir, M.S. Environmental Kuznets Curve hypothesis in Pakistan: Cointegration and Granger causality. Renew. Sustain. Energy Rev. 2012, 16, 2947–2953. [Google Scholar] [CrossRef] [Green Version]
- Al-Mulali, U.; Fereidouni, H.G.; Lee, J.Y.; Sab, C.N.B.C. Examining the bi-directional long run relationship between renewable energy consumption and GDP growth. Renew. Sustain. Energy Rev. 2013, 22, 209–222. [Google Scholar] [CrossRef]
- Al-mulali, U.; Sab, C.N.C. Energy consumption, pollution and economic development in 16 emerging countries. J. Econ. Stud. 2013, 40, 686–698. [Google Scholar] [CrossRef]
- Krkošková, R. Causality between energy consumption and economic growth in the V4 countries. Technol. Econ. Dev. Econ. 2021, 27, 900–920. [Google Scholar] [CrossRef]
- Streimikiene, D.; Kasperowicz, R. Review of economic growth and energy consumption: A panel cointegration analysis for EU countries. Renew. Sustain. Energy Rev. 2016, 59, 1545–1549. [Google Scholar] [CrossRef]
- Simionescu, M.; Wojciechowski, A.; Tomczyk, A.; Rabe, M. Revised environmental kuznets curve for V4 countries and Baltic states. Energies 2021, 14, 3302. [Google Scholar] [CrossRef]
- Sims, C.A. Macroeconomics and Reality. J. Econometr. Soc. 1980, 48, 1–48. [Google Scholar] [CrossRef] [Green Version]
- Granger, C.W.J. Developments in the study of cointegrated economic variables. In Long-Run Economic Relationship, Readings in Cointegration; Engle, R.F., Granger, C.W.J., Eds.; Oxford University Press: Oxford, UK, 1991. [Google Scholar]
- McAdam, P. A Pedagogical Note on the Long Run of Macroeconomic Models; University of Kent: Kent, UK, 2007. [Google Scholar]
- Osińska, M. (Ed.) Ekonometria Współczesna; Dom Organizatora: Warsaw, Poland, 2007. [Google Scholar]
- Maddala, G.S. Ekonometria; PWN: Warszawa, Poland, 2008; pp. 327–622. [Google Scholar]
- Myszczyszyn, J. The Long-run Relationships between Number of Patents and Economic Growth. Eur. Res. Stud. J. 2020, 3, 548–563. [Google Scholar] [CrossRef]
- Pesaran, M.H.; Shin, Y.; Smith, R.J. Bounds testing approaches to the analysis of level relationships. J. Appl. Econometr. 2001, 16, 289–326. [Google Scholar] [CrossRef]
- Kwiatkowski, D.; Phillips, P.C.B.; Schmidt, P.; Shin, Y. Testing the null hypothesis of stationarity against the alternative of a unit 719 root: How sure are we that economic time series have a unit root? J. Econometr. 1992, 54, 159–178. [Google Scholar] [CrossRef]
- Kripfganz, S.; Schneider, D.C. Response surface regressions for critical value bounds and approximate p-values in equilibrium correction models. Oxf. Bull. Econ. Stat. 2020, 82, 1456–1481. [Google Scholar] [CrossRef]
- Kripfganz, S.; Schneider, D.C. ARDL: Estimating Autoregressive Distributed Lag and Equilibrium Correction models. Available online: https://ideas.repec.org/p/boc/usug18/09.html (accessed on 2 November 2021).
- McKinsey & Company. Neutralna Emisyjnie Polska 2050, Jak Wyzwanie Zmienić w Szansę. Neutralna Emisyjnie Polska. Available online: https://www.mckinsey.com/pl/our-insights/carbon-neutral-poland-2050 (accessed on 2 November 2021).
- Enerdata Energy Market Research in Hungary. Available online: https://www.enerdata.net/estore/country-profiles/hungary.html (accessed on 13 April 2021).
- Bart, I.; Csernus, D.; Sáfián, F. Analysis of Climateenergy Policies & Implementation in Hungary, Climate Strategy 2050 Institute. Available online: http://eko.org.pl/imgturysta/files/vise/raport_hr_3.pdf (accessed on 2 November 2021).
- PISM. The Polish Institute of International Affairs. The Czech Republic in the Process of Climate and Energy Transformation. Available online: https://www.pism.pl/publikacje/Czechy_w_procesie_transformacji_klimatycznoenergetycznej (accessed on 2 November 2021).
- Polanecky, K. Climate policy implementation in the Czech Republic. Available online: http://eko.org.pl/imgturysta/files/vise/raport_cz_1.pdf (accessed on 2 November 2021).
- Furmanczuk, Z. Climate and Energy Policy in Slovakia. Available online: http://eko.org.pl/imgturysta/files/vise/raport_sl_1.pdf (accessed on 2 November 2021).
- Sulich, A.; Sołoducho-Pelc, L. Renewable Energy Producers’ Strategies in the Visegrád Group Countries. Energies 2021, 14, 3048. [Google Scholar] [CrossRef]
Figure 1.
A plot of share of energy from renewable sources (RES) in V4 and in the EU countries before 2004 (EU-15) in 1992–2019.
Figure 1.
A plot of share of energy from renewable sources (RES) in V4 and in the EU countries before 2004 (EU-15) in 1992–2019.

Figure 2.
A plot of CO2 emissions per capita for V4 countries in 1992–2015.

Figure 3.
A plot of energy consumption per capita for V4 countries in 1992–2015 kg of oil equivalent.
Figure 3.
A plot of energy consumption per capita for V4 countries in 1992–2015 kg of oil equivalent.

Figure 4.
A plot of GDP per capita for V4 countries in 1992–2015.

Figure 5.
Relationships of the studied features in V4 countries in 1992–2015.

Figure 6.
Relationship between variables.


Table 1.
Descriptive statistics.
| GDP per Capita | ||||||
| Country | N | Minimum | Maximum | Median | Mean | Std. Dev. |
| Czech Republic | 24 | 19,456.20 | 33,909.31 | 26,118.64 | 26,640.23 | 4868.67 |
| Poland | 24 | 10,420.52 | 26,534.72 | 17,250.98 | 18,048.15 | 4918.18 |
| Hungary | 24 | 15,533.26 | 26,777.47 | 22,159.48 | 21,107.78 | 3733.35 |
| Slovak Republic | 24 | 12,193.29 | 29,927.68 | 19,120.52 | 20,448.55 | 5749.14 |
| Energy consumption per capita | ||||||
| Country | N | Minimum | Maximum | Median | Mean | Std. Dev. |
| Czech Republic | 24 | 3782.89 | 4491.52 | 4100.28 | 4142.28 | 192.08 |
| Poland | 24 | 2314.20 | 2680.10 | 2511.79 | 2503.15 | 108.34 |
| Hungary | 24 | 2271.95 | 4233.04 | 2507.88 | 2584.54 | 360.55 |
| Slovak Republic | 24 | 2943.19 | 3504.48 | 3317.75 | 3299.14 | 150.69 |
| Per capita CO2 emissions | ||||||
| Country | N | Minimum | Maximum | Median | Mean | Std. Dev. |
| Czech Republic | 24 | 9.2311 | 12.8397 | 11.7497 | 11.2420 | 1.0438 |
| Poland | 24 | 7.5200 | 9.2469 | 8.2054 | 8.2606 | 0.5201 |
| Hungary | 24 | 4.1901 | 6.0191 | 5.6385 | 5.4005 | 0.5484 |
| Slovak Republic | 24 | 5.6616 | 8.3287 | 7.2750 | 7.0514 | 0.6955 |
Table 2.
The matrix of correlation coefficients for the analyzed variables.
| Czech Republic | Hungary | ||||||
| Variable | GDP | Energy | CO2 | Variable | GDP | Energy | CO2 |
| GDP | 1 | PKB | 1 | ||||
| Energy | 0.147313 | 1 | Energy | 0.034715 | 1 | ||
| CO2 | −0.81403 | 0.265309 | 1 | CO2 | −0.67659 | 0.540726 | 1 |
| Poland | Slovak Republic | ||||||
| Variable | GDP | Energy | CO2 | GDP | Energy | CO2 | |
| GDP | 1 | PKB | 1 | ||||
| Energy | 0.055587 | 1 | Energy | −0.55726 | 1 | ||
| CO2 | −0.70715 | 0.655194 | 1 | CO2 | −0.89196 | 0.759503 | 1 |
Table 3.
Unit Root Test—ADF Test Results.
| Variable | Original Variables | First Differences | ADF Integration | ||
|---|---|---|---|---|---|
| ADF Test for A Variable with An Intercept | ADF Test for A Variable with Intercept and Trend | ADF Test for Increments with the Intercept | ADF Test for Increments with A Trend | ||
| CZ_CO2 | 0.9724 | 0.3128 | 2.41 × 10⁻⁵ | 0.0001883 | I(1) |
| HU_CO2 | 0.8924 | 0.5237 | 3.15 × 10⁻⁴ | 0.001896 | I(1) |
| PL_CO2 | 0.394 | 0.4561 | 0.000469 | 0.00295 | I(1) |
| SL_CO2 | 0.9252 | 0.1077 | 0.000002 | 0.000018 | I(1) |
| l_CZ_E | 0.5948 | 0.9434 | 0.001913 | 0.008127 | I(1) |
| l_HU_E | 0.03096 | 0.9036 | 0.006705 | 0.0002757 | I(1) |
| l_PL_E | 0.3307 | 0.6457 | 0.000943 | 0.005263 | I(1) |
| l_SL_E | 0.5774 | 0.9521 | 0.003079 | 0.006764 | I(1) |
| l_CZ_GDP | 0.7667 | 0.2915 | 0.009775 | 0.04901 | I(1) |
| l_HU_GDP | 0.7173 | 0.1545 | 0.03495 | 0.1103 | I(1) |
| l_PL_GDP | 0.3218 | 0.1516 | 0.09633 | 0.03306 | I(1) |
| l_SL_GDP | 0.7861 | 0.4392 | 0.01446 | 0.04863 | I(1) |
Table 4.
Unit Root Test—KPSS Test Results.
| Variable | KPSS Test for the Variable (p Value) | KPSS Test for 1st Differences (p-Value) | KPSS Integration |
|---|---|---|---|
| Critical Val. | 0.462 | ||
| CZ_CO2 | 0.637008 | 0.09983 | I(1) |
| HU_CO2 | 0.576822 | 0.16810 | I(1) |
| PL_CO2 | 0.495913 | 0.11425 | I(1) |
| SL_CO2 | 0.669881 | 0.10066 | I(1) |
| l_CZ_E | 0.12902 | 0.15263 | I(1) |
| l_HU_E | 0.437966 | 0.54019 | I(0) |
| l_PL_E | 0.12648 | 0.10586 | I(0) |
| l_SL_E | 0.555051 | 0.21454 | I(1) |
| l_CZ_GDP | 0.688504 | 0.10937 | I(1) |
| l_HU_GDP | 0.665321 | 0.11963 | I(1) |
| l_PL_GDP | 0.706934 | 0.25673 | I(1) |
| l_SL_GDP | 0.700959 | 0.11065 | I(1) |
Table 5.
The ARDL bound testing for cointegration with critical values.
| Country | Dep. Variable | F-Statistics | I(0) | I(1) | Cointegration | Decision |
|---|---|---|---|---|---|---|
| Poland (PL) | GDP | 1.71338 | 3.538 | 4.428 | NO | short-run model |
| CO2 | 5.79441 | 3.538 | 4.428 | YES | ECM (error correction model) | |
| Energy | 6.56082 | 3.538 | 4.428 | YES | ECM (error correction model) | |
| Hungary (HU) | GDP | 2.43395 | 3.538 | 4.428 | NO | short-run model |
| CO2 | 25.4136 | 3.538 | 4.428 | YES | Estimate ECM (error correction model) | |
| Energy | 3.447 | 3.538 | 4.428 | NO | short-run model | |
| Czech Republik (Cz) | GDP | 3.05207 | 3.538 | 4.428 | NO | short-run model |
| CO2 | 3.48921 | 3.538 | 4.428 | NO | short-run model | |
| Energy | 2.92498 | 3.538 | 4.428 | NO | short-run model | |
| Slovakia (SV) | GDP | 2.129 | 3.538 | 4.428 | NO | short-run model |
| CO2 | 2.43360 | 3.538 | 4.428 | NO | short-run model | |
| Energy | 2.80193 | 3.538 | 4.428 | NO | short-run model |
Table 6.
The ARDL bound testing for cointegration with critical values.
| Country | Dep. Variable | Short-Run Statistics | Long-Run Statistics | ||||||||||||||
|---|---|---|---|---|---|---|---|---|---|---|---|---|---|---|---|---|---|
| l_GDP | CO2 | l_EC | |||||||||||||||
| t-1 | t-2 | t-3 | t-4 | t-5 | t-1 | t-2 | t-3 | t-4 | t-5 | t-1 | t-2 | t-3 | t-4 | t-5 | ECT | ||
| PL | l_GDP | 0.5 | 0.37 | −0.66 | 0.53 | −0.09 | −0.25 ** | 0.24 | 0.04 | 0.13 | −0.35 ** | 2.96 ** | −2.58 | −0.3 | −0.76 | 2.53** | −0.09 *** |
| CO2 | −1.07 | 4.88 | −12.88 | −0.02 | 1.38 | −7.27 | −0.53 | 1.11 | 4.91 ** | −2.69 | 67.62 ** | −0.9 | −11.89 | −38.8 ** | 18.08 | −1.17 *** | |
| l_E | −0.22 | 0.79 | −1.31 | −0.16 | 0.17 | −0.77 ** | −0.06 | 0.04 | 0.55 ** | −0.29 | 7.29 ** | −0.06 | −0.76 | −4.26 ** | 1.9 | −0.12 *** | |
| HU | l_GDP | 0.67 | −0.12 | 0.39 | −0.13 | 0.05 | −0.02 | −0.02 | −0.06 | −0.69 | 0.21 | 0.17 | 0.24 | −0.07 * | |||
| CO2 | 5.47 | −7.78 | 4.49 | 1.8 | 0.64 | 0.42 | 0.27 | 0.01 | −8.56 ** | 2.9 | −3.47 | −0.93 | |||||
| l_E | −0.31 | −0.27 | 1.18 | −0.04 | 0.17 ** | 0.07 | 0.01 | −0.09 | −1.11 * | −0.03 | −0.28 | 0.68 | |||||
| CZ | l_GDP | 2.36 * | −0.21 | 0.36 | 0.19 | −0.3 | 0.03 | 0.03 | −0.01 | 0.02 | 0.16 ** | −1.29 | −1.07 | 0.5 | −0.58 | −2.41 ** | |
| CO2 | 23.41 | 2.98 | −2.61 | −0.79 | −4.88 | 0.38 | 0.51 | 0.28 | 0.55 | 2.22 | −20.11 | −18.79 | 6.59 | −9.77 | −28.54 | −1.55 ** | |
| l_E | 2.67 | 0.22 | 0.25 | −0.17 | 0.02 | 0.08 * | 0.07 | 0.06 | 0.09 | 0.22 * | −2.26 * | −1.58 | −0.08 | −1.47 * | −3.53 * | −0.04 | |
| SV | l_GDP | 0.74 *** | −0.05 | −0.04 | 0.02 | 0.16 | −0.18 | ||||||||||
| CO2 | 0.76 | −3.5 ** | −0.58 *** | 0.11 | 0.02 | −1.95 ** | −1.38 ** | ||||||||||
| l_E | −0.03 | 0.52 *** | 0.01 | 0.05 *** | 0.03 | −0.19 | |||||||||||
The significance of the coefficients is indicated in the tables where *, **, *** denotes 5%, 1%, and 0.1% significance level. l_GDP, log of the gross domestic product; CO2, CO2 emissions per capita; l_E, log of energy consumption per capita.
Publisher’s Note: MDPI stays neutral with regard to jurisdictional claims in published maps and institutional affiliations. |
© 2021 by the authors. Licensee MDPI, Basel, Switzerland. This article is an open access article distributed under the terms and conditions of the Creative Commons Attribution (CC BY) license (https://creativecommons.org/licenses/by/4.0/).
Share and Cite
MDPI and ACS Style
Myszczyszyn, J.; Suproń, B. Relationship among Economic Growth (GDP), Energy Consumption and Carbon Dioxide Emission: Evidence from V4 Countries. Energies 2021, 14, 7734. https://0-doi-org.brum.beds.ac.uk/10.3390/en14227734
AMA Style
Myszczyszyn J, Suproń B. Relationship among Economic Growth (GDP), Energy Consumption and Carbon Dioxide Emission: Evidence from V4 Countries. Energies. 2021; 14(22):7734. https://0-doi-org.brum.beds.ac.uk/10.3390/en14227734
Chicago/Turabian StyleMyszczyszyn, Janusz, and Błażej Suproń. 2021. "Relationship among Economic Growth (GDP), Energy Consumption and Carbon Dioxide Emission: Evidence from V4 Countries" Energies 14, no. 22: 7734. https://0-doi-org.brum.beds.ac.uk/10.3390/en14227734
Note that from the first issue of 2016, this journal uses article numbers instead of page numbers. See further details here.