1. Introduction
In the last few years, electric vehicles (EV) applications have increased due to the cost reduction of implementing components and the spread of green energy and carbon-free policies all over the world [
1]. Several countries have limited greenhouse gases (GHG) emissions by establishing standards and increasing the capacity of green power sources in order to reduce fossil fuel usage [
2,
3,
4].
The environmental features of EVs are mostly related to low GHG emissions, which is helpful to reduce global warming and climate change problems [
2]. In the transportation sector, the EV may replace conventional vehicles in the following decades according to the green policies. For example, Germany intends to designate high EV participation on the grid system in future years [
5].
Electric vehicle technology emerged in the early 1900s; but, with the low energy density of its battery and poor drive range, it has faced some challenges compared to internal combustion engine (ICE) vehicles [
2]. However, with the increasing development of power electronics and battery technologies, EVs have become cheaper and more accessible to private usage [
1,
2,
6].
In the electrical system, a solution to reduce the high fossil fuel consumption has been to install more renewable power sources such as solar photovoltaic (PV) and wind [
2,
7]. However, these green energy sources have intermittent generation since they rely on sunlight and wind, which are not available all the time [
8,
9]. Therefore, storage systems such as EV batteries may be a suitable option to support the intermittence of renewable sources, providing energy support during grid disturbances [
10].
Recently, several studies have been reported concerning the optimal integration of renewable and non-renewable distributed generation (DGs) in the distribution networks, which aims to various technical and economic benefits such as power loss minimization, voltage profile improvement, and annual energy cost reduction [
1,
2,
3,
4,
5,
6]. In addition, the growing integration of generation sources near consumption loads has made the concept of microgrids become widespread. These small grids composed of different generation and consumption units can incorporate smart grid aspects allowing the communication of all the elements, and ensuring a better system performance [
3,
11,
12]. Microgrids can provide control and management strategies for power sources and improve the power quality and reliability of the electrical system [
3]. A typical microgrid configuration includes a DG unit, loads, and, in the recent years, some energy storage systems (ESS) which can include stationary batteries and/or electric vehicles at the parking lot [
4].
Despite the advantage of energy support for intermittent sources and carbon emission reduction, a larger number of EV users connected to the grid may cause high peak demands at specific periods of the day, as European researchers suggest for 2030 [
6]. Moreover, the integration of EV can add some harmful effects on the utility grid, such as phase unbalances, harmonic distortion, overloading components, and increase of power loss [
2].
Control strategies and management techniques are essential in order to reduce the problems related to EV integration in distributed systems, and add support for ancillary services. Some of those strategies are frequency voltage regulation, reactive power compensation, and power quality improvement [
2]. These ancillary services can be achieved with some techniques, such as controlling DG and ESS operation, regulating the direct current (DC) bus voltage, applying optimization approaches that aim to minimize the dispatch cost [
3]. A suitable option consists in using Vehicle-to-Grid (V2G) approach to implement these controls in the EV charger station and supply power to the grid, for example [
1,
2,
4,
6].
In the literature, several solutions have been proposed to provide these ancillary services to the utility grid. Regarding frequency and voltage regulation, the authors in [
3] propose a bidirectional charging control strategy to regulate both voltage and frequency by reducing the peak load demand based on the state of charge (SOC) from the battery and the available active power in the grid, however, it has no specified optimization method related to economic benefits. A different approach is investigated in [
13], the authors propose a multi-objective technique to minimize voltage deviation while searching for an optimal scheduling approach to obtain higher economic savings. Although [
13] utilizes an optimization process, the applied method does not take the power factor of the microgrid into account, however, it aims at voltage deviations and transformer tap changes. A control strategy for frequency regulation of microgrids is also presented in [
14]. The proposed approach achieves the coordination of a central controller and local controllers of a microgrid composed of EV, load, and power generation. Ref. [
15] presents a charging strategy for frequency regulation during grid disturbances and optimized charging control. Concerning reactive compensation and power flow coordination, two types of reactive power compensation are proposed in [
16]. The strategy considers information coming from the drivers and defines an incentive factor based on the voltage contribution. Ref. [
17] presents a hierarchical coordination strategy that takes active and reactive power into account to obtain optimal power flow. The proposed technique also achieves optimal EV charging with reactive support to the grid, but, in this case, it does not consider the V2G approach. About grid distortion and unbalances, in [
6] is presented a global strategy control to operate simultaneously the active and reactive power under distorted and unbalanced grid voltages.
Large DG units and EV penetration can cause power factor and voltage deviations issues, which results in poor power quality at point of common coupling (PCC) of the microgrid. Therefore, a control strategy may be necessary to deal with these problems while still allowing a proper integration of all elements: EVs, grid, loads, and PV generations. Therefore, this paper proposes an improved optimal control strategy for EV charging with optimized management.
The main contribution of this paper is to present a control strategy to provide an improved operation for the microgrid elements by reducing power factor issues that may be caused by the EV and DG inclusion in existing microgrids. In order to increase the possibilities of the control strategy, different operation modes are proposed to achieve power factor compensation while fulfilling the vehicle users’ requirements. One mode incorporates an optimal control strategy to offer an economical charging that reaches a final SOC selected by the client in the connection instant. Another mode utilizes the optimization process to correct the power factor at PCC of the microgrid and, simultaneously, it also aims the EV charging requests. A third mode is proposed to support the other modes and ensure the power factor correction when the microgrid is under stress moments. It is considered a three-phase AC microgrid composed of PV generation operating on the maximum power point (MPP), user loads, and EV charging slot. The proposed control strategy applies the optimal dynamic programming method to find the ideal point of the EV active and reactive power by using predicted energy price, PV generation, and load demand forecast. This method ensures that the optimal power reference will be obtained to maintain the power factor in a suitable region.
The paper is organized as follows:
Section 2 presents the proposed microgrid and the main characteristics about the EVs, while
Section 3 defines the control parameters, the cost function, and presents the algorithm logic. The results of different scenarios are illustrated in
Section 4, and
Section 5 concludes the article.
2. Microgrid Structure Definition
As defined by the U.S. Department of Energy, a microgrid is a group of interconnected loads and distributed energy resources, such as DG and, in more recent cases, the integration of ESS. Furthermore, by definition, microgrids can operate connected to the external grid, or in islanded mode [
11,
18]. By connecting DG units, microgrids increase grid quality, security, and reliability [
11,
19,
20]. There are mainly two types of microgrids regarding the bus configuration: AC bus and DC bus. AC grid systems are widely adopted, and the growing EV fleet may cause the addition of charging stations at these already existing systems. However, AC microgrids cause some issues related to power quality, synchronization, and stability [
20,
21]. Therefore, this paper considers the charging station inclusion in a three-phase microgrid that can be classified as a commercial and industrial topology. Considering the several operation aspects indicated by [
20], this article focuses on the improvement of voltage and reactive power control and the power quality, since it comprises the power factor constant. Moreover, since microgrid can suffer from reactive power issues, the key points of the proposed paper is to consider the EV as distributed ESS and provide a better balance between generation and load by reactive power compensation and power factor regulation.
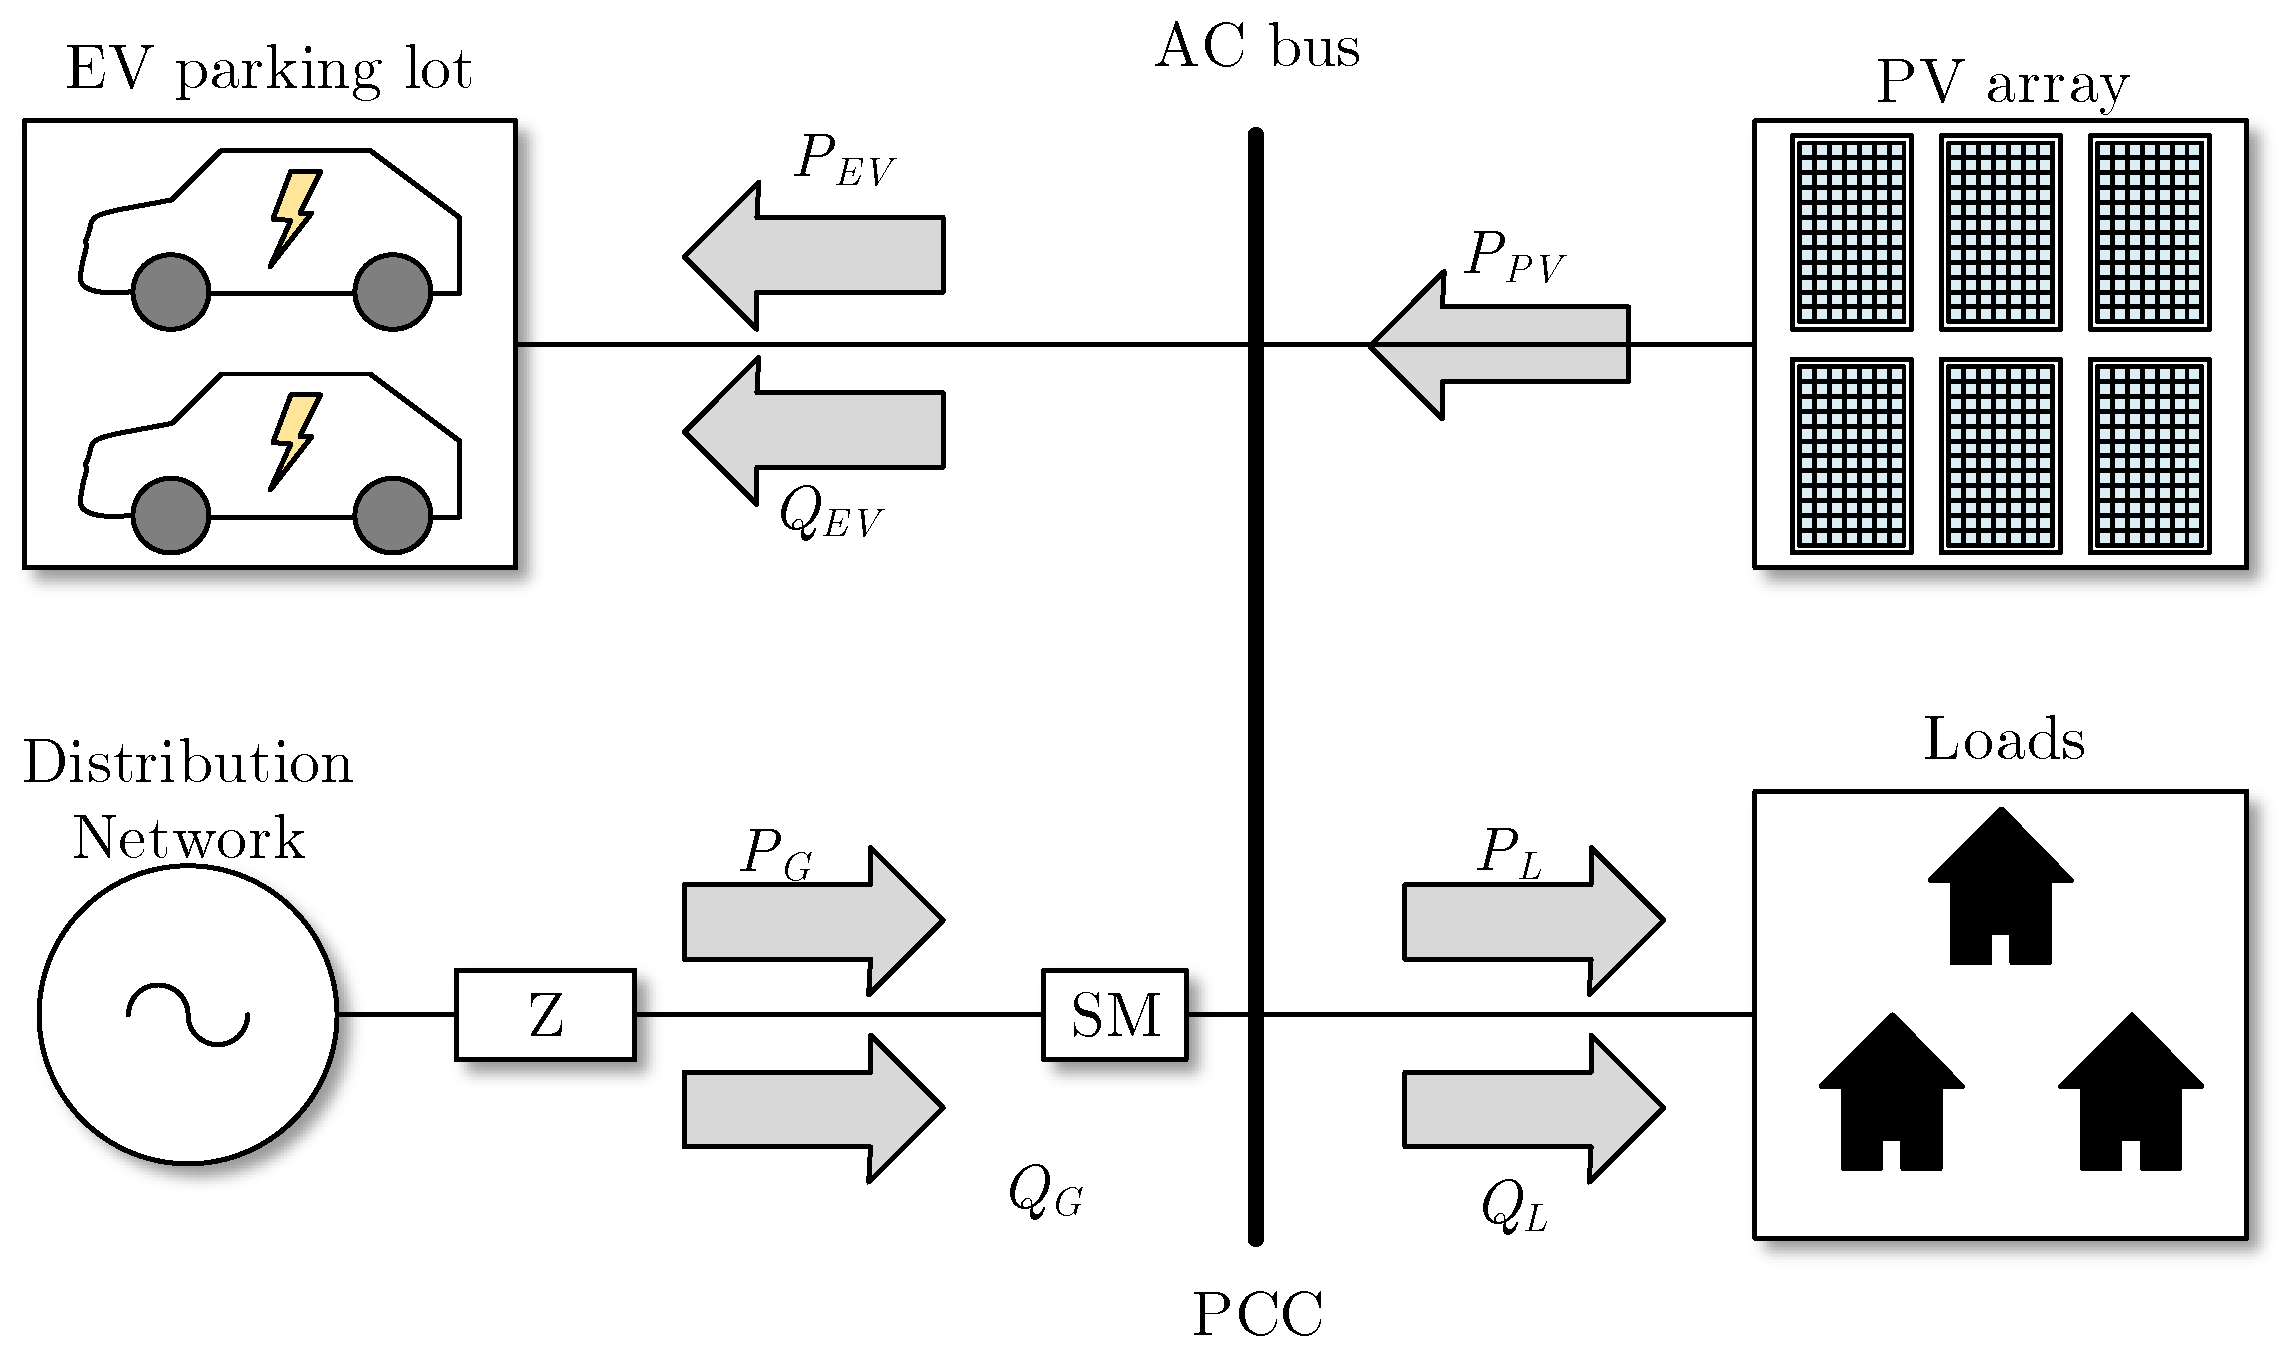
Over the years, the microgrid architecture has combined different types of generation and demand elements, such as PV arrangement, diesel generators, wind sources, stationary batteries, among others. A typical configuration of a microgrid with PV arrangement, loads, and EV charging is presented in
Figure 1.
From
Figure 1, it is considered
Z as the feeder impedance specified by
; all PV arrays operate in the MPP, and the
represents the sum of them. The load demand is defined as a combined representation of all fixed and dynamic microgrid loads. The adopted power reference considers the vehicles as a consumption element in the system, and the positive reactive power is inductive while the negative reactive power is capacitive. Finally, a smart DC/AC inverter reads the power measures from PV and EV, and the load demand is estimated by the smart meter (SM) element installed at the PCC.
Based on the microgrid configuration presented in
Figure 1, the active power flow exported from or imported into the microgrid can be defined as
in which
represents the active power of the microgrid,
and
are the active power of PV units and load demand, respectively, and
corresponds to the vehicles charging power.
Following the power flow direction, a positive
indicates the energy import from the external grid while a negative
means the energy export from the microgrid into the external grid. Similarly, the resulting reactive power flow of the microgrid can be obtained by
In (
2), the variable
indicates the reactive power of the loads, and
is the reactive power from the EV charging station. Likewise, a positive
indicates a power flow from the external grid into the microgrid, and a negative
a reactive export to the microgrid.
and
, in (
1) and (
2), are control variables since the DC/AC inverter of the EV charging station is an active element, and it is considered that the PV inverter will be a passive element, allowing the maximum generation available.
Both the microgrid and the EV inverter must have power restrictions to limit the control law and guarantee a satisfactory system behavior. Thereby, it is utilized the apparent power indicated by
where
is the maximum apparent power allowed to the inverter, and
is the microgrid feeder limitation.
Microgrids can incorporate three hierarchical control levels. The primary control is responsible for implementing a decentralized operation that may autonomously correct the active and reactive power to adjust the frequency and output voltage magnitude. The secondary control must reduce the error that may be caused by the first level. Finally, the tertiary control level is the central point of this paper since it evaluates global information to adjust the power references of the inverter [
11,
20,
22].
Voltage issues are the most concern related to low and medium voltage distribution grids. In particular, low-voltage grids are more affected since they have been developed for a unidirectional power flow to the loads. However, the high diffusion of DG forces the power flow inversion, rising the voltage values [
23,
24,
25]. The voltage deviation produced by the active power injection can be expressed by
where, the
indicates the estimated voltage after the power injection,
refers to the base voltage of the microgrid,
R and
X corresponds to the resistance and reactance of the connection feeder and are related to the
Z element of
Figure 1 [
23]. In this case, the negative signal is incorporated in
and
because (
5) utilizes a different power flow direction.
For low-voltage grid, it is considered a high R/X ratio, since low-voltage distribution networks present larger resistance compared to reactance
. Contrary to what occurs with medium and high voltage grids, the active power has more influence in voltage magnitude, and the reactive power affects more significantly the power angle [
26,
27].
Some voltage restrictions can be determined based on the steady state of the low voltage ride-through (LVRT). For steady state region, the maximum voltage allowed corresponds to 1.2 pu, and the minimum voltage value is equal to 0.9 pu [
20,
28].
Some researches deal with microgrid voltage issues, as can be seen in [
29] that proposes an optimization for system losses minimization and EV battery degradation, defining bus voltage limits; or [
30] that establishes maximal deviations for frequency and voltage levels to verify its control strategy in the presence of stochastic renewable sources. In this paper, it is utilized the voltage limits to verify the impact of the PV generation in the voltage response, however, the control strategy does not operate in this parameter. Thus, based on the maximum and minimum voltage levels allowed in steady state, the region with the suitable operation is defined by
According to IEEE 1459-2010, the ratio between the active power and the maximum energy, given by the apparent power, can be defined as the power factor [
31]. In order to evaluate the impact of the active and reactive power injection on the microgrid power factor, the following equation is used
where,
is the power factor at the PCC,
and
represent
and
, respectively.
In addition, the power factor has some restrictions that must be respected. Based on [
32], the power factor limits are indicated by
where
is equal to 0.95. In this case, the module in (
7) establishes the maximum power factor as 1, disregarding the lagging or leading aspect.
Electric Vehicles Characteristics
Since EVs can operate as energy storage, several companies have been looking for solutions to increase the EV battery capacity. In this regard, it can be seen a large rise in the number of vehicles that overtakes a 400 km range in the past few years [
33]. However, there are still certain issues, such as high initial cost compared with ICE vehicles, low range, small battery density, and long charging times, which are challenges that developers must overcome to widespread the EV approval [
34,
35]. A range comparison is presented in
Table 1, highlighting the battery capacity and range of some EVs available in the market.
The charging time problem can be figured out by the evolution of charging infrastructure technology, mainly using techniques that allow transferring high power density. The main available power level standards divide the charging process into DC and AC types, offering different supply voltage outlets depending on the country. The SAE J1772 and IEC 61851 standards can be seen in
Table 2 [
36].
Depending on the charging level that the charging station may supply, it can benefit the EV owner with a shorter charging time. However, it can harm the power quality of the microgrid, reducing power factor and affecting voltage level.
The EV model utilized in this paper considers the charging power and the battery capacity, that can be expressed by
where
represents the efficiency of the EV inverter,
indicates the EV battery capacity,
represents the time step considered in minutes for this work,
is the selected charging power given by the controller,
and
are the actual and estimated SOC, respectively [
1,
13]. This SOC estimation reflects a linear behavior of the charging process and simplifies the control development.
Some restrictions must be applied to the
variable in order to verify the EV performance, and providing the control law limitation. The state variable restrictions for SOC can be expressed by
and the limits of control variable
are represented by
Then, when there is no vehicle connected to the charger is equal to 0, likewise when the reaches the minimum and maximum limits.
3. Proposed Control Strategy
A control strategy of microgrid management is proposed in this paper, employing a multiobjective technique that considers different operation modes and aims to achieve both power factor regulation and economic battery charging. The more straightforward mode utilizes the charging station inverters only for reactive compensation, and the other two modes apply an optimization method to determine the ideal references of active and reactive power. Moreover, it is assumed a dependency order among these operation modes to consider the impact on active and reactive power flow of each other.
Many techniques can be applied to the optimized modes to obtain optimal multiobjective management. In this case, the Dynamic Programming method is utilized since the principle of optimality is guaranteed and it is adequate for software implementation [
37]. Moreover, the availability of future data and the minimization of multiple parameters are also eased by the dynamic programming implementation.
3.1. Operation Modes
The description of each operation mode is presented below, highlighting their objectives and the proposed cost functions to fulfill the microgrid and the EV users’ requirements.
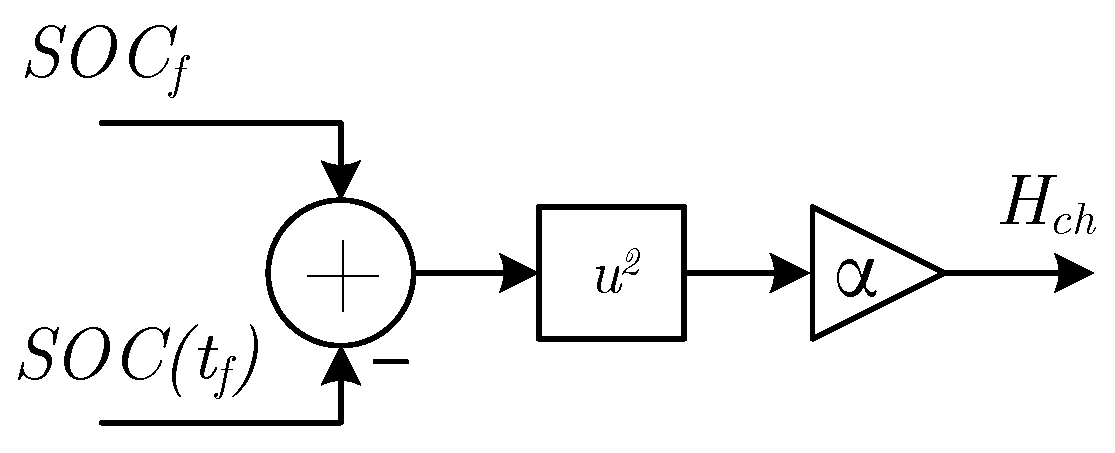
3.1.1. Charging Mode
The main goal of this mode is charging the vehicle during PV generation surplus or/and with a lower pricing level. The EV user must define a final SOC, and the control strategy will reach this value at the disconnection instant. It is important to notice that, when the vehicle charging occurs simultaneously with a damaged power factor moment, the power factor compensation is not accomplished by this mode. Therefore, the other microgrid inverters which remain idle must change their operation modes to support the inadequate power factor.
The cost function of this operation mode is composed of an element that is utilized to ensure the final SOC achievement. Its schematic diagram is presented in
Figure 2 and the corresponding equation is defined as follows
where
indicates the element related to the final state of the cost function,
is a weight determined for this element,
is the desired final SOC chosen by the EV user,
is the calculated SOC in the final time
of the connection period. By the analysis of (
12), it can be seen that the higher the error between
and
, the higher will be the cost related to this element. The weight
is utilized to set the importance of this part and directly influences the cost; a high value must ensure that SOC attainment [
1].
The EV user specifies the disconnection hour and the control searches to provide the desired SOC at this time. However, if the vehicle disconnects before the defined hour, the control management is not responsible to ensure the desired final SOC.
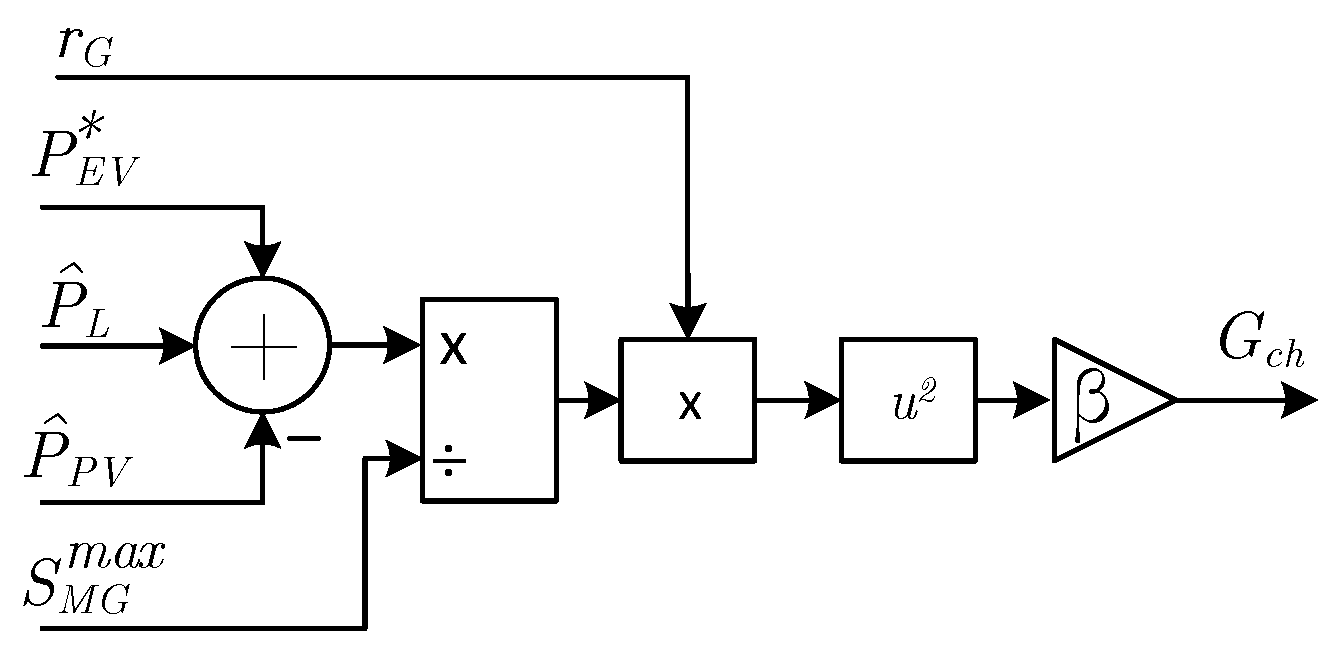
The other element that forms the Charging Mode describes the active power flow of the microgrid multiplied by the energy price and is expressed by
, it indicates the more feasible point of power and price.
Figure 3 indicates the schematic diagram.
Through
Figure 3,
can be specified by
where
is defined as
which it is the period that the vehicle stays connected to the charger, considering that
is the disconnection hour previously mentioned, and
is the connection hour. When the current time
t of the system passes
it is assumed the system time
t as the first sample. In (
13),
represents the importance weight,
and
the future data of the EV connection time,
indicates the maximum power possible scenario in the microgrid and it is applied to normalize the power flow, and
is the energy price of the distribution network [
1].
There are countries that define dynamic pricing schemes to their energy market, which can be incorporated in
. In this paper, scenarios with fixed and dynamic price levels were employed to verify the performance of the control strategy in distinct situations. A lower price level stimulates the charging while a higher price expects a charging limitation. The exponential term in (
13) ensures that slight variations in power significantly increase the cost, enhancing the control law behavior. The
represents the optimal active power set by the control strategy, and, in this case, a lower value decreases the cost factor.
The two elements
and
can be combined to determine the cost function of the Charging Mode, which can be seen in
and expanding the terms it can be obtained the following expression
In (
15), it can be noticed that the cost function only depends on the active power flow and the error between the desired SOC (
) and the estimated SOC (
) at the end of the connection time. Therefore, the control strategy must define the active power
that reaches the desired SOC with minimum cost.
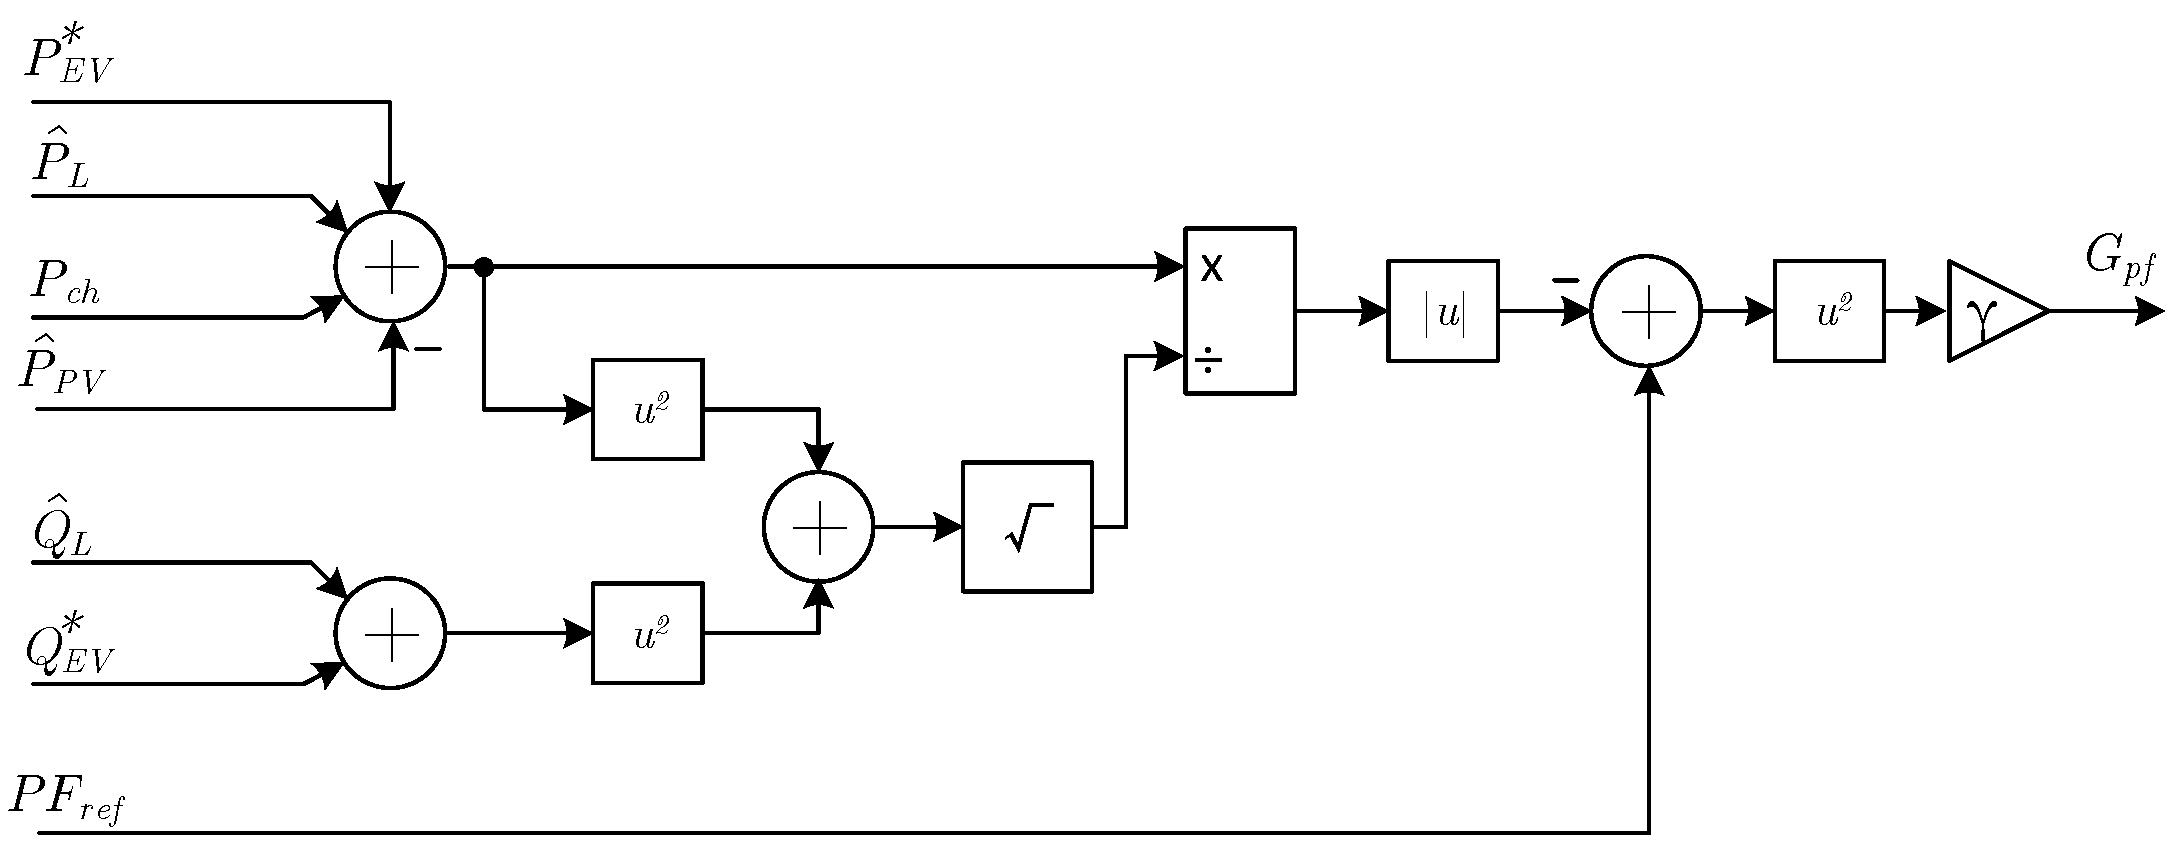
3.1.2. Power Factor Regulation Mode
For a scenario that the PCC microgrid presents an inadequate power factor, the following operation mode can support the microgrid and the EV user. The Power Factor Regulation Mode aims to follow a reference of power factor chosen by the microgrid operator, also allowing the charging of the vehicle. It is worth mentioning that the desired final SOC selected by the EV user may not be achieved, considering the power references needed for power factor regulation. Thereby, the inverter can restrict the active power to release the reactive power, decreasing the charging process.
Figure 4 illustrates the schematic of the block diagram utilized in this operation mode.
The element that presents the error between the desired and the estimated power factor at the PCC of the microgrid is represented by
and expressed by
where
indicates the importance weight of this part,
is the reference of power factor selected by the microgrid operator,
is the Charging Mode demand if it exists, and
represents the optimal reactive power of the charging station. The Charging Mode demand is considered in this mode to ensure the dependency order and establish the charging impact to achieve a better control operation.
In order to facilitate the control performance when the power factor is higher than the reference, it is assigned a modified weight directly to the reactive power
. When the estimated power factor of the microgrid
is lower than reference
the weight is reset, which can be seen in
Therefore, since
, decreasing the
in (
16) results in a higher cost path for
, then applying a minimum gain to
the lowest cost path must be related with a
greater than
, ensuring a better control performance.
The cost function of the Power Factor Regulator Mode is formed by combining the above parts with the Charging Mode elements previously proposed with minor adjustments. Thereby, the cost function is presented as
where
is characterized as
A module is applied to the power flow of the term to improve the control law. In this case, the impact in the active power flow is not the aim of the mode. Moreover, it is added the demand profile of the Charging Mode for the same reason previously explained.
Analyzing (
18), it can be noticed that the control variables
and
are calculated based on the
, the lower cost values determine the control references to each time
.
3.1.3. Standard Mode
The last operation mode is utilized to guarantee power factor correction. Some reference deal with reactive and active capability power injection of inverters as can be seen in [
38,
39]. In the proposed case, when there is no vehicle connected to the charging station, the inverter can provide reactive compensation by injecting only reactive power. This mode is required just for power factor issues, and, in other cases, the inverters remain idle. The reactive power needed for the regulation purpose is performed directly by
where,
and
, and
t represents the current time of the system.
In (
20),
is the active power demand of the Power Factor Regulation Mode,
is the reference power factor, and
represents the power factor at the PCC considering all previous modes, as presented in
where
is the reactive power demand of the Power Factor Regulation Mode.
The variable
in (
20) indicates the number of inverters without a vehicle connected, then the evaluated reactive power is distributed equally to all available inverters. If the absolute value of the calculated
is greater than the maximum apparent power of the inverter, the output is limited.
3.2. Controller Weights Tuning
In order to apply the right setup of weight values that provide a suitable control performance and allow the system to fulfill both the EV users and the microgrid objectives, their response is analyzed by modifying the applied value.
For the Charging Mode, a unit weight value for and already accomplished the desired objectives. However, for the Power Factor Regulation Mode, a detailed analysis is necessary.
The unique control response is verified for a single EV that connects at 8 am (
) and disconnects at 5 pm (
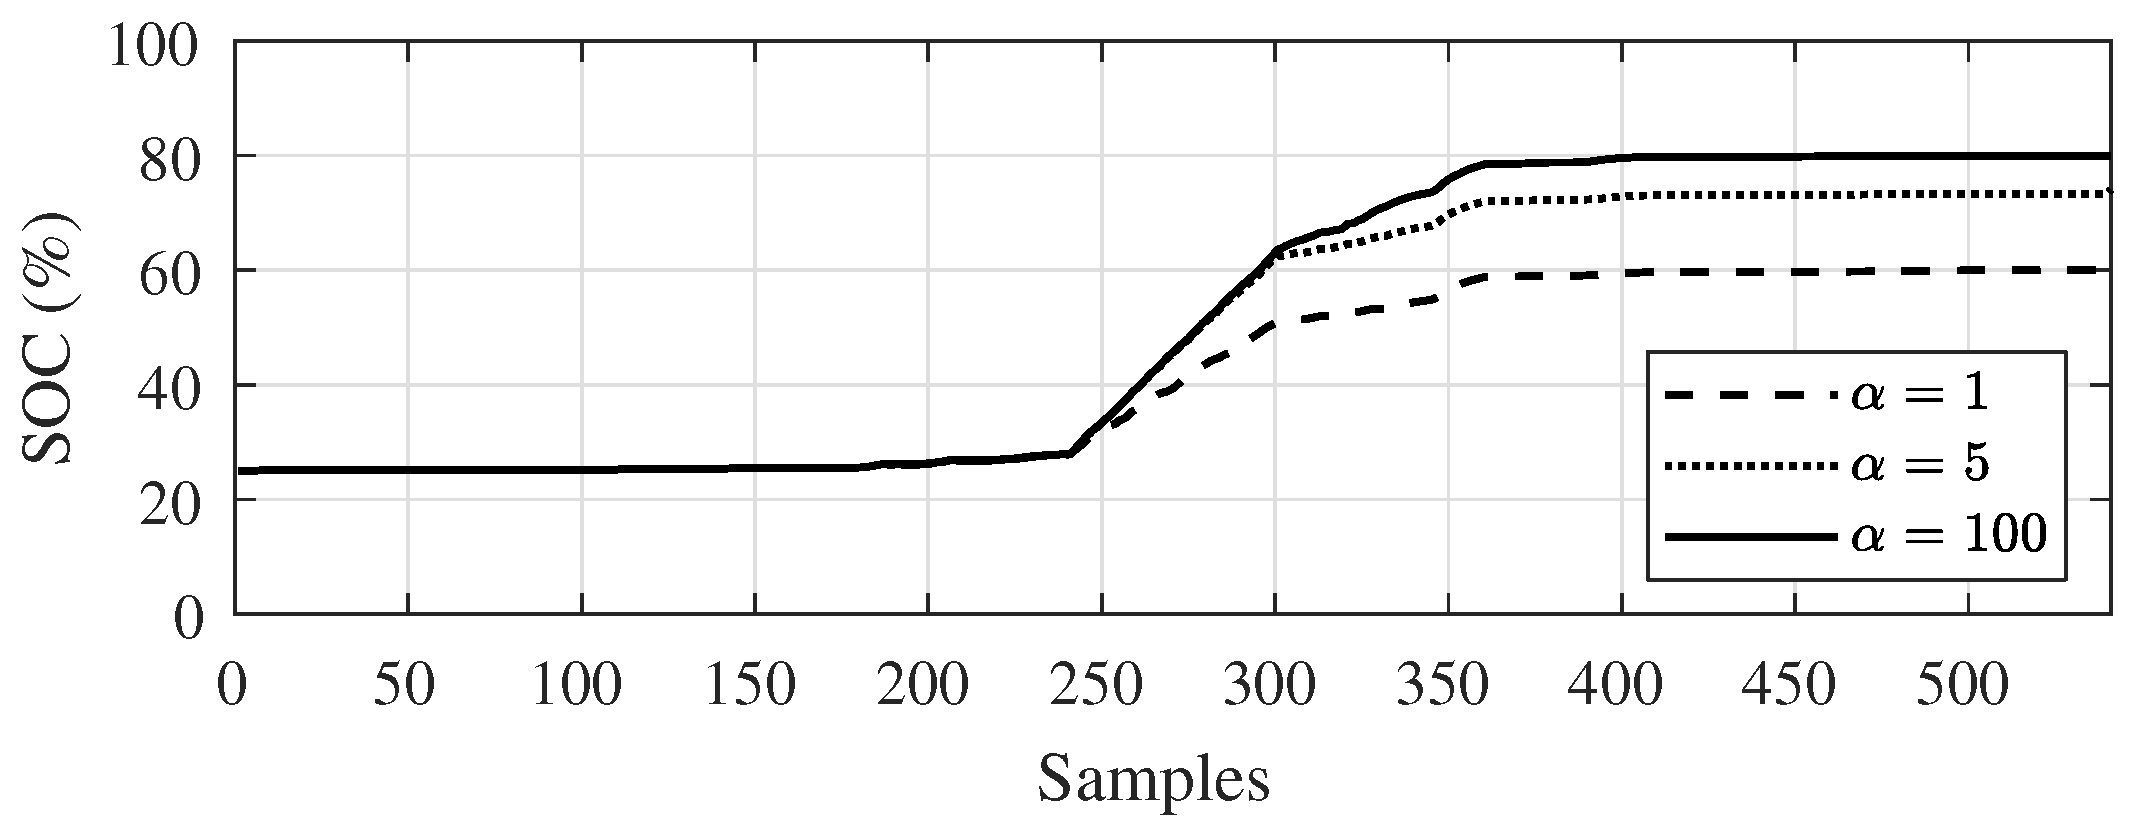
). For this example, it is selected that the EV battery capacity is 50 kWh with 25% at the beginning while intending to reach 80% at the end. Considering these EV parameters, first, the impact of
in the SOC variable response is investigated in
Figure 5.
Since the standard control response for all unit weight does not achieve the desired SOC,
weight must be adjusted, considering that this variable is related to the
. By observing
Figure 5, the higher the weight value, the closer is the state response to its desired value. However, there is a threshold value where greater variations no longer affect the response.
For the proposed system, it is considered because the following and weights may affect the SOC response. Therefore, a high value is applied to ensure the proper control response that satisfies the EV user.
Related to the other weights,
Figure 6 presents how
and
impacts both the state and the control responses. In this analysis is considered the same EV configuration and the selected value of
previously chosen is maintained.
Starting from the effect, in (a) it can be seen that by increasing the weight value to 10 the power factor keeps closer to the reference value of 0.95, considering that relates with . Naturally, on the other hand, high variations are introduced in the control variables and in order to maintain the low deviations in power factor.
By changing the analysis for the weight, in (b) a significantly better control response can be seen in the and , just increasing the weight to 10. is related to the element, and it is expected an improvement on control variables since it deals with the active power flow. However, the power factor response suffers a downgrade, presenting a much variable characteristic.
Considering the analysis of the tuning weight, the value selection for the controller weights is given by , , and , since a high ensures the desired SOC at the disconnection instant, and a slight increased improves the control variables performance without losing the power factor precision.
3.3. Microgrid Management Algorithm
An algorithm is developed that incorporates the operation modes and manages them to fulfill the users’ requirements, acquiring the microgrid measures and setting the control law references.
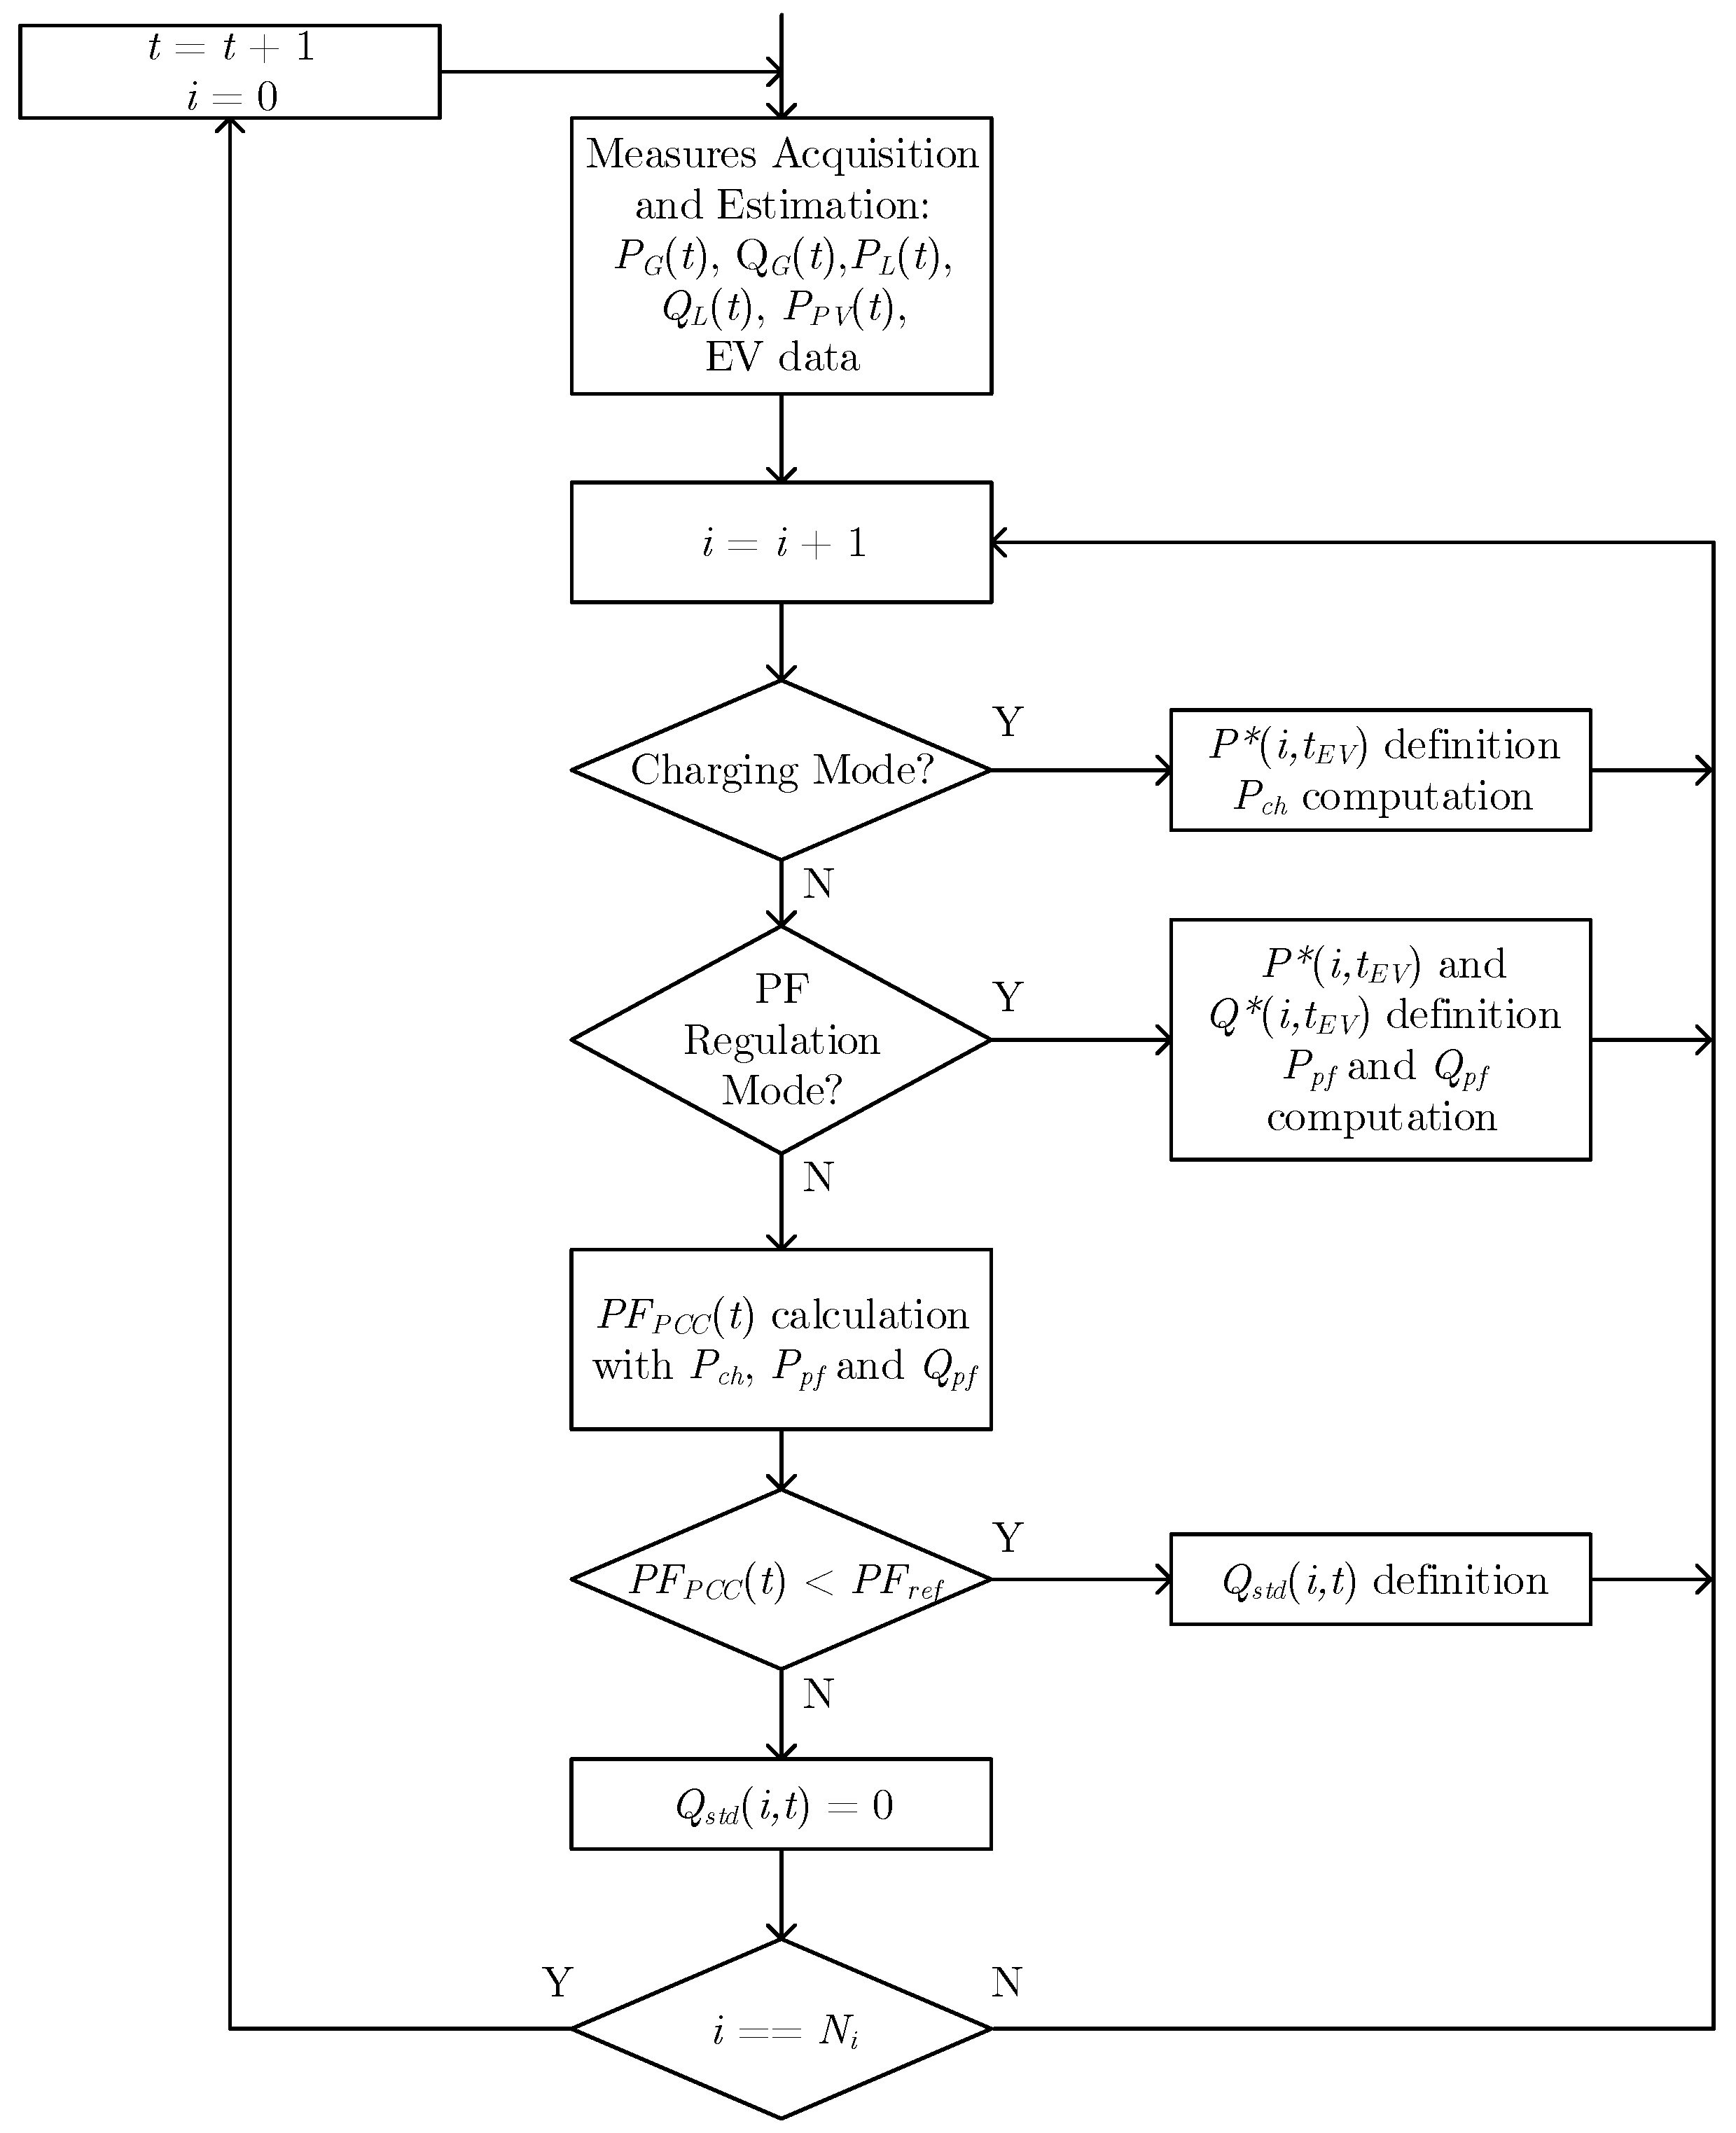
The operation of the microgrid management follows the flowchart logic presented in
Figure 7.
In each time step t, the measures of active and reactive microgrid power at the PCC and PV generation are collected, together with all EV data such as, connection and disconnection hour, current and desired final , and battery capacity .
First, the active and reactive load demand power are estimated by (
1) and (
2), considering the smart meter measures at the PCC and at the PV inverter. Then, each EV charging inverter
i is analyzed and verified which operation mode was selected.
If the Charging Mode is chosen, the optimal profile of active charging power is determined by dynamic programming, and all power references of each time interval are saved in the array. In the dynamic programming technique, initially, all ranges of possible state variables are analyzed with each possible control variable, which is done in a time regressive process. In this paper, the state variable of this mode is the of the vehicle, and the control variable is the charging power . In the regressive part, it is defined the cost of the final sample of the analyzed time period, testing the variation in the related to each possible value, and the minimal cost is saved. Then, this process repeats until the first time sample, and the respective cost and control laws are saved in proper arrays. In the second part, it is performed a progressive process, utilizing the parameters of the system as the initial state variable, in this case, the current of the vehicle. Therefore, based on the initial state, the control and the minimal cost arrays are utilized to handle the state variable to its optimal trajectory, and the corresponding power references are saved in . The process repeats at each time step t of the system, decreasing the length of the time interval considering that the first sample of changes with the current time.
On the other hand, if the user selects the Power Factor Regulation Mode, the optimal active and reactive power are established and the references are storage in and arrays. In this case, two control laws must be defined, the state variable is straight affected by control, and the influence of is verified directly in the cost function. This operation mode follows the same process as the previous mode. Each possible state is analyzed against each possible control variable. Their costs are compared, and the optimal value is storage. In this case, the values of and that most closely approximates the power factor to its reference and supply the vehicle requirements are selected.
After the optimal modes evaluation, the power factor at the PCC (
) is examined, considering the active and reactive power profile previously calculated. Therefore, it is verified if the estimated power factor is lower than the power factor reference
selected by the microgrid operator. If it is true, the third mode is requested, and the reactive power
is calculated based on (
20) and distributed to the remaining inverters. If it is false,
has an adequate value and
of the inverter
i at the time step
t is set to zero.
This entire process repeats until all inverters, represented by , are analyzed. Then, the management waits for the next time step , and reset the inverter counter i.
4. Results
Matlab script was developed to verify the performance of the proposed control strategy of microgrid management. It was considered the microgrid infrastructure presented in
Figure 1, and Equations (
5) and (
7) to examine the system parameters of voltage and power factor at the PCC, respectively. Initially, the microgrid management receives the collected data from the acquisition process, then this information follows the flowchart logic shown in
Figure 7.
Related to the control gains and the microgrid parameters utilized in this paper,
Table 3 gathers the weight values of the operation modes, the reference power factor selected, and the microgrid feeder parameters.
The feeder parameters
R and
X are chosen based on typical low voltage systems specified by [
26]. The time step
from (
9) indicates that each minute the management receives the system information and calculates the power references. The weights
and
corresponds to the Charging and the Power Factor Regulation Mode, respectively, as well as the
and
. The quantized levels of the state and control variables are represented by
,
and
, presenting its corresponding values in both optimized levels. These levels indicate the number of possible values that are tested in the dynamic programming method, and the higher the number of levels the more processing time is needed.
In the proposed system, it was considered four vehicle slots in the parking lot, and all EV information such as SOC, battery capacity, and connection period are indicated in
Table 4.
It can be noticed in
Table 4 that all battery capacity is the same to contribute to the charging analysis. However, it is reinforced that the proposed control strategy can manage different capacities with distinct connection periods.
4.1. Scenario 1: Typical Parameters
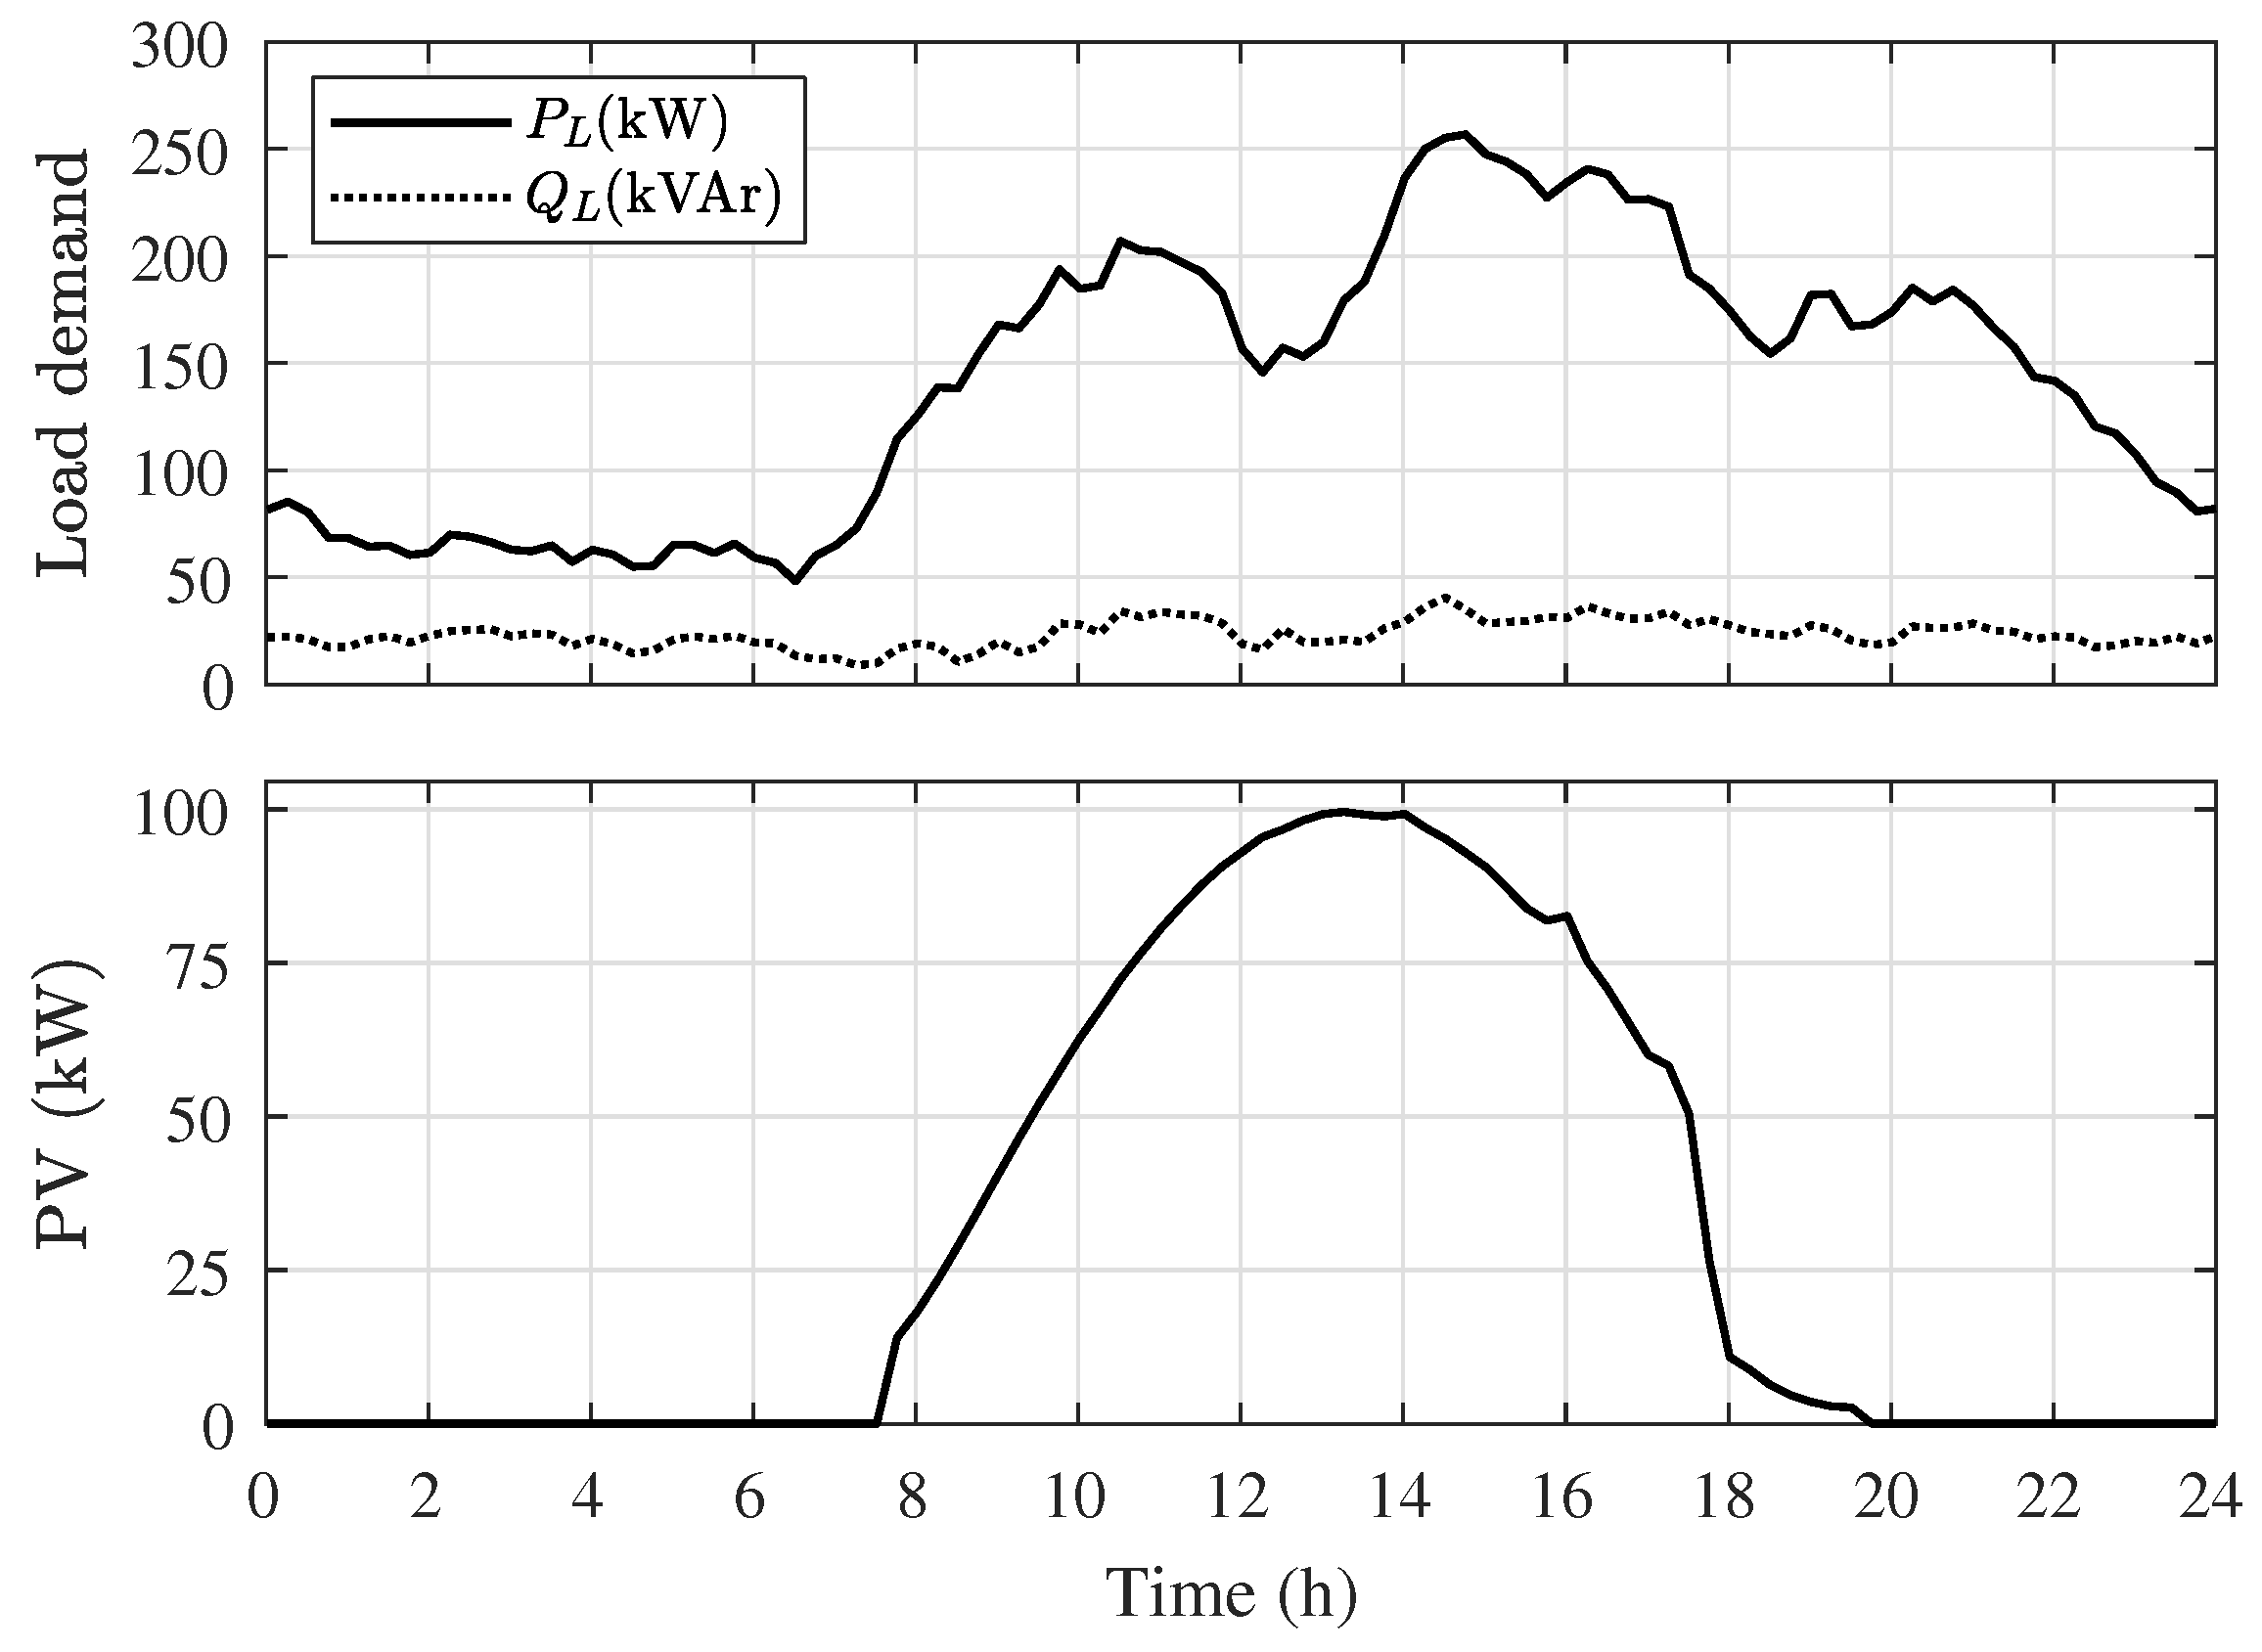
In the first scenario, the microgrid is examined with typical values of load demand and PV generation based on [
16,
25], and the energy price is considered as fixed with 0.084
$/kWh based on the household electricity price [
40]. The microgrid PV generation and the active and reactive load demand are illustrated in
Figure 8.
In this scenario, the microgrid does not have any generation surplus, and the load demand is characterized as a typical commercial profile, in which the peak demand occurs during the afternoon. For the future data
and
indicated in (
13), (
15), (
16) and (
19), it is considered the same curves presented in
Figure 8 due to the prediction process is not the focus of this paper.
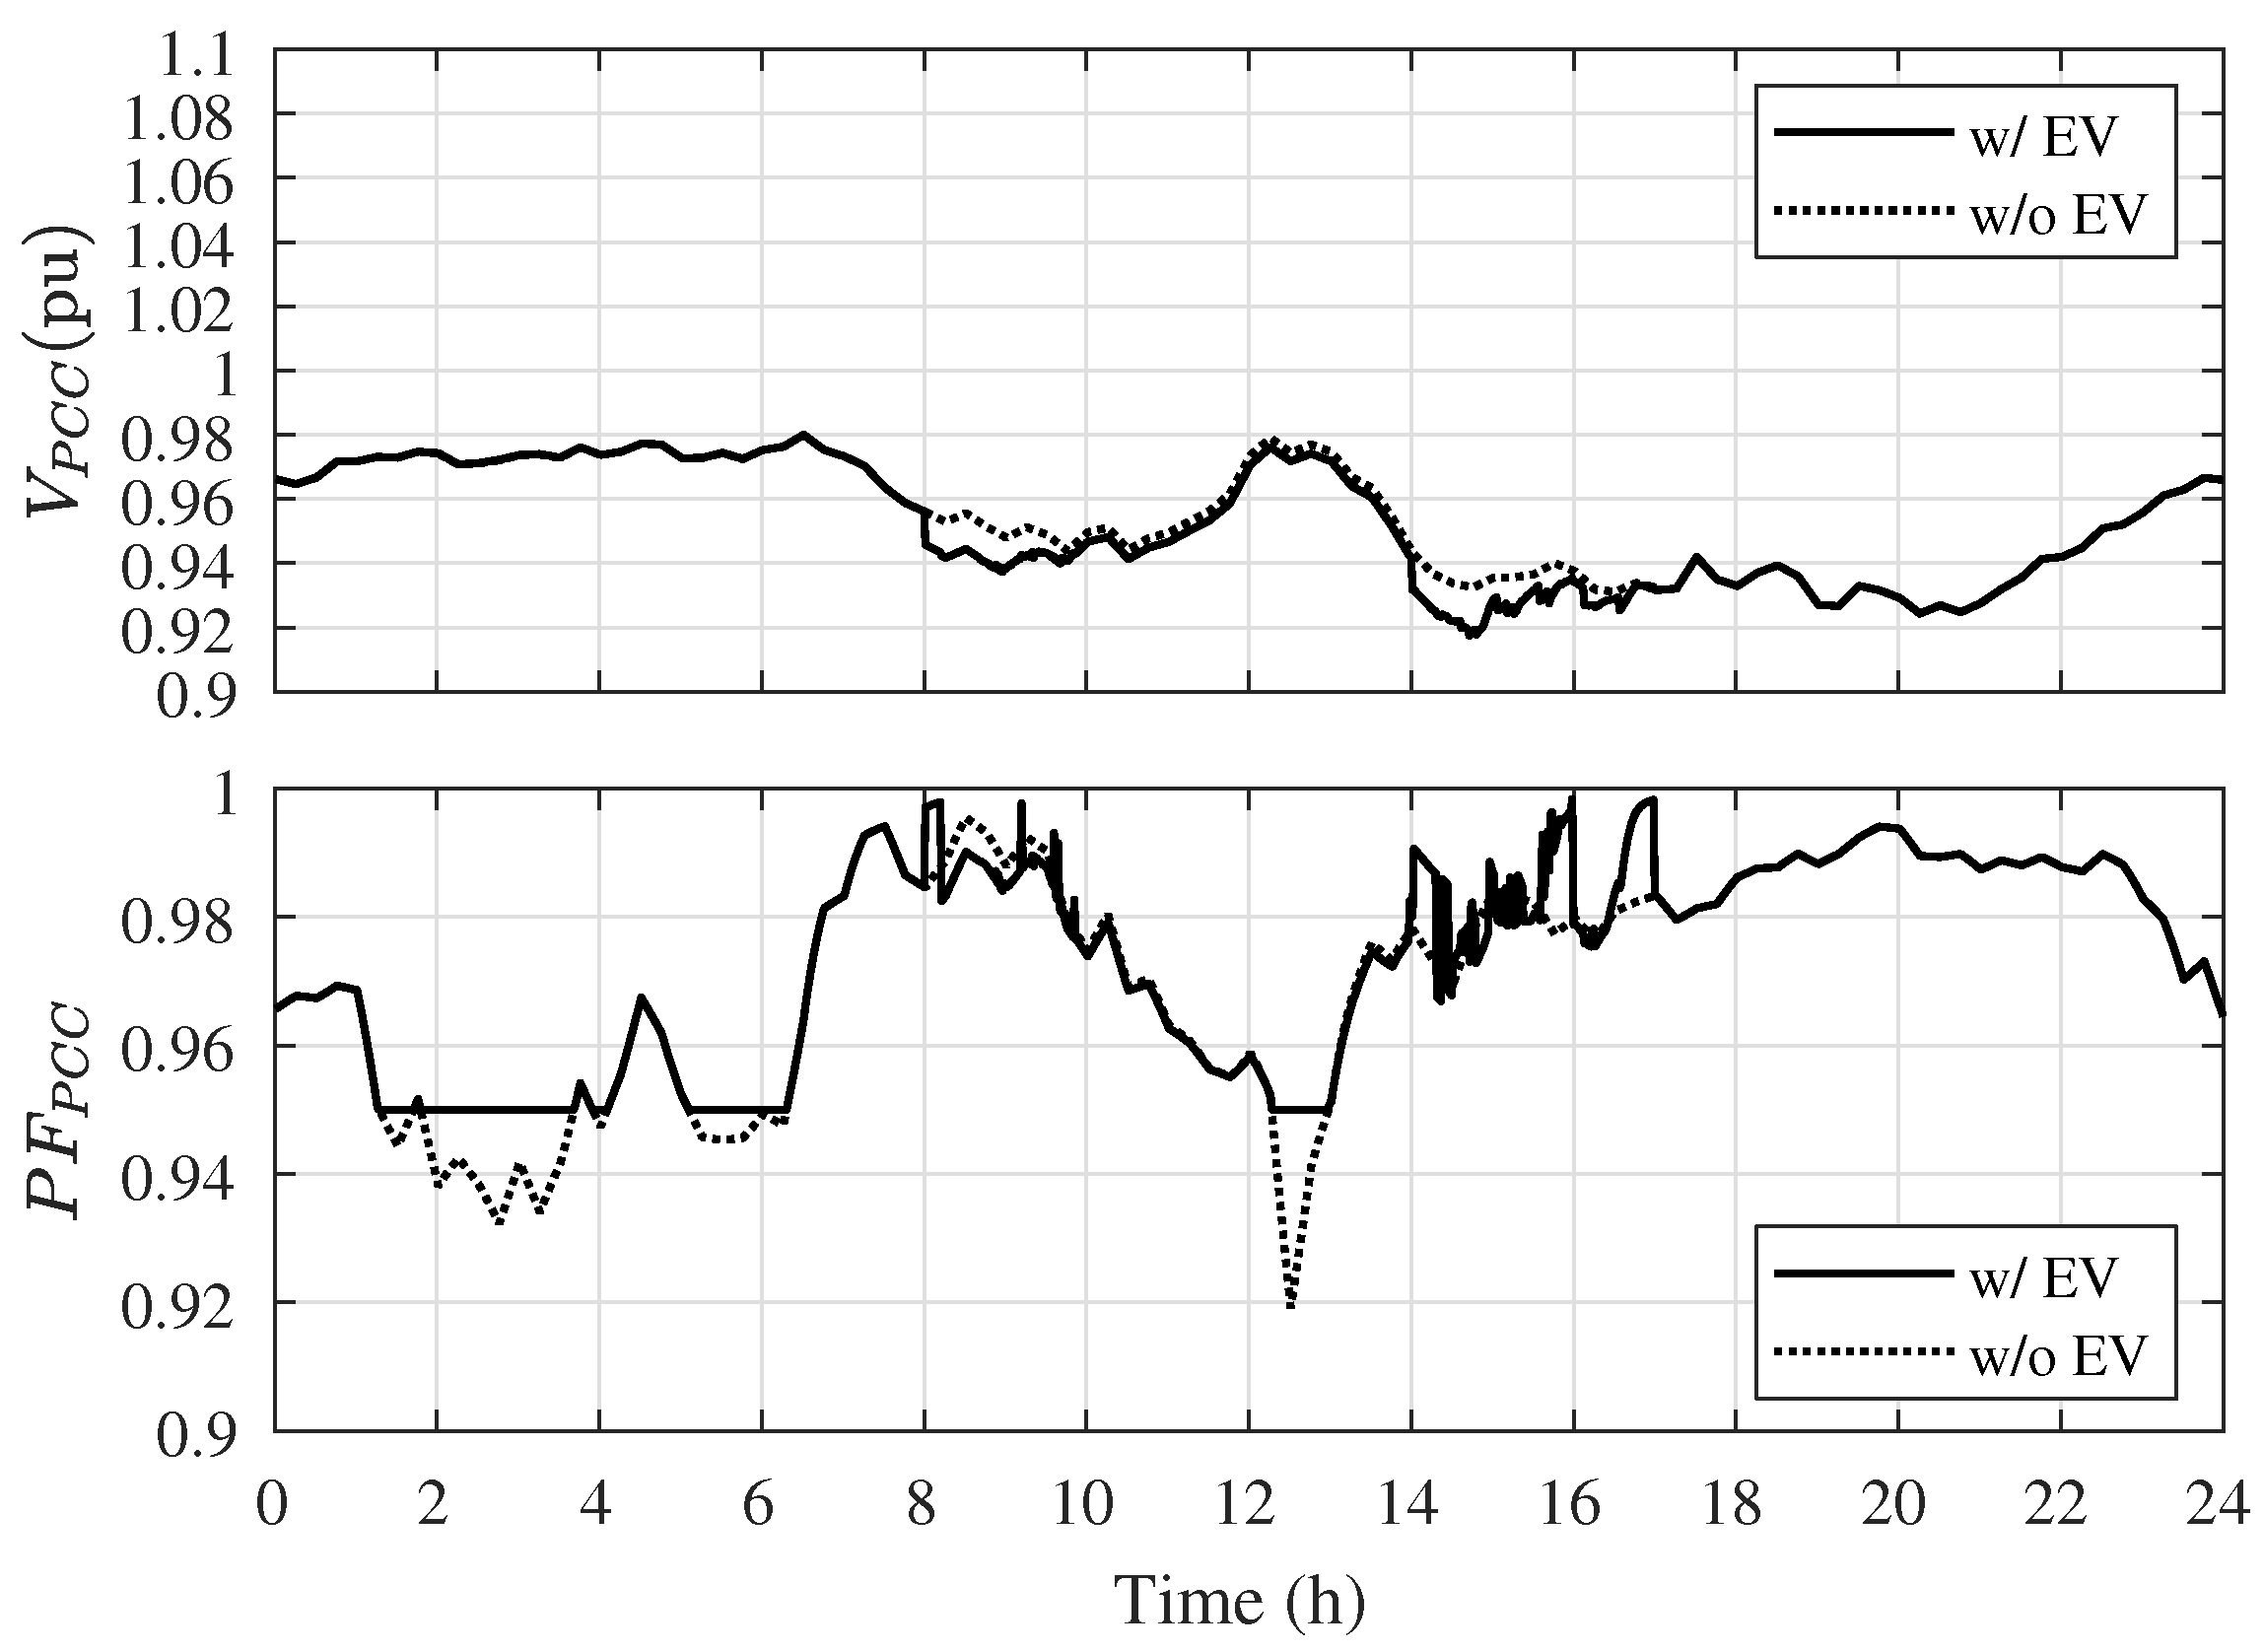
The influence of the EV charging in the microgrid can be seen in
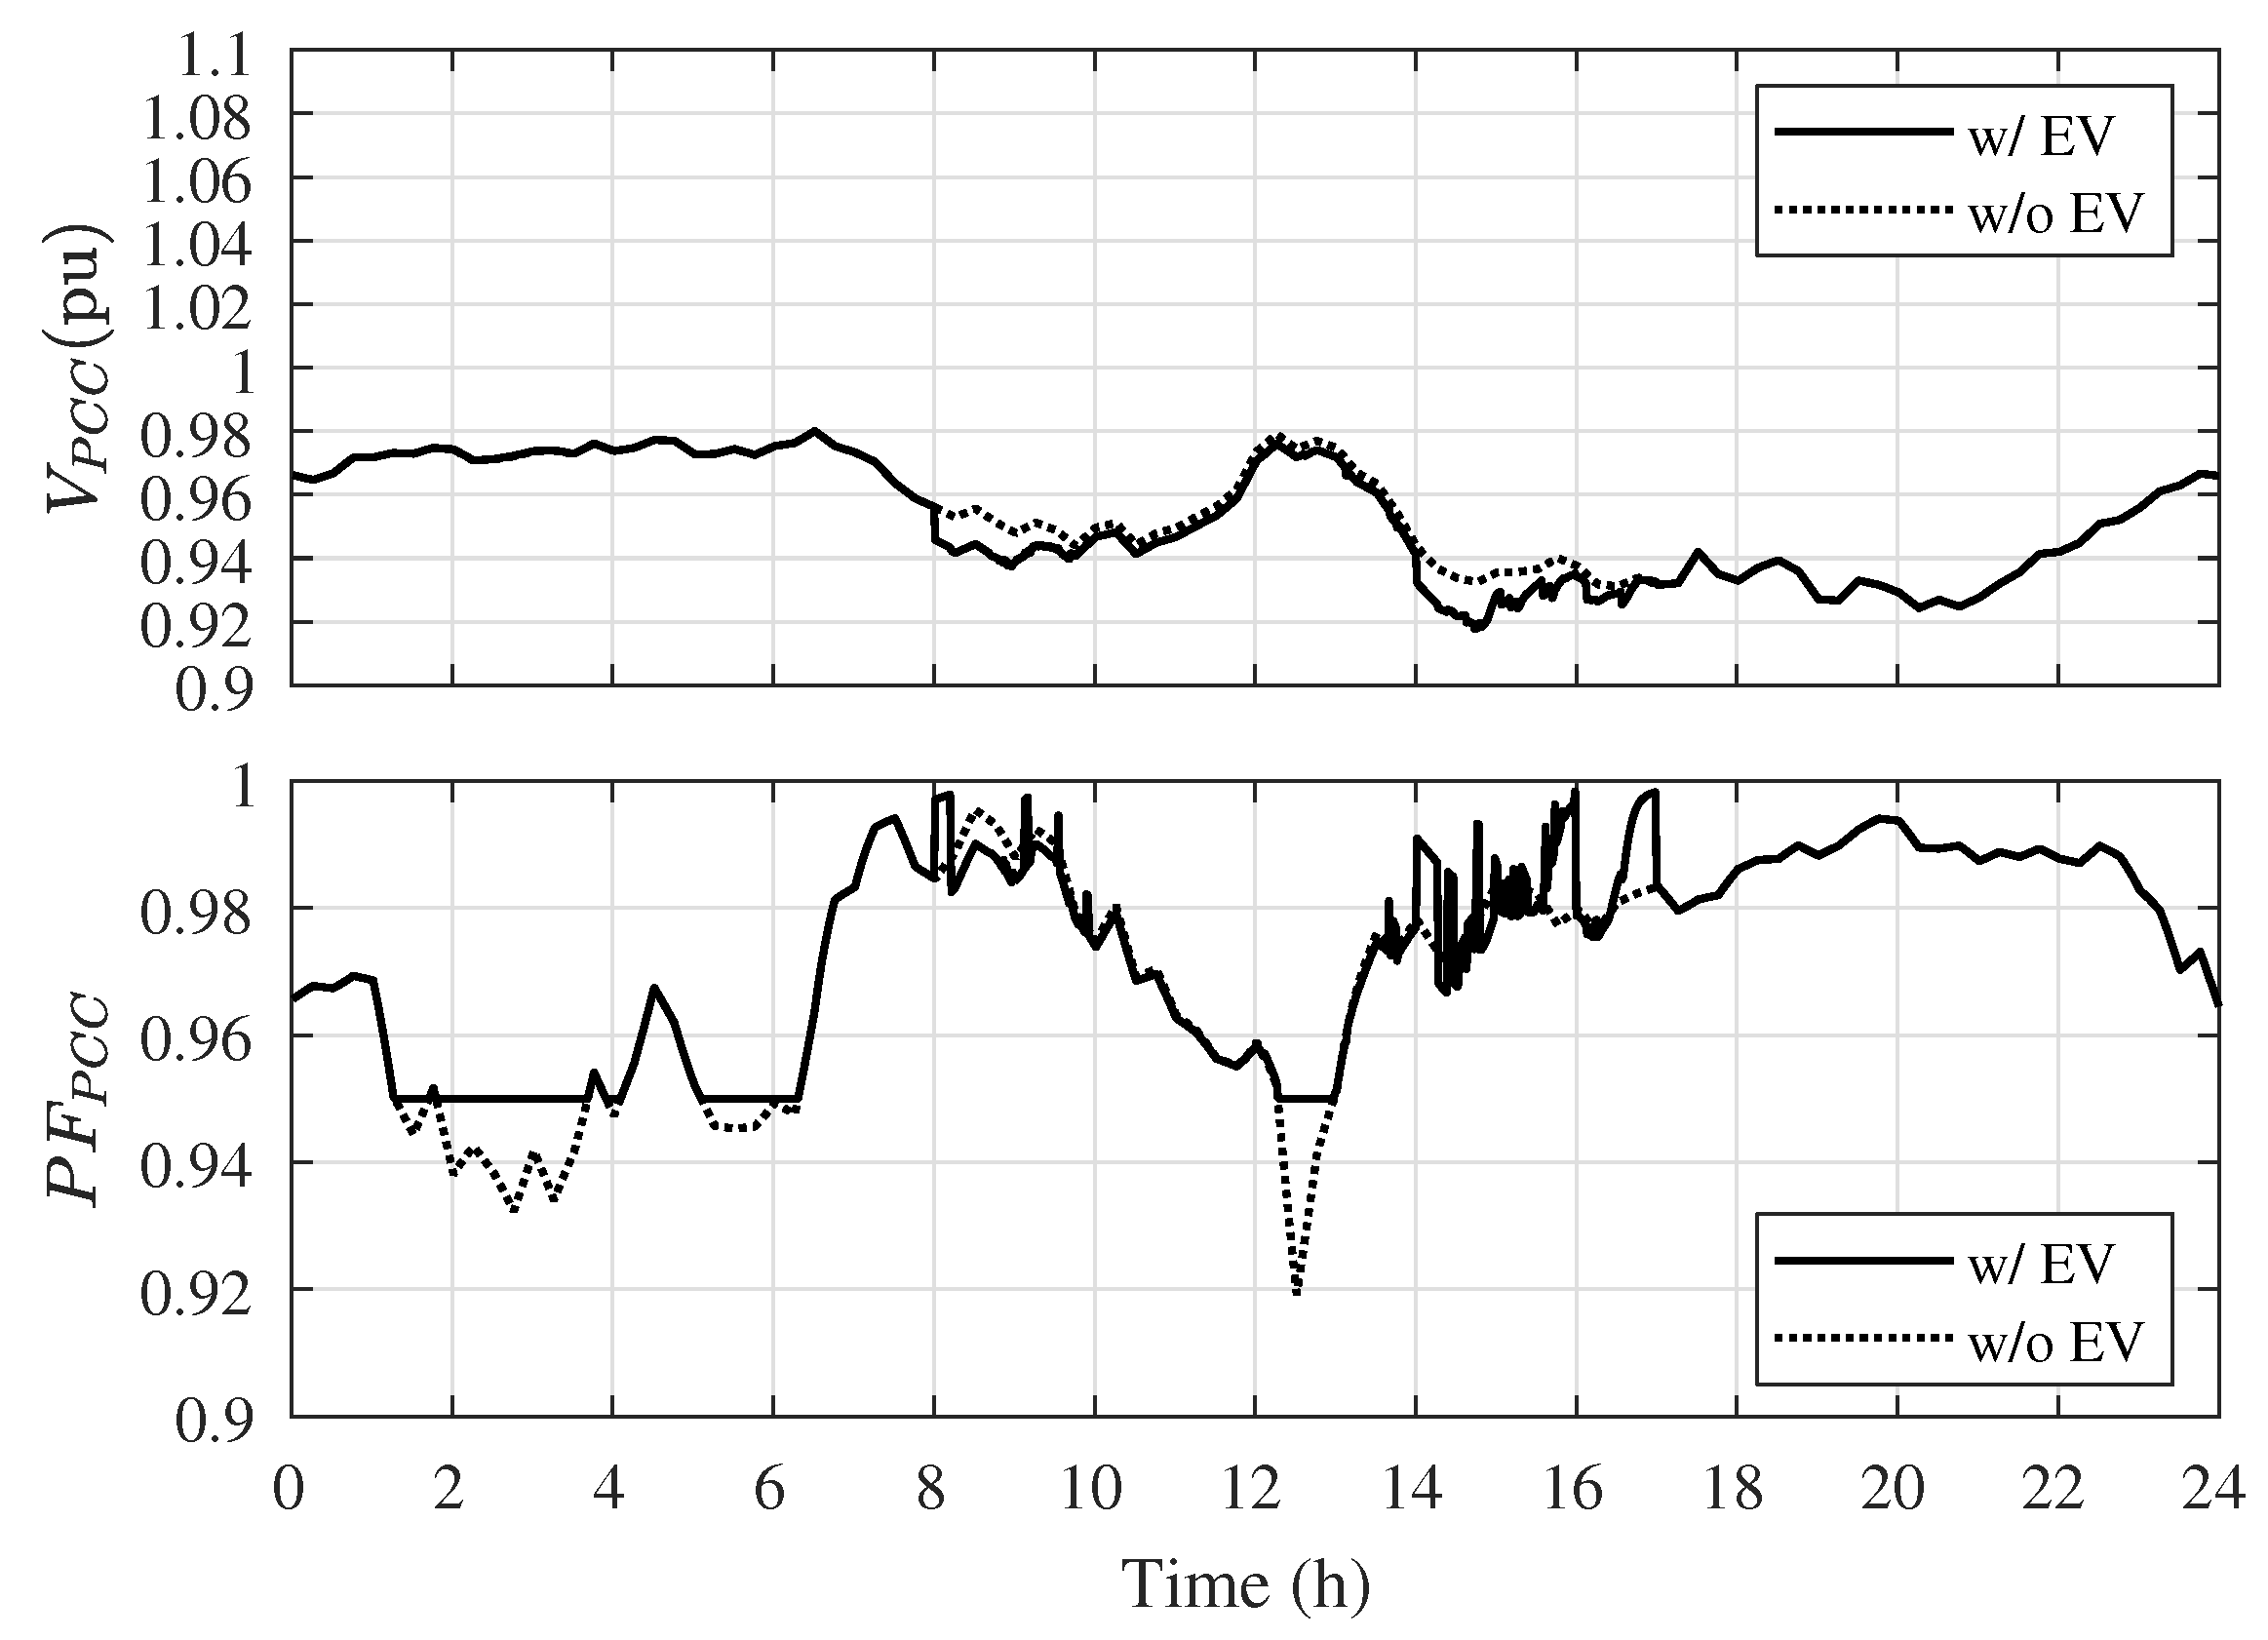
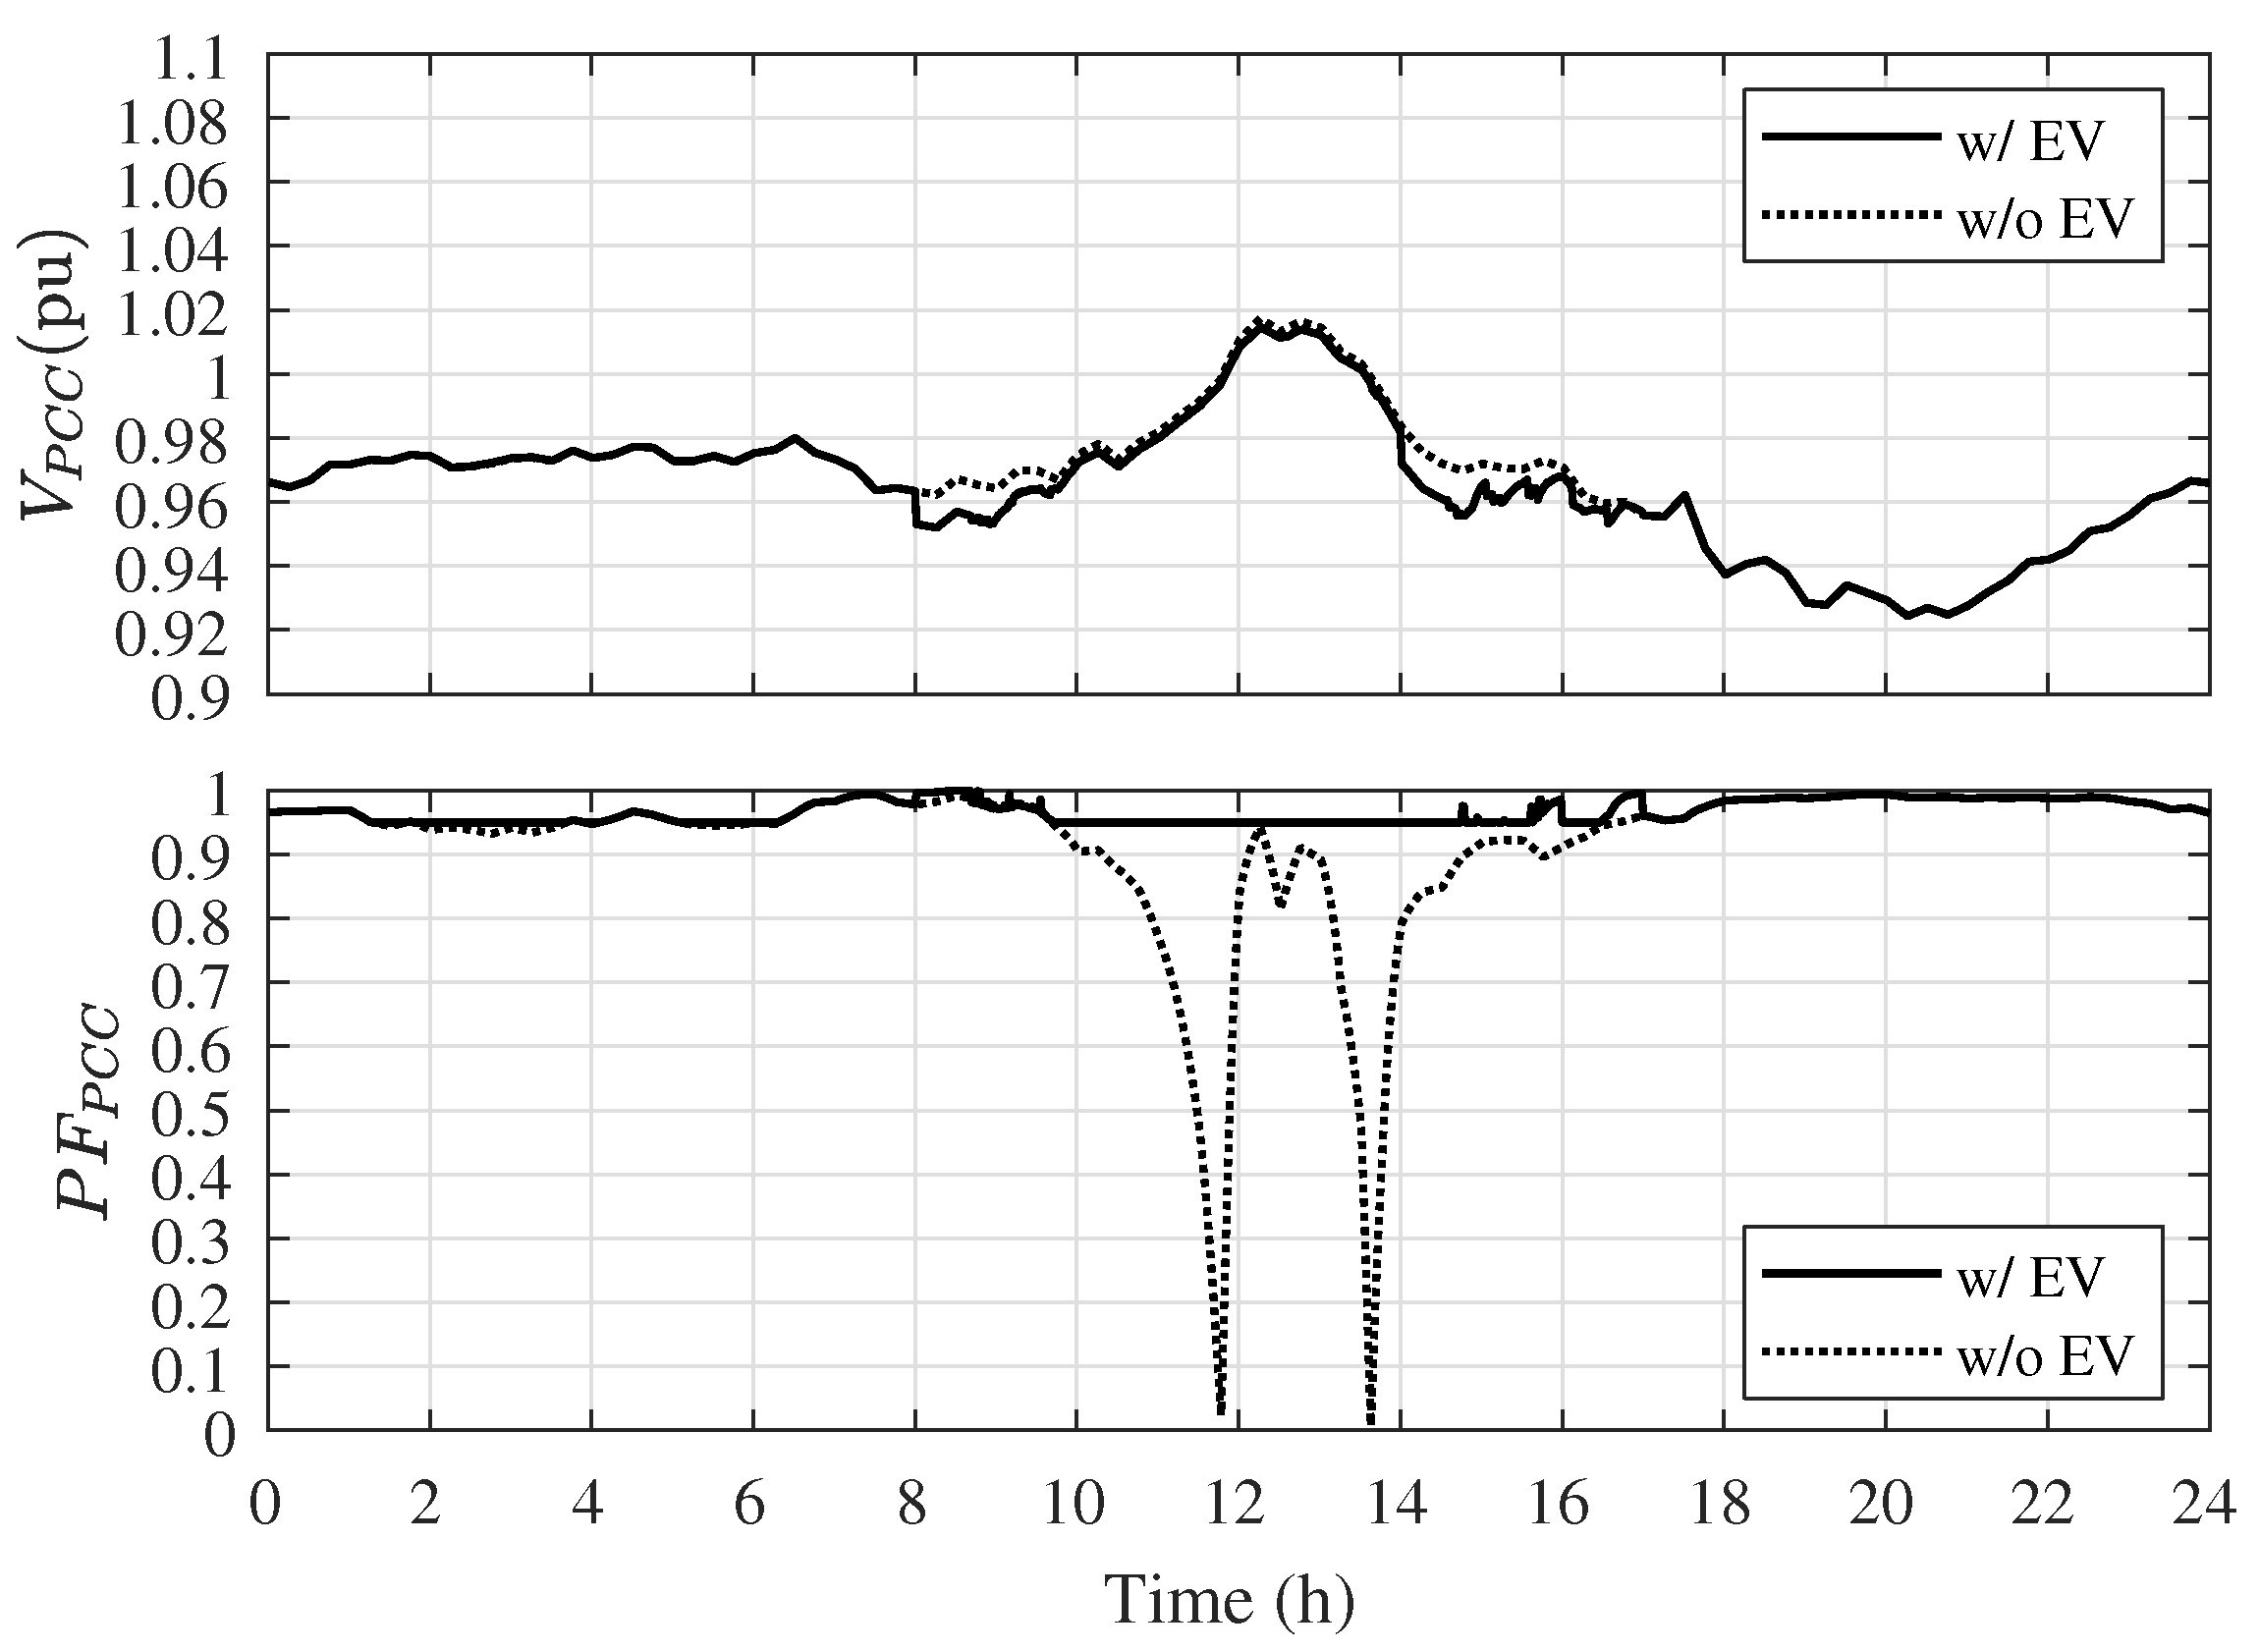
Figure 9, indicating the behavior of the power factor and the voltage at the PCC.
The power factor reference
selected and the other microgrid parameters follow the values indicated by
Table 3. It can be noticed due to the increase in PV generation that the
without vehicles suffers a slight drop during the night, between 2 a.m. and 4 a.m., and a deep reduction at 12 p.m. With the EV control strategy, the
remains above the 0.95, even in wide stress moments. The voltage at the PCC remains in the suitable operation region between the minimal value around 0.92 pu and the maximum value of 0.98 pu, and its behavior is slightly affected by the EV performance.
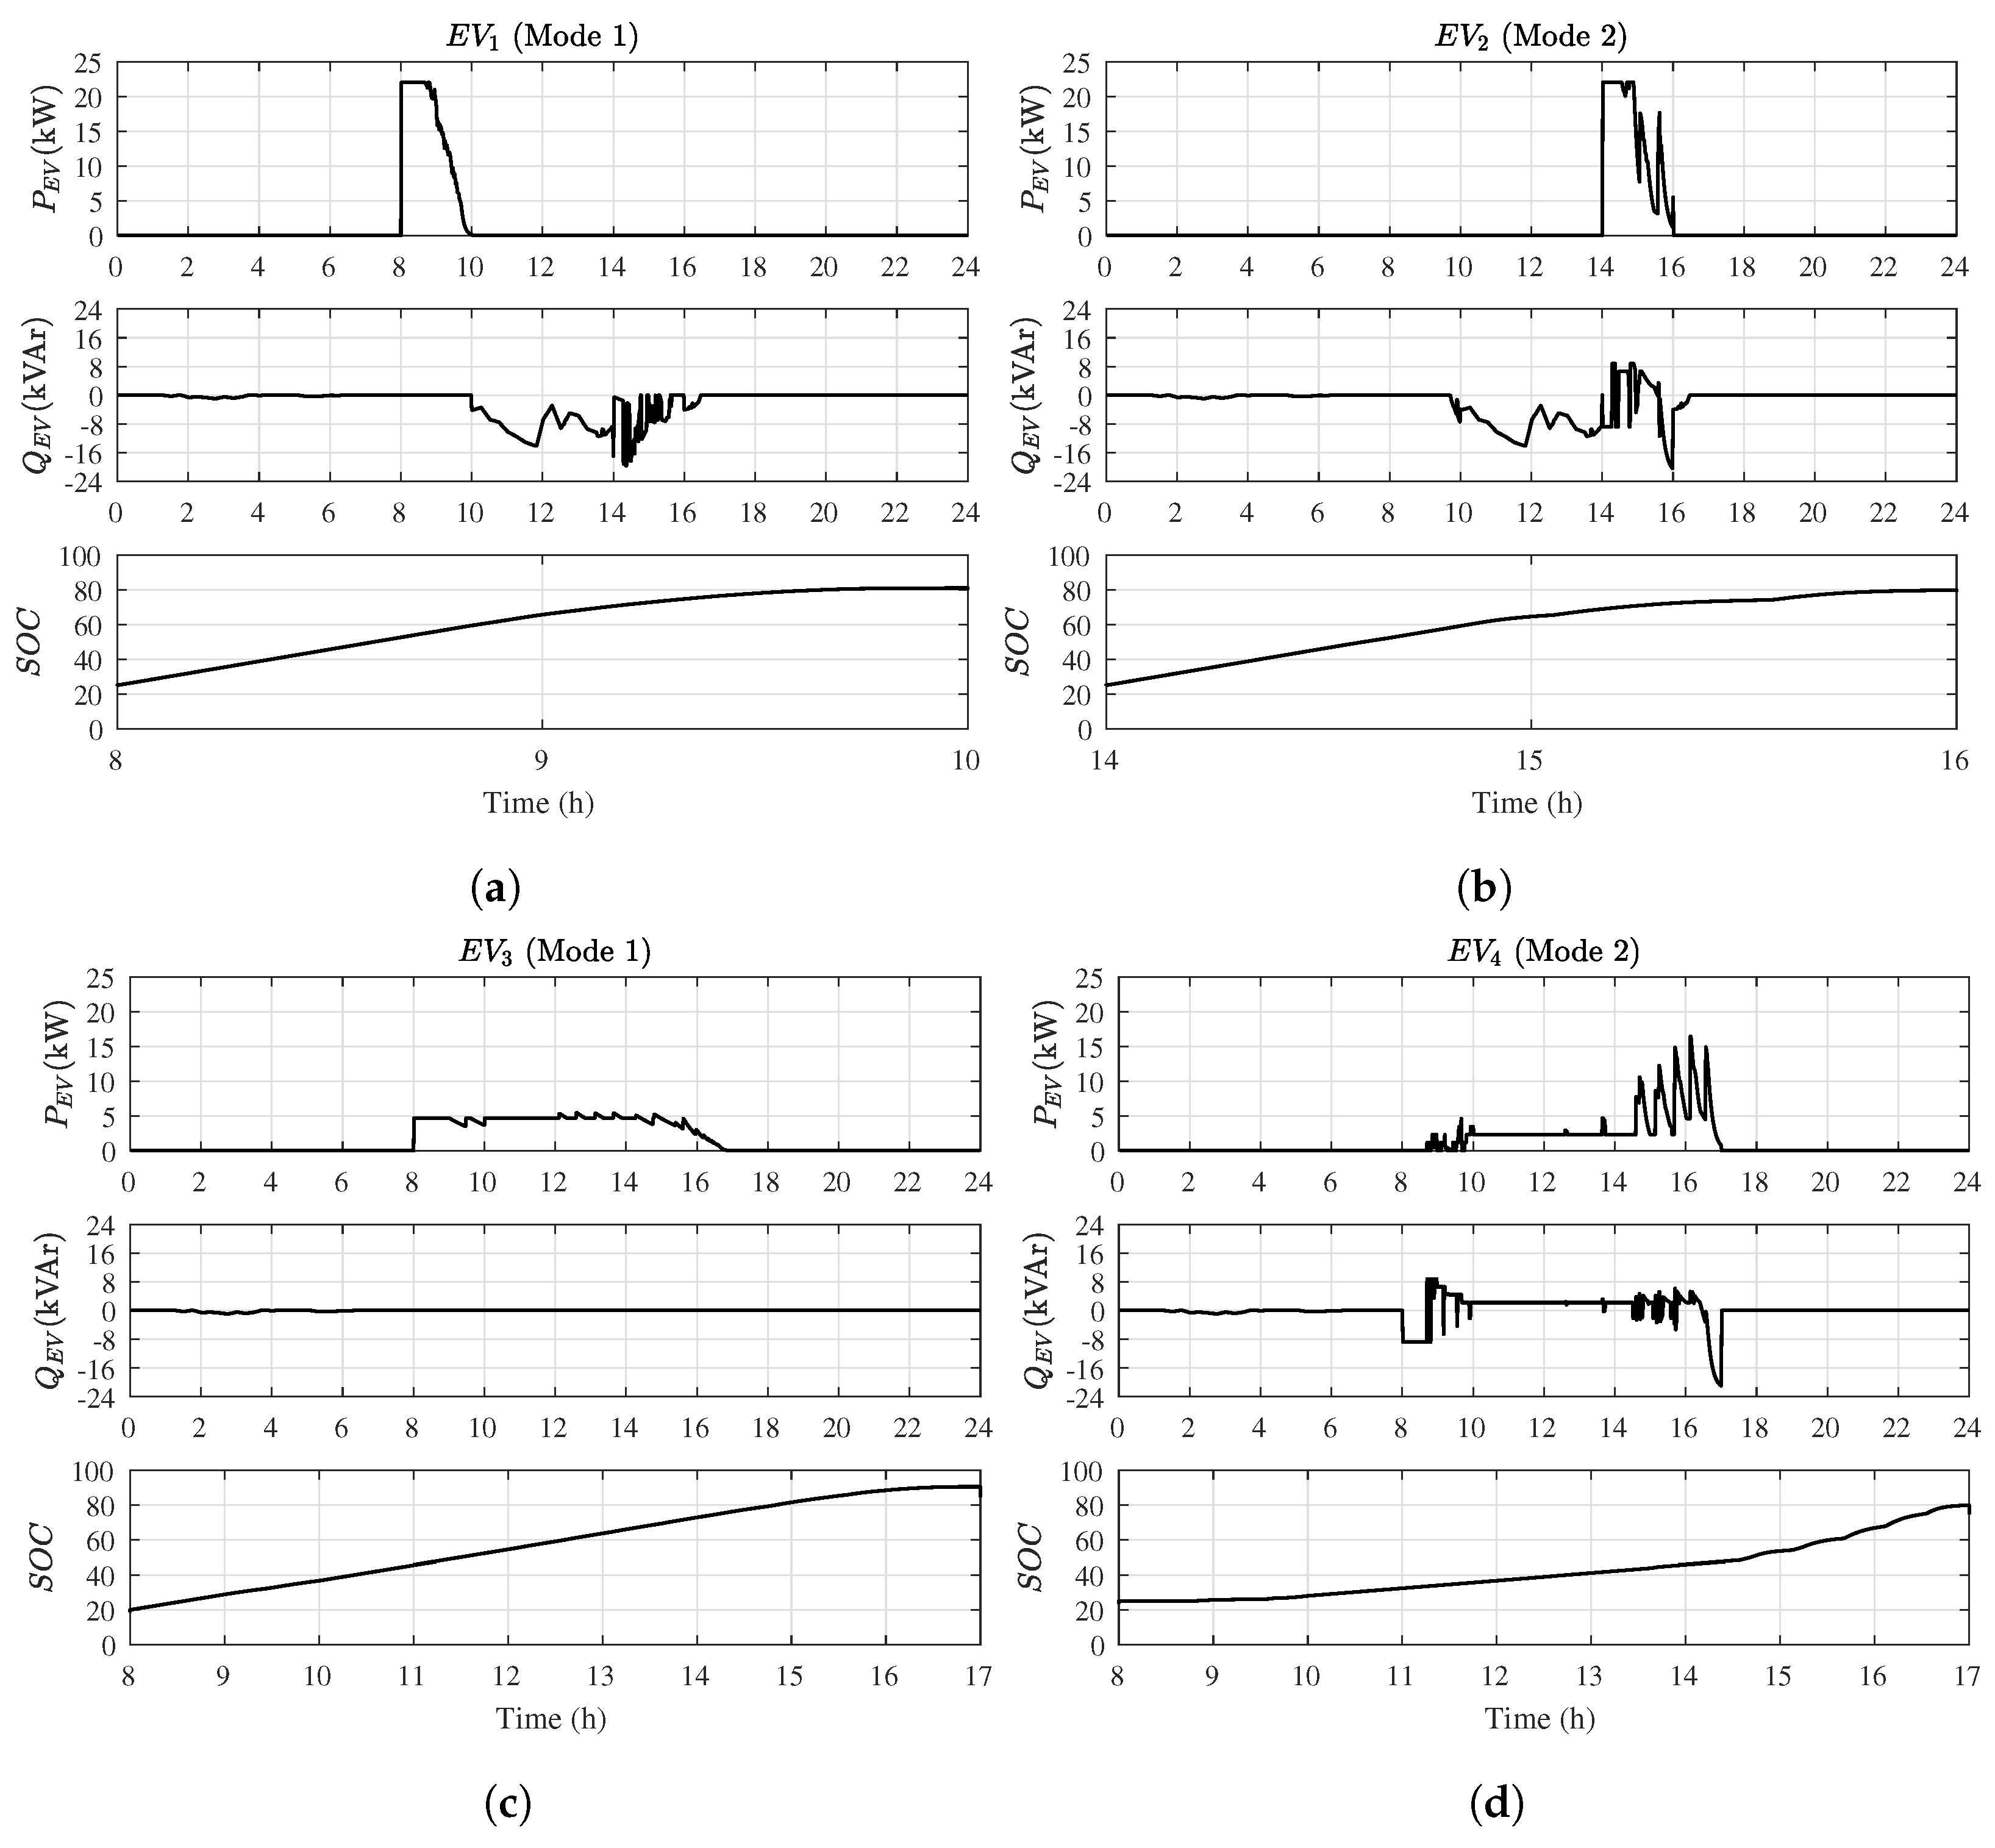
Related to the charging stations, it is selected the maximum charging power of 22 kW for each inverter, corresponding to the second level of the IEC 61851 standard, and a charger efficiency of 94% based on [
41]. Following the connection times indicated in
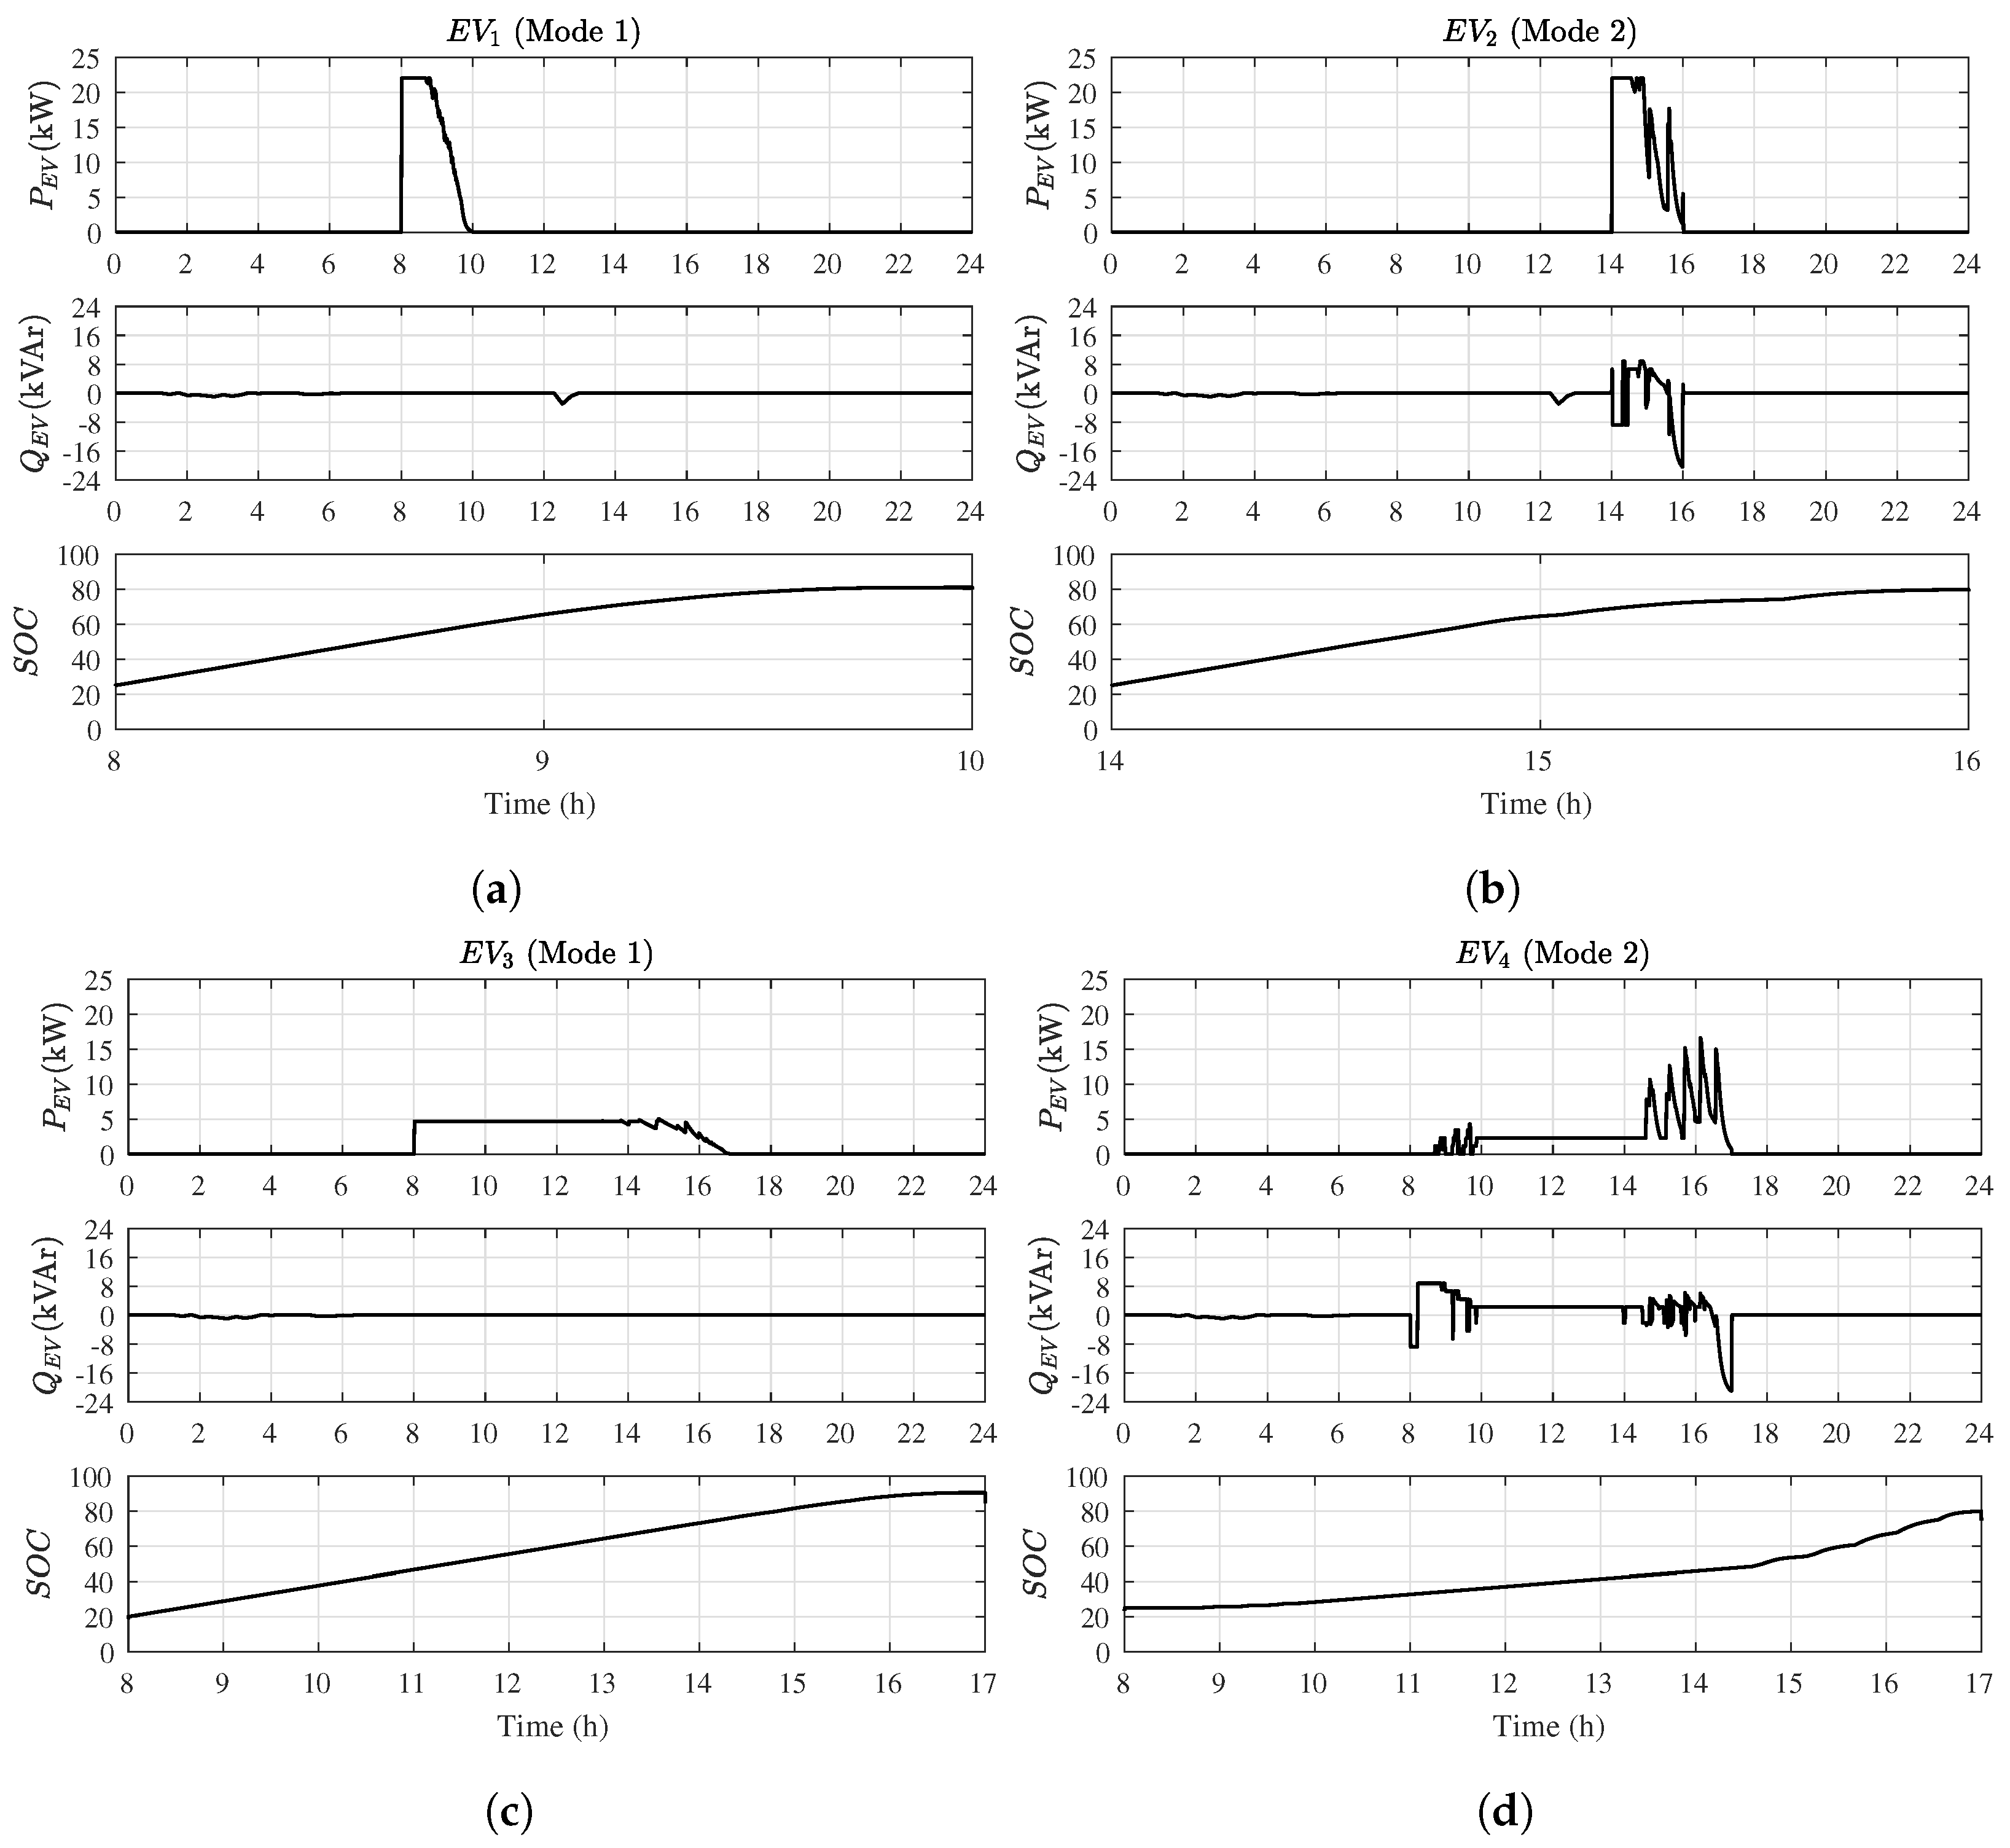
Table 4, the active and reactive power references of each EV charging station are shown in
Figure 10, together with each SOC behavior of the connection period. It is highlighted that the varied time indication in each SOC graph is related to the connection time of the respective vehicle.
The Charging Mode, indicated by 1, is selected for vehicles and , and the Power Factor Regulation Mode (2) is determined for the and . Related to the EVs in Mode 1, it can be seen that during the charging period there is no reactive power to restrict the active charging power, and the final SOC was achieved in both vehicles. The constant low active power of provided slow charging, also reducing the peak demand of the microgrid during its connection time.
The EVs in Mode 2 presents different responses due to the length of the connection time, however, in both cases, the desired SOC is reached. In this scenario, had a consistent active power reference and some significant reactive variations; meanwhile, the presented intermittent variations in both power profiles. By analyzing, the variations can be related either to the weight, as mentioned in previous section, and to increase the charging speed with minimum additional cost. Furthermore, the applied low power range maintained the cost without affecting the microgrid demand significantly.
The Standard Mode referred to as 3, has barely any activity in this scenario due to the inverters in Mode 2 that can deal with the power factor issues.
4.2. Scenario 2: Dynamic Energy Pricing
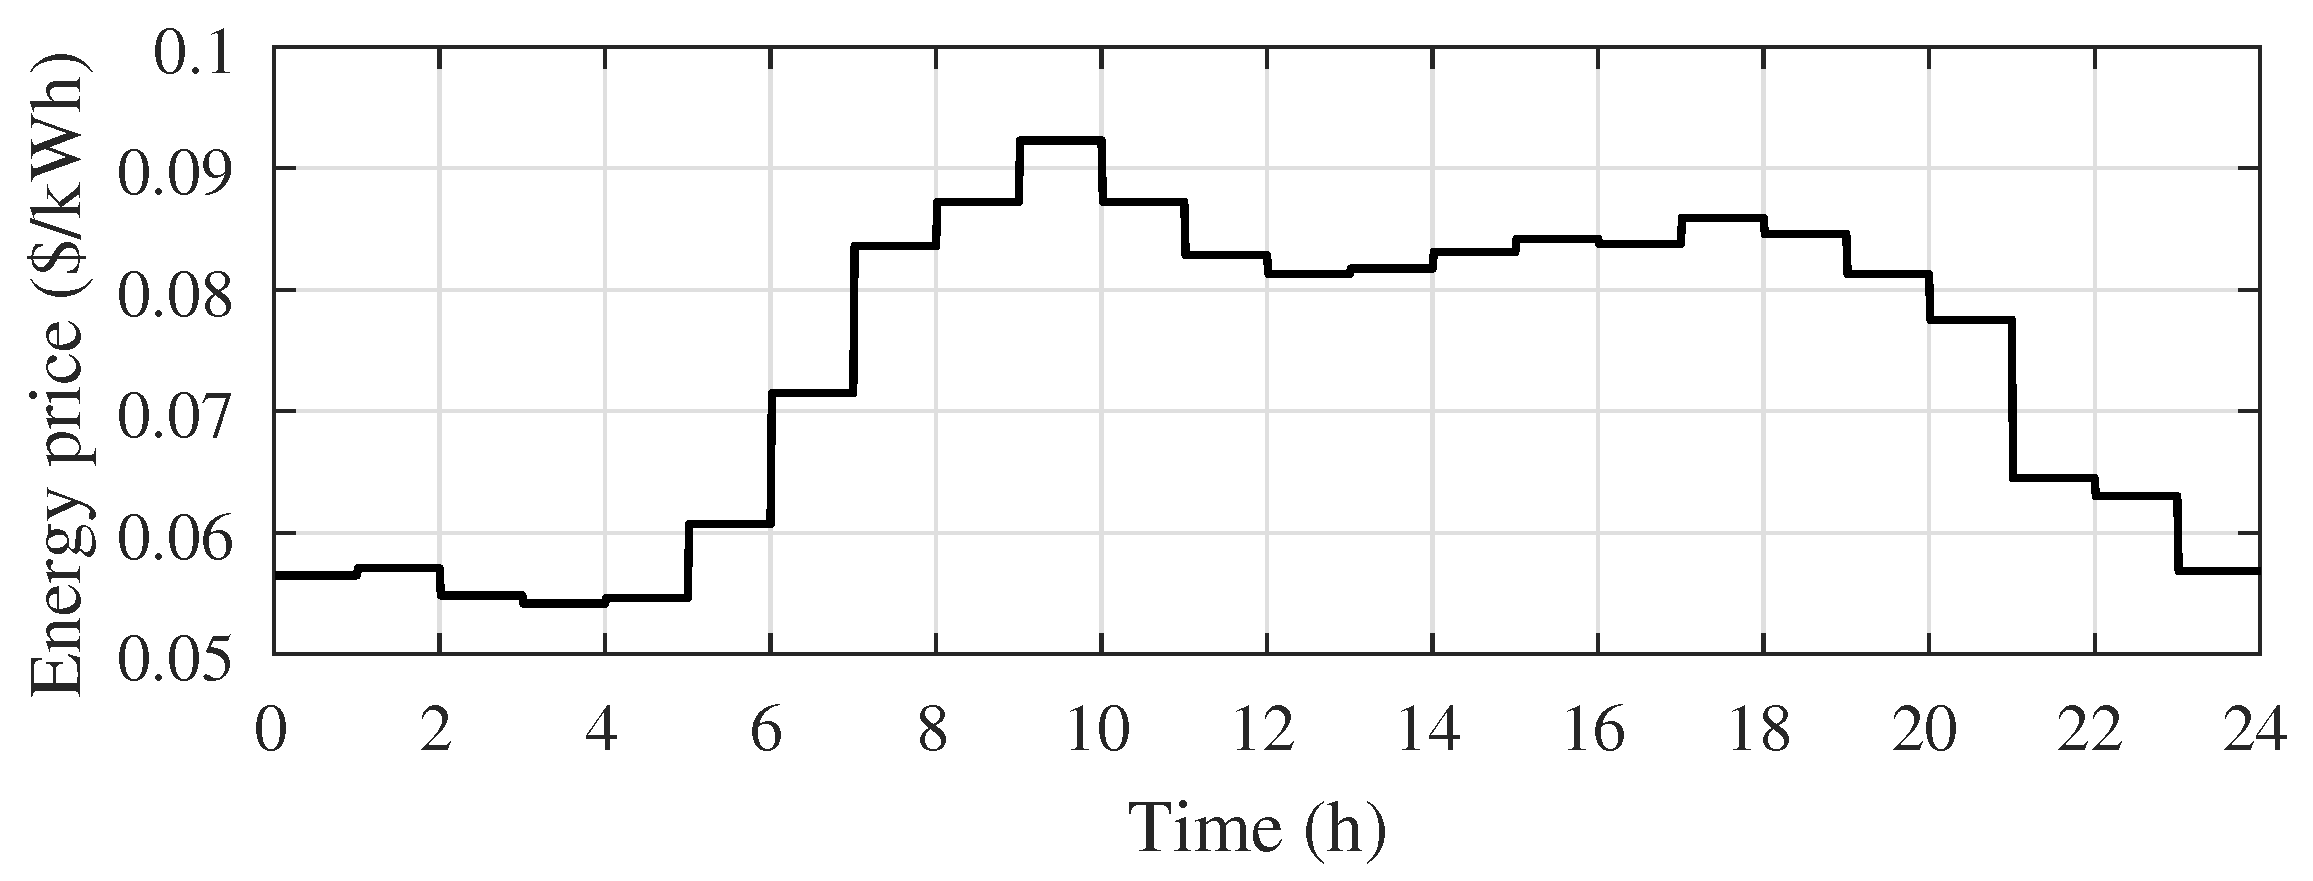
The next scenario utilizes the same microgrid parameters of PV generation and load demand proposed by
Figure 8. Some countries such as Germany and France present power spot markets which schedule dynamic energy prices [
42]. In this paper, it is defined electricity price range based on the spot market presented by [
43]. The proposed energy price profile is presented in
Figure 11.
By analyzing the price curve, the sweet spot for EV charging is during the night and early morning period, specifically between 9 p.m. and 6 a.m. However, throughout the day the price level does not present drastic variations, remaining between 0.08 and 0.09 $/kWh.
The relation of EV with the power factor can be examined in
Figure 12, and it is observed the same aspect of the previous scenario, the power factor keeps above the 0.95 sets as reference.
The only difference verified is the slight deviations in the middle of the day, due to the EV activity around 2 p.m., corresponding to the connection of . Equivalent to the previous scenario, the voltage at the PCC does not suffer heavy influences from the vehicles and remains in a suitable position.
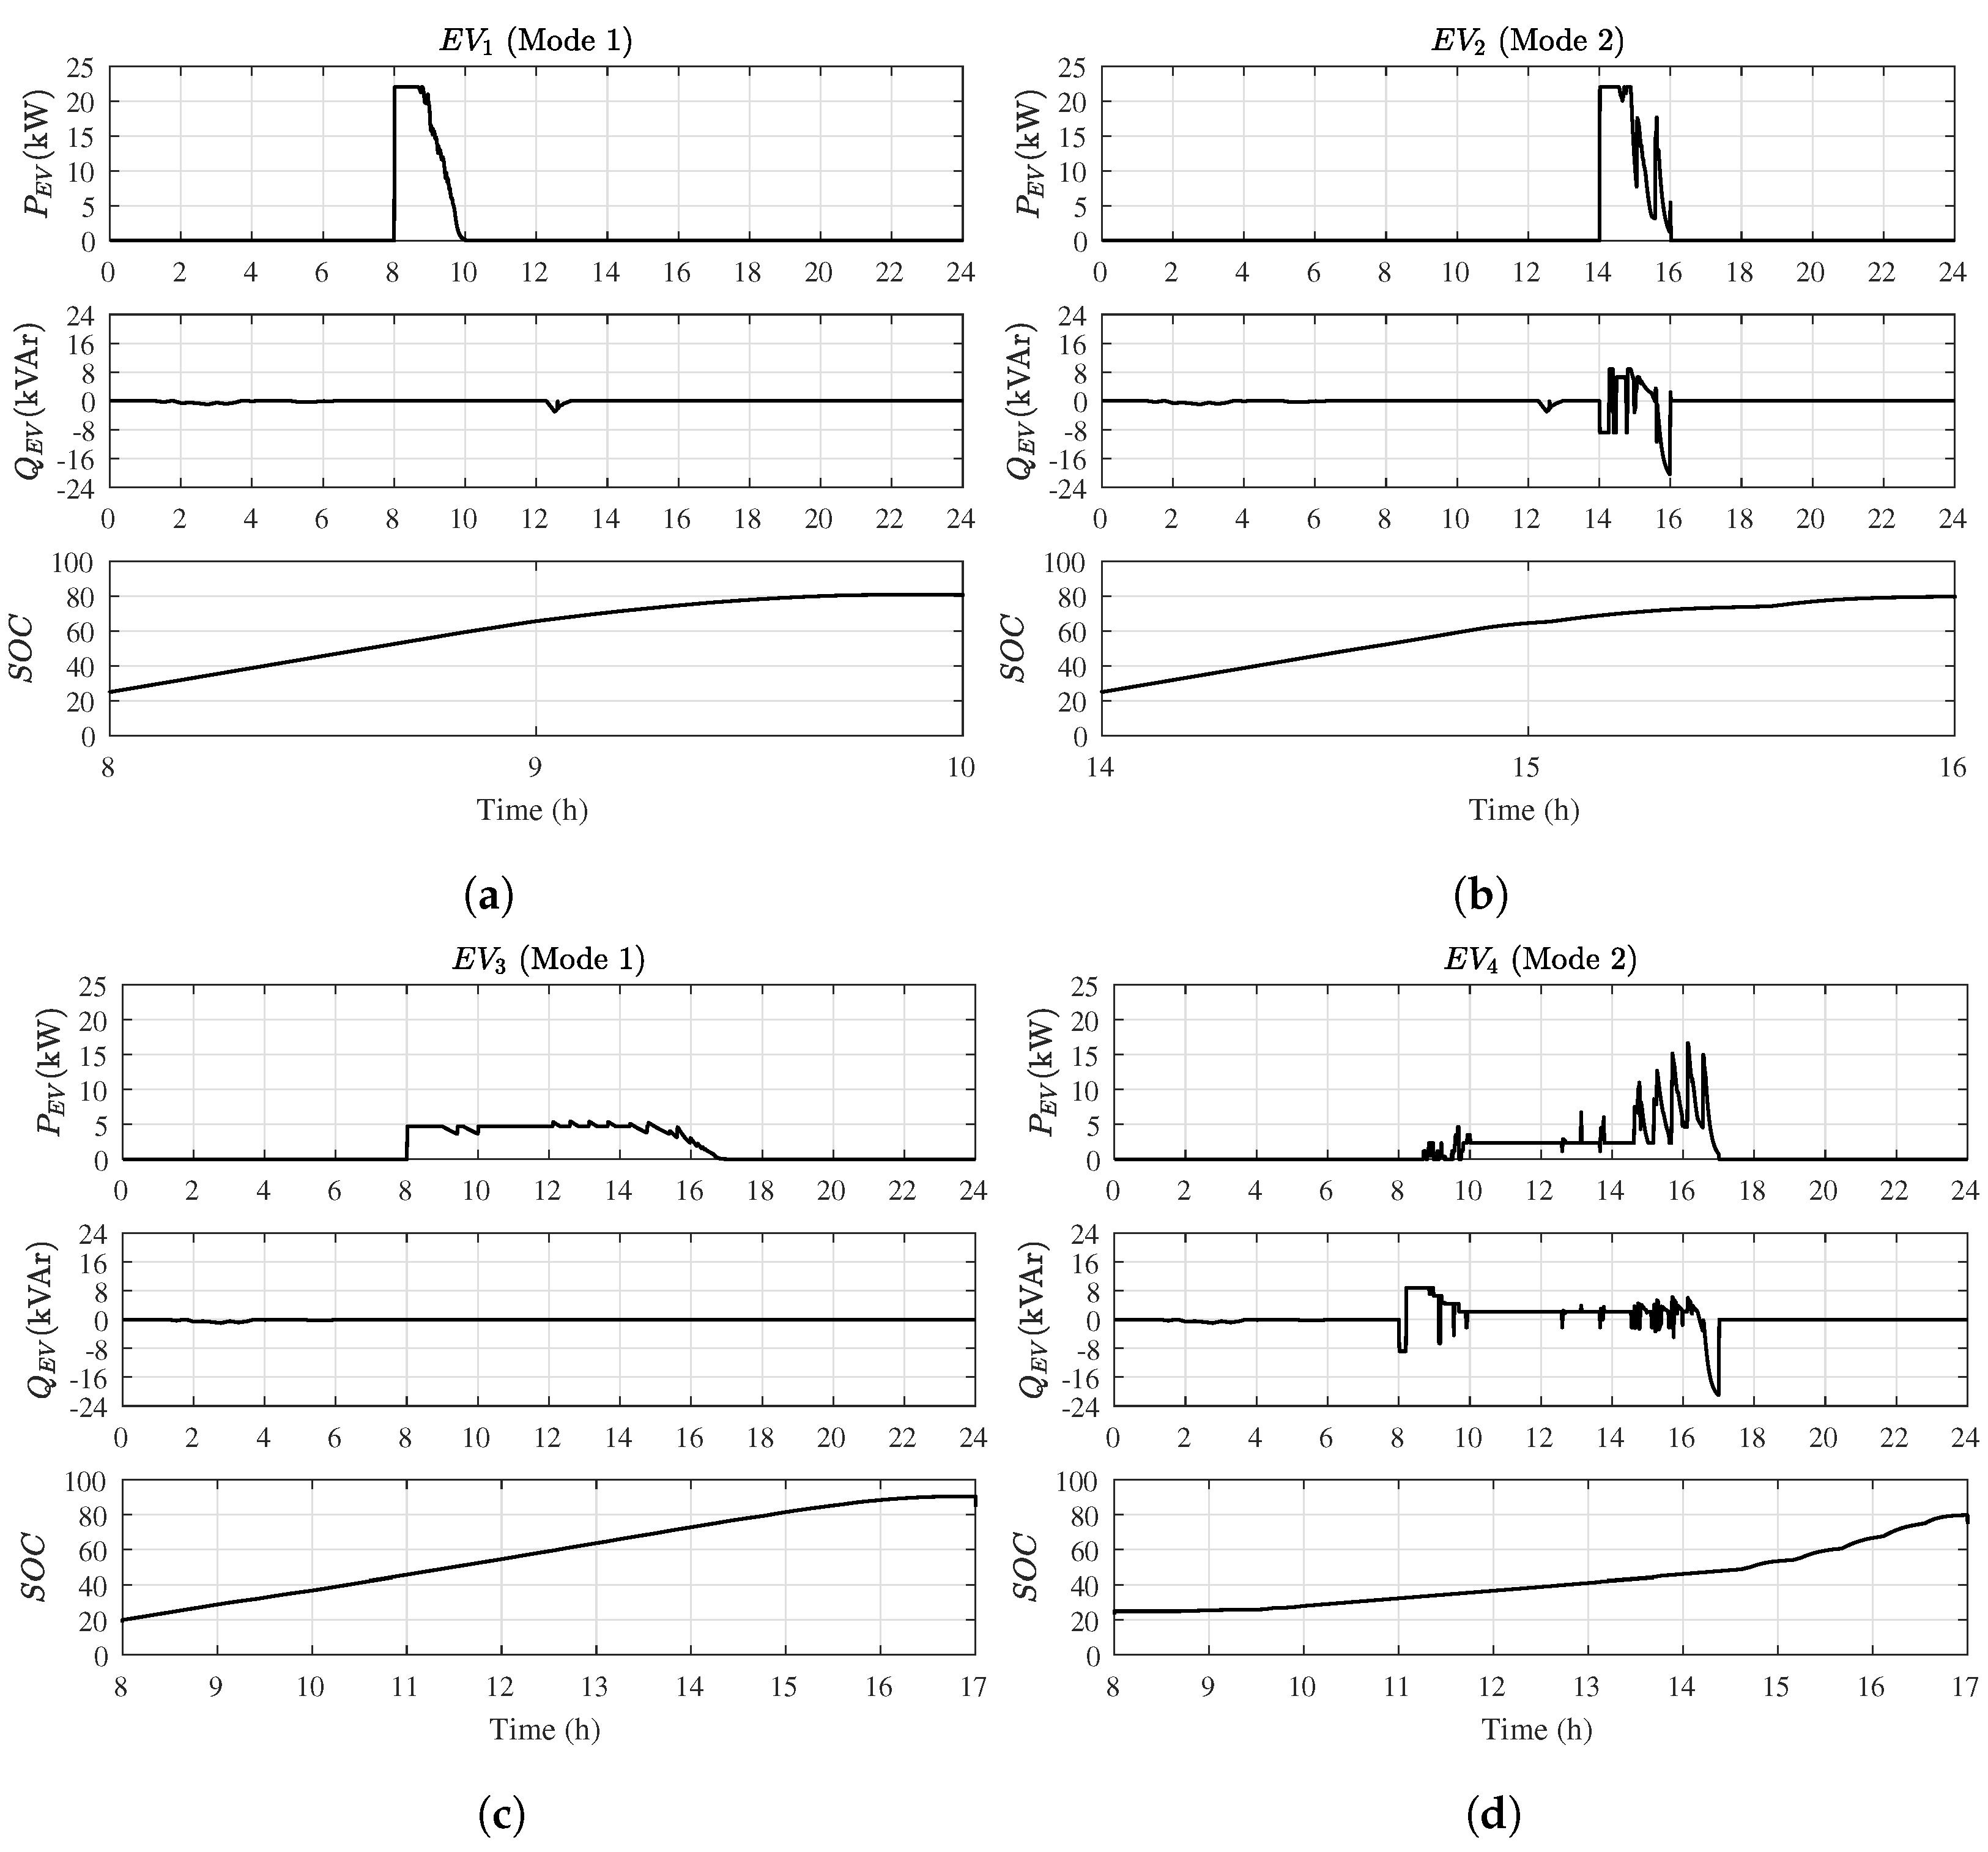
In this case, based on the dynamic price curve, the active and reactive power references, and the SOC of each EV charging station are shown in
Figure 13.
It is highlighted that the vehicles follow the same configuration mode: and in Mode 1 (Charging Mode); and in Mode 2 (Power Factor Regulation Mode). With another price scheme, there is minor changes in the power references. The reactive power from suffers some small changes, presenting more intermittent variations, as well as . In the active power reference of some slight decreases can be seen at 9 a.m. and 10 a.m., corresponding to the highest price levels, that establishes the control action trying to reduce the charging cost. The closer price levels may restrict the control performance, maintaining almost the same aspect of the previous scenario.
4.3. Scenario 3: PV Surplus
In the last scenario, it is proposed a PV surplus during the day to verify the control strategy performance throughout the power flow transition. The PV profile is the same indicated in
Figure 8, however, the maximum power achieved by the panels array is changed to reach 200 kW. With these assumptions, the resulting power factor and the voltage at the PCC are illustrated in
Figure 14.
In this case, it is noticed that the power factor without EVs suffers a significant drop at 12 p.m. and around 2 p.m., these drops are critically reduced by using the inverters to compensate the reactive power. The power factor behavior appears stable during the stress moments certifying the satisfactory performance of the control strategy, even with active power surplus. The pattern of the voltage curve at the PCC increases during the excessive PV power, reaching 1.02 pu and an inferior value of 0.92 pu, approximately, remaining in the adequate operation region.
The SOC of each vehicle with their respective active and reactive power references are presented in
Figure 15, and it shows some changes compared with the previous scenarios.
The operation of Mode 1 follows scenarios 1 and 2, maintaining the reactive reference idle during the charging time. Mode 2 presents a decent performance, with some small variations in both power references, however, it keeps the demand consumption low, reducing the microgrid peak demand. The main difference between scenarios 2 and 3 lies with Mode 3 which the inverters of and provide the leading contribution, considering that the vehicles stay a short time period connected. It can be seen that when there is not a vehicle connected to both inverters, the reactive power injected to the microgrid remains unaffected, which confirms the adopted logic of the proposed algorithm.
4.4. Quantitative Results
In order to discuss the results of each scenario, some quantitative results are presented in
Table 5 to better analyze how the proposed control strategy affects the system. A penalty for poor power factor is considered based on [
44] that includes an additional cost to values below 0.9. It is highlighted that the energy prices shown in
Table 5 do not reflect any real energy market, since it does not consider any tax, thereby these values are essential for comparison purposes.
In
Table 5, it was determined that the first column presents the values of the system without EV parking lot as a base for the following scenarios. In the case without multi objective optimization (MOO) strategy, it is considered that all vehicles charges with the maximum charging power from the connection hour.
For Scenario 1, in which the system utilizes a fixed energy price and there is no PV surplus, it can be seen a 234.42 $/kWh of energy price if no control strategy was applied, representing almost 5% rise compared with the base value. Applying the MOO strategy, it is observed a modest decrease in price compared with no control scheme.
Scenario 2 utilizes a dynamic energy price without PV surplus. In the case without MOO strategy, it is obtained 215.17 $/kWh describing a 5% increase compared with the base column. In this scenario, it is observed a 0.41 $ decrease with the MOO strategy. It represents a small reduction in a day, however, considering the gain in the time spent below the reference value of power factor, which decreased from 18.33% to 3.96%, it represents a significant improvement.
Scenario 3 presents a PV surplus and dynamic energy price, and it can be seen a significant decrease in the energy price cost since the PV generation units export power to the distribution network. The increase in the case without MOO strategy is almost 8% compared with the base column, however, a decrease occurs on energy price with MOO strategy, establishing that the control method has economic benefits since there is a penalty for poor power factor.
It can be observed that since the analyzed scenario utilizes few vehicles, the time spent suffer no difference with the EV addition, but when the MOO strategy is implemented the reference error reduces significantly. By analyzing the time spent below the power factor reference, in all cases can be verified a critical reduction around 4.5 times in power factor error, improving the system performance, and obtaining a better operation.
5. Conclusions
This paper proposed an improved control strategy for microgrid management with electric vehicles, photovoltaic arrangement, and typical loads demand. The control provides three operation modes to ensure the proper operation of the microgrid power factor, maintaining it above the reference value, while attending to the EV users’ requirements such as desired SOC attainment at the disconnection instant.
The control management performance was verified in different microgrid scenarios, and the overall results were satisfactory considering the objectives of the control strategy. The Charging Mode presented an ideal behavior, allowing the charge of the vehicle with less price cost and reaching the desired SOC in all cases. In the Power Factor Regulation Mode, the charging occurs simultaneously with the reactive compensation, leaving the power factor above the selected reference. The main contribution of this mode was noticed in the scenarios with no generation surplus, in which the microgrid power factor was fully compensated with barely any activity of the third mode. The logic of the Standard Mode was achieved, evaluating the ideal reactive power and separating it into the idle inverters to support the other mode.
The control strategy was examined in a scenario with realistic electricity price levels based on the spot market, and it was noticed that the management presented small changes compared with the fixed price scenario due to the closer electricity price levels considered. However, some variations in the power reference indicate the control activity searching for the lowest cost path. Furthermore, the scenario with PV generation surplus was evaluated and the proposed control strategy presented a suitable performance, maintaining the power factor above the reference.
The quantitative analysis demonstrated that the MOO strategy can provide economic benefits for systems with high PV penetration. In all scenarios, it was obtained a significant improvement in both energy price and power factor which could be observed by the time spent below the desired reference. The results indicate that the proposed control strategy can be applied in different systems composed mainly of EV parking lot and DG units, however, the same technique can be implemented for other ESS such as stationary batteries. Voltage and frequency regulations are some of the problems that can be evaluated in future works and added to the control strategy as future objectives, as well as a proper dynamic energy price determination.


