Article

Microseismic Temporal-Spatial Precursory Characteristics and Early Warning Method of Rockburst in Steeply Inclined and Extremely Thick Coal Seam

1
School of Civil and Resources Engineering, University of Science and Technology Beijing, Beijing 100083, China
2
Key Laboratory of Ministry of Education for Efficient Mining and Safety of Metal Mine, University of Science and Technology Beijing, Beijing 100083, China
3
Zhong-an Academy of Safety Engineering, Beijing 100083, China
4
School of Civil, Mining and Environmental Engineering, University of Wollongong, Wollongong, NSW 2522, Australia
5
State Key Laboratory of Coal Resources and Safe Mining, China University of Mining and Technology, Xuzhou 221116, China
6
Shenhua Xinjiang Energy Company Limited, Urumqi 830027, China
*
Author to whom correspondence should be addressed.
Submission received: 18 November 2020 / Revised: 2 January 2021 / Accepted: 31 January 2021 / Published: 23 February 2021

Abstract

:
Early warning of a potential rockburst risk and its area of occurrence helps to take effective and targeted measures to mitigate rockburst hazards. This study investigates the microseismic (MS) spatial-temporal precursory characteristic parameters in a typical steeply inclined and extremely thick coal seam (SIETCS) with high rockburst risk and proposes three spatial/temporal quantification parameters and a spatial-temporal early warning method. Analysis results of temporal parameters show that the sharp-rise-sharp-drop variation in total daily energy and event count can be regarded as a precursor for high energy tremor. The appearance of peak values of both energy deviation (≥20) and event count deviation (≥1) can be regarded as precursors that indicate imminent rockburst danger. A laboratory acoustic emission (AE) experiment reveals that precursor characteristics obtained from the study can be feasibly used to warn the rockburst risk. The spatial evolution laws of spatial parameters show that the high energy density index of MS (EDIM), velocity, velocity anomaly regions correlate well with stress concentration and rockburst risk areas. The field application verifies that the temporal-spatial early warning method can identify the potential rockburst risk in a temporal sequence and rockburst risk areas during the temporal early warning period.

1. Introduction

Rockburst is one of the main dynamic disasters encountered in mining and tunneling [1,2,3,4] and usually poses a serious threat to underground workers and equipment [5,6,7]. Currently, with an increase in mining depth, the frequency and intensity of rockburst are increasing, and the number of underground engineerings that experience rockburst is increasing [8]. The development of an accurate and efficient method for an early warning of rockburst has become a major problem to be solved urgently [9,10,11].
Generally, a seismogenic process occurs before rockburst, which is accompanied by the formation of a large number of micro-cracks and the release of microseismic (MS) energy [1]. Fracture evolves in four stages during the process of coal and rock failure, as shown in Figure 1 [12,13]. Therefore, the early warning of the rockburst disaster can be realized by monitoring the stress and fracture of the coal and rock mass. Researchers have done many studies on rockburst monitoring. The main monitoring methods and techniques include (a) electromagnetic radiation monitoring [14,15,16], (b) acoustic emission (AE) monitoring [17,18], (c) stress monitoring [19], (d) drilling cutting methods [20], and (e) microseismic (MS) monitoring [21,22,23]. Electromagnetic radiation and AE monitoring methods belong to the local monitoring method in which the monitoring range is small. Sensors are frequently moved, and hence, are subjected to large interference [21]. Stress monitoring and drilling cutting monitoring belong to discontinuous real-time monitoring method and are costly.
MS monitoring systems can perform continuous real-time monitoring, which has a wide range of monitoring and can realize temporal-spatial monitoring [24]. Furthermore, the source can be used for passive tomography to reveal the rockburst risk area and stress concentration area [21,25]. MS monitoring has been widely used in monitoring rockbursts and other dynamic disasters; it is essential in the assessment and mitigation of seismic hazards and risk [24,26,27,28].
Based on the analysis of MS monitoring parameters, some valuable indicators have been proposed for early warning of rockburst risk (Table 1). Besides that, both the total daily energy and MS event counts showed a declining trend before the rockburst occurred in a gently inclined coal mine. In particular, the MS daily total energy reached a minimum three days before the rockburst [9]. One MS silence period occurred before the rockburst. Moreover, the longer the silence period, the greater would be the probability of rockburst [29,30]. Two new seismic damage indices (cluster index and degradation index) according to MS monitoring information aimed at identification and quantification of rock mass damage and degradation were introduced by Falmagne [31]. The stress concentration and rockburst areas were closely related to the location and distribution characteristics of MS events [1,32]. The precursor of high and low MS event rates before rockburst were verified by AE test of coal samples at laboratory scale (Figure 2).
The meaningful results from the above-mentioned studies have significantly improved the understanding of the process and forecasting of rockbursts. However, the above studies mainly use the critical values or examine the trends to issue the early temporal warning, or use a single indicator for spatial early warning, and seldom quantify the trend precursor characteristics. Besides, these studies cannot realize comprehensive early warning covering time and space dimensions. In situ applications showed four limitations, namely, the accuracy of the current rockburst early warning method is very low [33], the early warning results of various parameters are inconsistent, the warning information is limited, and the utilization rate of monitoring equipment is not high. Moreover, the main research targets of the previous studies are horizontal or gently inclined coal seams and orebodies; the warning indicators and methods of rockburst and high energy tremor in steeply inclined and extremely thick coal seams (SIETCSs) are rarely investigated and reported. The variation in MS daily total energy and event count, and the spatial evolution law of MS events before rockburst in SIETCS were qualitatively studied based on three rockburst cases, and marked differences were observed between the precursor characteristics of rockburst in SIETCS and those in horizontal/gently inclined coal seam [12]. This difference was attributed to their different geological and mining conditions and other factors. Due to the complexity of the cause of rockburst, the accuracy of early warning is low. Early warning is estimated only by qualitative analysis of the rockburst risk based on the variation in real-time monitoring parameters or the spatial distribution of MS events. Therefore, it is necessary to further investigate the temporal and spatial quantitative indicators and precursor characteristics applicable to early-warning rockburst risk of SIETCSs based on two main disasters, namely, high energy tremor and rockburst. It has become urgent to develop a temporal-spatial comprehensive early warning method that takes advantage of each parameter and precursor characteristics.
The site chosen for this study is a typical SIETCS in the Wudong coal mine (WCM), Shenxin Coal District in Urumqi City, China, where high energy tremors (according to the actual situation of the WCM, the definition of a high energy tremor is an MS event in which energy exceeds 106 J, and the roadway does not cause obvious damage) and rockbursts are the main dynamic hazards. Three new spatial/temporal quantification parameters (energy deviation (DE), event count deviation (DP), and energy density index of MS (EDIM) (Mej)) are proposed based on MS monitoring data. The temporal evolution law of MS multi-parameters (MS daily total energy (Ed), event count (P), energy deviation (DE) and event count deviation (DP)) and spatial evolution law of EDIM, velocity, and velocity anomaly prior to rockburst or high energy tremor were investigated, and based on their respective advantages, a spatio-temporal comprehensive early warning method is proposed for the rockburst of SIETCSs. The feasibility of using the precursor characteristics obtained from the study to warn the rockburst risk is verified through a laboratory AE experiment. The early warning effectiveness of “critical value” and “critical value + trend” early warning methods were comparatively studied. Furthermore, the temporal-spatial comprehensive early warning method was applied in a field to issue rockburst and high energy tremor early warning and to guide the implementation of targeted pressure relief measures to evaluate its early warning effectiveness. The research results provide a significant reference for predicting rockburst risk, and then determining potential rockburst risk areas of steeply inclined and extremely thick coal seams.

2. Precursor Characteristic Parameters and Early Warning Method

2.1. Precursor Characteristic Parameters for Temporal Pre-Warning of Rockburst

The precursor characteristic parameters for temporal pre-warning of rockburst included daily total energy Ed, event count P, MS energy deviation DE, and event count deviation DP. Daily total energy Ed and event count P have been described in detail in the latest research [12].
The MS energy deviation (DE) of the trend warning index was defined as
D E = E t E ¯ E ¯
where Et represents the energy of one MS event occurring at t time, E ¯ represents the mean energy value of all MS events from the time of the last high energy tremor to the t time.
The event count deviation (DP) of the warning index was defined as
D P = P i P ¯ P ¯
where P i represents the total number of MS events that occur on the ith day, P ¯ represents the mean value of daily event counts from the time of the last high energy tremor to the t time.
Prior to the occurrence of rockburst, with the evolution of micro-cracks, the micro-cracks propagated, connected, and eventually penetrated to form macro-fractures, making MS energy increase abnormally. DE became greater than before, indicating an increase in the dynamic disturbance. Prior to the occurrence of rockburst, the source of the MS increased and clustered anomalously compared to the previous normal mining period [12]. It showed that the stress in the study area was close to the strength limit of coal and rock mass. Therefore, compared with the previous period, the event count at this stage showed an increasing trend. Dp is a quantitative description of the changing trend of the event count. The greater the Dp, the stronger were the MS activities and the larger was the stress concentration in the study area. Therefore, the quantitative parameters (DE and DP) of energy and event count trend changes could be used as a precursor to warn against a rockburst hazard.

2.2. Precursor Characteristic Parameter for Spatial Pre-Warning of Rockburst

2.2.1. Energy Density Index of MS

The traditional method for stress concentration and spatial risk area analysis based on MS monitoring systems is to locate MS events of different energy levels in the mine plan by different type and color graphics and to visually reflect the occurrence area and aggregation degree of MS events with different energy levels [34,35], so as to facilitate qualitative analyses. However, the traditional method cannot be applied to quantitative and comparative analysis. Therefore, a parameter shall be defined for quantitative analysis of stress concentration and rockburst risk area based on MS monitoring parameters.
The released energy is one of the most important factors responsible for inducing rockbursts [36,37]; it is very likely to occur as the rock energy storage rate reaches its limit [38,39,40]. Rockburst or the progressive failure of coal or rock depends mainly on how much elastic energy is stored in the coal or rock mass [9]. An MS monitoring system can monitor the released energy and rupture position of the coal and rock mass rupture event [29]. The stress concentration and failure intensity of coal and rock mass can be qualitatively analyzed according to the energy magnitude [33]. Rupture position analysis can determine the scope of occurrence of MS events, and their comprehensive analysis can quantify the degree of risk in a specific area. Therefore, according to the energy and coordinate values of MS events, a new spatial quantization parameter (EDIM) was defined as
M e j = i = 1 n log E i S
where Mej represents the EDIM of the jth statistical region, logJ/m2; Ei represents the energy of the ith MS event, which belongs to the jth statistical region, J; and S represents the area of the jth statistical region, m2.

2.2.2. Velocity and Velocity Anomaly

MS events are usually used in passive velocity tomography as the sources to infer the stress concentration areas. The passive velocity can periodically reveal the rockburst risk areas during the mining process [41,42]. The areas of high velocity and velocity anomaly are closely related to the areas with high energy tremors or stress concentration [43]. Therefore, passive velocity tomography can be used to assess rockburst risk areas in coal mining.
Positive velocity anomaly for spatial pre-warning of rockburst can be obtained as in Equation (4) [44,45]
A n = V P V P a V P a
where V P represents wave velocity of a certain point and V P a represents the average velocity in the research area. The relationship between velocity anomaly and stress concentration degree is shown in Table 2 [44,45].
Passive tomography is mainly based on the wave velocity propagation characteristics of coal and rock mass for different degrees of stress concentration to reflect the stress of coal rock mass. The EDIM mainly reflects the degree of stress concentration by monitoring the energy released from a certain area. Passive tomography and EDIM can complement each other based on their respective advantages and improve the accuracy of early warning.

2.3. Temporal-Spatial Comprehensive Early Warning Method

Based on the above-mentioned temporal and spatial precursor characteristic parameters, a temporal-spatial comprehensive early warning method was proposed. As shown in Figure 3, the method was capable of predicting the possibility of rockburst occurrence within the next few days of excavation and areas of high rockburst potential in SIETCSs. The method consisted of two parts. First, the “critical value + trend” temporal warning method was used to warn the of rockbursts in the SIETCS. When rockburst or a high energy tremor was predicted in the next few days, the second part, the spatial early warning method, was used to warn stress concentration areas and rockburst risk areas so as to take targeted pressure relief measures.

3. Case Study

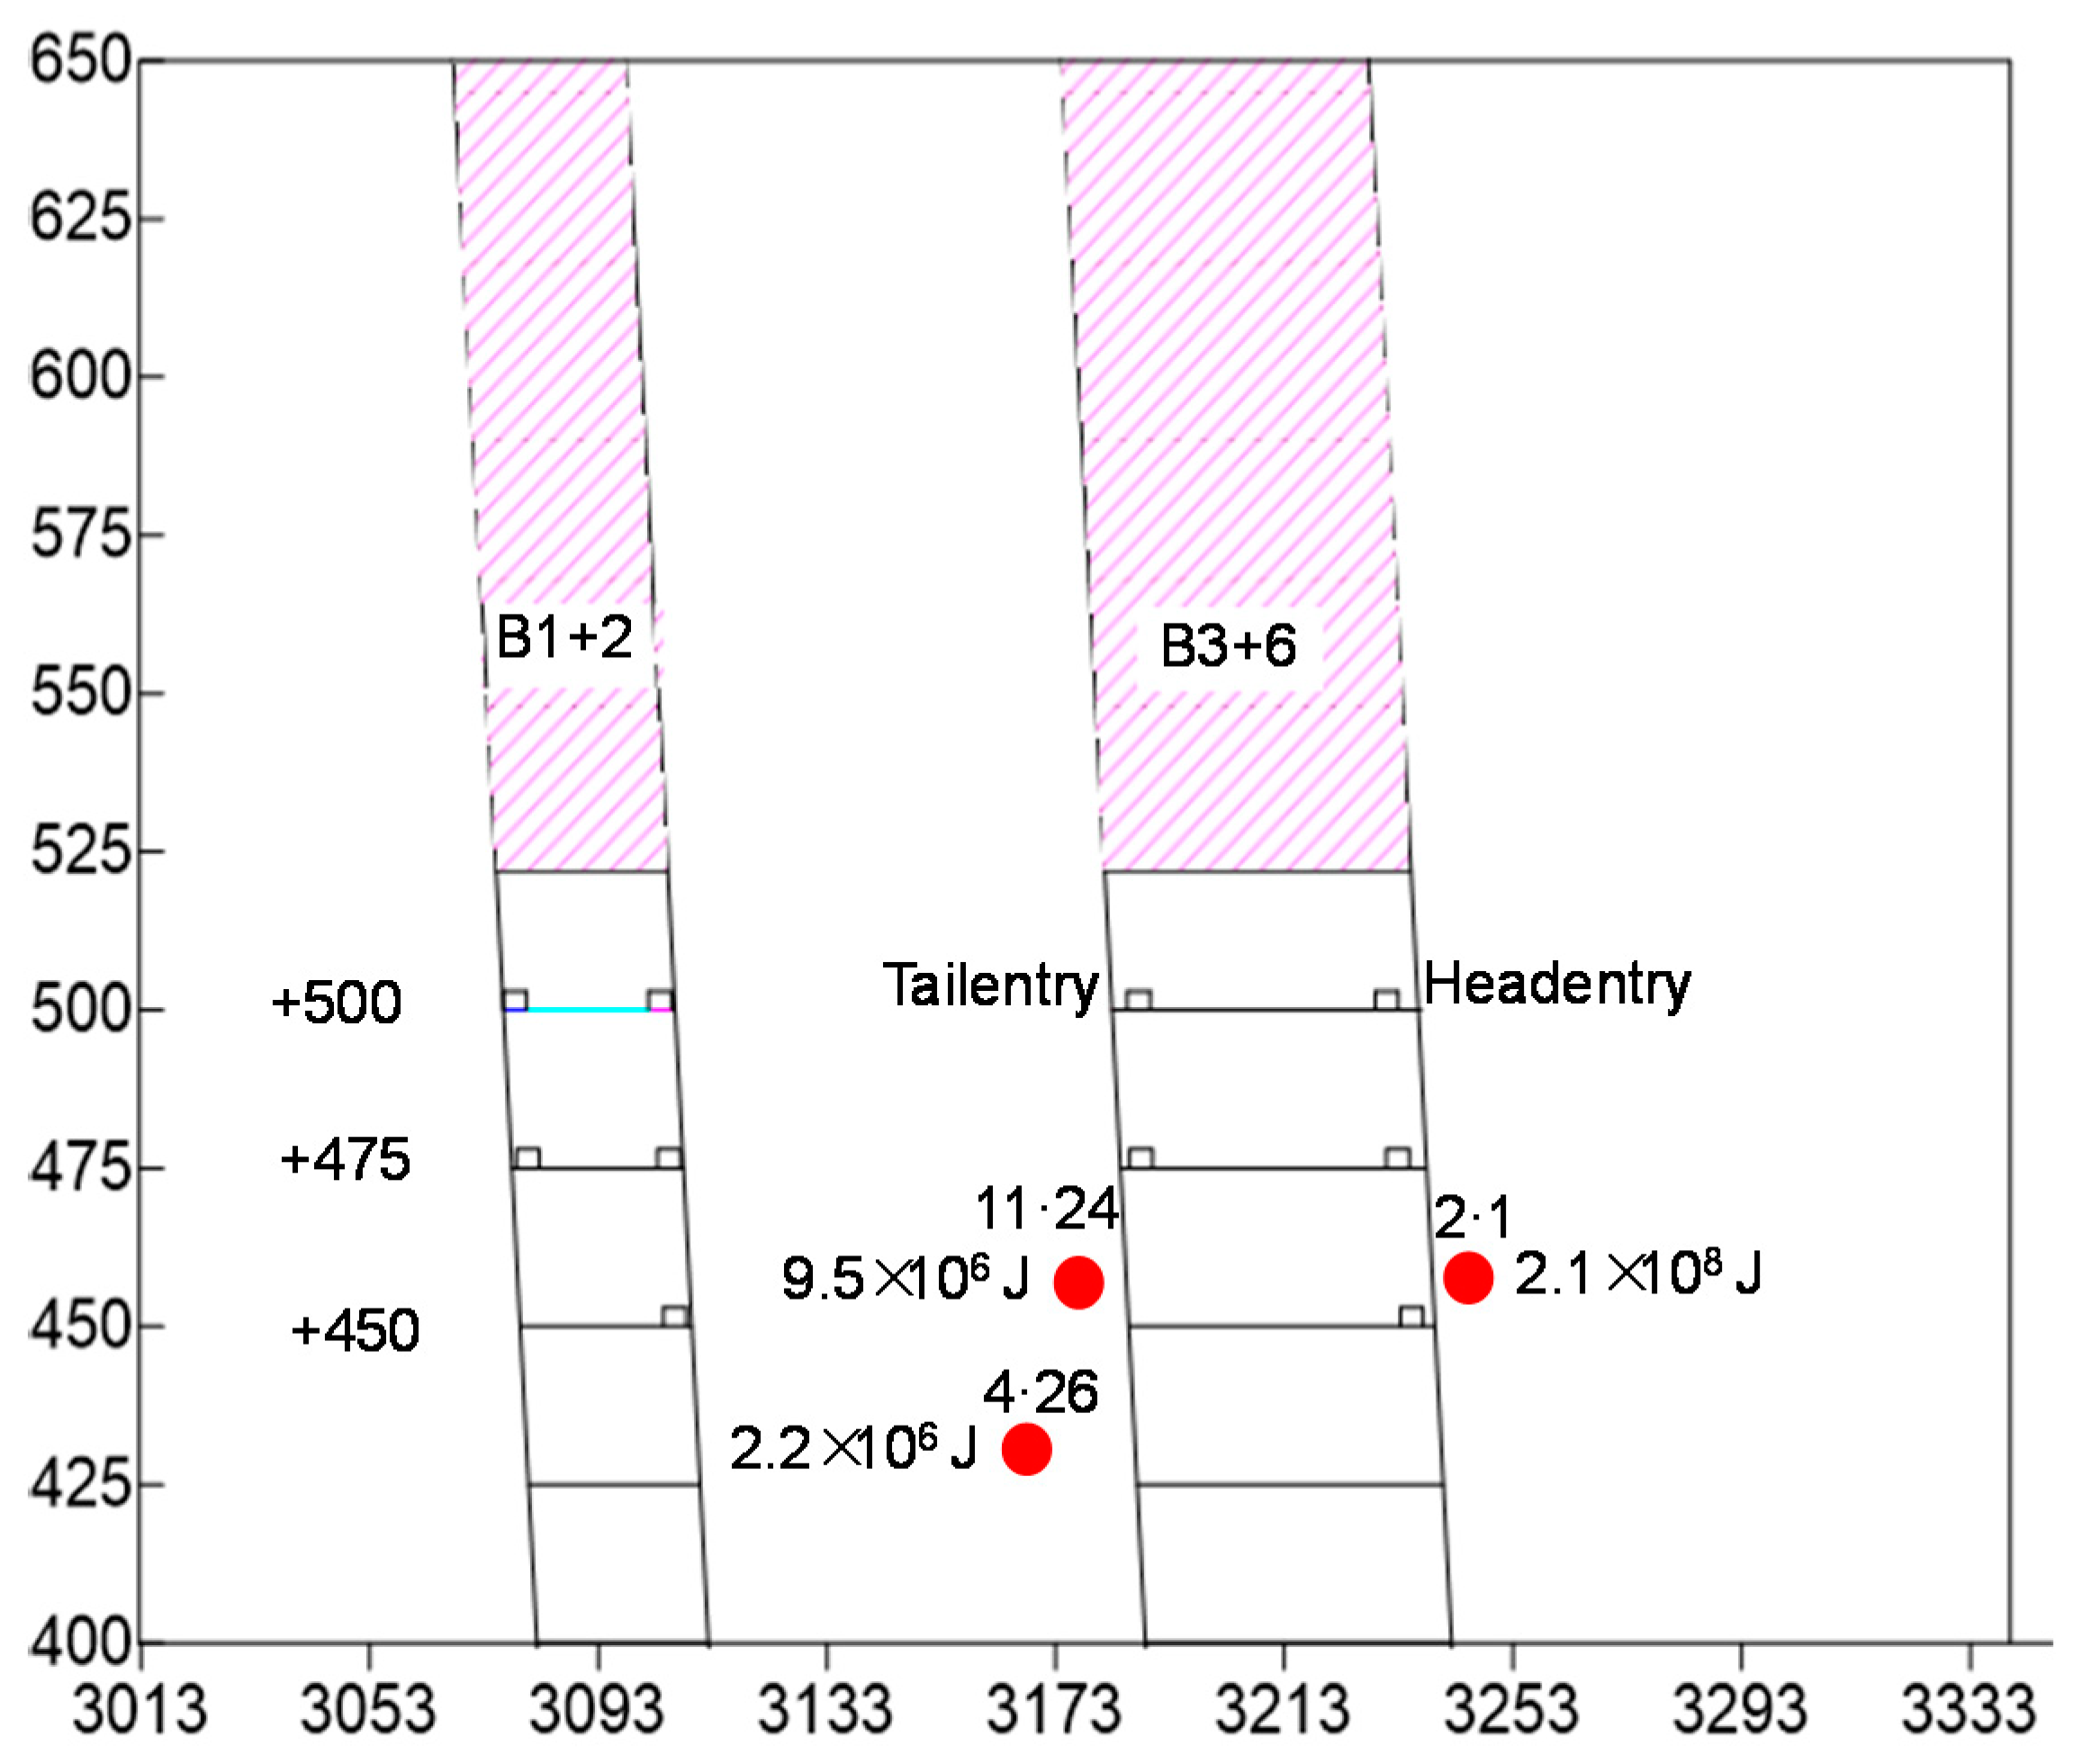
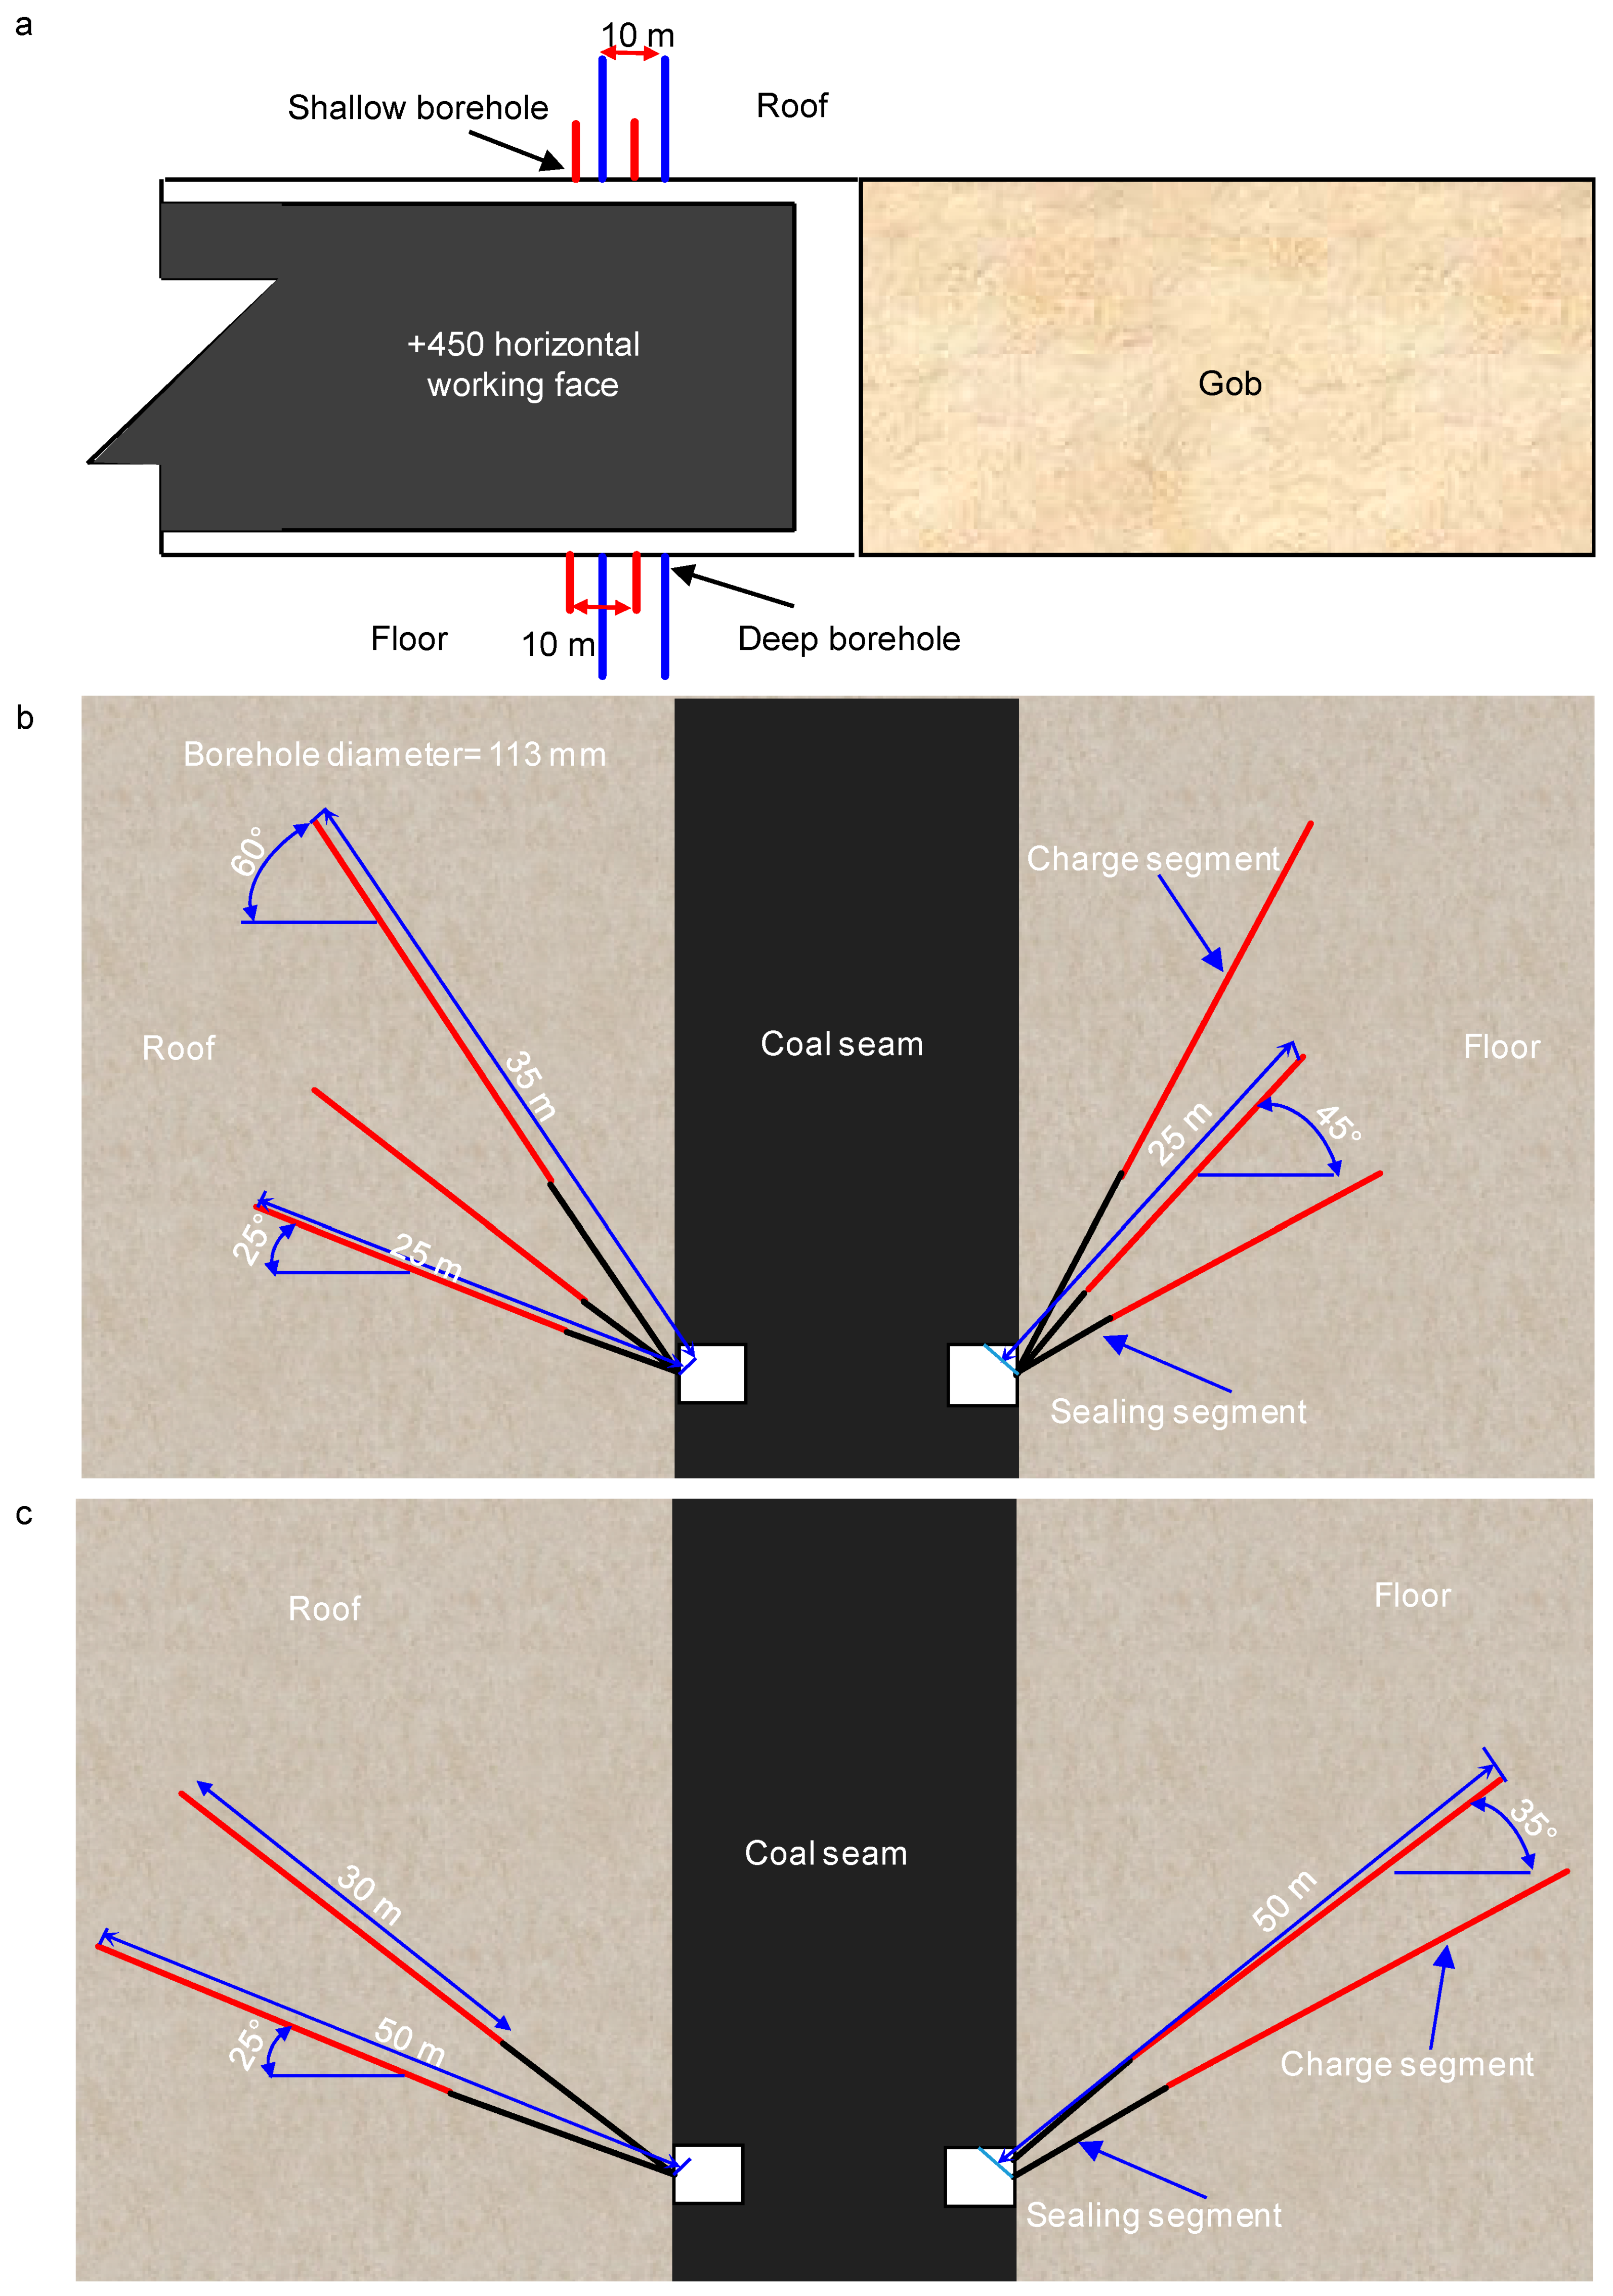
3.1. Basic Conditions of the Field

As shown in Figure 4, the overall geological section of the north and south mining areas of WCM are in a syncline structure. The south mining area of WCM is a typical SIETCS group. The research coal seam No. B3 + 6 had a dip angle of 87°, and both the width and strike length of the coal seam are 48.9 m and 2500 m. The horizontal sublevel fully mechanized caving mining method is adopted for mining, and the goaf is filled with loess. Three rockbursts and five high energy tremors occurred during the +450 horizontal No. B3 + 6 fully mechanized top coal caving face mining. The damage of rockburst and high energy tremor are shown in Figure 5. The rockburst risk was monitored by an MS monitoring system (ARAMIS M/E). Figure 6 shows the position of probes of the MS monitoring system when the rockburst “4·26” (rockburst designators refer to the month and day of occurrence) occurred (please refer to [12] for more details).

3.2. Temporal Early Warning Results and Analysis

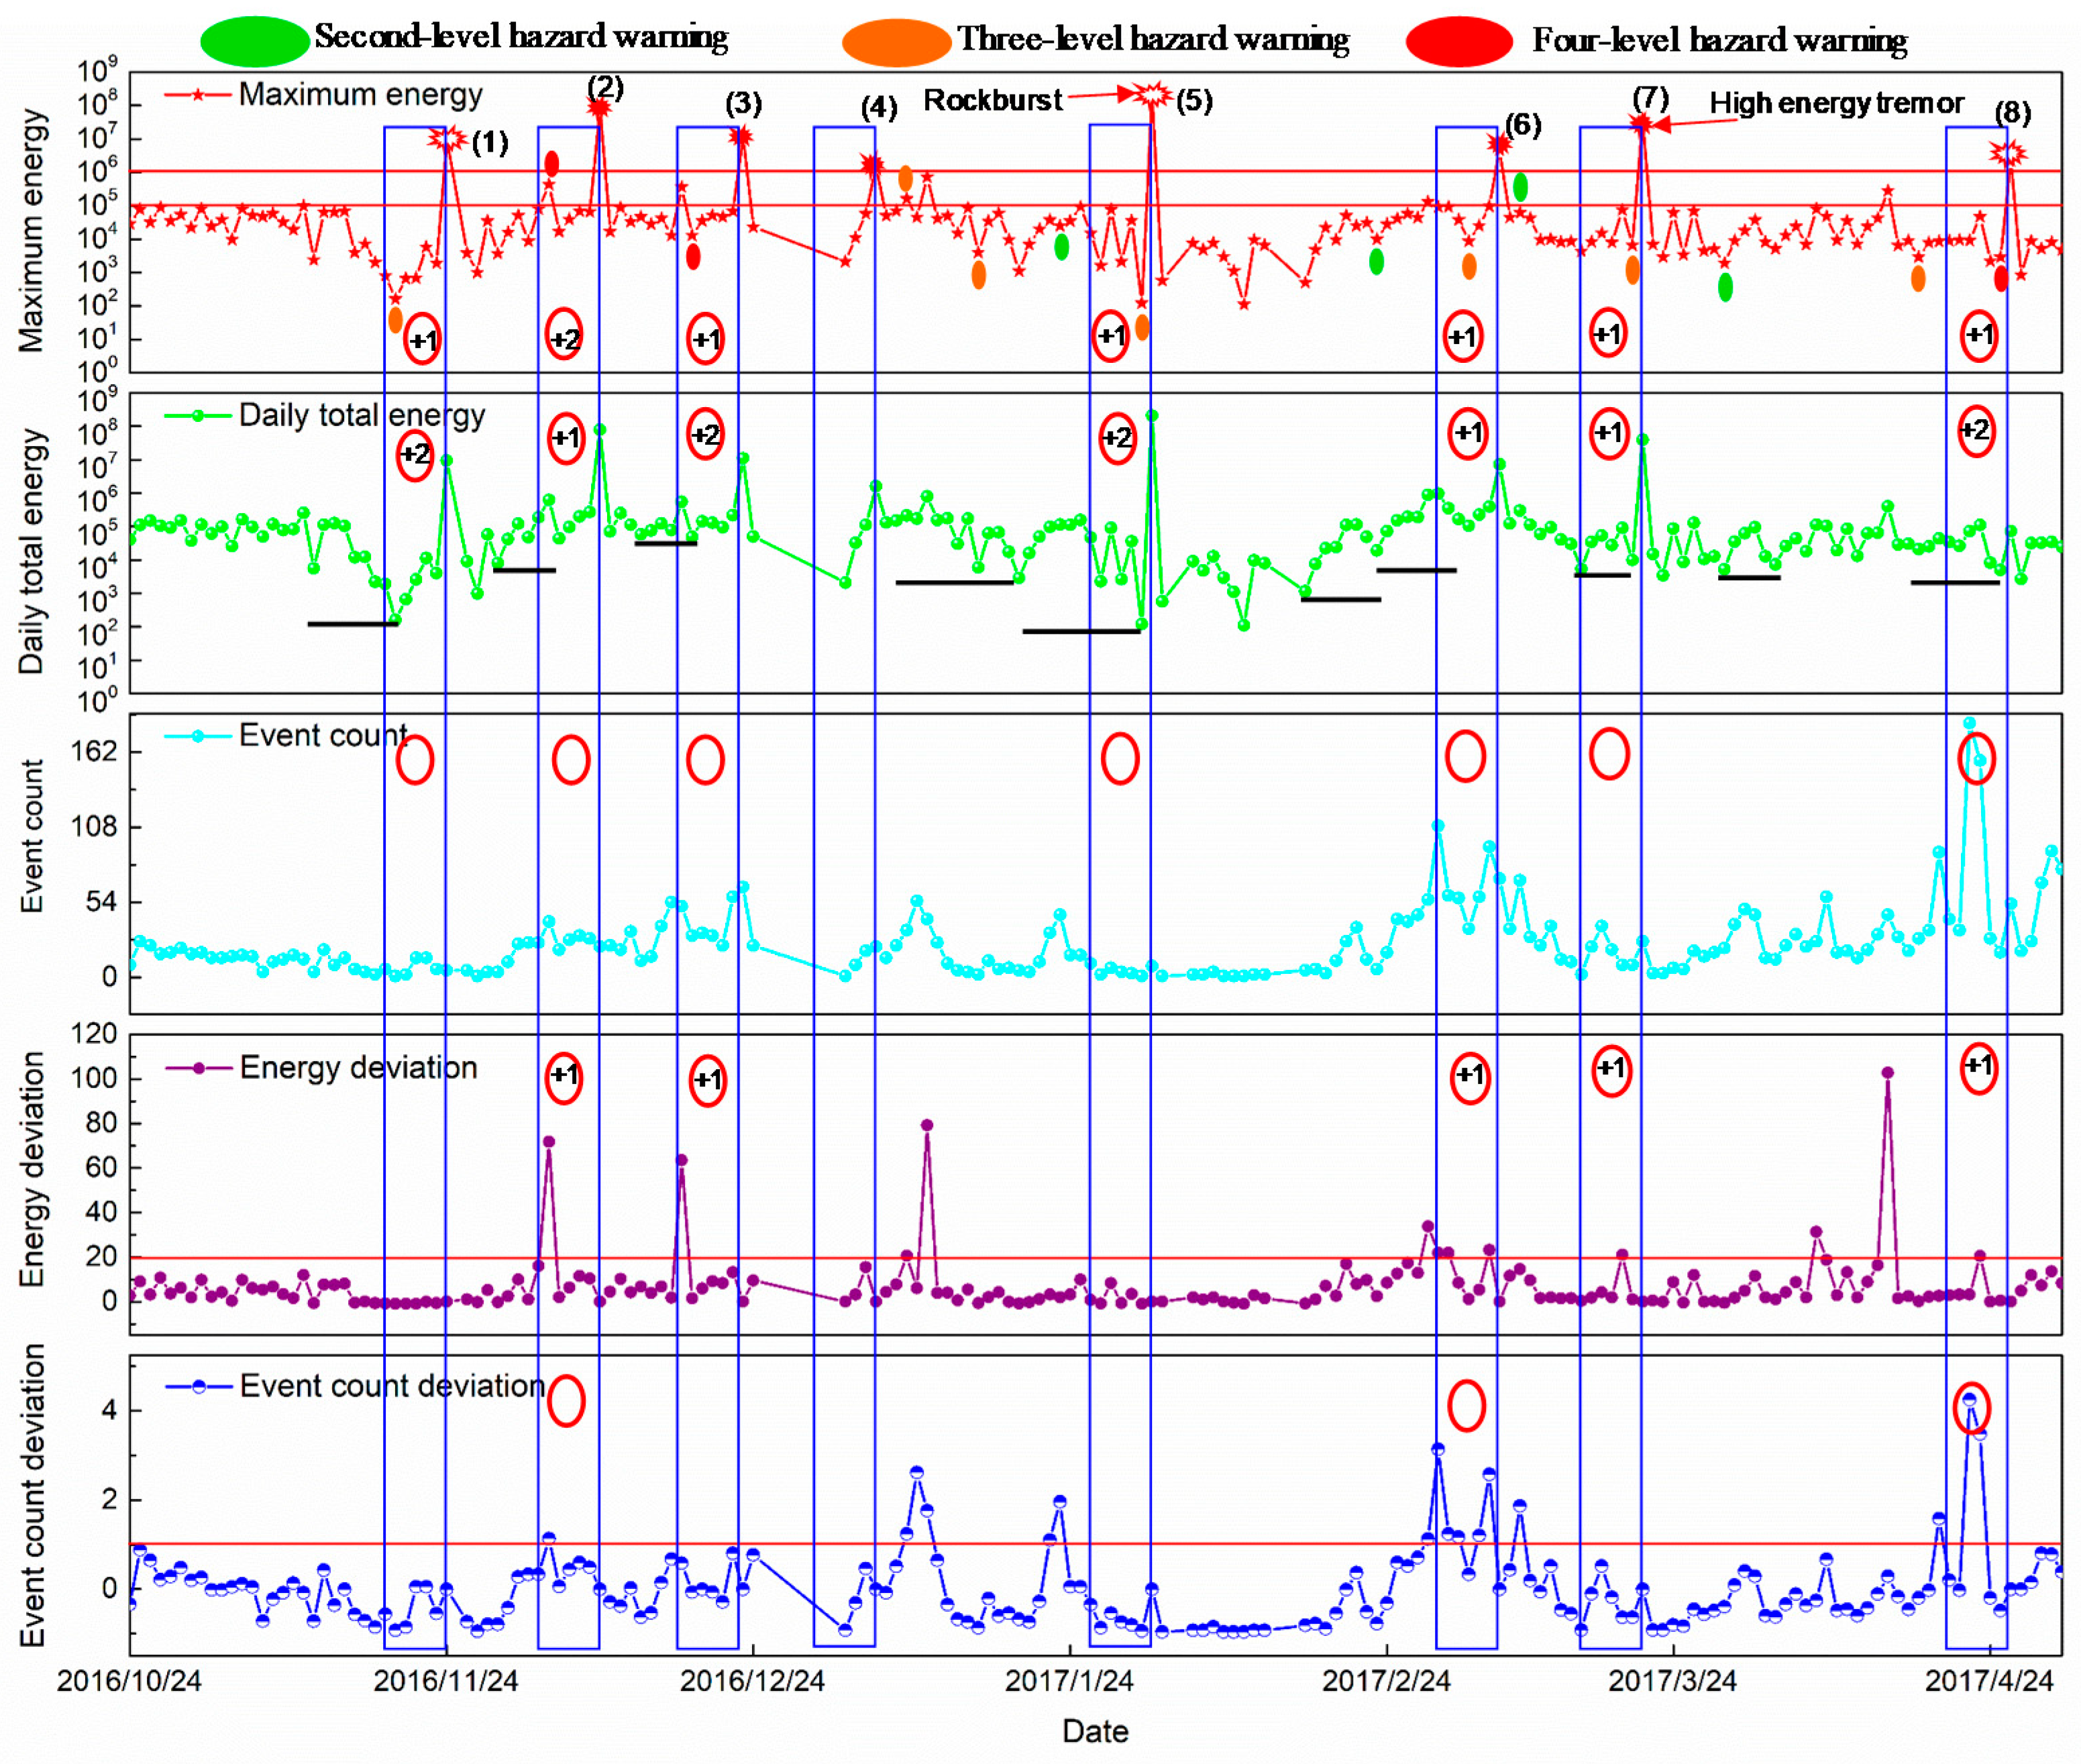
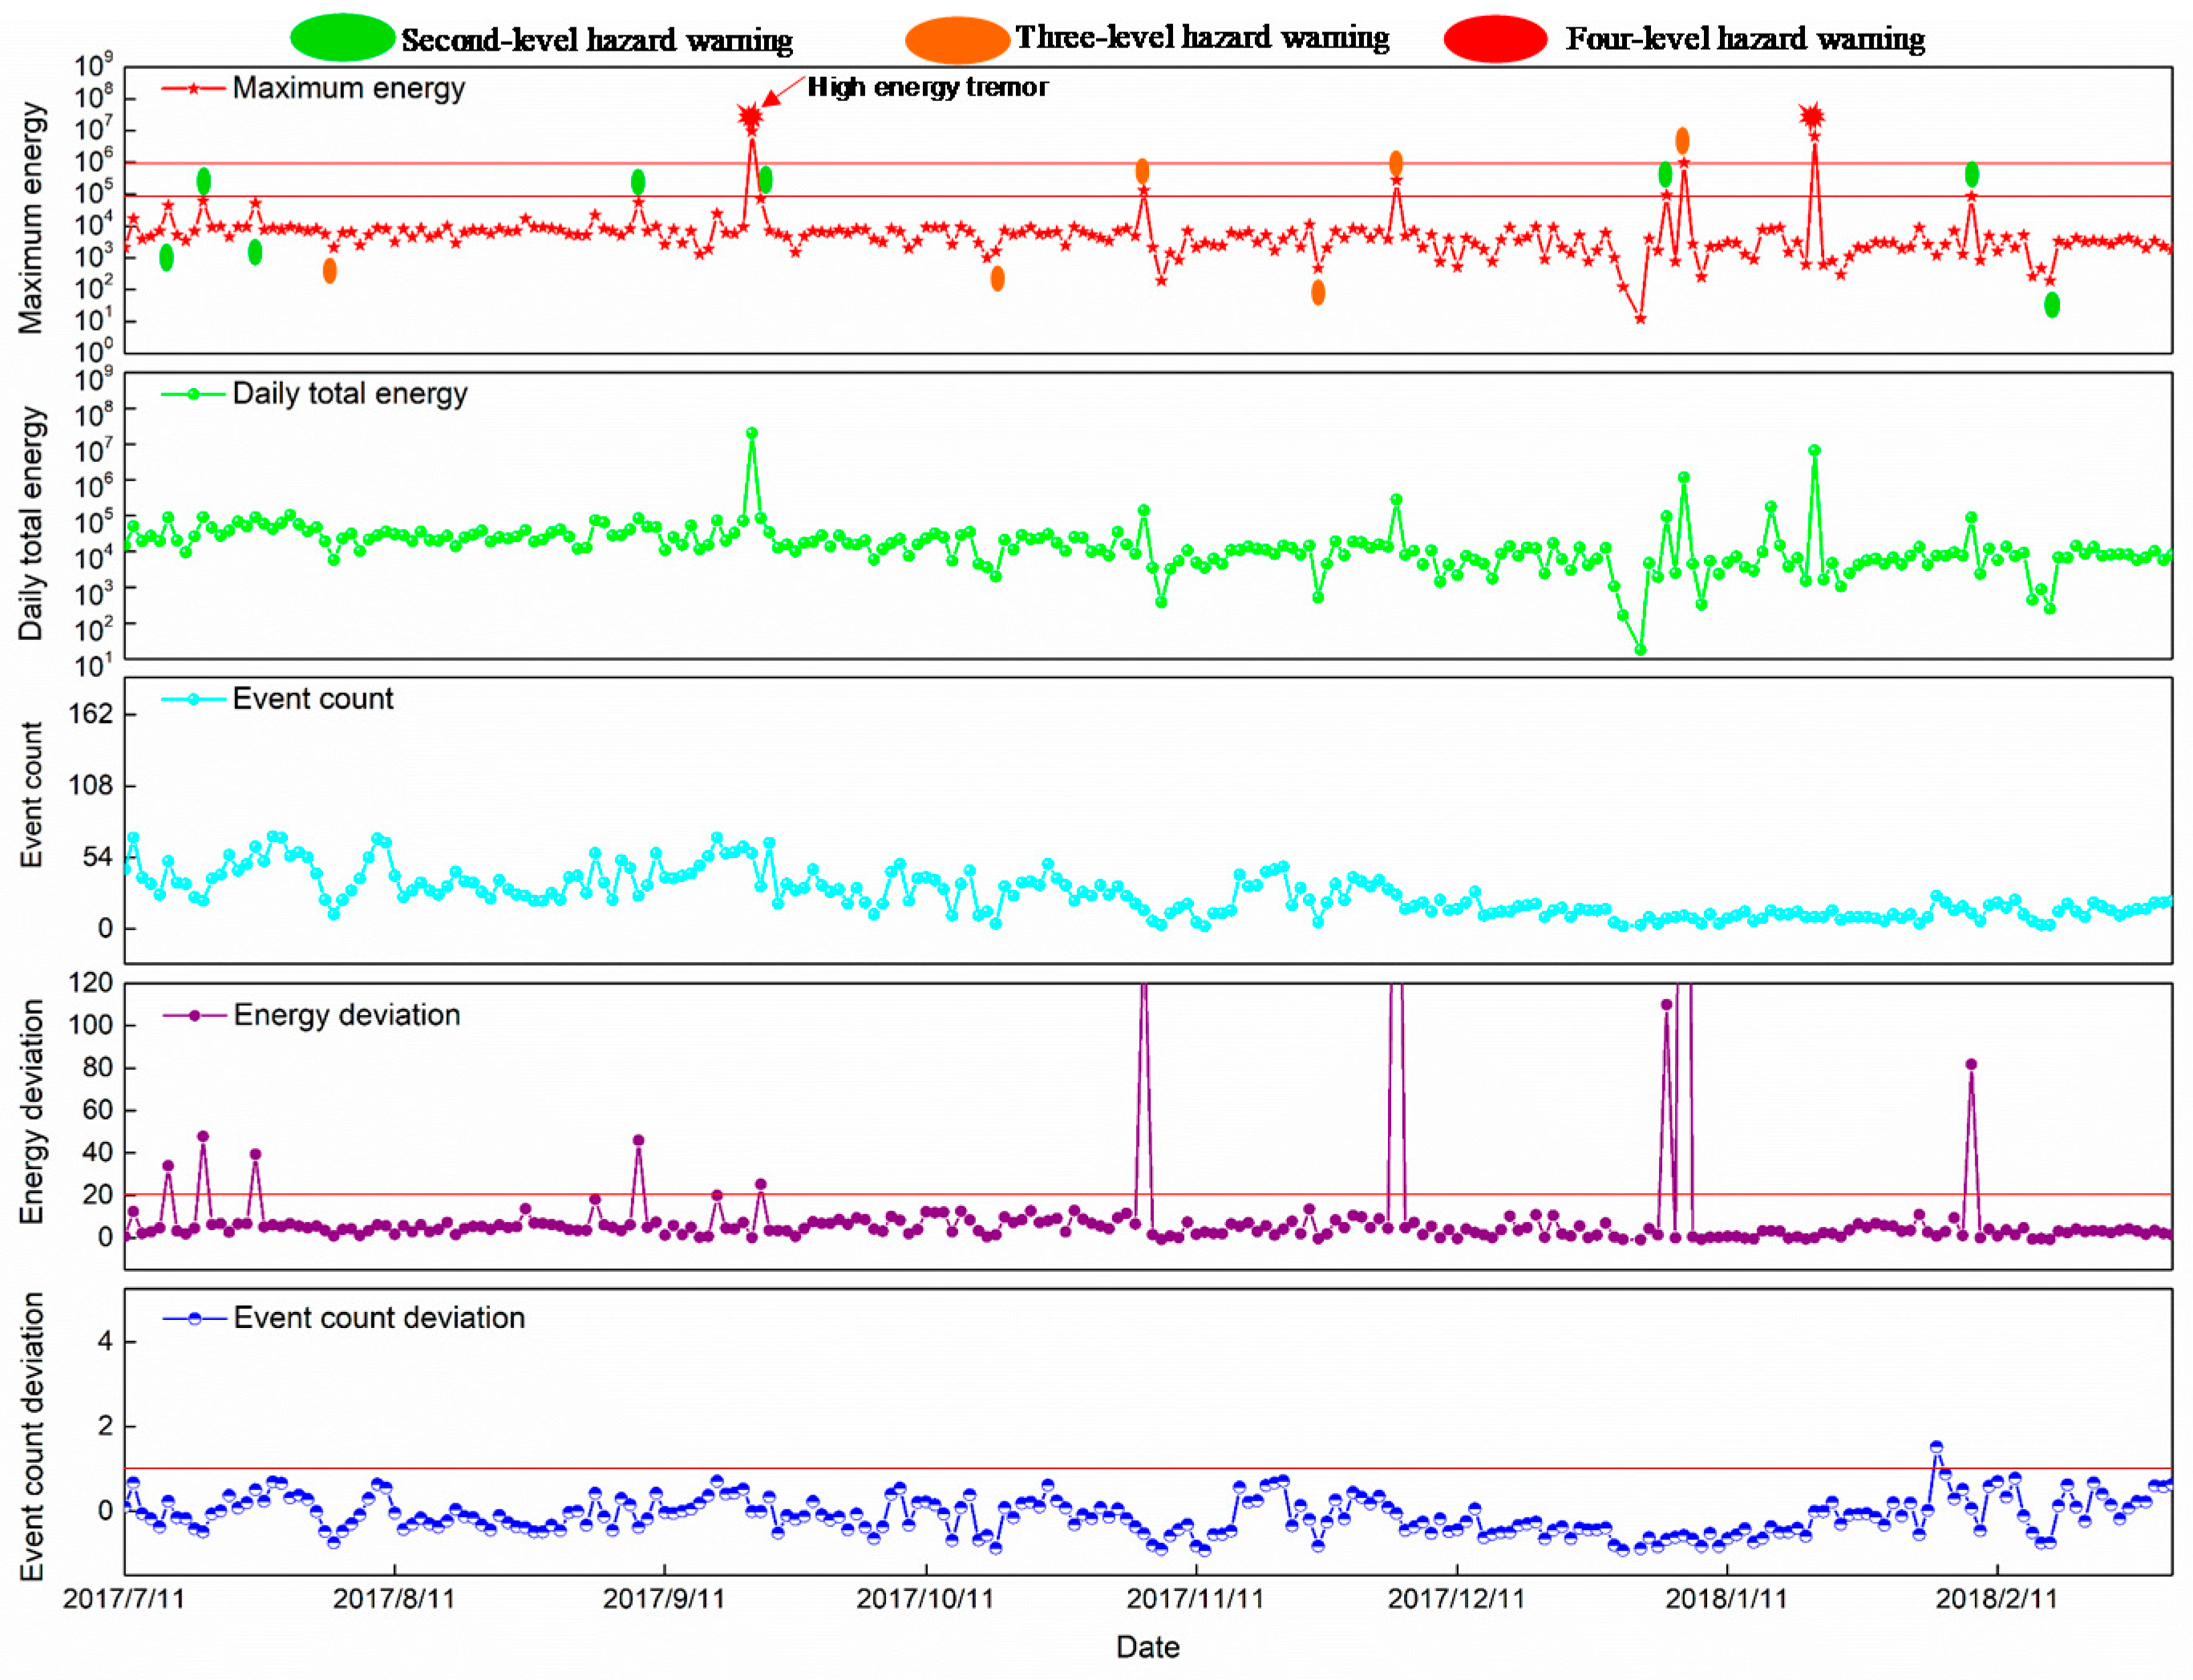
3.2.1. Variation of Energy and Event Count

The variation of total daily energy and event count prior to the rockbursts “11·24”, “2·1”, and “4·26” were explained previously [12]. The study concluded that total daily energy and event count showed sharp-rise-sharp-drop variation, accompanied by decreasing total daily energy to values lower than previously recorded. This observation can be used as an effective precursory sign of rockburst early warning in SIETCS. Figure 7 demonstrates the daily total energy and event count variation curves before one month of the occurrence of the high energy tremors. As shown in Figure 7, the total daily energy showed a sharply rising trend first and then a decreasing trend for a period before the high energy tremor occurred. Finally, total daily energy rapidly increased to values higher than previously recorded, and a high energy tremor occurred. The MS event count in Figure 7 showed a sharply rising trend, and the fluctuation was large, indicating that the fracture activity was significantly strengthened inside the steeply inclined floor and roof stratum, and many micro-cracks were formed. The event count sharply dropped for some time before the occurrence of the high energy tremor. The sharp-rise-sharp-drop variation range in the total daily energy and event count was marked by the solid black line in Figure 7. The main reason for the total daily energy and event count to decrease prior to the rockburst and high energy tremor was attributed to the influence by mining disturbance and the superposition of dynamic and static stress, increasing the stress concentration of coal and rock mass at the corresponding location. The internal fracture of coal and rock mass was active, the event count increased gradually, and the energy stored in the coal and rock mass was released. When the internal energy of coal and rock mass was released to a certain extent, the stored energy was insufficient to break the existing balance, and the energy released by coal and rock mass fracture was reduced. The internal energy began to accumulate under the action of stress. When it reached the limit of energy storage capacity of the coal and rock mass, it was released abruptly under the influence of external dynamic load disturbance, inducing rockburst or high energy tremor.
The total daily energy in the sharp drop stage decreased to values lower than previously recorded before the rockburst, and there was no similar phenomenon before the high energy tremors occurred. The lower value reveals why the damage degree of rockburst was serious than a high energy tremor: the energy released before rockburst was relatively lower. A large amount of energy was accumulated, and the instantaneous release of energy led to serious damage. Therefore, three phenomena, namely, the sharp-rise-sharp-drop variation in total daily energy, sharp-rise-sharp-drop variation in event count, and decreasing total daily energy to values lower than previously recorded, could be used as an effective precursory sign for rockburst. The sharp-rise-sharp-drop variation in total daily energy and event count could be used as one of the effective precursory signs for a high energy tremor. These findings were used to construct a spatio-temporal early warning method for SIETCSs.

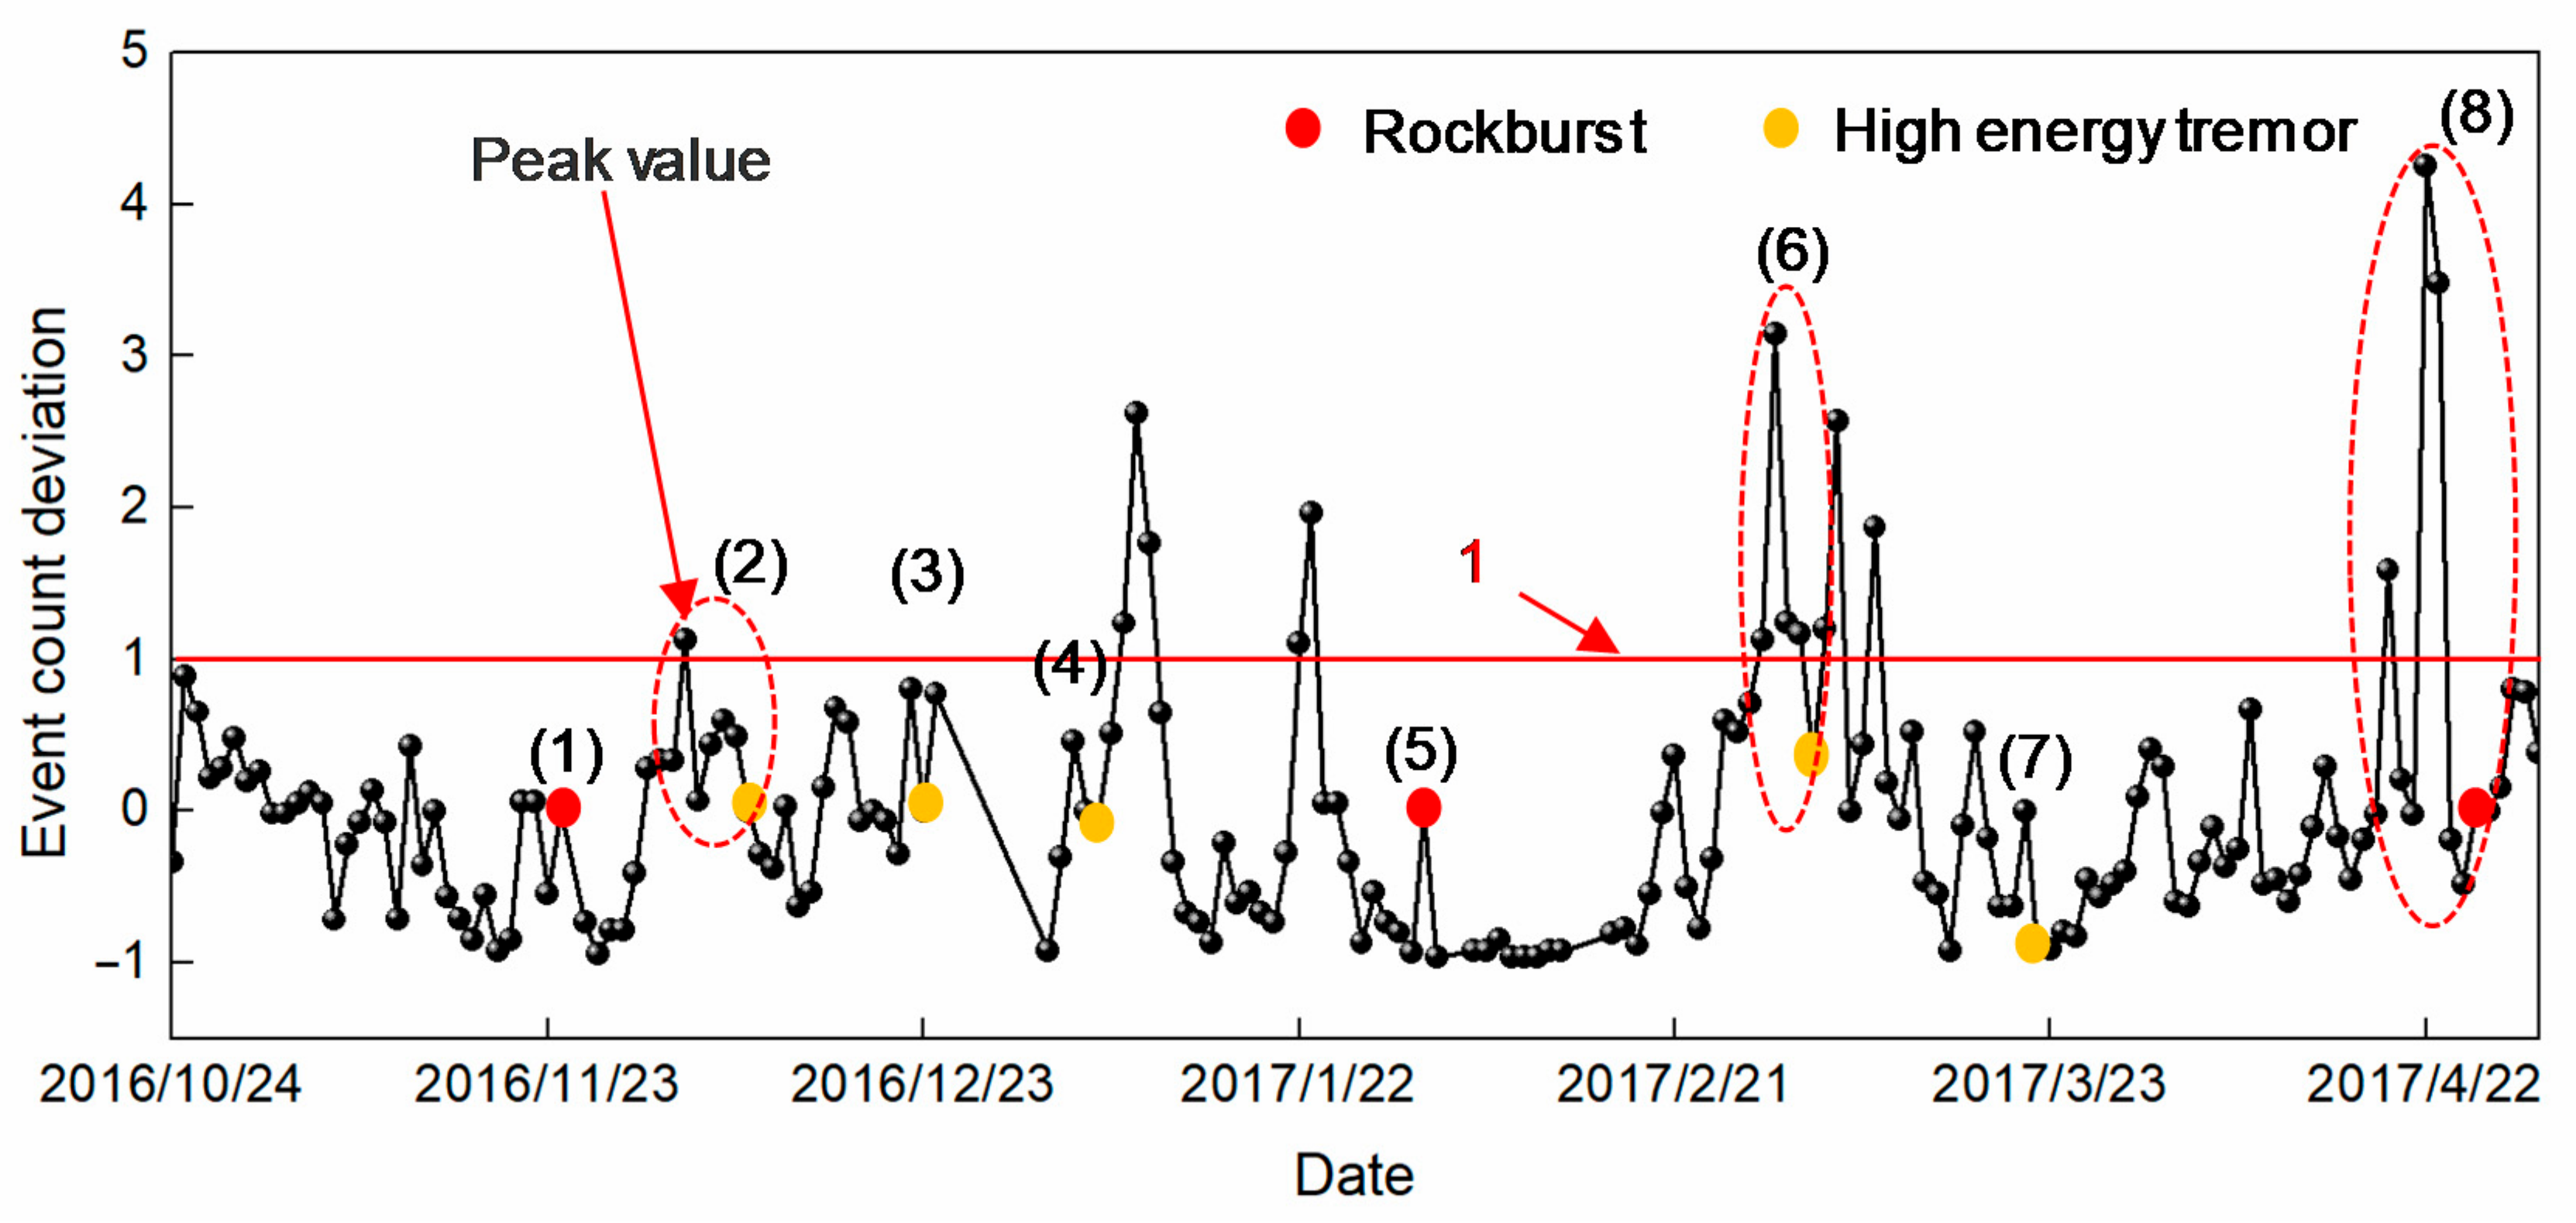
3.2.2. Variation of Energy and Event Count Deviation

Figure 8 and Figure 9 show the temporal evolution of both MS energy deviation and event count deviation before the rockbursts and the high energy tremors. The response indicates that prior to the occurrence of high energy tremors or rockbursts, peaks were observed in DE or DP with a magnitude exceeding 20 and 1, respectively. It indicates that the coal and rock mass was in an unstable state due to the disturbance of mining or surface subsidence during this period, and the MS activity of the corresponding stress concentration area of the coal and rock mass was enhanced. The micro-cracks inside the coal and rock mass were produced in large numbers and were gradually expanded, converged, and connected to form macro-fractures, making the MS energy and event count at this stage higher than before. The risk of rockburst near the mining surface was increased. Furthermore, temporal precursor characteristics of energy and event count deviation verified and complemented each other to improve the accuracy of early warning (see Figure 8 and Figure 9).
Therefore, in the monitoring and early warning of rockburst and high energy tremor, not only the original parameters such as MS energy should be considered, but also the trend of changes in the original parameters should be considered comprehensively. The appearance of a peak value of energy deviation (≥20) and event count deviation (≥1) can be regarded as an effective precursory sign that indicates imminent rockburst danger. The peak values of energy deviation and event count deviation for early warning were determined based on the rate of accurate alarm, omission, and false alert.
Crack generation, dynamic failure, and energy release can occur in different scales of coal and rock mass. For example, AE events are caused by a failure of standard coal and rock specimens in the laboratory, MS events are caused by coal and rock failure in underground mines and tunnels, and seismicity is induced by rapid energy release from earthquakes in the crustal field [46,47,48]. The failure of coal/rock specimens with a burst tendency under uniaxial compression can be regarded as a small-scale rockburst [48]. Due to the non-repeatability of rockburst in-situ, it is difficult to further demonstrate the relationship between MS and rockburst risk. Therefore, AE experiments under uniaxial compression were performed in the laboratory to study the temporal evolution laws of AE energy and pulses before the failure of the specimen. The experiments guided the selection of MS indicators and the determination of precursor characteristics before rockburst. As shown in Figure 2a and Figure 10a, the AE pulses and energy before the failure of specimen A showed an increase first, then decrease, accompanied by the appearance of a “silent period”. Subsequently, the specimen failed with an increase in energy and pulses. As shown in Figure 2b and Figure 10b, the AE pulses and energy showed an increasing trend followed by a decreasing trend before the failure occurred in specimen B. The temporal evolution laws of AE energy and pulses before the failure of the specimen were similar to the temporal evolution laws of daily total energy and event count before the rockburst and high energy tremor. This similarity proved the possibility of using this trend as a precursor for rockburst and high energy tremors early warning. On the other hand, the abnormal increase of AE energy and pulse number before specimen failure also supported for early warning of rockburst and high energy tremors by using higher MS energy and event count deviation.

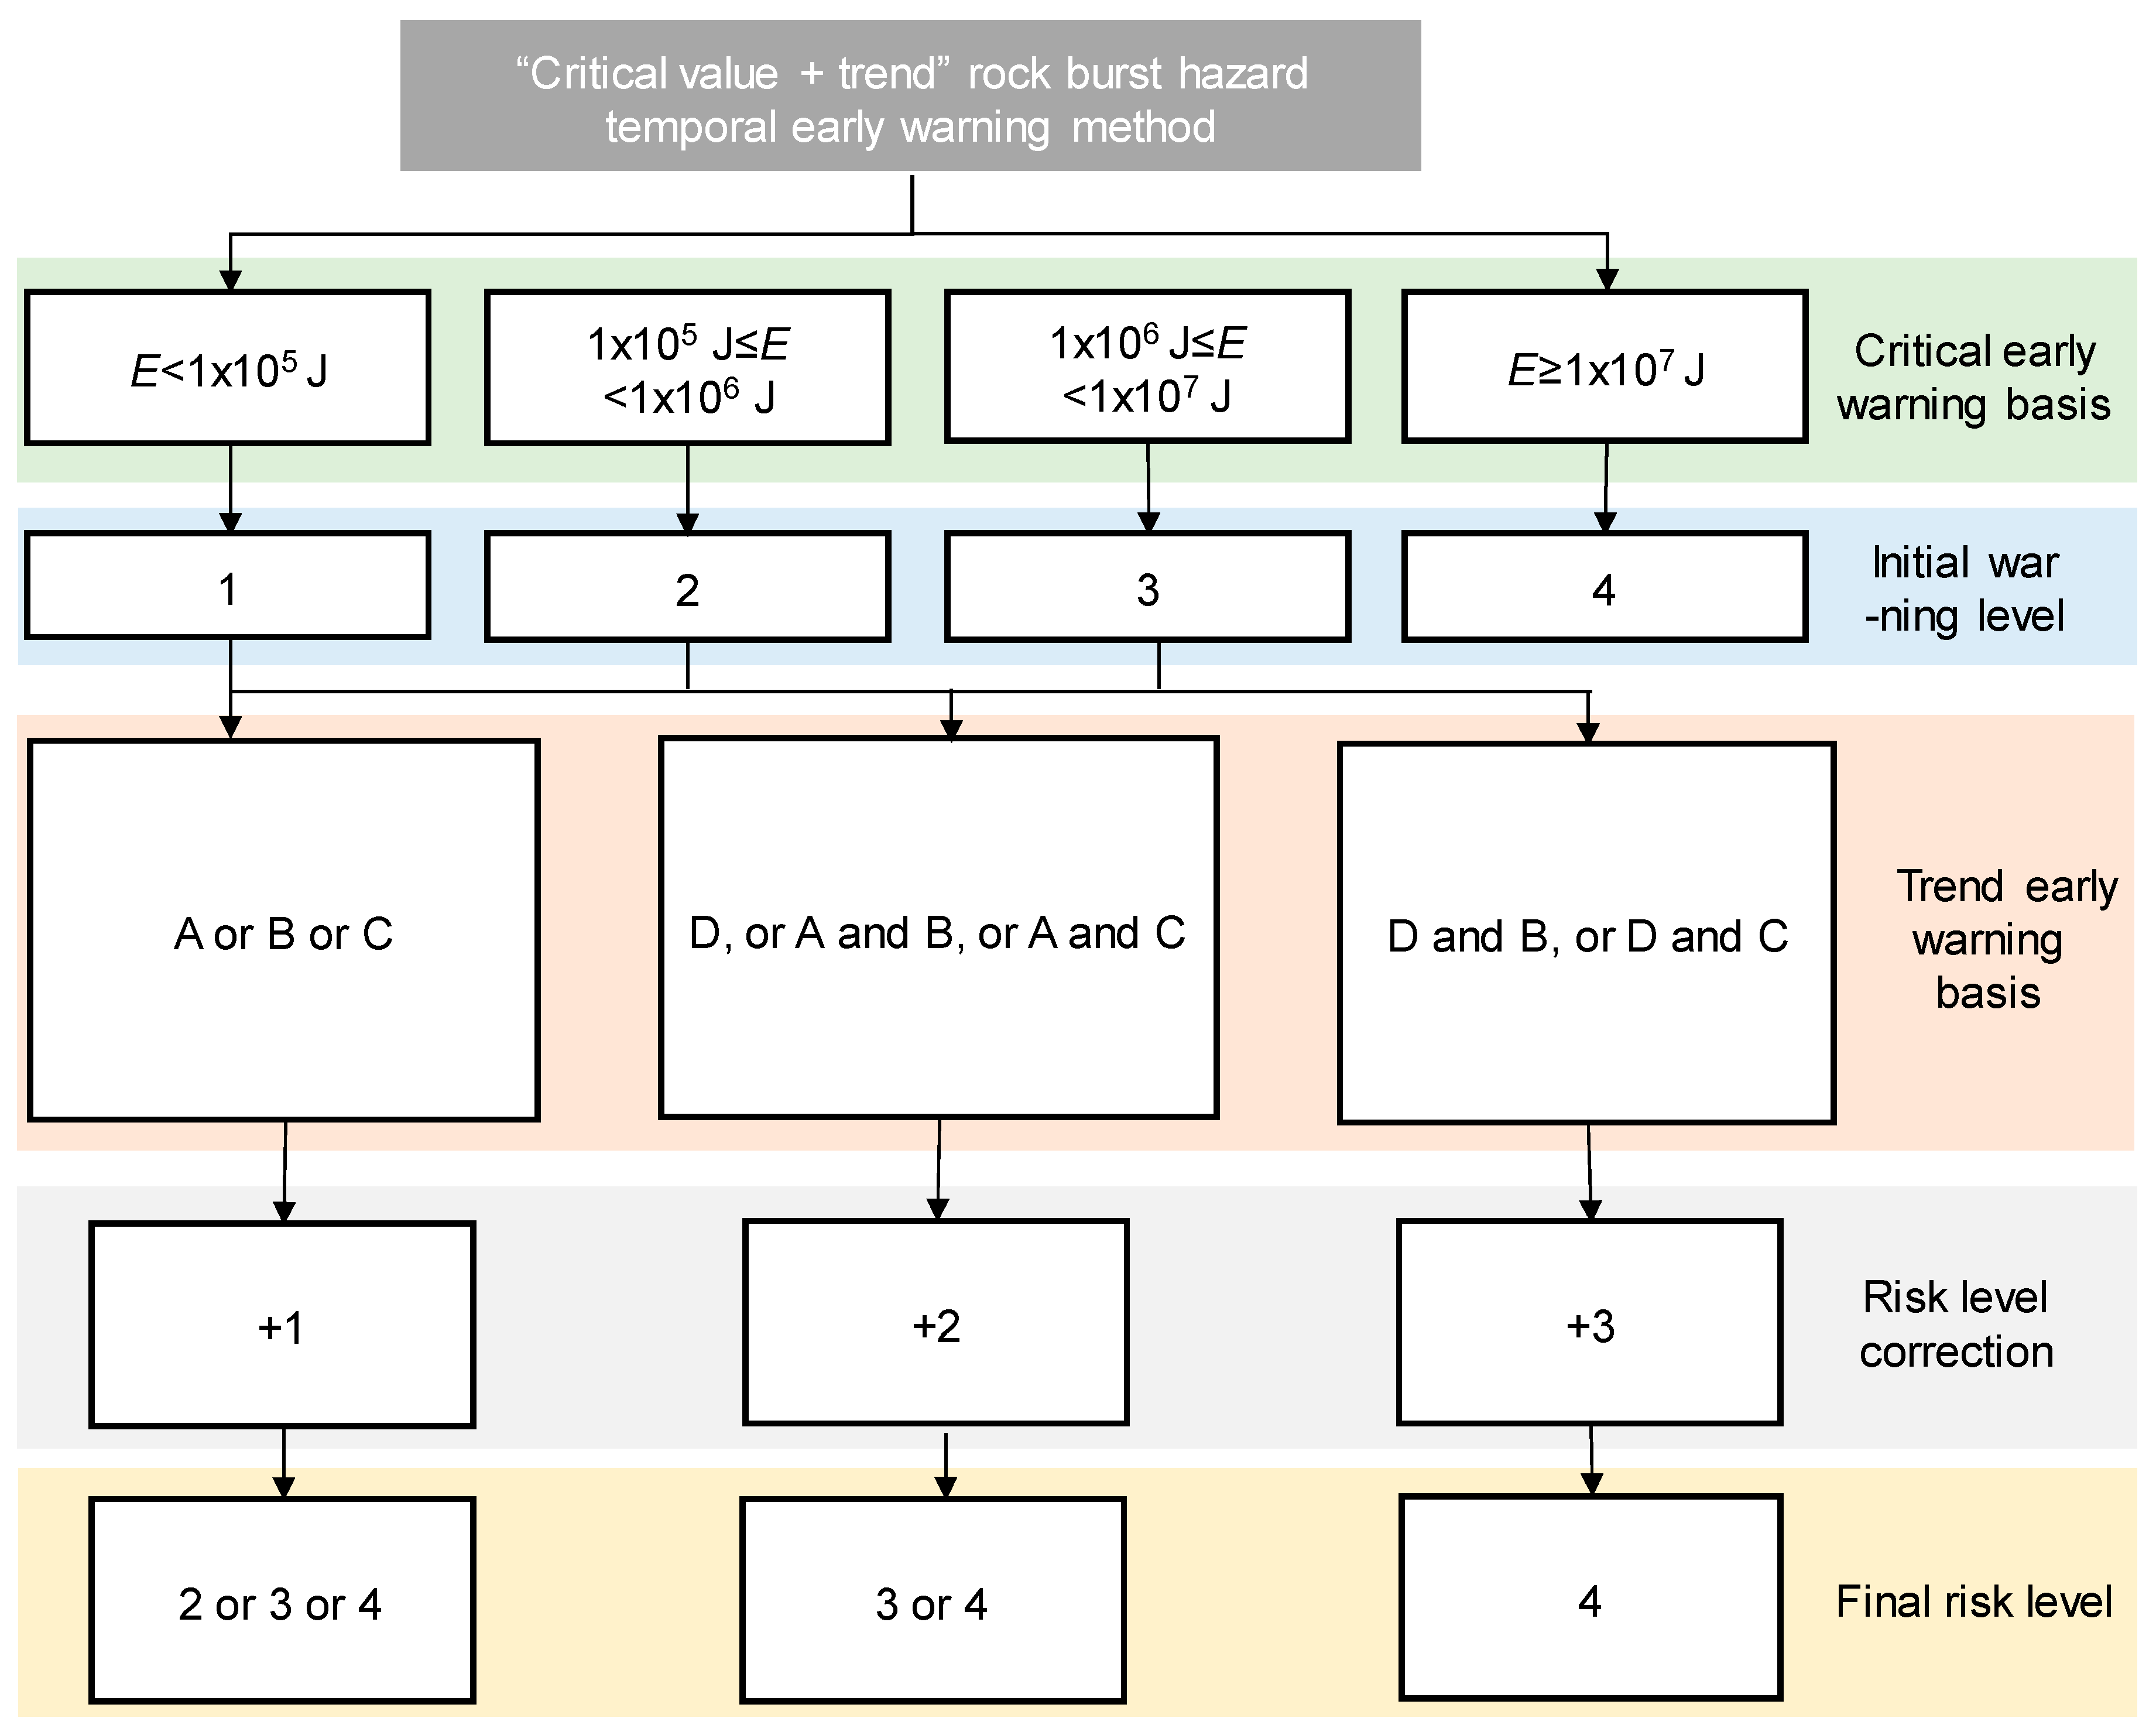
3.2.3. “Critical Value + Trend” Temporal Early Warning Method of Rockburst Hazard

At present, the WCM mainly conducts a “critical value” warning based on the analysis of historical monitoring data. The warning system comprises four levels of warning based on the magnitude of energy, which is termed as the critical value. The four levels of rockburst warning status of the WCM are: no danger (1), weak danger (2), medium danger (3), and strong danger (4), according to the China Detailed Rules for Prevention and Control of Rockburst in Coal Mines. Specifically, when the energy is < 1 × 10⁵ J, the first-level early warning is performed. When 1 × 10⁵ J ≤ energy < 1 × 10⁶ J, the second-level early warning is performed. When 1 × 10⁶ J ≤ energy < 1 × 10⁷ J, the three-level early warning is performed, and when the energy is ≥ 1 × 10⁷ J, a four-level early warning is issued. The elastic strain rebound increment generating an earthquake is proportional to the square root of the energy of the earthquake [49]. The magnitude of energy reflects the failure intensity of coal and rock [34,50]. Therefore, the use of different energy values to early warn different rockburst risk levels appears reasonable.
Based on the “critical value” warning method used in WCM and analysis results of temporal precursor characteristic of rockburst and high energy tremor, a temporal early warning method was proposed in this study. The method combined the critical value of early warning and the trend of early warning to warn the rockburst risk. The “critical value + trend” early warning method is shown in Figure 11, where A represents the sharp-rise-sharp-drop variation in daily total energy and event count, B represents the DE ≥ 20, C represents the DP ≥ 1, D represents the sharp-rise-sharp-drop variation in total daily energy and event count, accompanied by decreasing total daily energy to values lower than previously recorded. The highest risk level is 4.
As shown in Figure 11, firstly, a critical value early warning was used to determine the initial rockburst risk level based on the MS energy value E. Then, according to the trend of energy and event count change, energy deviation DE and event count deviation DP, the trend warning was used to correct the initial risk level and to determine the final rockburst risk level.
The “critical value + trend” temporal early warning method could alert the rockburst hazard state in a temporal sequence and could lay a foundation for subsequent spatial warning. If temporal early warning indicates the possibility of a rockburst risk, it is necessary to use spatial warning to identify the stress concentration areas and rockburst risk areas so as to provide a guide for targeted pressure relief measures.

3.3. Spatial Early Warning Results and Analysis

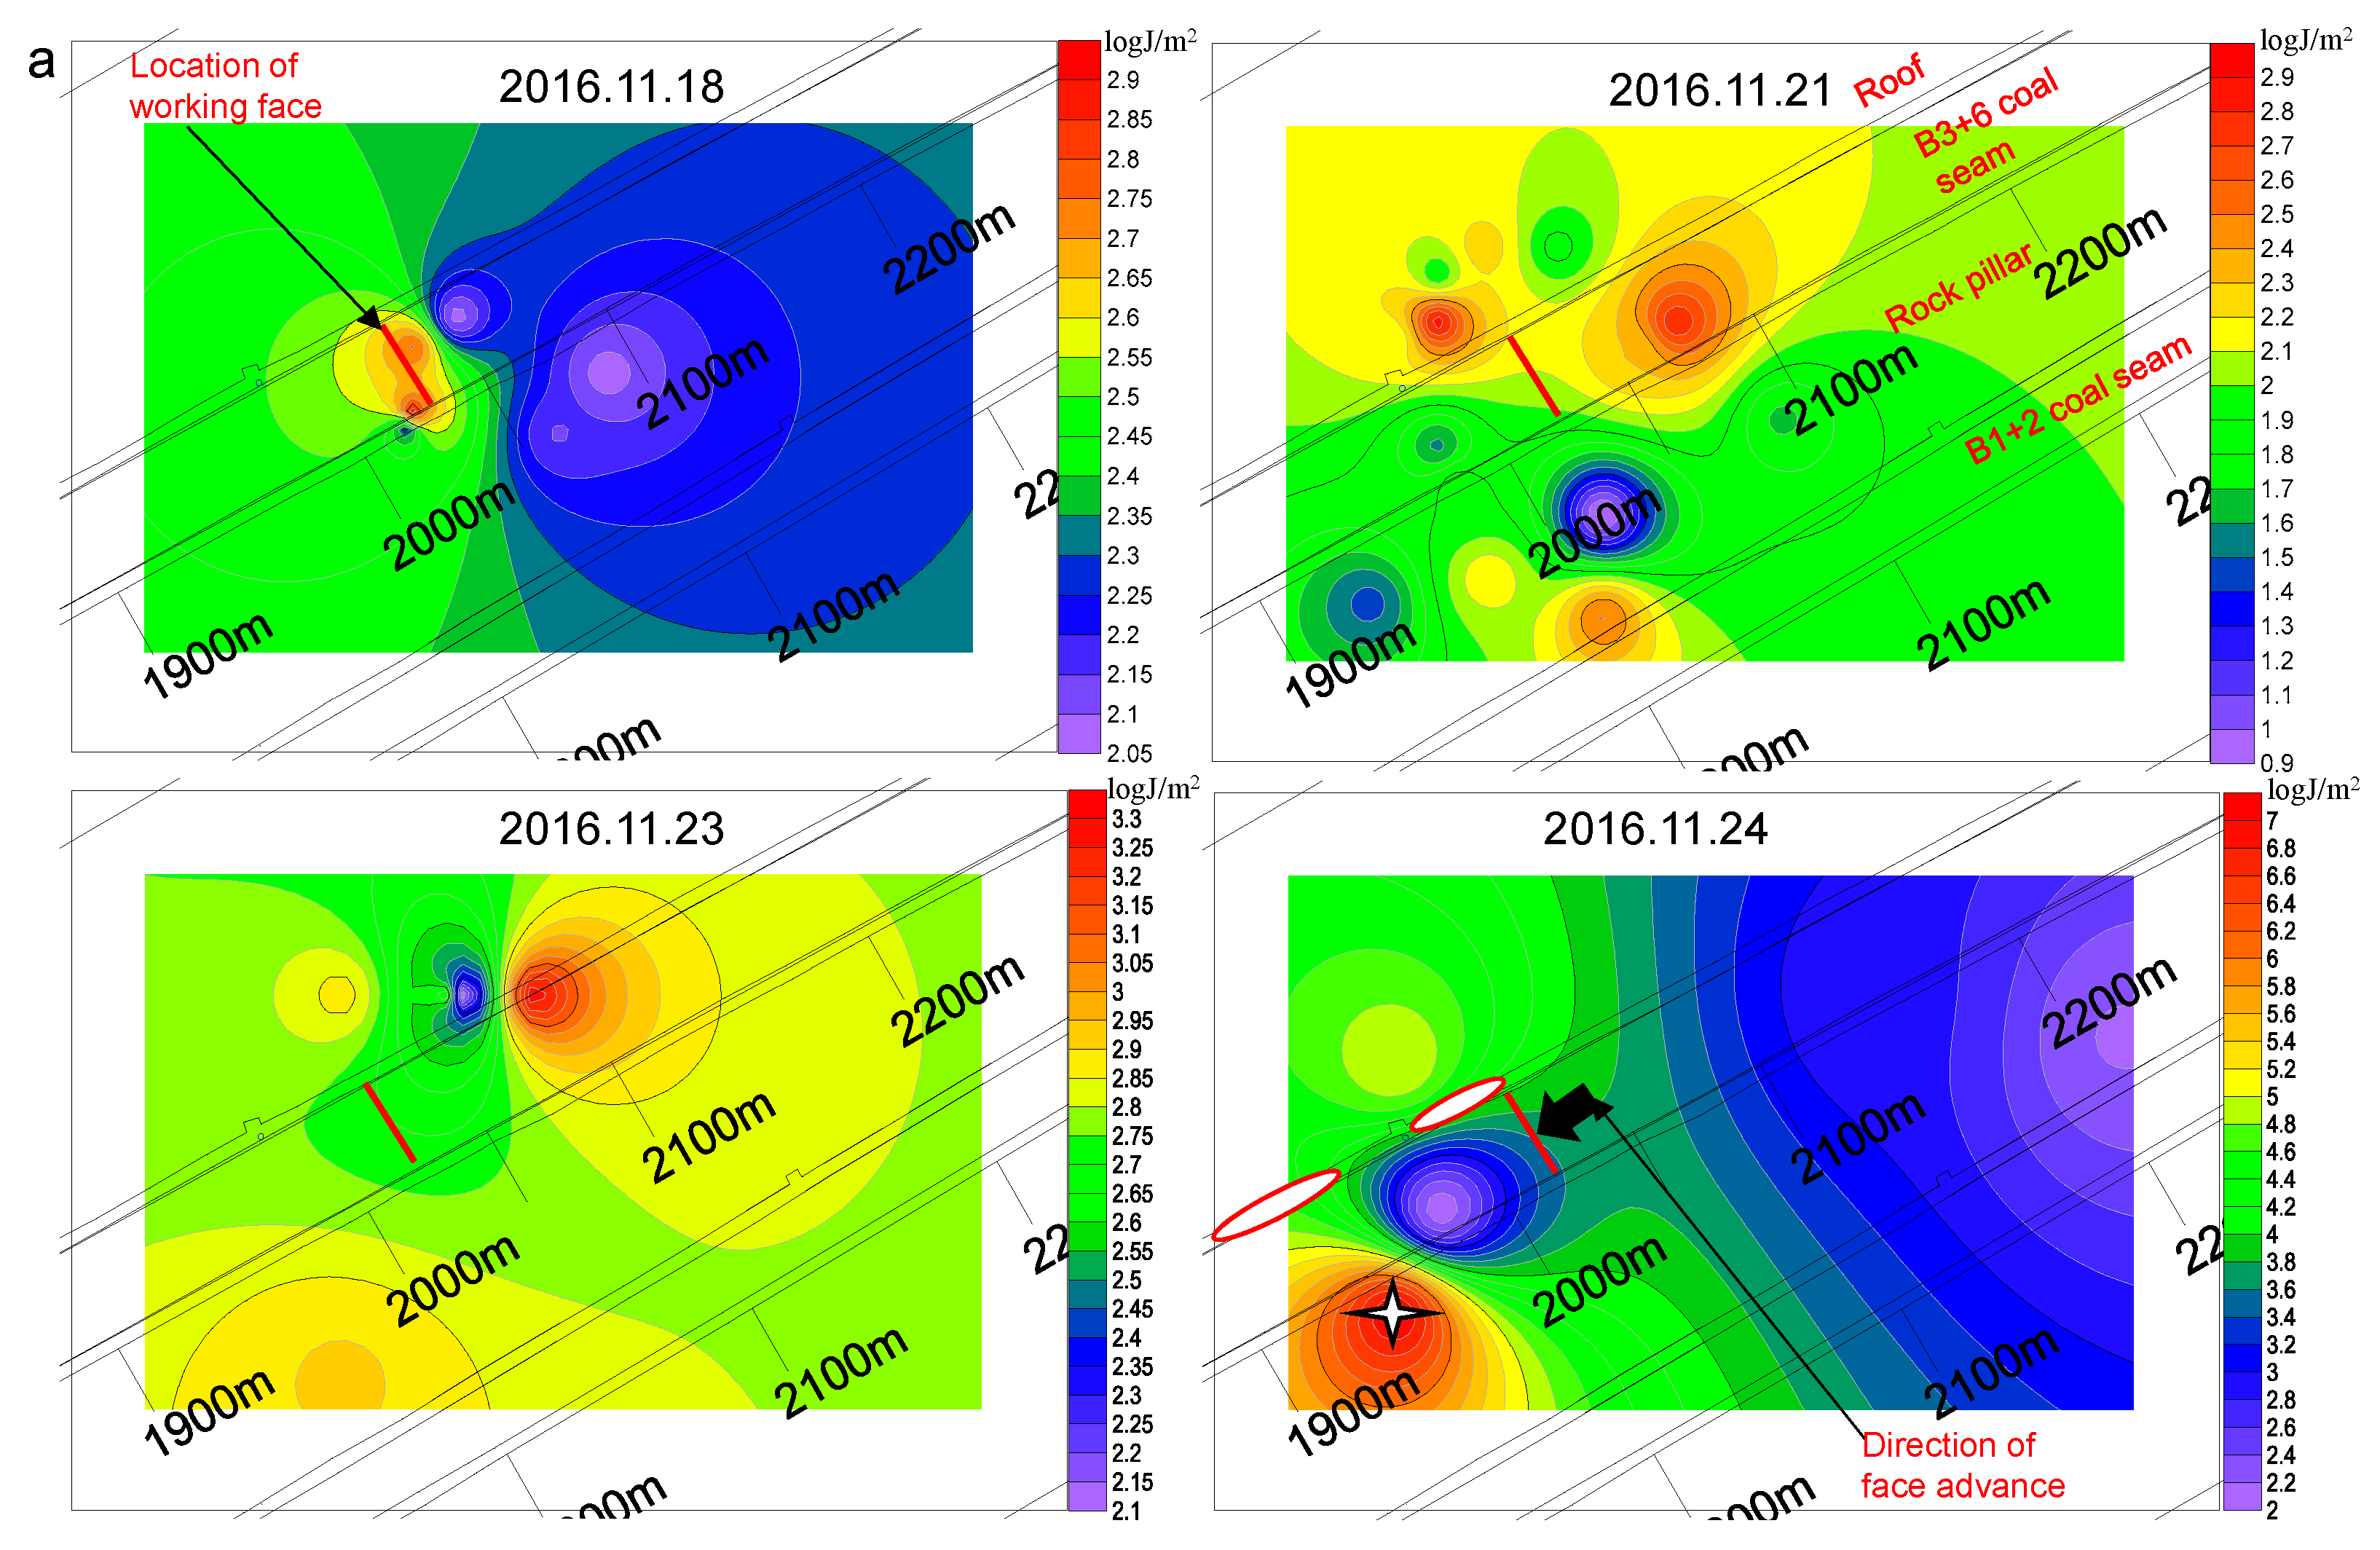
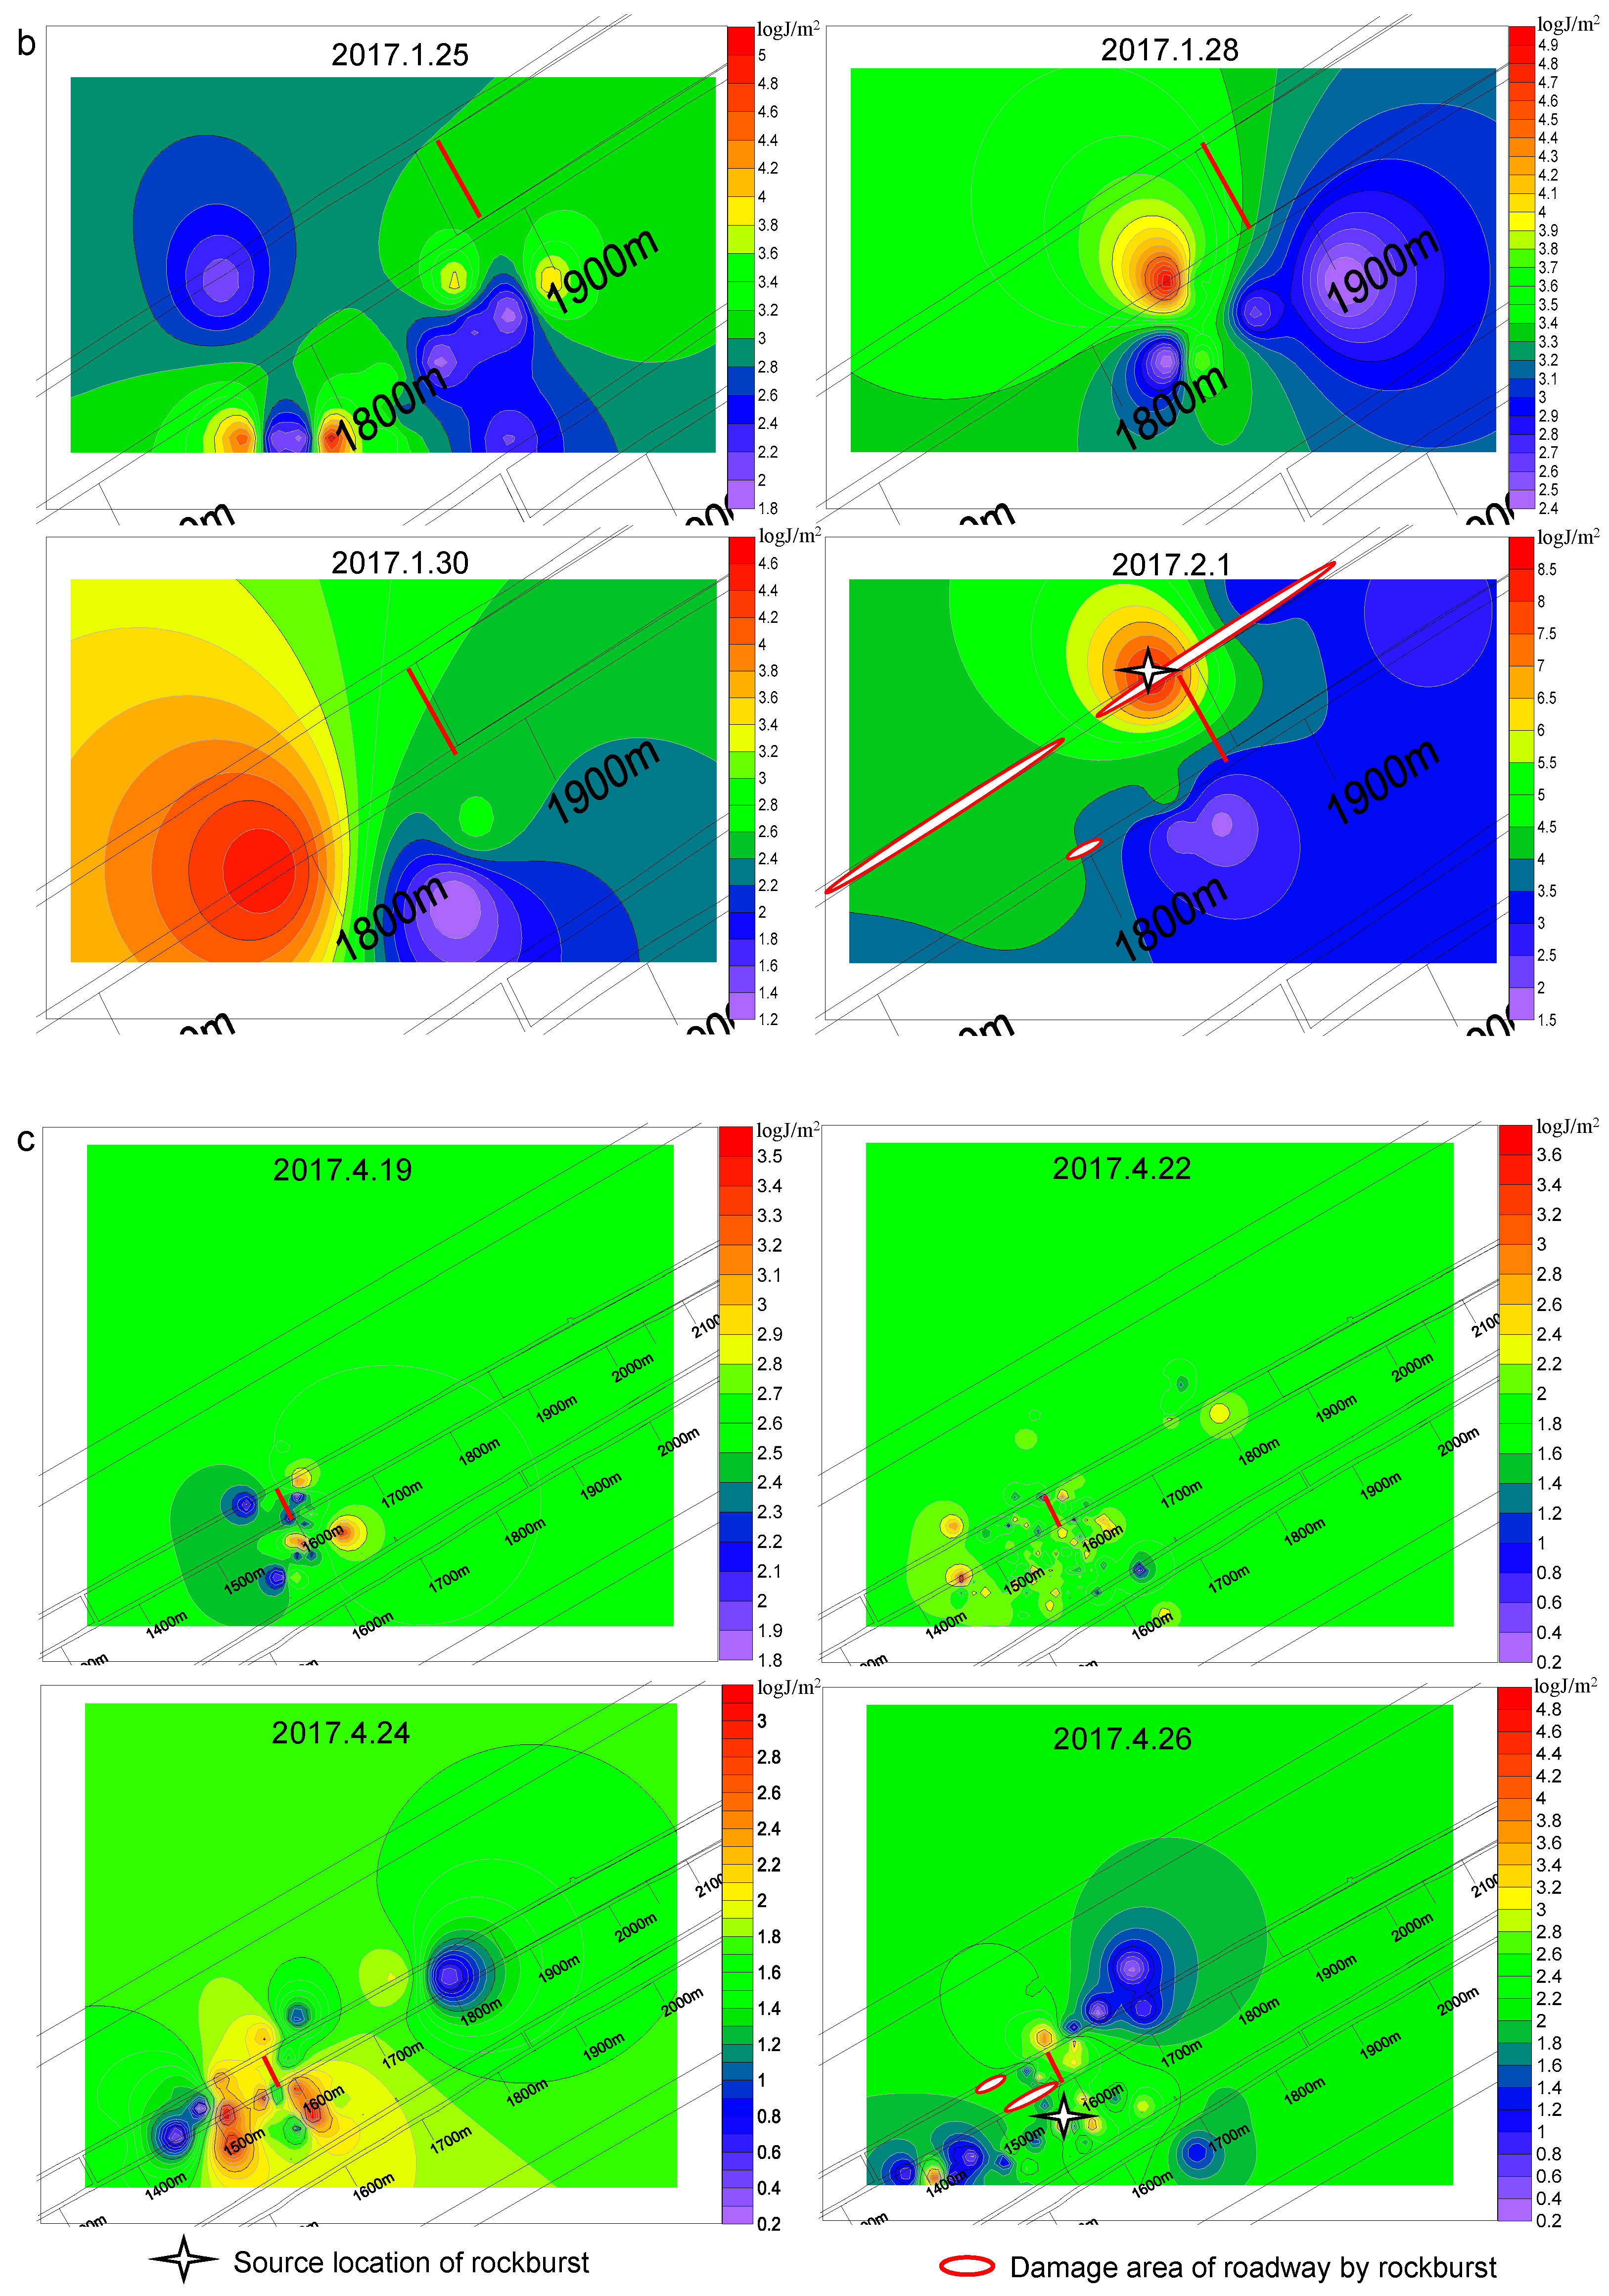
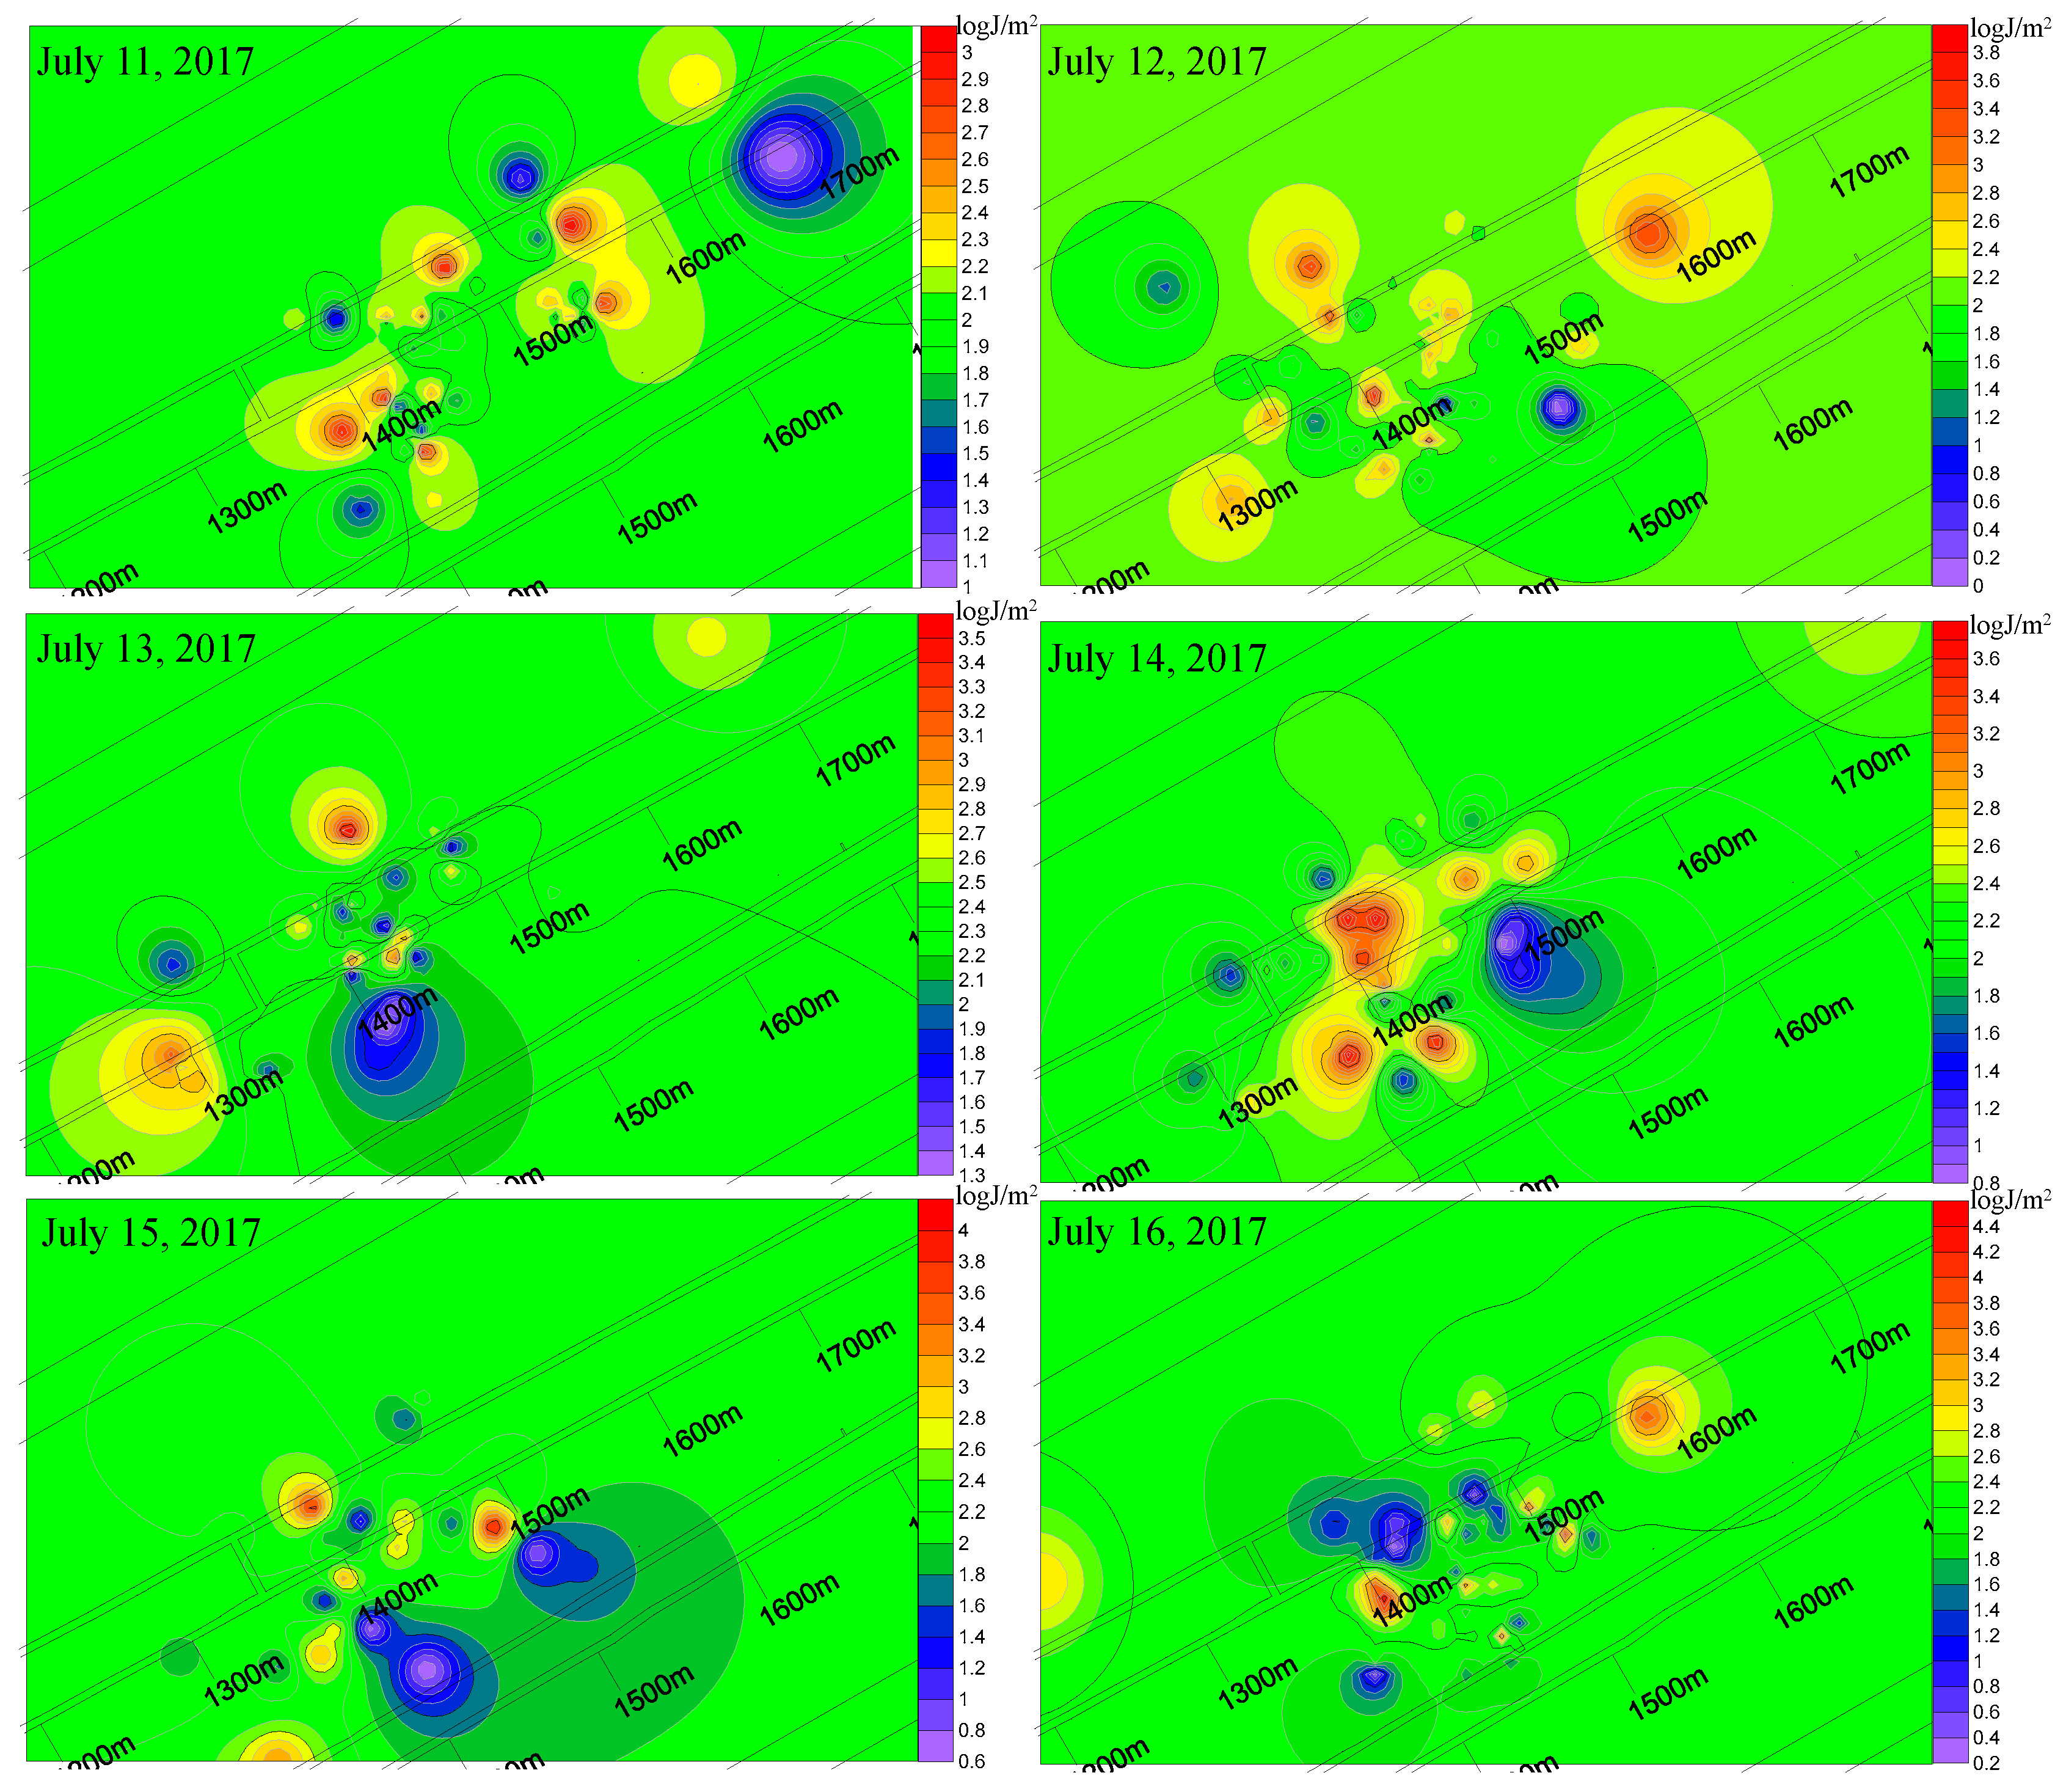
3.3.1. Evolution Law of EDIM and Discussion

Figure 12 shows spatial contour nephograms of EDIM for different mining periods before each rockburst. The damaged area and source location of rockburst were also marked. As shown in Figure 12a, the damaged area of rockburst “11·24” was mainly located in the roof side roadway in front of the working face, and the seismic source lay in the rock pillar. Six days before the occurrence of rockburst, only the values of EDIM in the coal seam near the working face were relatively high as they were affected by mining disturbance. With the advancement of the working face, the EDIM anomalous area of the roof and rock pillar increased significantly until two to three days before the occurrence of rockburst, and then the rockburst damage occurred in the anomalous area. As shown in Figure 12b, the damaged area of rockburst “2·1” was mainly located in the roadway around the working face, and the source of rockburst lay in the roof. Seven days before the occurrence of rockburst “2·1”, the area with larger EDIM was located near the 1800 m chainage. With the approach of rockburst, the EDIM in front of the working face continued to rise and began to expand to the roof. Then, large MS events occurred in the area with larger EDIM, and rockburst was induced. Figure 12c shows the spatial evolution law of the EDIM before rockburst “4·26” occurred. The EDIM in front of the working face began to increase abnormally before four days of the occurrence of rockburst. The corresponding areas of the roof and rock pillar led to rock failure and elastic energy release under the action of high-stress concentration. Two days before the rockburst occurred, the EDIM and spatial range further increased, and then the rockburst occurred in the corresponding area. The source of rockburst lay in the rock pillar. The damage induced by rockburst was mainly located in the larger EDIM area.
The anomalous areas of the EDIM before the occurrence of the rockburst were consistent with the rockburst damaged areas and the source locations, which were located within 200 m of the working surface. It indicated that stress was mainly concentrated in these areas before rockburst occurred. The fracture strength of coal and rock and rockburst risk were high, so necessary prevention measures would be required within 200 m of the working surface. Therefore, the EDIM was effective for early warning of stress concentration and rockburst risk area, and the EDIM could guide the targeted implementation of pressure relief measures.
The vertical distribution of three rockburst sources occurred in +450 horizontal No. B3 + 6 as shown in Figure 13. The sources were located in the roof and rock pillar and in the mining level or plastic zone under the mining level. The principle of induced rockburst is shown in Figure 14. The reasons for the sources to be concentrated in those particular locations are attributed to the fact that the areas experienced markedly large compressive and prying effect caused by the bending of roof and rock pillar. Stress concentration in those areas was high, and it was exacerbated by the influence of mining disturbance. The dynamic stress which caused previous rockbursts was concentrated in those areas. Therefore, in the plane and vertical direction, the pressure relief activities should be focused on the roof and rock pillar areas, particularly within 200 m of the working face (strike direction) and in the mining level or the plastic zone under the mining level (vertical direction).

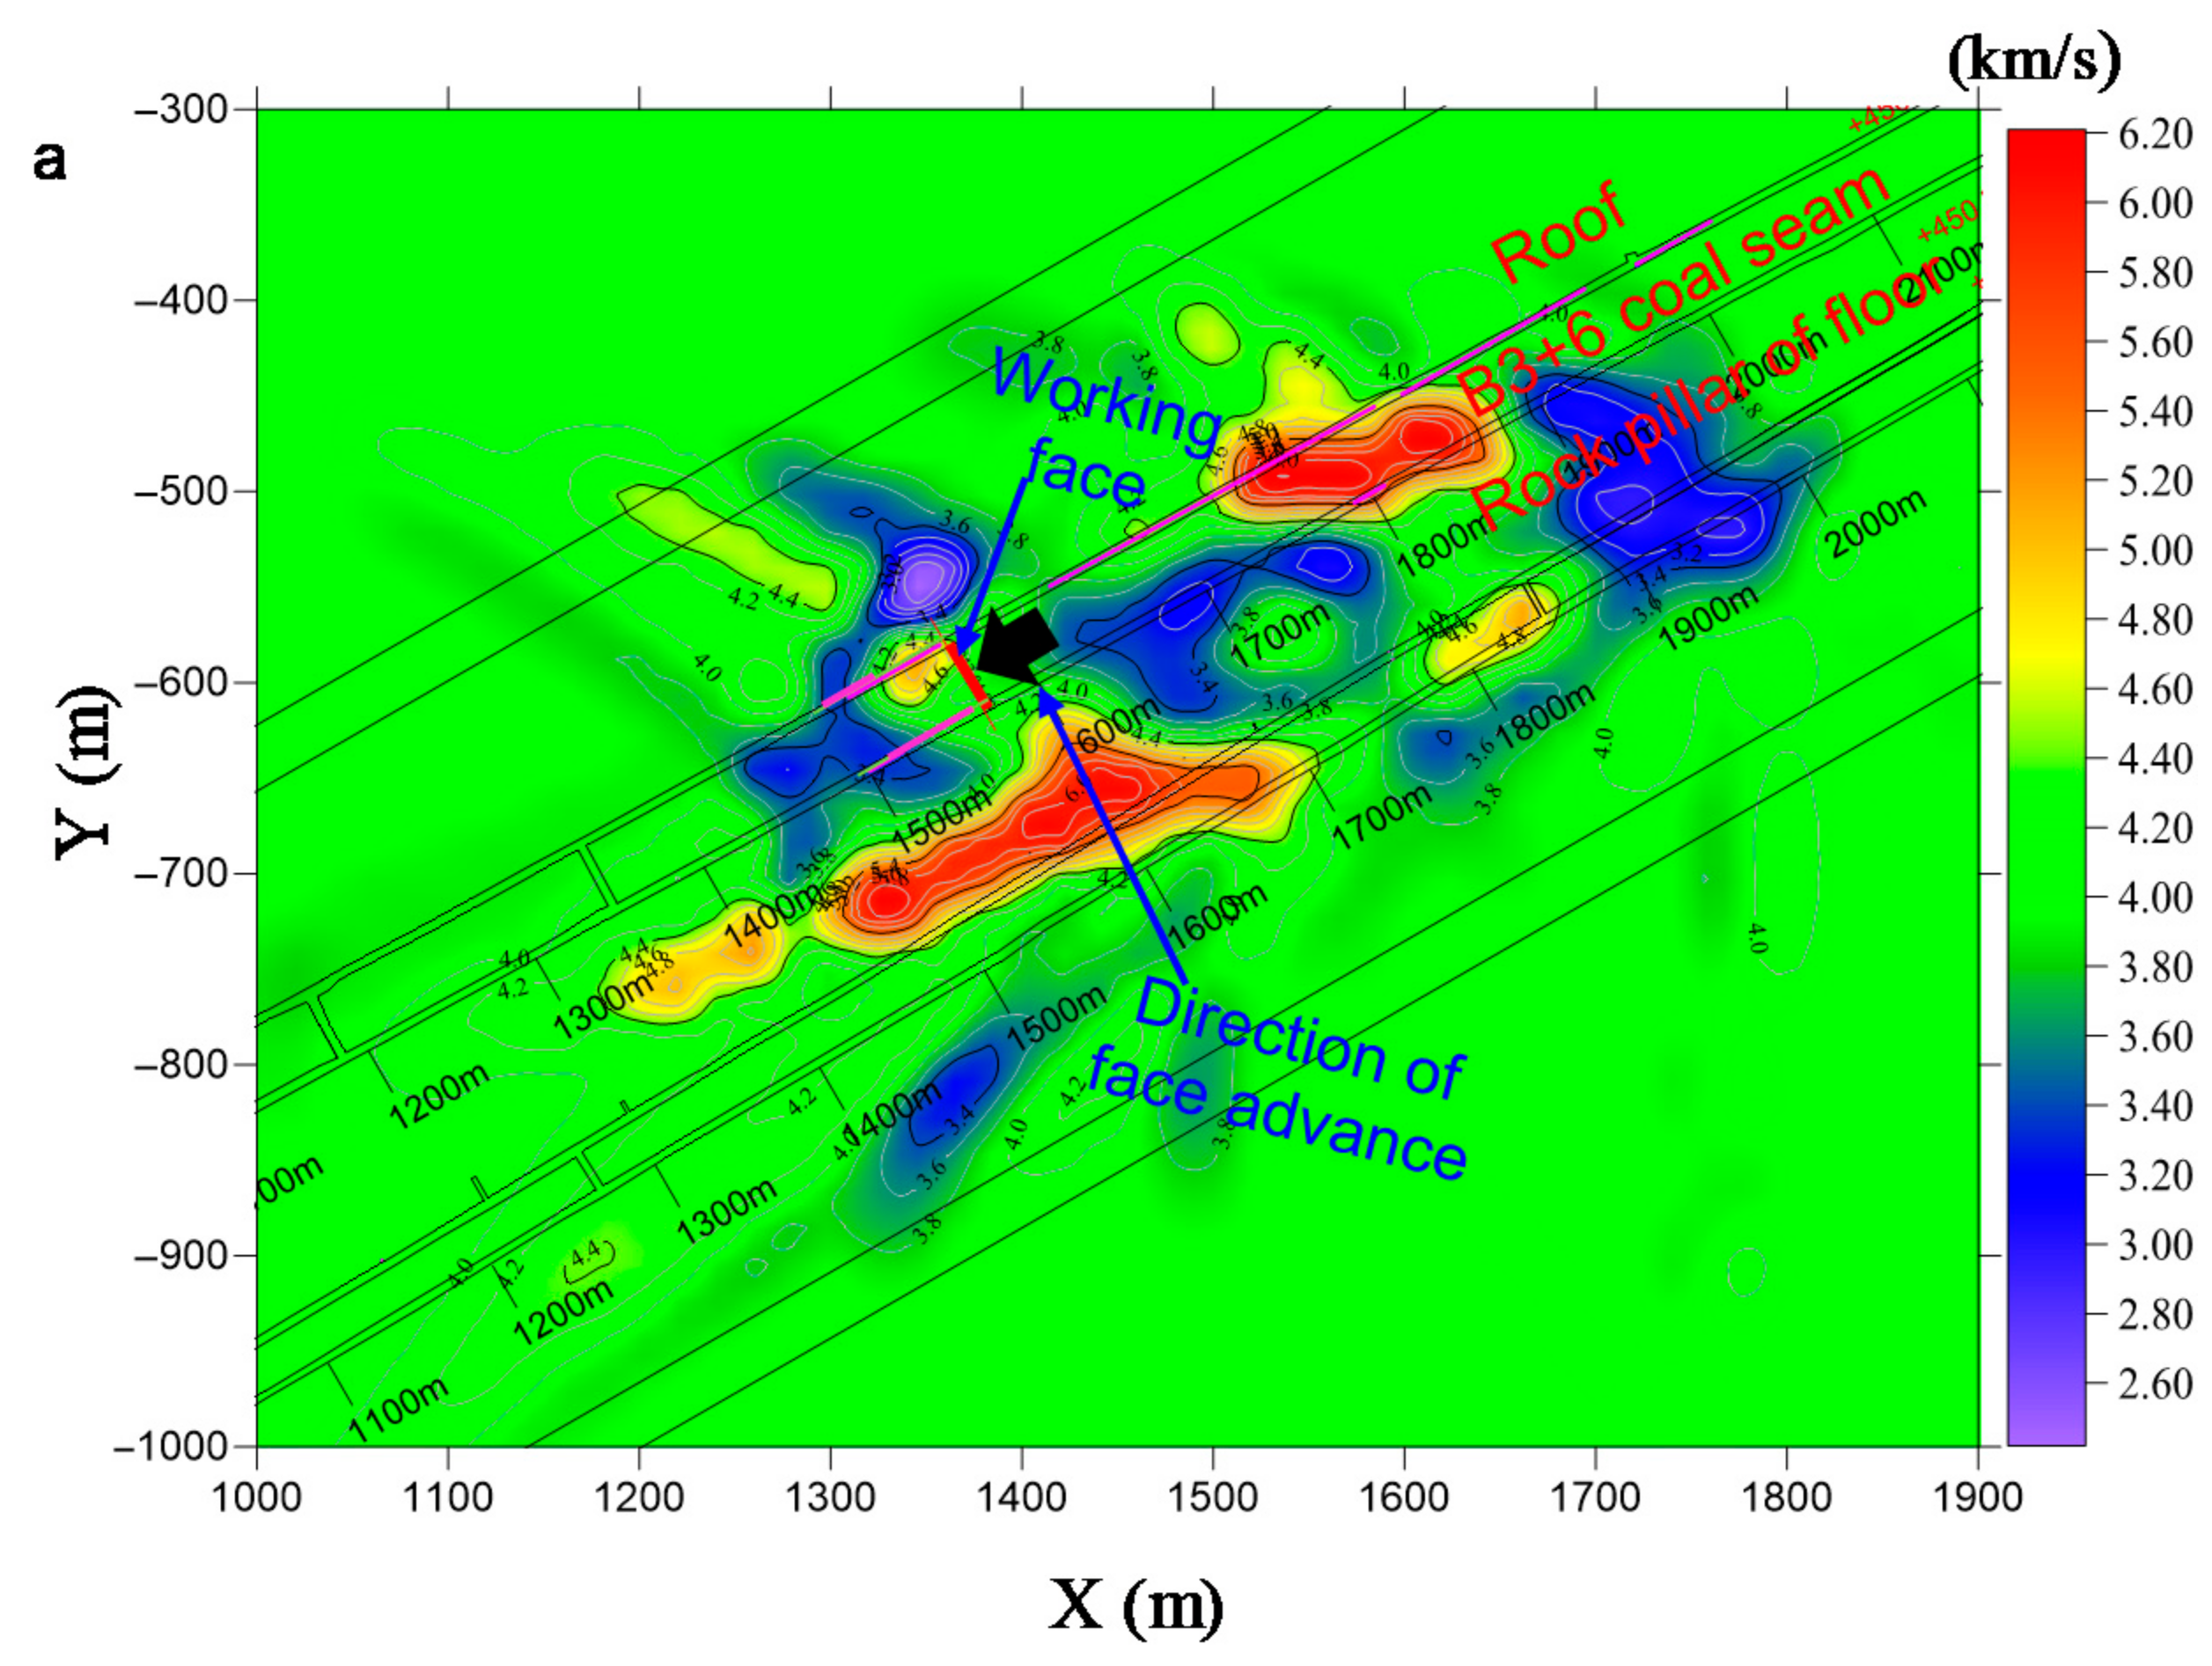
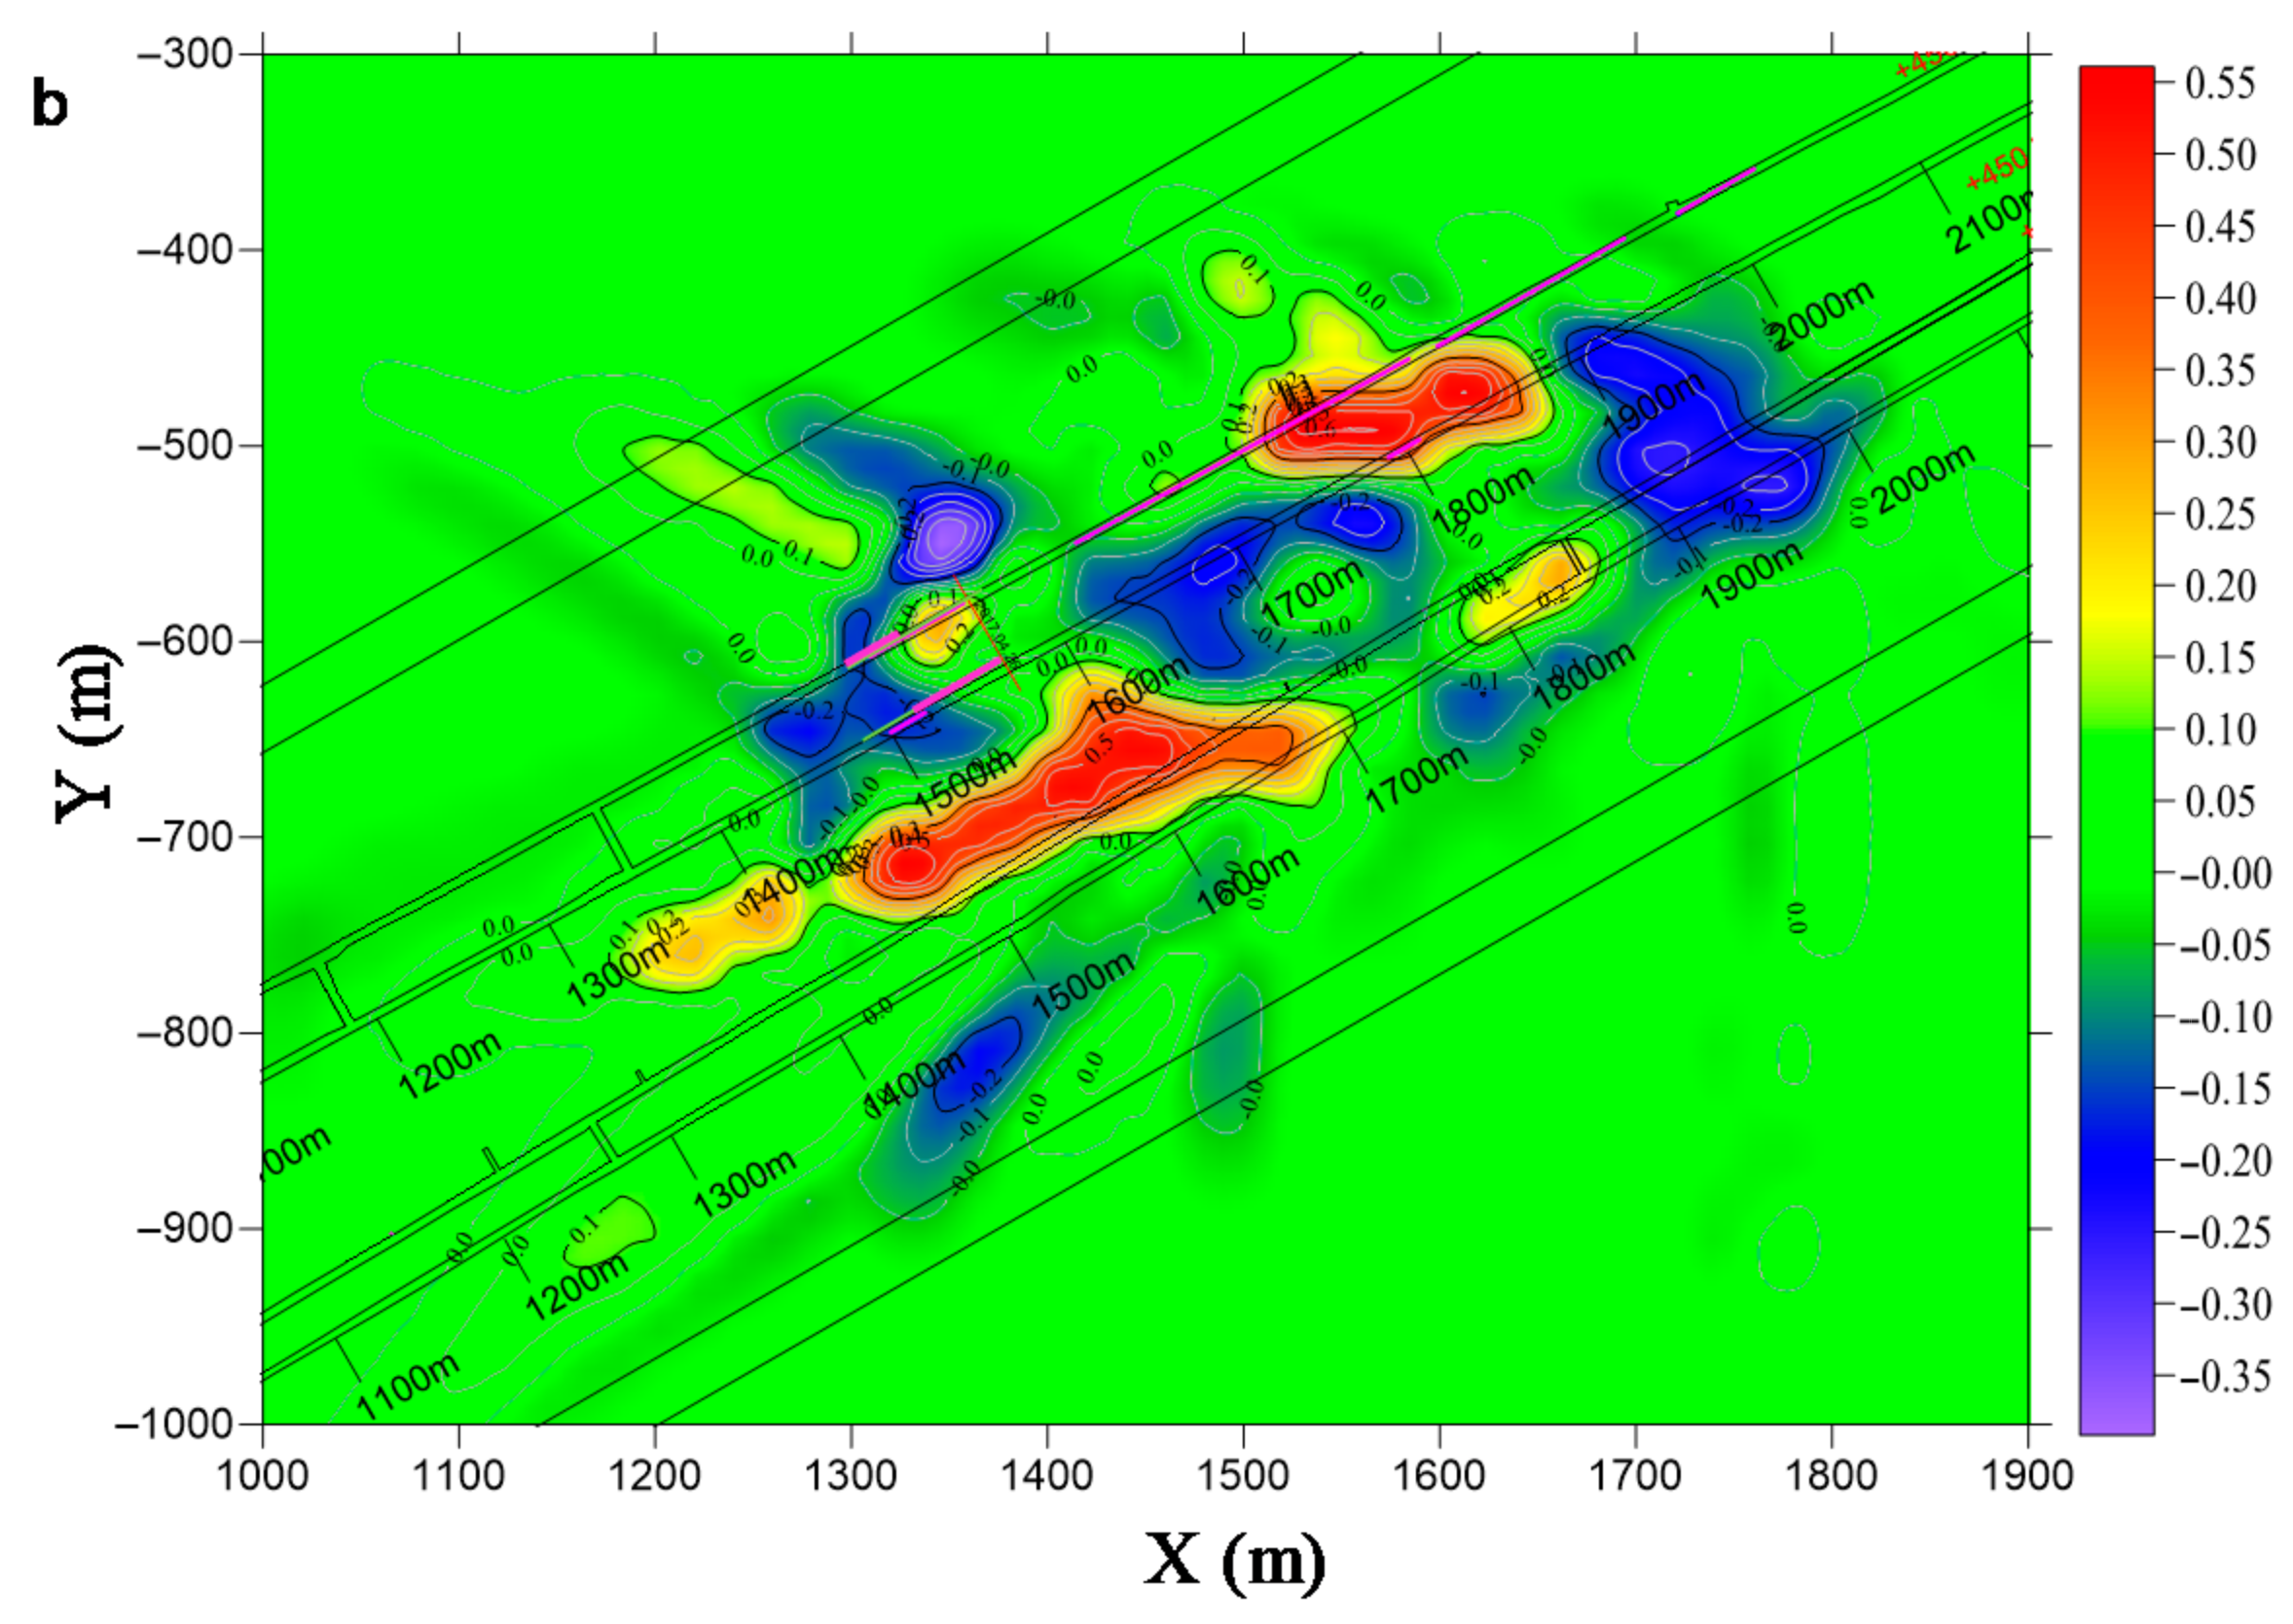
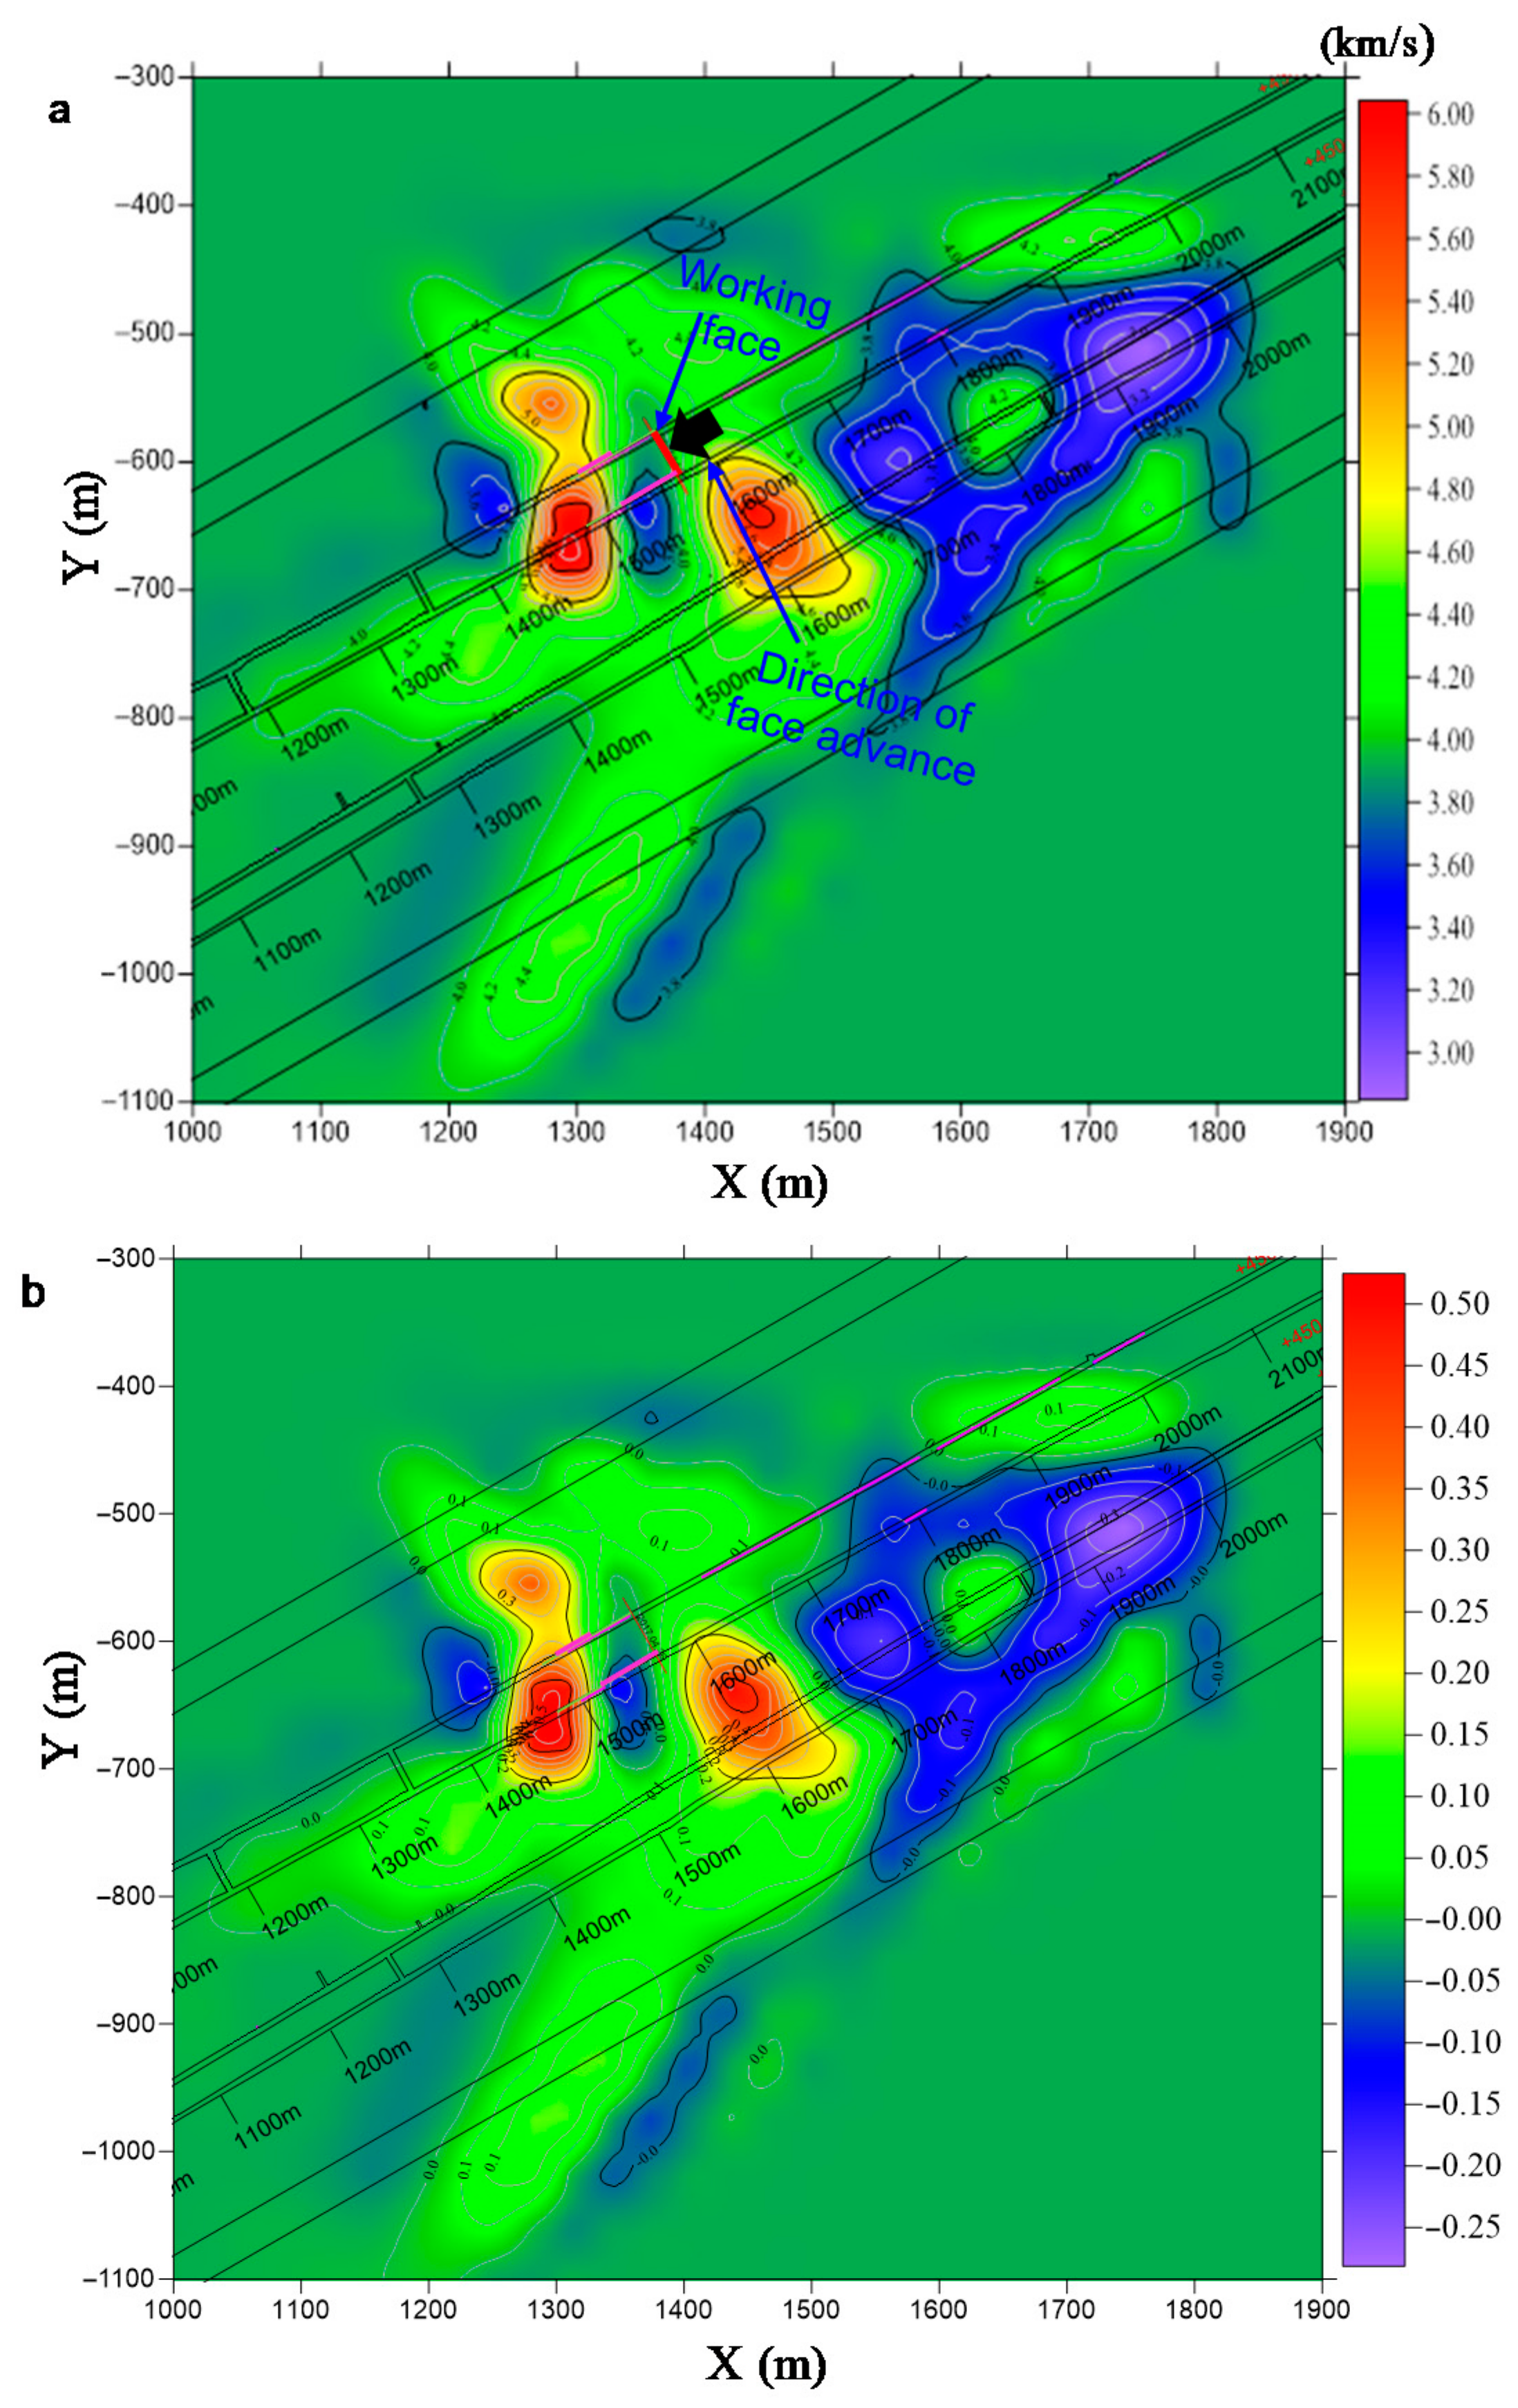
3.3.2. Passive Tomographic Results and Discussion

Passive tomographic imaging uses a MS source to infer the stress state of the surrounding coal and rock mass. In this study, the MS event acquisition for passive velocity inversions during the +450 horizontal No. B3 + 6 fully mechanized top-coal caving face mining was implemented by the ARAMIS M/E monitoring system. The velocity and velocity anomalies were obtained by using MINESOSTOMO program [44].
In order to analyze the spatial stress distribution of surrounding coal and rock mass before the occurrence of rockbursts, and to investigate the mechanism of rockburst of SIETCS, passive tomographic imaging was implemented four days before rockburst. In order to improve the calculation accuracy, only the MS events that were recorded by at least five stations were adopted. A total of 46 × 48 × 37 voxels in the inversion of 22 April 2017 and 23 April 2017, with each voxel measuring 20 × 20 × 20 m, were input into the tomographic calculation. Plan views of velocity tomograms were generated for each period at seam level, Z = +450 m, to evaluate the areas and degrees of high rockburst hazard for the next mining period.
Figure 15 and Figure 16 show P-wave velocity and velocity anomaly changes during the mining period in +450 horizontal No. B3 + 6 coal seam from 22 April 2017 and 23 April 2017. While more than 100 MS events occurred each day, the inversion criterion met the accuracy requirement once a day. The pink color in the figure indicates the damage range of the previous rockburst during the +450 horizontal mining. The inversion results of wave velocity four days before the occurrence of rockburst are shown in Figure 15. The inversion results showed that the high wave velocity region was concentrated in the B3 + 6 coal seam and the rock pillar. The maximum value of P-wave velocity in this period was up to 6.0 km/s. The maximum velocity anomalies exceeded 0.5, which indicated that the above stress concentration areas were at moderate or strong rockburst risk now and in the future.
The inversion results in the three days prior to the occurrence of rockburst are shown in Figure 16. Compared with the previous day, a low-velocity region about 50 m ahead of the working face was transformed into a high-velocity region, and the stress concentration region was expanded. The maximum velocity and velocity anomaly increased to 6 km/s and 0.5, respectively. Furthermore, the high-velocity region on the rock pillar further extended to the B3 + 6 coal seam and more concentrated. This indicated that large-scale rupturing might have occurred in the steeply-inclined rock pillar between two coal seams, causing high-stress concentrations and dynamic loading near the face with the constant increase of the mined-out area. Rockburst is more easily induced once the steeply inclined rock pillar was broken or the dynamic load disturbance generated by the strong mining propagated to this region. The spatial evolution law of velocity and velocity anomaly revealed that the rock pillar was the location having the most rockburst hazard. Therefore, during the mining of SIETCS, the rockburst prevention measures should be done well for the rock pillar near the working face.
The above-mentioned research results showed that the areas of high EDIM, velocity, and velocity anomaly were closely related to the damaged areas where actual rockburst occurred. Therefore, the EDIM spatial evolution law and inversion results of velocity and velocity anomaly can be used to early warn both the stress concentration areas and the rockburst risk areas and to provide guidance for targeted pressure relief measures.

4. Effectiveness and Field Application

4.1. Effectiveness Test Method

Currently, the R-score method is the main method to test the effectiveness of rockburst warning and earthquake prediction [52]. It not only evaluates the prediction rate of early warning methods but also deducts the influence of false predictions and missed predictions. Therefore, the R-score method was used in this study to evaluate the early-warning effectiveness of the “critical value + trend” early warning method.
The early warning times of rockburst/high energy tremor and actual occurrence times of rockburst/high energy tremor can be summarized as a 2 × 2 contingency table (Table 3). n 1 1 , n 1 0 , n 0 1 , n 0 0 , N 1 and N 0 are, respectively, the accurate prediction numbers of high energy tremor and rockburst, the number of missed predictions, the number of false predictions, the accurate predictions number of MS events that are neither rockburst nor high energy tremor, the number of high energy tremor and rockburst, and the number of MS events that are neither rockburst nor high energy tremor. Let us assume that a = n 1 0 / N 1 is the missed prediction rate, b = n 0 1 / N 0 is the false prediction rate, c = n 1 1 / N 1 is the accurate prediction rate of rockburst and high energy tremor, and d = n 0 0 / N 0 is the accurate prediction rate of non-rockburst and non-high energy tremor. Obviously, a + c = 1 and b + d = 1.
The R-score is defined as:
R = 1 a b = a + c a b = c b
Alternatively, R can be calculated as follows:
R = n 1 1 / N 1 n 0 1 / N 0
R = 1 means that all warnings are accurate, R = 0 means that the warning has no effect, and when a warning is completely wrong, R is negative. The larger the R-value, the better is the warning performance.
In the case of rockburst early warning effectiveness test, if it was determined that there was risk of rockburst or high energy tremor, a rockburst risk warning would be issued, and the warning would be extended for six days (determined based on the comprehensive consideration of the rate of accurate alarm, omission, and false alerts, and can be adjusted according to field-specific conditions) from the date of the release of the rockburst risk warning. If a high energy tremor or rockburst occurred during the period, the early warning was successful, otherwise, the early warning failed.

4.2. Early Warning Capability of “Critical Value + Trend” Early Warning Method

The MS temporal precursor characteristic parameters were obtained from the analysis of historical monitoring data from 24 October 2016 to 1 May 2017. It was necessary to integrate the above characteristic parameters to study whether the precursor characteristic parameters obtained by the above analysis could complement each other and improve the accuracy of early warning. The green, orange, and red ellipses in Figure 17 represent the warning status as level 2, 3, and 4, respectively.
As shown in Figure 17, eight rockbursts and high energy tremors occurred during the precursor analysis stage. Affected by the discontinuity of acquisition and other factors, only event (4) was not predicted by the “critical value + trend” early warning method (the energy of the event (4) is 1.5 × 10⁶ J). The remaining seven events were accurately predicted. Before event (1) occurred, the MS event with energy less than 1 × 10⁵ J occurred. Based on MS energy value E, a critical value early warning was used to determine the initial rockburst risk level, that is 1. Based on the sharp-rise-sharp-drop variation in total daily energy and event count, accompanied by decreasing total daily energy to values lower than previously recorded, the initial hazard level was corrected by the trend warning method, and the final rockburst hazard level was determined to be 3. Similarly, Figure 17 shows the contribution of each precursory characteristic parameter to the final warning results of other events.
The above analysis showed that the “critical value + trend” early warning method had a good warning capability for rockburst and high energy tremor. Furthermore, the trend of early warning could play a very good supplementary role to determine the critical value for early warning, to raise the level of early warning, and to cause the attention of the staff in taking timely measures.

4.3. Comparative Study on the Early Warning Effectiveness of “Critical Value” and “Critical Value + Trend” Early Warning Method

The “critical value + trend” and “critical value” warning methods were applied to warn the rockburst of the +450 horizontal No. B3 + 6 working face. The two methods used the MS monitoring data at the same time period, during which eight rockbursts and high energy tremors occurred. As shown in Table 4 and Table 5, the “critical value + trend” early warning method accurately predicted seven times, while the “critical value” early warning method accurately predicted only two times.
The early warning effectiveness test of the two early warning methods was performed by the R-score method described in Section 4.1. The early warning capability of the “critical value + trend” early warning method was R = 0.83, and the early warning capability was strong. The early warning capability of the “critical value” warning method was R = 0.23, and the early warning efficiency was poor. Compared to the “critical value” early warning method applied in SIETCS of the WCM, the “critical value + trend” temporal early warning method studied in this paper was more effective for the rockbursts and high energy tremors early warning. This improved prediction capability of the critical value + trend method has great significance to take timely and effective pressure relief measures against rockburst disaster in coal mines.

4.4. Field Application of Temporal-Spatial Comprehensive Early Warning Method

After 11 July 2017, the spatio-temporal comprehensive early warning method was applied to subsequent production of the +450 horizontal No. B3 + 6 working face. Since the application of the spatio-temporal comprehensive early warning method in the follow-up production to 3 March 2018, a total of 14 warnings were issued. As shown in Figure 18, the maximum energy E was 4.4 × 10⁴ J on 16 July 2017, and the energy deviation DE was 33.93. According to the “critical value + trend” early warning method, it is concluded that the rockburst risk level in the next few days was 3. After the “critical value + trend” early warning method determined the rockburst risk level, the spatial early warning method was applied to determine the stress concentration areas and the rockburst risk areas. Figure 19 shows the spatial evolution law of EDIM from 11 July 2017 to 16 July 2017, when the corresponding working face locations ranged from 1464 to 1440 m. The high EDIM was mainly distributed in four areas, namely, the roof near 1230 and 1430 m of + 450 horizontal No. B3 + 6 working face, and the rock pillars near 1270, 1370, and 1400 m, which were located within 200 m of the working surface. The maximum value of EDIM is more than 4.4 logJ/m2; according to the findings of each rockburst in Section 3.3.1, these four areas have a high-stress concentration, were likely to suffer from high energy MS events and damage in the future. The rockburst risk is high; pressure relief measures should be implemented in these areas.
Stress-relief blasting was conceived as a type of rock weakening method that could reduce the stiffness and increase the deformation of the surrounding rocks to adjust the energy distribution state and to reduce stress concentration [53]. According to the spatial warning results, pressure relief measures of alternating shallow and deep boreholes were taken at corresponding areas. The parameters and layout of the blastholes are shown in Figure 20. The timely implementation of the measures ultimately control the occurrence of rockburst and high energy tremor and ensure the safety of personnel and equipment.
The application of the spatio-temporal comprehensive early warning method significantly improved the accuracy of early warning of rockburst in a SIETCS, and greatly reduced the probability of rockburst hazard on the working face. In the mining period of up to 8 months, no rockburst occurred, only two high energy tremors occurred. The incidence of high energy tremors was 75% lower compared to a similar previous period. Due to the superposition of the early warning parameters such as the MS energy and event count change trend, energy, and event count deviation value to the “critical value” early warning, the level of early warning was markedly increased. Compared to the traditional “critical value” early warning method or spatial early warning method, this method not only integrated the advantages of “critical value” early warning and spatial early warning but also integrated the changing trend of MS monitoring parameters and some temporal-spatial quantization parameters.

5. Conclusions

This paper studied a typical steeply inclined and extremely thick coal seam in the Wudong coal mine that suffered from rockburst and high energy tremor threats. Temporal evolution law of MS multi-parameters and spatial evolution law of EDIM, velocity, and velocity anomaly were analyzed to construct a spatial-temporal comprehensive early warning method for the rockburst hazard of SIETCS. The main findings are listed below:
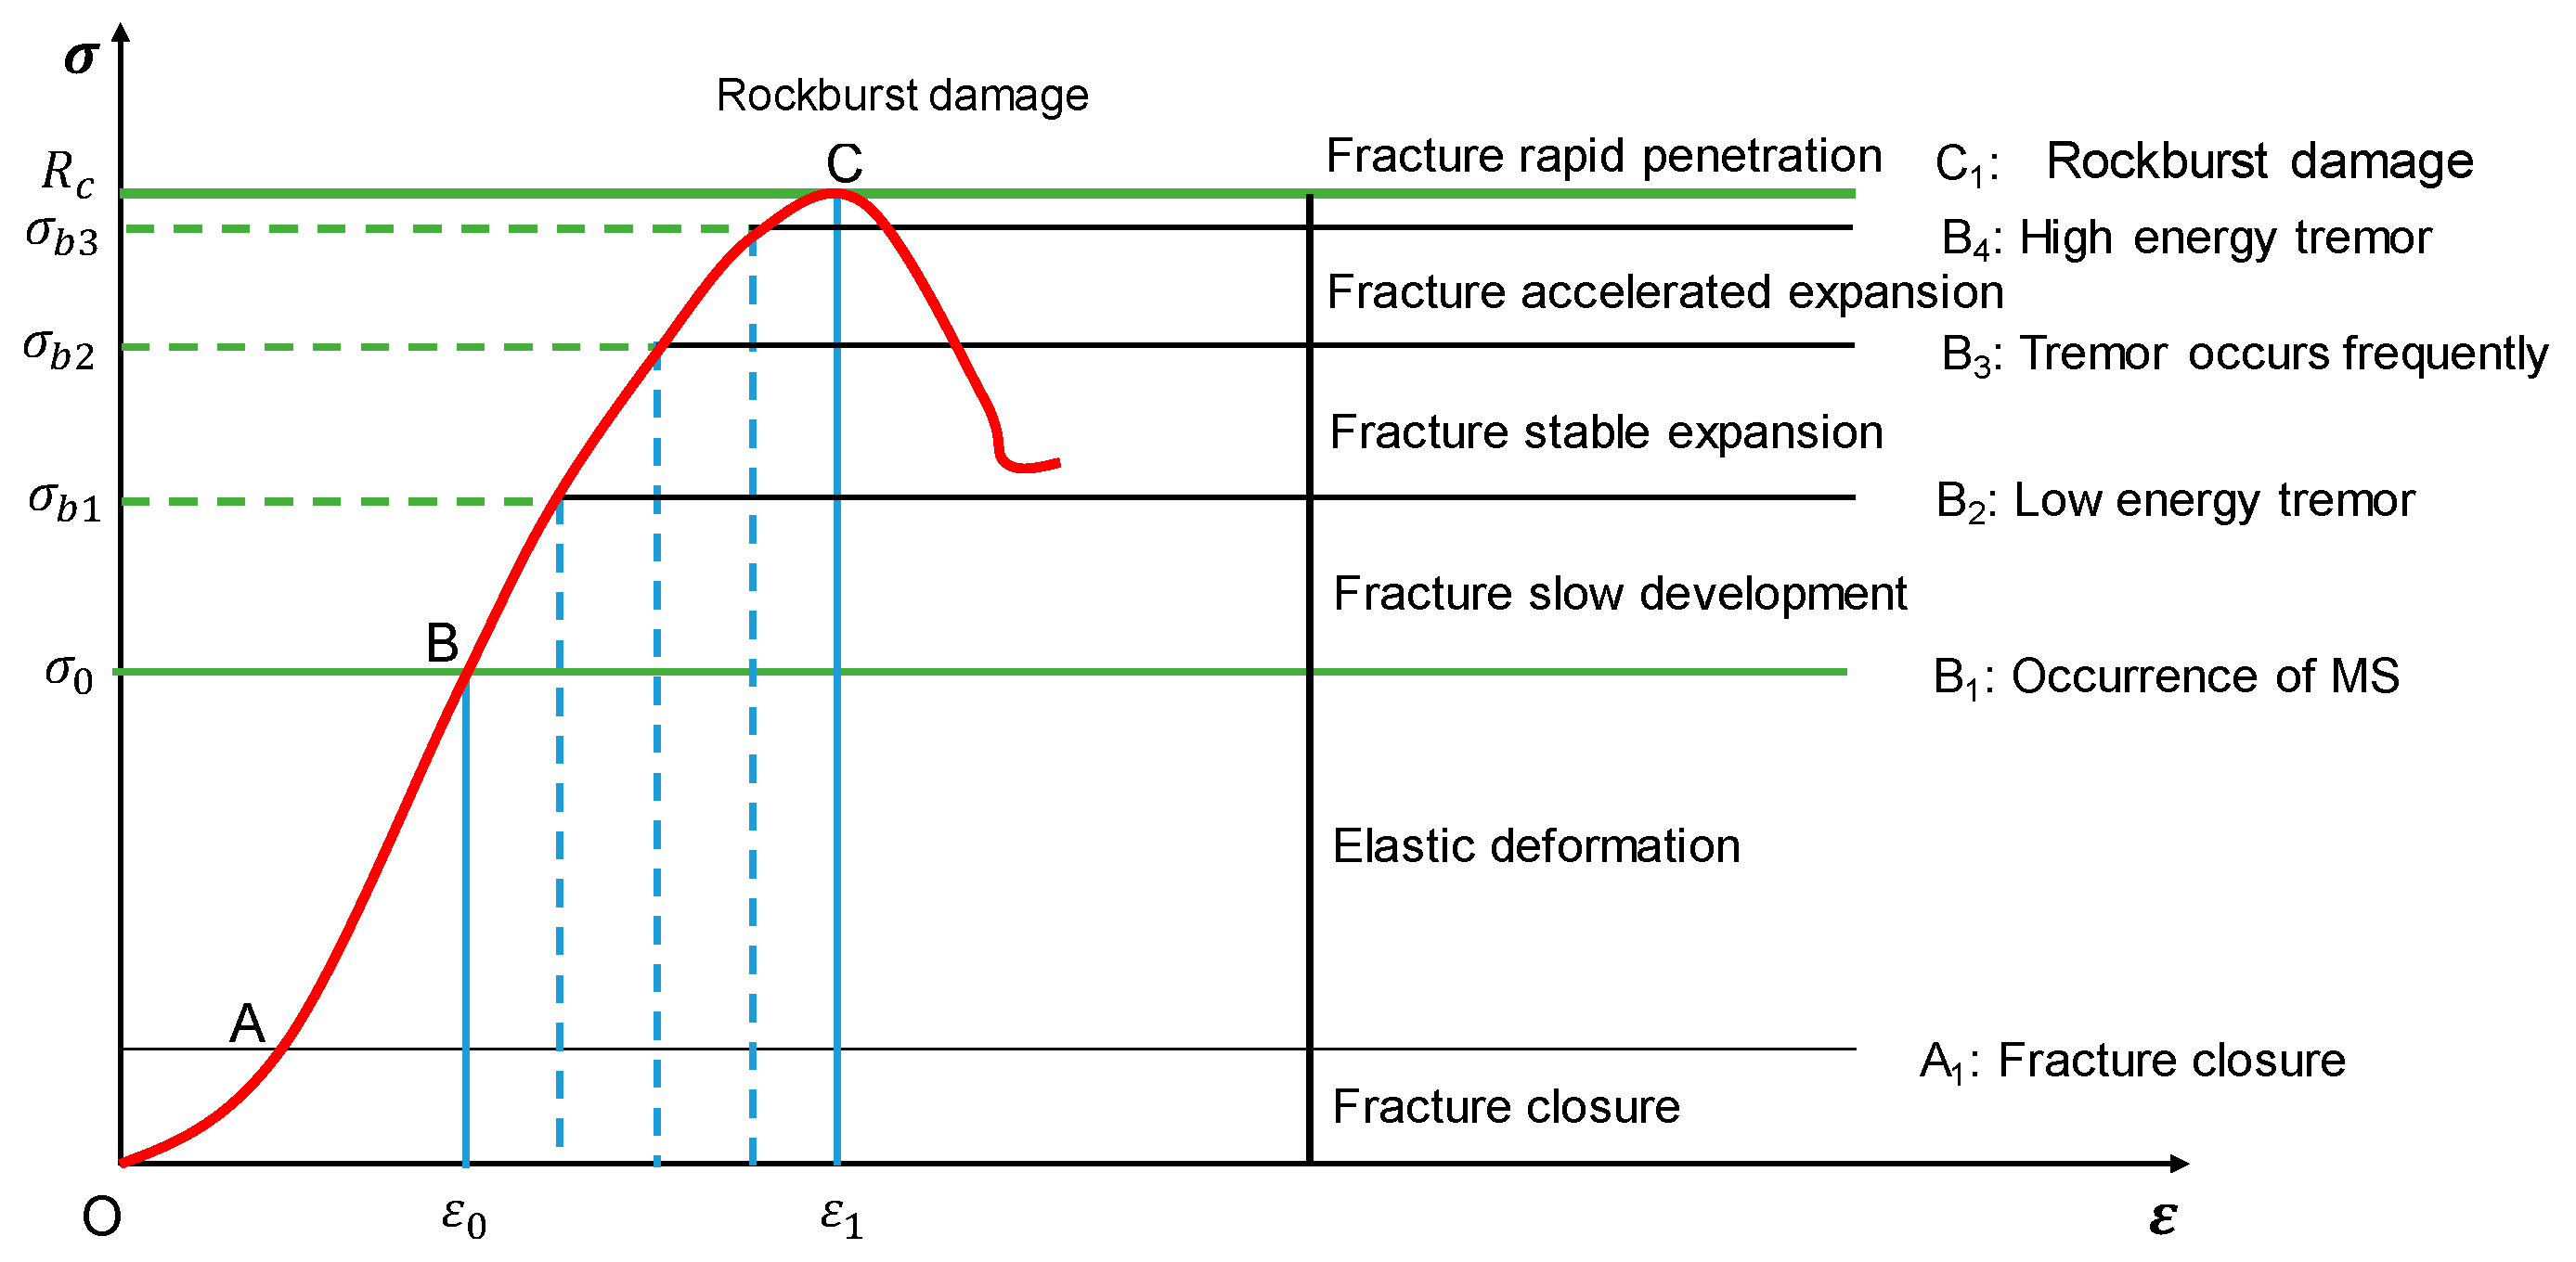
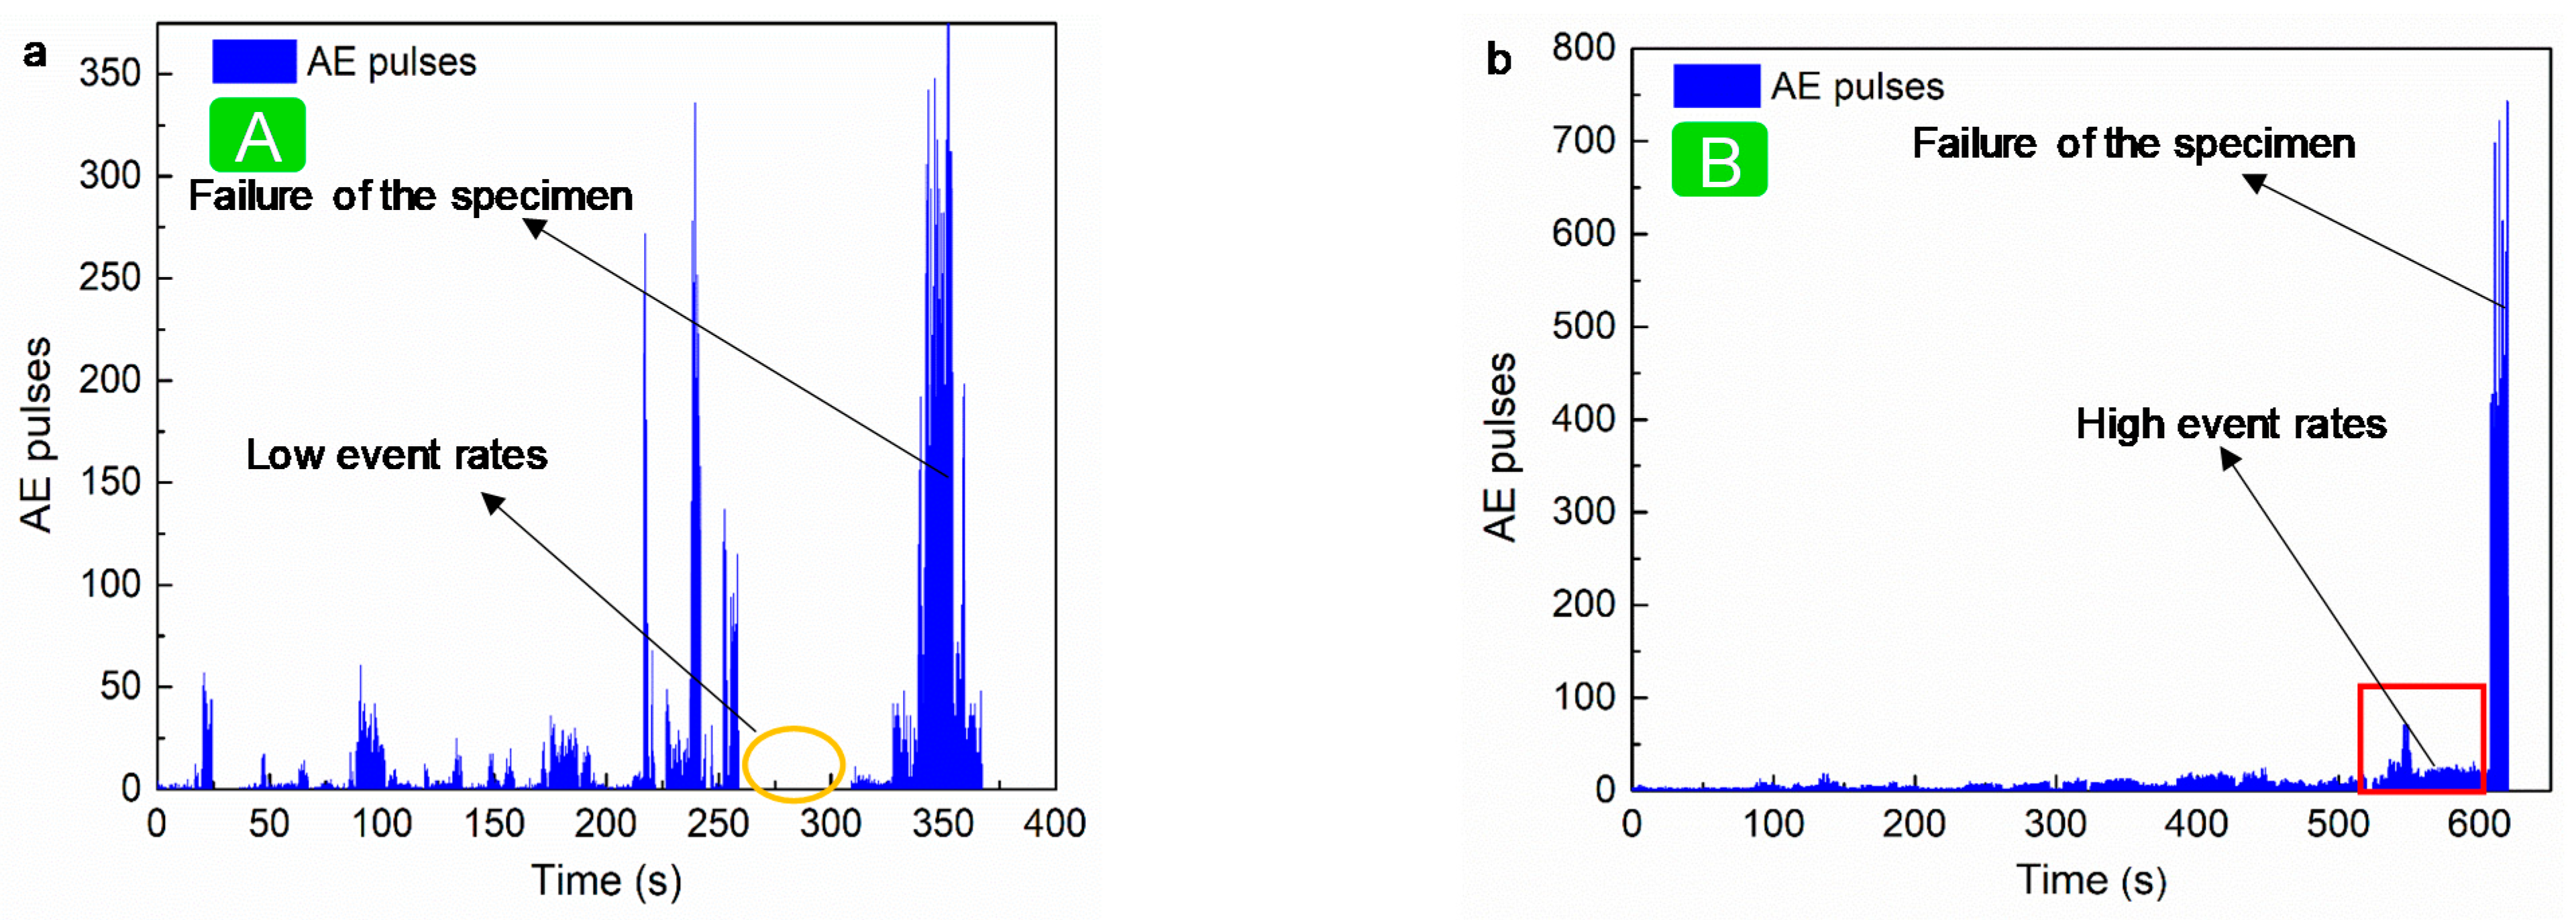
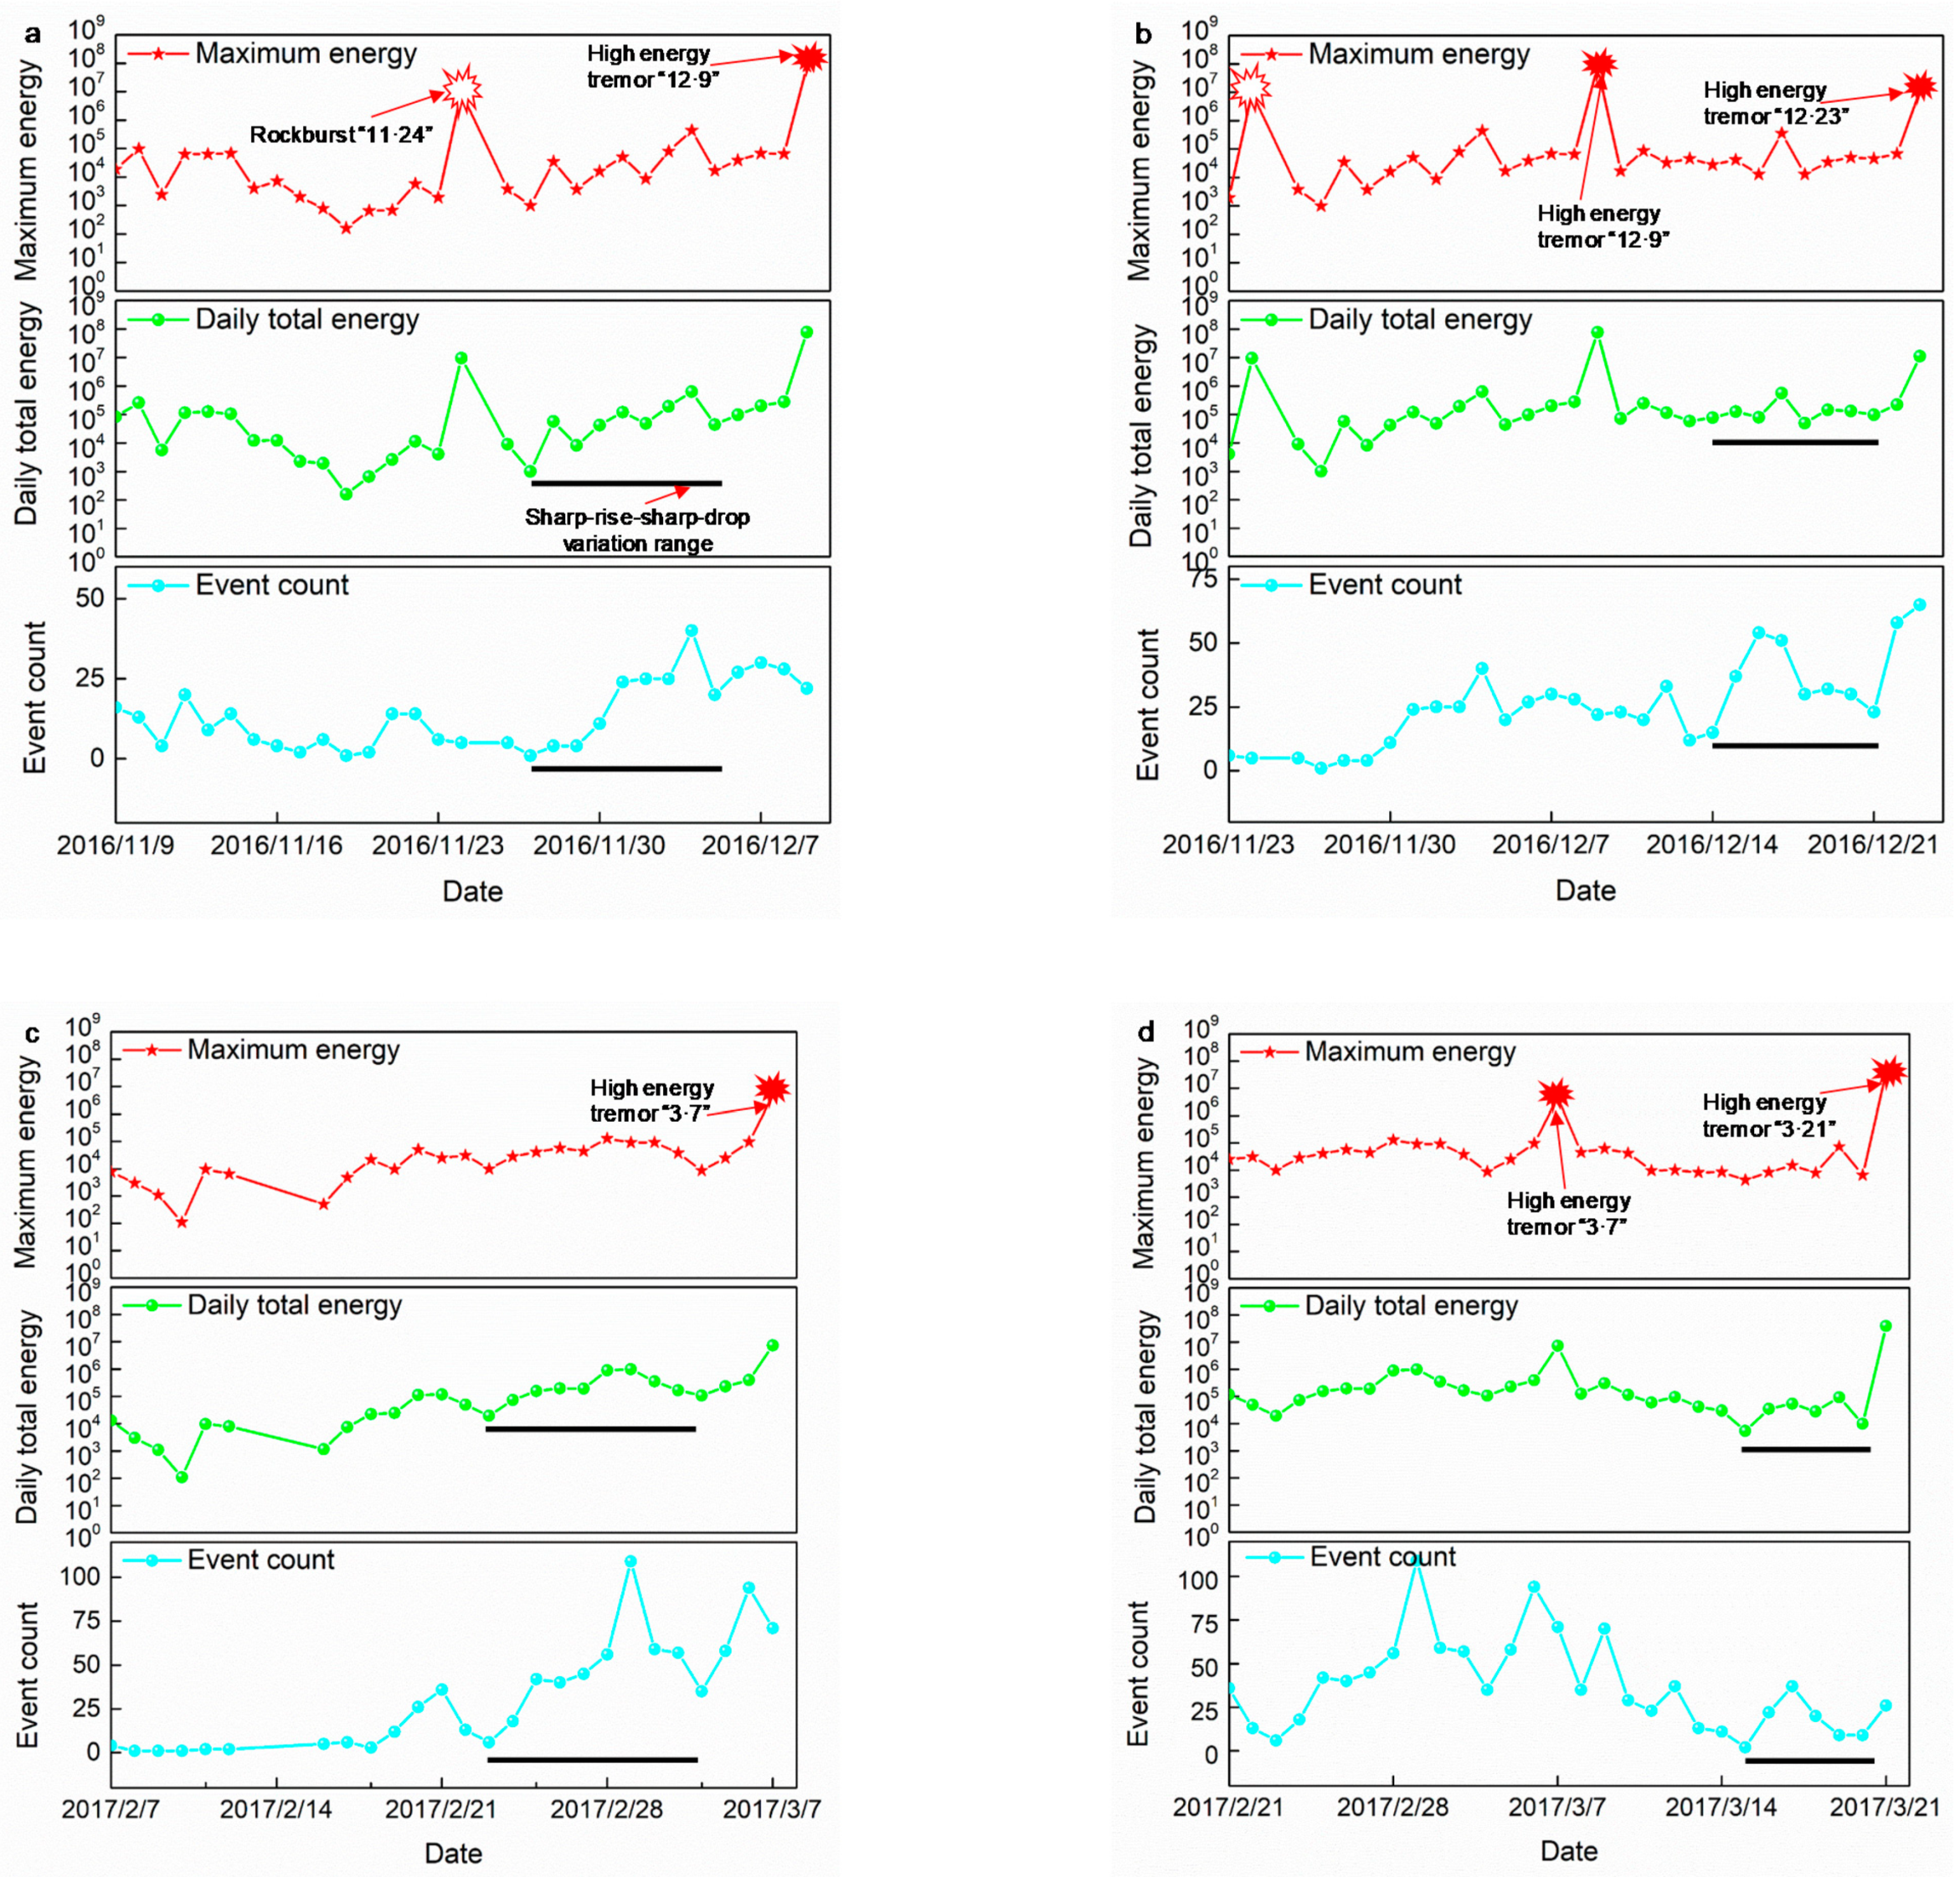
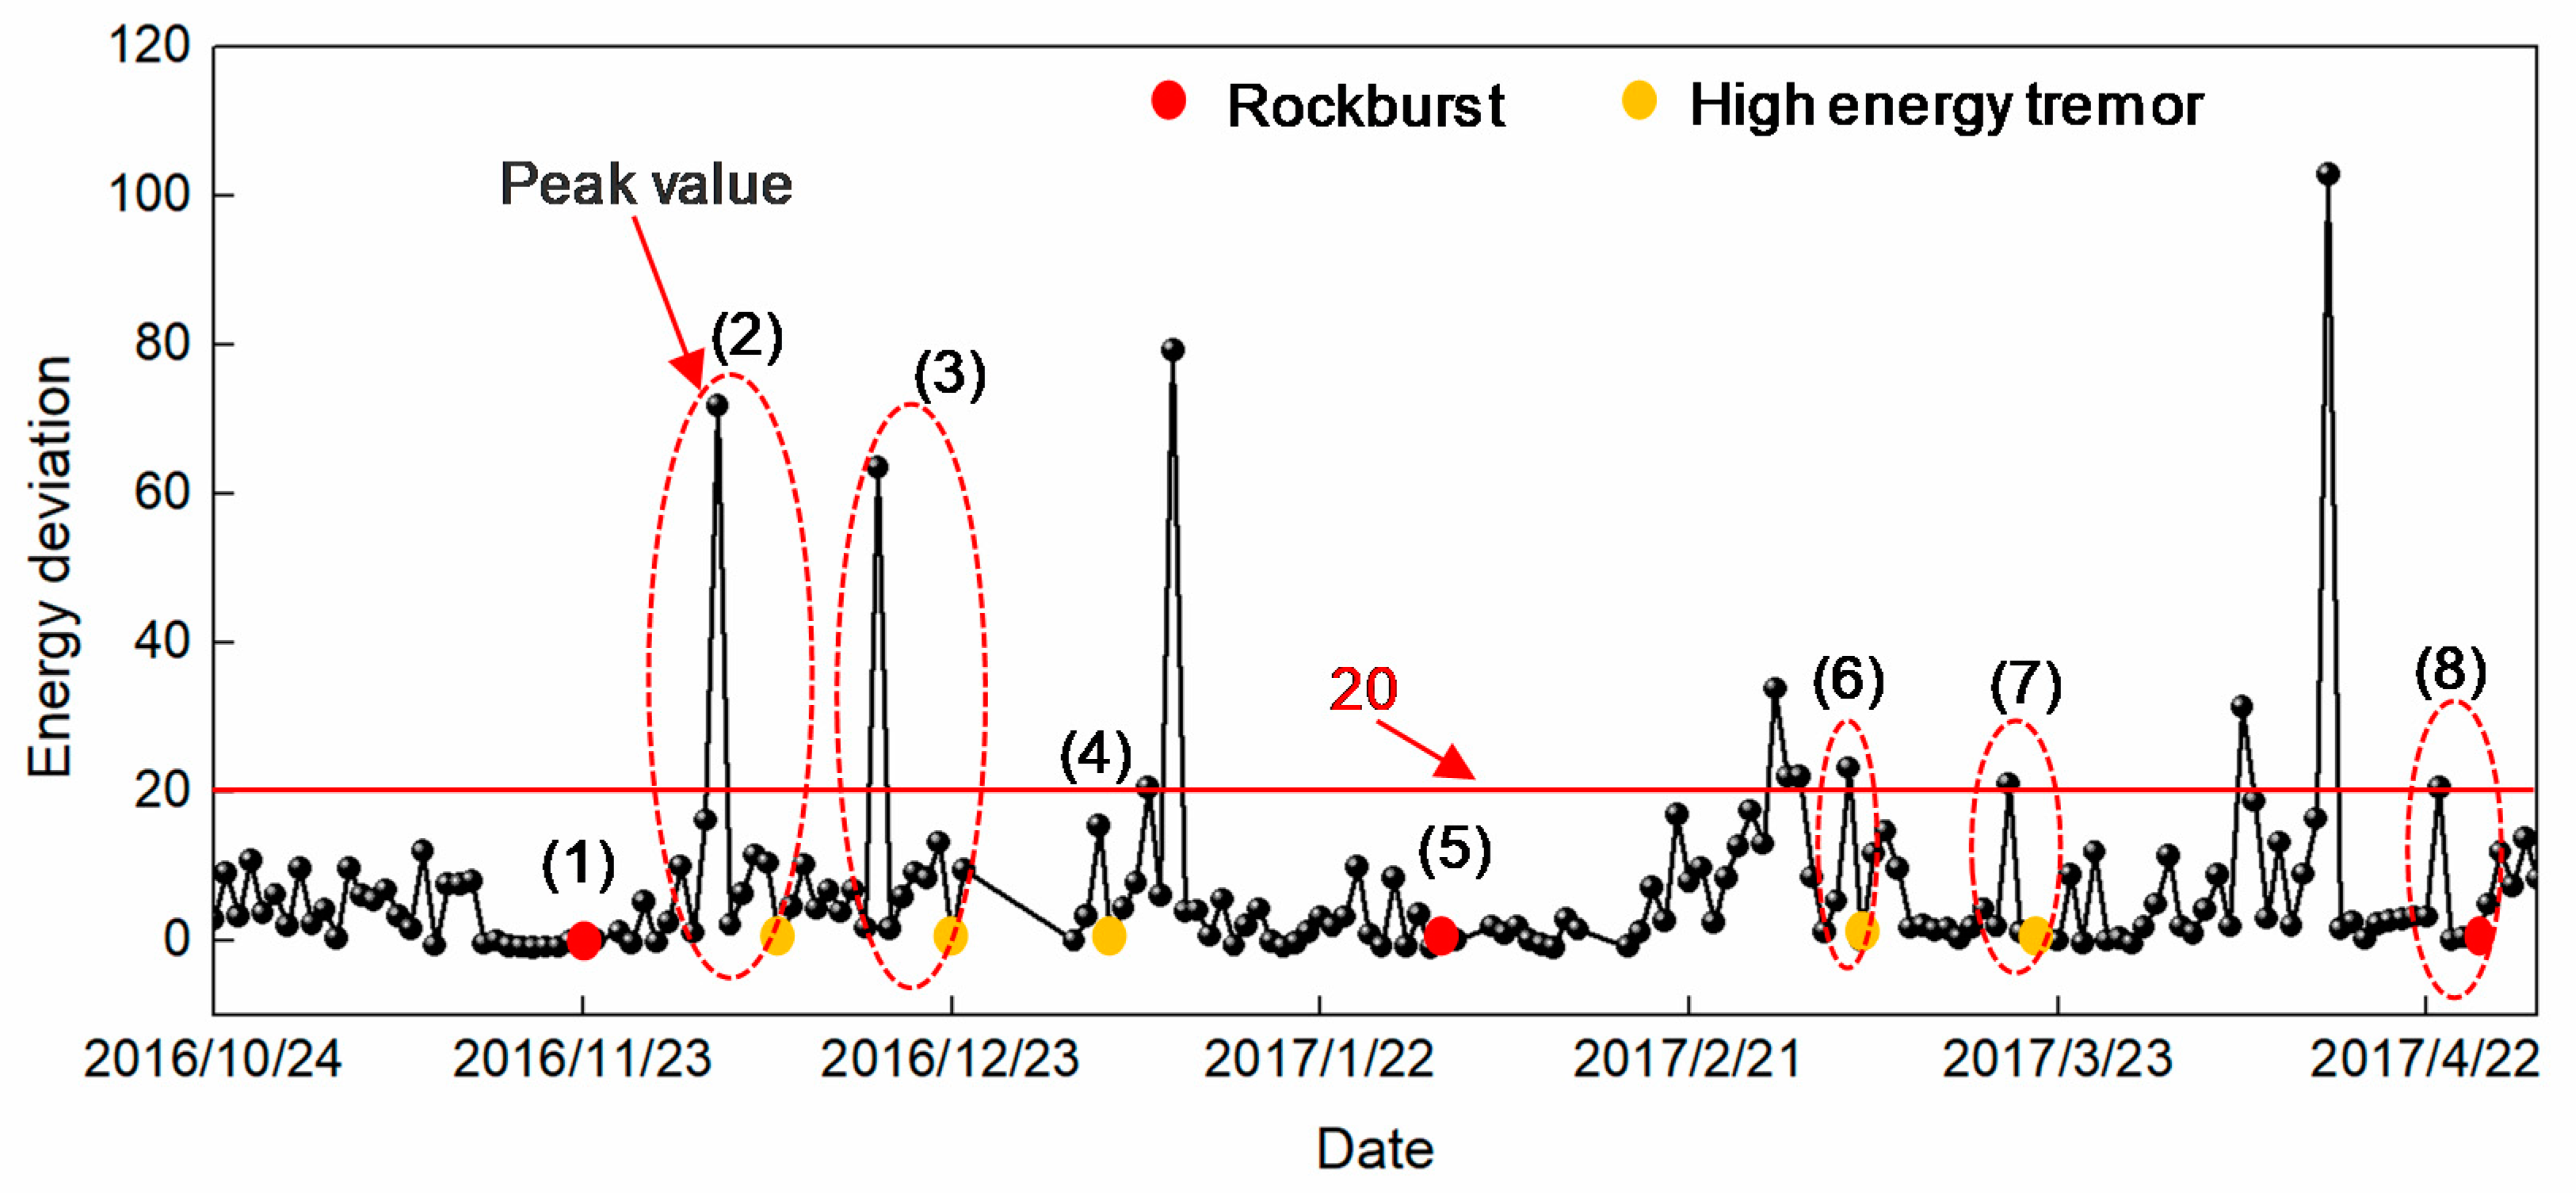
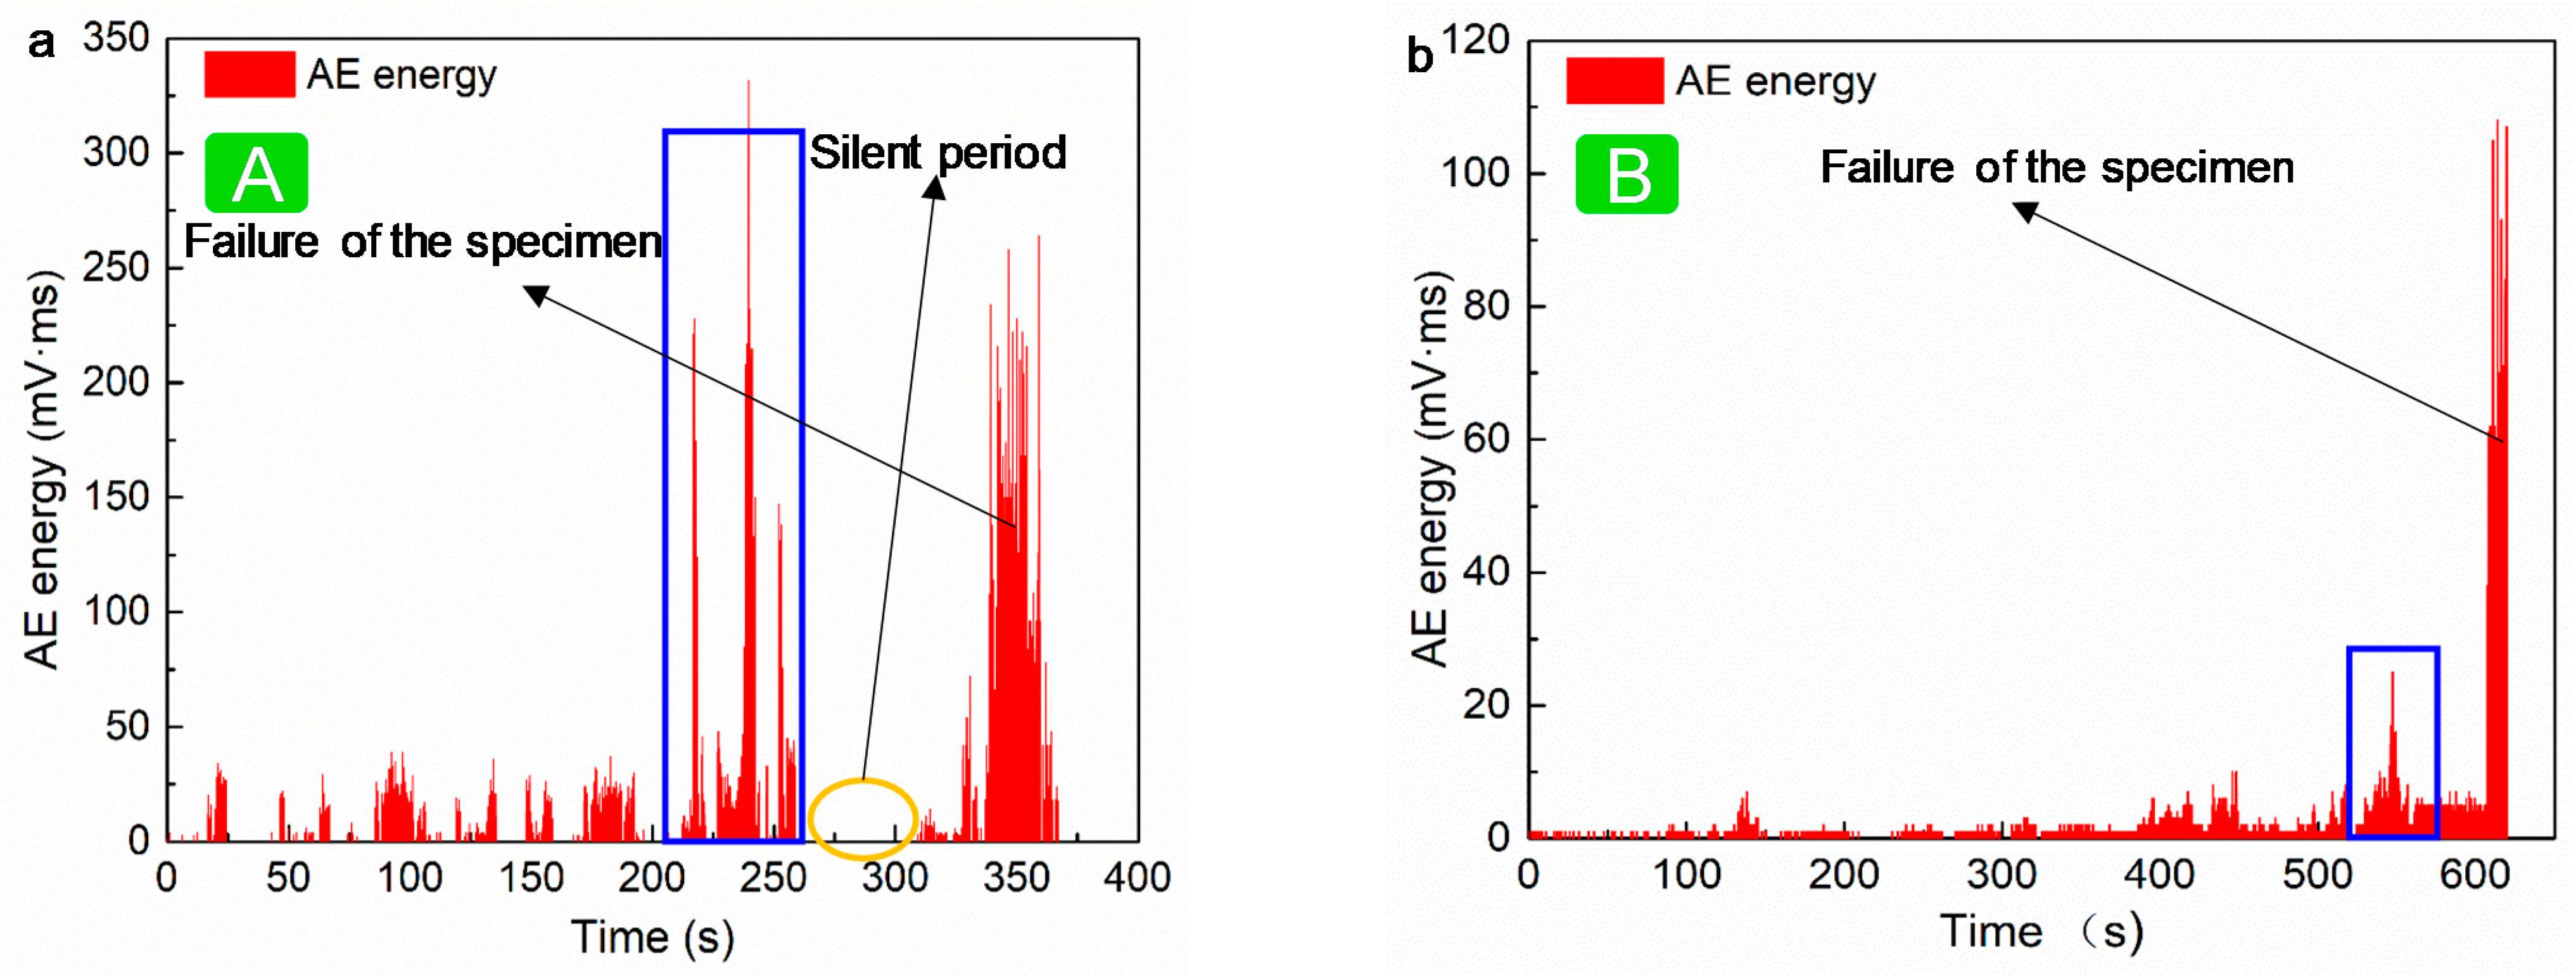
  • Three new spatial/temporal quantification parameters (energy deviation, event count deviation, and EDIM) were proposed. The temporal precursor characteristic parameters of rockburst and high energy tremor, including daily total energy Ed, event count P, energy deviation DE, event count deviation DP were used to comprehensively early warn rockburst risk in time series. The sharp-rise-sharp-drop variation in total daily energy and event count, DE ≥ 20, DP ≥ 1, could be regarded as a precursor to rockburst and high energy tremor occurrence. Laboratory AE experiment revealed that using the precursor characteristics obtained from this study could be feasibly used to warn of rockburst risk.
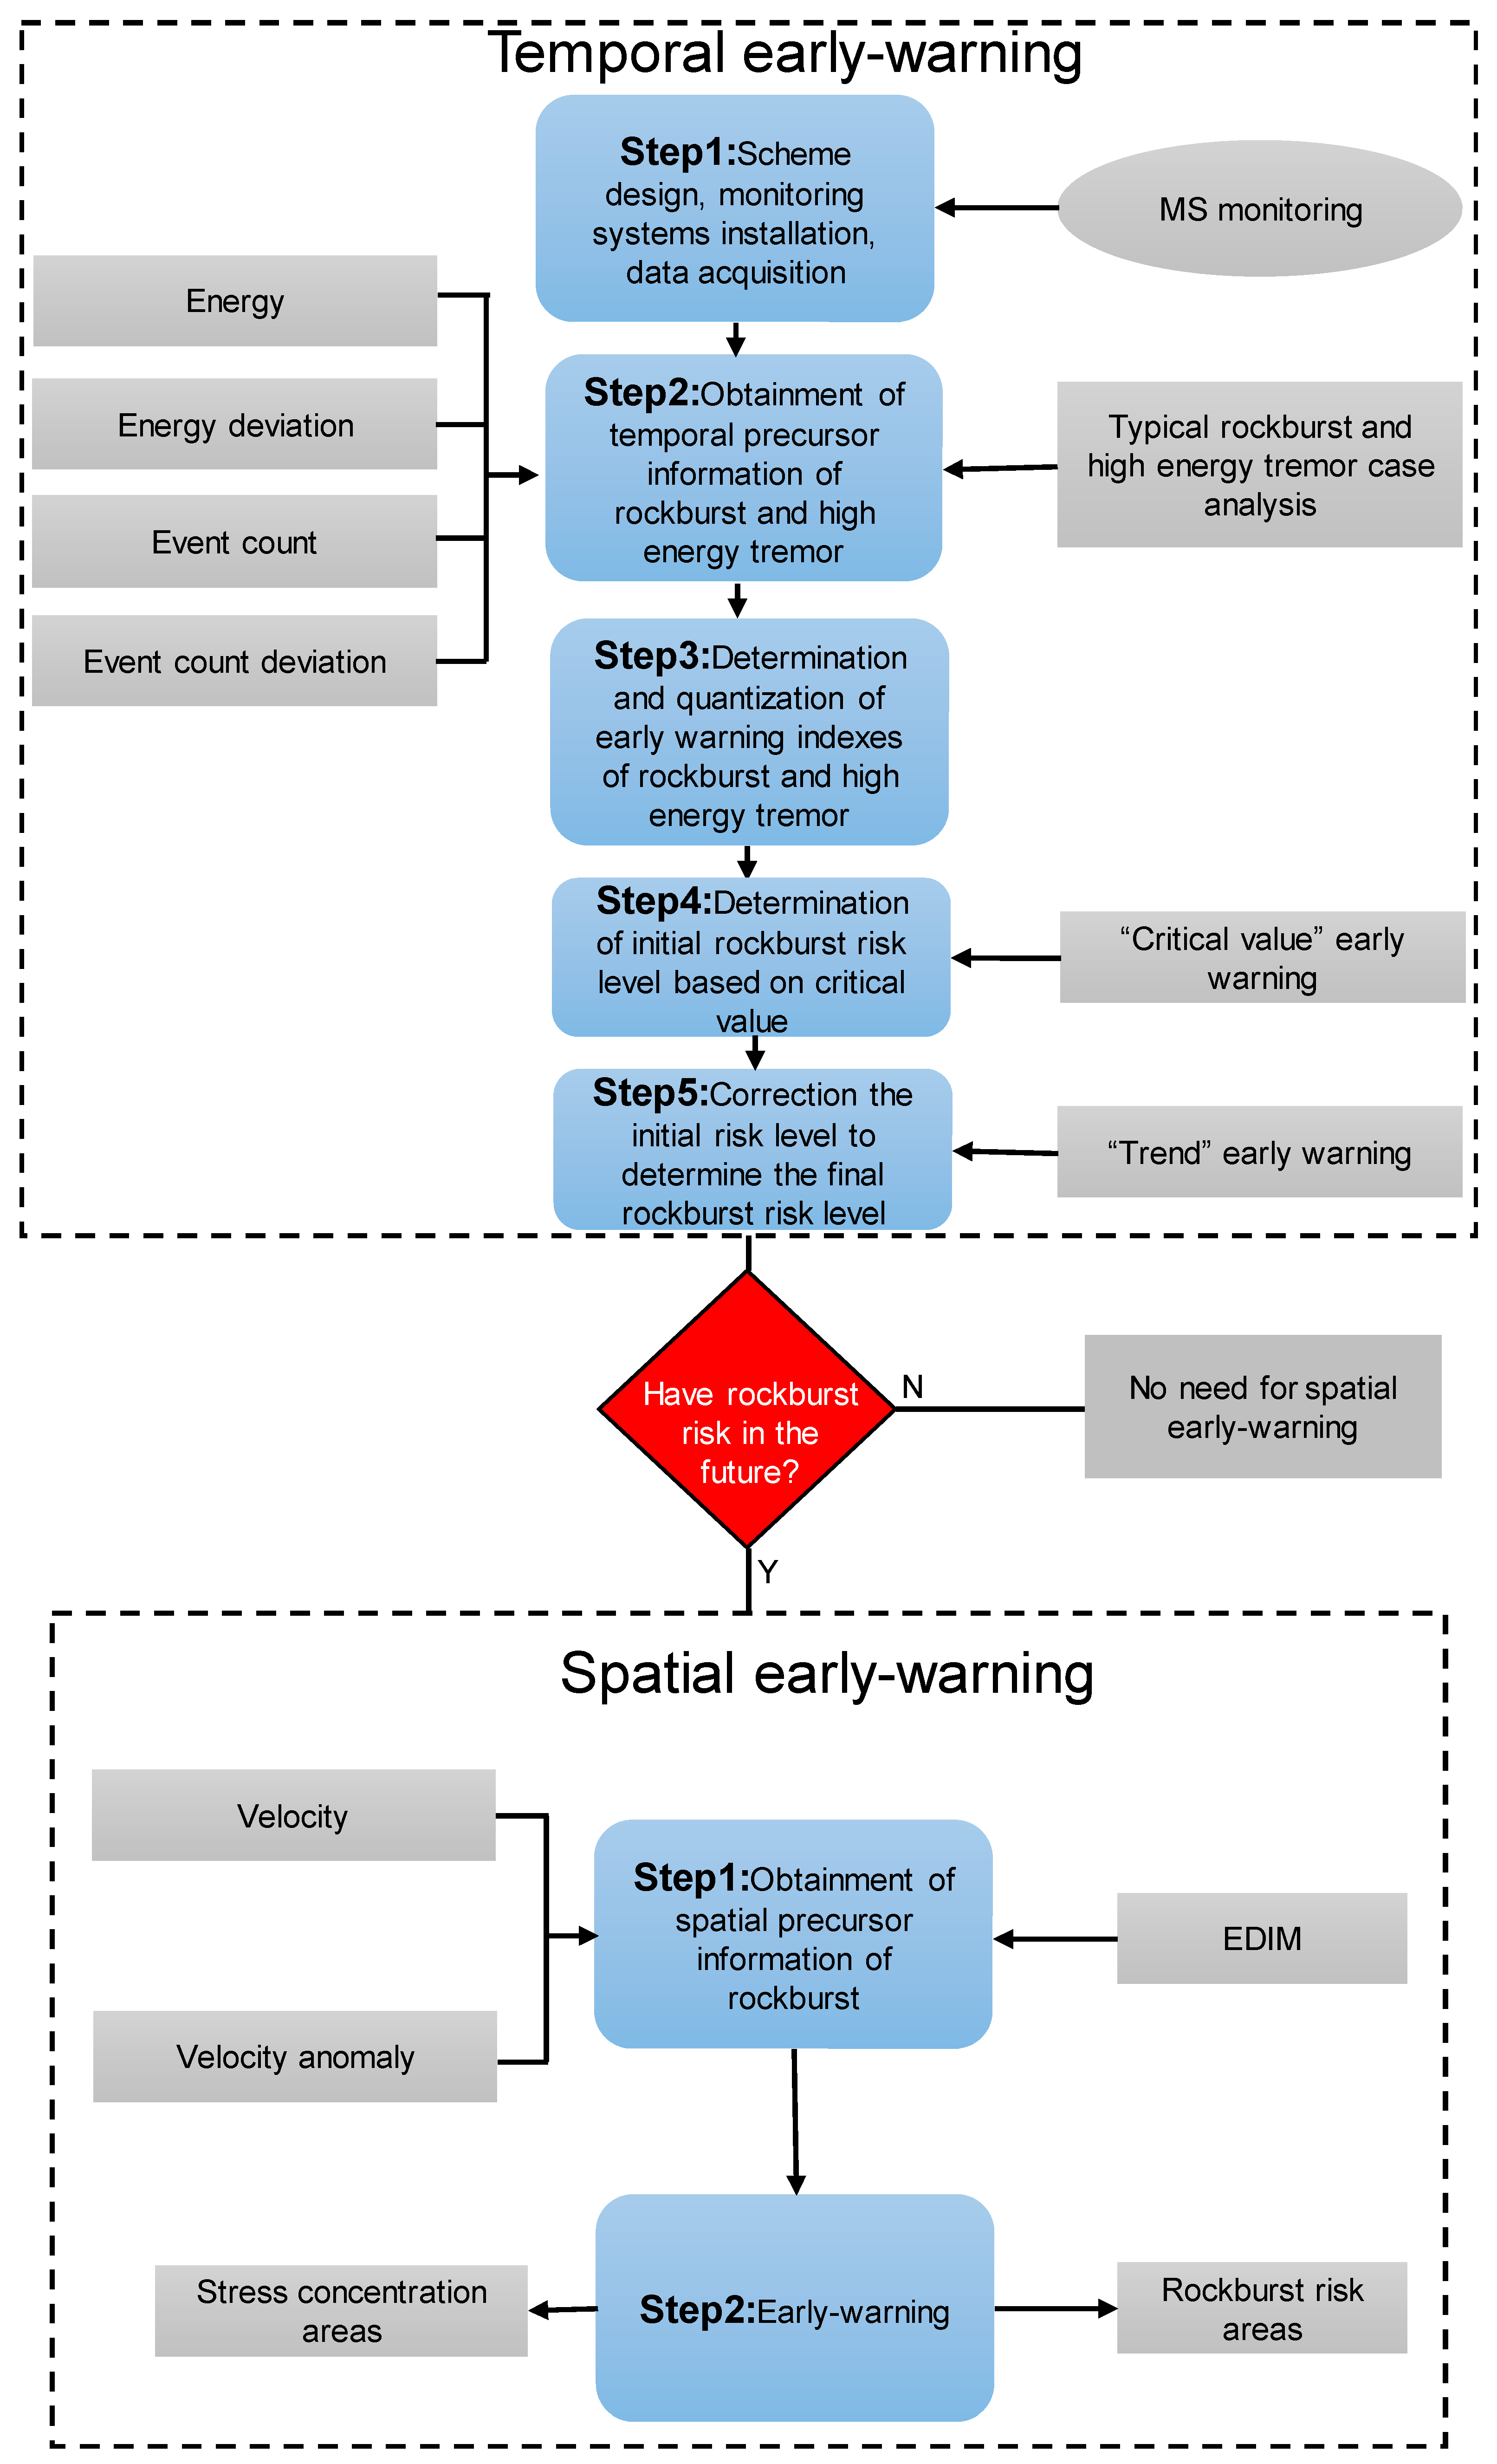
  • A “critical value + trend” early warning method of SIETCS was proposed by combining MS energy, trend, and quantitative precursor characteristics. Firstly, based on the MS energy value E, a critical value early warning was used to determine the initial rockburst risk level. Then, the trend and quantitative precursor characteristics were used to correct the initial risk level and to determine the final rockburst risk level. The trend and quantitative precursor characteristics could play a very good supplementary role to the critical value of early warning, thus enhancing early warning level and improving early warning accuracy.
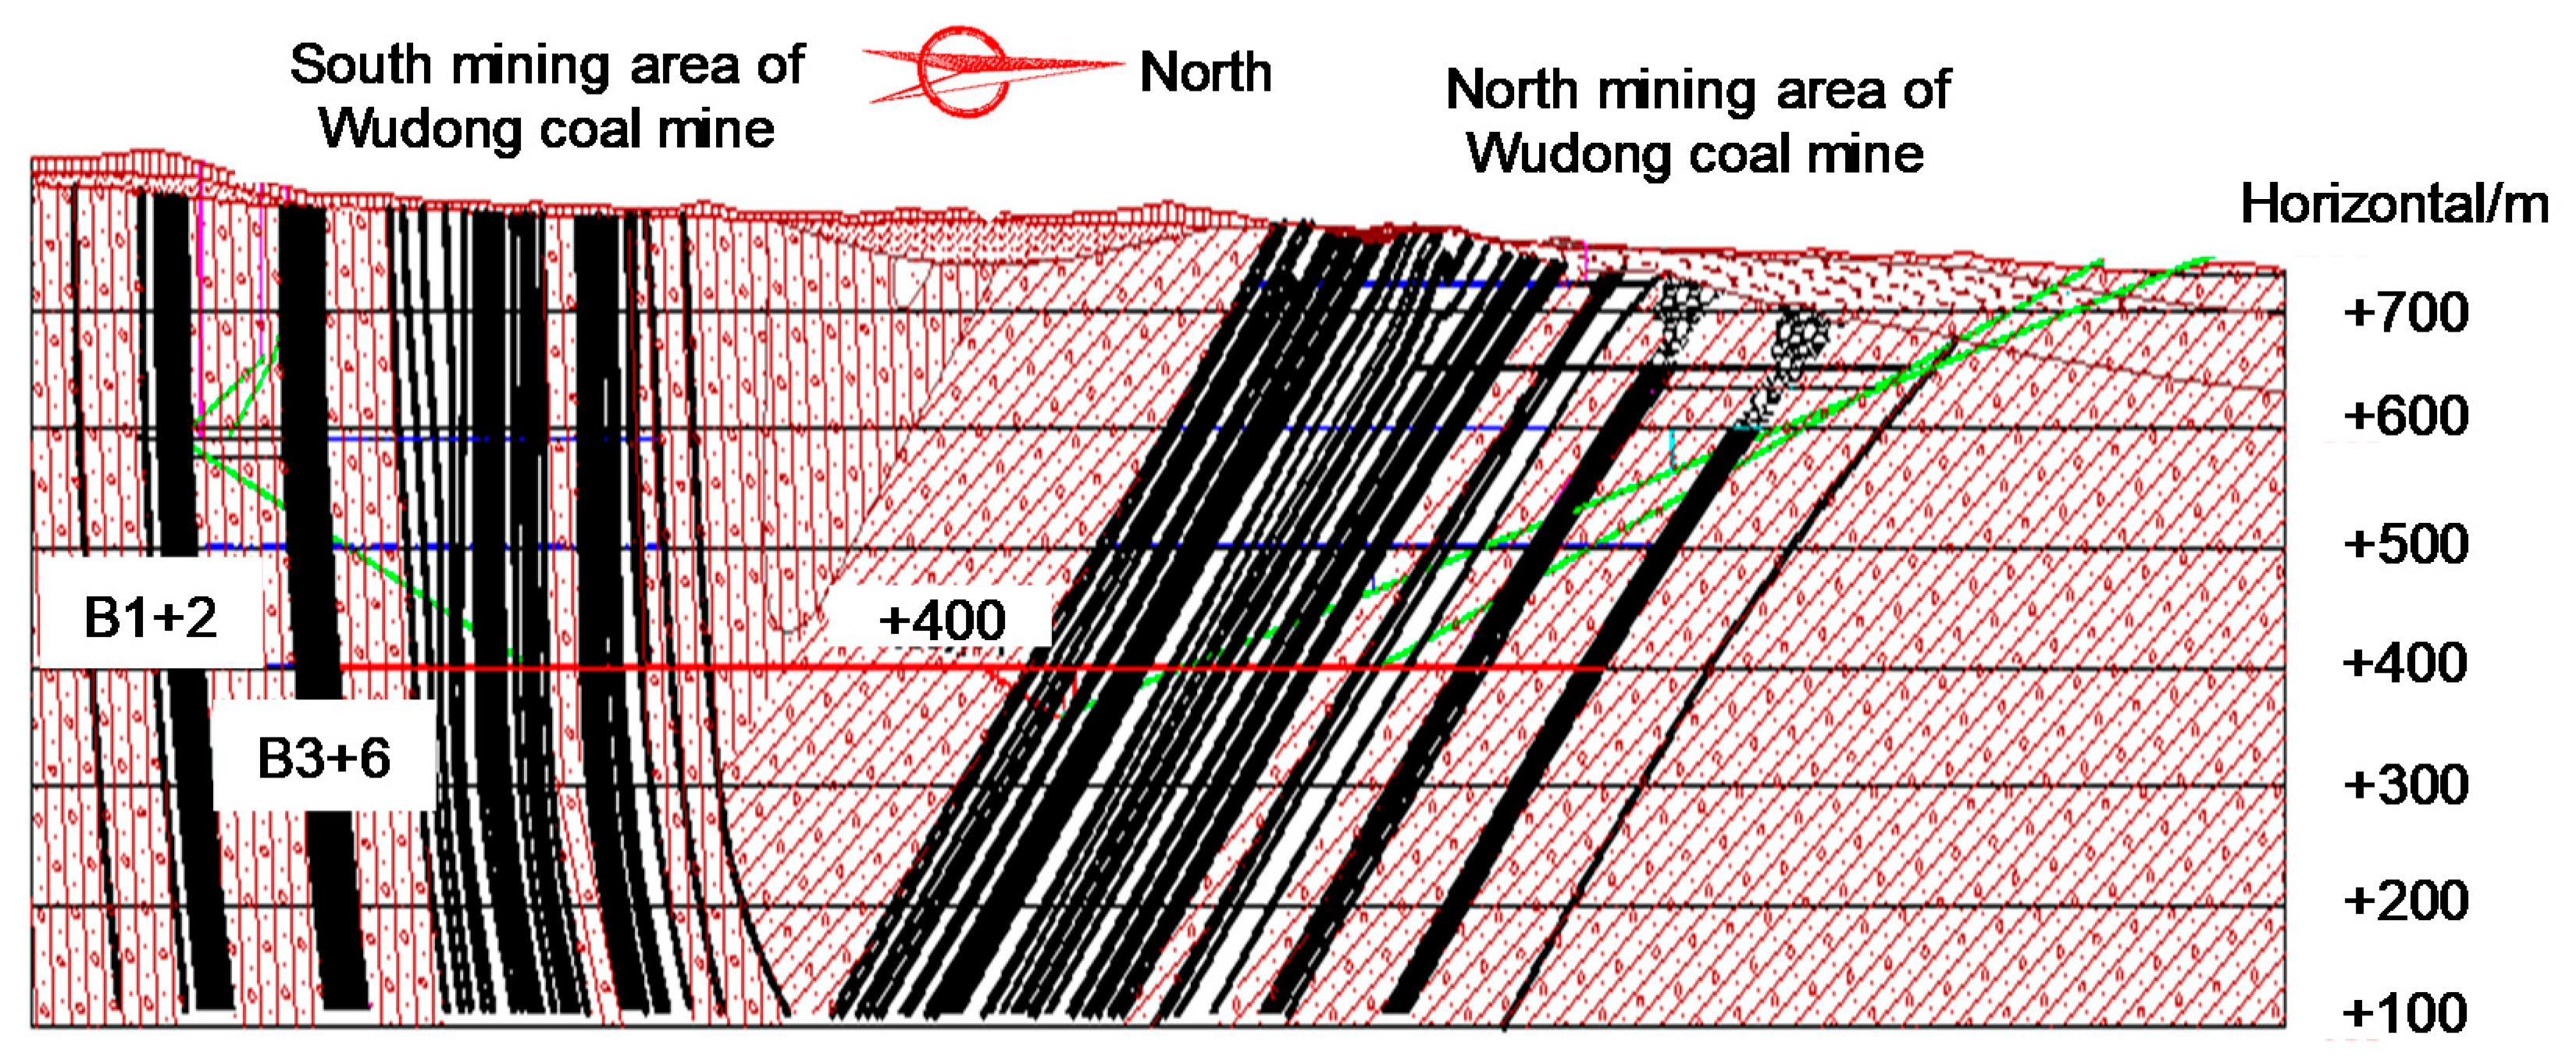
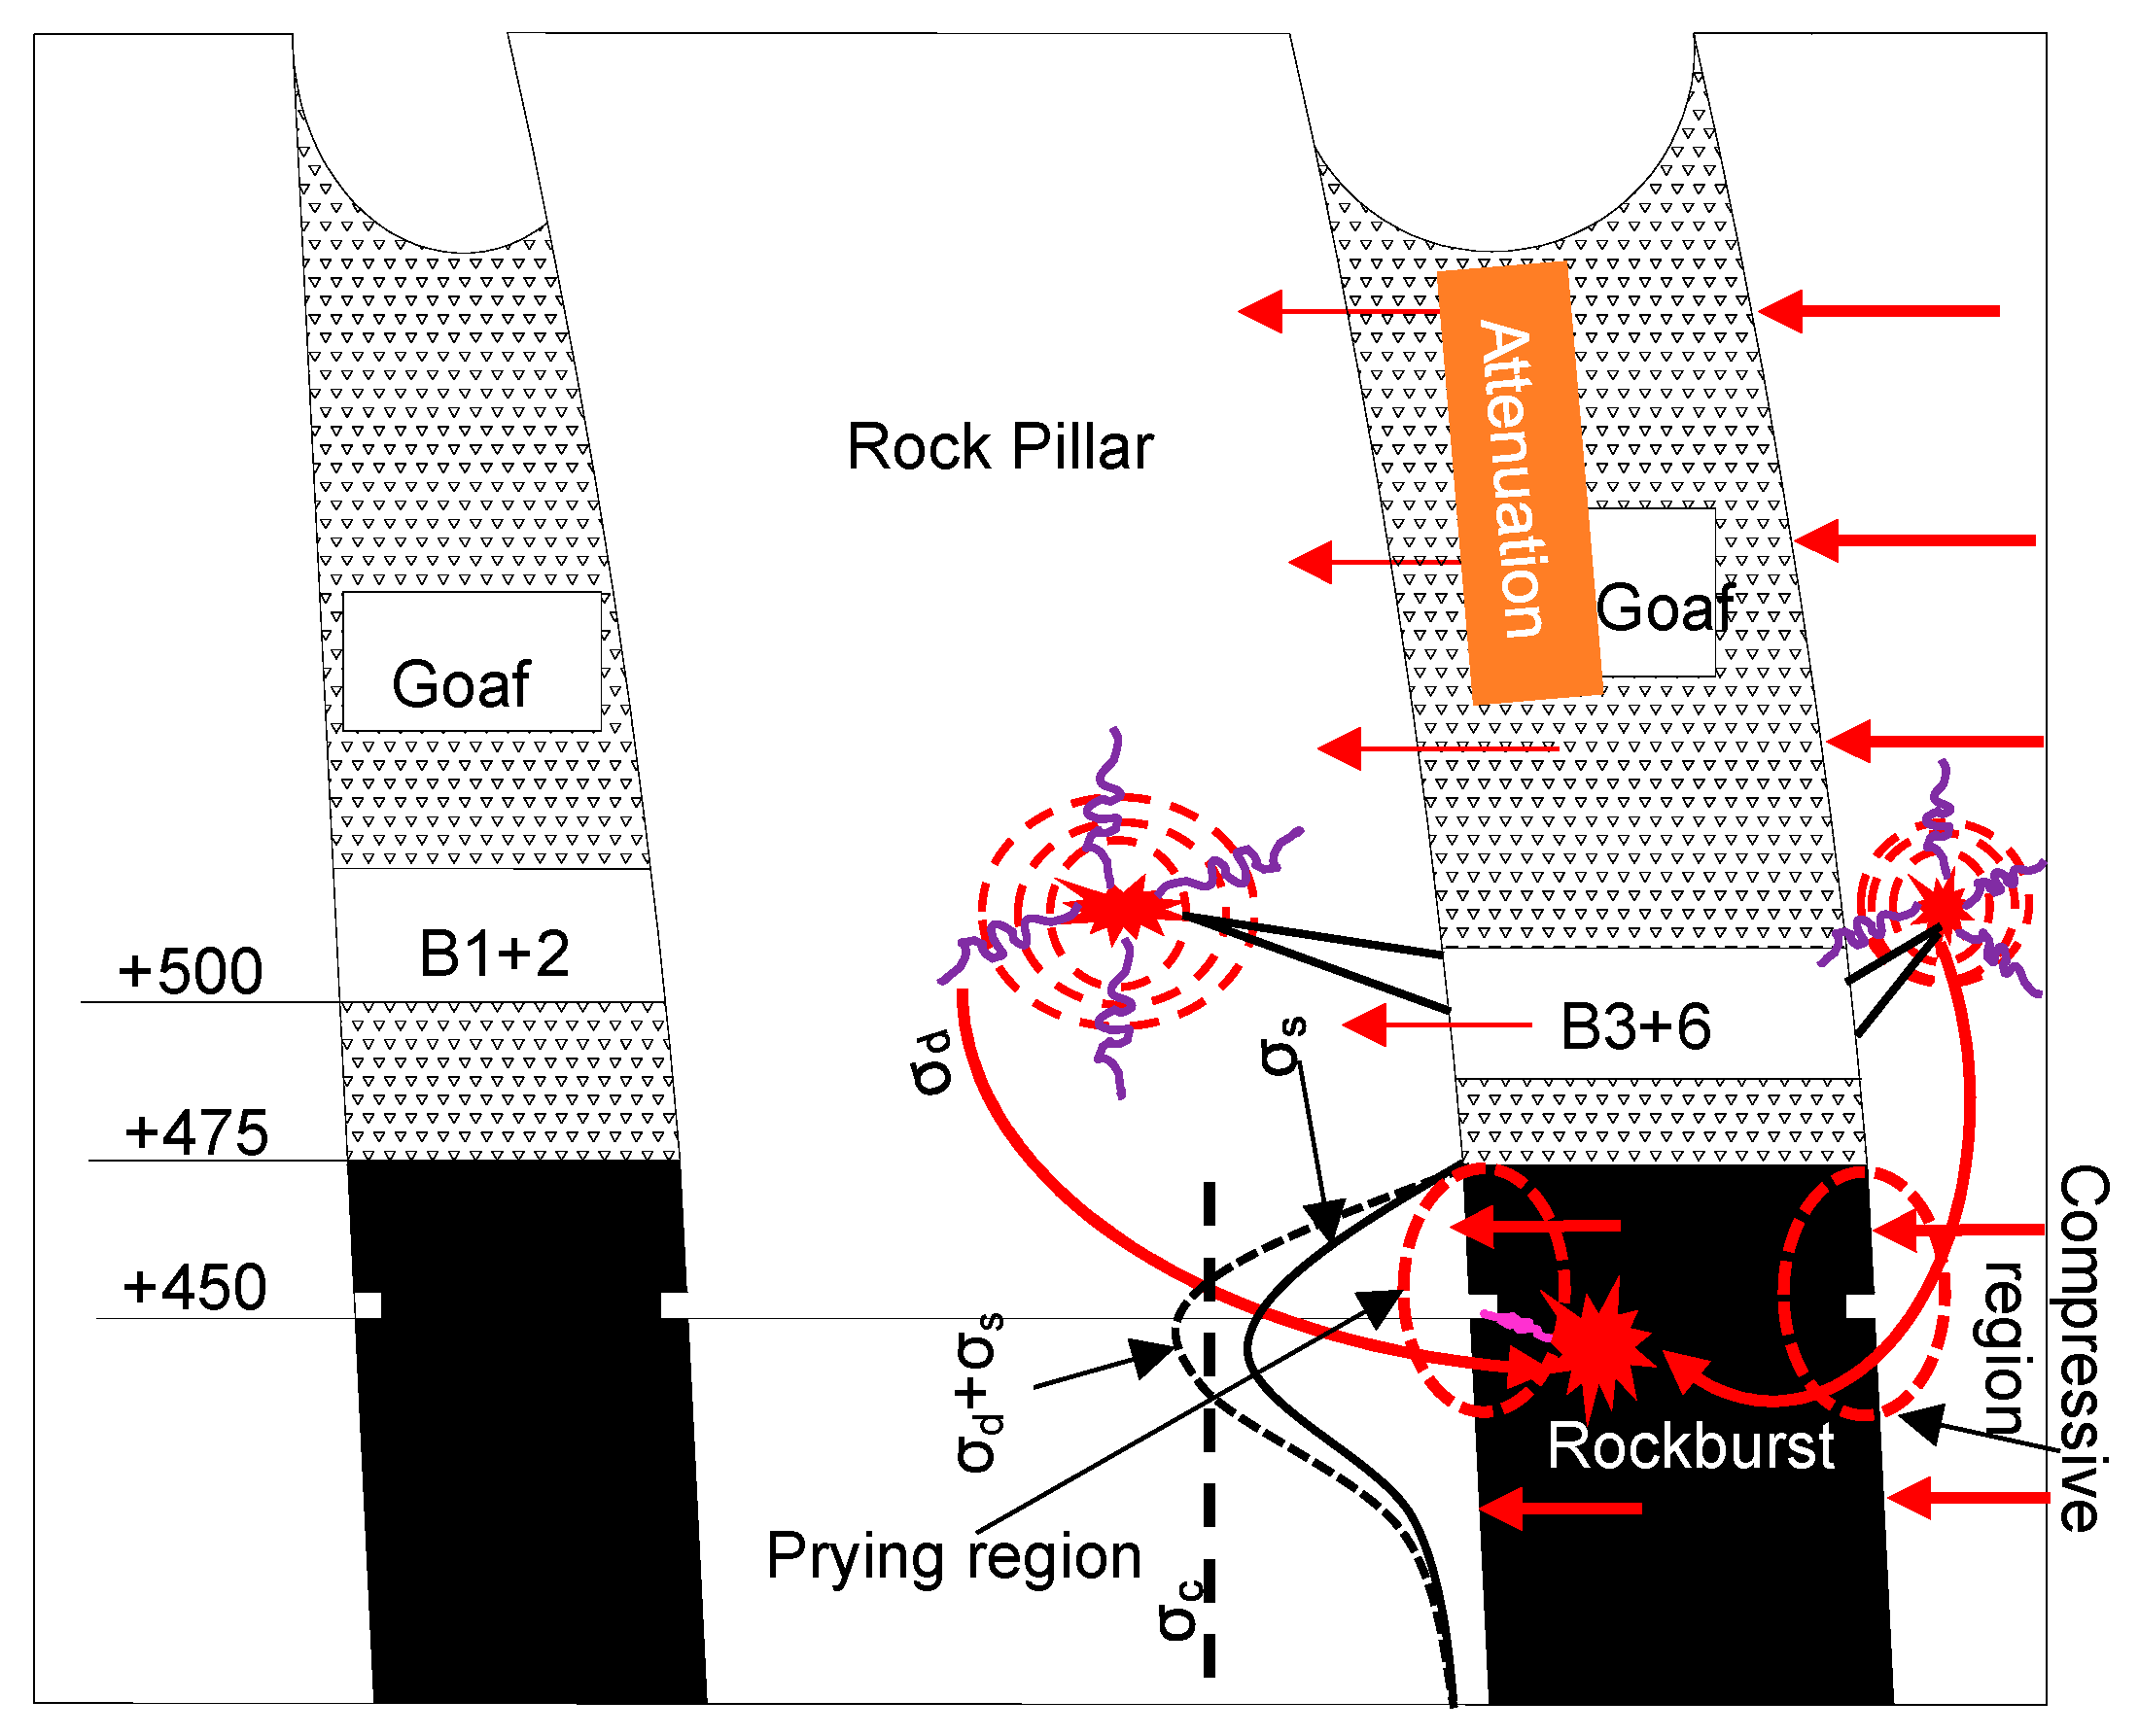
  • The high EDIM, velocity, and velocity anomaly areas were observed to be mainly distributed within the rock pillar and roof around the working surface. The fracturing of rock pillar and roof was the main inducing factor of rockbursts. The spatial distribution of both EDIM and passive velocity tomography could compensate for the shortcomings of the “critical value + trend” early warning method, specifically to determine the rockburst risk area and to guide the accurate implementation of the pressure relief engineering.
  • While the early warning capability of the “critical value” warning method had R = 0.23, the early warning capability of the “critical value + trend” temporal early warning method had R = 0.83, which was 3.6 times the “critical value” early warning method. The “critical value + trend” early warning method had marked significance for the warning of the rockburst risk in SIETCS.
  • This study could improve MS monitoring and provide a reference for rockburst early warning in SIETCSs. Most importantly, it should be emphasized that warning of a rockburst must use the comprehensive warning method, including both temporal early warning method (both qualitative and quantitative analysis of microseismicity evolution) and spatial early warning method (spatial evolution law of EDIM, velocity, and velocity anomaly), as well as some traditional detection methods. The spatio-temporal comprehensive early warning method not only identified the possibility of rockburst occurrence but also early warned stress concentration areas and rockburst risk areas. Furthermore, field application in this study showed that this method could help to reduce the probability of rockburst.

Author Contributions

Conceptualization, S.H. and D.S.; Methodology, Z.L. and S.H.; Validation, X.H. and S.H.; Investigation, Z.L. and P.F.; Data Curation, L.D.; Writing—Original Draft Preparation, S.H. and Z.L.; Writing—Review and Editing, D.S., Z.L., and J.C.; Visualization, S.H. and X.L.; Supervision, D.S. and X.H. All authors have read and agreed to the published version of the manuscript.

Funding

This work was supported and financed by the National Natural Science Foundation of China (Grant No. 52011530037, No. 51904019, No. 51634001), the Fundamental Research Funds for the central universities (Grant No. FRF-IP-20-01).

Institutional Review Board Statement

Not applicable

Informed Consent Statement

Not applicable

Data Availability Statement

The data that support the findings of this study are available from the corresponding author upon request.

Acknowledgments

Special thanks should be extended to the Wudong coal mine for providing raw data.

Conflicts of Interest

The authors confirm that there are no conflicts of interest associated with this publication.

References

  1. Ma, T.H.; Tang, C.A.; Tang, L.X.; Zhang, W.D.; Wang, L. Rockburst characteristics and microseismic monitoring of deep-buried tunnels for Jinping II Hydropower Station. Tunn. Undergr. Space Technol. 2015, 49, 345–368. [Google Scholar] [CrossRef]
  2. He, M.C.; Ren, F.Q.; Liu, D.Q. Rockburst mechanism research and its control. Int. J. Min. Sci. Technol. 2018, 28, 829–837. [Google Scholar] [CrossRef]
  3. Mazaira, A.; Konicek, P. Intense rockburst impacts in deep underground construction and their prevention. Can. GeoTech. J. 2015, 52, 1426–1439. [Google Scholar] [CrossRef]
  4. Feng, G.L.; Feng, X.T.; Chen, B.R.; Xiao, Y.X.; Yu, Y. A microseismic method for dynamic warning of rockburst development processes in tunnels. Rock Mech. Rock Eng. 2015, 48, 2061–2076. [Google Scholar] [CrossRef]
  5. Li, T.; Mu, Z.L.; Liu, G.J.; Du, J.L.; Hao, L. Stress spatial evolution law and rockburst danger induced by coal mining in fault zone. Int. J. Min. Sci. Technol. 2016, 26, 409–415. [Google Scholar] [CrossRef]
  6. Li, N.; Jimenez, R. A logistic regression classifier for long-term probabilistic prediction of rock burst hazard. Nat. Hazards 2018, 90, 197–215. [Google Scholar] [CrossRef]
  7. Zhang, C.G.; Ismet, C.; Faham, T.; Bruce, H. Assessment of energy release mechanisms contributing to coal burst. Int. J. Min. Sci. Technol. 2017, 27, 43–47. [Google Scholar] [CrossRef]
  8. Ren, F.Q.; Zhu, C.; He, M.C. Moment tensor analysis of acoustic emissions for cracking mechanisms during schist strain burst. Rock Mech. Rock Eng. 2020, 53, 153–170. [Google Scholar] [CrossRef]
  9. Li, X.L.; Wang, E.Y.; Li, Z.H.; Liu, Z.T.; Song, D.Z.; Qiu, L.M. Rock burst monitoring by integrated microseismic and electromagnetic radiation methods. Rock Mech. Rock Eng. 2016, 49, 4393–4406. [Google Scholar] [CrossRef]
  10. Wu, S.C.; Wu, Z.G.; Zhang, C.X. Rock burst prediction probability model based on case analysis. Tunn. Undergr. Space Technol. 2019, 93, 1–15. [Google Scholar] [CrossRef]
  11. Pu, Y.Y.; Apel, D.B.; Liu, V.; Mitri, H. Machine learning methods for rockburst prediction-state-of-the-art review. Int. J. Min. Sci. Technol. 2019, 29, 565–570. [Google Scholar] [CrossRef]
  12. He, S.Q.; Song, D.Z.; Li, Z.L.; He, X.Q.; Chen, J.Q.; Li, D.H.; Tian, X.H. Precursor of spatio-temporal evolution law of MS and AE activities for rockburst warning in steeply-inclined and extremely-thick coal seams under caving mining conditions. Rock Mech. Rock Eng. 2019, 52, 2415–2435. [Google Scholar] [CrossRef]
  13. Dou, L.M.; Jiang, Y.D.; Cao, A.Y.; Liu, H.S.; Gong, S.Y.; Cai, W.; Zhu, G.A. Monitoring and pre-warning of rockburst hazard with technology of stress field and wave field in underground coalmines. Chin. J. Rock Mech. Eng. 2017, 36, 803–811. [Google Scholar]
  14. He, X.Q.; Chen, W.X.; Nie, B.S.; Mitri, H. Electromagnetic emission theory and its application to dynamic phenomena in coal-rock. Int. J. Rock Mech. Min. Sci. 2011, 48, 1352–1358. [Google Scholar] [CrossRef]
  15. Song, D.Z.; Wang, E.Y.; Wang, C.; Xu, F.L. Electromagnetic radiation early warning criterion of rockburst based on statistical theory. Int. J. Min. Sci. Technol. 2010, 20, 686–690. [Google Scholar]
  16. Wang, E.Y.; He, X.Q.; Wei, J.P.; Nie, B.S.; Song, D.Z. Electromagnetic emission graded warning model and its applications against coal rock dynamic collapses. Int. J. Rock Mech. Min. Sci. 2011, 48, 556–564. [Google Scholar] [CrossRef]
  17. Tan, Y.L.; Guo, W.Y.; Gu, Q.H.; Zhao, T.B.; Yu, F.H.; Hu, S.C.; Yin, Y.C. Research on the rockburst tendency and AE characteristics of inhomogeneous coal-rock combination bodies. Shock Vib. 2016, 2016, 1–11. [Google Scholar] [CrossRef] [Green Version]
  18. Su, G.H.; Shi, Y.J.; Feng, X.T.; Jiang, J.Q.; Zhang, J.; Jiang, Q. True-triaxial experimental study of the evolutionary features of the acoustic emissions and sounds of rockburst processes. Rock Mech. Rock Eng. 2018, 51, 375–389. [Google Scholar] [CrossRef]
  19. Zhang, N.; Zhang, N.C.; Han, C.L.; Qian, D.Y.; Xue, F. Borehole stress monitoring analysis on advanced abutment pressure induced by Longwall Mining. Arab. J. Geosci. 2014, 7, 457–463. [Google Scholar] [CrossRef]
  20. Gu, S.; Wang, C.; Jiang, B.Y.; Tan, Y.L.; Li, N. Field test of rockburst danger based on drilling pulverized coal parameters. Disaster Adv. 2012, 5, 237–240. [Google Scholar]
  21. He, J.; Dou, L.M.; Gong, S.Y.; Li, J.; Ma, Z.Q. Rockburst assessment and prediction by dynamic and static stress analysis based on micro-seismic monitoring. Int. J. Rock Mech. Min. Sci. 2017, 93, 46–53. [Google Scholar] [CrossRef]
  22. Driad-Lebeau, L.; Lahaie, F.; Heib, M.A.; Josien, J.P.; Bigarre, P.; Noirel, J.F. Seismic and geotechnical investigations following a rockburst in a complex French mining district. Int. J. Coal Geol. 2005, 64, 66–78. [Google Scholar] [CrossRef]
  23. Ghosh, G.K.; Sivakumar, C. Application of underground microseismic monitoring for ground failure and secure longwall coal mining operation: A case study in an indian mine. J. Appl. Geophys. 2018, 150, 21–39. [Google Scholar] [CrossRef]
  24. Xu, J.; Jiang, J.D.; Xu, N.; Liu, Q.S.; Gao, Y.F. A new energy index for evaluating the tendency of rockburst and its engineering application. Eng. Geol. 2017, 230, 46–54. [Google Scholar] [CrossRef]
  25. Hosseini, N.; Oraee, K.; Shahriar, K.; Goshtasbi, K. Studying the stress redistribution around the longwall mining panel using passive seismic velocity tomography and geostatistical estimation. Arab. J. Geosci. 2013, 6, 1407–1416. [Google Scholar] [CrossRef]
  26. Cao, A.Y.; Dou, L.M.; Luo, X.; Zhen, Y.D.; Huang, J.L.; Andrew, K. Seismic effort of blasting wave transmitted in coal-rock mass associated with mining operation. J. Centl. South Univ. 2012, 19, 2604–2610. [Google Scholar] [CrossRef]
  27. Yamada, T.; Mori, J.J.; Ide, S.; Abercrombie, R.E.; Kawakata, H.; Nakatani, M.; Iio, Y.; Ogasawara, H. Stress drops and radiated seismic energies of microearthquakes in a South African gold mine. J. Geophys. Res. 2007, 112, 1–12. [Google Scholar] [CrossRef]
  28. Liu, J.P.; Liu, Z.S.; Wang, S.Q.; Shi, C.Y.; Li, Y.H. Analysis of microseismic activity in rock mass controlled by fault in deep metal mine. Int. J. Min. Sci. Technol. 2016, 26, 235–239. [Google Scholar] [CrossRef]
  29. Tan, Y.L.; Yin, Y.C.; Gu, S.T.; Tian, Z.W. Multi-index monitoring and evaluation on rock burst in Yangcheng Mine. Shock Vib. 2015, 2015, 1–5. [Google Scholar] [CrossRef]
  30. Jiang, B.Y.; Wang, L.G.; Lu, Y.L.; Wang, C.Q.; Ma, D. Combined early warning method for rockburst in a deep island, fully mechanized caving face. Arab. J. Geosci. 2016, 9, 731–743. [Google Scholar] [CrossRef]
  31. Falmagne, V. Quantification of Rock Mass Degradation Using Microseismic Monitoring and Applications for Mine Design. Ph.D. Thesis, Queen’s University, Kingston, ON, Canada, 2001. [Google Scholar]
  32. Chen, B.R.; Feng, X.T.; Li, Q.P.; Luo, Z.R.; Li, S. Rockburst intensity classification based on the radiated energy with damage intensity at Jinping II Hydropower Station. China Rock Mech. Rock Eng. 2015, 48, 289–303. [Google Scholar] [CrossRef]
  33. Lu, C.P.; Liu, G.J.; Liu, Y.; Zhang, N.; Xue, J.H.; Zhang, L. Microseismic multi-parameter characteristics of rockburst hazard induced by hard roof fall and high stress concentration. Int. J. Rock Mech. Min. Sci. 2015, 76, 18–32. [Google Scholar] [CrossRef]
  34. Li, Z.L.; He, X.Q.; Dou, L.M.; Wang, G.F. Rock burst occurrences and microseismicity in a longwall panel experiencing frequent rockbursts. GeoSci. J. 2018, 22, 623–639. [Google Scholar] [CrossRef]
  35. Cheng, G.W.; Ma, T.H.; Tang, C.A.; Liu, H.Y.; Wang, S.J. A zoning model for coal mining-induced strata movement based on microseismic monitoring. Int. J. Rock Mech. Min. Sci. 2017, 94, 123–138. [Google Scholar] [CrossRef]
  36. Cook, N.G.W. The design of underground excavations. In Proceedings of Eighth Rock Mechanics Symposium; American Rock Mechanics Association: Minneapolis, MN, USA, 1966; pp. 45–52. [Google Scholar]
  37. He, S.Q.; Chen, T.; Vennes, I.; He, X.Q.; Song, D.Z.; Chen, J.Q.; Mitri, H. Dynamic modelling of seismic wave propagation due to a remote seismic source: A case study. Rock Mech. Rock Eng. 2020, 53, 5177–5201. [Google Scholar] [CrossRef]
  38. Mitri, H.S.; Tang, B.; Simon, R. FE modelling of mining-induced energy release and storage rates. J. S. Afr. Inst. Min. Metall. 1999, 99, 103–110. [Google Scholar]
  39. Tahmasebinia, F.; Zhang, C.G.; Canbulat, I.; Sepasgozar, S.; Saydam, S. A Novel Damage Model for Strata Layers and Coal Mass. Energies 2020, 13, 1928. [Google Scholar] [CrossRef] [Green Version]
  40. Zhang, C.G.; Tahmasebinia, F.; Canbulat, I.; Vardar, O.; Saydam, S. Analytical Determination of Energy Release in a Coal Mass. Energies 2018, 11, 1–16. [Google Scholar]
  41. Hosseini, N. Evaluation of the rockburst potential in longwall coal mining using passive seismic velocity tomography and image subtraction technique. J. Seismol. 2017, 21, 1–10. [Google Scholar] [CrossRef]
  42. Lurka, A. Location of high seismic activity zones and seismic hazard assessment in Zabrze Bielszowice coal mine using passive tomography. J. China Univ. Min. Technol. 2008, 18, 177–181. [Google Scholar] [CrossRef]
  43. Cao, A.Y.; Dou, L.M.; Cai, W.; Gong, S.Y.; Liu, S.; Zhao, Y.L. Tomographic imaging of high seismic activities in underground island longwall face. Arab. J. Geosci. 2016, 9, 1–10. [Google Scholar] [CrossRef]
  44. Gong, S.Y. Research and Application of Using Mine Tremor Velocity Tomography to Forecast Rockburst Danger in Coal Mine. Ph.D. Thesis, China University of Mining and Technology, Xuzhou, China, 2010. [Google Scholar]
  45. Cao, A.Y.; Dou, L.M.; Cai, W.; Gong, S.Y.; Liu, S.; Jing, G.C. Case study of seismic hazard assessment in underground coal mining using passive tomography. Int. J. Rock Mech. Min. Sci. 2015, 78, 1–9. [Google Scholar] [CrossRef]
  46. Cai, M.; Kaiser, P.K.; Morioka, H.; Minami, M.; Maejima, T.; Tasaka, Y.; Kurose, H. FLAC/PFC coupled numerical simulation of AE in large-scale underground excavations. Int. J. Rock Mech. Min. Sci 2007, 44, 550–564. [Google Scholar] [CrossRef]
  47. Tang, C.A.; Wang, J.; Zhang, J. Preliminary engineering application of microseismic monitoring technique to rockburst prediction in tunneling of Jinping II project. J. Rock Mech. GeoTech. Eng. 2010, 2, 193–208. [Google Scholar] [CrossRef] [Green Version]
  48. Cai, W.; Dou, L.M.; Zhang, M.; Cao, W.Z.; Shi, J.Q.; Feng, L.F. A fuzzy comprehensive evaluation methodology for rock burst forecasting using microseismic monitoring. Tunn. Undergr. Space Technol. 2018, 80, 232–245. [Google Scholar] [CrossRef]
  49. Benioff, H. Crustal strain characteristics derived from earthquake sequences. Trans. Am. Geophys. Union 1951, 32, 508–514. [Google Scholar]
  50. Lu, C.P.; Liu, Y.; Wang, H.Y.; Liu, P.F. Microseismic signals of double-layer hard and thick igneous strata separation and fracturing. Int. J. Coal Geol. 2016, 160–161, 28–41. [Google Scholar] [CrossRef]
  51. He, S.Q.; Song, D.Z.; He, X.Q.; Chen, J.Q.; Ren, T.; Li, Z.L.; Qiu, L.M. Coupled mechanism of compression and prying-induced rock burst in steeply inclined coal seams and principles for its prevention. Tunn. Undergr. Space Technol. 2020, 98, 103327. [Google Scholar] [CrossRef]
  52. Xia, Y.X.; Lan, H.; Wei, X.Z. Study of comprehensive evaluation technology for rockburst hazard based on microseismic and underground sound monitoring. J. China Coal Soc. 2011, 36, 358–364. [Google Scholar]
  53. Yan, P.; Zhao, Z.G.; Lu, W.B.; Fan, Y.; Chen, X.R.; Shan, Z.G. Mitigation of rockburst events by blasting techniques during deep-tunnel excavation. Eng. Geol. 2015, 188, 126–136. [Google Scholar] [CrossRef]
Figure 1. Stress-strain curve of coal-rock specimens during the deformation-failure process (Dou et al. 2017).
Energies 14 01186 g001
Figure 2. Temporal evolution law of acoustic emission (AE) pulses on the process coal specimen’s failure. (a) specimen A, (b) specimen B.
Energies 14 01186 g002
Figure 3. Flowchart of the temporal-spatial comprehensive early warning method to accurately forecast rockburst and risk area. EDIM: energy density index of MS.
Energies 14 01186 g003
Figure 4. Geologic section of WCM.
Energies 14 01186 g004
Figure 5. In situ record photos showing damage to the rockburst and high energy tremor in +450 horizontal No. B3 + 6 working face (a) rockburst “2·1”, (b) high energy tremor “3·21”.
Energies 14 01186 g005
Figure 6. Probes installation position of the MS monitoring system when the “4·26” rockburst occurred.
Energies 14 01186 g006
Figure 7. Daily total energy and event count evolution law before one month the high energy tremors. (a) “12·9”, (b) “12·23”, (c) “3·7”, (d) “3·21”.
Energies 14 01186 g007
Figure 8. Energy deviation temporal evolution law before and after the rockbursts and high energy tremors.
Energies 14 01186 g008
Figure 9. Event count deviation temporal evolution law before and after the rockbursts and high energy tremors.
Energies 14 01186 g009
Figure 10. Temporal evolution law of AE energy on the process coal specimen’s failure. (a) specimen A, (b) specimen B.
Energies 14 01186 g010
Figure 11. “Critical value+ trend” rockburst temporal early warning method. E: maximum energy.
Energies 14 01186 g011
Figure 12. Spatial evolution of the EDIM before each rockburst. (a) “11·24”, (b) “2·1”, (c) “4·26”.
Energies 14 01186 g012aEnergies 14 01186 g012b
Figure 13. Elevation of each rockburst source spatial distribution.
Energies 14 01186 g013
Figure 14. Principle of induced rockburst in a steeply inclined and extremely thick coal seam (SIETCS). σs is the static stress, σd is the dynamic stress, and σc is the critical value stress when rockburst occurs [51].
Energies 14 01186 g014
Figure 15. Tomographic images obtained using MS events on 22 April 2017 (with the 125 MS events that occurred). (a) Velocity inversion result, (b) Velocity anomaly inversion result.
Energies 14 01186 g015aEnergies 14 01186 g015b
Figure 16. Tomographic images obtained using MS events on 23 April 2017 (with the 181 MS events that occurred). (a) Velocity inversion result, (b) Velocity anomaly inversion result.
Energies 14 01186 g016
Figure 17. Early warning results of “critical value + trend” early warning method (precursor analysis stage).
Energies 14 01186 g017
Figure 18. Early warning results of “critical value + trend” early warning method (application stage).
Energies 14 01186 g018
Figure 19. Spatial evolution law of the EDIM from 11 July 2017 to 16 July 2017.
Energies 14 01186 g019
Figure 20. Schematic diagram of pressure-relief boreholes: (a) Plan view of the alternate layout of deep and shallow boreholes, (b) Sectional plan of shallow de-stress blasting borehole, (c) Sectional plan of deep de-stress blasting borehole.
Energies 14 01186 g020
Table 1. Microseismic (MS) indicators for early warning of rockburst risk.
NameBasic EquationsKey References
Number of events N Total number of MS events in a given time windowSrinivasan et al. (1997); Tan et al. (2015); Li et al. (2018)
Amount of energy E Total amount of MS energy in a given time window
b value log N ( M ) = a b M Gutenberg and Richter (1944); Li et al. (2017); Cao et al. (2018)
N(M) is the cumulative number of MS events having a magnitude larger than M, and a and b are constants. It has been shown in laboratory studies, field observations, and numerical simulations that the slope of this distribution curve depends on stress conditions
A(b) value A ( b ) = 1 b log i = 1 N 10 b M i Wu and Cao (1983)
b is the b value, and Mi is the magnitude of the MS event.
Seismicity degree SD S D = 0.117 log ( N + 1 ) + 0.029 log 1 N i = 1 N 10 1.5 M i + 0.015 M max Gu and Wei (1987)
N is the total number of MS events, and Mmax is the maximum magnitude
Lack of shock bL b L = log e M mean M min Aki (1965)
Mmean is the mean magnitude and Mmin is the minimum magnitude of given MS events
Fault total area A ( t ) = k = k 0 k 1 N ( k ) 4.5 k k 0 Lu et al. (2015)
k0 is the lower limit of the statistical MS energy level, and k is the energy level of each event. N(k) is the event count of MS energy level k
(correspondingly, the energy is 10k–10k+1 J)
Z value Z = M ¯ m ¯ σ M 2 N + σ m 2 n Lu et al. (2015)
M ¯ is the arithmetic mean magnitude of all MS events in the entire monitoring period, which is a relatively stable amount to manifest background characteristics. m ¯ is the arithmetic mean magnitude of MS events over the time window. N and n are the quantities of MS events used for calculating M ¯ and m ¯ , respectively, and σM and σm are their standard deviations accordingly
Source concentration degree S d = λ 1 λ 2 λ 3 3 Cai et al. (2014)
λ1, λ2, and λ3 are standard orthogonal eigenvectors of the covariance matrix of MS hypocentre parameters x, y, z
Seismic diffusivity d s = ( X ¯ ) 2 / t ¯ Mendecki (1996)
X ¯ is the mean distance between consecutive events and t ¯ is the mean time between events
Fractal dimension D = lim r 0 lg C ( r ) lg r Xie and Pariseau (1993);
C(r) is the correlation integral of the energy or number of MS events, and r is the energy or spatial radio scaleFeng et al. (2016)
Algorithm complexity AC A C = ln ( n ) n ln ( M A C ) Lv and Lu
n is the number of magnitudes of MS events over the time window; MAC = MmaxMmin + 1, and Mmax and Mmin here are the maximum and minimum magnitudes, respectively(1993)
Apparent stress/volume σ A = μ E A M 0 , V A = M 0 2 μ E A Mendecki (1996); Tang and
μ is the shear rigidity modulus, EA is the MS energy, and M0 is the MS momentXia (2010)
Energy index E I = E A E ¯ ( M 0 ) Mendecki (1996); Tang et al. (2010); Xu et al. (2011)
E ¯ ( M 0 ) is the average energy released by events of the same MS moment
Time information entropy Qt Q t = ( 1 / N ) i = 1 N p i ln p i ln ( N 1 ) Zhu and Wang
where pi = (ti + 1−ti)/(tNt1), with value from 0 to 1, and ti is the occurrence time of the ith MS event.(1988)
Energy ratioRatio of the S- and P-wave energies (ES/EP)Gibowicz and Kijko (1994)
Table 2. Relation between velocity anomaly and stress concentration [44,45].
Rockburst Risk IndexStress Concentration DegreeVelocity Anomaly An, %
0None<5
1Weak5–15
2Middle15–25
3Strong>25
Table 3. R-score contingency table.
Early Warning Result
No Rockburst or High Energy TremorRockburst or High Energy Tremor
Actual situationNo rockburst or high energy tremor n 0 0 n 0 1 N0
Rockburst or high energy tremor n 1 0 n 1 1 N1
N0N1N
n 1 1 , n 1 0 , n 0 1 , n 0 0 , N 1 and N 0 are, respectively, the accurate prediction numbers of high energy tremor and rockburst, the number of missed predictions, the number of false predictions, the accurate predictions number of MS events that are neither rockburst nor high energy tremor, the number of high energy tremor and rockburst, and the number of MS events that are neither rockburst nor high energy tremor.
Table 4. Early warning effectiveness test results of “critical value + trend” early warning method.
Early Warning ResultTotal Number of Times
No Rockburst or High Energy TremorRockburst or High Energy Tremor
Actual situationNo rockburst or high energy tremor
1617168
Rockburst or high energy tremor
178
Table 5. Early warning effectiveness test results of “critical value” early warning method.
Early Warning ResultTotal Number of Times
No Rockburst or High Energy TremorNo Rockburst or High Energy Tremor
Actual situationNo rockburst or high energy tremor
1653168
Rockburst or high energy tremor
628
Publisher’s Note: MDPI stays neutral with regard to jurisdictional claims in published maps and institutional affiliations.

