
Improvement Effect of Green Remodeling and Building Value Assessment Criteria for Aging Public Buildings


1
Architectural Engineering Major, Division of Urban, Architecture and Civil Engineering, Dong-Eui University, Busan 47340, Korea
2
Smart Greenbuilding Lab, EAN Technology, Seoul 06159, Korea
*
Author to whom correspondence should be addressed.
Energies 2021, 14(4), 1200; https://0-doi-org.brum.beds.ac.uk/10.3390/en14041200
Submission received: 13 January 2021
/
Revised: 10 February 2021
/
Accepted: 19 February 2021
/
Published: 23 February 2021
(This article belongs to the Section G: Energy and Buildings)
Abstract
:The Green Remodeling Project under South Korea’s Green New Deal policy is a government-led project intended to strengthen the performance sector directly correlated with energy performance among various elements of improvement applicable to building remodeling by replacing insulation materials, introducing new and renewable energy, introducing high-efficiency equipment, etc., with public buildings taking the lead in green remodeling in order to induce energy efficiency enhancement in private buildings. However, there is an ongoing policy that involves the application of a fragmentary value judgment criterion, i.e., whether to apply technical elements confined to the enhancement of the energy performance of target buildings and the prediction of improvement effects according thereto, thus resulting in the phenomenon of another important value criterion for green remodeling, i.e., the enhancement of the occupant (user) comfort performance of target buildings as one of its purposes, being neglected instead. In order to accurately grasp the current status of these problems and to promote ‘expansion of the value judgment criteria for green remodeling’ as an alternative, this study collected energy usage data of buildings actually used by public institutions and then conducted a total analysis. After that, the characteristics of energy usage were analyzed for each of the groups of buildings classified by year of completion, thereby carrying out an analysis of the correlation between the non-architectural elements affecting the actual energy usage and the actual energy usage data. The correlation between the improvement performance of each technical element and the actual improvement effect was also analyzed, thereby ascertaining the relationship between the direction of major policy strategies and the actual energy usage. As a result of the relationship analysis, it was confirmed that the actual energy usage is more affected by the operating conditions of the relevant building than the application of individual strategic elements such as the performance of the envelope insulation and the performance of the high-efficiency system. In addition, it was also confirmed that the usage of public buildings does not increase in proportion to their aging. The primary goal of reducing energy usage in target buildings can be achieved if public sector (government)-led green remodeling is pushed ahead with in accordance with biased value judgment criteria, just as in the case of a campaign to refrain from operating cooling facilities in aging public buildings. However, it was possible to grasp through the progress of this study that the remodeling may also result in the deterioration of environmental comfort and stability, such as the numerical value of the indoor thermal environment. The results of this study have the significance of providing basic data for pushing ahead with a green remodeling policy in which the value judgment criteria for aging existing public buildings are more expanded, and it is necessary to continue research in such a direction that the quantitative purpose of green remodeling, which is to reduce energy usage in aging public buildings, and its qualitative purpose, which is to enhance their environmental performance for occupants’ comfort, can be mutually balanced and secured at the same time.
1. Introduction
1.1. Background and Purpose
In order to address the challenges of overcoming the economic recession, which was further exacerbated by the COVID-19 pandemic, the current South Korean government set two policy directions: the Digital New Deal and the Green New Deal in 2020. Ten key projects were designated as implementation strategies for the above-mentioned two policy directions. Data Dam, AI Government, and Smart Healthcare were designated as three projects to be implemented according to the Digital New Deal policy direction, whereas Green Remodeling, Green Energy, and Eco-friendly Mobility of the Future were specified as three projects to be implemented according to the Green New Deal policy direction. In addition, Green and Smart Schools, Digital Twin, Digitalization of SOC, and Smart and Green Industrial Complexes were set up as four projects to be implemented for the convergence of the Digital New Deal and the Green New Deal [1].
Among the projects, Green Remodeling is intended to strengthen the energy-related performance of buildings among the architectural elements by replacing insulation materials, introducing new and renewable energy, introducing high-efficiency equipment, etc., with public buildings taking the lead in green remodeling in order to induce energy efficiency enhancement in private buildings. Its goal is to ensure through this that public buildings with a gross floor area of 500 m2 or more are completed as zero-energy buildings by 2023. However, the evaluation of the results (achievements) related to the promotion of green remodeling is biased toward the energy saving figures for heating and cooling.
The main reason for such biased evaluation is that the problem of the aging of a building is addressed only by focusing on energy overconsumption due to the thermal insulation and the facility system deteriorating as a result of their aging, etc. However, paradoxically, the energy consumption of an aging building cannot exceed the capacity range of the cooling and heating system already installed in it. The scenario of energy consumption increasing due to an aging system is a scenario in which the cooling and heating functions of the system deteriorate as it ages, with its uptime increasing in order to meet the temperature conditions due to the deterioration of its functions, thus resulting in the increasing energy usage. However, since one day is limited to 24 h, the margin of additional system uptime is limited.
Accordingly, it has been judged necessary to check whether the actual energy usage is high in aging buildings. More specifically, it is necessary to improve the fragmentary judgment criterion itself, i.e., making a judgment based on whether to apply technical elements confined to energy performance enhancement through thermal insulation improvement and facility system replacement and the prediction of improvement effects according thereto in the so-called green remodeling promotion strategy.
From our point of view regarding green remodeling intended to improve aging buildings, it is necessary to expand the value assessment criteria in a variety of ways, including not only the amount of energy usage but also the effects of thermal environment improvement for the users living in aging buildings as compared with the energy usage levels and the degree of contribution to urban regeneration by the remodeling of aging buildings [2].
A method that can evaluate the effect of maintaining the thermal environment relative to the energy usage level works by conducting dynamic energy simulations to check the “Discomfort Hours” or “Not Met Hours” reports during one year, thereby determining the level of the thermal environment that is likely to deviate from the comfort range. Even for buildings with the same level of energy usage, it is possible to conclude by making value assessments that buildings with lower discomfort hours have higher efficiency in achieving the purpose of the energy used. However, in order to perform such analyses, it is necessary to quantitatively measure and know all the energy performance correlation information values of the existing target buildings. In particular, it is difficult but necessary to accurately simulate various energy-related conditions, such as the operational state as well as the shape of each building, with the digital twin technique.
In spite of this difficulty, in order to proceed with this study seeking to explore factors influencing the value of existing buildings for the establishment of value assessment criteria for the improvement effects of green remodeling of aging public buildings, it was ascertained whether green remodeling influenced the real amount of energy usage by analyzing data related to energy usage in existing public buildings in Korea and conducting an exploratory analysis of data on the characteristics of energy usage. In addition, basic research for the establishment of value assessment criteria for green remodeling was conducted together with some other research through data analyses, simulations, and field investigations.
1.2. Study Method
For the expansion of the value judgment criteria for green remodeling, this study conducted a correlation analysis of non-architectural elements affecting the actual energy usage and the actual usage data.
Measurements were performed on the actual environment of real buildings to which the improvement technology element of green remodeling as shown in an actual remodeling consulting case was applied in order to ascertain how much additional values other than the energy aspect, including the improvement of the living environment, were enhanced, and simulations were conducted to determine which method should be applied to enhance the actual values.
A total analysis of public institution data was conducted to determine whether public institution buildings could actually be defined as high energy consumption buildings as a result of aging, and the energy usage data on the building groups by year of completion were compared to verify whether aging buildings actually use a lot of energy.
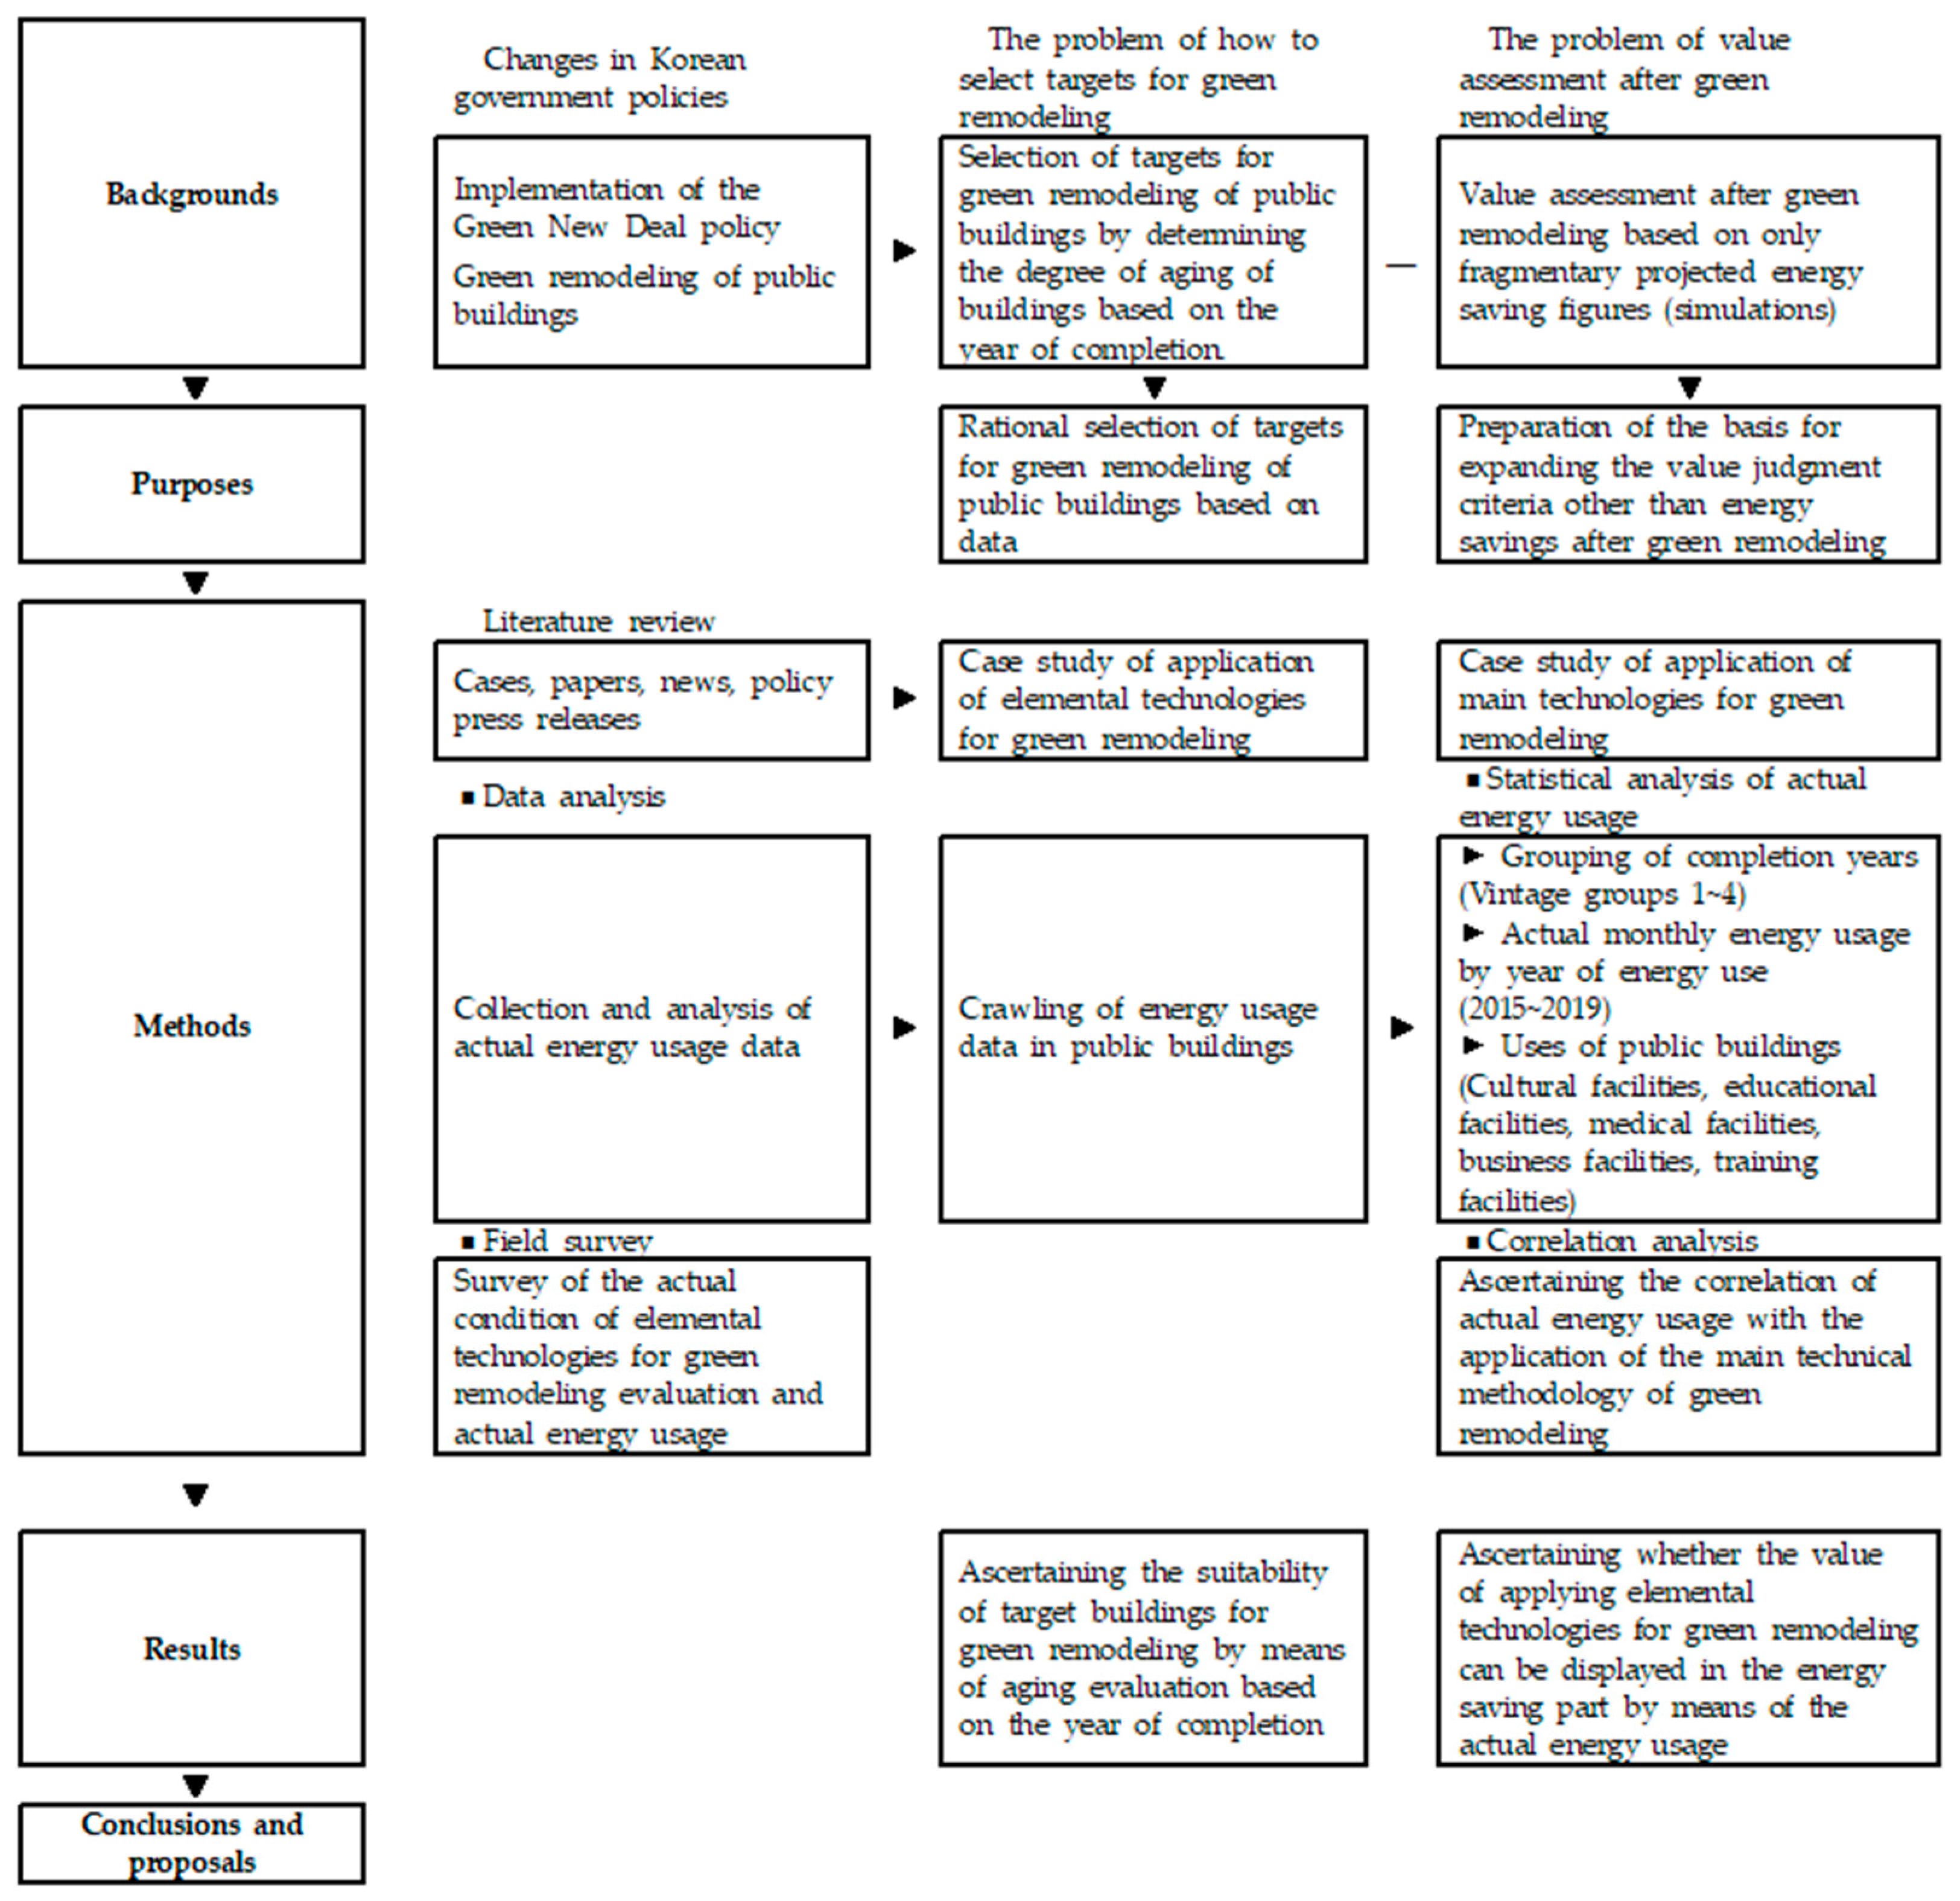
The thermal insulation levels, facility systems, etc., of aging public buildings were investigated, and the collected actual energy consumption data were analyzed to ascertain whether the buildings were overconsuming energy. In addition, correlation analyses were performed to ascertain the relationship between the actual energy usage in the buildings and the major strategies of green remodeling, such as improving their insulation performance, applying new and renewable energy, and replacing the LED lighting. Figure 1 shows the overall process of this study.
2. Analysis of the Relationship between the Actual Amount of Energy Usage and the Major Strategic Elements of Green Remodeling
2.1. Necessity of Analyzing Non-Architectural Elements Affecting the Actual Energy Usage
As for the elements correlated with the actual energy usage in a building, not only the building envelope insulation performance and the system efficiency as defined in the major strategies of green remodeling but also the building use characteristics greatly affect the actual energy usage in the building.
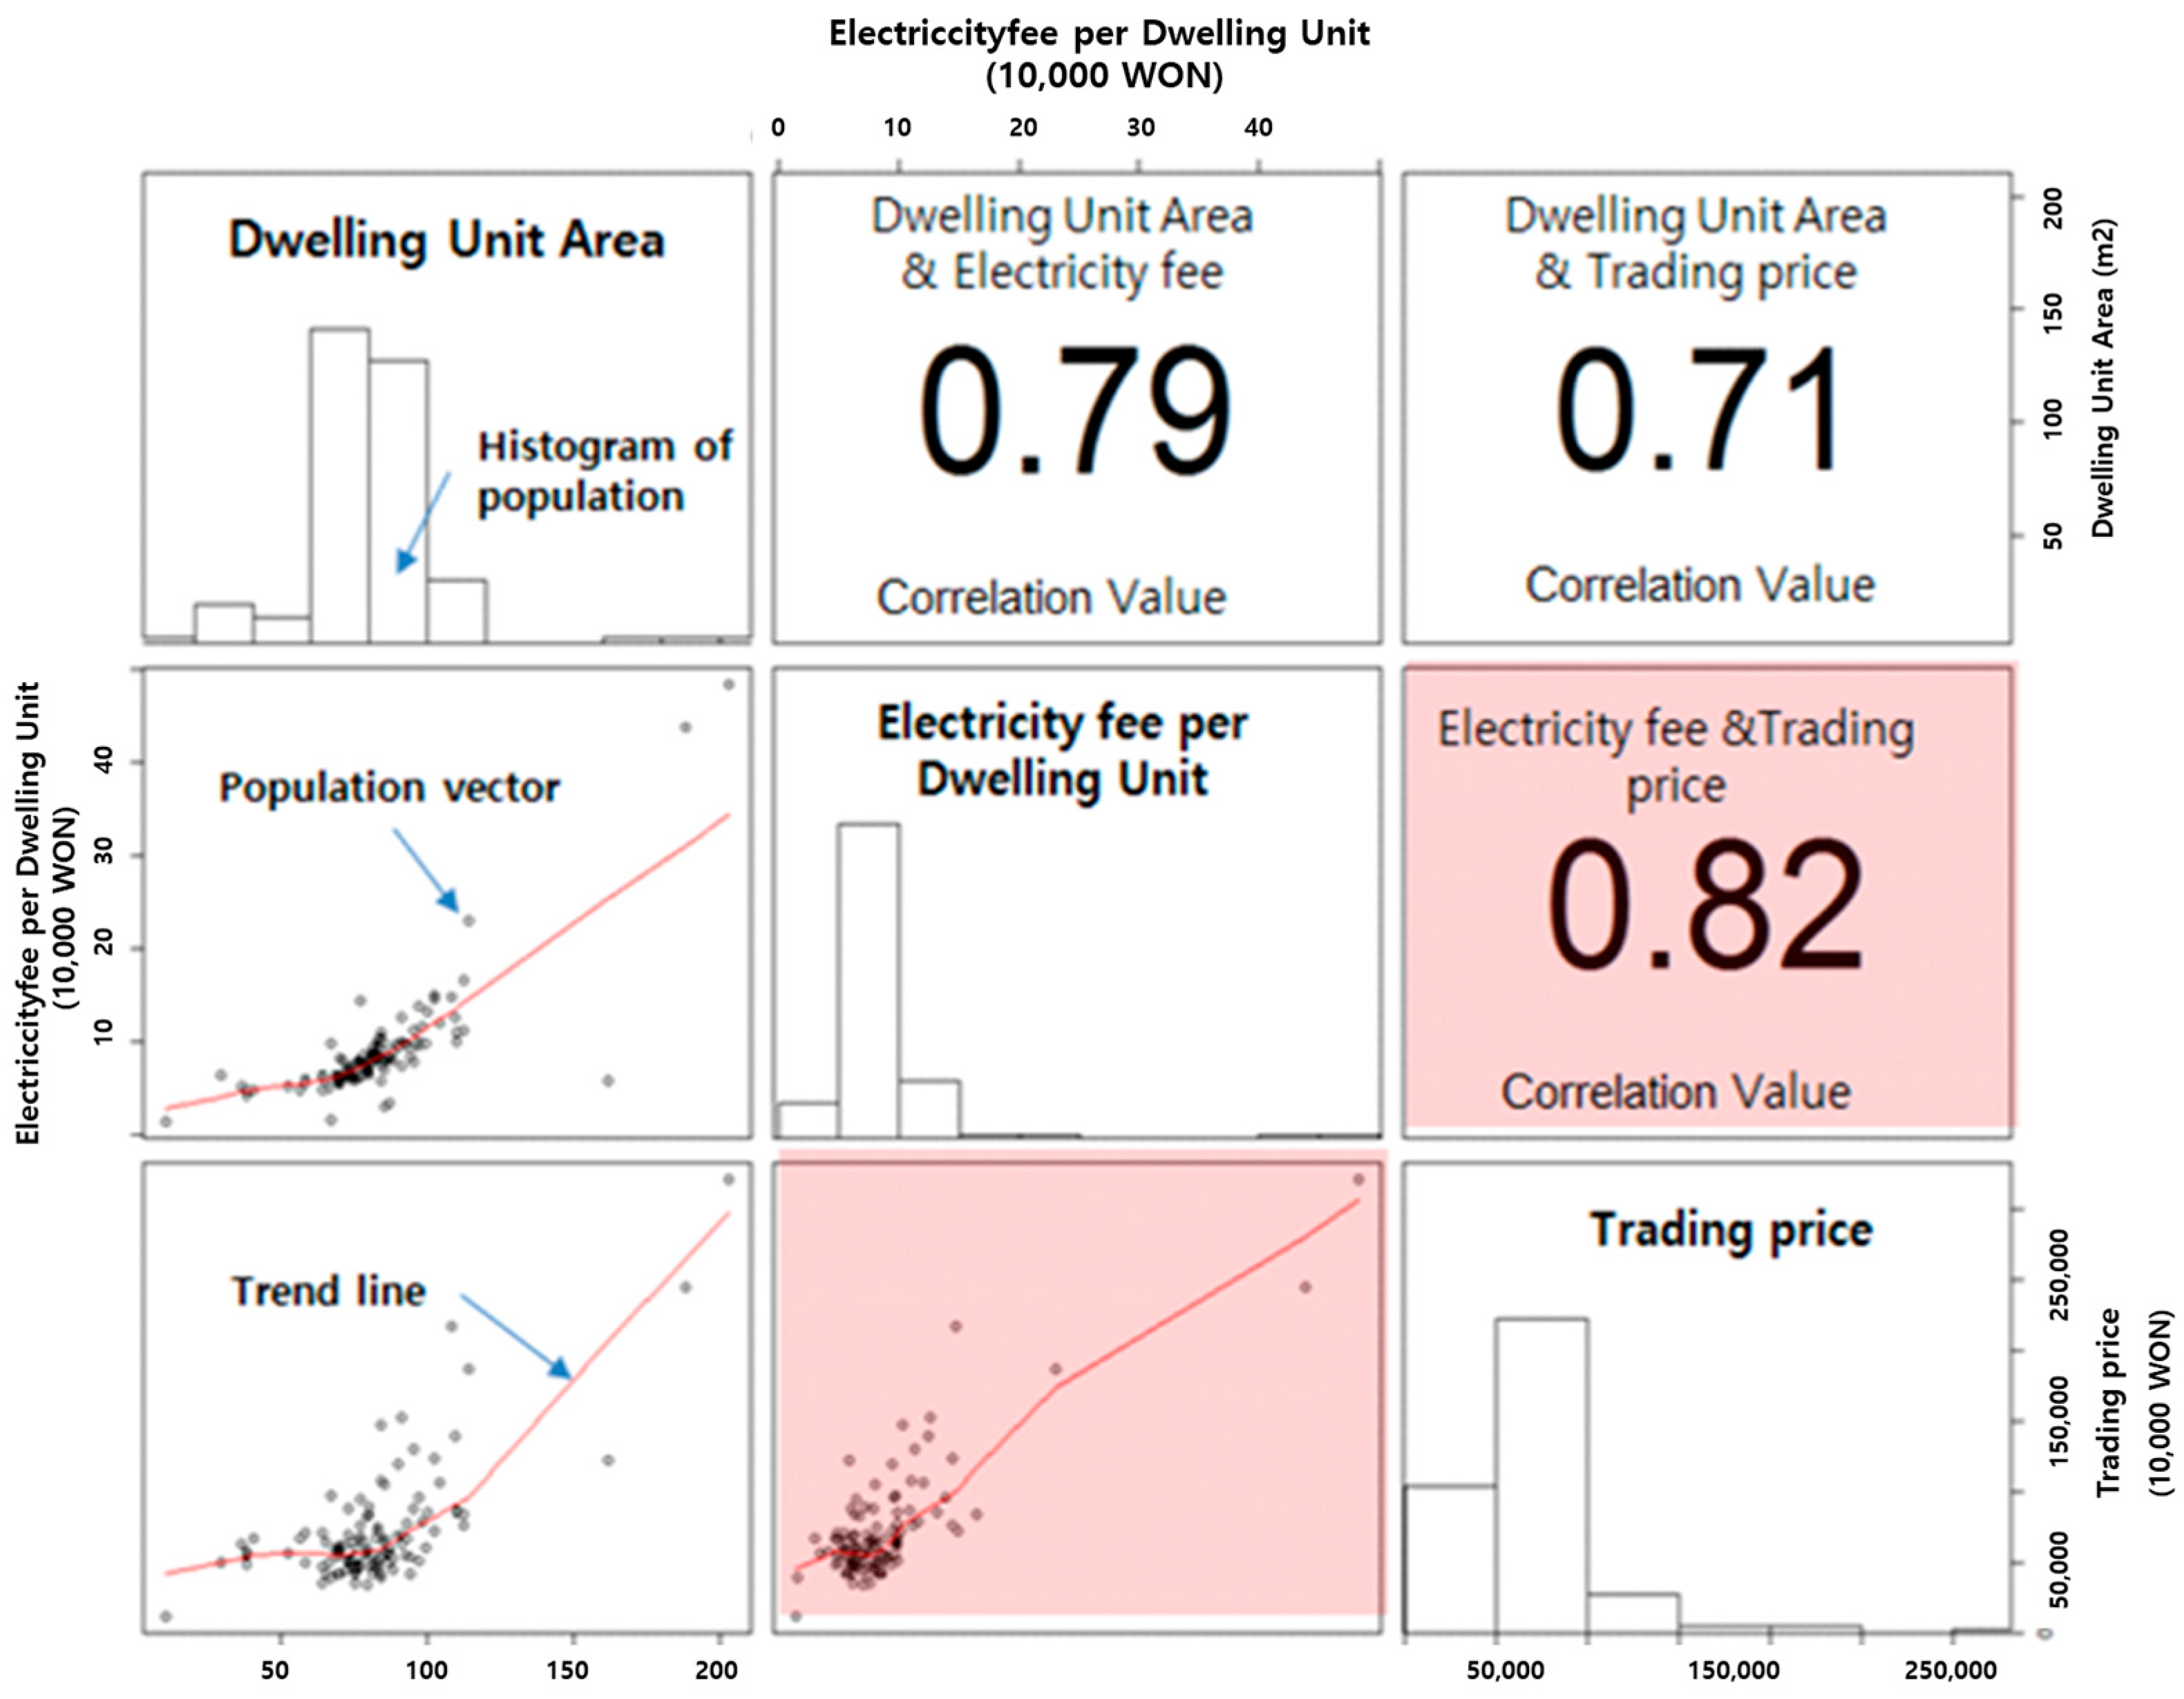
To take an example as proof of the above premise, in the case of a residential building as shown in Figure 2, after analysis it was shown that there is a very strong correlation of 0.82 between the price of the building and the electricity usage charge.
This is a fragmentary example, but methodologically in a study on quantification methods based on big data analysis of explanatory variable factors that contain the uncertainty of the actual energy usage in buildings, it can be confirmed that the amount of energy usage in a building has a very high correlation with the price of the building.
In analyzing the relationship between the actual energy usage in a building and the major strategic elements of green remodeling, analysis of non-architectural elements affecting the actual energy usage can be an important judgment criterion [3], and methodologically in the process of this study, it was judged that the correlation and the actual energy usage and such non-architectural elements also proves the utility and necessity of using the analysis technique.
2.2. Policy Trends through Press Releases Related to Green Remodeling of Public Buildings
In July 2020, the Ministry of Environment and the Ministry of Trade, Industry and Energy implemented the Green New Deal policy to restore the green ecosystem, spread new and renewable energy, and lay the foundation for the green industry, together with efforts to establish carbon neutrality as the point of orientation. The Green New Deal is largely divided into three areas: green transformation of the urban/space/living infrastructure, diffusion of low carbon/decentralized energy, and establishment of a green industry innovation ecosystem. Among them, the government announced a plan to push ahead with green remodeling of public buildings in a zero energy project for public facilities close to people’s lives [4].
5.4 million buildings, about 75% of the total 7.2 million buildings in Korea, are aging buildings and at least 15 years old, and 135,000 buildings in particular are facilities used by vulnerable groups such as children and the elderly. Thus, activation of green remodeling projects has been required. Accordingly, many local governments are participating in the improvement of living environments for vulnerable groups, such as by undertaking the design of about 790 green remodeling cases regarding aging public buildings for vulnerable groups under the current 2020 Green Remodeling Project for Public Buildings (total project cost of KRW 340 billion) among the projects covered by the 3rd supplementary budget [5].
2.3. Applied Technologies Trends in Green Remodeling of Aging Buildings in Europe and the United States
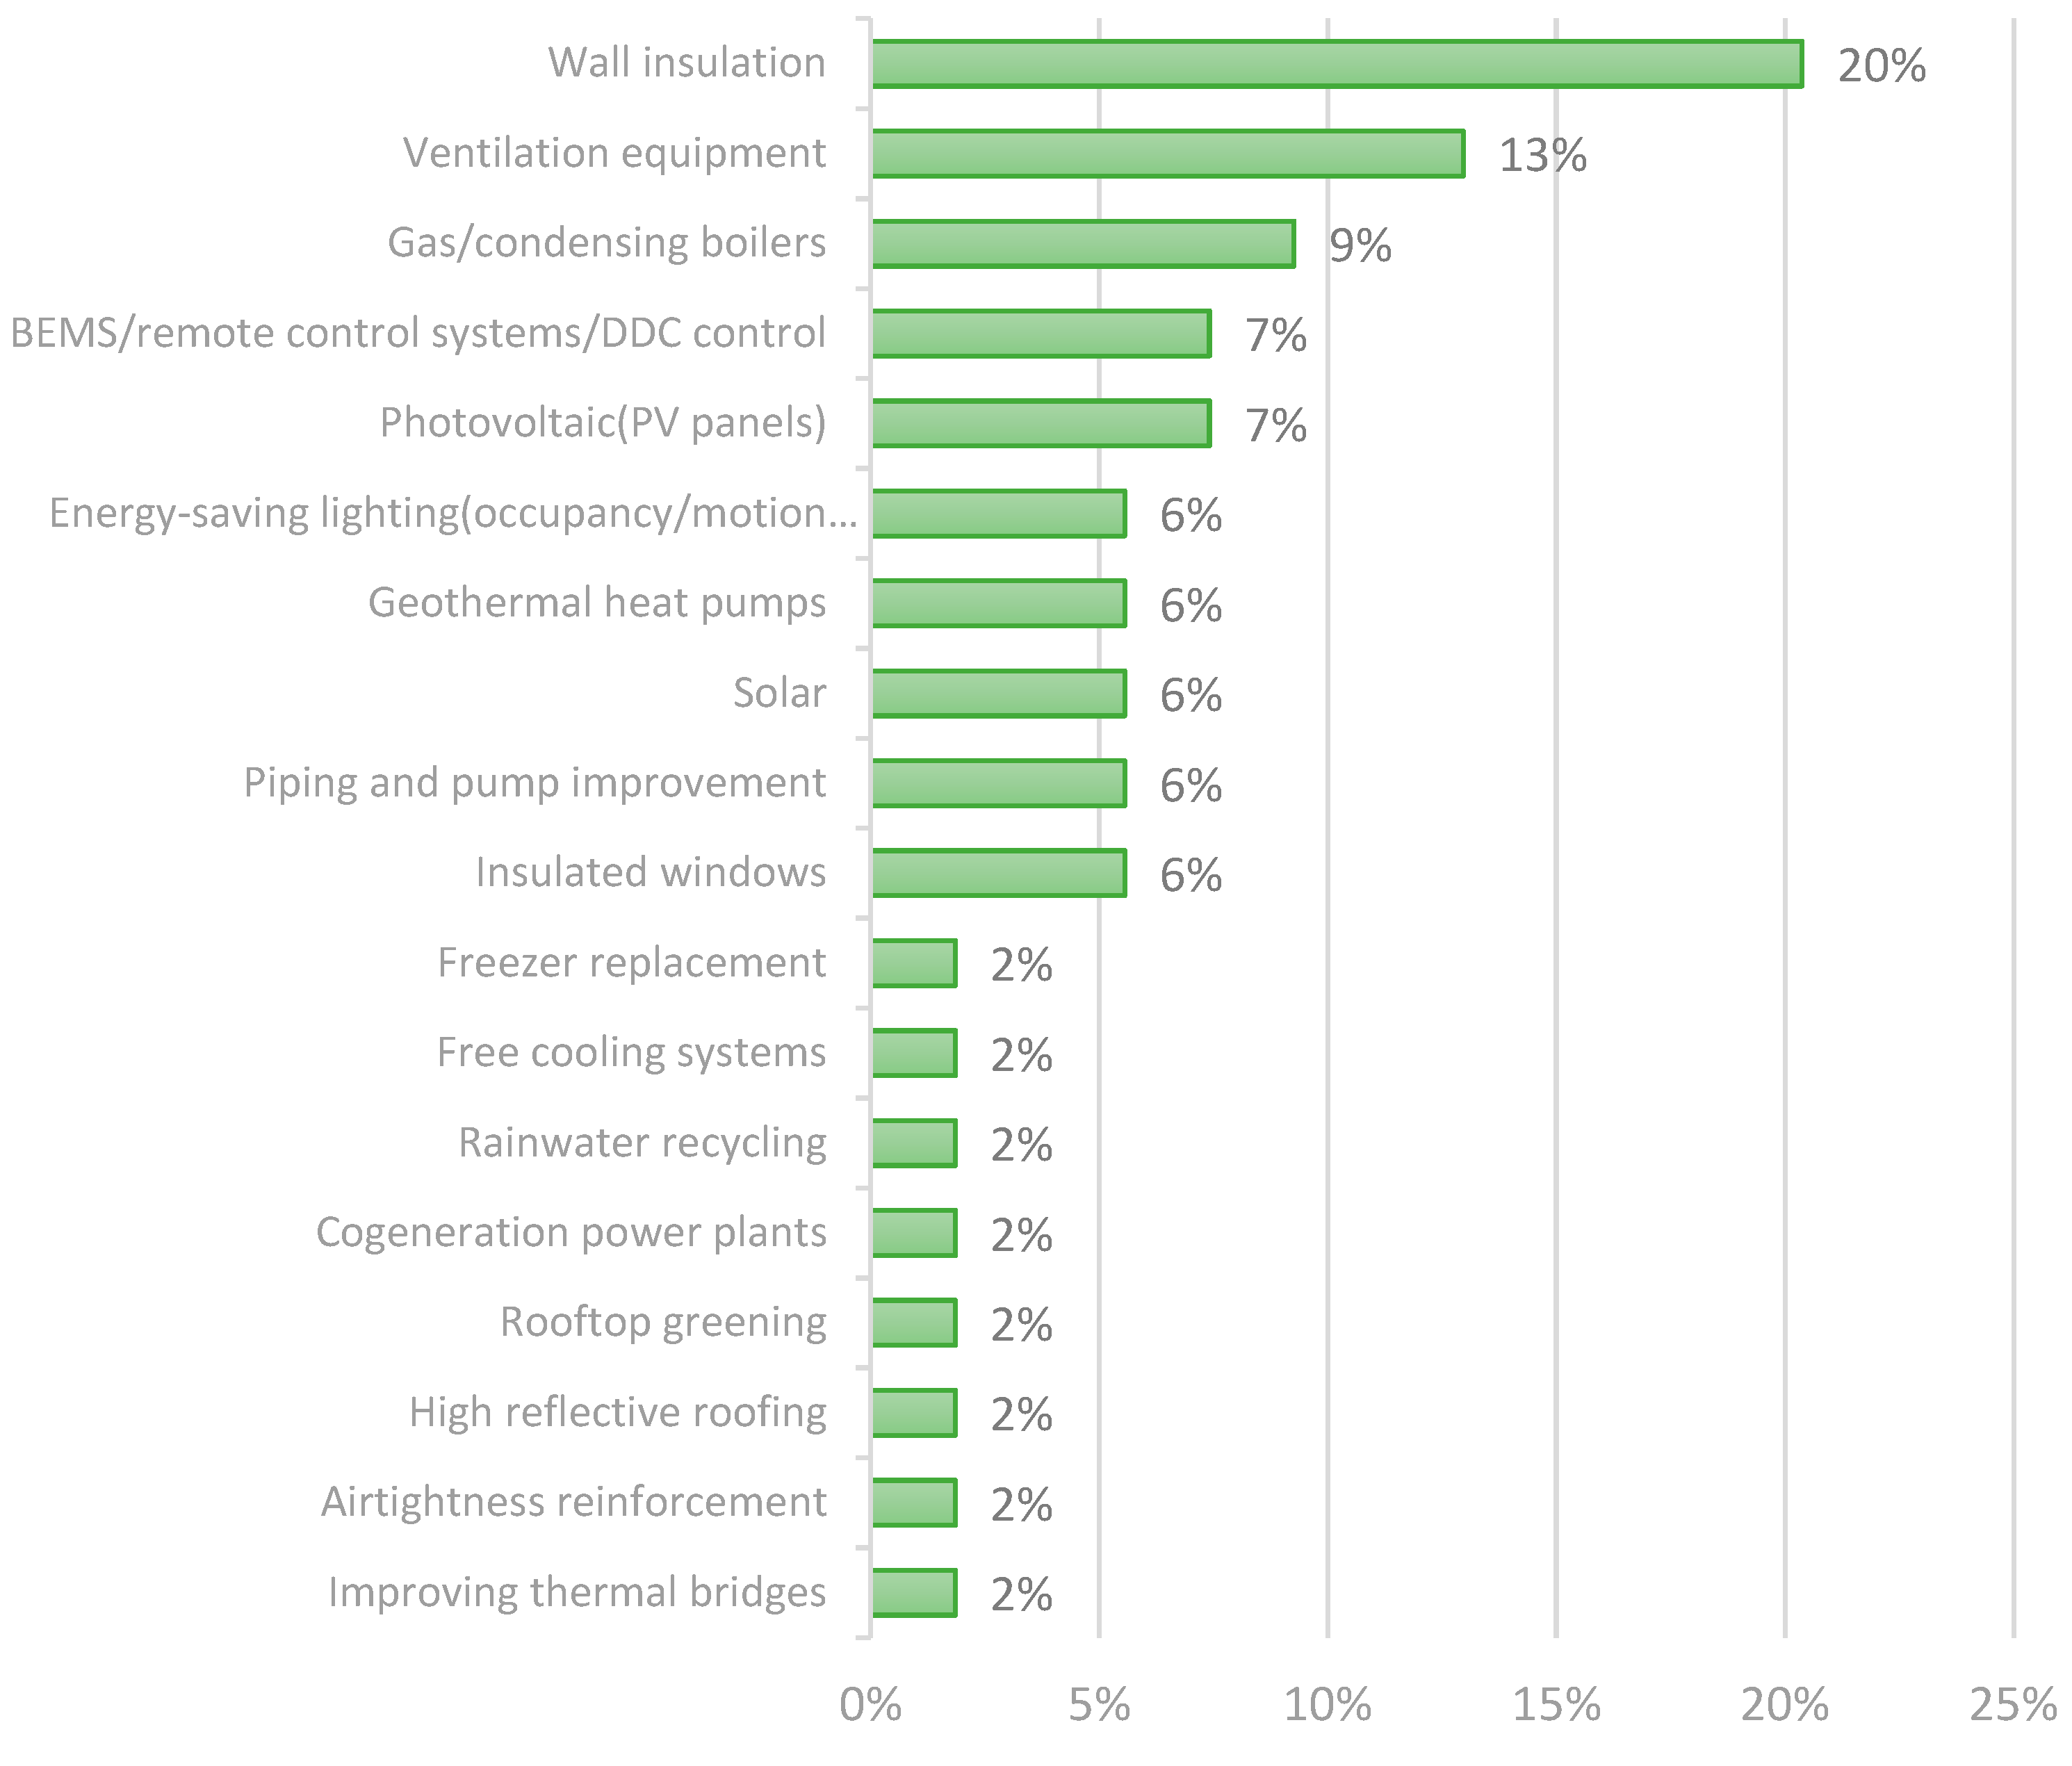
As for the technical elements of green remodeling used in urban regeneration cases in Europe and the United States, exterior wall insulation, boiler installation, and piping construction were carried out for remodeling in each residential complex, whereas exterior wall insulation, ventilation equipment, and new and renewable energy (solar, photovoltaic, geothermal, etc.) facilities were applied for remodeling in each small-scale complex, among overseas urban regeneration cases such as exterior wall insulation, window insulation, rooftop greening, boiler installation, etc. As for the percentage of each technical element of green remodeling, the parts related to wall insulation accounted for 20%, the largest proportion, and the parts related to ventilation equipment represented a large proportion of 13%. Wall insulation was applied in all the cases observed, and ventilation equipment was applied in more than half of the cases. It is summarized in Table 1 and Figure 3.
2.4. Applied Technologies Trends in Green Remodeling of Aging Buildings in South Korea
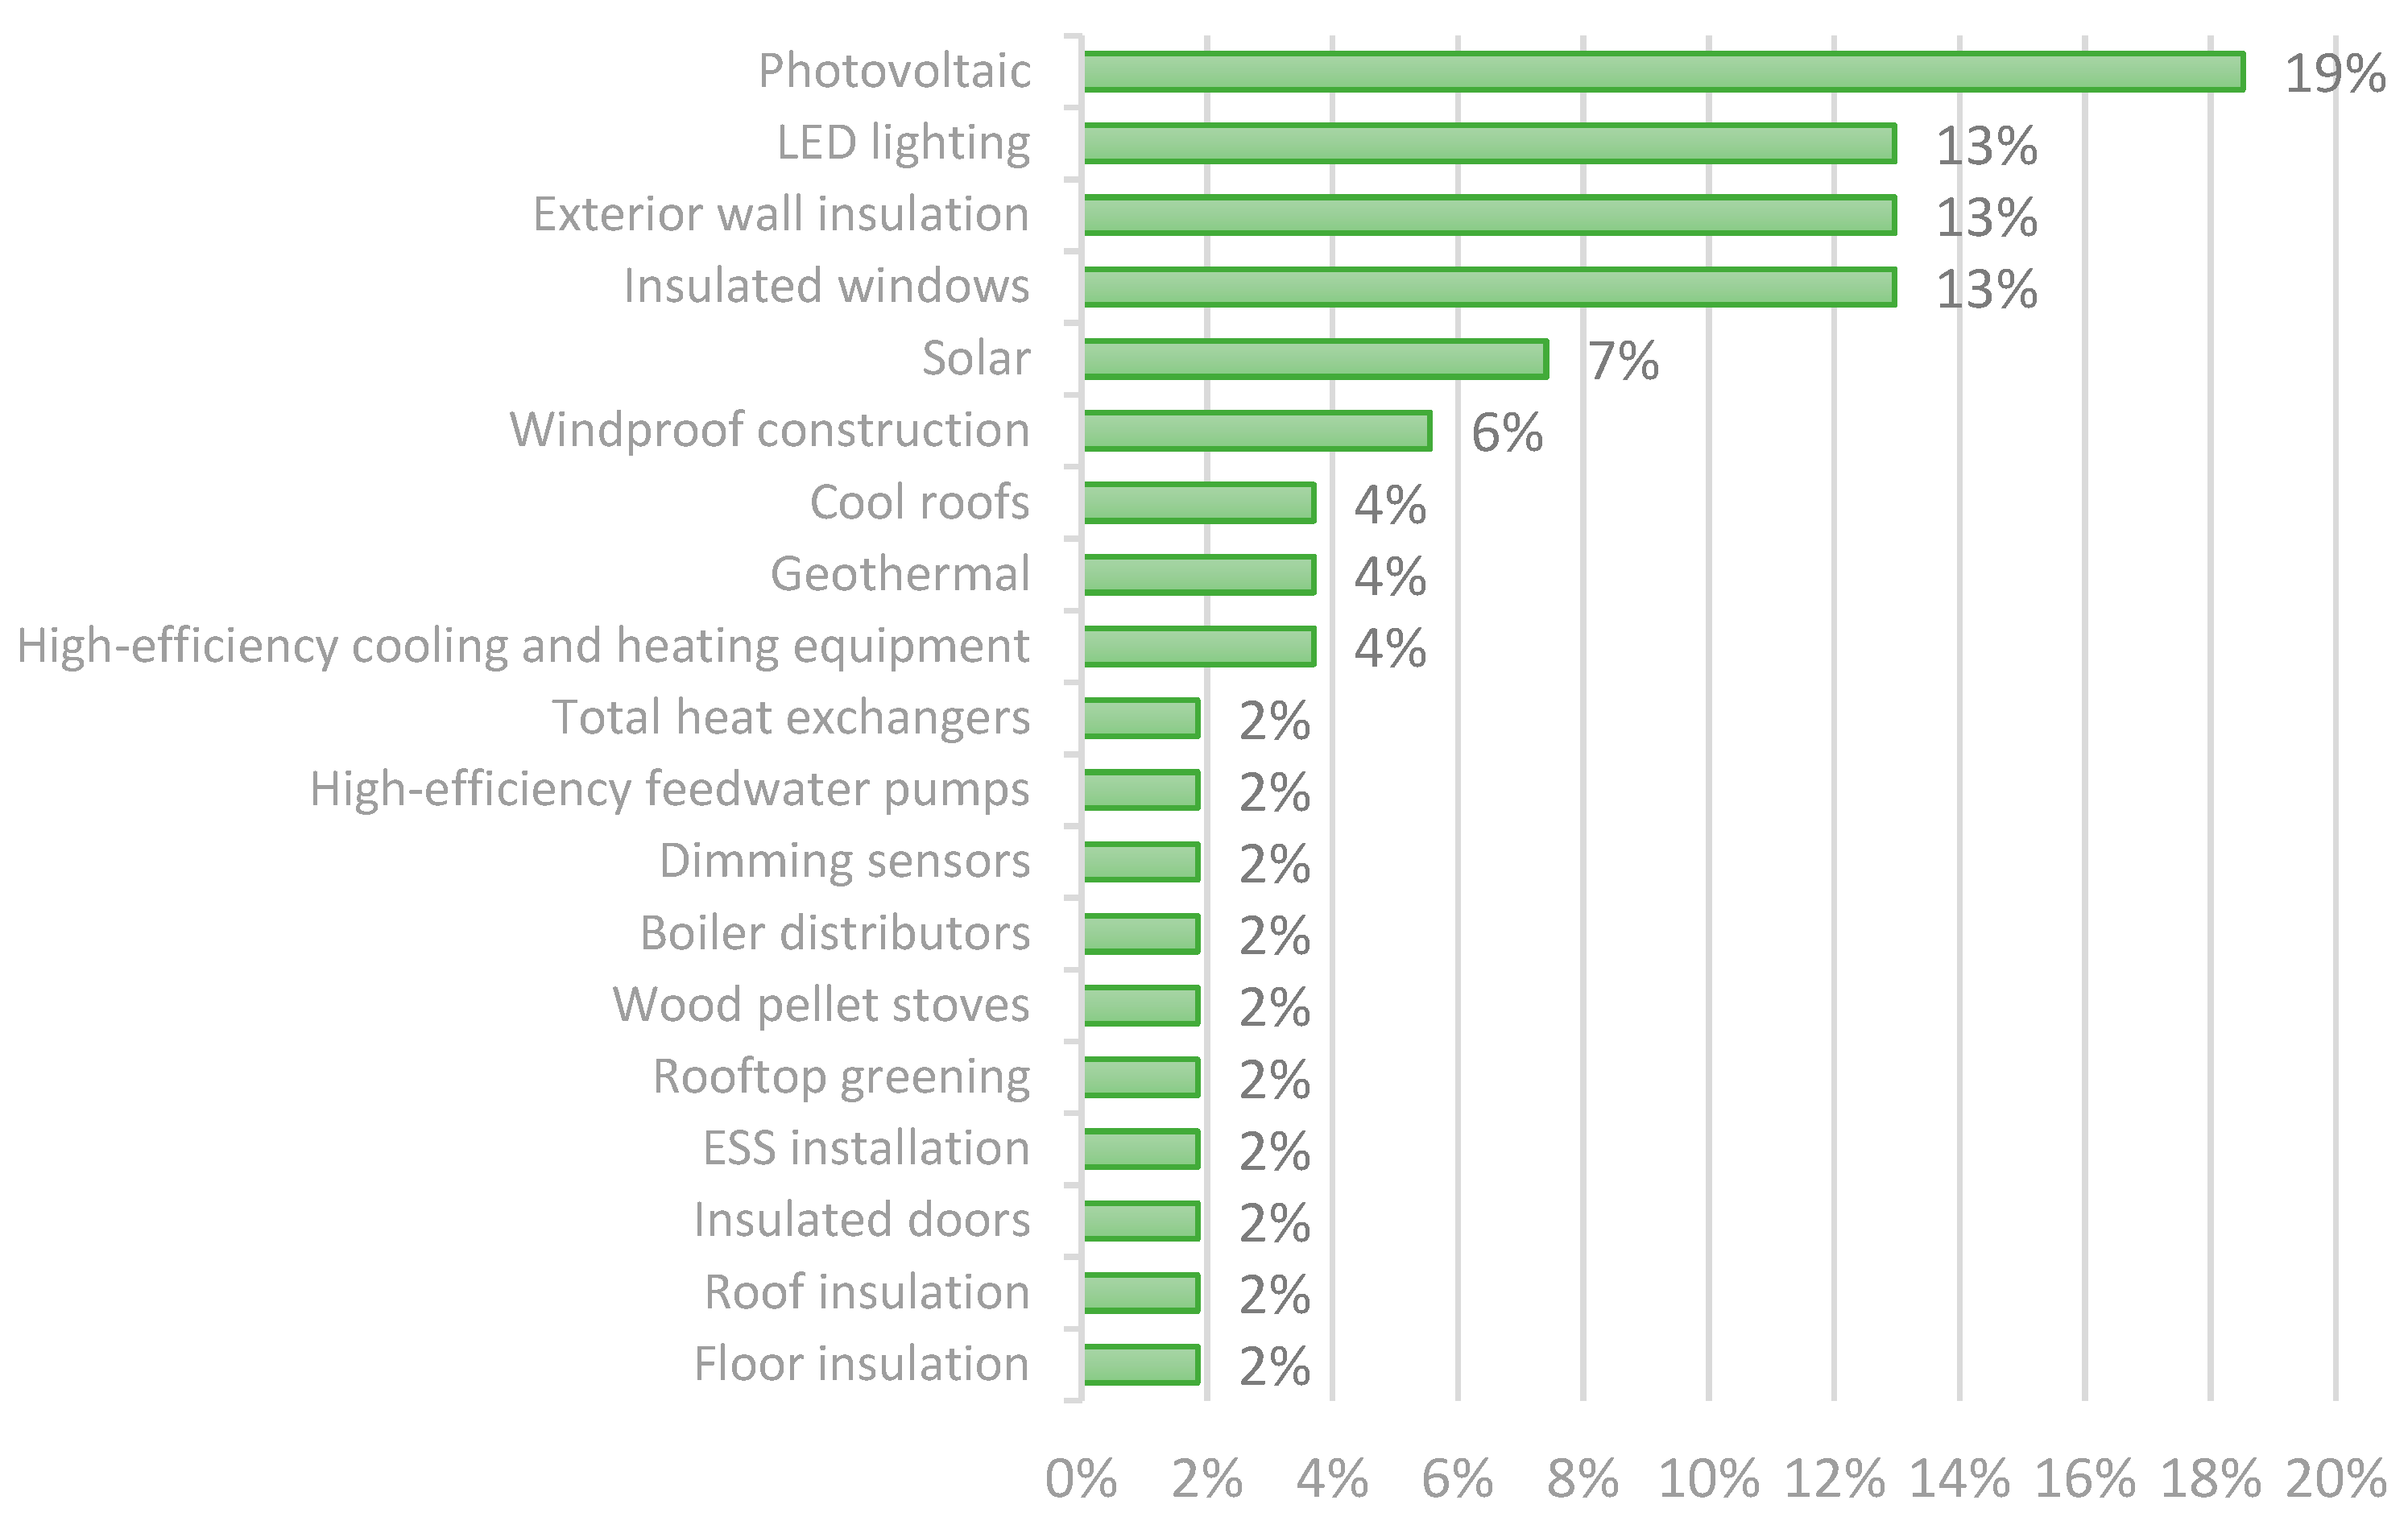
This study investigated the main technical elements of green remodeling for aging buildings in urban regeneration areas in Korea and the technical elements of improvement corresponding to green remodeling among the support projects implemented by the state in favor of aging buildings for urban regeneration. The investigated main technical elements of green remodeling for aging buildings were cool roofs, rooftop waterproofing, window replacement and exterior wall insulation on the energy side, and reinforcement of carbon fiber sheets and steel braces on the structure side. The national support projects implemented in favor of aging buildings for urban regeneration include the Place Renewal Project, the Village Happiness Project, the Seoul-type New Deal Alley Housing Appearance Project, and the Gyeonggi-do Urban Regeneration Priming Water Project.
Window replacement and exterior wall insulation are essential technologies for green remodeling. Depending on the project, such technologies as cooling and heating equipment replacement, rooftop repair, and seismic reinforcement are also used. In the case of cool roofs, the Ministry of Environment and local governments are actively pushing for them not only to reduce indoor temperatures but also to mitigate heat islands. It is summarized in Table 2 and Figure 4.
2.5. Research Trends Related to the Value Assessment Criteria Based on Green Remodeling of Public Buildings
Target public buildings for government-led green remodeling have been designated and items to be improved are limited. However, there are no prescribed criteria for target buildings for green remodeling or the timing of its implementation when it is expanded to the private sector. Thus, it is necessary for you to evaluate the feasibility of remodeling a building, etc. based on your own judgment in such case. In order to determine the possibility of remodeling aging buildings, AI-based rapid automated building condition assessment technologies are expected to be utilized throughout the course of remodeling aging buildings. However, existing research cases show that such methods as vision assessment techniques are limited in making an integrated judgment of the degree of aging of buildings. In addition, research cases for evaluating and predicting energy performance still remain inclined to use existing research methods such as multiple regression analysis. It is summarized in Table 3.
3. Analysis of Energy Usage Data Patterns of Public Buildings and Correlation Analysis of Major Strategies of Green Remodeling
3.1. Analysis of Energy Usage Patterns of Public Buildings in Korea
3.1.1. Overview of Public Building Data Collection
Monthly electricity and gas consumption in domestic public institutions from 2015 to 2019 was collected. The data on public buildings are available on the public institution data portal (https://www.data.go.kr/ (accessed on 12 January 2021), and data were collected using the crawling technique by providing an open API (Application Program Interface) [21]. The Python code crawled using the API is shown in Appendix A.
As can be seen in Table 4 and Figure 5 below, it was found that the highest proportion of the public buildings in the collected data were used as educational facilities, accounting for 63%. Second, public service facilities accounted for 22% of the total collected data.
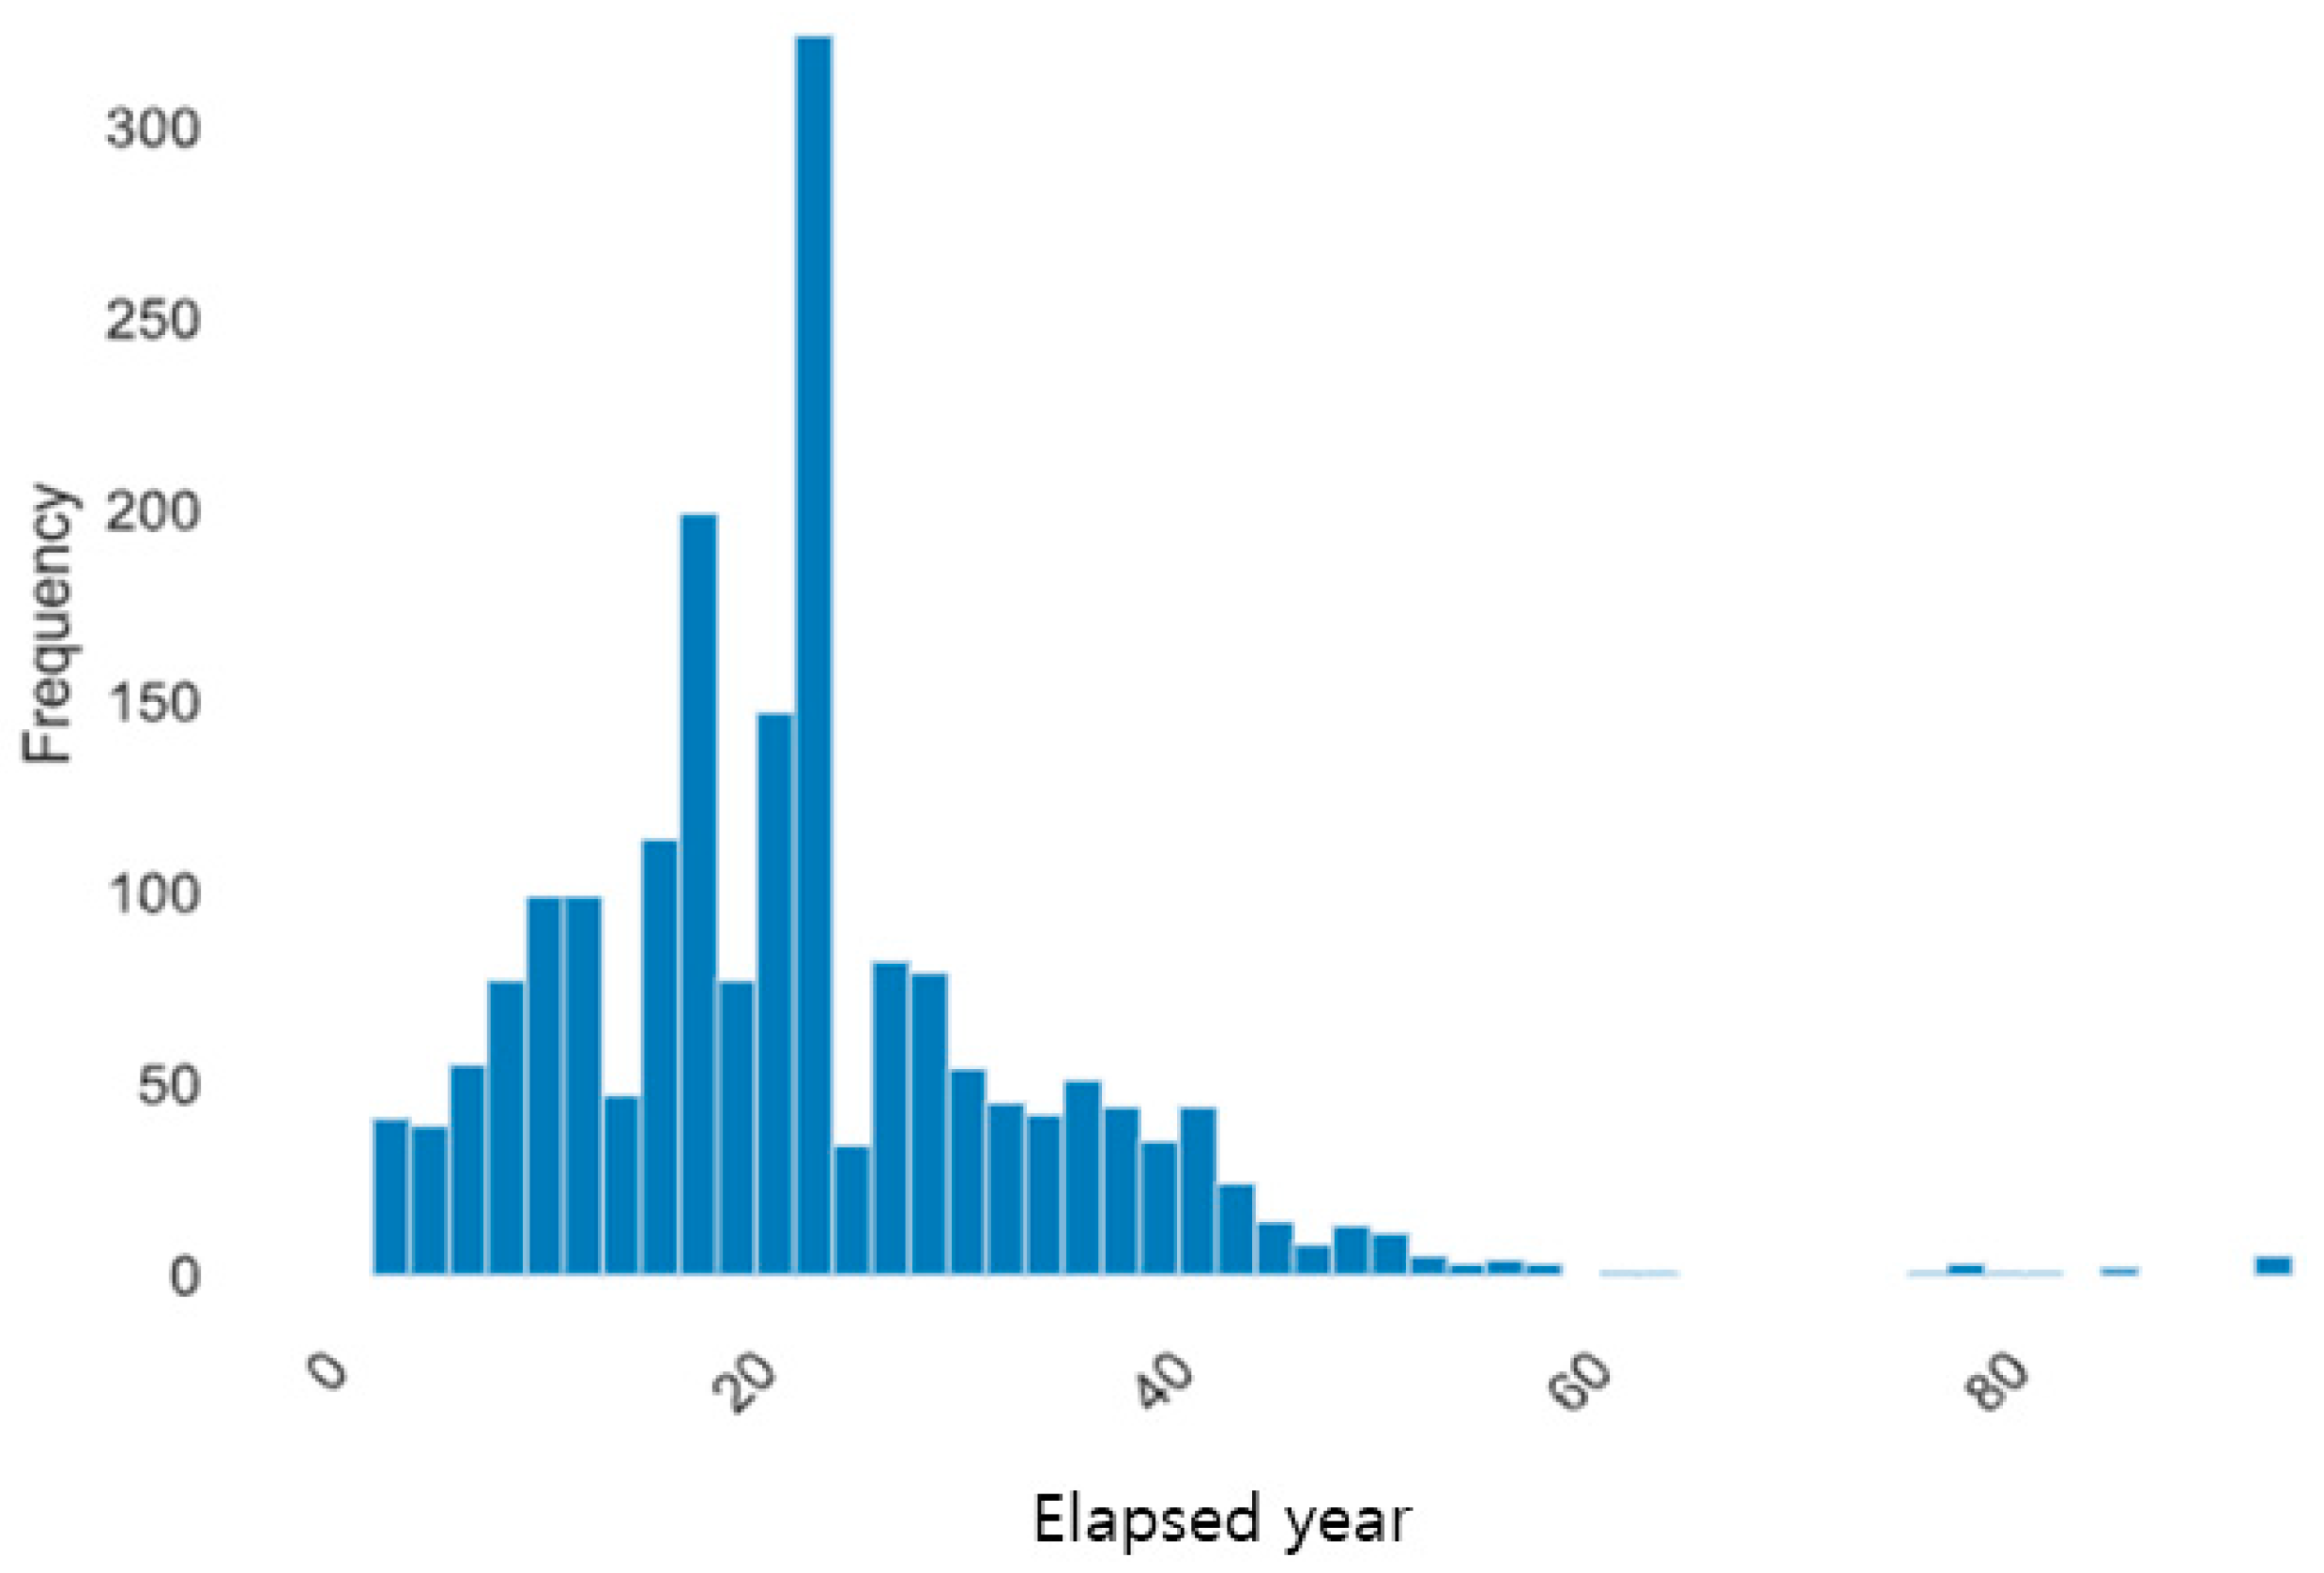
As shown in Table 5 below, the periods of use of the public buildings in the data collected using the crawling technique were found to have a median value of 22 years, a minimum value of 2 years, and a maximum value of 94 years. As shown in the histogram of the numbers of years of use, the number of buildings built before 2000 and aged 20 years or so was found to be high according to information on the completion and use of public buildings in Korea.
3.1.2. Establishment of a ‘Vintage Group’ for Each Revision Year for the Legal Minimum Insulation Performance Criteria in the Energy Saving Design Standards
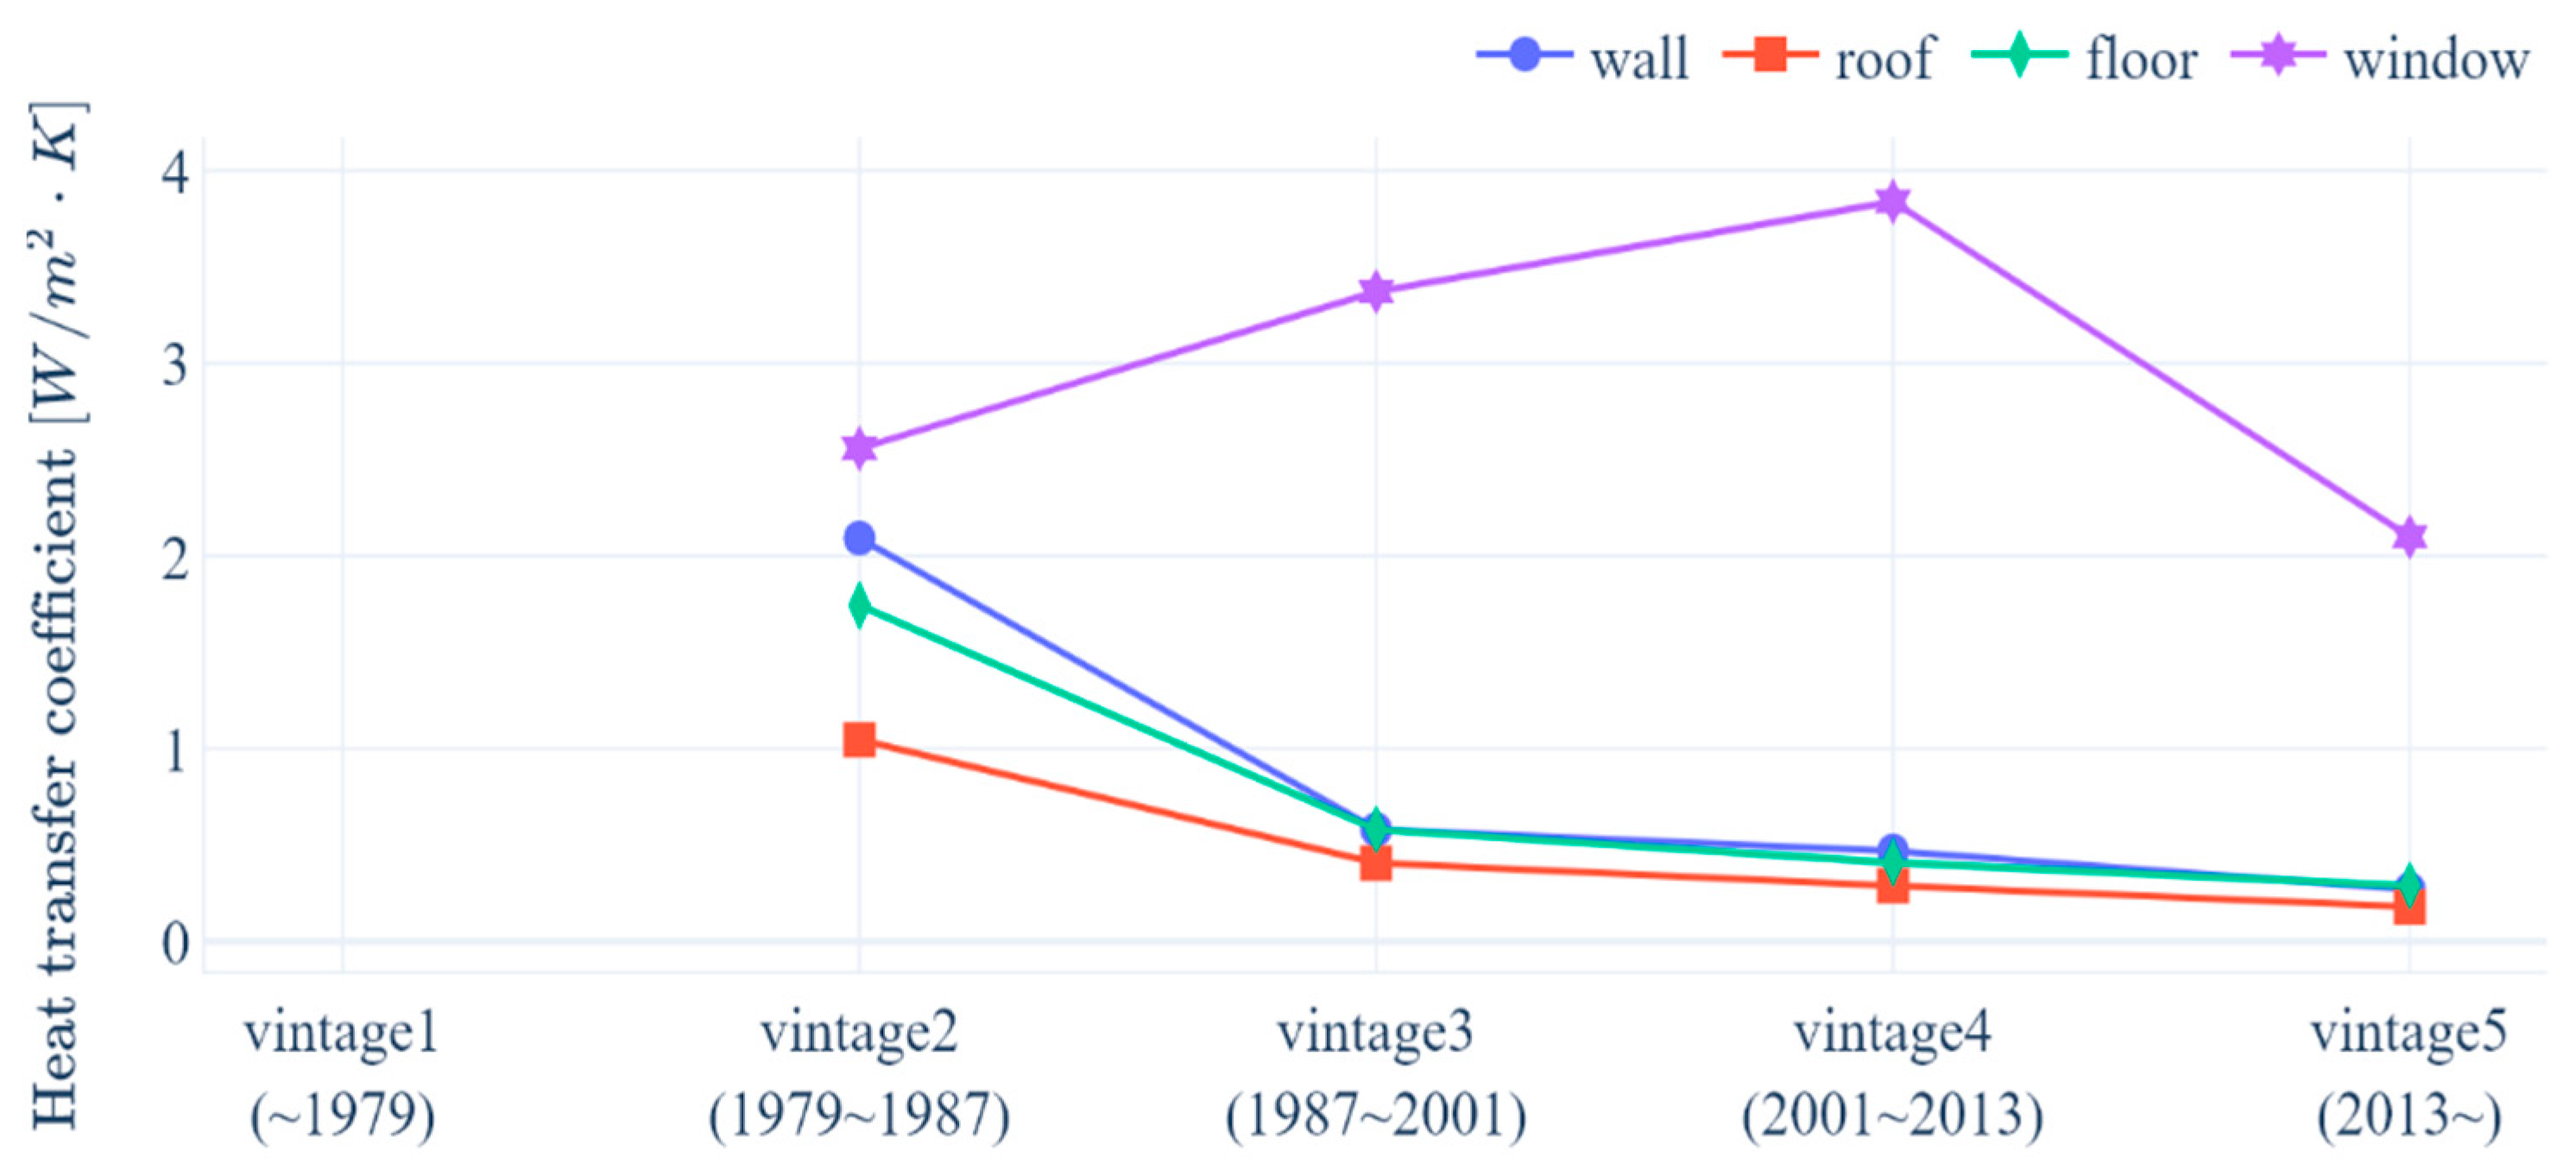
The Energy Saving Design Standards are currently in force under the current legal system in the field of architecture. The building data collected based on the revision year for the insulation performance standards in the Energy Saving Design Standards were clustered as shown in Table 6 [22]. Due to the oil crisis that occurred in the 1970s, the government first enacted thermal insulation standards in September 1979 with the aim of reducing energy consumption in buildings. Subsequently, buildings can be classified into buildings before 1979, buildings before 1987, buildings before 2001, and buildings before 2013 based on the time when the Energy Saving Design Standards were greatly strengthened in 2013. By analyzing the characteristics of each group of buildings clustered according to this classification, it is possible to grasp the energy performance characteristics that an existing building has according to the year of its completion. As an example, it can be ascertained that the performance standards for windows were strengthened by 28% in 2008 in comparison with the previous standards, and by 30% in 2011 and 2013 in comparison with the standards immediately before the revision.
The insulation performance standards in the Energy Saving Design Standards require that the minimum insulation performance value should be designated by law and applied when designing not only public buildings but also private buildings. Therefore, this can serve as a criterion for estimating the legal values for the envelope performance of each building based on the year of its completion. By examining the 1928 public building data collected in this study by cluster, it can be seen that vintage group 3 built between 1987 and 2001 accounts for the largest proportion with 46.6%, as shown in the vintage group proportions in Table 7 and the insulation standards for each building part in vintage groups in Figure 6.
3.1.3. Amounts of Energy Usage by Year in Each Vintage Group
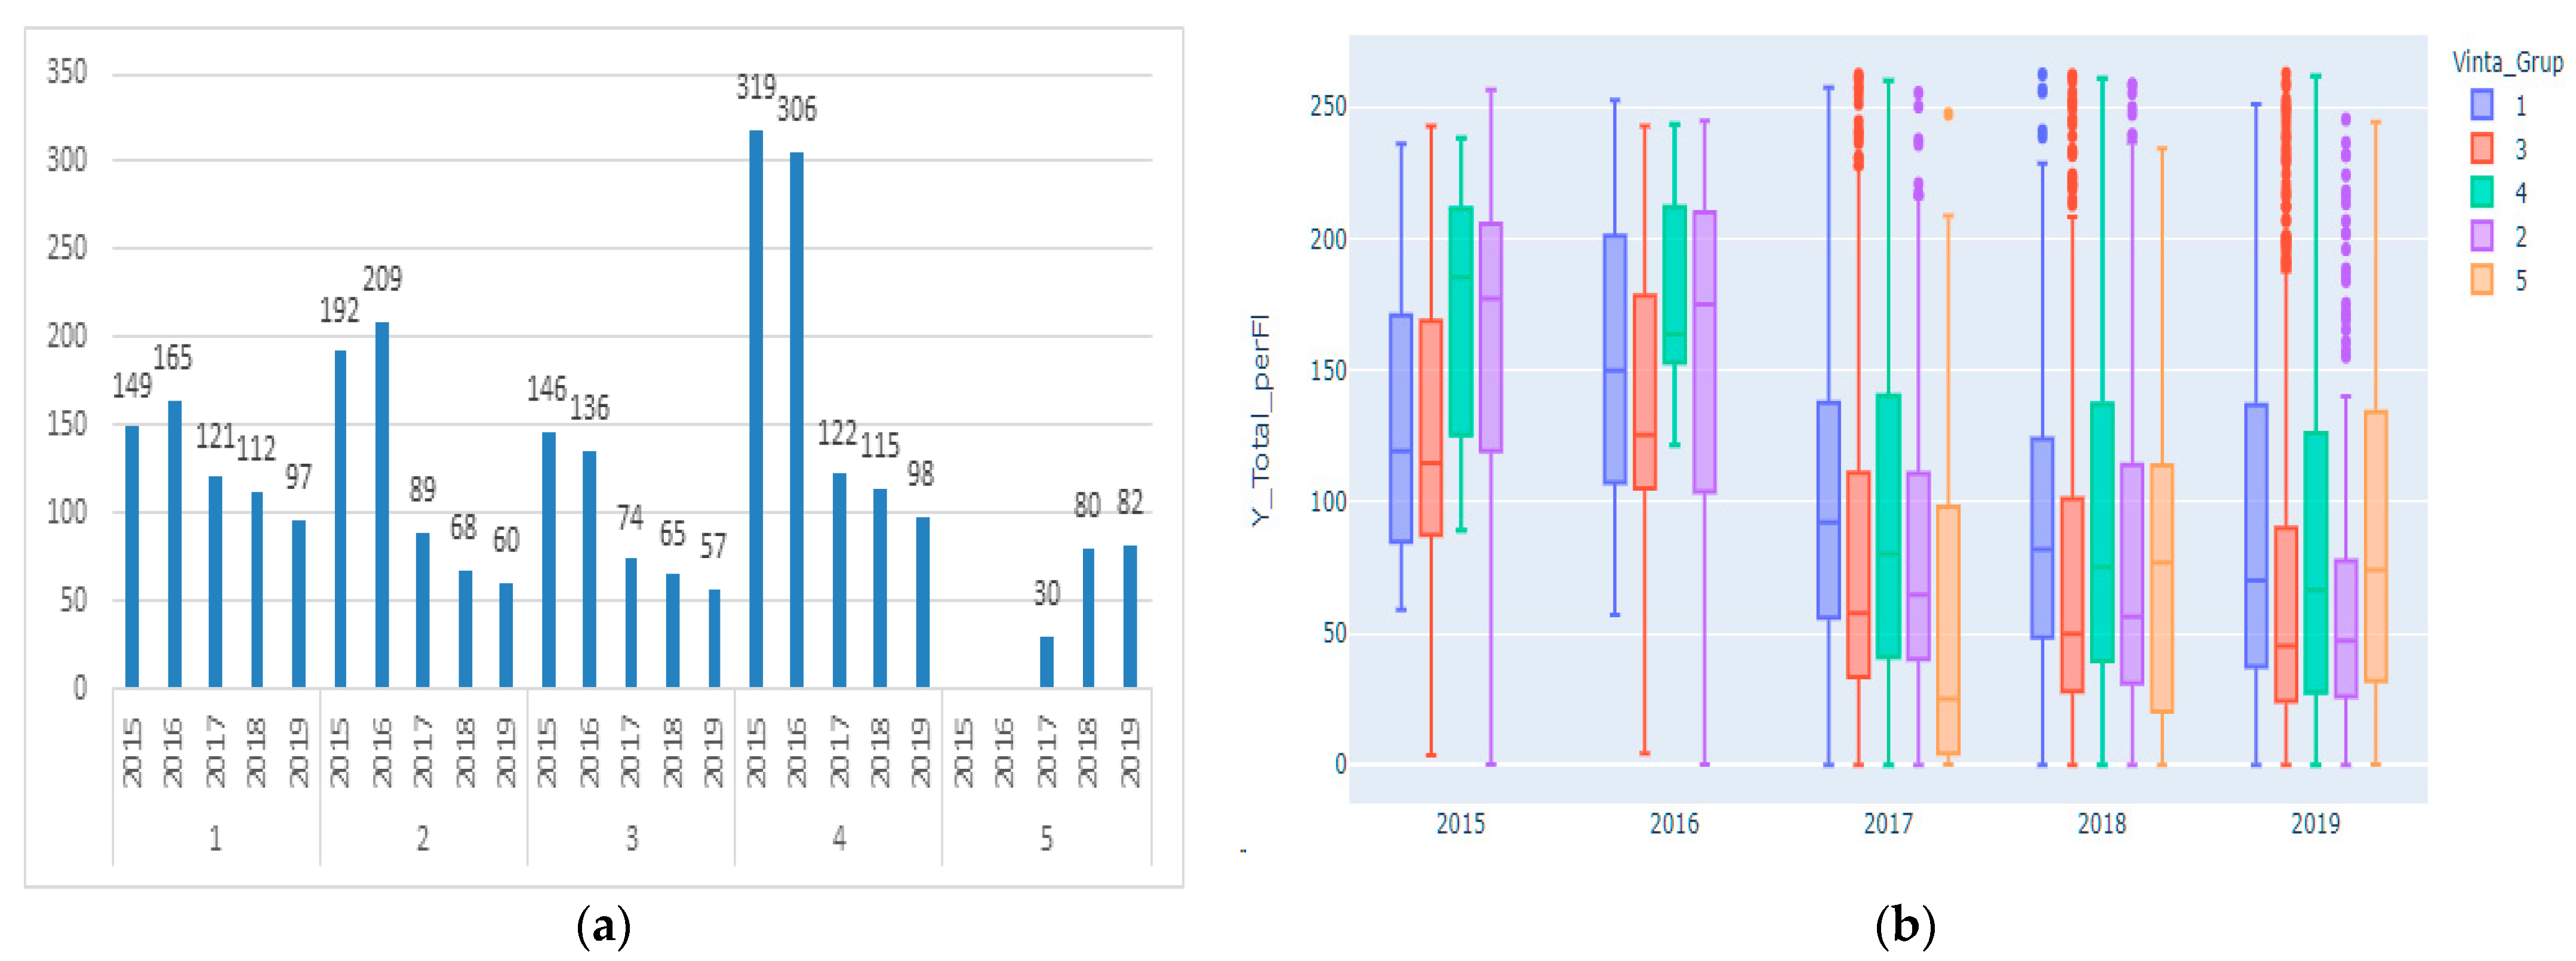
The amounts of energy usage by year in each vintage group were analyzed as shown in Table 8 below. No difference in the annual energy usage per unit area in each vintage group showed the characteristics of any significant change. However, the energy usage in public buildings has showed a trend of declining sharply in all vintage groups since 2017. The characteristics of such a trend can be seen not simply as energy saving but as a result of energy saving practiced by public building users and managers in compliance with the energy saving campaign based on the government’s policy stance [23,24].
2016 recorded the highest temperatures for the Republic of Korea in 22 years. The minimum reserve rate for stable power supply dropped to 15% or even to 6%, and the Ministry of Trade, Industry and Energy launched a campaign asking the public to refrain from using air conditioning to prevent a blackout [25].
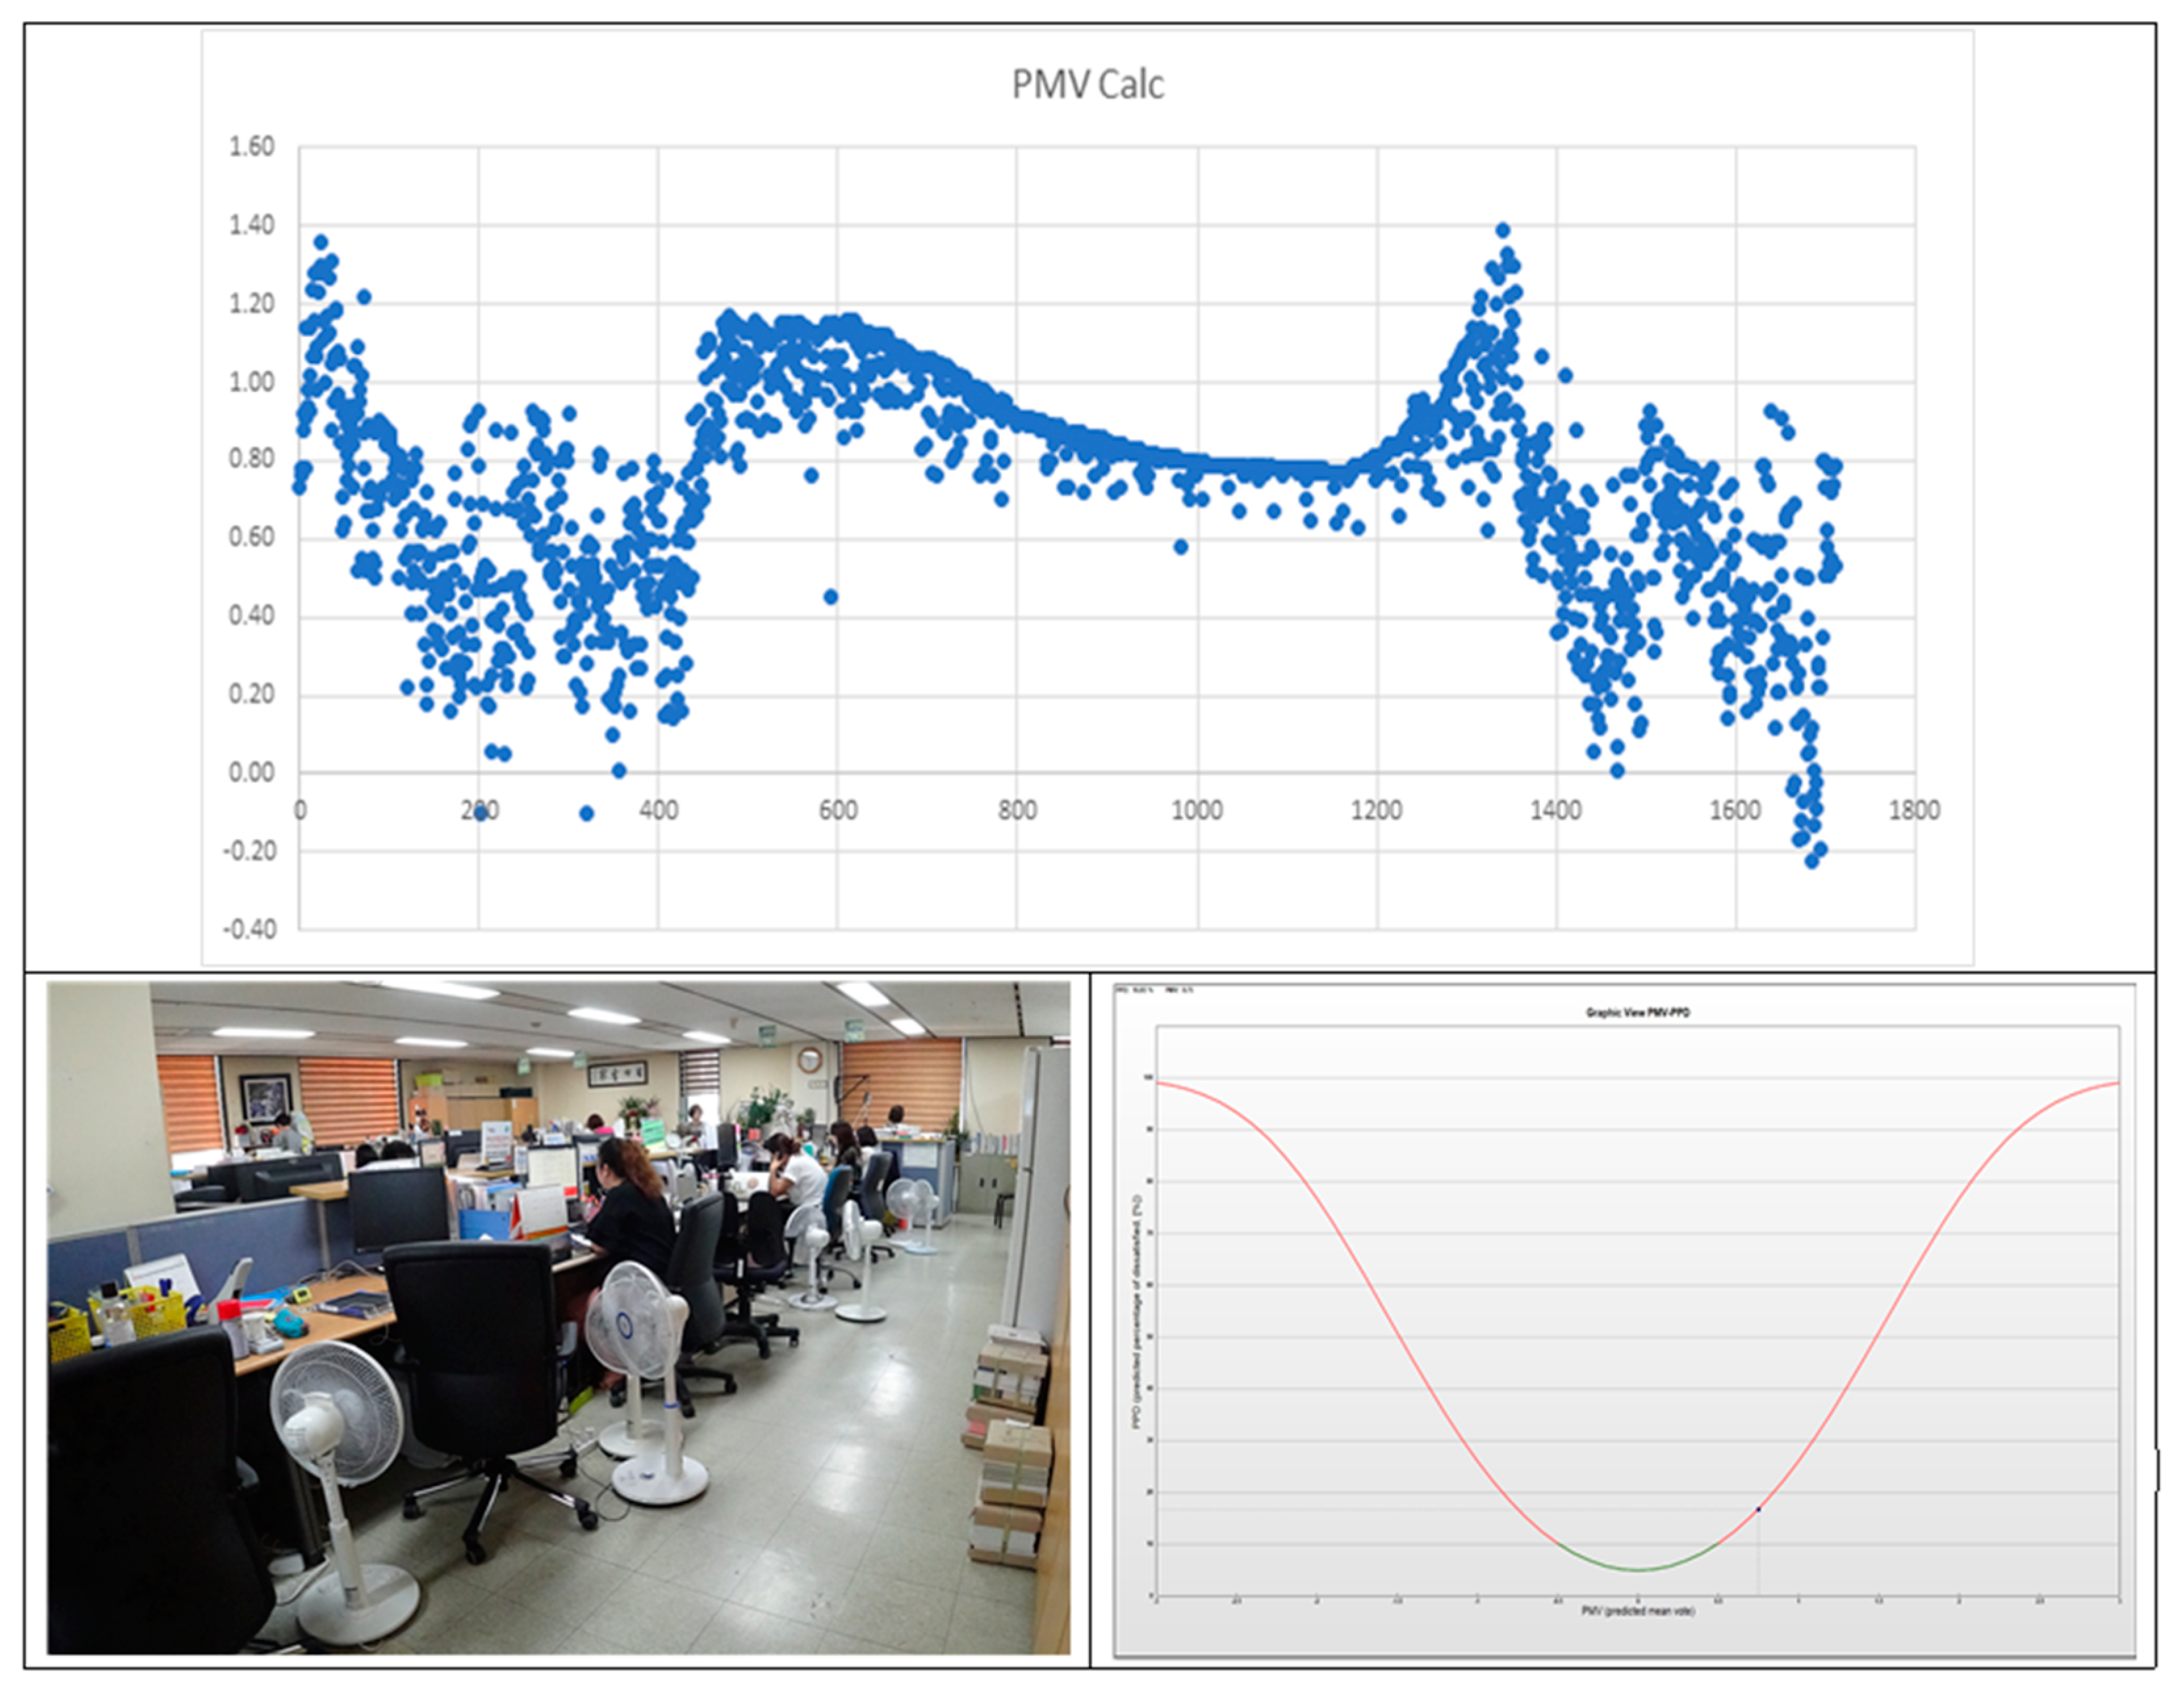
It can be ascertained from the result of implementing a campaign to refrain from using air conditioning to prevent a blackout that there is a possibility of the lost value being greater as compared to the value of reducing electricity consumption. As shown in Figure 7 and Figure 8 as a result of the campaign to refrain from using air conditioning, the occupants of public buildings used individual electric fans instead. At the time of on-site measurement surveys, it was also confirmed by PMV measurements that indoor thermal environments were very hot and outside the comfortable range [26].
The occupants, i.e., main users of public buildings, are public officials who mainly provide services for the convenience of citizens. Other users of public buildings are an unspecified number of citizens. An energy saving plan that does not take into account the indoor thermal environment of a building may result in the loss of its value its value as a building [27,28].
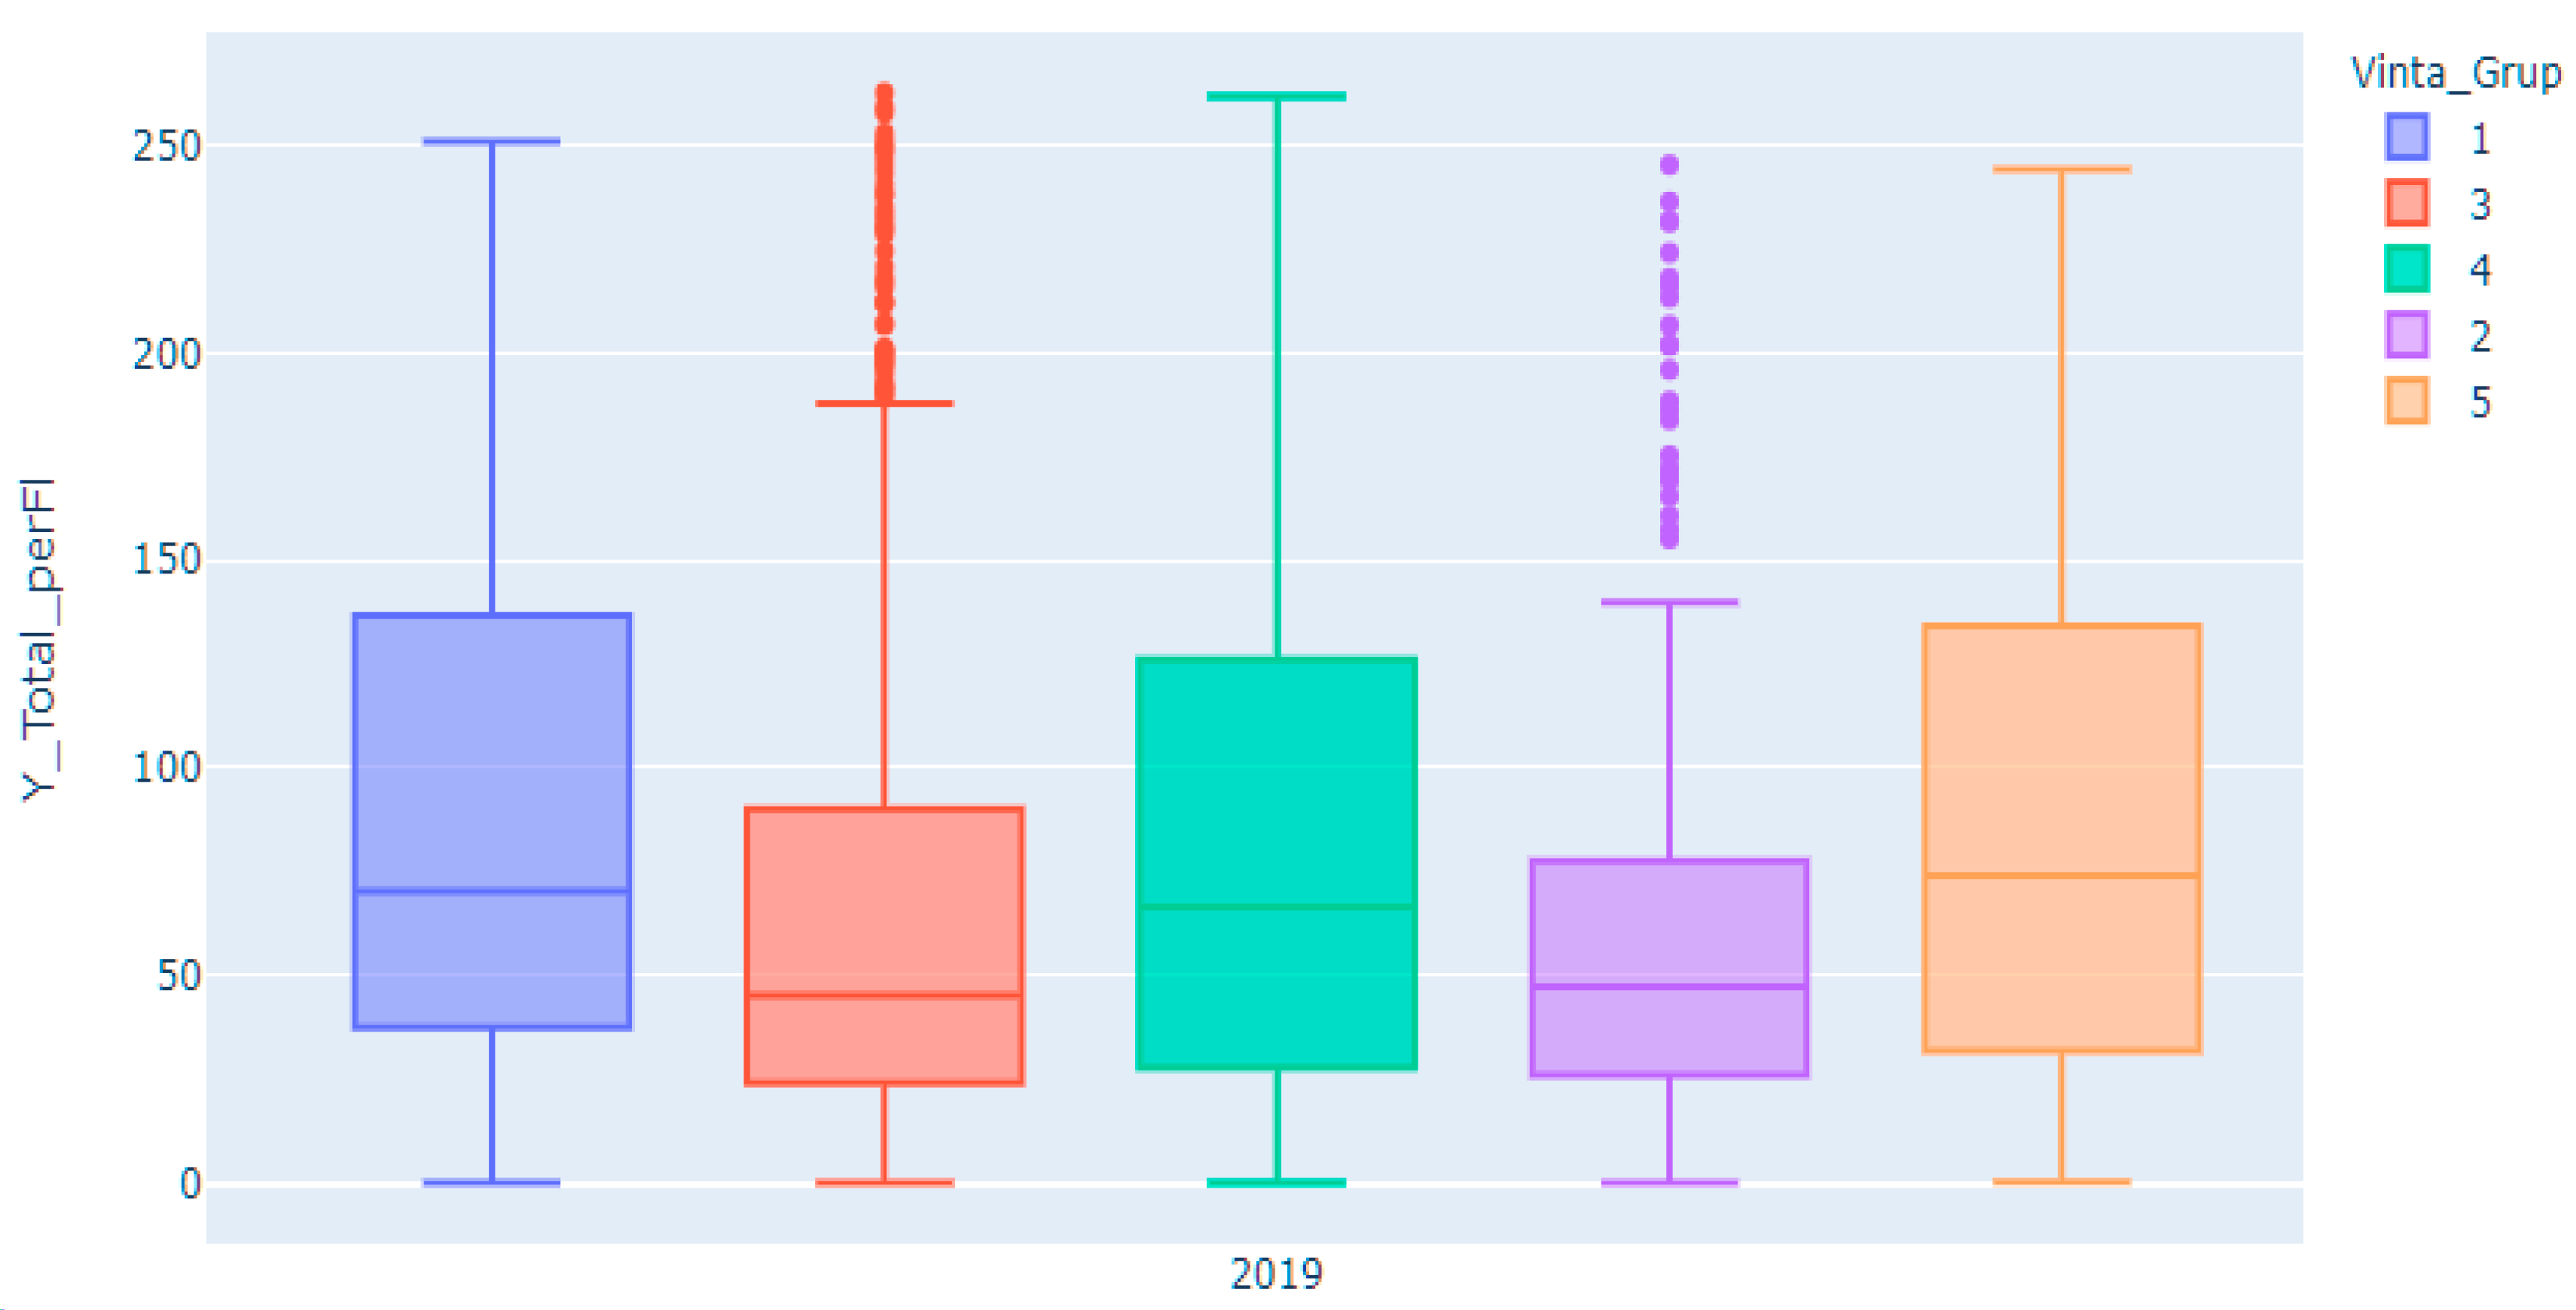
As can be seen from the box plot of annual energy consumption per unit area by vintage group in 2019 in Figure 9, no significant difference occurred in the annual energy consumption per unit area among the vintage groups with different years of completion. This demonstrates that there is a need for partial revision in setting the promotion direction for designating targets of green remodeling for the Green New Deal, which requires green remodeling of buildings with high energy consumption due to aging. The following may be one method of doing so: revising the criterion for regarding an existing building as aging from the concept that ‘it has undergone a long lapse of time’ to the concept that ‘it can no longer sustain the value of its use as a public building and has reached the end of the lifespan of its corresponding value’ [29]. If the concept as a criterion for determining the degree of aging of public buildings and designating them as targets for green remodeling is revised in such direction, it is also judged possible to increase the value of a building itself that meets its fundamental purpose in addition to improving the energy aspect of green remodeling as well as securing the validity of the selection of target buildings for green remodeling.
3.1.4. Amounts of Energy Usage by Facility Use in Each Vintage Group
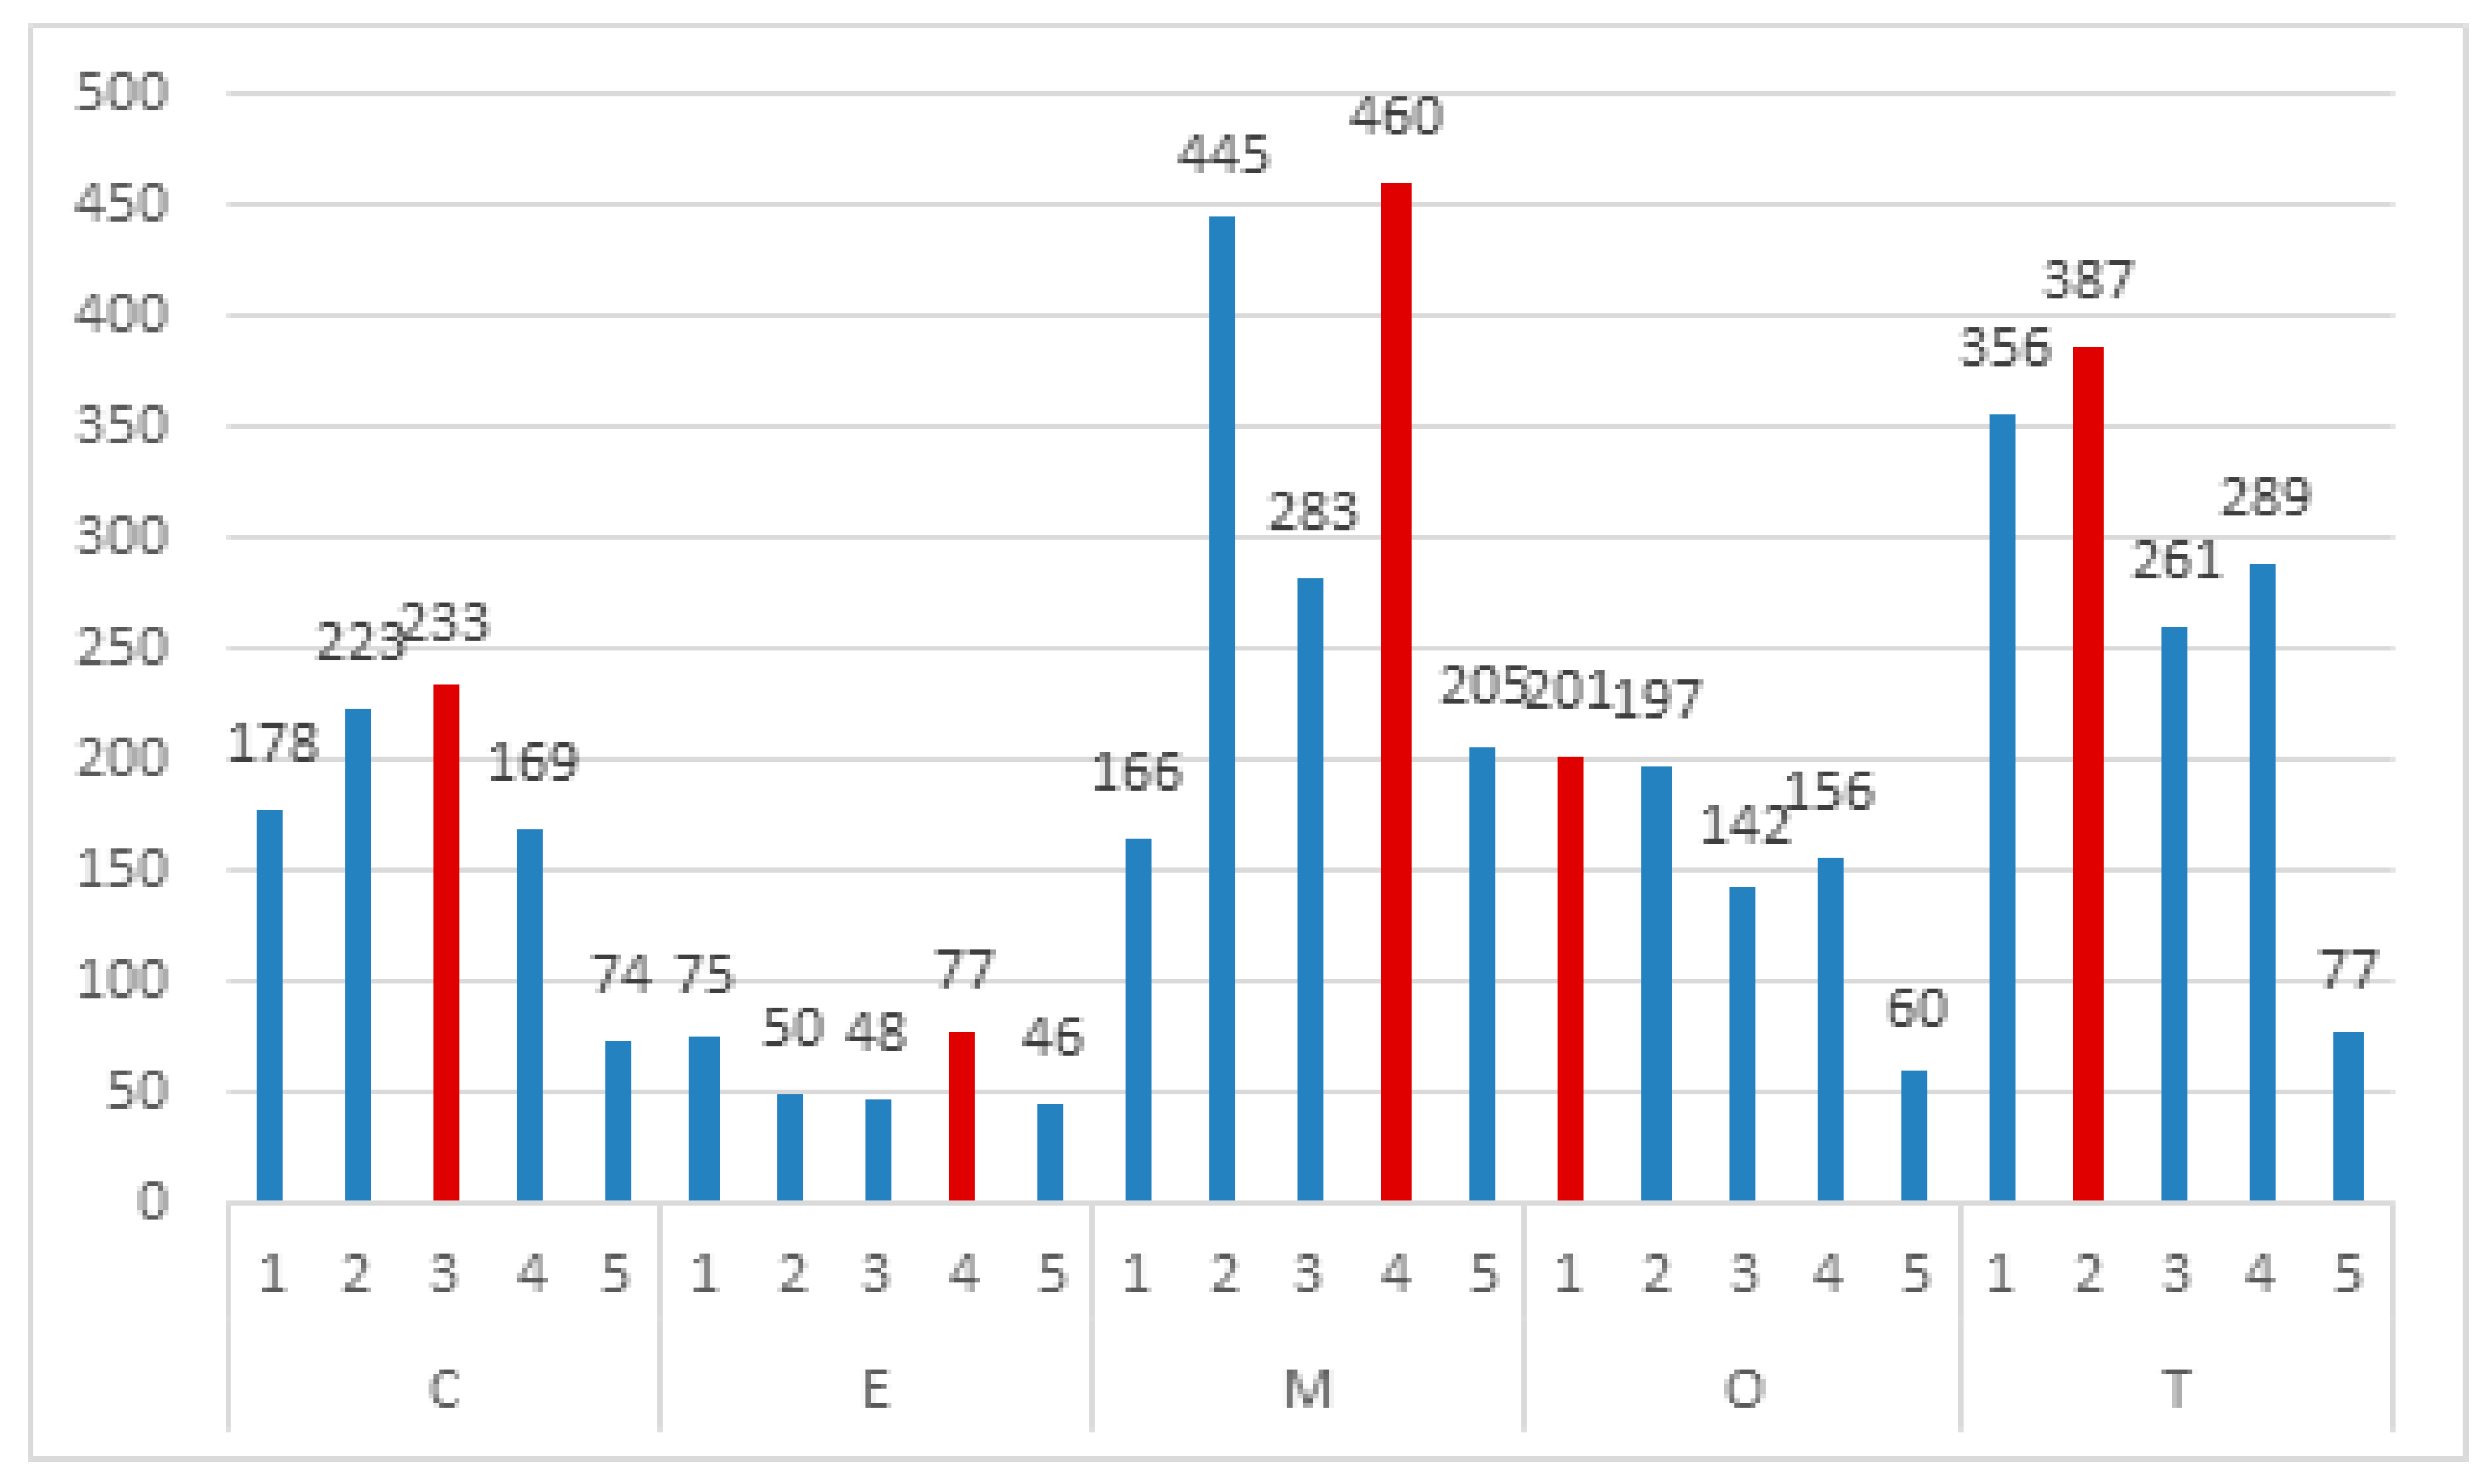
When carrying out analyses through Figure 10 and Table 9 which show the amounts of energy usage by facility use in the vintage groups, the annual energy usage per unit area was found to be the highest in Group 3 in terms of cultural facilities. It was found to be highest in Group 4 in terms of both educational and cultural facilities, and in Group 1 in terms of office facilities. As for training facilities, it was highest in Group 2.
Also, in the results of analyses carried out by classifying the vintage groups according to the classified types of use of public buildings, it was difficult to find a logical basis as a criterion for the policy that green remodeling should be performed on aging buildings that have undergone a longer lapse of time, on the grounds that they use more energy.
3.2. Analysis of the Correlation between the Major Strategic Elements of Green Remodeling and the Amount of Energy Usage
The correlation factor was explored by analyzing how much the current major strategic approaches of green remodeling and its applicable elements correlate with the actual amount of energy usage [30,31].
In general, the correlation coefficient of a sample is indicated by the letter r. When r = 1, it means that there is a complete positive linear correlation. When r = −1, it means that there is a complete negative correlation. When r = 0, it means that there is no linear correlation between the two variables. Guilford [32] and Cohen [33] present the same criteria as Table 10 by means of the absolute values of correlation coefficients. A table of the contents of 80 cases in which nominal variables were converted into ratio scales for correlation analysis was added to the Appendix B.
As a result of ascertaining the amounts of energy usage in public buildings and cases in which wall and window insulation improvements, LED replacements, and the application of new renewable energy, the major strategic elements of green remodeling, were actually carried out, the degree of negative correlation between the amount of energy usage and the major strategic elements was found to be highest in the window area ratio as a positive correlation of 0.16 among the strategic elements as shown in Table 11, but it can be seen in Table 10 that the degree of correlation represented by the numerical value ‘0.16′ is interpreted to mean ‘no correlation’.
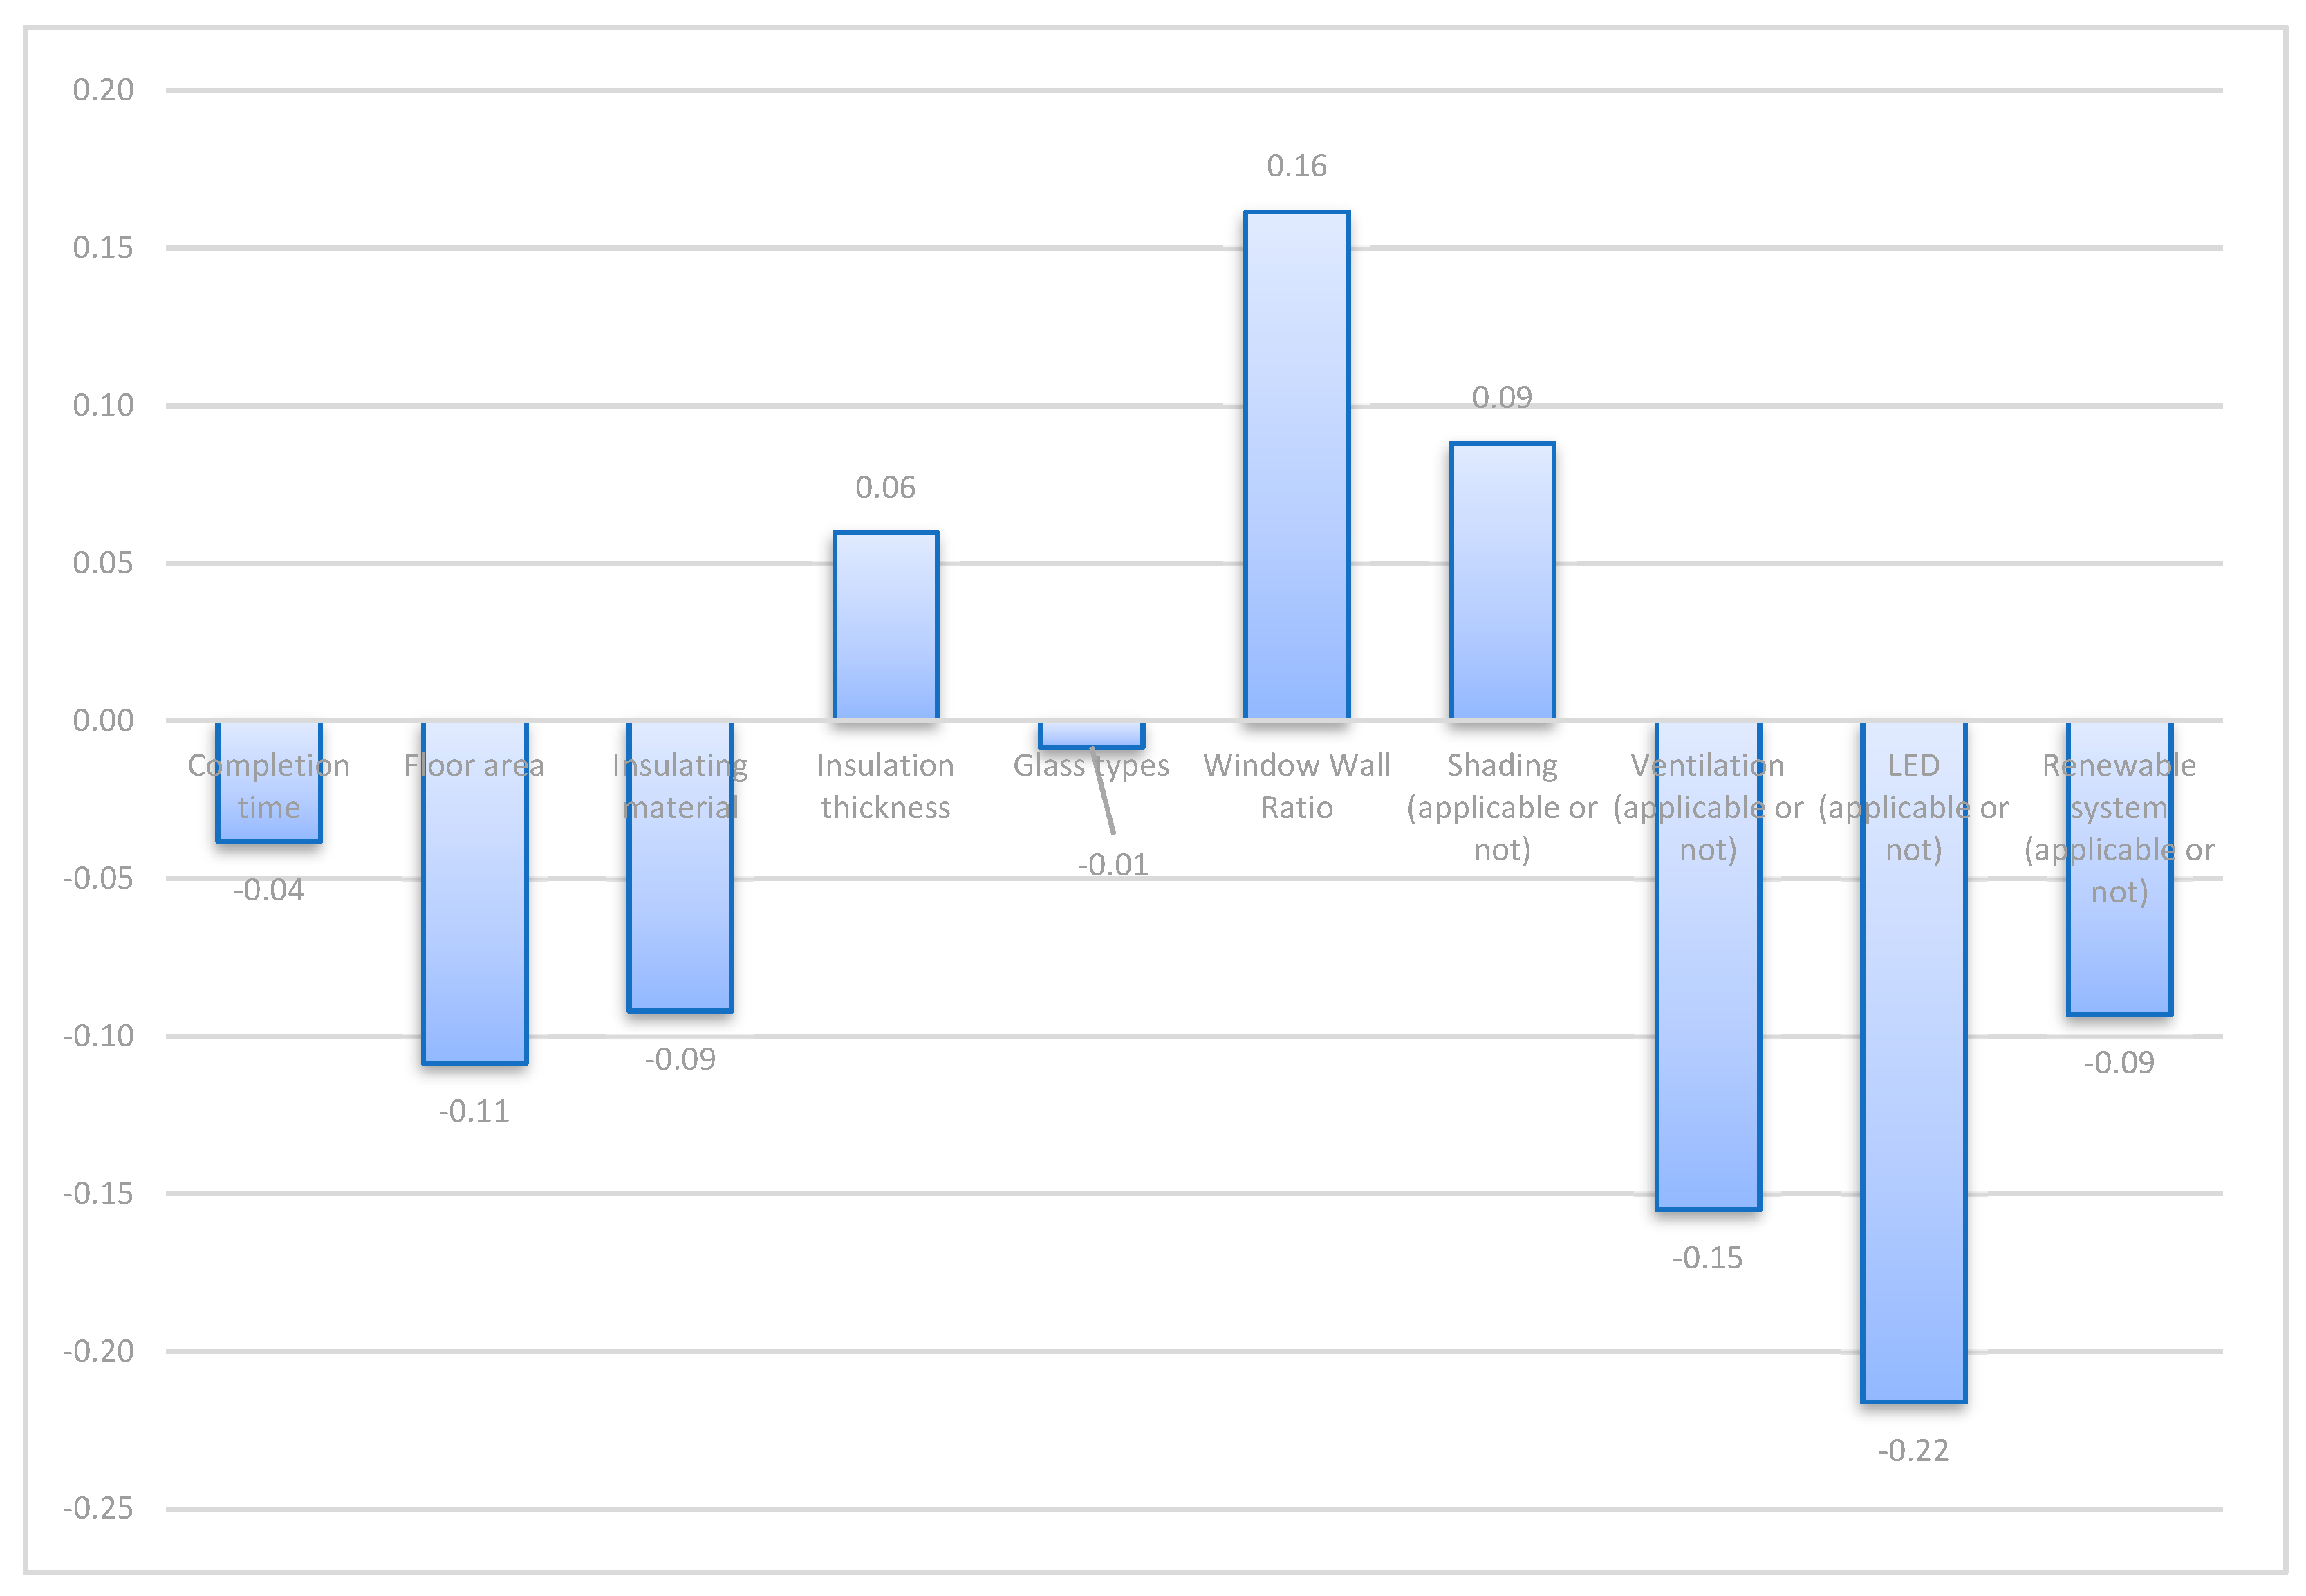
When looking at the results of comparing the correlation coefficients between the amount of energy usage and the green remodeling implementation strategy as shown in the visualization bar chart in Figure 11, it was found that there was a positive correlation of 0 to 0.2 in the window area ratio, the sun blind, and the insulation thickness, but a negative correlation was found in the amount of energy usage in buildings with a higher LED replacement rate. As for public buildings that underwent remodeling, it can be inferred that the annual amount of energy usage has either increased or that the actual amount of energy usage has not been reduced as compared to before remodeling [34].
The actual energy usage in aging existing public buildings shows a correlation of 0.06 with the insulation thickness closely linked to the outer skin insulation, whereas it’s correlation with the window area ratio and its correlation with the shade are 0.161 and 0.088 respectively, thus showing little correlation between them. Even when replacing fluorescent lights with LED lights, the correlation between the actual energy usage and them was found to be −0.216. It is likely that these figures have improved the living environment by adding energy capacity rather than by simply replacing existing equipment with high-efficiency equipment when remodeling aging building.
4. Conclusions
The green remodeling implementation strategy, one of the representative themes of the Green New Deal policy currently in force, and the methodology based on it were applied by expanding the generalized model results derived from a number of cases, and it is judged that when they are applied again to individual events (cases), there are feasibility problems.
To ensure the feasibility of the expected performance from applying the improvement elements for the performance of buildings undergoing green remodeling (improvement results in terms of the building value), it is judged necessary to clarify the scope and limitations of utilizing applicable elements for respective improvement purposes and then provide sufficient guidelines and examples regarding this, thereby setting a direction for helping to enhance the value of public buildings across the board through actual remodeling.
To demonstrate this argument, this study collected and analyzed data on the actual energy usage in public buildings, and also analyzed the relationship between the main application techniques of green remodeling and the actual amount of energy usage.
The analysis results are summarized as follows:
- (1)
- The actual energy usage in aging existing public buildings shows a correlation of 0.06 with the insulation thickness closely linked to the outer skin insulation, whereas its correlation with the window area ratio and its correlation with the shade are 0.161 and 0.088 respectively, thus showing little correlation between them. Even when replacing fluorescent lights with LED lights, the correlation between the actual energy usage and them was found to be −0.216. It is likely that these figures have improved the living environment by adding energy capacity rather than by simply replacing existing equipment with high-efficiency equipment when remodeling aging building.
- (2)
- The median actual energy usage in the group of public buildings after 2001 (Vintage Group 4) was found to be 114% higher as of 2015 and 85% higher as of 2016 than that of the group before 1979 (Vintage Group 1), which is expected to have aged the most.
- (3)
- The groups of public buildings with high energy consumption were found to differ according to their aging by use of facilities:In cultural facilities, Vintage Group 3 used 215% more energy than Vintage Group 5.In educational facilities, Vintage Group 4 used 67% more energy than Vintage Group 5.In medical facilities, Vintage Group 4 used 177% more energy than Vintage Group 1.In business facilities, Vintage Group 1 used 235% more energy than Vintage Group 5.In training facilities, Vintage Group 2 used 403% more energy than Vintage Group 5.
- (4)
- Actual energy consumption has decreased rapidly in public buildings in South Korea since 2017:The energy usage in Vintage Group 1 from 2017 to 2019 decreased by 30% from the median average in comparison with 2015 and 2016.The energy usage in Vintage Group 2 from 2017 to 2019 decreased by 64% from the median average in comparison with 2015 and 2016.The energy usage in Vintage Group 3 from 2017 to 2019 decreased by 54% from the median average in comparison with 2015 and 2016.The energy usage in Vintage Group 4 from 2017 to 2019 decreased by 64% from the median average in comparison with 2015 and 2016.
It is judged that such decreases in energy consumption were due to the Korean government’s measures to reinforce energy conservation activities in the operation of the system, such as by designating more than one person as protectors of the energy of public buildings after the massive power outage in 2016. Based on the above-mentioned analysis results, our suggestions are as follows:
- (1)
- The designation of public buildings subject to green remodeling should be evaluated in an integrated manner by preparing comprehensive value judgment criteria for buildings rather than starting with the oldest buildings.
- (2)
- The green remodeling implementation strategy for public buildings should be carried out by preparing an integrated strategy implementation plan based on comprehensive value judgment criteria, such as by the use and purpose of buildings, rather than fragmentary strategies such as thermal insulation reinforcement and system repair or replacement with high-efficiency systems.
- (3)
- The main users of public buildings are an unspecified number of citizens who use facilities and public officials who manage and operate facilities or perform public service activities. Therefore, in pushing ahead with green remodeling aimed at realizing zero-energy public buildings, it is necessary to set an essential and important goal of making it possible to maintain their basic value as public facilities which provide a pleasant thermal environment for the users of facilities, instead of one-sidedly focusing green remodeling only on the single purpose of reducing energy usage [35].
There are countries that recommend the implementation of/make it obligatory to implement thermal environment standards in office facilities under the policy initiative of government agencies, including the United States, France, Japan, Hong Kong, and China. According to the Energy Code in France, which makes it legally obligatory to implement such standards as Korea does, the scope of policy application regarding such standards also covers residential, office, and educational spaces in addition to the spaces of public institutions. However, the French policy is different from the Korean policy in that France makes it obligatory to implement only heating standards and regulates cooling so that the cooling system may operate only at a room temperature of 26 °C or above in accordance with Law R241-30 [36]. In the case of Japan and Hong Kong, indoor temperature limits in summer are being implemented on a pilot basis only in public institutions in accordance with government-made guidelines, and the two countries recommend that the eased indoor temperature regulations should be applied to shopping malls, general office facilities, etc. [37,38]. As for Korea’s energy saving-related policies, including the Green New Deal policy, which are being pushed ahead with for the purpose of reducing the total amount of energy consumed in public buildings and also achieving a greenhouse gas reduction of 32.7% compared to the expected gas emissions of the building sector by 2030 in accordance with the emission targets of the greenhouse gas roadmap for the building sector on a broad basis, it is judged that the direction of policy promotion is focused on a somewhat biased goal in comparison with other advanced countries. It is not desirable that the value assessment criteria for aging buildings biased toward one goal of saving energy based on economic indicators become a single yardstick for assessing the value of public buildings through public use.
There is an ongoing policy that involves the application of a fragmentary value judgment criterion, i.e., whether to apply technical elements confined to the enhancement of the energy performance of target buildings and the prediction of improvement effects according thereto, thus resulting in the phenomenon of another important value criterion for green remodeling, i.e., the enhancement of the occupant (user) comfort in target buildings being neglected instead. In order to accurately grasp the current status of these problems and to promote ‘expansion of the value judgment criteria for green remodeling’ as an alternative, this study performed a comparison of various value judgment criteria and carried out correlation analyses, starting with a total analysis of energy-related data on buildings actually used by public institutions. The characteristics of energy usage were analyzed for each of the groups of buildings classified by their year of completion, thereby carrying out an analysis of the correlation between the non-architectural elements affecting the actual energy usage and the actual energy usage data. As a result of the relationship analysis, it was confirmed that the actual energy usage is more affected by the operating conditions of the relevant building than the application of individual strategic elements such as the performance of the envelope insulation and the performance of the high-efficiency system. In addition, it was also confirmed that the usage of public buildings does not increase in proportion to their aging. The primary goal of reducing energy usage in target buildings can be achieved if public sector (government)-led green remodeling is pushed ahead with in accordance with biased value judgment criteria, just as in the case of a campaign to refrain from operating cooling facilities in aging public buildings. On the other hand, however, it was possible to grasp through the progress of this study that it may also result in the deterioration of environmental comfort and stability, such as with the numerical value of the indoor thermal environment.
Seeking to reduce energy usage for the single purpose of saving energy in public buildings may be given a physical value in terms of energy cost, but it may also be directly connected to reduction in work productivity due to the uncomfortable heat sensation which public officials, the main users of public buildings, may experience and the inconvenience of ordinary citizens, an unspecified number of civilians who use public buildings. It should not be overlooked that the value of public buildings that can be lost due to the pursuit of one purpose of energy saving can be greater than the value of energy saving costs [39].
It is judged necessary to ensure that one purpose of green remodeling, which is to reduce energy usage in aging public buildings, and another purpose, which is to enhance their environmental performance for occupants’ comfort, are mutually balanced and secured at the same time, thereby comprehensively evaluating alternatives for establishing a green remodeling strategy in the direction of enhancing the overall value of buildings and the performance of the detailed applicable elements of green remodeling accordingly, and then continuously proceed with the follow-up research proposed as a guideline.
Author Contributions
All authors participated in the research, analysis and interpretation of the data, as well as the design and production of this article. All authors have read and agreed to the published version of the manuscript.
Funding
This research was funded by the National Research Foundation of Korea(NRF) grant funded by the Korea government (No.2019R1F1A105870312).
Institutional Review Board Statement
Not applicable.
Informed Consent Statement
Not applicable.
Data Availability Statement
Not applicable.
Conflicts of Interest
The authors declare no conflict of interest.
Appendix A
Data crawling Python code for collecting energy data on public buildings
| for bdgs_no in tqdm.tqdm(df_raw.index): |
| try: |
| sigunguCd = int(LocCd.loc[(LocCd[‘city, county, district name’] == df_raw.loc[bdgs_no, ‘city,
county, district name’]) & (LocCd[‘raw rocation’] == df_raw.loc[bdgs_no, ‘raw rocation’]), ‘city, county, district code’]) |
| bjdongCd = int(LocCd.loc[(LocCd[‘ ‘city, county, district name’] == df_raw.loc[bdgs_no, ‘ ‘city,
county, district name’]) & (LocCd[‘ ‘raw rocation’] == df_raw.loc[bdgs_no, ‘ ‘raw rocation’]), ‘city, county, district code’]) |
| bun = int(df_raw.loc[bdgs_no, ‘top-street number’]) |
| ji = int(df_raw.loc[bdgs_no, ‘sub-street number’]) |
| # electric charges api |
| # end_point = ‘http://apis.data.go.kr/1611000/BldEngyService/getBeElctyUsgInfo’ |
| # gas charges api |
| end_point = ‘http://apis.data.go.kr/1611000/BldEngyService/getBeGasUsgInfo’ |
| api_key = ‘XXXXXXXXXXXXXXXXXXXXXXXXX’ |
| for Ym in [‘20{}’.format(100*yr + mn) for yr, mn in product(range(17, 20), range(1, 13))]: |
| url = end_point + ?sigunguCd={:05d}&bjdongCd={:05d}&bun={:04d}&ji={:04d}&useYm={}&ServiceKey={}’.format(sigunguCd, bjdongCd, bun, ji, int(Ym), api_key) |
| try: |
| reqURL = req.Request(url, headers={‘User-Agent’: ‘Mozilla/5.0’}) |
| response = req.urlopen(reqURL).read().decode(‘utf-8’) |
| iter_tree = ET.fromstring(response).iter(tag=‘item’) |
| for i in iter_tree: |
| df_raw.loc[bdgs_no, Ym] = float(i.find(‘useQty’).text) |
| except urllib.error.HTTPError: |
| pass |
| except urllib.error.URLError: |
| pass |
| except ValueError: |
| pass |
| ed = time.time() |
Appendix B

Table A1.
Nominal variables converted into ratio scales for correlation analysis.
| No. | Completion Time | Floor Area | Insulating Material (Resistance) | Insulation Thickness | Glass Types | Window Wall Ratio | Shading (Applicable or Not) | Ventilation (Applicable or Not) | LED (Applicable or Not) | Renewable System (Applicable or Not) | Energy Usage (kW/m2) |
|---|---|---|---|---|---|---|---|---|---|---|---|
| 1 | 1991 | 14,464 | 32 | 50 | 2 | 39 | 0 | 1 | 5 | 0 | 125 |
| 2 | 1988 | 7860 | 27 | 50 | 2 | 25 | 0 | 1 | 5 | 0 | 194 |
| 3 | 1992 | 5330 | 32 | 50 | 2 | 25 | 0 | 0 | 5 | 1 | 264 |
| 4 | 1993 | 6895 | 27 | 50 | 2 | 32 | 0 | 1 | 1 | 1 | 47 |
| 5 | 1979 | 8360 | 32 | 25 | 2 | 51 | 0 | 0 | 5 | 1 | 290 |
| 6 | 1989 | 722 | 32 | 40 | 2 | 23 | 0 | 1 | 5 | 0 | 45 |
| 7 | 1995 | 8684 | 27 | 50 | 2 | 36 | 0 | 1 | 1 | 0 | 210 |
| 8 | 1988 | 1697 | 32 | 50 | 4 | 35 | 0 | 0 | 5 | 0 | 60 |
| 9 | 1992 | 551 | 32 | 50 | 1 | 39 | 0 | 0 | 5 | 0 | 25 |
| 10 | 1989 | 400 | 32 | 40 | 4 | 32 | 0 | 0 | 5 | 0 | 57 |
| 11 | 2003 | 5867 | 32 | 60 | 1 | 34 | 0 | 0 | 5 | 0 | 60 |
| 12 | 1992 | 24,475 | 27 | 50 | 1 | 28 | 1 | 1 | 5 | 0 | 173 |
| 13 | 1993 | 7870 | 32 | 70 | 1 | 17 | 0 | 1 | 5 | 0 | 88 |
| 14 | 1981 | 5720 | 32 | 50 | 1 | 28 | 0 | 1 | 0 | 0 | 87 |
| 15 | 1982 | 9933 | 32 | 50 | 1 | 22 | 0 | 0 | 1 | 0 | 75 |
| 16 | 1997 | 6876 | 32 | 50 | 1 | 39 | 0 | 1 | 5 | 0 | 161 |
| 17 | 1989 | 6932 | 32 | 80 | 2 | 25 | 0 | 0 | 1 | 1 | 356 |
| 18 | 1982 | 6481 | 27 | 50 | 2 | 29 | 0 | 0 | 5 | 1 | 129 |
| 19 | 1997 | 5050 | 32 | 40 | 1 | 19 | 0 | 0 | 0 | 0 | 166 |
| 20 | 1997 | 240,951 | 28 | 50 | 1 | 41 | 0 | 1 | 5 | 0 | 162 |
| 21 | 1997 | 13,921 | 32 | 50 | 1 | 62 | 0 | 0 | 5 | 1 | 150 |
| 22 | 1997 | 42,190 | 28 | 50 | 1 | 60 | 0 | 1 | 5 | 1 | 81 |
| 23 | 1978 | 3198 | 0 | 0 | 1 | 40 | 0 | 0 | 5 | 0 | 159 |
| 24 | 1995 | 6483 | 28 | 50 | 1 | 44 | 0 | 1 | 1 | 0 | 619 |
| 25 | 1997 | 8396 | 35 | 40 | 1 | 36 | 0 | 0 | 5 | 0 | 48 |
| 26 | 1989 | 4068 | 0 | 0 | 0 | 40 | 0 | 1 | 0 | 0 | 143 |
| 27 | 1981 | 4271 | 32 | 50 | 2 | 53 | 1 | 0 | 5 | 1 | 70 |
| 28 | 1977 | 2966 | 0 | 0 | 1 | 35 | 0 | 0 | 5 | 0 | 106 |
| 29 | 1984 | 6577 | 0 | 0 | 1 | 56 | 0 | 0 | 0 | 0 | 93 |
| 30 | 1995 | 9180 | 32 | 50 | 1 | 59 | 0 | 0 | 5 | 1 | 373 |
| 31 | 2003 | 3100 | 32 | 50 | 1 | 43 | 1 | 0 | 5 | 0 | 1045 |
| 32 | 1991 | 3315 | 0 | 0 | 1 | 24 | 1 | 0 | 5 | 0 | 34 |
| 33 | 1988 | 566 | 6 | 50 | 1 | 24 | 0 | 0 | 0 | 0 | 198 |
| 34 | 1981 | 3105 | 6 | 50 | 1 | 40 | 0 | 0 | 0 | 0 | 1529 |
| 35 | 1984 | 3533 | 32 | 50 | 2 | 31 | 0 | 0 | 5 | 1 | 194 |
| 36 | 1997 | 2237 | 6 | 0 | 1 | 33 | 0 | 0 | 5 | 0 | 92 |
| 37 | 1999 | 87,742 | 27 | 60 | 2 | 45 | 0 | 0 | 5 | 1 | 114 |
| 38 | 1988 | 1647 | 32 | 50 | 2 | 33 | 0 | 0 | 5 | 0 | 152 |
| 39 | 1977 | 2864 | 32 | 50 | 1 | 34 | 0 | 0 | 5 | 0 | 463 |
| 40 | 1993 | 19,270 | 32 | 50 | 1 | 33 | 0 | 1 | 1 | 0 | 367 |
| 41 | 1990 | 5443 | 28 | 50 | 3 | 46 | 0 | 0 | 1 | 0 | 487 |
| 42 | 1988 | 17,784 | 32 | 50 | 1 | 34 | 0 | 0 | 5 | 0 | 433 |
| 43 | 1985 | 731 | 32 | 50 | 1 | 24 | 0 | 0 | 5 | 0 | 433 |
| 44 | 1995 | 19355 | 27 | 100 | 2 | 66 | 0 | 1 | 1 | 1 | 493 |
| 45 | 1996 | 9591 | 32 | 50 | 1 | 31 | 0 | 0 | 5 | 1 | 431 |
| 46 | 1985 | 7367 | 32 | 50 | 1 | 33 | 0 | 0 | 5 | 0 | 401 |
| 47 | 1989 | 495 | 6 | 20 | 2 | 32 | 0 | 0 | 5 | 0 | 454 |
| 48 | 1988 | 4124 | 32 | 50 | 2 | 13 | 0 | 0 | 0 | 0 | 336 |
| 49 | 1986 | 761 | 6 | 20 | 1 | 42 | 1 | 0 | 0 | 0 | 420 |
| 50 | 1994 | 1615 | 0 | 50 | 1 | 28 | 0 | 0 | 5 | 0 | 272 |
| 51 | 2003 | 630 | 32 | 50 | 2 | 25 | 0 | 0 | 1 | 0 | 396 |
| 52 | 1992 | 17,898 | 0 | 40 | 1 | 34 | 0 | 1 | 5 | 0 | 303 |
| 53 | 1992 | 17,898 | 0 | 40 | 1 | 34 | 0 | 1 | 5 | 0 | 303 |
| 54 | 1991 | 7357 | 0 | 40 | 1 | 24 | 0 | 0 | 5 | 0 | 251 |
| 55 | 1998 | 1016 | 0 | 30 | 1 | 22 | 0 | 0 | 1 | 0 | 249 |
| 56 | 1970 | 32,488 | 0 | 0 | 0 | 40 | 0 | 1 | 0 | 0 | 236 |
| 57 | 1994 | 6477 | 0 | 0 | 0 | 32 | 0 | 1 | 0 | 0 | 145 |
| 58 | 1987 | 21,240 | 0 | 0 | 0 | 40 | 0 | 1 | 0 | 0 | 180 |
| 59 | 1990 | 10,067 | 0 | 0 | 0 | 45 | 0 | 1 | 0 | 0 | 172 |
| 60 | 1999 | 34,460 | 0 | 0 | 0 | 40 | 0 | 1 | 0 | 0 | 275 |
| 61 | 1991 | 15,220 | 0 | 0 | 0 | 40 | 0 | 1 | 0 | 0 | 217 |
| 62 | 1980 | 13,062 | 0 | 0 | 0 | 40 | 0 | 1 | 0 | 0 | 367 |
| 63 | 2001 | 2191 | 0 | 0 | 0 | 31 | 0 | 0 | 0 | 0 | 505 |
| 64 | 1988 | 799 | 0 | 0 | 0 | 23 | 0 | 0 | 0 | 0 | 63 |
| 65 | 1981 | 26261 | 32 | 50 | 2 | 40 | 0 | 0 | 0 | 0 | 324 |
| 66 | 1994 | 4396 | 27 | 100 | 2 | 40 | 0 | 0 | 0 | 0 | 321 |
| 67 | 1990 | 1424 | 32 | 50 | 2 | 40 | 0 | 0 | 0 | 0 | 389 |
| 68 | 1983 | 9345 | 32 | 50 | 2 | 40 | 0 | 0 | 0 | 0 | 333 |
| 69 | 1981 | 3369 | 0 | 0 | 1 | 40 | 0 | 0 | 0 | 0 | 405 |
| 70 | 1993 | 2655 | 0 | 0 | 2 | 40 | 0 | 0 | 5 | 0 | 256 |
| 71 | 1978 | 4546 | 0 | 0 | 2 | 40 | 0 | 0 | 0 | 0 | 408 |
| 72 | 1985 | 551 | 0 | 0 | 2 | 40 | 0 | 0 | 0 | 0 | 375 |
| 73 | 1990 | 2248 | 0 | 0 | 2 | 40 | 0 | 0 | 0 | 0 | 370 |
| 74 | 1977 | 3514 | 0 | 0 | 2 | 40 | 0 | 0 | 5 | 0 | 569 |
| 75 | 1997 | 3469 | 0 | 0 | 2 | 40 | 0 | 1 | 0 | 0 | 578 |
| 76 | 1982 | 13,605 | 0 | 0 | 2 | 40 | 1 | 0 | 0 | 1 | 324 |
| 77 | 1990 | 1739 | 32 | 50 | 2 | 40 | 0 | 0 | 0 | 0 | 309 |
| 78 | 1972 | 4563 | 32 | 50 | 2 | 40 | 0 | 0 | 5 | 0 | 266 |
| 79 | 1995 | 1896 | 32 | 50 | 2 | 40 | 0 | 0 | 5 | 0 | 337 |
| 80 | 1988 | 550 | 32 | 50 | 1 | 40 | 1 | 0 | 0 | 0 | 346 |
References
- The Government of the Republic of Korea. Comprehensive Green New Deal Plan—Government Policy. Available online: https://www.korea.kr/special/eLibraryList.do (accessed on 12 January 2021).
- ASHRAE. Standard 55-2010, Thermal Environmental Conditions for Human Occupancy; American Society of Heating, Refrigerating and Air Conditioning Engineers: Atlanta, GA, USA, 2010. [Google Scholar]
- KICT. Establishment of a Standard Model Database for Analyzing Potential Greenhouse Gas Reduction Model in the Building Sector; KICT: Seoul, Korea, 2016; pp. 95–100. [Google Scholar]
- Press Release from the Ministry of Environment. The First Step in the Green New Deal towards a Carbon-Neutral Society. 2020. Available online: http://me.go.kr/home/web/board/read.do?boardMasterId=1&boardId=1385320&menuId=286 (accessed on 12 January 2021).
- Press Release from the Ministry of Land, Infrastructure and Transport. 200513 (after 12:00) Old Buildings_Pleasant and Safe_Green Remodeling in Earnest (Green Architecture Division). 2020. Available online: http://www.molit.go.kr/USR/NEWS/m_71/dtl.jsp?lcmspage=1&id=95083880 (accessed on 12 January 2021).
- STUNNING. GAP Solutions. Available online: https://renovation-hub.eu/refurbishment-solutions/gap-solutions/ (accessed on 12 January 2021).
- New Building Institute. A Case for Deep Savings. 2011. Available online: https://newbuildings.org/wp-content/uploads/2015/11/DeepSavings_11CaseStudies1.pdf (accessed on 12 January 2021).
- WBDG. Retro-Commissioning Process Manual. 2014. Available online: https://www.wbdg.org/ffc/va/commissioning/retro-cxmanual (accessed on 12 January 2021).
- PG&E. Dimming Controls for Lighting. 1997. Available online: https://www.lightingassociates.org/i/u/2127806/f/tech_sheets/dimming_controls_for_lighting_basics.pdf (accessed on 12 January 2021).
- Kalsruhe-Oststadt-die Lohfeldsiedlung. Available online: https://www.karlsruhe.de/b3/bauen/sanierung/oststadt/HF_sections/content/ZZjW1idMFeXfZ2/ZZjW1iKaXesTrI/Teil3.pdf (accessed on 12 January 2021).
- Energy Conservation in Buildings and Community Systems Programme. Building Renovation Case Studies. 2011. Available online: https://www.iea-ebc.org/Data/publications/EBC_Annex_50_Documented_CaseStudies.pdf (accessed on 12 January 2021).
- Michele Calzavara. The Skyscraper that Is Making History. 2017. Available online: https://www.abitare.it/en/habitat-en/urban-design-en/2017/10/01/empire-state-building-sustainable-windows/ (accessed on 12 January 2021).
- Ministry of Land, Infrastructure and Transport. Place Renewal Project. Available online: http://www.molit.go.kr/good_job/work/city_01.jsp (accessed on 12 January 2021).
- Gyeonggi Housing and Urban Development Corporation. Urban Regeneration Priming Water Project. Available online: http://www.gh.or.kr/business/urban/urban02.do (accessed on 12 January 2021).
- Ewha Womans University. Development of Source Technology for Intelligent Fire Damage Assessment of Reinforced Concrete Structures through Machine Learning-Based Image Information Analysis. 2018. Available online: https://www.codil.or.kr/viewDtlConRpt.do?gubun=rpt&pMetaCode=OTKCRK180937 (accessed on 12 January 2021).
- Tsanas, A.; Xifara, A. Accurate quantitative estimation of energy performance of residential buildings using statistical machine learning tools. Energy Build. 2012, 49, 560–567. [Google Scholar] [CrossRef]
- Castelli, M.; Trujillo, L.; Vanneschi, L.; Popovic, A. Prediction of energy performance of residential buildings: A genetic programming approach. Energy Build. 2015, 102, 67–74. [Google Scholar] [CrossRef]
- Fan, C.; Sun, Y.; Shan, K.; Xiao, F.; Wang, J. Discovering gradual patterns in building operations for improving building energy efficiency. Appl. Energy 2018, 224, 116–123. [Google Scholar] [CrossRef]
- Sadeghi, A.; Younes Sinaki, R.; Young, W.A.; Weckman, G.R. An intelligent model to predict energy performances of residential buildings based on deep neural networks. Energies 2020, 13, 571. [Google Scholar] [CrossRef] [Green Version]
- Benavente-Peces, C.; Ibadah, N. Buildings Energy Efficiency Analysis and Classification Using Various Machine Learning Technique Classifiers. Energies 2020, 13, 3497. [Google Scholar] [CrossRef]
- Public Institution Data Portal. Korean Public Data Map. Available online: https://www.data.go.kr/tcs/opd/ndm/view.do (accessed on 12 January 2021).
- Energy Saving Design Standards for Buildings. Available online: https://www.law.go.kr (accessed on 12 January 2021.).
- Lee, J.S. The Government Office in Seoul will Also Make the Air Conditioner Run-up Time. News1, 8 August 2018. Available online: http://news1.kr/articles/?3393697 (accessed on 12 January 2021).
- Park, K.H.; Lee, C.S.; Yang, J.E. Comparison of Energy Saving Programs in Major Countries in Summer; Korea Energy Economics Institute: Ulsan, Korea, 2010. [Google Scholar]
- Sung, S.Y. At 6 pm, the air conditioner is turned off. Civil servants go to work and go to cafes. The Korea Economic Daily, 2 August 2018. Available online: https://www.hankyung.com/economy/article/2018080258271 (accessed on 12 January 2021).
- Health and Safety Commission. Workplace Health, Safety and Welfare. Workplace (Health, Safety and Welfare) Regulations 1992; Approved Code of Practice and Guidance; HM Stationery Office: Richmond, UK, 1992. [Google Scholar]
- International Standard Organization (ISO). ISO 7730, Ergonomics of the Thermal Environment—Analytical Determination and Interpretation of Thermal Comfort Using Calculation of the PMV and PPD Indices and Local Thermal Comfort Criteria; ISO: London, UK, 2005. [Google Scholar]
- Jang, H.M. Designing Indoor Thermal Comfort Predict Tool Based on VBA and Analyzing Energy Demand on Building by PMV Control. Master’s Thesis, Yonsei University, Seoul, Korea, 2013. [Google Scholar]
- KEITI. Eco-Energy Based Indoor Environmental Management Technology Trend; KEITI: Seoul, Korea, 2013. [Google Scholar]
- Nicol, F.; Humphreys, M.; Roaf, S. Adaptive Thermal Comfort: Principles and Practice; Routledge: London, UK, 2012. [Google Scholar]
- Jang, H.M.; Choi, L.H.; Lim, J.H.; Lim, T.S.; Kim, B.S. The Need Adopting Thermal Environment Code Meeting Comfort Zone in Public Buildings. In Proceeding of the Summer SAREK Annual Conference; Seoul, Korea, 2012; pp. 529–535. [Google Scholar]
- Guilford, J.P. Fundamental Statistics in Psychology and Education, 3rd ed.; McGraw-Hill: New York, NY, USA, 1956. [Google Scholar]
- Cohen, J. Statistical Power Analysis for the Behavioral Sciences, 2nd ed.; Lawrence Erlbaum Associates: Hillsdale, NJ, USA, 1988. [Google Scholar]
- CCOHS. Thermal Comfort for Office Work. Available online: https://www.ccohs.ca/oshanswers/phys_agents/thermal_comfort.html (accessed on 12 January 2021).
- Choi, J.W.; Ahn, S.H.; Park, B.H.; Ko, J.L.; Shin, J.W. Method of Quantitative Analysis Based on Big Data Analysis for Explanatory Variables Containing Uncertainty of Energy Consumption in Residential Buildings—Focused on Apartment in Seoul Korea. KIEAE J. 2017, 17, 75–81. [Google Scholar] [CrossRef]
- Government of the French Republic. Energy Code (Code de l’Énergie); Government of the French Republic: Paris, France, 2015.
- The Government of the Hong Kong Special Administrative Region. Guidance Notes for the Management of Indoor Air Quality in Office and Public Places; The Government of the Hong Kong Special Administrative Region: Hong Kong, China, 2019.
- Government of Japan. Office Hygiene Standards; Government of Japan: Tokyo, Japan, 1973.
- Jun, Y.J.; Yoon, J.H.; Kim, S.; Song, Y.H.; Park, K.S. The Necessity of Improving the Standard for Thermal Environment in Korean Public Facilities. Energies 2020, 13, 523. [Google Scholar] [CrossRef] [Green Version]
Figure 1.
Research flowchart.

Figure 2.
2010~2015 range scale of Correlation analysis between market price and Annual electric energy fee.
Figure 2.
2010~2015 range scale of Correlation analysis between market price and Annual electric energy fee.

Figure 3.
Visualization of the percentages of the applied technologies for green remodeling in urban regeneration projects in Europe and the United States.
Figure 3.
Visualization of the percentages of the applied technologies for green remodeling in urban regeneration projects in Europe and the United States.

Figure 4.
Percentages of the applied technologies for green remodeling of aging buildings in urban regeneration projects in South Korea.
Figure 4.
Percentages of the applied technologies for green remodeling of aging buildings in urban regeneration projects in South Korea.

Figure 5.
Histogram of the number of buildings according to the year of public buildings.

Figure 6.
Insulation standards for each building part in vintage groups.

Figure 7.
(a) Visualization of the bar chart in Table 5; (b) Visualization of the box plot in Table 5; Ascertainment of the decreasing trend in the median (kW/m2y) in the amounts of energy usage by year from 2017, as compared to 2015 and 2016

Figure 8.
PMV in the energy saving environment in a public institution building against a blackout.

Figure 9.
A box plot of annual energy consumption per unit area by vintage group in 2019.

Figure 10.
Visualization bar chart of vintage groups by highest energy use among the medians (kW/m2y) by vintage group in the amounts of energy usage by facility use in each group in Table 9.
Figure 10.
Visualization bar chart of vintage groups by highest energy use among the medians (kW/m2y) by vintage group in the amounts of energy usage by facility use in each group in Table 9.

Figure 11.
A visualization bar chart comparing correlation coefficients between the amount of energy usage and the green remodeling implementation strategy.
Figure 11.
A visualization bar chart comparing correlation coefficients between the amount of energy usage and the green remodeling implementation strategy.

Table 1.
Applied technologies for green remodeling in urban regeneration projects in Europe and the United States [6,7,8,9,10,11,12].
| Wall Insulation | Insulated Window | Improving Thermal Bridges | Airtightness Reinforcement | High Reflective Roofing | Rooftop Greening | Cogeneration Power Plants | High-Efficiency Feed Water Pump | Gas/Condensing Boilers | Solar | Photovoltaic | Ventilation Equipment | Geothermal Heat Pumps | Rainwater Recycling | BEMS | Free Cooling Systems | Energy-Saving Lighting | Freezer Replacement | |
|---|---|---|---|---|---|---|---|---|---|---|---|---|---|---|---|---|---|---|
| Belss/Luedecke | ● | ● | ● | ● | ||||||||||||||
| Karlsruhe | ● | ● | ● | ● | ||||||||||||||
| Hackney Homes Project | ● | ● | ● | |||||||||||||||
| Metchley·Derwent·Coniston House | ● | ● | ||||||||||||||||
| Ready4Retrofit Project | ● | ● | ● | ● | ||||||||||||||
| Second Life School Project | ● | ● | ● | ● | ● | |||||||||||||
| Post War Residential Building | ● | ● | ● | ● | ● | ● | ||||||||||||
| Dieselweg 3-19 | ● | ● | ● | ● | ● | ● | ||||||||||||
| Alliance Center | ● | ● | ● | ● | ● | ● | ||||||||||||
| 200 Market Building, Portland, USA | ● | ● | ● | ● | ● | ● | ● | ● | ||||||||||
| Empire State Building | ● | ● | ● | ● | ● | ● |
Table 2.
Cases of the applied technologies for green remodeling of aging buildings in urban regeneration areas in South Korea [13,14].
| Energy- Independent Village | Insulated Window | Exterior Wall Insulation | Floor Insulation | Roof Insulation | Insulated Door | Wind Proof Construction | LED Lighting | Photovoltaic | Solar | ESS Installation | Rooftop Greening | High-Efficiency Heating and Cooling | Geothermal | Wood Pellet Stove | Cool Roof | Boiler Distributor | Dimming Sensor | High-Efficiency Feed Water Pump | Total Heat Exchanger |
|---|---|---|---|---|---|---|---|---|---|---|---|---|---|---|---|---|---|---|---|
| Seongdaegol, Seoul | ● | ● | ● | ● | ● | ● | ● | ||||||||||||
| Sipjaseong, Seoul | ● | ● | ● | ● | ● | ● | ● | ● | ● | ||||||||||
| Hobakgol, Seoul | ● | ● | ● | ● | ● | ||||||||||||||
| EungamSangol, Seoul | ● | ● | ● | ● | ● | ● | |||||||||||||
| Nangoknanhyang, Seoul | ● | ● | ● | ● | ● | ● | |||||||||||||
| Seokgwan-dong, Seoul | ● | ● | ● | ● | |||||||||||||||
| Guweol3-dong, Incheon | ● | ||||||||||||||||||
| AbandonedMine, Gyeongangbuk-do | ● | ● | |||||||||||||||||
| Suncheonman, Suncheon | ● | ● | ● | ● | ● | ● | ● | ● | |||||||||||
| Junggeum, Imsil-gun, Jeollabuk-do | ● | ● | ● | ● | ● | ● |
Table 3.
Summarized trends survey table of value assessment criteria.
| Subclassification | Summary of Existing Research Studies | Complementary Points for Existing Research Results |
|---|---|---|
| Research case evaluating AI-based structural and aging performance and predicting the lifespan of buildings [15] |
|
|
| Research cases evaluating Al-based energy performance and predicting the energy efficiency of buildings [16,17,18,19,20]. |
|
|
Table 4.
Proportions by the use of public buildings subject to energy usage analysis.
| Use | Count | Frequency (%) |
|---|---|---|
| Educational facilities | 1222 | 63.4% |
| Office facilities | 425 | 22.0% |
| Cultural facilities | 149 | 7.7% |
| Training facilities | 86 | 4.5% |
| Medical facilities | 46 | 2.4% |
| SUM | 1928 | 100.0% |
Table 5.
Quantile of the number of buildings according to the years of use of public buildings.
| Quantile | Value (Number of Buildings) |
|---|---|
| Min | 2 |
| 5-th percentile | 6 |
| Q1 | 15 |
| Median | 22 |
| Q3 | 28 |
| 95-th percentile | 43 |
| Maximum | 94 |
| Range | 92 |
| Interquartile range (IQR) | 13 |
Table 6.
Reference years for vintage group classification.
| Vintage Group | Year | Period |
|---|---|---|
| Vintage Group 1 | Before 1979 | - |
| Vintage Group 2 | 1979~1987 | 8 |
| Vintage Group 3 | 1987~2001 | 14 |
| Vintage Group 4 | 2001~2013 | 12 |
| Vintage Group 5 | After 2013 | 7 |
Table 7.
Proportions of public buildings by vintage group.
| Vintage Group | Count | Frequency (%) |
|---|---|---|
| Vintage Group 1 | 183 | 9.5% |
| Vintage Group 2 | 216 | 11.2% |
| Vintage Group 3 | 898 | 46.6% |
| Vintage Group 4 | 552 | 28.6% |
| Vintage Group 5 | 79 | 4.1% |
| SUM | 1928 | 100.0% |
Table 8.
Descriptive statistics of the amounts of energy usage by year in each vintage group.
| Vintage Group | Year | Standard Deviation (kW/m2y) | Minimum Value (kW/m2y) | Maximum Value (kW/m2y) | Median (kW/m2y) | Mean (Average of VALUE) (kW/m2y) |
|---|---|---|---|---|---|---|
| 1 Before 1979 | 2015 | 125 | 59 | 565 | 149 | 183 |
| 2016 | 133 | 57 | 646 | 165 | 200 | |
| 2017 | 866 | 0 | 6836 | 121 | 399 | |
| 2018 | 845 | 0 | 5985 | 112 | 410 | |
| 2019 | 1499 | 0 | 16,508 | 97 | 504 | |
| 2 1979~1987 | 2015 | 99 | 0 | 391 | 192 | 212 |
| 2016 | 112 | 0 | 422 | 209 | 213 | |
| 2017 | 826 | 0 | 6125 | 89 | 358 | |
| 2018 | 694 | 0 | 7095 | 68 | 275 | |
| 2019 | 1532 | 0 | 12,294 | 60 | 444 | |
| 3 1987~2001 | 2015 | 401 | 4 | 2243 | 146 | 251 |
| 2016 | 183 | 4 | 1060 | 136 | 197 | |
| 2017 | 3563 | 0 | 98,040 | 74 | 495 | |
| 2018 | 4085 | 0 | 113,143 | 65 | 395 | |
| 2019 | 4109 | 0 | 96,962 | 57 | 719 | |
| 4 2001~2013 | 2015 | 158 | 89 | 585 | 319 | 322 |
| 2016 | 154 | 122 | 586 | 306 | 325 | |
| 2017 | 1090 | 0 | 15,554 | 122 | 432 | |
| 2018 | 2195 | 0 | 40,807 | 115 | 452 | |
| 2019 | 2555 | 0 | 40,109 | 98 | 643 | |
| 5 After 2013 | 2015 | - | - | - | - | - |
| 2016 | - | - | - | - | - | |
| 2017 | 12,978 | 0 | 101,461 | 30 | 1812 | |
| 2018 | 13,282 | 0 | 107,831 | 80 | 1918 | |
| 2019 | 7510 | 0 | 62,468 | 82 | 1198 |
Table 9.
Amounts of energy usage by facility use in each vintage group.
| Use | Vinta_Group | Standard Deviation (kW/m2y) | Minimum Value (kW/m2y) | Maximum Value (kW/m2y) | Median (kW/m2y) | Mean (Average of Value) (kW/m2y) |
|---|---|---|---|---|---|---|
| Cultural facilities | 1 | 708 | 0.11 | 2671 | 178 | 498 |
| 2 | 861 | 0.04 | 3227 | 223 | 542 | |
| 3 | 998 | 0.00 | 6727 | 233 | 556 | |
| 4 | 485 | 0.09 | 3089 | 169 | 327 | |
| 5 | 2388 | 0.43 | 11,725 | 74 | 664 | |
| Educational facilities | 1 | 1286 | 0.03 | 16,508 | 75 | 384 |
| 2 | 943 | 0.01 | 12,294 | 50 | 243 | |
| 3 | 1672 | 0.00 | 18,931 | 48 | 371 | |
| 4 | 1222 | 0.00 | 13,656 | 77 | 382 | |
| 5 | 633 | 0.29 | 2753 | 46 | 305 | |
| Medical facilities | 1 | 1674 | 8.60 | 6484 | 166 | 676 |
| 2 | 430 | 0.08 | 1112 | 445 | 508 | |
| 3 | 1196 | 37.92 | 6206 | 283 | 700 | |
| 4 | 643 | 2.73 | 3051 | 460 | 582 | |
| 5 | 46 | 126.85 | 247 | 205 | 191 | |
| Office facilities | 1 | 446 | 0.02 | 2610 | 201 | 312 |
| 2 | 1428 | 0.13 | 11,543 | 197 | 508 | |
| 3 | 1486 | 0.00 | 16,710 | 142 | 470 | |
| 4 | 3989 | 0.13 | 40,807 | 156 | 1029 | |
| 5 | 17,323 | 0.13 | 107,831 | 60 | 3303 | |
| Training facilities | 1 | 1240 | 0.42 | 3715 | 356 | 946 |
| 2 | 794 | 0.06 | 2581 | 387 | 677 | |
| 3 | 18,532 | 1.44 | 113,143 | 261 | 3749 | |
| 4 | 300 | 9.08 | 1505 | 289 | 353 | |
| 5 | 73 | 2.29 | 189 | 77 | 84 |
Table 10.
Criteria for evaluation of correlation coefficient.
| Guilford [32] | Cohen [33] | ||
|---|---|---|---|
| Value | Level of Agreement | Value | Level of Agreement |
| |r| < 0.2 | None | - | - |
| 0.2 ≤ |r| < 0.4 | Week | 0.5 ≤ |r| ≤ 1 | Week |
| 0.4 ≤ |r| < 0.7 | Moderate | 0.3 ≤ |r| < 0.5 | Moderate |
| 0.7 ≤ |r| < 0.9 | Strong | 0.1 ≤ |r| < 0.3 | Strong |
| 0.9 ≤ |r| ≤ 1 | Almost perfect | - | - |
Table 11.
A table showing the results of analyzing the correlation between the amount of energy usage and the green remodeling implementation strategy.
Table 11.
A table showing the results of analyzing the correlation between the amount of energy usage and the green remodeling implementation strategy.
| Completion Time | Floor Area | Insulating Material | Insulation Thickness | Glass Types | Window Wall Ratio | Shading (Applicable or Not) | Heat Exchanging Type Ventilation (Applicable or Not) | LED (Applicable or Not) | Renewable System (Applicable or Not) | Energy Usage | |
|---|---|---|---|---|---|---|---|---|---|---|---|
| Completion time | 1.00 | 0.16 | 0.16 | 0.25 | −0.08 | −0.03 | −0.02 | 0.16 | 0.10 | 0.05 | −0.04 |
| Floor area | 0.16 | 1.00 | 0.07 | 0.10 | −0.11 | 0.17 | −0.05 | 0.28 | 0.12 | 0.09 | −0.11 |
| Insulating material | 0.16 | 0.07 | 1.00 | 0.80 | 0.42 | −0.02 | −0.01 | −0.11 | 0.33 | 0.28 | −0.09 |
| Insulation thickness | 0.25 | 0.10 | 0.80 | 1.00 | 0.38 | −0.04 | −0.05 | −0.05 | 0.27 | 0.28 | 0.06 |
| Glass types | −0.08 | −0.11 | 0.42 | 0.38 | 1.00 | 0.02 | −0.03 | −0.34 | 0.22 | 0.20 | −0.01 |
| Window Wall Ratio | −0.03 | 0.17 | −0.02 | −0.04 | 0.02 | 1.00 | 0.07 | 0.09 | −0.03 | 0.34 | 0.16 |
| Shading (applicable or not) | −0.02 | −0.05 | −0.01 | −0.05 | −0.03 | 0.07 | 1.00 | −0.11 | 0.02 | 0.09 | 0.09 |
| heat ex-changing type venti-lation (ap-plicable or not) | 0.16 | 0.28 | −0.11 | −0.05 | −0.34 | 0.09 | −0.11 | 1.00 | −0.14 | −0.10 | −0.15 |
| LED (applicable or not) | 0.10 | 0.12 | 0.33 | 0.27 | 0.22 | −0.03 | 0.02 | −0.14 | 1.00 | 0.21 | −0.22 |
| Renewable system (applicable or not) | 0.05 | 0.09 | 0.28 | 0.28 | 0.20 | 0.34 | 0.09 | −0.10 | 0.21 | 1.00 | −0.09 |
| Energy Usage(kW/m2) | −0.04 | −0.11 | −0.09 | 0.06 | −0.01 | 0.16 | 0.09 | −0.15 | −0.22 | −0.09 | 1.00 |
Publisher’s Note: MDPI stays neutral with regard to jurisdictional claims in published maps and institutional affiliations. |
© 2021 by the authors. Licensee MDPI, Basel, Switzerland. This article is an open access article distributed under the terms and conditions of the Creative Commons Attribution (CC BY) license (http://creativecommons.org/licenses/by/4.0/).
Share and Cite
MDPI and ACS Style
Jun, Y.-J.; Ahn, S.-h.; Park, K.-S. Improvement Effect of Green Remodeling and Building Value Assessment Criteria for Aging Public Buildings. Energies 2021, 14, 1200. https://0-doi-org.brum.beds.ac.uk/10.3390/en14041200
AMA Style
Jun Y-J, Ahn S-h, Park K-S. Improvement Effect of Green Remodeling and Building Value Assessment Criteria for Aging Public Buildings. Energies. 2021; 14(4):1200. https://0-doi-org.brum.beds.ac.uk/10.3390/en14041200
Chicago/Turabian StyleJun, Yong-Joon, Seung-ho Ahn, and Kyung-Soon Park. 2021. "Improvement Effect of Green Remodeling and Building Value Assessment Criteria for Aging Public Buildings" Energies 14, no. 4: 1200. https://0-doi-org.brum.beds.ac.uk/10.3390/en14041200
Note that from the first issue of 2016, this journal uses article numbers instead of page numbers. See further details here.