Article

Multi-Objective Optimisation-Based Design of an Electric Vehicle Cabin Heating Control System for Improved Thermal Comfort and Driving Range

Faculty of Mechanical Engineering and Naval Architecture, University of Zagreb, 10000 Zagreb, Croatia
*
Author to whom correspondence should be addressed.
Submission received: 19 January 2021 / Revised: 15 February 2021 / Accepted: 18 February 2021 / Published: 23 February 2021

Abstract

:
Modern electric vehicle heating, ventilation, and air-conditioning (HVAC) systems operate in more efficient heat pump mode, thus, improving the driving range under cold ambient conditions. Coupling those HVAC systems with novel heating technologies such as infrared heating panels (IRP) results in a complex system with multiple actuators, which needs to be optimally coordinated to maximise the efficiency and comfort. The paper presents a multi-objective genetic algorithm-based control input allocation method, which relies on a multi-physical HVAC model and a CFD-evaluated cabin airflow distribution model implemented in Dymola. The considered control inputs include the cabin inlet air temperature, blower and radiator fan air mass flows, secondary coolant loop pump speeds, and IRP control settings. The optimisation objective is to minimise total electric power consumption and thermal comfort described by predictive mean vote (PMV) index. Optimisation results indicate that HVAC and IRP controls are effectively decoupled, and that a significant reduction of power consumption (typically from 20% to 30%) can be achieved using IRPs while maintaining the same level of thermal comfort. The previously proposed hierarchical HVAC control strategy is parameterised and extended with a PMV-based controller acting via IRP control inputs. The performance is verified through simulations in a heat-up scenario, and the power consumption reduction potential is analysed for different cabin air temperature setpoints.

Graphical Abstract

1. Introduction

Consumer acceptance of electric vehicles is increasing strongly [1], with the trend bound to continue due to imposed emissions and carbon tax legislation, e.g., in the European Union [2] and China [3]. Although the declared range of current battery electric vehicles (BEV) is typically between 300 km and 500 km, the mass market share is still hindered due to long and widely unavailable charging and end-users’ perception of BEVs, having limited driving range compared to conventional vehicles.
The EV range significantly drops below the declared one when considering extremely hot or cold weather conditions since the heating, ventilation, and air-conditioning (HVAC) system has the highest energy consumption of all auxiliary systems [4,5]. In cold weather, the vehicle range can be decreased by up to 60% [6,7] when compared to the declared range obtained at room temperature. This is especially emphasised in BEVs, which utilise high-voltage positive thermal coefficient (HV-PTC) resistive heaters for cabin air heating with a power rating of up to 5 kW for passenger vehicles. Since the coefficient of performance of HV-PTC heaters is 1 at maximum [8], this can lead to the high energy consumption of the HVAC system.
New heating concepts have been developed recently for improved BEV heating efficiency in cold weather. These particularly relates to vapour-compression cycle (VCC)-based heat pump systems with integrated cabin and battery/powertrain thermal management [9], which support operation in both heating and cooling mode with the coefficient of performance being considerably higher than 1 [10]. Such heat pump systems can improve the fuel economy and reduce emissions of hybrid electric vehicles (HEVs) [11], as well as boost the electric driving range of plug-in HEVs (PHEVs) [12]. When concerning BEVs, the driving range can be increased by 18% at the ambient temperature of −10 °C by opting for heat pump system instead of a PTC system, as demonstrated in Fiat 500e [13]. Additionally, to boost the efficiency, novel HVAC systems utilise new types of refrigerant, e.g., CO2 or propane (R290; see [14] for details and a broader discussion of refrigerant selection).
The latest trends in automotive HVAC development place emphasis on localised heating and cooling by forming microclimate zones around the passengers, instead of conditioning the entire cabin volume in the same way. For instance, heating the seats at the temperature of 37 °C allows for reduction of operative cabin air temperature from the nominal value of 20 °C by about 3 °C [15], thus, reducing convective heat load on HVAC. The operative cabin air temperature can be reduced by 6 °C when combining heated seats with radiative foot heaters [15]. Installing infrared heating panels (IRPs) throughout the cabin can reduce the energy consumption by 50% compared to convective heating [16], but to achieve adequate thermal comfort they need to be combined with the classic convection HVAC system. Reference [17] considers extending the aforementioned HVAC system of Fiat 500e with heated seat and radiation heating. The analysis shows that using the localized heating reduces average battery power consumption from 2.3 kW to around 0.9 kW at the ambient temperature of 0 °C and New European Driving Cycle (NEDC).
The advanced BEV HVAC systems are characterised by an increased number of actuators, which makes the energy management/control system design more challenging. To minimise the power consumption at a favourable level of thermal comfort, it is necessary to develop new HVAC control systems that optimally coordinate multiple, often redundant actuators. Fuzzy-logic control of cabin thermal comfort presented in [18] relies on feedback information of simplified predicted mean vote (PMV) model, and it improves both thermal comfort and energy efficiency when compared to using cabin air temperature as a feedback signal of the conventional air-conditioning (A/C) system. A multi-input/single-output proportional-integral (PI)-like controller is proposed in [19] for the conventional A/C system to improve the HVAC efficiency and a PMV-based thermal comfort criterion in a feedback loop manner. It is shown, therein, that the fuel consumption can be reduced by 4.3% compared to conventional control algorithms for the same level of thermal comfort. An optimal allocation-based control strategy presented in [20] allocates low-level A/C control inputs by means of instantaneous on-line optimisation (maximisation) of efficiency and thermal comfort, subject to cooling capacity demand constraint. Alternatively, the model predictive control proposed in [21] and [22] optimises control inputs over prediction horizon to achieve optimal cooling performance of HEV and BEV, respectively. Such an on-line optimisation is computationally demanding, particularly for the case of increased number of actuators. For improved computational efficiency, it is possible to use off-line optimised allocation control law or maps [23].
In this paper, the genetic algorithm-based optimisation method from [23] is extended to multi-objective optimisation and applied to obtain optimal control input allocation maps of an advanced BEV HVAC system comprising also IRPs. The aim is to minimise the total power consumption and the PMV thermal comfort index in the heat pump operating mode. The optimal control input allocation maps are used within a hierarchical cabin temperature control system, which is extended with a proportional-like PMV controller that commands the IRP power setting. The main contributions of the paper are twofold. The first contribution relates to the multi-objective optimisation method itself, which is targeted at providing a favourable trade-off between thermal comfort and power consumption for specified heating power demand and actual cabin air conditions. The method results in computationally efficient optimisation by relying on a simplified computational fluid dynamics (CFD) model-based cabin airflow distribution model and replacing the cabin thermal dynamics and thermal load disturbance by cabin air condition sources. The second contribution concerns analysis of optimisation results and establishing a related optimal control strategy to quantitatively recognise and exploit IRP benefits for both steady-state and emphasised transient conditions. The steady-state analysis is more comprehensive than analyses presented in available literature (see e.g., [16,17]) in terms of analysing a wide range of HVAC-only and HVAC+IRP cabin air temperature targets using both optimisation and simulation. Moreover, unlike in the available references (e.g., [17,23]), the optimisation and simulation analysis results are exploited to design an optimal HVAC+IRP control system, which is tested under heavily transient heat-up conditions, as well.
The presented study includes the following main steps: (i) multi-physical modelling of the HVAC system and passenger cabin (Section 2), (ii) setting the model-based control input allocation map optimisation framework (Section 3), (iii) analysing the optimisation results and related power consumption reduction potential based on using infrared panels (Section 4), and (iv) revealing the structure of optimal control strategy and presenting corresponding simulation verification results for steady-state and transient conditions, again with the emphasis on power consumption reduction potential (Section 5). Section 6 discusses the main results and open problems, while concluding remarks are given in Section 7.

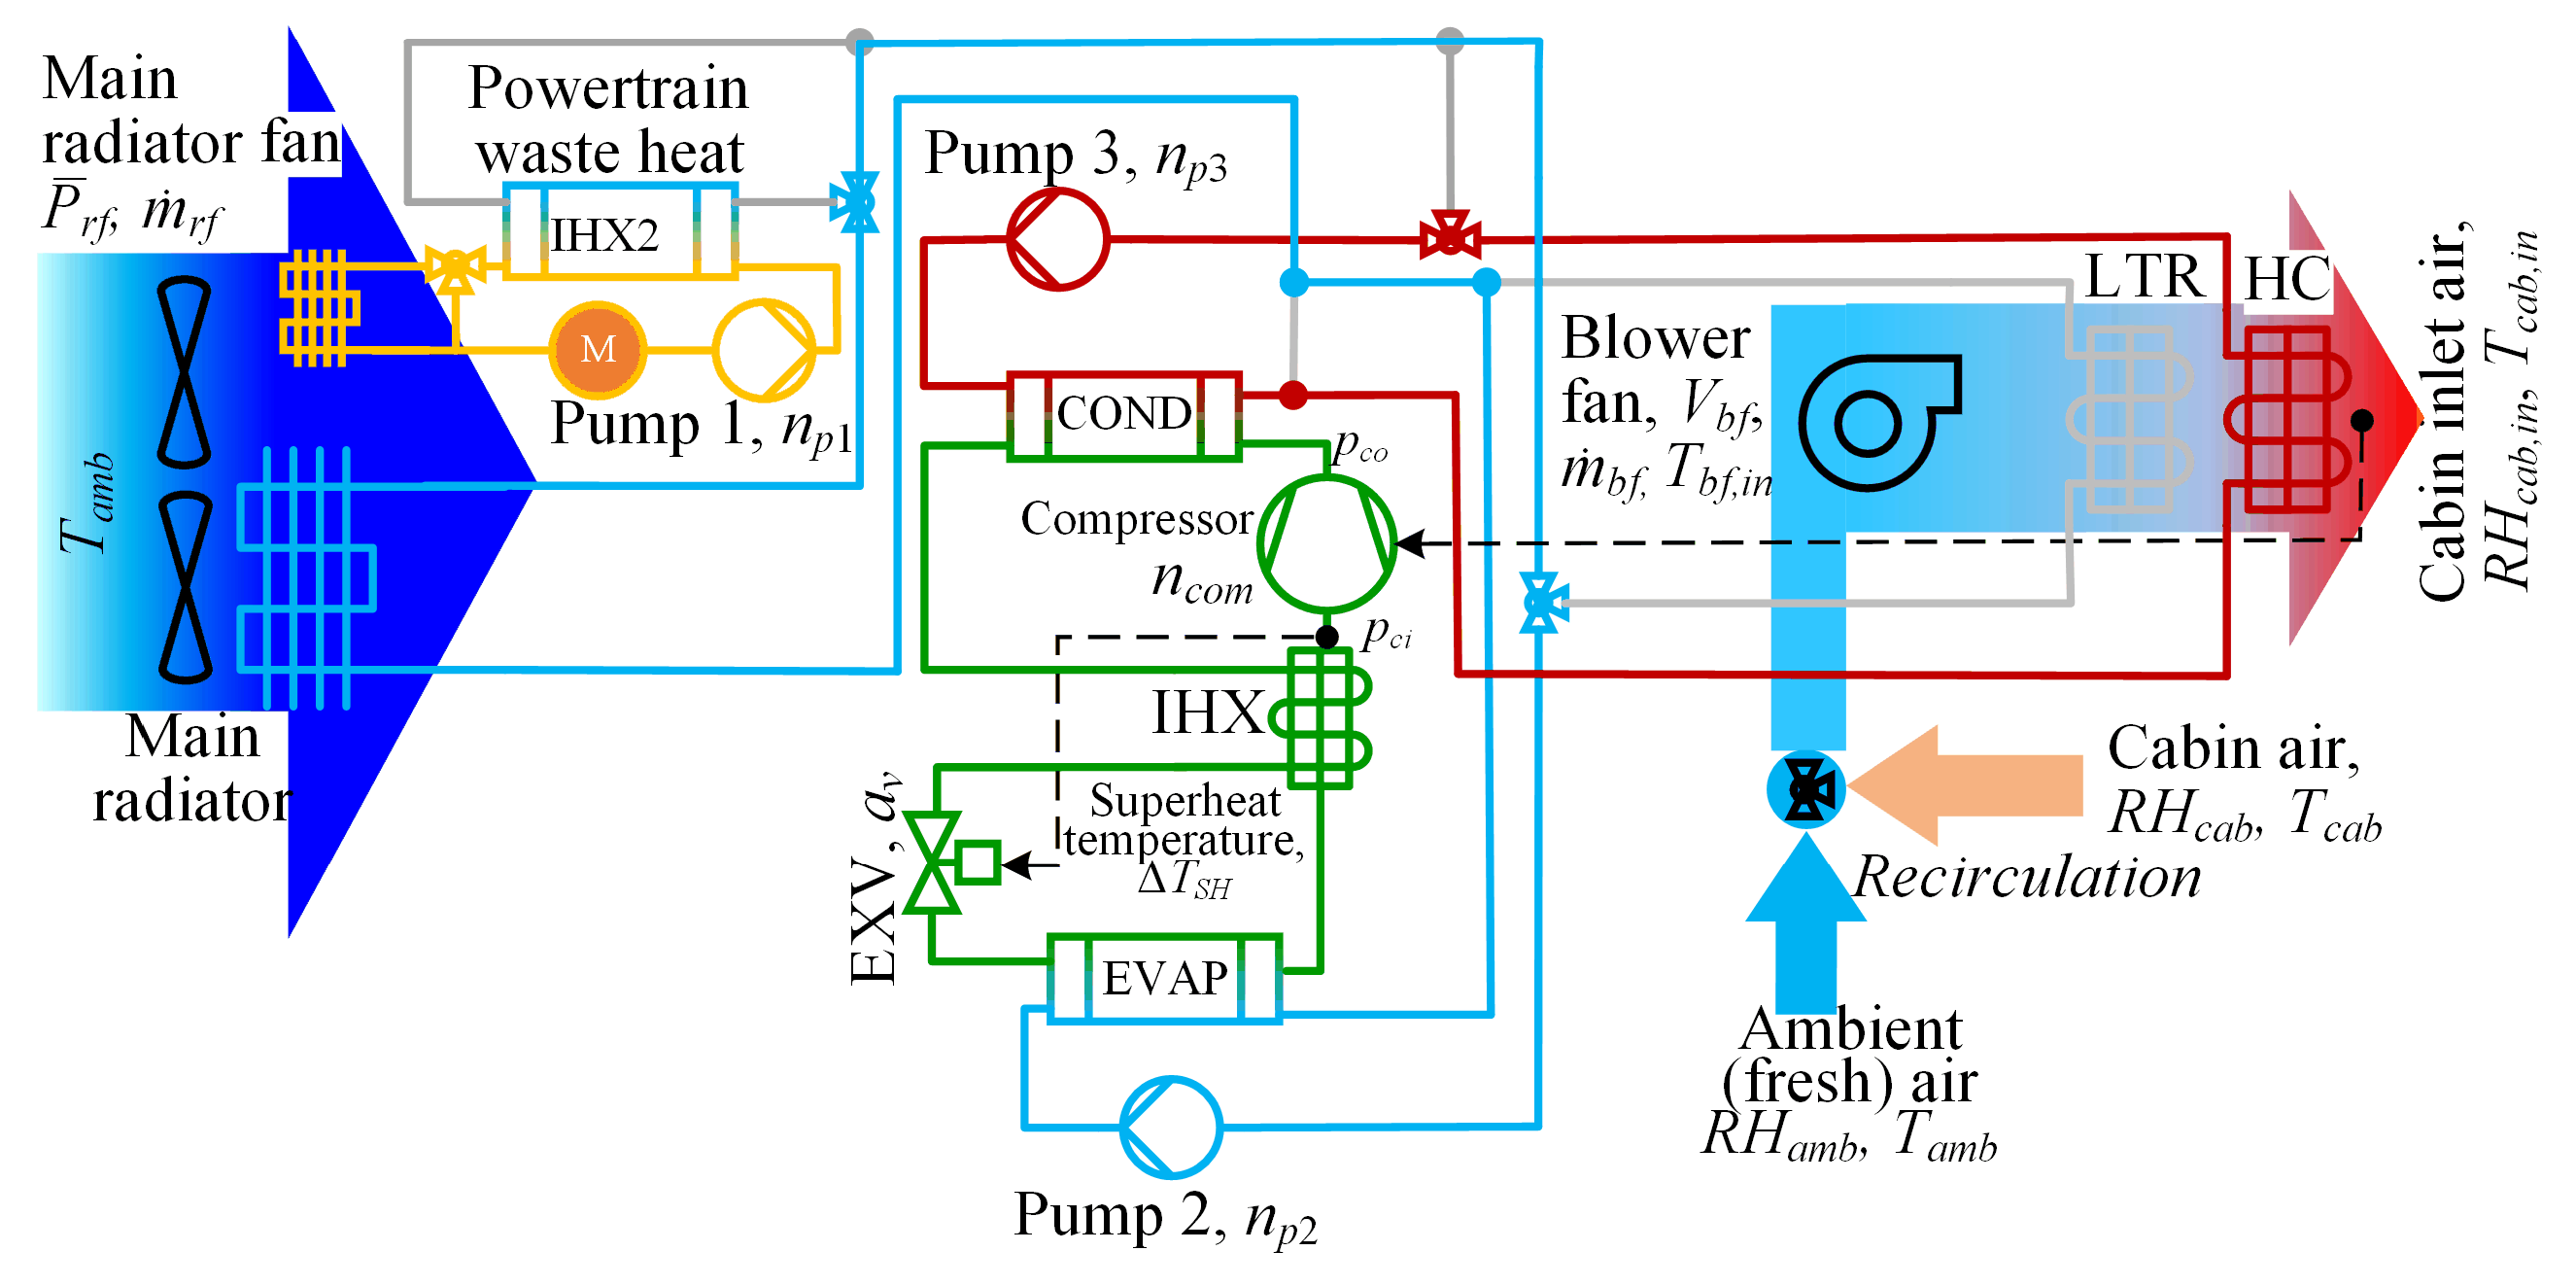
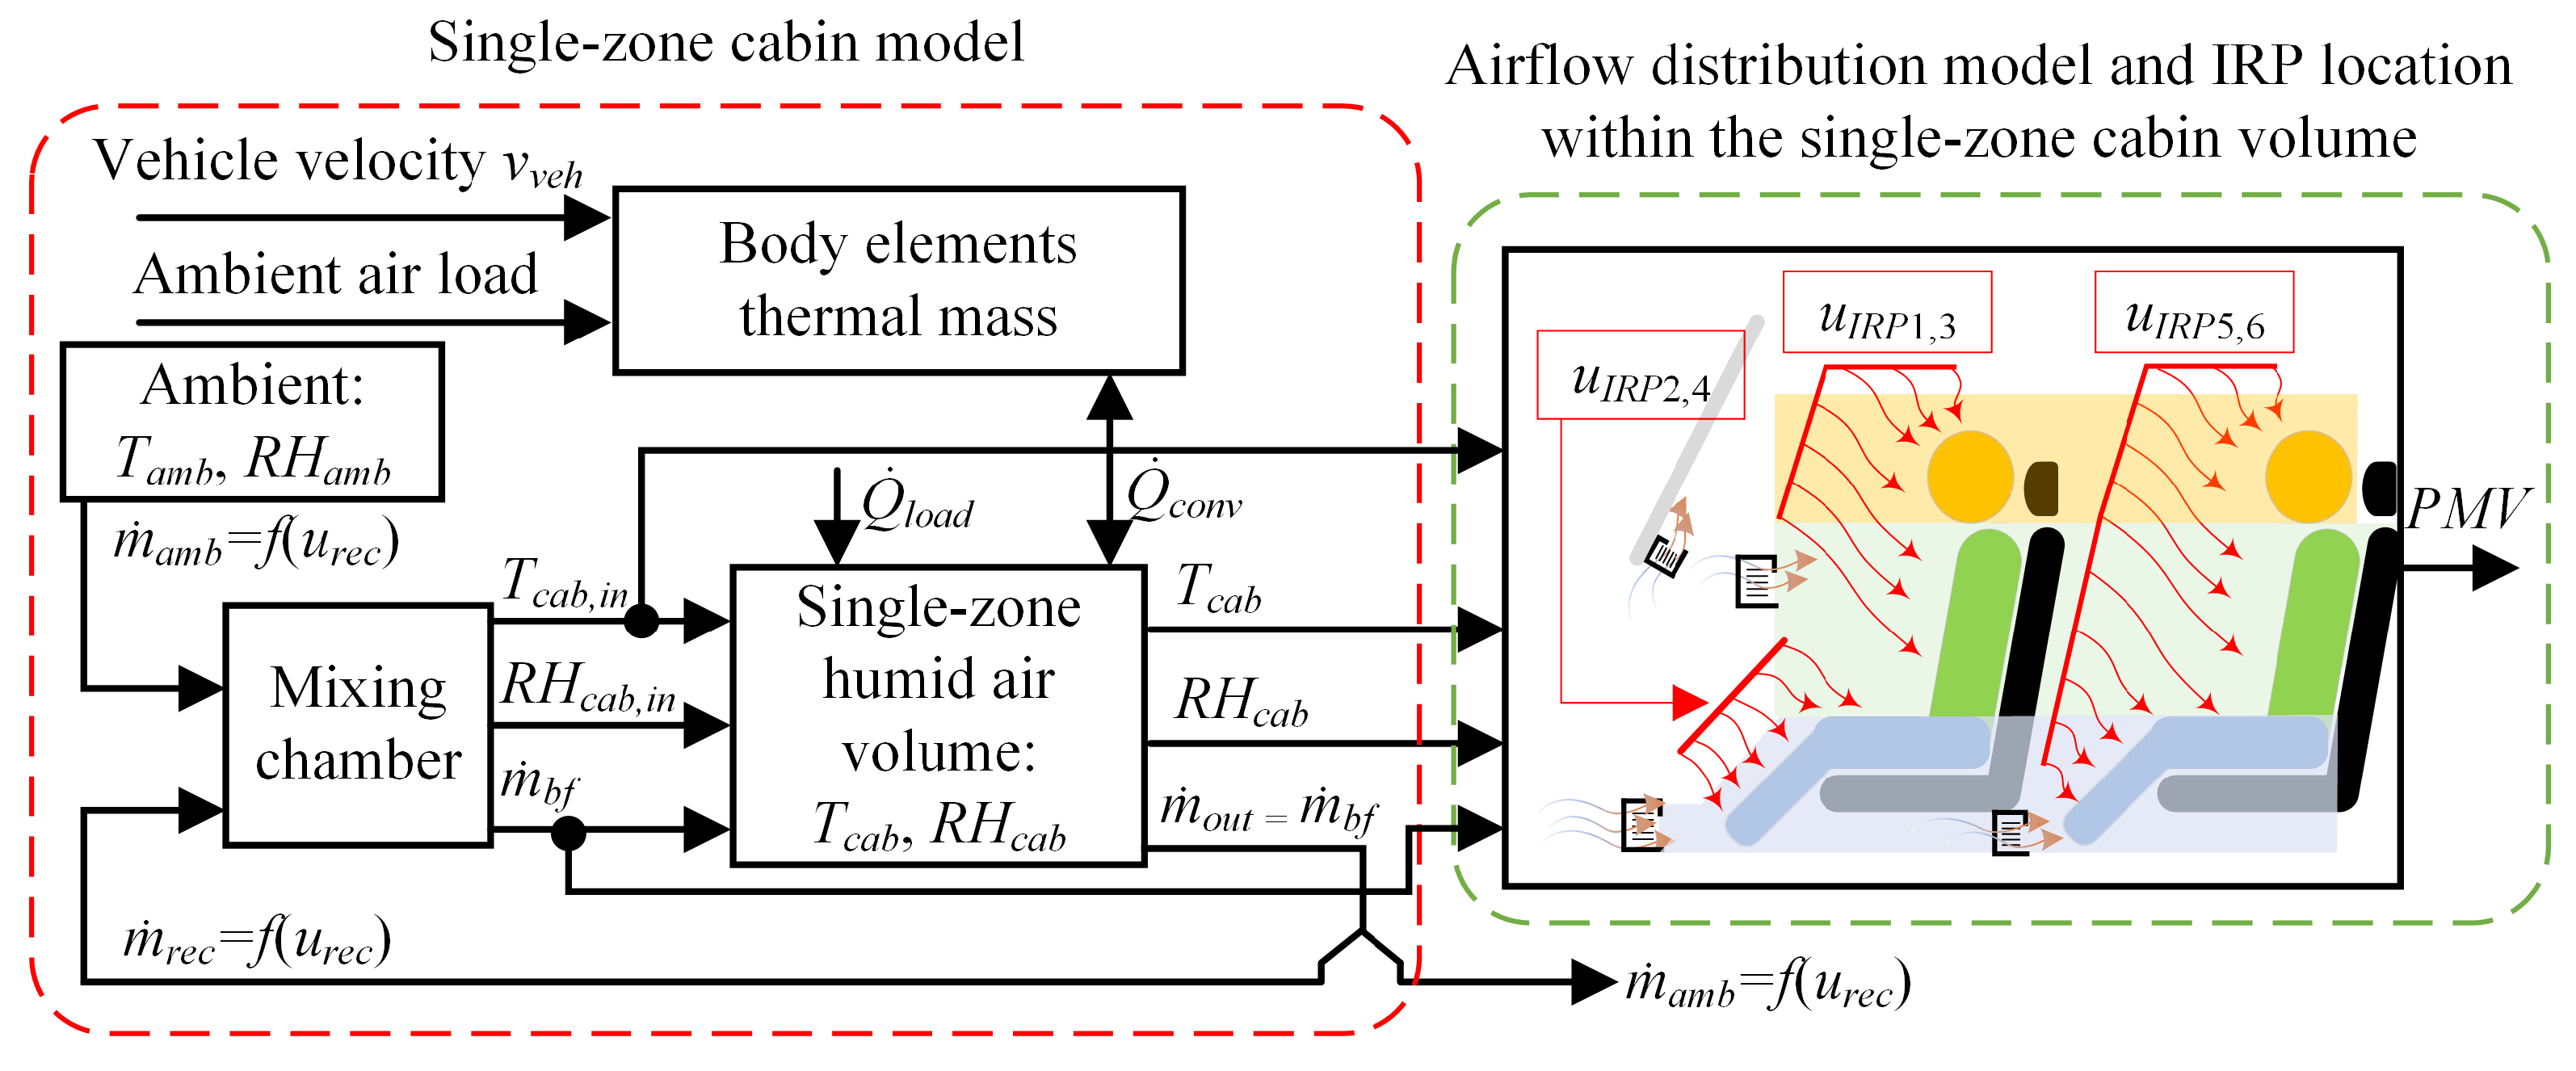
2. HVAC System Model

2.1. HVAC System Configuration

The considered R290-based HVAC system configuration, operating modes, and thermal energy exchange principles are described in detail in [14] and [23]. The emphasis in this work is on the heat-pump operating mode of the HVAC system, where no use of powertrain/battery waste-heat is considered since it is insufficient for cabin heating [24].
The heat pump mode comprises of three distinct thermal energy exchange loops (see Figure 1): the core vapour-compression-cycle (VCC) refrigerant loop (green line), which exchanges thermal energy with a low temperature secondary coolant loop (blue line) and a high-temperature secondary coolant loop (red line). The secondary coolant loops serve as intermediary between VCC and ambient and cabin air (coloured arrows). The VCC actuators include the electric compressor and the electronic expansion valve (EXV). The secondary coolant loops are equipped with multiple pumps and proportional three-way valves, which allow for implementing more complex operating modes such as dehumidification. In the considered heat-pump operating mode, the low-temperature coolant is at lower temperature than the ambient air and it receives thermal energy through the main radiator and heats the refrigerant in a chiller (EVAP), while the high-temperature coolant loop is heated by a condenser (COND). The high-temperature coolant flows through the heater core (HC) where it heats up the cabin inlet air. The ambient air is forced through the front main radiator by means of a fan and ramming flow due to vehicle velocity, while the air flow into the cabin is achieved by the blower fan. The air properties at the blower fan inlet are influenced by the cabin air recirculation setting, which allows mixing of the fresh air and cabin air in a specified ratio. The HVAC system is equipped with multiple refrigerant pressure and refrigerant and air temperature sensors to allow for implementation of the complex automatic climate control system considered. The cabin inlet air temperature is controlled by a PI controller, which commands compressor speed, and the superheat temperature is controlled by a PI controller, which commands the EXV position (dashed black lines). The superheat temperature control ensures that the refrigerant at the compressor inlet is in gas state.

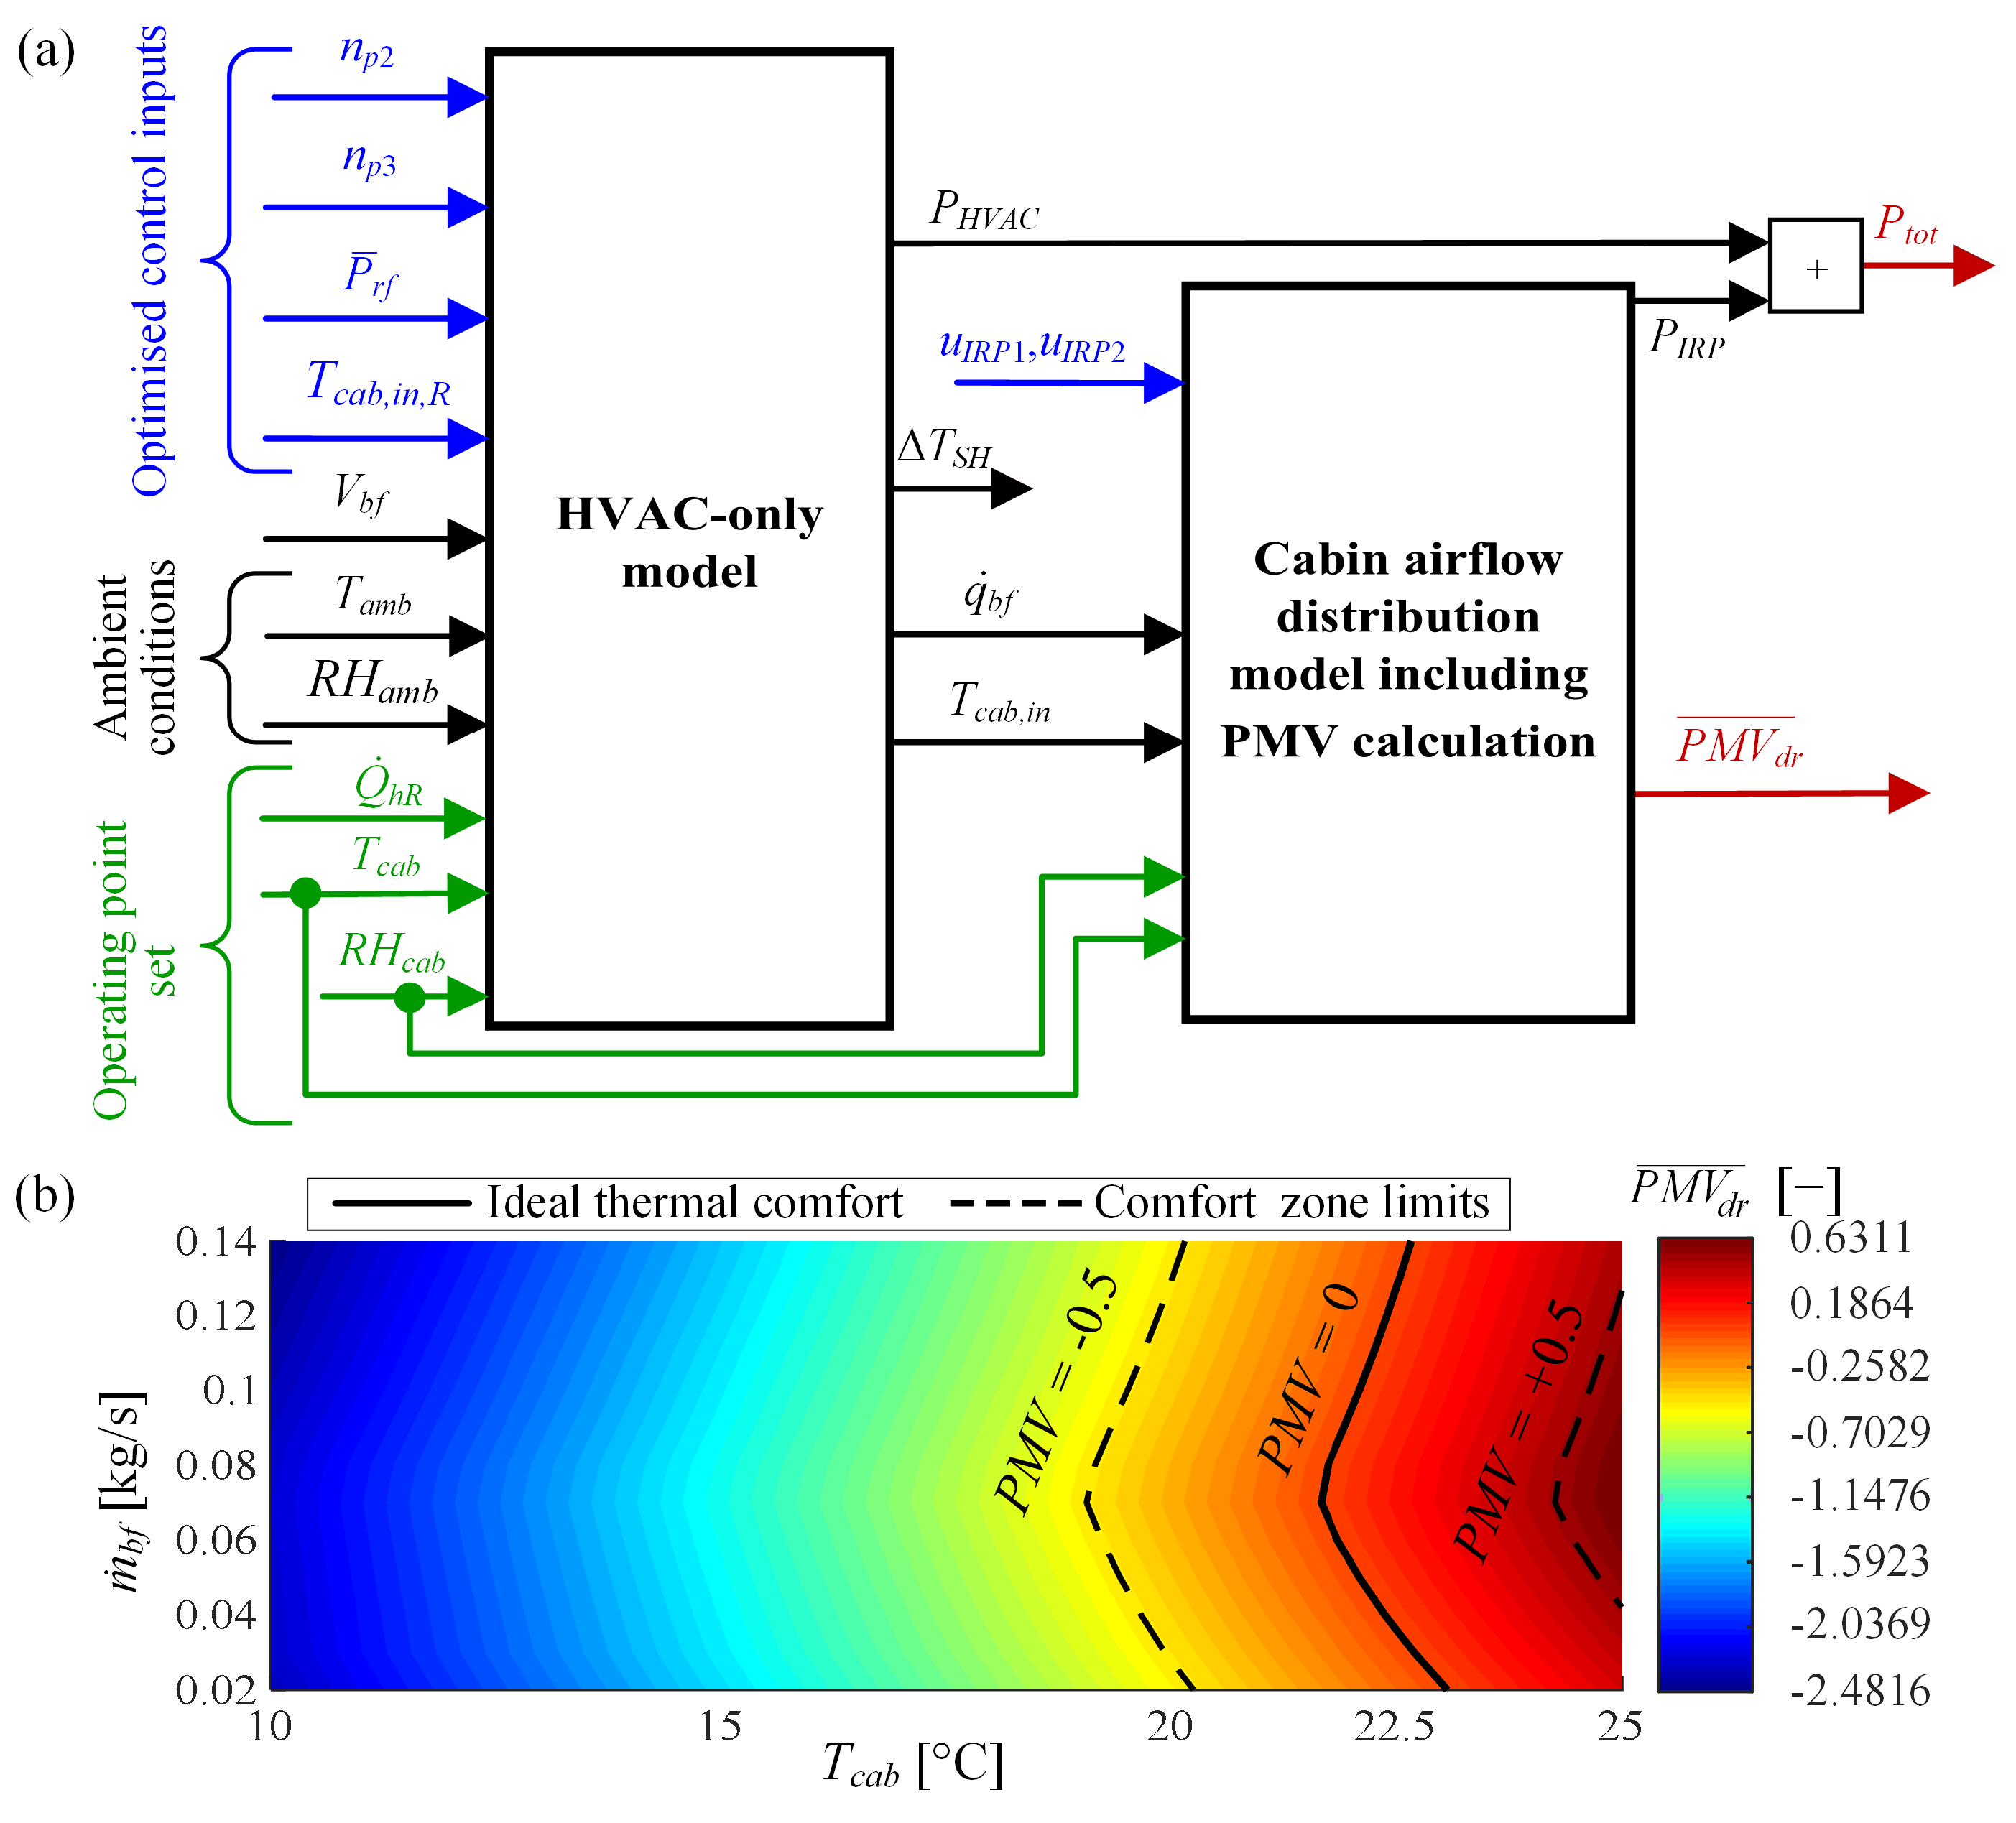
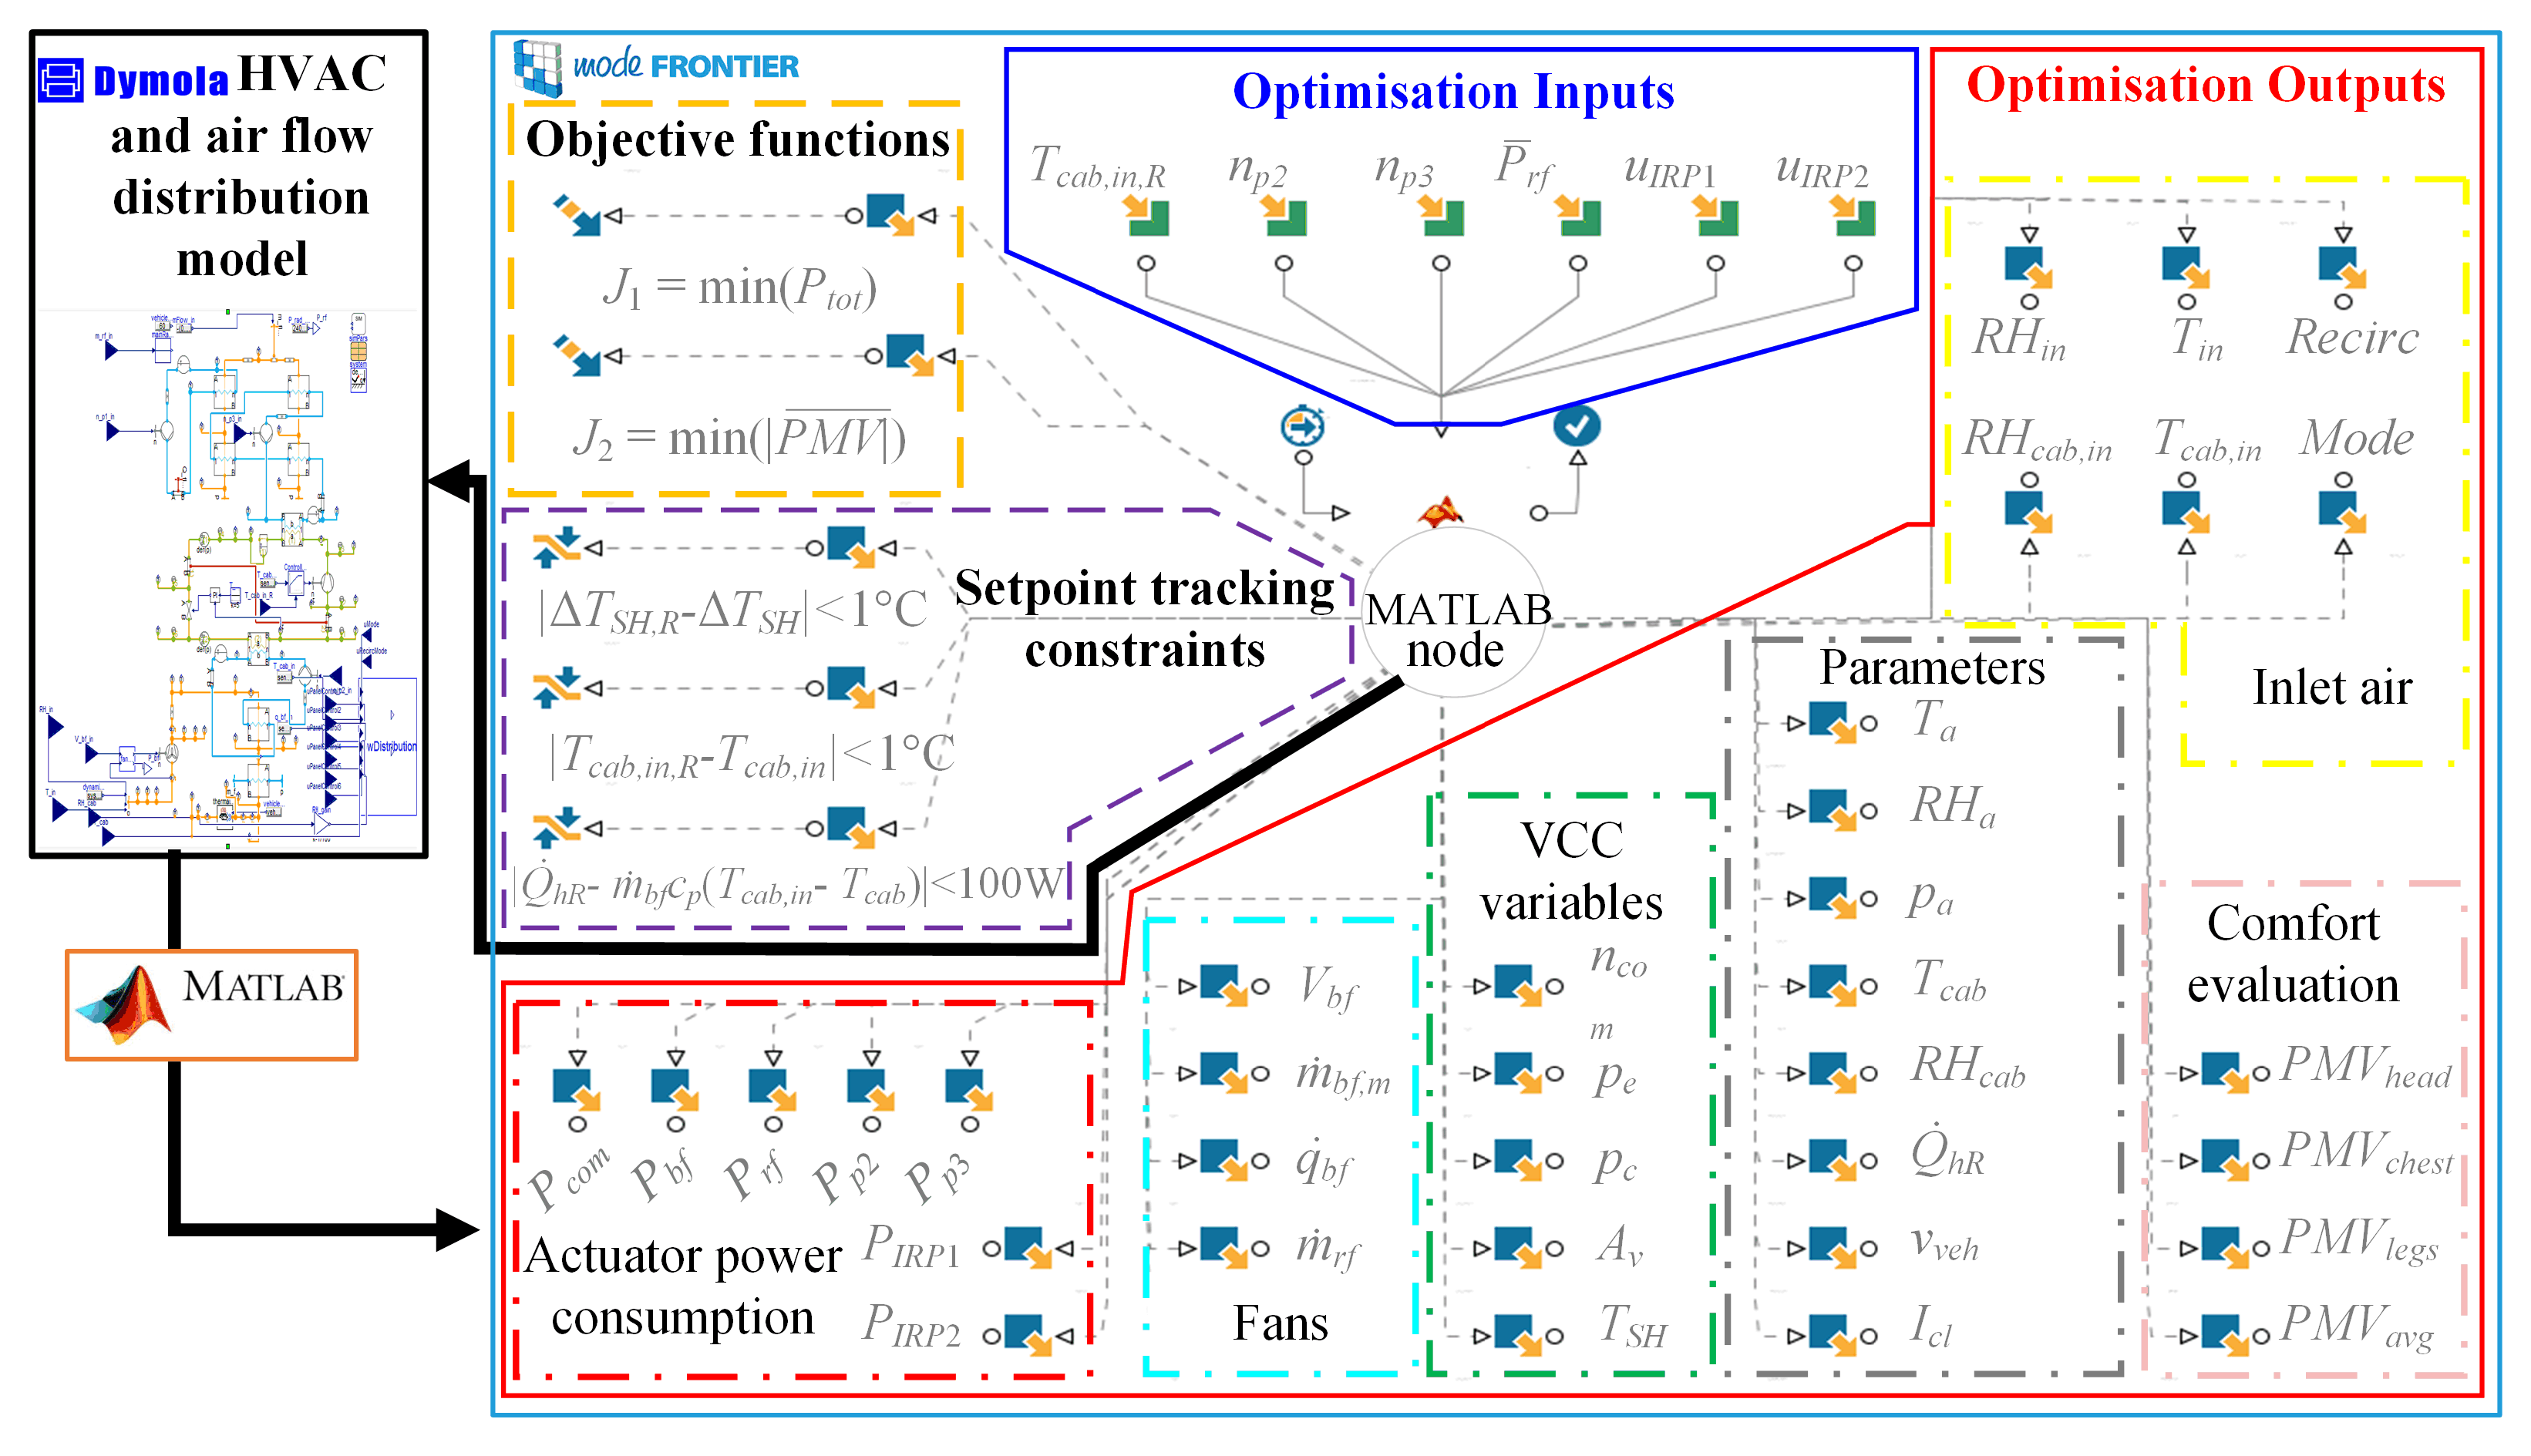
2.2. Dymola-Based HVAC and Cabin Air Flow Distribution Models

The multi-physical HVAC system model has been implemented in Dymola, parametrised using available system design data, technical datasheets, and component test bench data, and partly validated using test rig data [25].
Figure 2 depicts the passenger cabin model with associated HVAC inputs (red outline) and the airflow distribution subsystem (green outline). The cabin (red outline) is modelled as a single-zone humid air volume enveloped by a lumped-parameter thermal mass of interior elements such as seats, ducts, panels, and car body [26]. The lumped body thermal mass exchanges heat via forced convection with the ambient due to vehicle traveling at velocity vveh and with the interior cabin air volume. The cabin air volume is additionally subject to various thermal loads Q . load, including passenger metabolic load Q . met and the solar load Q . sol. The cabin inlet air properties including mass flow rate m . bf, temperature Tcab,in, and relative humidity RHcab,in are determined by the HVAC system. The inlet air is assumed to ideally mix with the cabin air at a constant pressure. Therefore, the cabin outlet air mass flow rate comprised of the mass flow going to the ambient and recirculated mass flow (depending on the set recirculation ratio) is equal to the inlet air mass flow. The recirculation ratio used for heating is set, herein, to 90% of fresh air intake and 10% of recirculated cabin air.
The passenger thermal comfort is evaluated using the Predicted Mean Vote (PMV) index [27] whose inputs are provided by a look-up table-based cabin airflow distribution model described in [26]. The flow distribution model shown in Figure 2 (green outline) is comprised of four main zones (driver, co-driver, and the two backseat passengers) and each zone is further divided in three body-specific parts: head, torso, and legs. Such discretisation enables the PMV evaluation for different body parts and, therefore, the implementation of localised heating by means of spatially distributed infrared panels. Negative PMV values correspond to the occupant feeling cold, while positive PMV values indicate that the occupant is feeling hot. The best (neutral) thermal comfort is achieved at the PMV value of zero, while the favourable thermal comfort range is defined by PMV values lying between −0.5 and +0.5.
The airflow distribution model is extended with six infrared heating panel (IRP) clusters (Figure 2), i.e., those for driver (uIRP1,2) and co-driver (uIRP3,4) upper body (torso, head) and lower body (four clusters in total), and also backseat passengers (uIRP5,6; two in total). Each cluster is modelled by a thermal mass heated by an internal panel temperature controller that commands heating power, and each panel exchanges convective heat with cabin air. The maximum IRP heating power depends on the panel size, and it equals 390 W and 160 W for driver clusters 1 and 2, respectively. The IRP control level setting uIRP sets the panel target temperature command, which is equal to air temperature for uIRP = 0% and the maximum panel temperature for uIRP = 100% (80 °C for head panels, and 60 °C for other panels).
The inlet air distribution in the cabin is determined by air vent outlet locations. In the heating mode, the air distribution mode HEAT redirects 75% of the inlet air to the legs, 15% of the inlet air to the torso, while the rest of the air mass flow rate is redirected towards the windshield area (see [25,26] for details and also definition of other air distribution modes). The inputs to the airflow distribution model are cabin inlet air temperature Tcab,in and volumetric inlet air flow q . bf (outputs of HVAC model), cabin air temperature Tcab and humidity RHcab, and infrared panel control settings uIRP,1–6. Metabolic activity and clothing factors are considered to be constant parameters. The cabin air temperature, the inlet air temperature and the inlet air volume flow determine the actual air temperature and velocity for each body part used as inputs for PMV calculation, and they are determined using CFD model-based look-up tables for the given ventilation and recirculation mode [26]. The mean radiant temperature, required by the PMV model, is determined as a linear combination of cabin air temperature and IRP temperature [26].
For the purpose of computationally-efficient control input allocation optimisation, the cabin thermal model (Figure 2, red outline) is replaced with the boundary conditions that determine the cabin air properties (Tcab and RHcab) and required thermal heating power demand Q . hR, where the latter accommodates for various cabin thermal loads and the heat transferred into thermal masses [23]. The airflow distribution model inputs related to cabin air properties (Tcab and RHcab) are defined by the same boundary conditions, while the blower fan air mass flow m . bf and the inlet air temperature Tcab,in are provided by the HVAC model.
The optimisation model structure is shown in Figure 3a. The considered HVAC control inputs are (Figure 1): the low-temperature coolant pump speed np2, the high-temperature coolant pump speed np3, the main radiator fan power level setting P ¯ rf and the blower fan air mass flow rate m . bf, which is transformed to blower fan input voltage using polynomial functions Vbf = fbf−1( m . bf, Tbf,in) as described in [23]. The radiator fan air mass flow and power consumption are determined by three discrete input settings P ¯ rf ϵ {0, 0.5, 1} corresponding to different fan power levels (turned off, at half power, and at full power). The blower fan power consumption is described by a look-up table. Another HVAC control input is the cabin inlet air temperature reference Tcab,in,R, which is feedback-controlled by varying the compressor speed. Other inputs include the ambient air temperature (Tamb) and relative humidity (RHamb), as well as the cabin air properties inputs (Tcab, RHcab) that replace the cabin model, as described above and in [23].
The cabin airflow distribution model control inputs include the driver-related IRP cluster control settings uIRP,1 and uIRP,2, while other PMV calculation-related inputs are obtained from the HVAC model ( q . bf and Tcab,in) and the cabin boundary conditions (Tcab and RHcab). The recirculation mode is set to fresh air mode and the ventilation mode corresponds to the above-described HEAT mode.
The relevant outputs are the total power consumption of HVAC+IRP system Ptot and driver’s comfort index P M V ¯ d r (Figure 3a), where the former is expressed as (see Figure 1):
Ptot = PHVAC + PIRP
PHVAC = Pcom + Pbf + Prf + Pp2 + Pp3
PIRP = PIRP1 + PIRP2
The power consumption of other, low-power, positioning HVAC actuators, such as the EXV stepper motor and cabin air distribution flaps, is not modelled and, therefore, not accounted for.
The driver’s comfort is evaluated by an arithmetic mean of the three individual body part PMV values (head, torso, legs):
P M V ¯ d r =   1 3 i = 1 3 P M V i
Figure 3b shows the driver’s mean PMV map obtained for the HEAT ventilation mode, driving activity (metabolic rate of 1.2), typical winter clothing factor of 1.2, and with no use of IRPs (i.e., the mean radiant temperature is equal to the cabin air temperature). The driver’s PMV is primarily determined by the cabin air temperature Tcab and the blower fan volumetric flow q . bf, while the effect of cabin air relative humidity RHcab is of minor influence. For the particular CFD model-based look-up tables, the ideal thermal comfort (PMV = 0) is achieved at around 22.5 °C, while the comfortable range (|PMV| < 0.5) is achieved for the cabin air temperatures lying between 19 °C and 24 °C for moderate blower air mass flows.

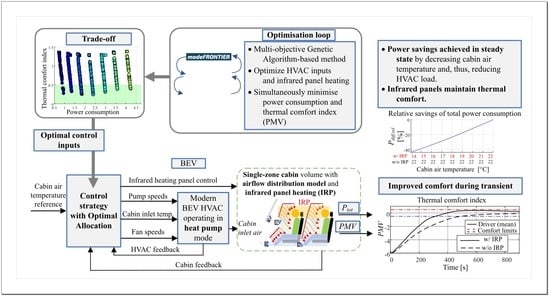
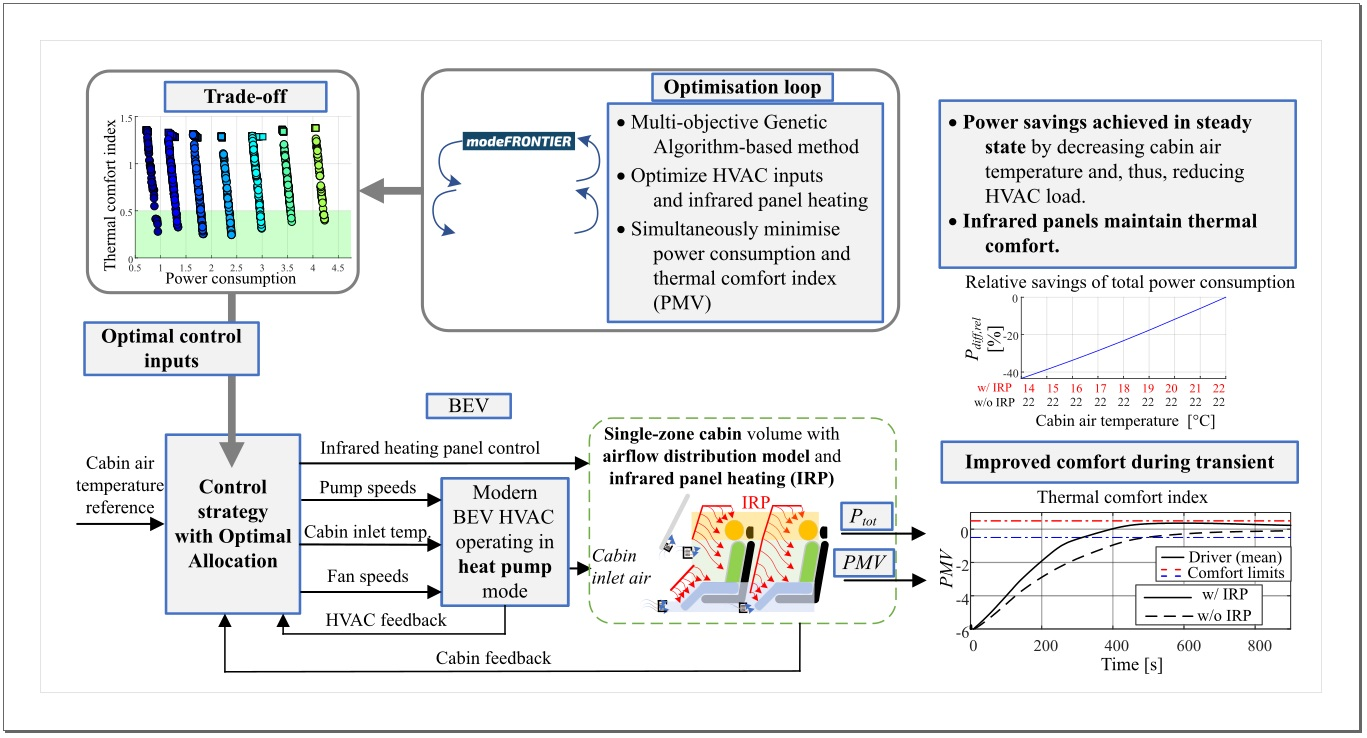
3. Control Input Optimisation Framework

The control input optimisation framework has been built around the one developed in [23], where the main extension relates to incorporating the IRPs model and controls.

3.1. General Aim

The optimisation is aimed at obtaining optimal control input allocation maps, which minimise total power consumption while maintaining high passenger thermal comfort. As a part of the hierarchical control strategy (see Section 5 and [23] for details), the optimised allocation maps transform the heating power demand Q . hR, commanded by a superimposed cabin air temperature controller, to low-level controller inputs/references for the given cabin air conditions (Tcab and RHcab). As described in Section 2 and [23], the above formulation of allocation optimisation problem allows for omitting the passenger cabin dynamics model, thus, leading to a straightforward and computationally efficient optimisations [23].
It should be noted that strictly speaking the optimal allocation ensures optimal control system performance only for quasi-steady-state operation, under which the actual HVAC variables (e.g., Tcab,in) accurately follow the optimal allocation commands (e.g., Tcab,in,R). This is not a major constraint since the (quasi)-stationary HVAC operation usually has a dominant influence on power consumption, because its share of a driving cycle is typically dominant over distinct transient operation (e.g., heat-up transient for which Tcab,in can considerably differ from Tcab,in,R due to HVAC system thermal inertia) [23].

3.2. Objectives and Constraints

The optimisation problem is to find an optimal set of control inputs, which simultaneously minimises the following conflicting optimisation objectives: the total actuator power consumption (J1) and the absolute value of driver’s mean PMV (J2):
J1 = min(Ptot)
J 2 = min ( | P M V ¯ d r | )
The control inputs are the cabin inlet air temperature reference Tcab,inR, the radiator fan setpoint P ¯ rf, two pump speeds np2 and np3, and the IRP control level settings uIRP1,2 (see Figure 3a and also blue box in Figure 4). For the optimised control inputs, the blower fan air mass flow rate m . bf can be determined directly from the following relation:
m ˙ b f = Q ˙ h R c p ( T c a b , i n , R T c a b ) ,
The cost functions J1 and J2 are subject to various hardware and controller setpoint tracking constraints. The control input constraints (left column of Table 1) relate to actuator hardware limits (those of pump speeds and IRP control level settings, as well as discrete states of radiator fan power setting) and software limits of cabin inlet air temperature reference for comfortable operation. Additional hardware-related constraints, such as compressor speed, EXV position, and blower fan control voltage limits, are not included in Table 1, as they are realised within the HVAC model as saturations of low-level feedback controllers.
The controller setpoint tracking constraints (right column of Table 1) are applied to ensure that the reference values of cabin inlet air temperature and superheat temperature are achieved for the optimised set of control inputs under steady-state conditions. In both cases the temperature tracking error of up to 1 °C is tolerated, as defined in Table 1. The third setpoint tracking constraint is related to the requested heating power, where the heating power error of 100 W is tolerated.

3.3. Optimisation Method

Optimisation of HVAC control inputs has been carried out by using a multi-objective genetic algorithm (GA) called MOGA-II, which is built in software modeFrontier. MOGA-II employs an effective multi-search elitism method and preserves good (Pareto or non-dominated) solutions without converging prematurely to a local optimum [28]. The implemented workflow is shown in Figure 4, with the MATLAB node placed at the centre.
The MATLAB node is used as an intermediary interface between the Dymola simulation model and modeFrontier. It feeds the control inputs determined by the GA to Dymola simulation model in an executable form, calculates the steady-state performance and constraint-related indices after the simulation is executed, and feeds them back to the GA. The model simulation is controlled as described in [29], where the model is initialised in accordance with the GA-set control inputs and the simulation time is set to be large enough to ensure that the steady-state condition is reached (1200 s).
In this study, the initial design of experiments for the GA is populated with 20 generations of control input values obtained using a quasi-random Sobol method and optimisation runs for 512 GA iterations. Execution of such an optimisation setup for a single operating point defined by Tcab, RHcab, and Q . hR takes about 40 min when running on a PC based on 3.5 GHz Intel Xeon central processing unit and when using three parallel design evaluations.
The control input constraints from the left column of Table 1 are implemented in the form of limited GA search space. All optimisation inputs have continuous values between the set bounds, with the exception of the main radiator fan power settings where only three distinct values are given to GA to choose from. The controller setpoint tracking constraints are implemented using the modeFrontier’s constraint node. The MOGA-II algorithm handles these hard constraints as soft constraints in the GA cost function by proportionally penalizing constraint violation [30].
The above described optimisation procedure has been repeated in a loop for the full set of cabin air conditions and heating power demands (Tcab, RHcab, Q . hR). The considered operating set range, optimisation setting parameters and main simulation parameters are given in Table 2. The following scenario is considered: the driver (with the metabolic rate activity of 1.2 and the clothing factor of 1.2) is the only passenger in the vehicle that is travelling at the velocity of 60 km/h and at the ambient temperature of Ta = −10 °C. Without the loss of generality, the cabin relative humidity was kept at the value RHcab = 10%, which was obtained by open-loop simulations of cabin thermal dynamics model. Recall that the cabin air relative humidity has negligible impact on PMV thermal comfort index.

4. Optimisation Results and Related Power Consumption Reduction Analysis

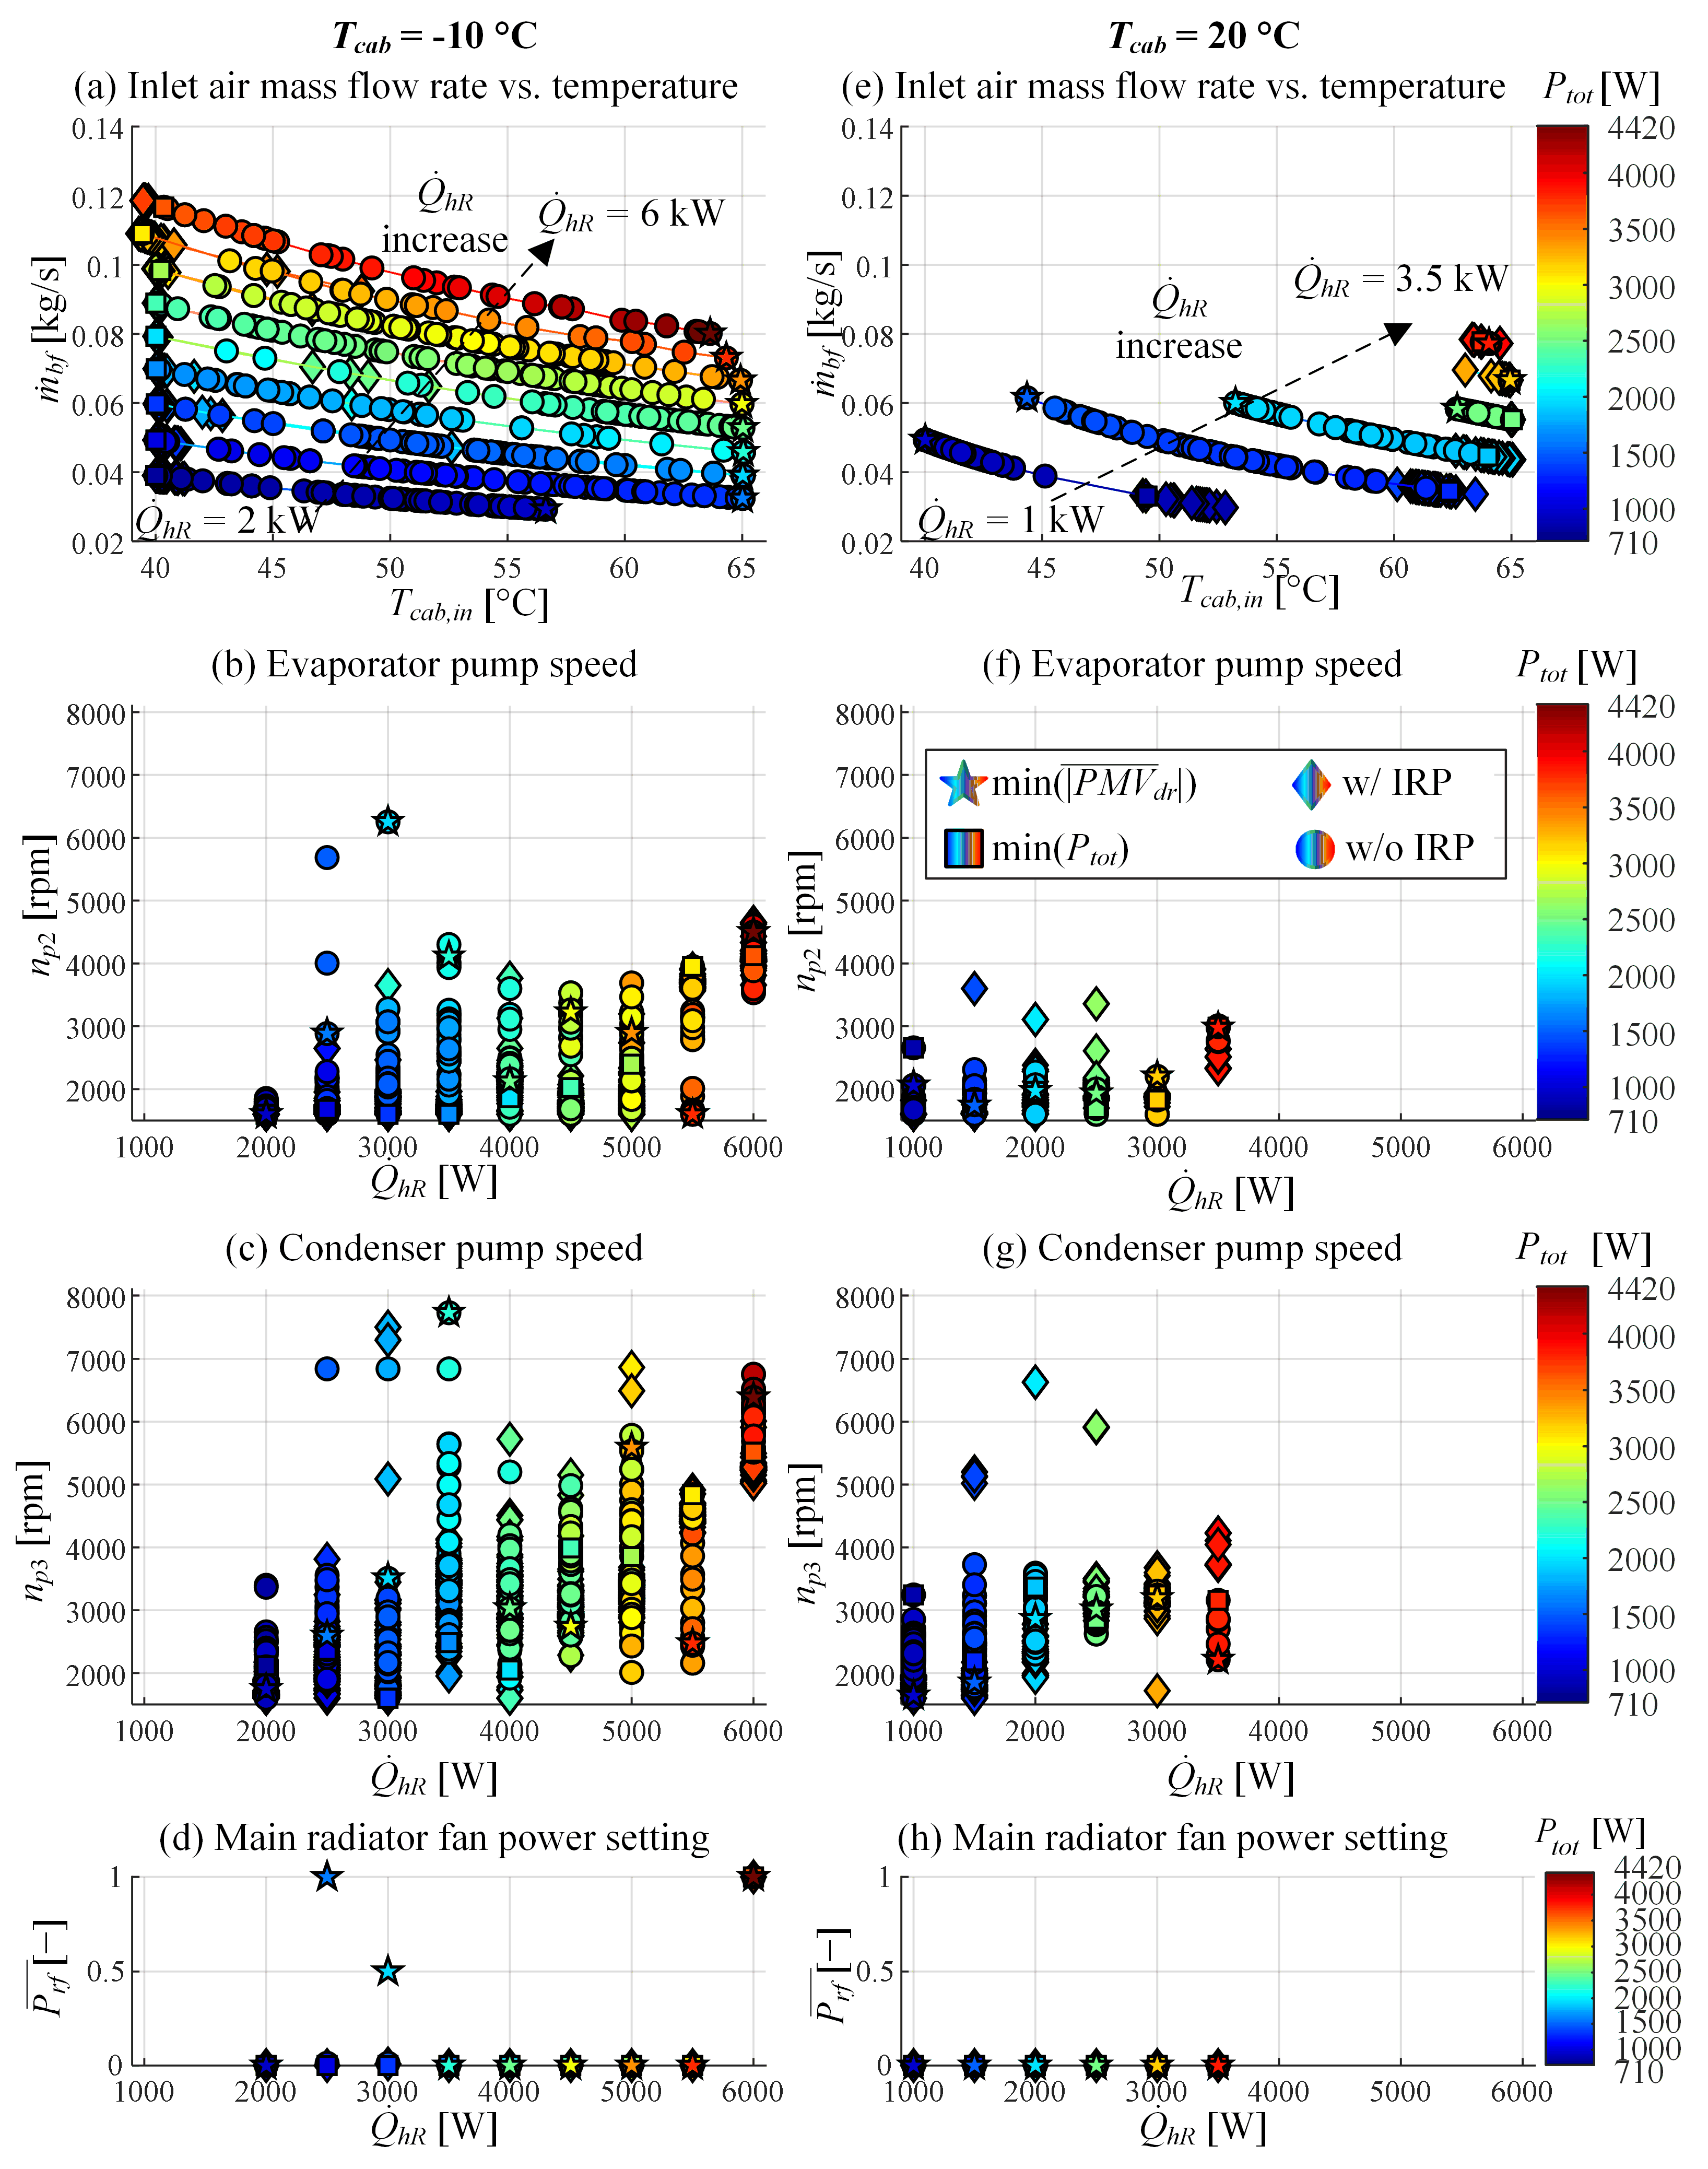
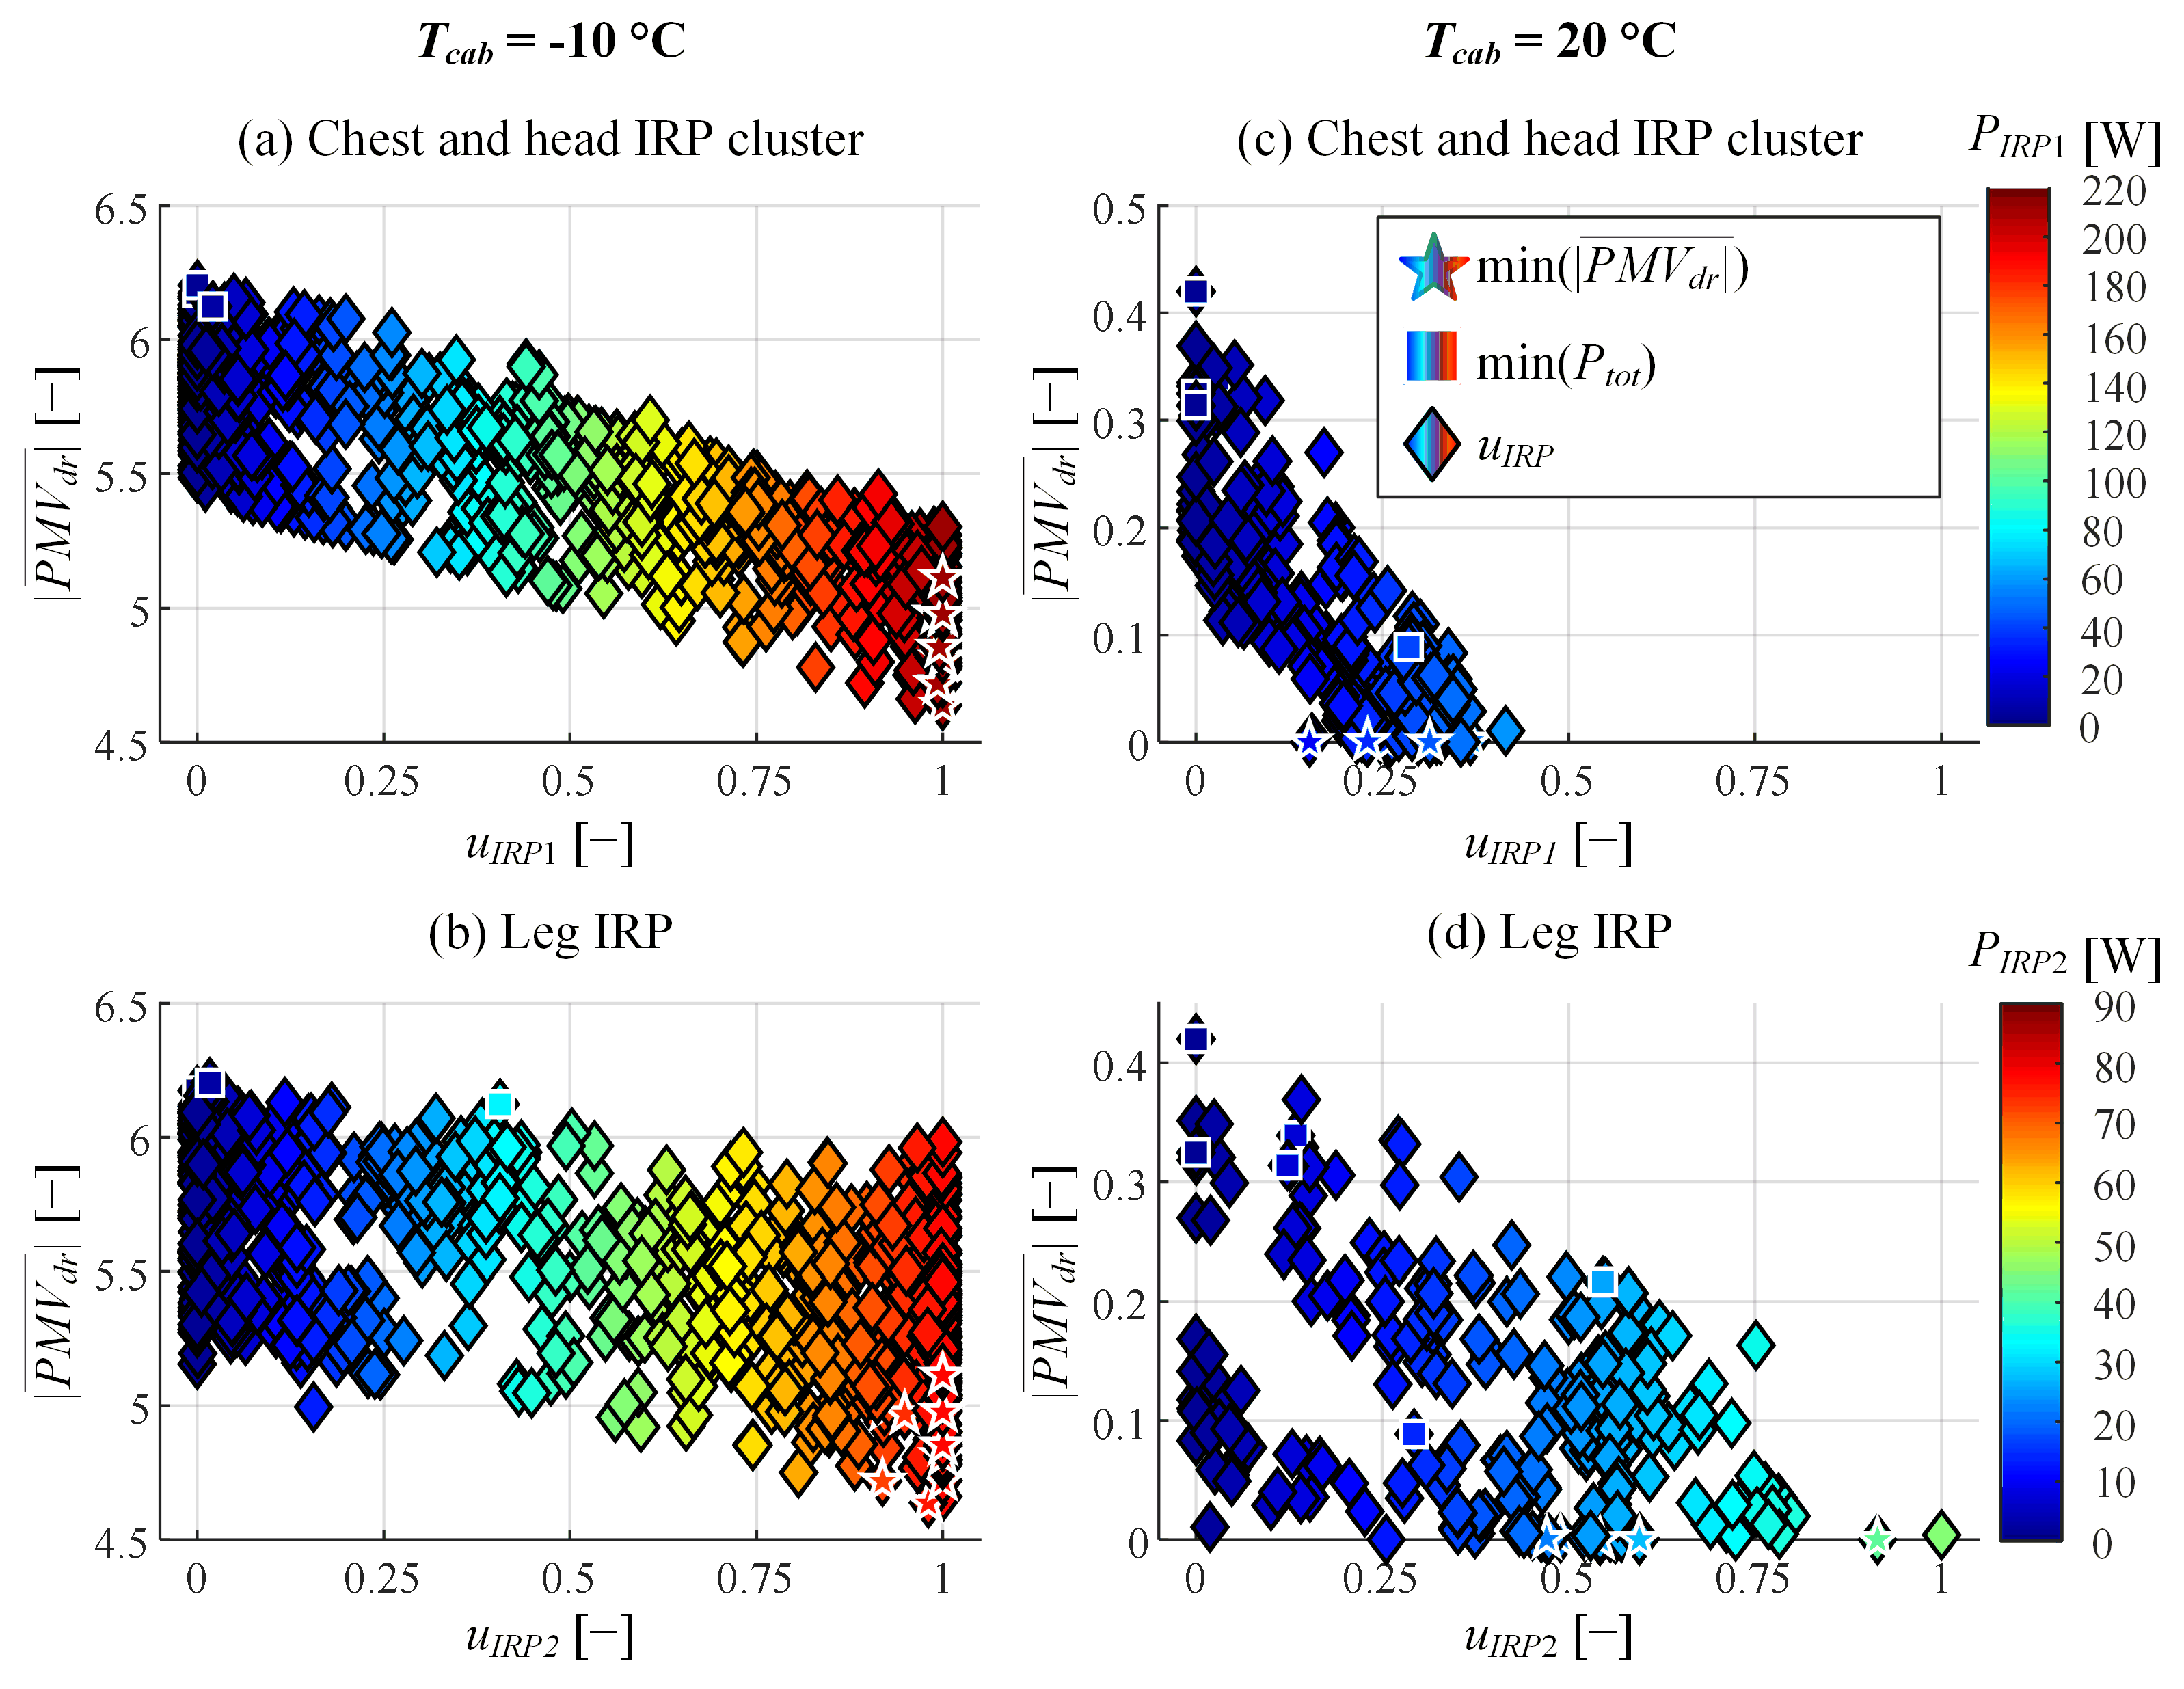
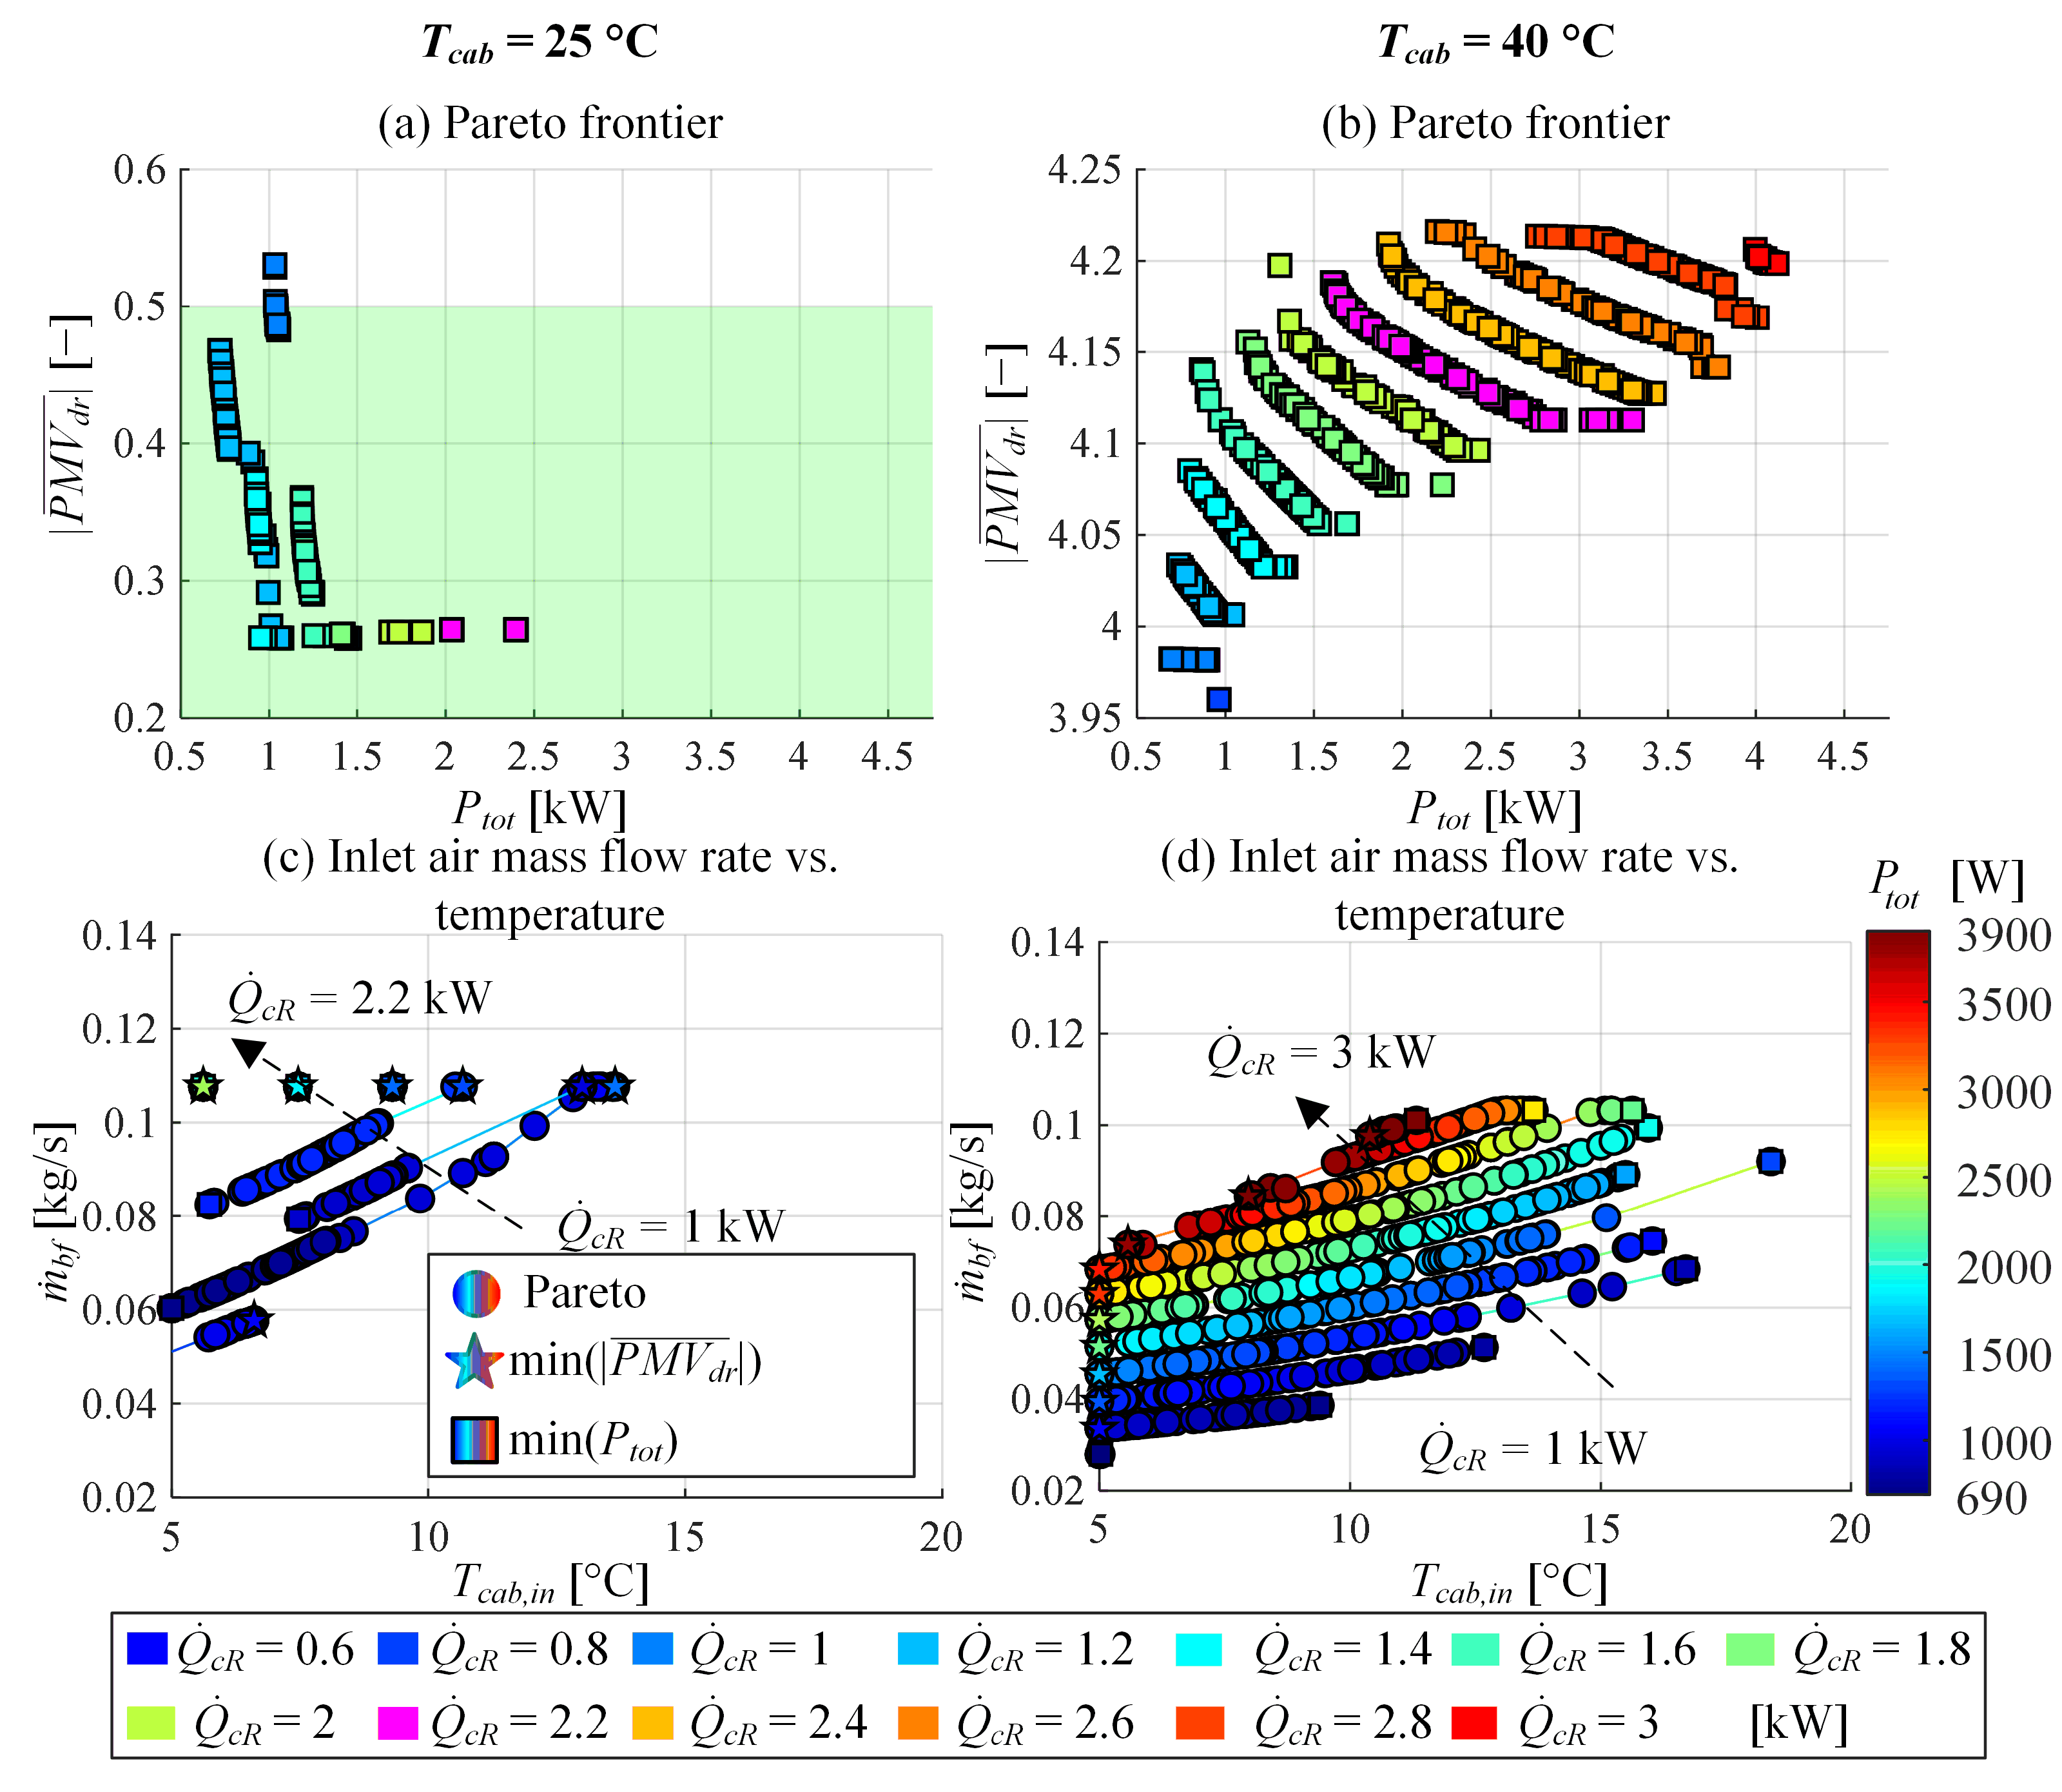
4.1. Optimisation Results

Figure 5 shows the optimisation results in the form of Pareto frontiers obtained for two characteristic scenarios: without (squares) and with use of IRPs (circles). These results show that by using IRPs (circles) it is possible to significantly improve the thermal comfort (the driver’s absolute mean PMV is reduced by around 1 to 1.5 point) in the cold cabin environment (below Tcab = 22 °C) at the expense of somewhat increased power consumption. This is especially advantageous at cabin temperatures that marginally fall outside the comfortable PMV range (e.g., 15 °C, Figure 5d), since using IRPs can bring the PMV into the comfort range in that case.
On the other hand, the impact of solely HVAC system optimisation on the thermal comfort enhancement is marginal (squares in Figure 5), i.e., there is a possibility to reduce the PMV by only up to 0.2 points. This is achieved by changing the cabin inlet air temperature and flow rate, while satisfying Equation (7) (a more detailed discussion on the effect is given with Figure 7). Not only the thermal comfort improvement is marginal, but the power consumption needed to achieve this improvement is rather excessive, particularly for high thermal energy demands Q . hR and low cabin air temperatures Tcab.
Figure 6 shows the trade-off between PMV and HVAC-only power consumption. In the majority of cases the HVAC power consumption does not depend on the IRP control input (circles in Figure 6), i.e., it coincides well with the minimum HVAC power consumption obtained for zero IRP control input. Only at the low-PMV endpoints, the optimiser chooses to increase the HVAC power consumption to gain marginal improvement of thermal comfort (see e.g., Tcab = −10 °C and Q . hR = 5.5 kW). This indicates that the HVAC and IRP controls can be effectively decoupled with a very marginal effect on system performance. The HVAC system should be optimised for minimum power consumption due to its marginal impact on PMV, while the IRPs should be used for improving the thermal comfort as much as needed due to its relatively minor effect on the total power consumption (Figure 5).
Figure 7, in its left and right column, shows the optimised control inputs corresponding to the Pareto frontiers shown in Figure 5a (Tcab = −10 °C) and Figure 5e (Tcab = 20 °C), respectively. Figure 7a shows the blower fan air mass flow vs. the cabin inlet air temperature for different heating power demands Q . hR and the corresponding total power consumption Ptot. At the considered low cabin air temperature, the spread of cabin inlet air temperatures and blower fan air mass flows for the case of no infrared panels used is rather wide. The lowest power consumption is achieved at the left end points (low inlet temperature/high mass flow; see squares in Figure 7a), while the maximum comfort (and the highest power consumption) is achieved with low air mass flow and high inlet temperature (star symbols). The optimisation results for the case of infrared panels included (diamonds) are mostly grouped around the lowest total power consumption end (low inlet temperature/high mass flow).
The optimised evaporator and condenser pump speed control inputs np2 and np3 are given in Figure 7b,c, respectively. Higher pump speeds are preferred for better thermal comfort for most of the heating power demands Q . hR. However, this increase in pump speeds has a major impact on the HVAC power consumptions, since it correlates with higher cabin inlet air temperatures and, thus, higher speeds of the compressor as the largest HVAC consumer.
The optimised radiator fan control input plot is shown in Figure 7d. The radiator fan is turned off for the majority of operating points, while half or full power is demanded only at high heating power demands Q . hR, with an exception of heating demands of 2000 W and 2500 W and the maximum comfort case. For the considered constant vehicle velocity of 60 km/h, this means that the ramming air mass flow through the main radiator is high enough for sufficient thermal energy exchange.
Figure 7e shows the blower fan air mass flow vs. the cabin inlet air temperature for the near-neutral comfort cabin temperature of 20 °C. The trade-off between cabin inlet air mass flow and temperature is narrower compared to low cabin air temperature, and the minimum total power consumption is achieved at lower air mass flow rate, unlike at low cabin air temperature. Similarly, the spread of pump speeds is narrower (Figure 7f,g), which is connected with the narrower spread of inlet air temperatures. The ramming air mass flow through the main radiator is sufficient for the conditions of high cabin air temperature and the radiator fan control input is set to zero (Figure 7h).
The optimised IRP control input plots are shown in Figure 8, again for the cabin air temperatures of −10 °C and 20 °C. The total consumption of the two IRP clusters (colour axis) is subject to both IRP control inputs (uIRP1 and uIRP2) and the local (cabin) air temperature. To achieve the IRP control input-demanded target radiant surface temperature at the lower cabin air temperature, the IRPs require greater input power when compared with warm cabin air temperature (cf. left and right columns of Figure 8). This is due to convective thermal heat exchange of IRP surface with the surrounding air.
As discussed with Figure 5, increasing IRP control input (and consequently the IRP power consumption) results in reduced PMV, i.e., improved thermal comfort. The spread of PMV values at a given IRP control input level (vertical spread in each subplot of Figure 8) can be explained by the fact that the Cluster 1 (chest and head; uIRP1) and Cluster 2 (legs; uIRP2) can operate at different control input settings.
At the low cabin air temperature (Tcab = −10 °C), the maximum comfort (star symbols) is achieved for both panels operating at the maximum IRP control input. At the near-neutral cabin temperature (Tcab = 20 °C), the maximum (lumped PMV-based) comfort is achieved by setting the IRP control inputs to approximately 25% and 50% for the head/chest and leg area, respectively.

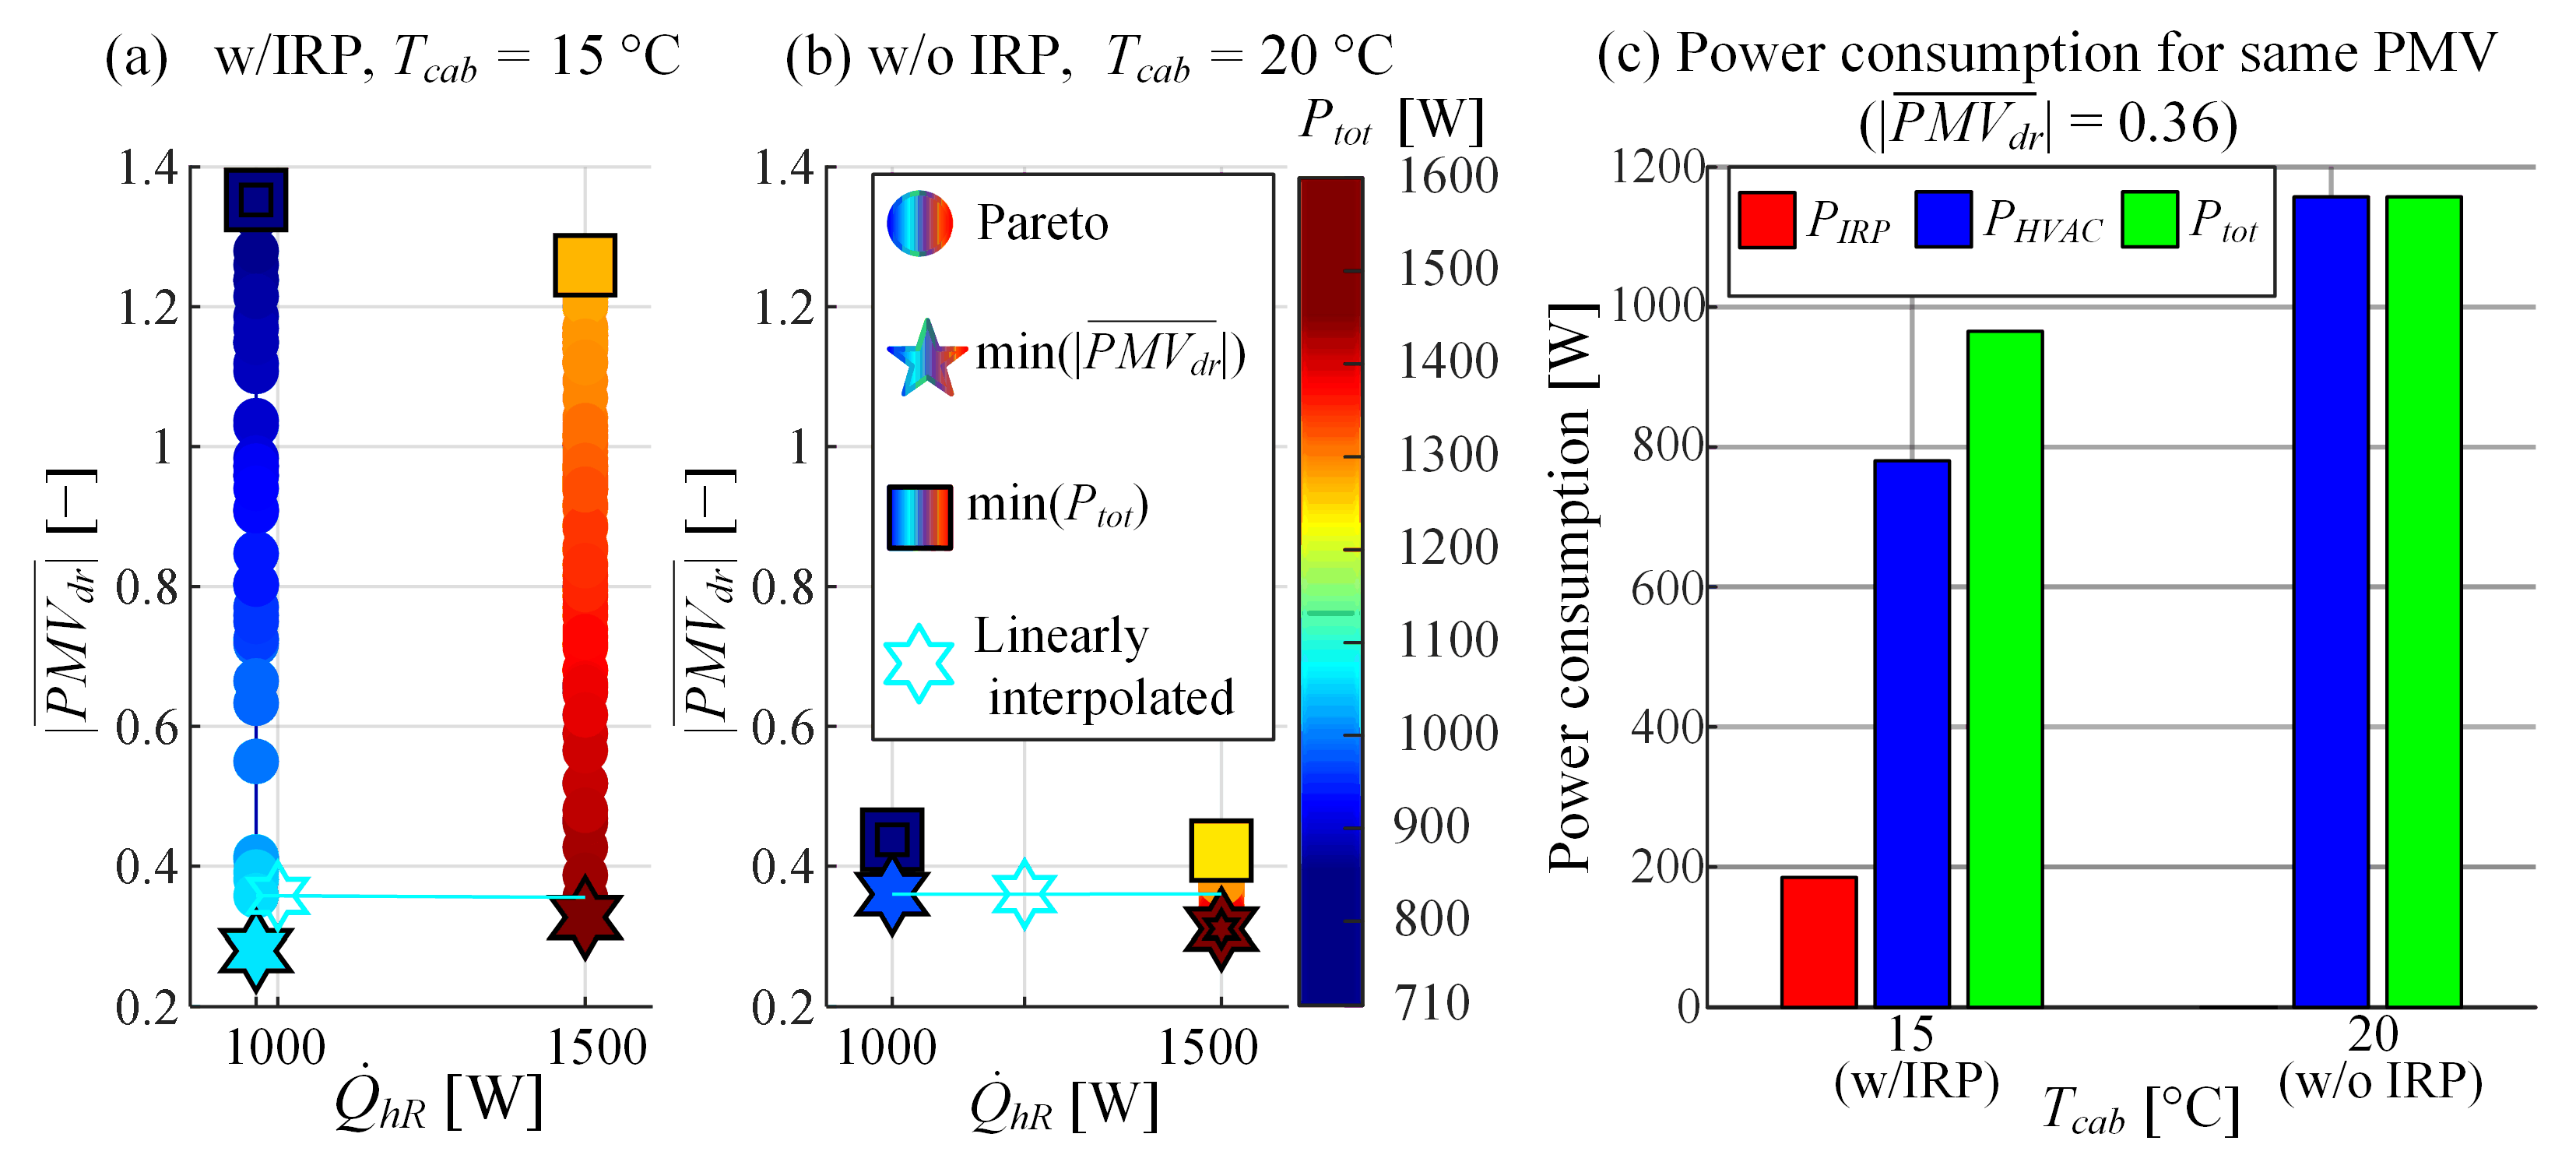
4.2. Power Consumption Reduction Analysis

The Pareto optimal results presented in Section 4.1 have indicated that HVAC and IRP control actions for a given cabin air temperature and heating demand are strongly decoupled, where the HVAC system should be tuned for minimum power consumption while the IRPs should be adjusted for favourable thermal comfort. This opens the possibility of reducing the total power consumption by reducing the cabin air temperature target below the nominal one and compensating for the loss of thermal comfort by engaging the IRPs [17]. The optimisation results are further analysed for steady-state conditions to verify if this possibility is viable.
The considered scenarios relate to the cabin air temperatures Tcab = 15 °C and Tcab = 20 °C and the cases with and without the use of IRPs, respectively. In Section 4.1, the optimisation results are presented for a wide range of heating demands Q . hR, thus, covering the transient and steady-state conditions for proper control strategy formulation. In order to obtain steady-state condition-related values of Q . hR, closed-loop simulations of cabin thermal model (with no solar load) have been conducted, which gives Q . hR = 1033 W for Tcab = 15 °C and Q . hR = 1201 W for Tcab = 20 °C. The thermal comfort of | P M V ¯ dr|= 0.36 obtained at Tcab = 20 °C is taken as the setpoint for determining the IRP control input at Tcab = 15 °C, both based on optimisation results.
Figure 9a,b show the Pareto optimal fronts, which are redrawn from Figure 5d,e for the heating power values Q . hR = 1000 W and Q . hR = 1500 W in a form with substituted x-axis and colour bar. The total power consumptions for the aforementioned, steady-state heating power values Q . hR = 1033 W for Tcab = 15 °C and Q . hR = 1201 W for Tcab = 20 °C are calculated by linear interpolation of the charts corresponding to Q . hR of 1000 and 1500 W for the comfort level | P M V ¯ dr|= 0.36 (see horizontal lines and hollow star symbols in Figure 9a,b).
Figure 9c shows the obtained power consumptions for different scenarios and the same thermal comfort level. The total power consumption (green bars) at the reduced cabin temperature of 15 °C and IRPs engaged is almost 20% lower than at the cabin air temperature of 20 °C and convective heating only. This is because the saving in HVAC power consumption when reducing the target cabin air temperature to 15 °C (blue bars) is greater than extra power consumption taken by IRPs in that case (red bars).

5. Simulation Results

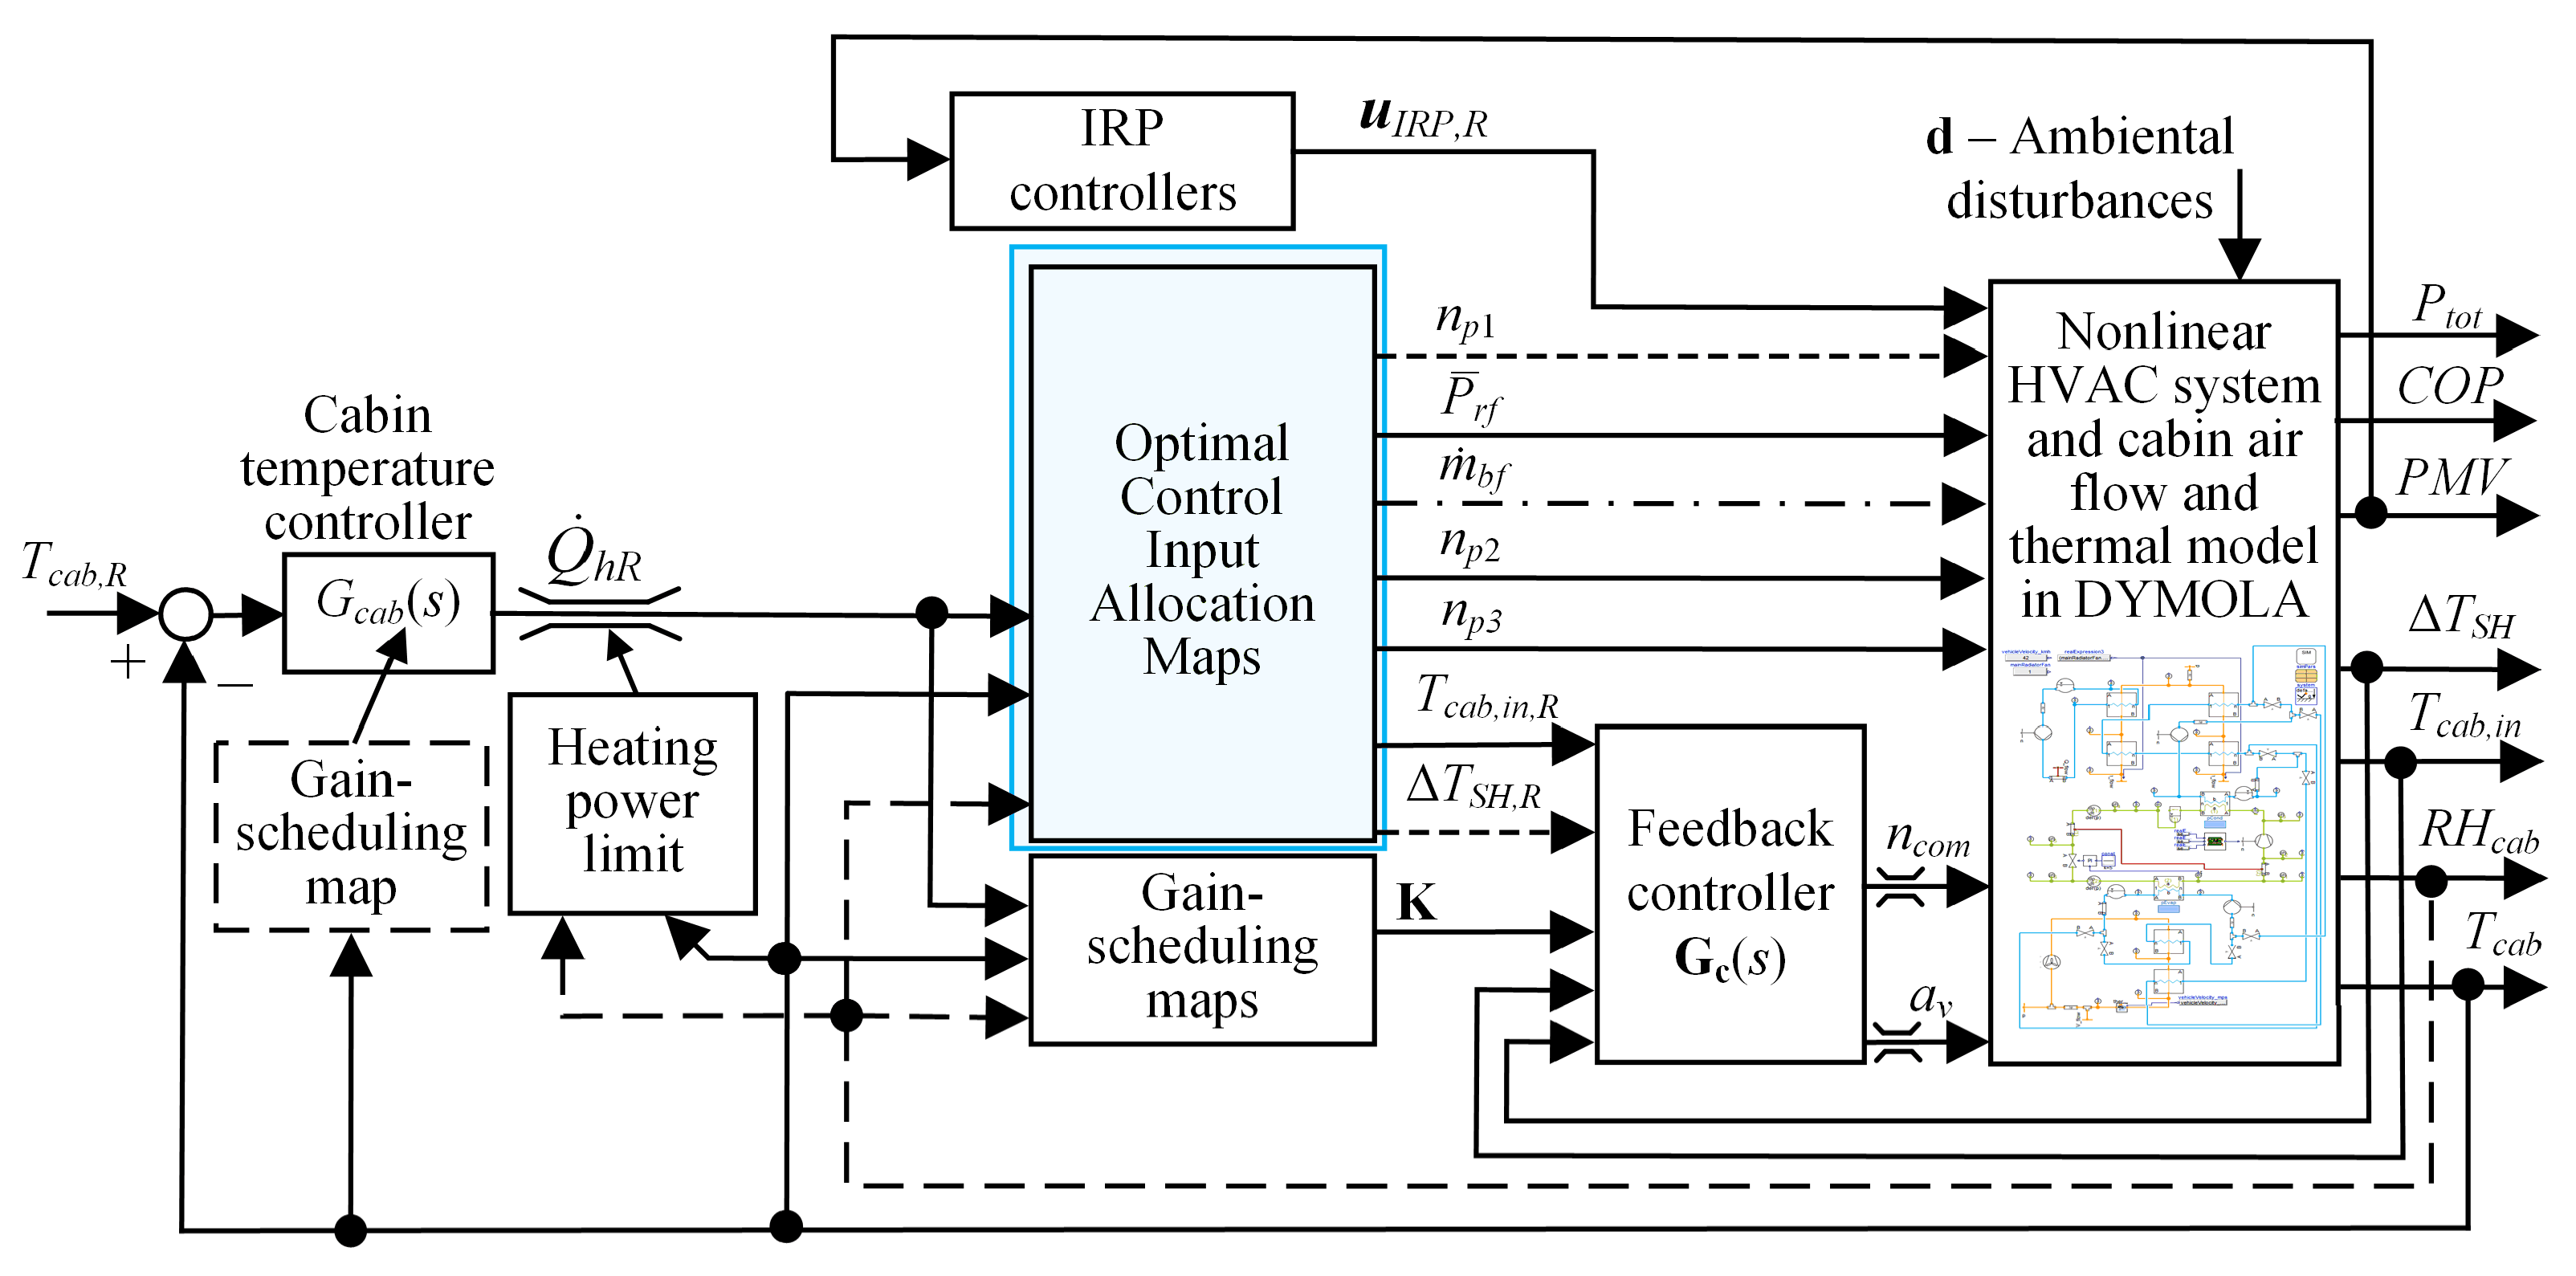
5.1. Control Strategy

Optimisation results presented in the previous section demonstrated that HVAC and IRP controls are effectively decoupled. Therefore, the HVAC control strategy can be based on the hierarchical structure proposed in [20] and refined in [23], with the control input allocation maps set for minimal HVAC power consumption. Such HVAC control system is shown in Figure 10 and extended with IRP control based on PMV feedback for improved comfort.
The high-level HVAC control subsystem consists of a superimposed cabin air temperature controller and optimal HVAC control input allocation maps. A superimposed PI controller regulates the cabin air temperature Tcab by commanding the heating power demand Q . hR. The heating power demand is limited based on time-varying maximum feasible heating power for the given cabin air temperature and relative humidity, which is obtained from the optimisation results and implemented in the form of a look-up table. The optimal HVAC control input allocation maps are implemented in the form of look-up tables with the cabin air temperature Tcab and heating demand Q . hR used as the map inputs. These look-up tables are obtained directly from optimisation results presented in Section 4 by choosing the design that corresponds to minimal HVAC power consumption (see [23] for details of allocation map generation).
The cabin air inlet temperature and the superheat temperature are controlled by PI controllers, which are given in a modified form with the P action moved into the feedback path. All of the PI controllers are extended with gain-scheduling maps and an anti-windup algorithm. The gain-scheduling maps of low-level controllers have been designed based on the controller parameter optimisation method described in [20] and [23], and they involve the heating power demand Q . hR and cabin temperature Tcab as inputs. The superheat temperature reference ΔTSH,R is typically set to a fixed value (5 °C, herein). Additionally, pressure limit controllers of P type are added to reduce compressor speed if the compressor outlet pressure or the compressor outlet/inlet pressure ratio exceeds a certain safety threshold.
The PMV feedback controller commands the driver-side IRP control setting. The controller is of a proportional type with a dead-zone and output saturation, as described by:
u I R P i =   { sat ( k P M V i e P M V , u I R P , max ) ,         for   e P M V >   Δ P M V > 0 0 ,           otherwise ,   i     [ 1 ,   2 ]
where ePMV = PMVR| P M V ¯ dr| is the driver’s absolute mean PMV error (which is positive for cold conditions, see Figure 3), PMVR is the PMV reference (set to the ideal value of zero), kPMV is the PMV controller gain, uIRP,max is IRP control setting limit (set to 1 or 100%), and ΔPMV is the PMV control error threshold for turning off the IRPs (set to 0.5, herein).

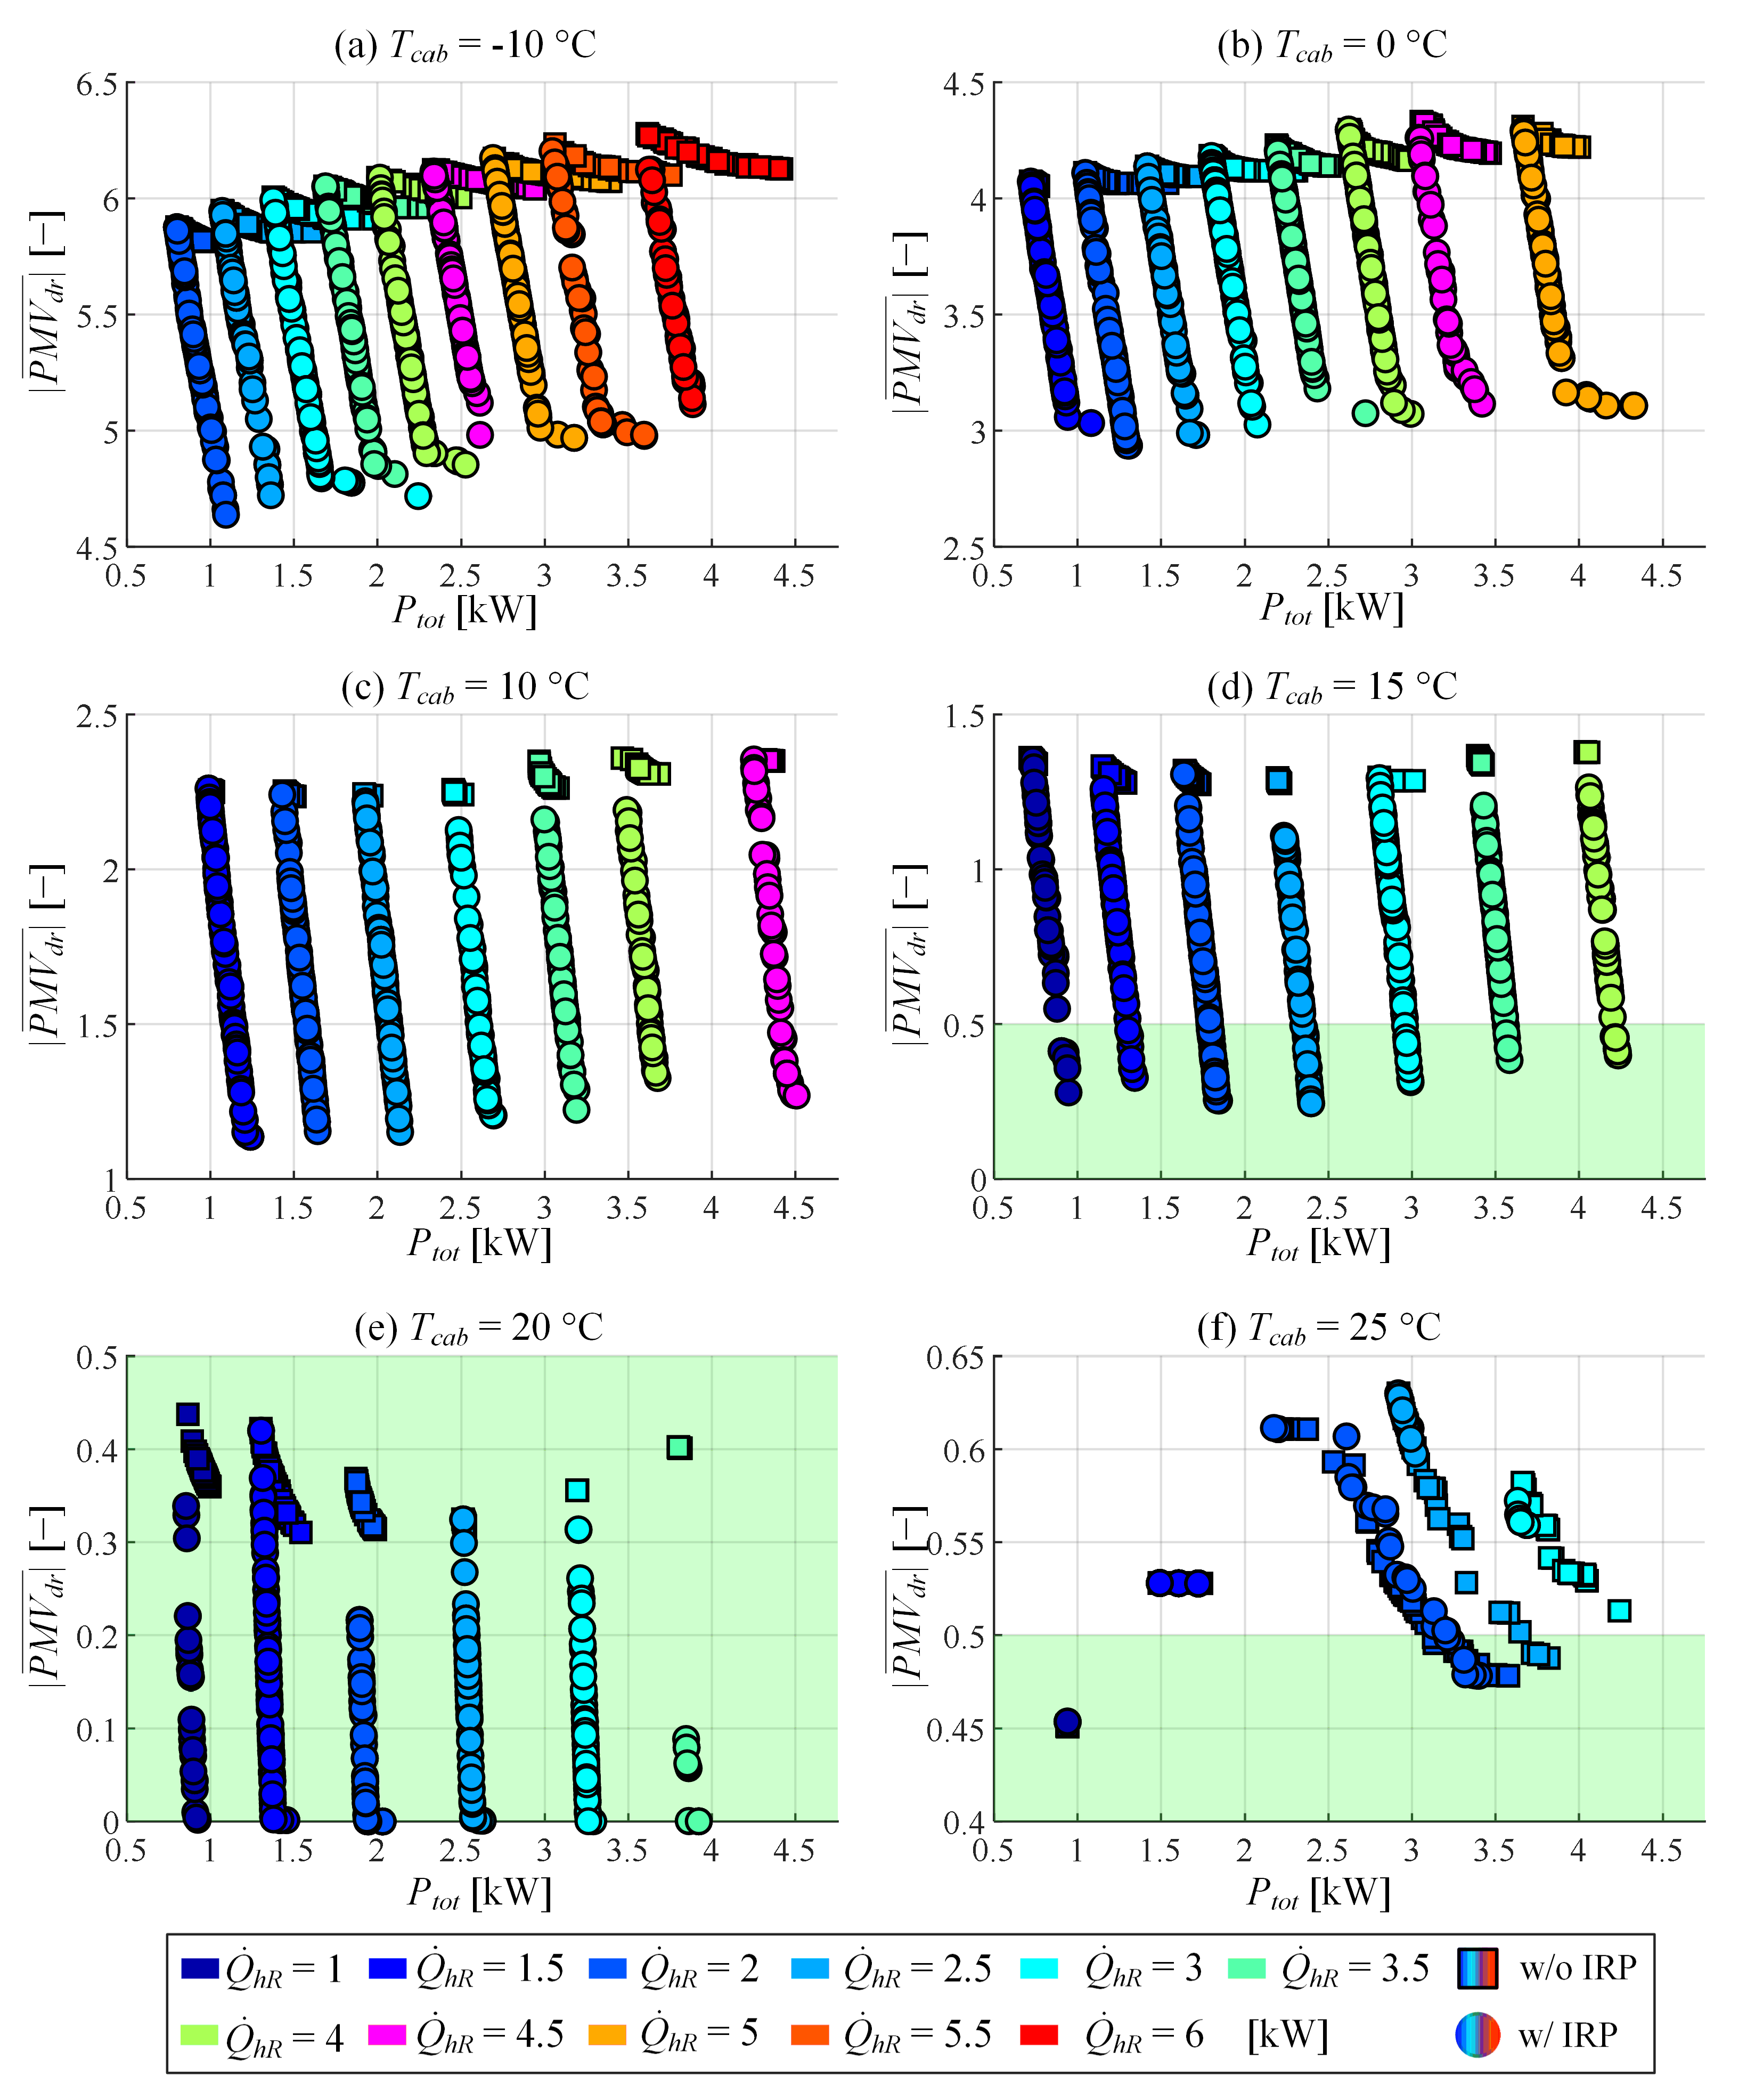
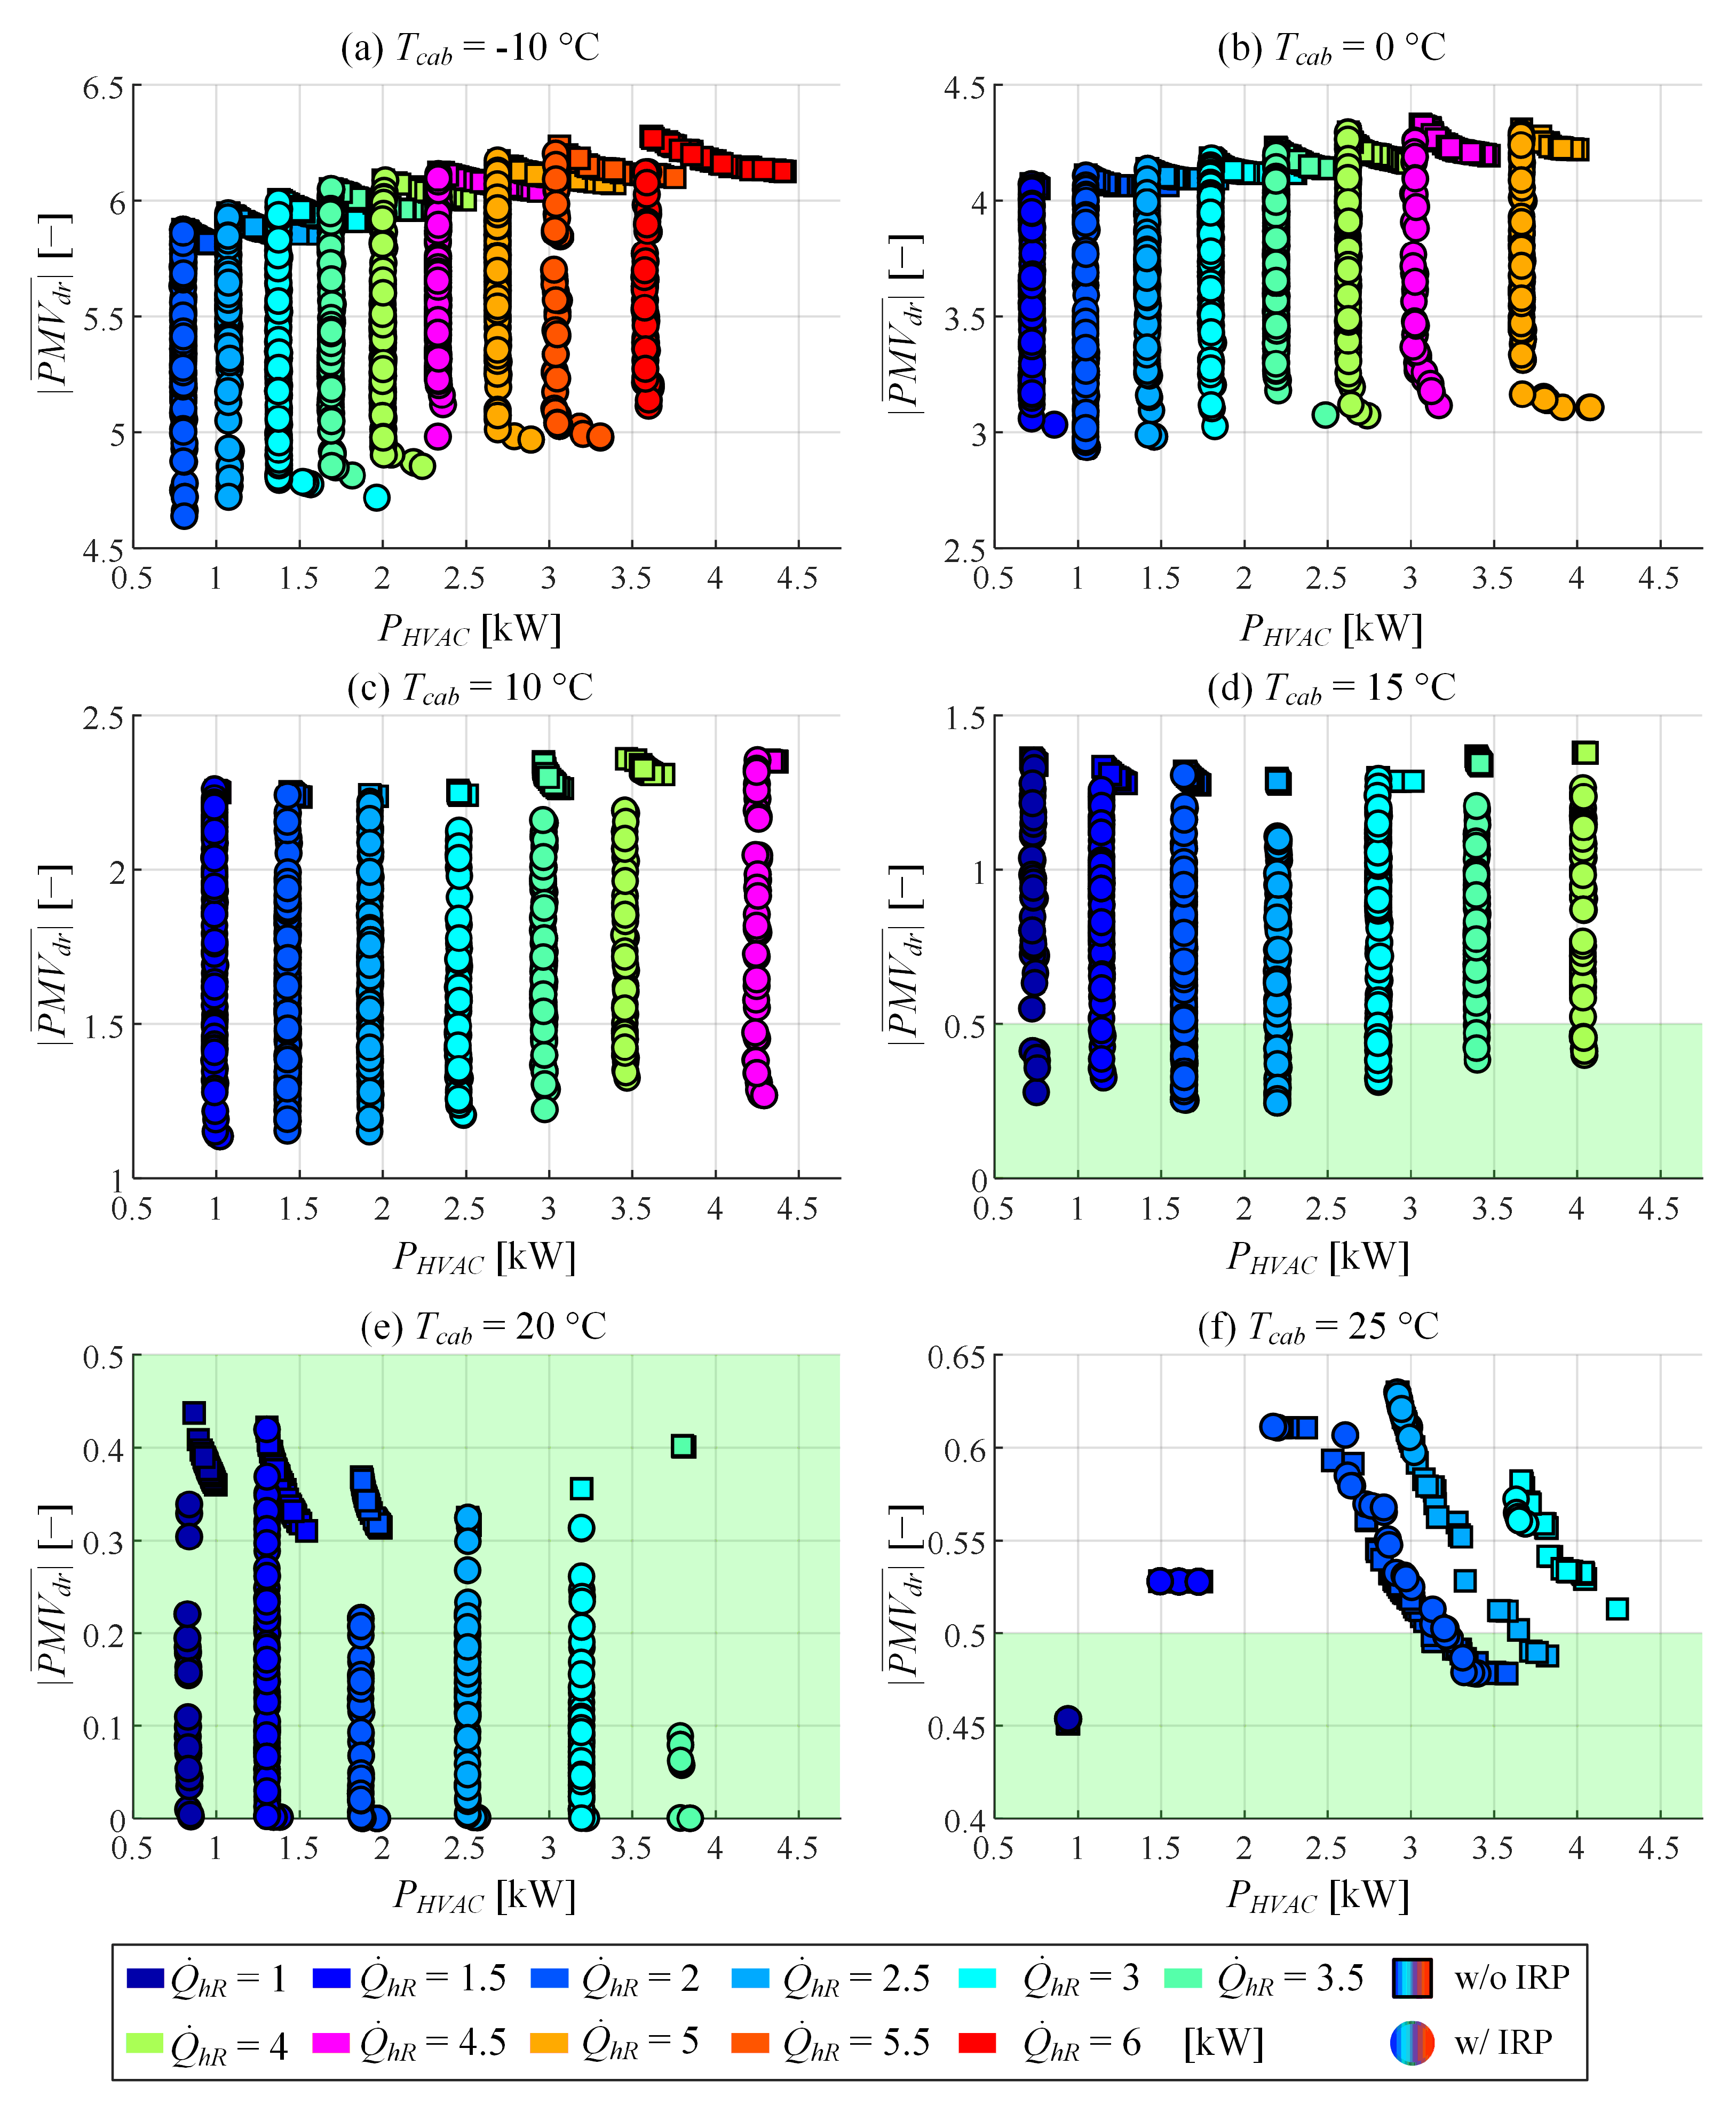
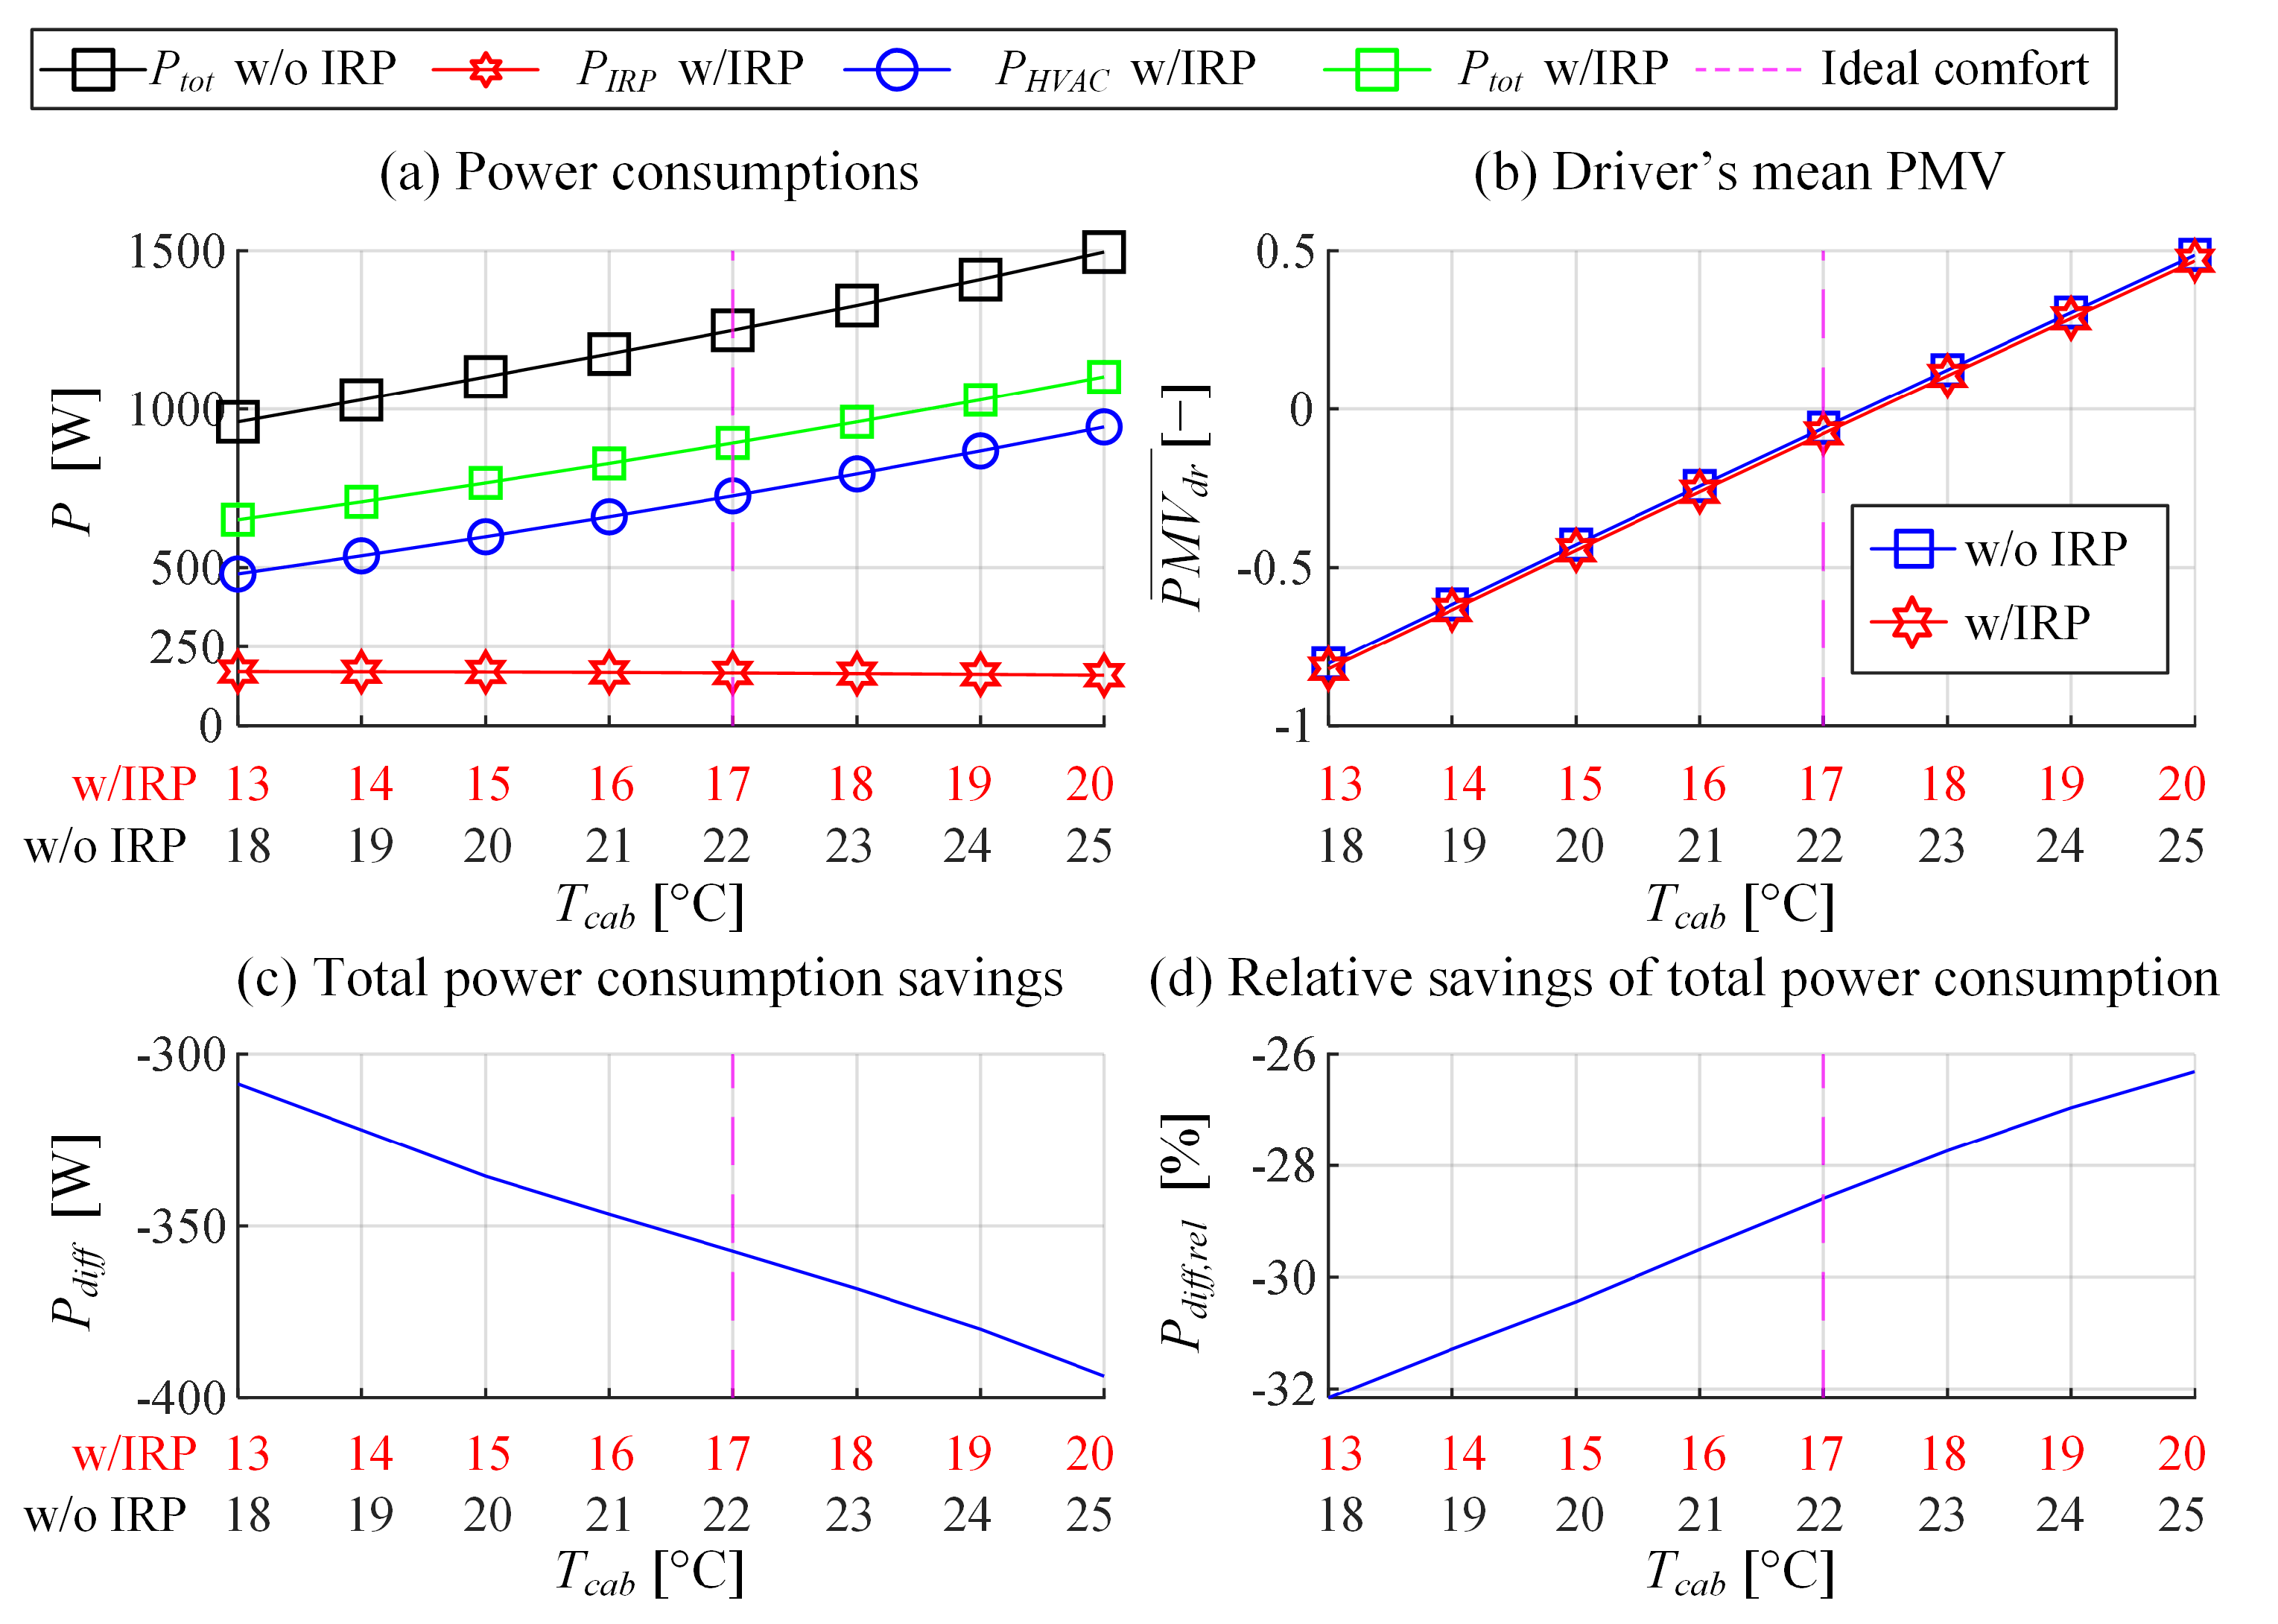
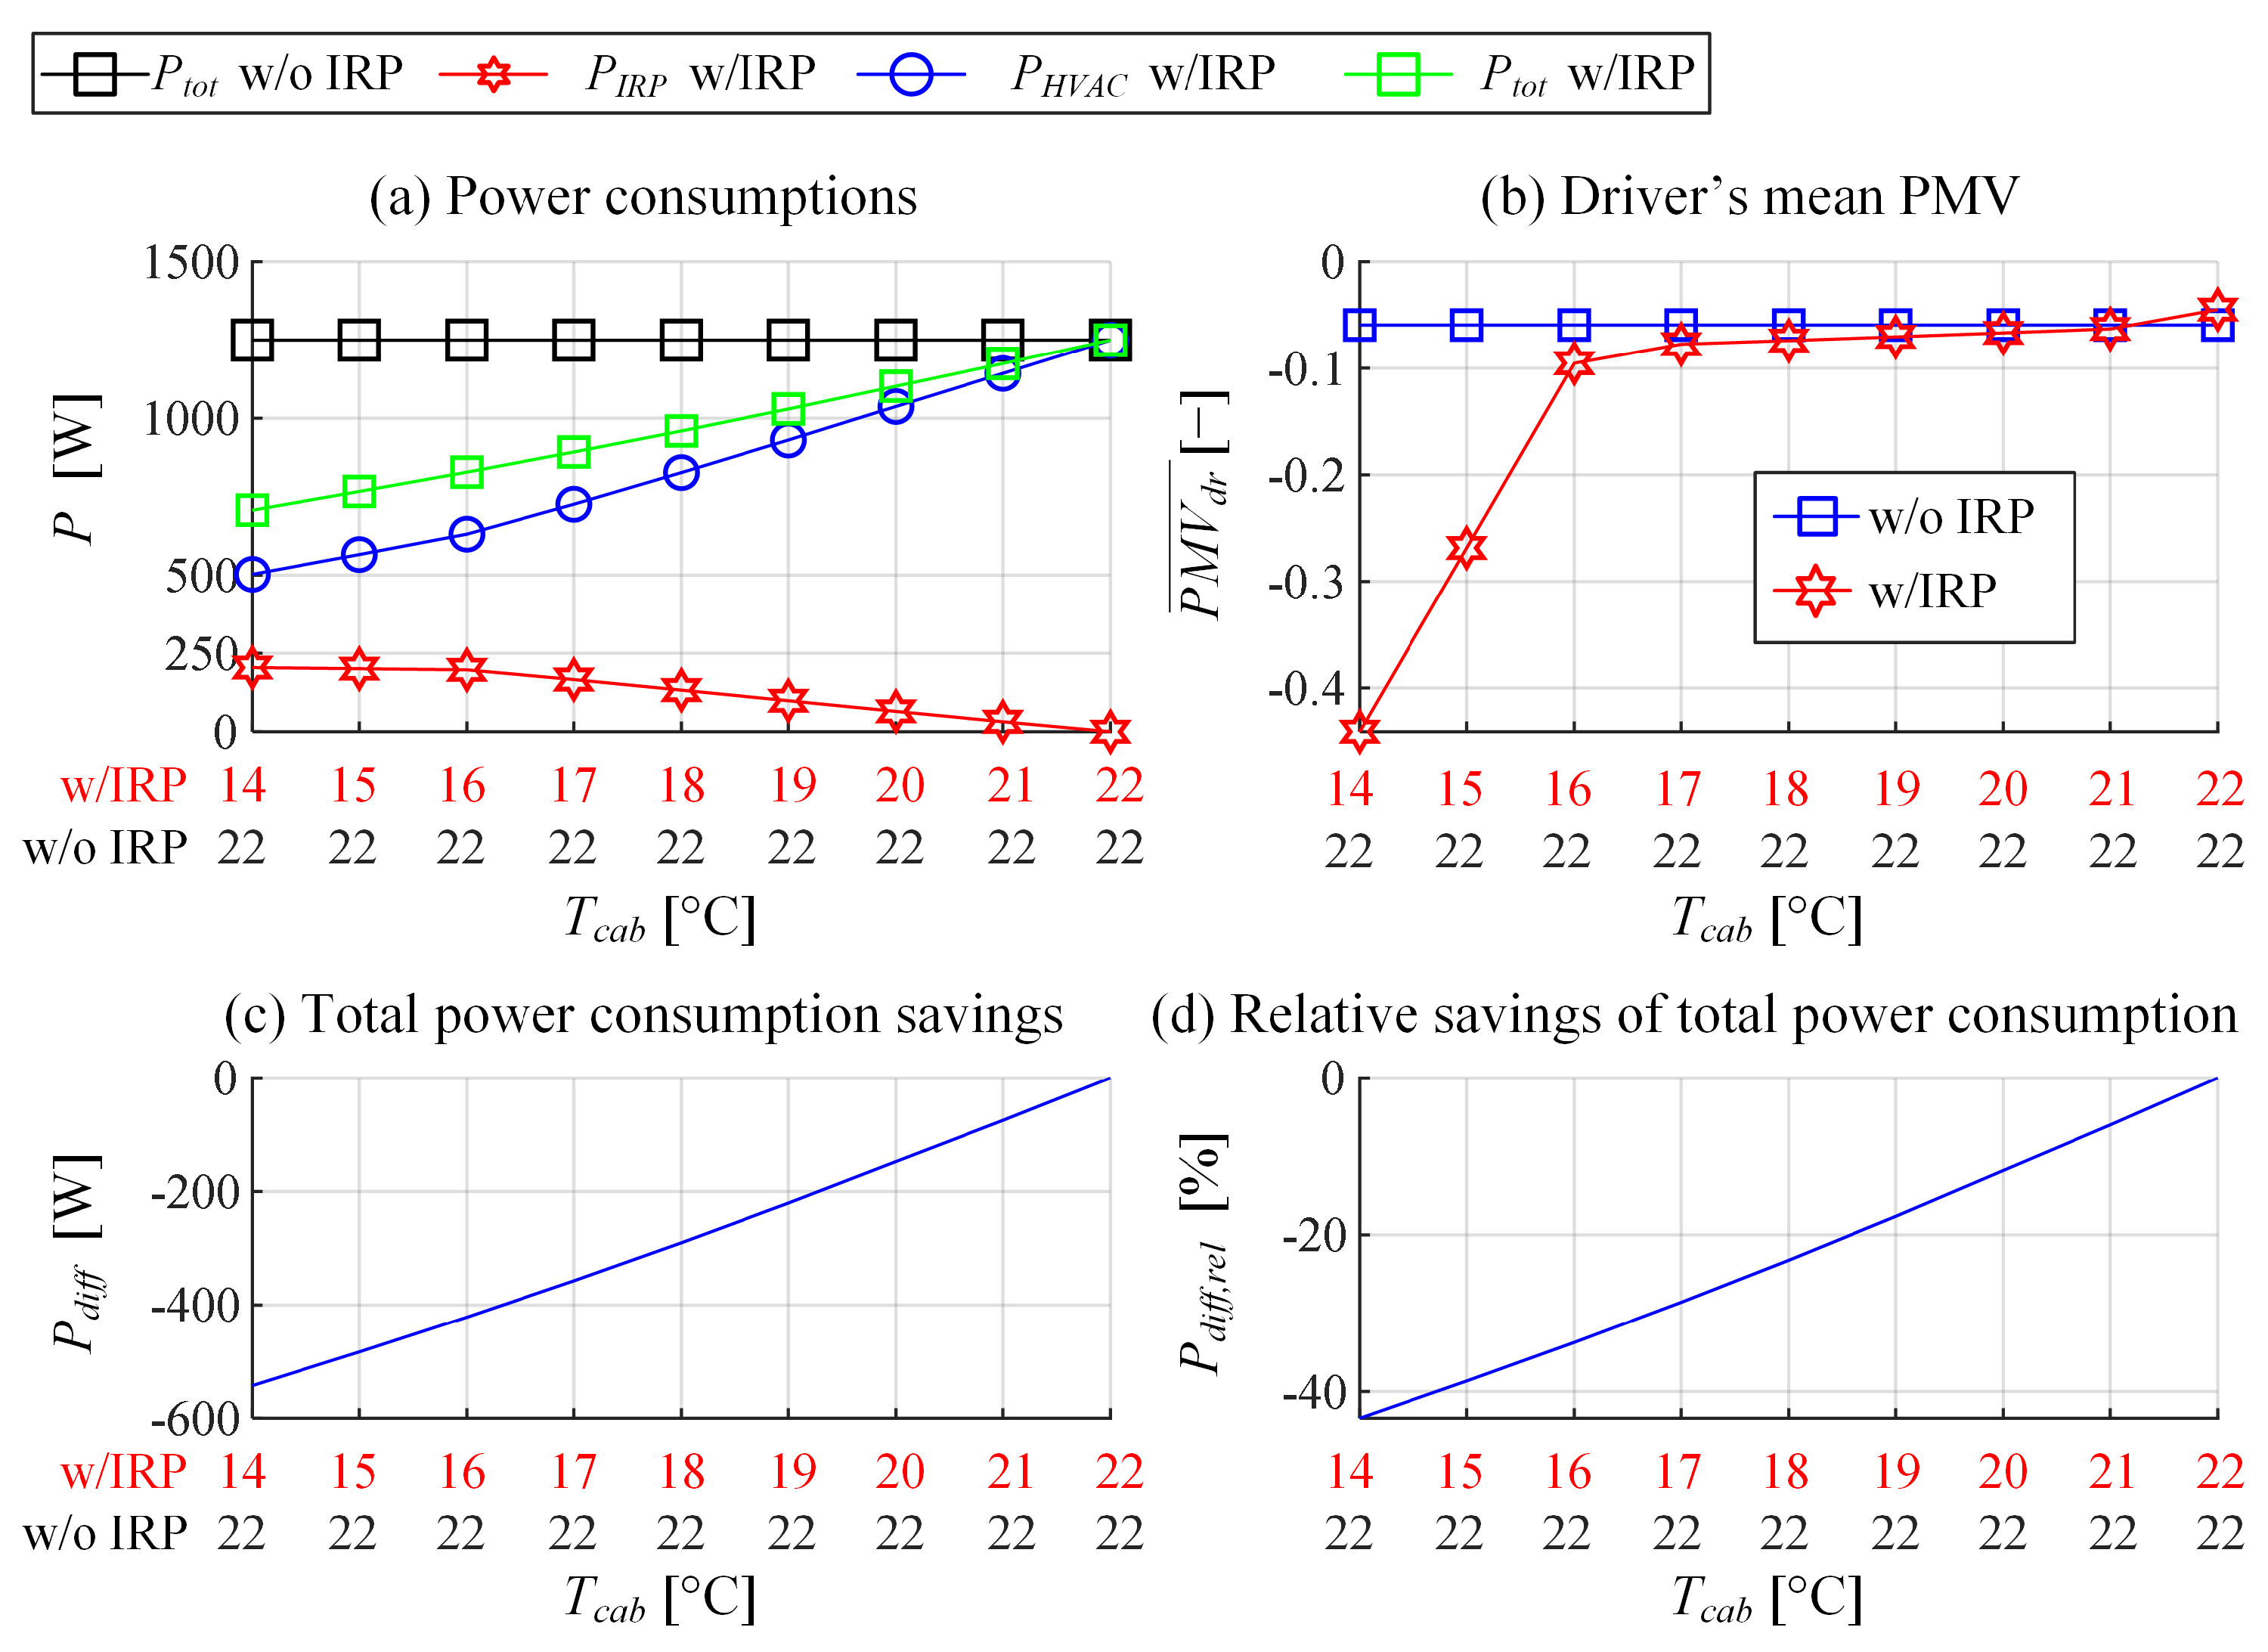
5.2. Simulation Analysis of IRP-Based Steady-State Power Consumption Reduction Potential

The potential of employing IRP heating for power consumption reduction while maintaining the thermal comfort has been investigated in more detail using the overall simulation model consisting of plant model (Section 2) and control strategy (Section 5.1). Similarly, as in the case of optimisation-based analysis, the steady-state operation is considered. In the first scenario, the difference between the cabin air temperature targets of HVAC-only and HVAC+IRP systems is kept at the constant value of 5 °C. In the second scenario, the cabin air temperature target is set to the fixed, high-comfort value of 22 °C for the HVAC-only system, while in the HVAC+IRP system the target temperature is reduced from 22 °C in increments of 1 °C down to 14 °C. The PMV reference (PMVR) of the HVAC+IRP system is set to the value obtained in the HVAC-only case, in order to provide a fair power consumption comparison for the two cases. The ambient conditions and other parameters remain the same as in the optimisation study from Section 4.
Figure 11 shows the simulation results obtained in the first scenario, where the temperature target difference equals 5 °C. Figure 11a indicates that both total and HVAC power consumptions, with or without IRP heating, increase with the cabin air temperature Tcab, which is due to increased cabin thermal load. On the other hand, the IRP power consumption is largely independent of cabin temperature. The thermal comfort is best (PMV is close to 0) at the HVAC-only system cabin temperature of 22 °C (see Figure 11b and cf. Figure 3). For all considered cabin air temperatures, the use of IRP heating results in power consumption reduction by roughly 300–400 W or 26–32%. In the best thermal comfort point, the power consumption saving is 360 W or 28.6%.
Figure 12 shows the results obtained for the second scenario characterised by the best thermal comfort setting of HVAC only system (Tcab = 22 °C). Figure 12a indicates that the total power consumption of HVAC+IRP system decreases with the fall of corresponding cabin air temperature target, as it is associated with the fall of cabin thermal load and, thus, the HVAC power consumption. However, the decreasing cabin target temperature requires higher IRP power consumption (Figure 12a) to maintain the thermal comfort (Figure 12b), which is feasible up to the temperature target difference of 6 °C; otherwise, the IRP power saturates, and the thermal comfort degrades. The total power consumption saving due to the use of IRP heating is 150 W or 12% for the temperature target difference of 2 °C, and 420 W or 34% for the temperature difference of 6 °C. Although the thermal comfort decreases towards cold when the temperature difference is increased beyond 6 °C, it still remains within the comfortable range PMV > −0.5 for the cabin air temperature of 14 °C, for which the power consumption reduction is 540 W or over 40%.

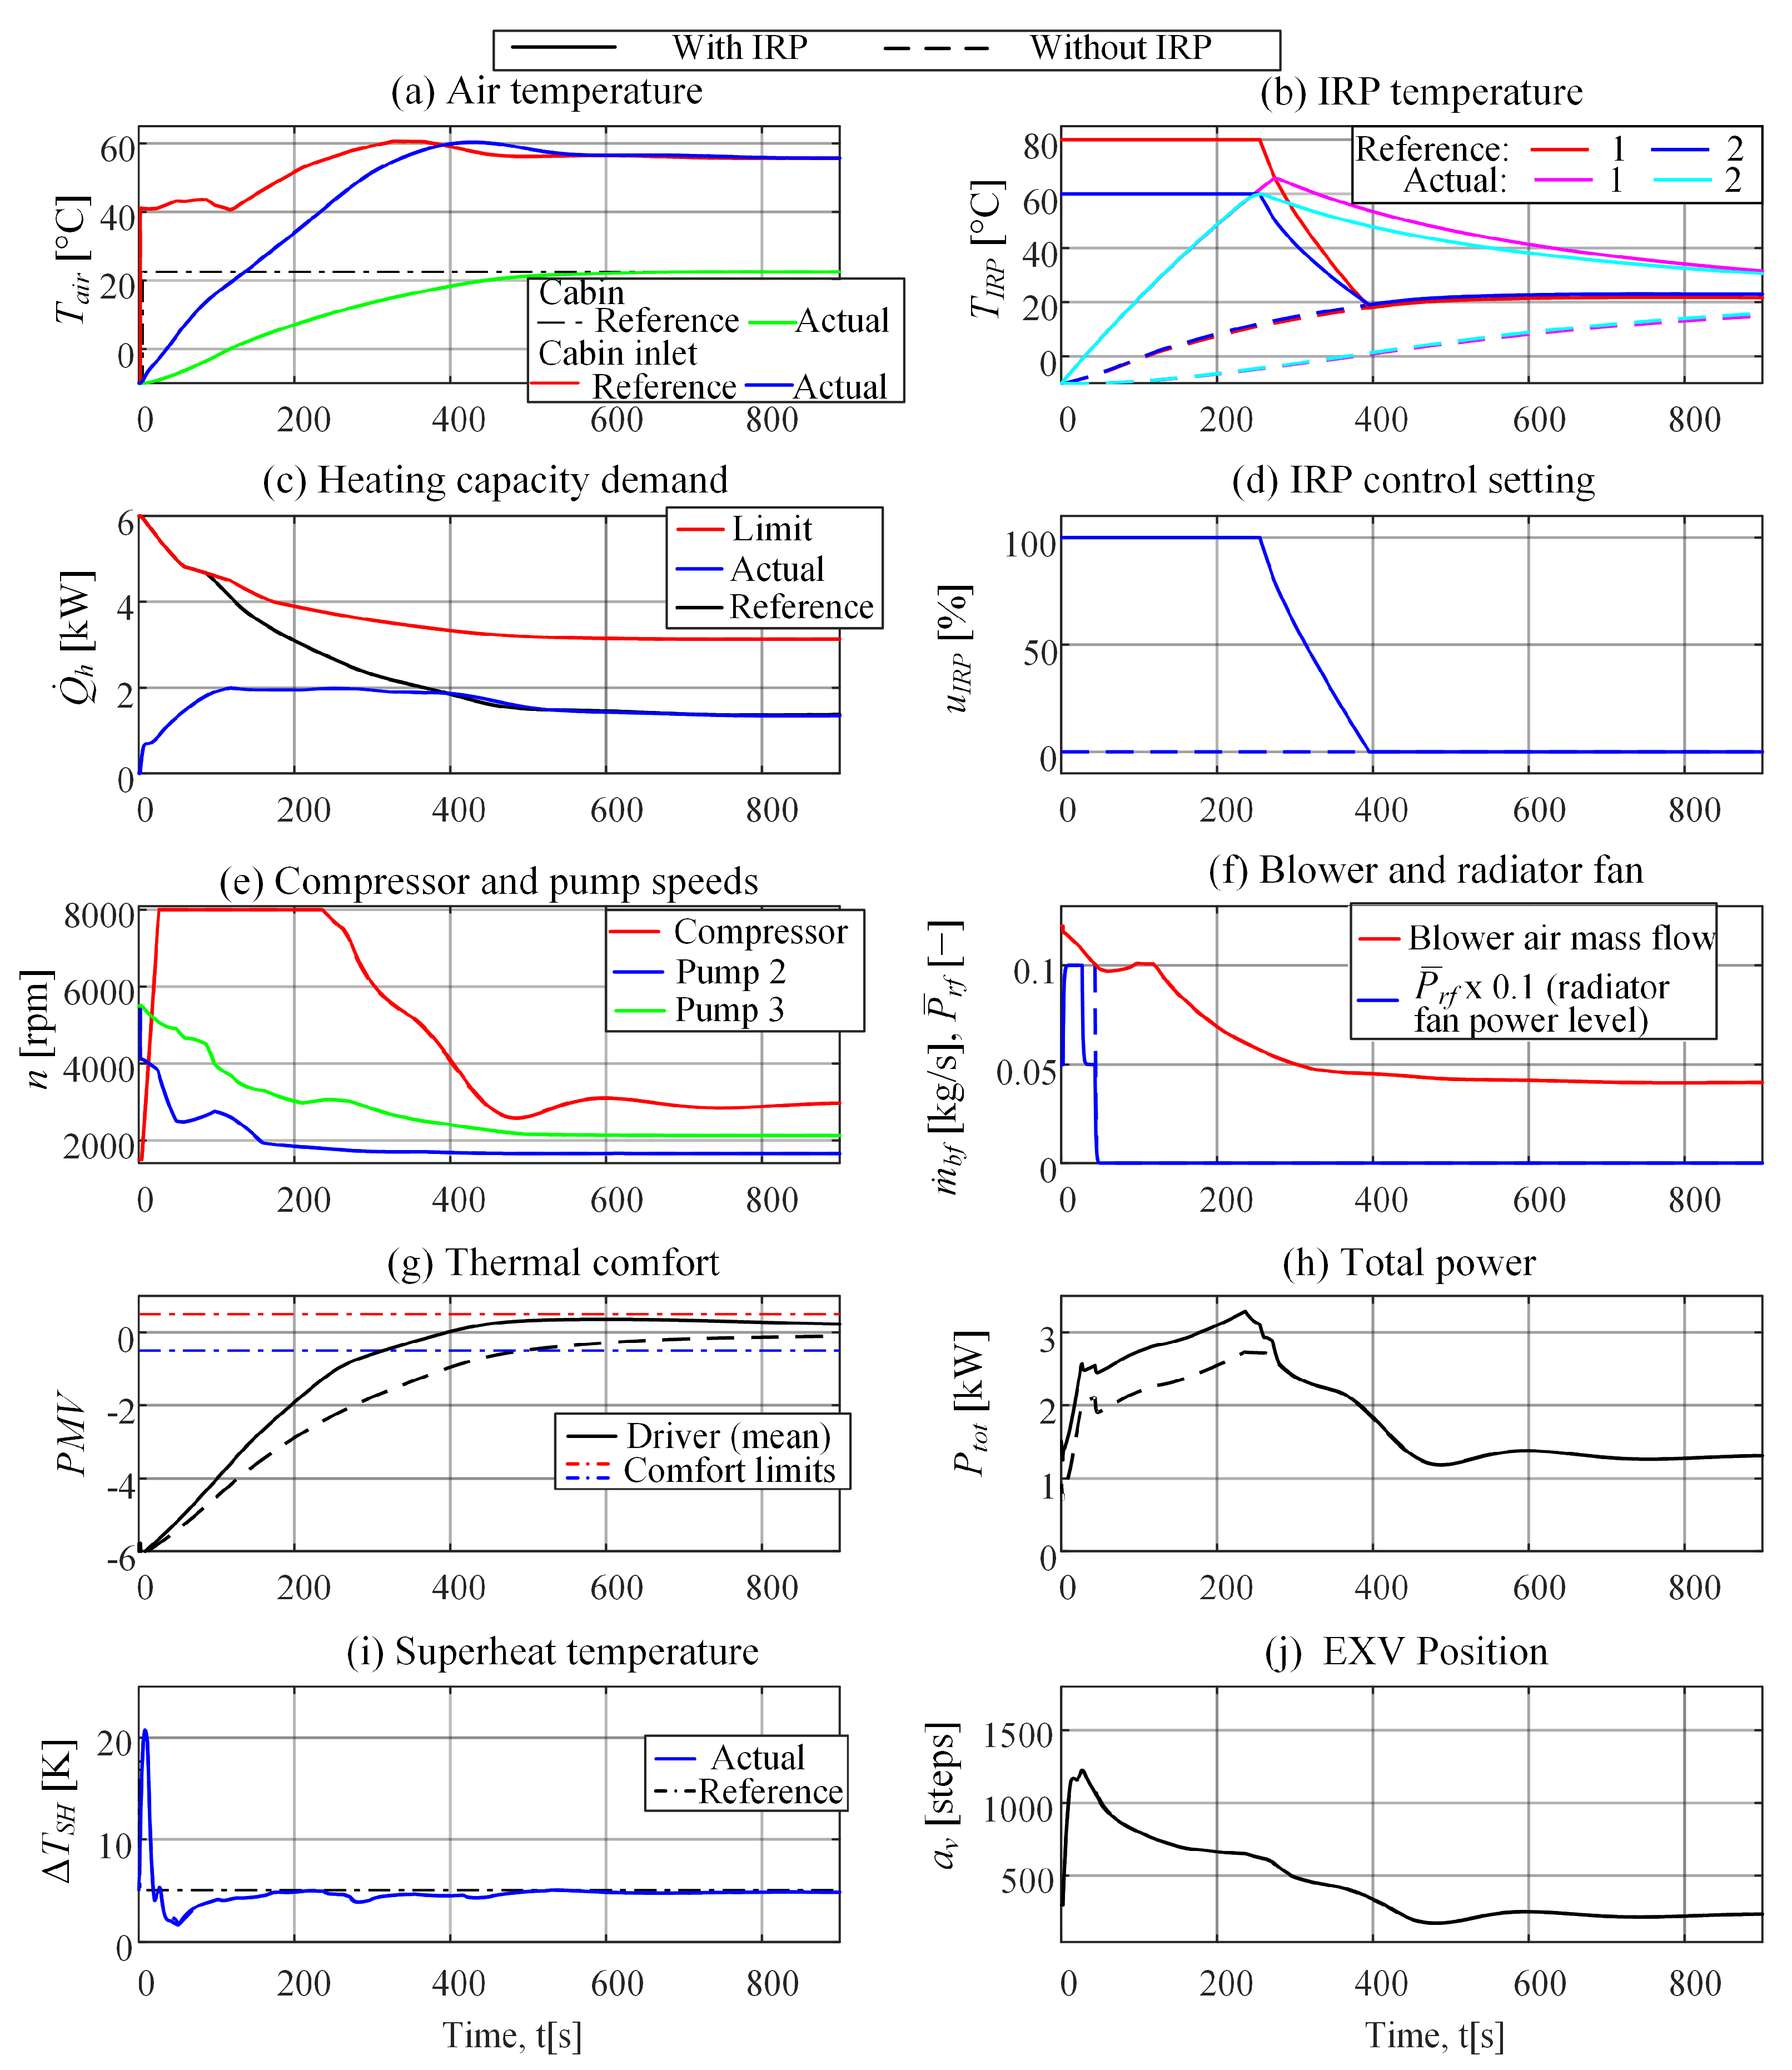
5.3. Heat-Up Scenario Simulation Results

The IRP-based power consumption reduction analysis presented in Section 5.2 is related to steady-state conditions. Another opportunity of improving the system efficiency based on IRP use corresponds to heavy transient conditions, such as those occurring during the heat-up process from a low ambient temperature. In the particular heat-up simulation test, the cabin and HVAC system are initialised with respect to ambient conditions given by Tamb = −10 °C and RHamb = 60%, and the goal is to reach the cabin air temperature setpoint Tcab,R = 22.5 °C in 10 min. The vehicle velocity is set to 60 km/h and no solar load is set. In the case of using IRPs, the case of reduced target temperature (Tcab,R = 17.5 °C) is additionally considered.
In all cases, the considered control performance metrics (Table 3) include:
  • Total energy consumed (Eel);
  • Two thermal comfort indices: (i) time to reach the comfortable range defined by | P M V ¯ dr | < 0.5 (tPMV,05), and (ii) integral of absolute value of mean PMV in uncomfortable range C2 [min] = ∫| P M V ¯ dr|/60 dt, if | P M V ¯ dr| > 0.5 [20].
Figure 13 shows the comparative heat-up simulation results for the HVAC-only and HVAC+IRP systems for Tcab,R = 22.5 °C. Since the cabin air temperature is not affected by the IRPs, its response and the response of allocated HVAC control inputs are the same for both systems. The cabin inlet air temperature reaches the value of 40 °C in approximately 4 min and approaches its reference value in 6 min (Figure 13a, blue and red lines). During this transient, the compressor speed is saturated (Figure 13e) and the power consumption (Figure 13h) is significantly increased compared to that occurring in the steady-state condition (i.e., in the final stage of response). For the same reason, the actual heating power differs from the demanded heating power (Figure 13c), and, therefore, the optimal allocation may be suboptimal during the transient phase.
In both cases, the cabin air temperature reaches 22 °C in 10 min (green plot in Figure 13a). However, it takes around 8 min for thermal comfort (Figure 13g) to reach the comfortable range (|PMV| < 0.5) in the HVAC-only case (dashed line), while when employing IRP heating the comfort range is reached in 5 min. The IRP control inputs are initially saturated to their maximum value (Figure 13d) and they then decrease as the PMV is approaching its target (zero) value (Figure 13g). The saturated IRP control inputs corresponds to the maximum IRP target temperatures of 60 °C for Cluster 2 (legs) and 80 °C for Cluster 1 (head and chest; Figure 13b). The panels have certain thermal inertia and it takes them around 3 min to reach 45 °C and 6 min to reach 60 °C. Moreover, once the IR panels are turned off, their temperature slowly decreases due to slow convection cooling by cabin air. During the transient stage, the total power consumption is increased by 500 W when using the IRPs (Figure 13h). Nevertheless, the indices listed in Table 3 under Case 2 indicate that the total energy consumption is only 9% higher, while the cumulative thermal comfort index C2 is reduced by 23% and the time to reach the comfortable PMV range is decreased by 36%.
The remaining allocated control inputs are dependent on the heating power demand and the cabin air temperature. The pump speeds (Figure 13e) are increased at the start and decrease once the steady-state condition is reached. Similarly, the blower fan (Figure 13f) is high at the start to achieve greater heating power demand. The radiator fan (Figure 13f) is mostly turned-off for the considered velocity of 60 km/h (cf. Figure 7g).
Table 3 also shows the comparison of thermal comfort and energy consumption indices for the case of reduced target cabin air temperatures of 17.5 °C. Setting the lower cabin air temperature reference reduces energy consumption by 21% in the HVAC only case (Case 3), but results in the worst thermal comfort performance—thermal comfort range is not reached. When adding IRP heating (Case 3), the thermal comfort remains similar or even better than in Case 2, but the energy consumption is now reduced by (6 + 9)/109 = 14%.

6. Discussion

The presented optimisation and simulation results indicate that HVAC and IRP controls can effectively be decoupled, where the HVAC control system should be optimised for best efficiency, while the IRP heating improves the thermal comfort. The benefits of thermal comfort improvement are present under both steady-state and transient (heat-up) conditions. In the former case, IRP heating allows for reducing the cabin air temperature reference for the HVAC system without compromising thermal comfort, thus, resulting in considerable energy savings (around 350 W or 30% for the particular system). In the latter case, the IRPs can improve thermal comfort by locally heating the passenger compartment until the slower, HVAC system reaches regular operation.
The proposed IRP controller relies on PMV feedback, which cannot be directly measured. For in-vehicle implementation, the PMV should be estimated from available measurements based on available sensors (see Section 2.1. for details) such as cabin air temperature and relative humidity and cabin inlet air temperature and flow. This requires special attention and calibration due to (i) unmeasurable factors such as passenger’s activity and clothing, which should be carefully set based on season or ambient temperature; (ii) lack of the air velocity measurement, which should be replaced by an estimate determined from the commanded blower air mass flow, air distribution flap positions and calibrated air flow distribution models; and (iii) lack of mean radiant temperature, which should then be estimated from available air temperature sensors and calibrated 3D cabin models. When multi-zone heating is considered, PMV should be estimated locally, and localised PMV control should be implemented taking into account different passengers’ preferences.
Vehicle velocity and ambient air conditions could potentially impact the performance of the HVAC system. The presented optimization results were obtained for the fixed values of vehicle velocity vveh = 60 km/h and ambient air conditions (Tamb = −10, RHamb = 60%). However, the optimisation method is readily applicable for any external conditions, and the input parameter space can be extended with additional ‘disturbance’ inputs such as vehicle velocity or ambient air temperature. A preliminary study on ‘disturbance’ inputs influence has been conducted, and the results point out that varying the ambient relative humidity has no impact on the HVAC system, while varying the ambient air temperature and vehicle velocity have a marginal influence on allocation maps. Namely, varying vehicle velocity changes ramming air flow through the main radiator and in turn changes the total air flow. However, it is possible to empirically correct radiator fan power level with respect to vehicle velocity to counteract for this disturbance effect. Similarly, higher ambient air temperature slightly affects the cabin inlet air temperature reference, and this can also be accounted for through an empirical correction.
Due to the thermal inertia of both HVAC and IRP system components, the control system could be extended with predictive information to anticipate the transient effects, especially slow cooling of IRPs when its command is set to zero. A method worth considering is model predictive control, as it is capable of handling the process dynamics, limits, and predictive information.
It should be noted that the HVAC system and airflow distribution models used in this study have been systematically built up, parameterised, and partly validated based on the available test bench data [25]. The models can be further refined/re-parameterised after performing in-vehicle tests if experimental results show considerable discrepancies with respect to simulation results. Similarly, the control strategy can be re-calibrated to improve the performance for final implementation. Experimental validation is an on-going activity conducted both in climate chambers with dynamometers and also through on-road tests, whose results and recommendations are subject of future publications.
Finally, the optimisation and subsequent analyses were performed for extreme ambient conditions (−10 °C) where high power consumption occurs. The system should be tested and/or optimised in less severe ambient conditions to fully exploit the infrared panel heating control strategy.

7. Conclusions

A multi-objective genetic algorithm-based method for obtaining optimal control inputs has been proposed and applied to an advanced battery electric vehicle HVAC system, equipped with infrared panels (IRP), for the heat pump operating mode. The obtained Pareto frontiers have indicated that HVAC and IRP control actions are effectively decoupled. The HVAC system should be controlled to achieve minimum power consumption, as its tuning has a relatively minor impact on thermal comfort both in heat pump and A/C mode (Appendix A); on the other hand, the IRP heating effectively improve thermal comfort with a modest effect on power consumption.
Based on these findings, the hierarchical control strategy from [23] has been parameterised and extended with a superimposed, proportional-like PMV controller acting through IRP control channel. The control strategy has been verified by simulation, both for various steady-state conditions and a heat-up transient scenario. The steady-state, simulation-based analysis has showed that decreasing the cabin air temperature target by 6 °C from the nominal target of 22 °C reduces the power consumption by 420 W or 35% and maintains the ideal thermal comfort, in extreme ambient conditions of −10 °C.
Moreover, the results point out that IRPs can significantly improve driver’s thermal comfort during the heat-up transient, where the combined HVAC+IRP system reaches the comfortable range in 314 s (36% faster) compared to HVAC only case, where the comfort settling time is 493 s. This comfort improvement is at the expense of increased energy consumption by 9%. However, if the target cabin air temperature is reduced by 5 °C, the energy consumption can, in fact, be reduced by 6% without affecting the thermal comfort gain.
The ongoing work includes experimental verification of the proposed control strategy, while the future work will concern development of model predictive controller to account for HVAC and IRP actuator transient behaviours, actuator limits, and possibly predictive information about various disturbances.

Author Contributions

Conceptualization, J.D., I.C. and I.R.; methodology, I.C., I.R. and J.D.; software, I.R. and I.C.; writing—original draft preparation, I.C. and I.R.; writing—review and editing, J.D.; visualization, I.R. and I.C.; supervision, J.D. All authors have read and agreed to the published version of the manuscript.

Funding

The QUIET project has received funding from the European Union’s Horizon 2020 research and innovation programme under grant agreement No. 769826. The content of this publication is the sole responsibility of the QUIET consortium partners and does not necessarily represent the view of the European commission or its services.

Acknowledgments

It is gratefully acknowledged that the research work of the first author has been partly supported by the Croatian Science Foundation through the “Young researchers’ career development project-training of new doctoral students”.

Conflicts of Interest

The authors declare no conflict of interest.

Abbreviations

AbbreviationDescription
HVACHeating, ventilation and air conditioning
VCCVapour-compression cycle
A/CAir conditioning
EXVElectronic expansion valve
CFDComputational fluid dynamics
HCHeater core
LTRLow temperature radiator
IRPInfra-red panel
PMVPredictive mean vote
MOGAMulti-objective genetic algorithm

Nomenclature

SymbolsUnitDescription
RH%Air relative humidity
T°CTemperature
m . kg/sFluid mass flow rate
nrpmRotational speed
PWPower consumption
P ¯ -Discrete actuator power setting
VVVoltage
av-Electronic expansion valve steps
Q . WHeat flow
P M V ¯ -Mean PMV index
cpJkg−1K−1Isobaric specific mass capacity
e-Control error
k-PMV Controller proportional gain
EelWhTotal energy consumption
SubscriptsDescriptionSubscriptsDescription
ambAmbientSHsuperheat
cabCabinIRPInfra-red panel
inInletvehVehicle
outOutletmetMetabolic
rfMain radiator fansolSolar
bfBlower fanrecRecirculation
pCoolant pumpdrDriver
comCompressorhHeating
Rreference

Appendix A

Multi-objective optimisation of the HVAC control input allocation maps has also been carried for the air-conditioning (A/C) mode originally considered in [23]. The optimisation framework described in Section 3 is subject to the following modifications:
  • The air recirculation is set to 100%. This means that the blower fan inlet air temperature and the relative humidity correspond to the cabin air conditions, i.e., Tin = Tcab and RHin = RHcab.
  • The ambient air temperature is set to 40 °C and the relative humidity is 60%.
  • The air distribution vents are set to “VENT” mode, where the air is only distributed at chest-height positioned air vents (see [25] for details).
  • The lower limit of cabin inlet air temperature is set to 5 °C, while the upper limit is equated with the cabin air temperature to prevent heating, i.e., 5 °C < Tcab,in,R < Tcab.
  • The control inputs are allocated with respect to three inputs: the cooling power demand Q . cR, the cabin air temperature Tcab, and the cabin relative humidity RHcab, where the latter is relevant in the A/C mode due to the dehumidification effect.
The Pareto optimal solutions are shown in Figure A1 for two cabin temperatures (25 °C and 40 °C) and RHcab = 20%. These results indicate that for lower cabin air temperature Tcab = 25 °C (Figure A1a), the HVAC system can achieve comfortable PMV range. Figure A1c shows that high blower air mass flow rate is preferred when aiming for maximum comfort (star symbol), while lower blower fan mass flow rate is suitable for low total power consumption (square symbol). However, similarly as with the heat-pump mode (cf. Figure 5), the Pareto frontiers are relatively narrow, particularly for higher cooling demands, i.e., the trade-off of efficiency and comfort is rather modest.
The Pareto frontiers are even narrower for high cabin air temperature (Tcab = 40 °C, Figure A1b), and the PMV gain when using higher air mass flows is only 0.1 point on the scale of 4. On the other hand, the power consumption is strongly influenced by the control inputs, which should, therefore, be selected for minimum power consumption (square symbols in Figure A1d). Unlike the case of lower cabin air temperature (Figure A1c), the lowest total power consumption is achieved at higher blower fan mass flow rates.
The optimisation results are influenced by the cabin relative humidity, as the cabin air is recirculated, and water condensation occurs on low-temperature radiator (LTR). This affects the performance of HVAC system in A/C mode, especially at high relative humidity due to higher latent heat loss on LTR. For more details, the interested reader is referred to [23].
Figure A1. Multi-objective optimisation results for A/C mode.
Energies 14 01203 g0a1

References

  1. Global EV Outlook 2020—Analysis—IEA. Available online: https://www.iea.org/reports/global-ev-outlook-2020 (accessed on 7 December 2020).
  2. Council of the European Union Council. Decision (EU) 2017/710 of 3 April 2017 on the Position to Be Adopted, on Behalf of the European Union, within the EEA Joint Committee Concerning an Amendment to Annex XX (Environment) to the EEA Agreement (CO2 Emissions). Available online: https://eur-lex.europa.eu/eli/dec/2017/710/oj (accessed on 23 June 2020).
  3. Yang, D.X.; Qiu, L.S.; Yan, J.J.; Chen, Z.Y.; Jiang, M. The government regulation and market behavior of the new energy automotive industry. J. Clean. Prod. 2019, 210, 1281–1288. [Google Scholar] [CrossRef]
  4. Pouladi, J.; Bannae Sharifian, M.B.; Soleymani, S. Determining charging load of PHEVs considering HVAC system and ana-lyzing its probabilistic impacts on residential distribution network. Electr. Power Syst. Res. 2016, 141, 300–312. [Google Scholar] [CrossRef]
  5. Vatanparvar, K.; Al Faruque, M.A. Battery lifetime-aware automotive climate control for electric vehicles. In Proceedings of the 52nd ACM/EDAC/IEEE Design Automation Conference (DAC), San Francisco, CA, USA, 8–12 June 2015; pp. 1–6. [Google Scholar] [CrossRef]
  6. Zhang, T.; Gao, C.; Gao, Q.; Wang, G.; Liu, M.H.; Guo, Y.; Xiao, C.; Yan, Y.Y. Status and development of electric vehicle integrated thermal management from BTM to HVAC. Appl. Therm. Eng. 2015, 88, 398–409. [Google Scholar] [CrossRef]
  7. Paffumi, E.; Otura, M.; Centurelli, M.; Casellas, R.; Brenner, A.; Jahn, S. Energy consumption, driving range and cabin tem-perature performances at different ambient conditions in support to the design of a user-centric efficient electric vehicle: The QUIET Project. In Proceedings of the 14th SDEWES Conference, Dubrovnik, Croatia, 1–6 October 2019; p. 18. [Google Scholar]
  8. Park, M.H.; Kim, S.C. Heating Performance Characteristics of High-Voltage PTC Heater for an Electric Vehicle. Energies 2017, 10, 1494. [Google Scholar] [CrossRef] [Green Version]
  9. Zhang, Z.; Wang, J.; Feng, X.; Chang, L.; Chen, Y.; Wang, X. The solutions to electric vehicle air conditioning systems: A review. Renew. Sustain. Energy Rev. 2018, 91, 443–463. [Google Scholar] [CrossRef]
  10. Feng, L.; Hrnjak, P. Performance characteristics of a mobile heat pump system at low ambient temperature. In SAE Technical Paper; SAE Interational: Warrendale, PA, USA, 2018. [Google Scholar] [CrossRef]
  11. Okamoto, K.; Aikawa, H.; Ohmikawa, M.; Hayashi, K. Thermal management of a hybrid vehicle using a heat pump. In SAE Technical Paper; SAE Interational: Warrendale, PA, USA, 2019. [Google Scholar] [CrossRef]
  12. Menken, J.C.; Strasser, K.; Anzenberger, T.; Rebinger, C. Evaluation of the Energy Consumption of a Thermal Management System of a Plug-In Hybrid Electric Vehicle Using the Example of the Audi Q7 e-tron. SAE Int. J. Passeng. Cars Mech. Syst. 2018, 11, 203–212. [Google Scholar] [CrossRef]
  13. Chowdhury, S.; Leitzel, L.; Zima, M.; Santacesaria, M.; Titov, G.; Lustbader, J.; Rugh, J.; Winkler, J.; Khawaja, A.; Go-vindarajalu, M. Total Thermal management of battery electric vehicles (BEVs). In SAE Technical Paper; SAE Interational: Warrendale, PA, USA, 2018. [Google Scholar] [CrossRef] [Green Version]
  14. Drage, P.; Hinteregger, M.; Zotter, G.; Šimek, M. Cabin Conditioning for Electric Vehicles. ATZ Worldw. 2019, 121, 44–49. [Google Scholar] [CrossRef]
  15. Oi, H.; Yanagi, K.; Tabat, K.; Tochihar, Y. Effects of heated seat and foot heater on thermal comfort and heater energy con-sumption in vehicle. Ergonomics 2011, 54, 690–699. [Google Scholar] [CrossRef] [PubMed]
  16. Bauml, T.; Dvorak, D.; Frohner, A.; Simic, D. Simulation and measurement of an energy efficient infrared radiation heating of a full electric vehicle. In Proceedings of the IEEE Vehicle Power and Propulsion Conference (VPPC), Coimbra, Portugal, 27–30 October 2014; pp. 1–6. [Google Scholar] [CrossRef]
  17. Steiner, A.; Rauch, A.; Larrañaga, J.; Izquierdo, M.; Ferraris, W.; Piovano, A.A.; Gyoeroeg, T.; Huenemoerder, W.; Backes, D.; Trenktrog, M. Energy Efficient and Comfortable Cabin Heating. In Future Interior Concepts; Fuchs, A., Brandstätter, B., Eds.; Springer: Cham, Switzerland, 2021; pp. 89–100. [Google Scholar] [CrossRef]
  18. Farzaneh, Y.; Tootoonchi, A.A. Controlling automobile thermal comfort using optimized fuzzy controller. Appl. Therm. Eng. 2008, 28, 1906–1917. [Google Scholar] [CrossRef]
  19. Yan, X.; Fleming, J.; Lot, R. A/C Energy Management and Vehicle Cabin Thermal Comfort Control. IEEE Trans. Veh. Technol. 2018, 67, 11238–11242. [Google Scholar] [CrossRef]
  20. Cvok, I.; Škugor, B.; Deur, J. Control trajectory optimisation and optimal control of an electric vehicle HVAC system for favourable efficiency and thermal comfort. Optim. Eng. 2020. [CrossRef]
  21. Amini, M.R.; Wang, H.; Gong, X.; Liao-Mcpherson, D.; Kolmanovsky, I.; Sun, J. Cabin and battery thermal management of connected and automated hevs for improved energy efficiency using hierarchical model predictive control. IEEE Trans. Control Syst. Technol. 2020, 28, 1711–1726. [Google Scholar] [CrossRef]
  22. Schaut, S.; Sawodny, O. Thermal Management for the Cabin of a Battery Electric Vehicle Considering Passengers’ Comfort. IEEE Trans. Control Syst. Technol. 2020, 28, 1476–1492. [Google Scholar] [CrossRef]
  23. Cvok, I.; Ratković, I.; Deur, J. Optimisation of Control Input Allocation Maps for Electric Vehicle Heat Pump-based Cabin Heating Systems. Energies 2020, 13, 5131. [Google Scholar] [CrossRef]
  24. Qi, Z. Advances on air conditioning and heat pump system in electric vehicles—A review. Renew. Sustain. Energy Rev. 2014, 38, 754–764. [Google Scholar] [CrossRef]
  25. Dvorak, D.; Basciotti, D.; Gellai, I. Demand-Based Control Design for Efficient Heat Pump Operation of Electric Vehicles. Energies 2020, 13, 5440. [Google Scholar] [CrossRef]
  26. Basciotti, D.; Dvorak, D.; Gellai, I. A Novel Methodology for Evaluating the Impact of Energy Efficiency Measures on the Cabin Thermal Comfort of Electric Vehicles. Energies 2020, 13, 3872. [Google Scholar] [CrossRef]
  27. ASHRAE. ANSI/ASHRAE Standar Thermal Environmental Conditions for Human Occupancy; ASHRAE: Atlanta, GA, USA, 2017; Volume 2017. [Google Scholar]
  28. Poles, S. MOGA-II an Improved Multi-Objective Genetic Algorithm: Technical Report; ESTECO: Trieste, Italy, 2003. [Google Scholar]
  29. Cvok, I.; Ratković, I.; Deur, J. Optimization of control parameters of vehicle air-conditioning system for maximum efficiency. In SAE Technical Paper; SAE Interational: Warrendale, PA, USA, 2020. [Google Scholar] [CrossRef]
  30. Esteco ModeFrontier. Available online: https://www.esteco.com/modefrontier (accessed on 28 August 2020).
Figure 1. System schematic for heat pump (HP) mode.
Energies 14 01203 g001
Figure 2. Block diagram of cabin thermal system model including airflow distribution model used for Predicted Mean Vote (PMV) evaluation.
Energies 14 01203 g002
Figure 3. System model used within optimisation framework (a) and driver’s average thermal comfort index (PMV) map in dependence of cabin air temperature and inlet air mass flow rate (b).
Energies 14 01203 g003
Figure 4. Optimisation framework implemented within ModeFrontier environment.
Energies 14 01203 g004
Figure 5. Comparison of multi-objective Pareto optimal results for cases with (circles) and without use of infrared heating panels (IRPs) (squares) at different cabin temperatures (af).
Energies 14 01203 g005
Figure 6. Pareto frontiers expressed in terms of HVAC-only power consumption for cases with (circles) and without use of IRPs (squares) at different cabin temperatures (af).
Energies 14 01203 g006
Figure 7. Optimised control inputs corresponding to Pareto frontiers from Figure 5a (ad, Tcab = −10 °C) and Figure 5e (eh, Tcab = 20 °C).
Energies 14 01203 g007
Figure 8. Optimised IRP control inputs corresponding to Pareto frontiers from Figure 5a (a,b, Tcab = −10 °C) and Figure 5e (c,d, Tcab = 20 °C).
Energies 14 01203 g008
Figure 9. Power consumption reduction analysis (c) based on optimisation results (a,b) for the same thermal comfort level and different cabin air temperatures under steady-state conditions.
Energies 14 01203 g009
Figure 10. Overall hierarchical structure of HVAC control system including decoupled IRP-based PMV controller.
Energies 14 01203 g010
Figure 11. Simulation results of HVAC-only and HVAC+IRP systems for scenario of constant cabin air temperature target difference of 5 °C.
Energies 14 01203 g011
Figure 12. Simulation results of HVAC-only and HVAC+IRP systems for scenario of increasing cabin air temperature target difference.
Energies 14 01203 g012
Figure 13. Comparative heat-up responses of HVAC-only system (solid line) and HVAC+IRP system (dashed line) for target cabin air temperature of 22.5 °C.
Energies 14 01203 g013
Table 1. Optimisation constraints.
Control Input ConstraintsSetpoint Tracking Constraints
40   ° C T c a b , i n , R 65   ° C 1600   rpm n p 2 8000   rpm 1600   rpm n p 3 8000   rpm P ¯ r f { 0 ,   0.5 ,   1 } u P 1 , 2 [ 0 , 1 ] | Δ T S H , R Δ T S H | < 1   ° C | T c a b , i n , R T c a b , i n | < 1   ° C | Q ˙ h R m ˙ b f , m c p , a ( T c a b , i n T c a b ) | < 100   W
Table 2. Basic optimisation and simulation model setting parameters.
ParameterValue
Heating power demand grid Q . hR ∈ {1:0.5:6} kW
Cabin air temperature gridTcab ∈ {−10:5:25} °C
Cabin relative humidityRHcab = 10%
Ambient conditionsTamb = −10 °C, RHamb = 60%, pamb = 101.3 kPa
Dassl solver tolerance0.0001
Table 3. HVAC system performance indices obtained from heat-up scenario simulation results.
CaseTcab,R [degC]IRPEel [Wh]tPMV,05 [s]C2 [min]
122.5w/o IRP433.4 49323
(0%)(0%)(0%)
222.5w/IRP473.131417.8
(+9%)(−36%)(−23%)
317.5w/o IRP341.1N/A31.0
(−21%) (+35%)
417.5w/IRP407.931515.9
(−6%)(−36%)(−31%)
Publisher’s Note: MDPI stays neutral with regard to jurisdictional claims in published maps and institutional affiliations.

