Article

Prolongation of Battery Lifetime for Electric Buses through Flywheel Integration

by
Philipp Glücker
1,2,
Klaus Kivekäs
1,
Jari Vepsäläinen
1,*,
Panagiotis Mouratidis
2,
Maximilian Schneider
2,
Stephan Rinderknecht
2 and
Kari Tammi
1
1
Department of Mechanical Engineering, School of Engineering, Aalto University, 02150 Espoo, Finland
2
Institute for Mechatronic Systems, Technical University of Darmstadt, 64289 Darmstadt, Germany
*
Author to whom correspondence should be addressed.
Submission received: 21 December 2020 / Revised: 2 February 2021 / Accepted: 3 February 2021 / Published: 9 February 2021
(This article belongs to the Special Issue Battery Management for Electric Vehicles)

Abstract

:
Electrification of transportation is an effective way to tackle climate change. Public transportation, such as electric buses, operate on predetermined routes and offer quiet operation, zero local emissions and high energy efficiency. However, the batteries of these buses are expensive and wear out in use. The battery ageing is expedited by fast charging and power spikes during operation. The contribution of this paper is the reduction of the power spikes and thus a prolonged battery lifetime. A novel hybrid energy storage system for electric buses is proposed by introducing a flywheel in addition to the existing battery. A simulation model of the hybrid energy storage system is presented, including a battery ageing model to measure the battery lifetime. The bus was simulated during its daily driving operation on different routes with different energy management strategies and flywheel configurations. These different flywheels as well as the driving cycle had a significant impact on the battery life increase. The proposed hybrid battery/flywheel storage system resulted in a battery lifetime increase of 20% on average.

1. Introduction

In the wake of climate change and the turnaround in energy policy within numerous countries, research focus has shifted towards green technology over the last decade. This environmental development has led to a rapid transformation of transport in recent years, including the increase of hybrid electric and battery electric passenger vehicles. To comply with the climate targets stated in the Paris agreement in 2015, the European Council promotes renewable energy sources and electric transportation as the transport sector was responsible for 27% of the total greenhouse gas (GHG) emissions within the 28 countries of the European Union in 2017 [1,2]. As part of this promotion, public transport has likewise shifted towards the electrification of public bus fleets. Due to the main operation characteristics of battery electric buses (BEBs) within cities and the simpler realisation of charging infrastructure for regular bus routes, the range limitations of electric powertrains have less impact for BEBs than for passenger vehicles. Besides their range, other significant aspects of battery electric vehicles (BEVs) are the costs and the limited lifetime of the battery. As the battery life depends on various factors such as its chemistry, the operating temperature or peak currents, it seems beneficial to hybridise the battery by introducing a second energy storage system (ESS) such as supercapacitor or flywheel (FW). This ESS could supplement the battery and possibly improve the overall performance of the vehicle.
This paper contributes to the extension of the battery lifetime of BEBs with the help of an integrated flywheel within the vehicle. The novelty is the investigation of the hybrid battery/flywheel energy storage system during its daily driving operation, comparing the hybrid configuration with the non-hybrid BEB. The results provide novel information about the influence of the driving cycle and the size of the flywheel on the battery wear. A rule-based control strategy is implemented to evaluate the benefit of the hybrid system. Subsequently, a nonlinear model predictive control is developed, which is specifically designed for the extension of the battery lifetime. The research is conducted with the help of simulation models in Matlab® and Simulink. The models consider longitudinal dynamics of the bus along a designated route, the ageing of the battery as well as the transient behavior and energy flow between the energy storage systems and the electric drive.

2. State-of-the-Art

In recent years, research efforts have largely focused on enhancing lithium-ion batteries due to their high specific energy as well as power density, high energy efficiency and low self-discharge [3]. In this context, Farhadi et al. [4] compared the applications, advantages and limitations of the high-power storage systems Li-ion batteries (LIBs), supercapacitors, flywheels and superconducting magnetic energy storage (SMES). The results showed that LIBs excel in their high energy density, long discharge time and low self-discharge rate, allowing much longer storage periods in comparison to the other technologies. However, among LIB chemistry variations, it is hard to achieve high power density, high energy density and low cost in the same package. The study concluded that the suitability of each storage technology for specific applications is defined by various requirements such as power and energy density, efficiency, self-discharge rate and cycle life.
The integration of flywheel energy storage systems (FESSs) has lately been accelerated due substantial improvements in fibers, high strength composite materials and technologies, power electronics and magnetic bearings [5,6,7]. FESSs are often compared to ultracapacitors (UCs) as their specifications in high power density, fast response time, costs and lifetime are similar. Itani et al. [8] compared FWs and UCs as secondary energy storage systems for a two-front wheel driven electric vehicle (EV). Based on an optimised design, the FESS is advantageous regarding volume, energy density, power density and costs, whereas the ultracapacitor excels in terms of weight, specific energy and specific power. Within electrified railways, UCs are superior in maintenance costs, weight and size [9], whereas FWs seem to excel in terms of power and energy density as well as their mass within automotive applications [10]. Because of their excellent high power rating, FESS are often combined with a high energy rated ESS to a hybrid energy storage system (HESS), especially in stationary applications. The possible benefits of such hybrid systems are better performance, increasing lifetime of the high energy rated ESS and cost savings, with the latter two shown by a hybrid battery/flywheel system for a solar PV-powered application in [11].
The energy management strategy (EMS) is a key part of a HESS as it controls the power flow within the powertrain, affects the efficiency and the range of the vehicle and the lifetime of its components [12]. EMSs can be broadly divided into rule-based and optimisation-based strategies [3]. In the following, different EMSs for various HESS applications are briefly introduced. A flywheel/battery HESS controlled with a rule-based algorithm was studied for primary control reserve by Mouratidis et al. [13], which successfully improved the state of health (SOH) of the battery by 16% within four years. A similar HESS was investigated as a buffer for all-electric ship propulsion systems. The performance of the real-time optimisation-based model predictive control (MPC) proved effectiveness in terms of power-fluctuation compensation, HESS energy saving and reduction of the battery usage, especially at high sea states [14]. A frequency control was applied by Sessa et al. [15,16] on a battery/flywheel HESS during grid frequency regulation service. The implemented low-pass filter forced the battery to supply the low frequency and the FESS to supply the high-frequency components of the required power, leading to a significant reduction of the lithium manganese oxide (LMO) battery ageing of around 22%. A similar control including partially charging the flywheel by the batteries was carried out for a hybrid locomotive including diesel generators, batteries and flywheel. The frequency approach-based EMS which focused on optimal sizing and operation resulted in a reduced number and improved lifetime of the battery cells [17].
Besides stationary applications, the integration of FESS within the transport sector was examined as well. Dhand et al. [18] integrated a flywheel into a BEV by a mechanical continuously variable transmission system. The dynamic programming control strategy reduced battery peak loads during all cycles, leading to potentially reducing the energy consumption in extra-urban and highway cycles. GKN Hybrid Power successfully implemented an electrical flywheel in various hybrid endurance racing cars to assist the internal combustion engine as the prime mover, e.g., Audi’s R18 e-tron as the first hybrid car winning the Le Mans 24 h endurance race in 2012. The advantage of this carbon-fiber flywheel is its compactness with a power output of 120 k W while weighing only 55 k g [19]. The GKN Gyrodrive flywheel hybrid system is an adapted version of the aforementioned FESS which was introduced into mass market by the installation into 500 diesel driven buses in the UK between 2014 and 2016 [5].
An overview of flywheels in racing cars and vehicles is given in Table 1. The FESSs were designed for hybrid electric vehicles such as passenger cars, urban transport buses and light rail applications, depending on the required peak power and available energy. The defined mass includes rotor and stator of the electric machine (EM), bearings and the containment mass, but exclude the power electronics.
A conceptual design of an efficient flywheel battery of 200 Wh as an additional ESS for common vehicles was carried out in [21], while only commercially available components for hybrid and electric vehicles were employed. A research group of Heilbronn University performed a range-extension simulation of a plug-in hybrid electric vehicle (PHEV) with an additional flywheel by collecting comprehensive experimental data of a battery-driven 26 k W powered electric car [22]. Briat et al. [23] examined the hybridisation of heavy-duty vehicles with high peak-to-average battery power ratio, including the control strategy between battery and FW. Depending on the required traction current and the flywheel speed, the rule-based operating mode was divided into 12 states which corresponded to either charging, discharging or speed maintenance of the flywheel. Itani et al. [24,25] designed a flywheel/battery HESS with a special focus on the traction and regenerative braking strategy. The main electrical source was the battery, but it only contributed if the FESS could not absorb the whole regenerative braking or deliver the whole traction power. Furthermore, a controlled dissipative resistor was added to lower the electrical stress on the battery during low-speed high-power braking.
The implementation of flywheels in the transportation sector is often focused on the addition to a combustion engine for the recuperation of braking energy. There is only limited research on battery/flywheel electric vehicles to extend the lifetime of the battery. On the one hand, the simplistic rule-based control strategy of Itani et al. [8] focused on the reduction of battery use only during regenerative braking and the startup of the vehicle during intervals of a few seconds. On the other hand, elaborate energy management strategies were only applied for a battery/supercapacitor hybrid system, e.g., the nonlinear model predictive control (NMPC) for a fully electric hybrid vehicle for various driving cycles by Santucci et al. [26].
A battery/flywheel hybrid energy storage system for heavy-duty vehicles within urban and suburban areas with a special focus on battery lifetime increase has not been analysed. The study presented here aims to narrow this gap by integrating a kinetic energy storage system (KESS) into an existing battery electric bus, examining the results on the battery lifetime for its daily driving operation. Furthermore, various flywheel sizes are taken into account within this paper to study their influence on the battery lifetime.

3. Materials and Methods

3.1. Bus and Routes

This study is based on the operation of a battery electric bus on the bus route 11 in Espoo (E11), Finland. It is a typical suburban Finnish bus line which was operated until early 2018, starting at Tapiola station and ending at Friisilä station as shown in Figure 1.
Lajunen [27] has noted that end-terminus charging results in the lowest lifecycle costs for BEB systems, thus it was used for this route with a high-power charging station being located at the Tapiola station where the buses were charged during a dwell-time of a few minutes. Besides the driving cycle, this charging process was considered in the simulation as well, as its contribution to the battery ageing was significant due to its high power. The characteristic parameters of route E11 are compared to the well-known Braunschweig driving cycle (BR) in Table 2. This reference test route represents a mid-size European city with similar characteristics to E11 and is therefore used as a comparative cycle. Further details as well as the speed profile of both driving cycles can be found in [28].

3.2. Simulation Model

The simulation model of this study is based on the non-hybrid battery electric bus model developed by Vepsäläinen et al. [30]. It is built within Matlab®/Simulink and was validated to measurement data of a BEB on the E11 bus route in the previous work by Kivekäs et al. [28]. This model represents the system at the level of components, such as the battery, motor, motor controller, internal bus heating and air conditioning, etc. The novelty of this study is the addition of the kinetic energy storage system as a second ESS besides the existing battery. The topology of this hybrid battery/flywheel system comprises of the parallel configuration of the two storage systems which is shown in Figure 2.
The parameters of the simulation model are presented in Table 3. They are based on the BEB providing the on-board measurement data on the E11 bus line. The auxiliary power equals the average demand measured in the validation cycle, excluding the non-available measurement data from the separate diesel heater of the BEB.
One of the main disadvantages of BEBs is the degradation of the battery. It is caused by various factors such as high temperatures, wide state of charge (SOC) ranges, deep cycles and high peak currents [31,32]. Besides, the material of the anode and cathode is pivotal to the capacity fade of LIBs, which is predominantly caused by the impedance rise at both electrodes and the growth of a solid electrolyte interface (SEI) on the anode, resulting in the loss of active lithium [33,34]. The end of life (EOL) of a battery is reached when the remaining capacity has degraded to 80% of its original one [31,35]. The used battery was Toshiba’s rechargeable battery SCiBTM which is a LIB with a lithium-titanate (LTO) anode. This kind of battery is suitable within the transport sector due to their long cycle lifetime, good deep temperature behaviour and high power capability [36,37]. The LTO battery was modelled with the help of the Thévenin model as presented in Figure 3a, which consists of the steady-state and the transient response of the battery. Furthermore, the relationship between the open-circuit voltage u oc and the SOC of the battery is depicted in Figure 3b. This enables the precise battery SOC estimation as well as the dynamic voltage drop. The internal temperature of the battery was assumed to be constant at 20 ° C . The governing equations of the Thévenin model in generator convention are the following:
d u c τ d t = 1 C τ · i bat u c τ R τ
u bat = u oc i bat · R ss u c τ
S O C ( t ) = S O C ( t 0 ) 1 Q nom · t 0 t i bat ( t ˜ ) d t ˜
where i bat and u bat represent the battery current and output voltage, u oc is the open-circuit voltage, u c τ represents the capacitor voltage, R ss is the steady-state and R τ the transient component of the battery resistance, C τ represents the internal capacitance and Q nom is the coulombic nominal capacity of the battery [38].
To examine the influence of the KESS integration on the battery ageing, a weighted charge throughput model was implemented. It assumes that under standard conditions, a battery reaches an overall charge throughput Q tot by its EOL. An important parameter in this context is the C-rate, which is defined by the ratio between the current and the nominal capacity of the battery Q nom . For instance, a C-rate of 3C is equivalent to a current of 240 A for this battery. Under the nominal conditions of 25 ° C and a C-rate of 3C, the manufacturer states that the given LTO battery can withstand 17,000 equivalent full cycles (EFC) until its EOL. The weighted charge throughput model considers the deviation of the C-rate from the nominal conditions with a weighting factor σ , which is multiplied to the actual charge through the battery. Once the weighted charge Q w equals the equivalent charge Q tot , the EOL of the battery is reached.
Q = 0 t ( i bat ) d t ˜
Q tot = 2 · Q nom · E F C N
Q w = Δ T · k N σ ( k ) · Q ( k )
The influence of the C-rate is based on the results of Namor et al. [39] and was adjusted to the given battery and the nominal conditions of its data sheet. This leads to the following linear weight function:
σ ( C rate ) = 0.57 + 0.14 · C rate
where the constant term represents the C-rate independent ageing process and the second term models the effect of the C-rate. For a median charge/discharge current of 3C, the nominal conditions are met and therefore the weighting factor approximately equals one, leading to the number of cycles provided by the manufacturer for this current rate. The bus route as well as the end-terminus charging to the original battery SOC before the driving are both considered in the ageing process. This model only focuses on cycle-related capacity degradation and does not consider calendar ageing.
The KESS is the second energy storage system which complements the battery. An electric machine converts the electric energy to kinetic energy and vice versa and stores the latter within a rotating flywheel. The stored kinetic energy depends on the square of the rotational speed and the moment of inertia. Due to the linear relation between power and rotational speed within the base speed range of a synchronous machine and to remain operational at all times, there is a designated minimum rotational speed ω m , min which defines the available energy E avl of the KESS. This energy and the SOC of the KESS are described as the following:
E avl = 1 2 · J · ( ω m , max 2 ω m , min 2 )
S O C fw = ω m 2 ω m , max 2
where J represents the moment of inertia, ω m is the rotational speed and S O C fw represents the state of charge of the flywheel.
Three mobile KESS configurations were designed by a simulation tool at TU Darmstadt as listed in Table 4. The permanent magnet synchronous machines as the electric machines of the KESS were designed specifically for mobile applications according to the work of Schneider [40]. The losses of the EM are included in the simulation model as a loss map of 100 equally weighted operating points, which depend on the power output and the rotational speed of the KESS.
The parameters of the maximum power and available energy of the stationary prototype KESS ETA290 were taken as the framework for the first flywheel (FW1). This prototype is designed as an outer-rotor setup with a hollow cylinder rotor made of fiber reinforced plastic (FRP). Furthermore, the permanent magnetic bearing prevents rotor-stator contact during regular operation by axial levitation [41]. The auxiliary losses for magnetic bearings, vacuum pump and the inverter of all three configurations were assumed to be equal to the measured auxiliary losses of the aforementioned stationary prototype. All three KESS configurations operate within the field-weakening range where the maximum power output is constant. However, they vary in their SOC range due to their different speed range. The influence of the maximum power P max and its available energy E avl of the flywheel is shown within this study.

3.3. Energy Management Strategy

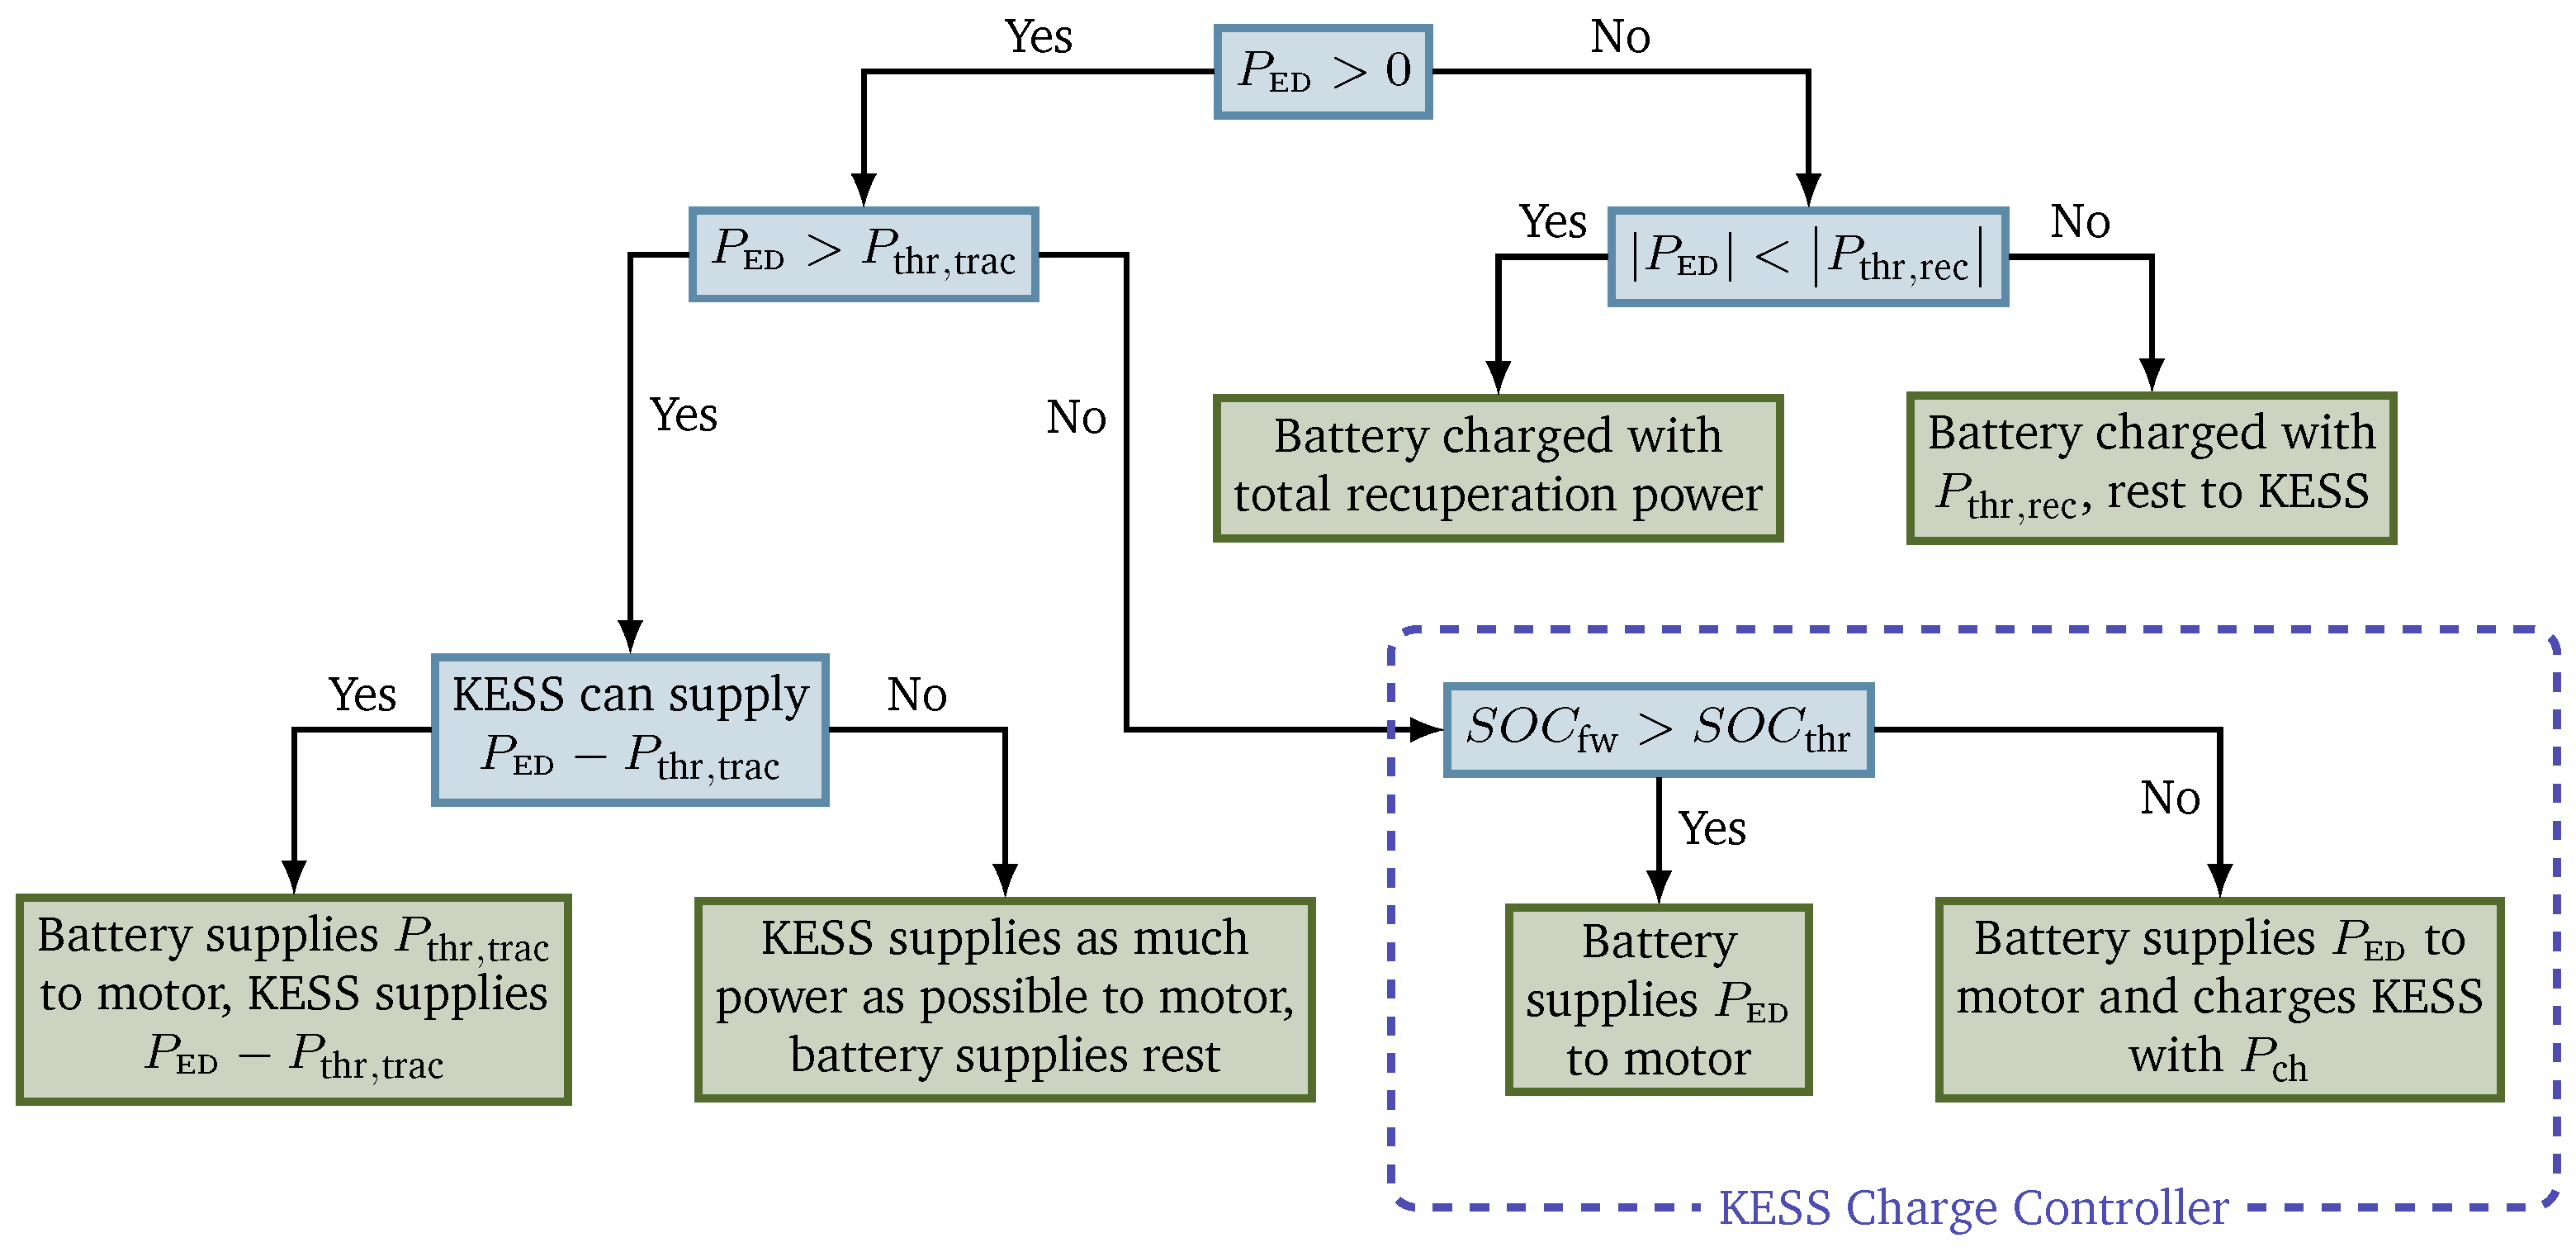
3.3.1. Rule-Based Control Strategy

The flow-chart of the implemented rule-based strategy is presented in Figure 4, which has been adapted from the battery/supercapacitor HESS in [42]. To control the power flow of the HESS, this strategy defines three adjustable values, each in k W : the traction threshold (TH) value P thr , trac , the threshold value for recuperation P thr , rec as well as the power of the charge controller P ch , which is delivered to the flywheel by the battery.
If the vehicle is recuperating energy and hence the requested power of the electric drive P ED is negative, the battery is charged with up to P thr , rec and the remaining power charges the KESS. During motor operation, the battery supplies P thr , trac and the KESS supplies the remaining power as far as possible. To keep the flywheel SOC within an operating range, a charge controller is implemented which is displayed in the lower right-hand part. This ensures that enough power can be supplied at all times from the flywheel. The threshold value S O C thr for the KESS charge controller is set at 20% above the respective minimum SOC of the KESS configuration. The battery charges the KESS with P thr , trac P ED , but never exceeds the maximum charging power P ch . To finish the driving cycle close to the minimum SOC of the KESS, the charge controller is switched off after 80% of the bus cycle.
The values for the three adjustable parameters were determined by a sweep within a reasonable range for both driving cycles individually. The traction threshold P thr , trac was varied in 10 k W increments from 20 k W to 120 k W and the recuperation threshold P thr , rec simultaneously from 0 k W to 70 k W in 10 k W increments. The power for the KESS charge controller P ch was tested in 5 k W increments starting from 0 k W .

3.3.2. Nonlinear Model Predictive Control

The (nonlinear) model predictive control is an optimisation-based strategy which can take system limitations into account while optimising a defined multivariable problem over a prediction horizon [43]. The algorithm, depicted in green, consists of the following three steps as shown in Figure 5: First, the simplified model of the system is used to predict the future output over the prediction horizon. Secondly, the cost function for the given future output is evaluated. Thirdly, the first element of the optimal control policy with minimum cost is applied to the system.
This control strategy makes use of the future reference speed of the driving cycle which can be converted to an estimation of the reference power given to the NMPC model over the prediction horizon. To predict the future output of the system, the actual system depicted in blue is modelled as a simplified version within the NMPC. Based on the predicted output of the NMPC model, the optimisation algorithm calculates the future control sequence for each time step over the prediction horizon to minimise the cost function while simultaneously satisfying the system constraints. Once the first control element was applied to the system, the prediction horizon—which can be specified within the controller—is shifted to the next step. At the next time step, the problem is updated with new measurement data and the optimisation is executed again. In other words, the algorithm optimises the current time slot while keeping future time slots within the prediction horizon in account [44].
The nonlinear model predictive control was implemented in Matlab® and Simulink with the help of the Model Predictive Control Toolbox [45]. The implemented optimiser in the Simulink controller is the sequential quadratic programming (SQP) algorithm. Reduced order models were adopted for the HESS components to keep the computational cost low while predicting accurately the system response.

Simplified Battery and KESS Models for the NMPC

The simplified battery model is based on the Thévenin circuit model, but it excludes the transient response by combining the steady-state and the transient resistance to the equivalent internal resistance R bat [26]. This leads to the following dynamics of the battery [46]:
P bat = u oc · i bat R bat · i bat 2
S O C ˙ bat = d S O C bat d t = i bat 3.6   ×   10 6 · Q nom = u oc u oc 2 4 · R bat · P bat 2 · R bat · 3.6   ×   10 6 · Q nom
Moreover, the dependence of the open-circuit voltage on the battery SOC was linearly approximated for the operating range between 30% and 70%. Similarly, the state equation of the flywheel SOC can be expressed as follows:
S O C ˙ fw = d S O C fw d t = P fw P loss ( S O C fw , P fw ) 3.6   ×   10 6 · E max
The losses of the EM and the inverter—the power for magnetic bearing and vacuum pump is supplied by the battery—are implemented as a third-degree polynomial approximation to reduce the computing time.

NMPC Implementation

The HESS model within the NMPC algorithm is implemented as a state-space representation reported in Equation (13). The states x are defined as the state of charge of the battery S O C bat and the KESS S O C fw , the control variables u as the respective output power P bat and P fw , and the battery current i bat as well as S O C fw comprise the NMPC output variables y:
x = x 1 x 2 = S O C bat S O C fw , u = u 1 u 2 = P bat P fw , y = y 1 y 2 = i bat S O C fw
The operational limits of the system and its components are included within the NMPC model as inequality constraints as follows:
ω · T gen , max P fw ω · T mot , max T gen , max T fw T mot , max S O C min , bat c e 1 · e S O C bat S O C max , bat + c e 1 · e S O C min , fw c e 2 · e S O C fw S O C max , fw + c e 2 · e
where ω is the mechanical angular velocity of the flywheel, T gen , max and T mot , max represent the maximum EM torque values in generator (negative) and motor mode for the KESS, T fw is the actual KESS torque, S O C min and S O C max represent the minimum and maximum values for the state of charge of the respective ESS, e is the slack variable used for constraint softening and c e are slack coefficients for the respective ESS.
The NMPC control at instant k is calculated by the minimisation of the following cost function along the control horizon, being subject to the above given constraints:
J = i = 1 p ( c 1 · u 1 ( k + i | k ) + u 2 ( k + i | k ) u 3 ( k + i | k ) P aux 2 + c 2 · e ( k + i | k ) + c 3 · σ ( k + i | k ) · | y 1 ( k + i | k ) | 2 + c 4 · y 2 ( k + i | k ) y 2 , ref ( k ) 2 )
where ( k + i | k ) represents the value predicted for time ( k + i ) based on the information available at time k, p denotes the prediction horizon as the number of time steps, P aux is the auxiliary power supplied by the battery, σ represents the weighting factor for the battery ageing and c n is the respective coefficient for the n-th part of the cost function. The first term gives a penalty for not meeting the requested power of the electric drive and the auxiliary devices. The purpose of the second term is to respect the soft constraint, whereas the third term considers the battery ageing by penalizing the weighted energy throughput of the battery. The fourth term penalizes both rapid FW discharging in the beginning and a high SOC at the end of the driving cycle. The reference SOC for the FW y 2 , ref is set at its initial value at the start and degrades linearly to S O C min , fw over the time of the driving cycle.

4. Results

4.1. Energy Management Strategies

The results of the parameter sweep for the rule-based control strategy regarding the battery lifetime can be seen in Table 5. The values for the recuperation threshold are all set to 0, hence the total recuperating energy only charges the KESS. The values for E11 vary slightly depending on the chosen flywheel, whereas the TH values remain the same for the BR driving cycle independent on the FW. This can be partially explained by the chosen increment of 10 k W and 5 k W respectively, as the exact values might differ slightly from each other, but did not become apparent for the chosen increments.
The first column of each flywheel represents the rule-based control without KESS charge controller (RB1), whereas the one including the charge controller is shown in the respective second column (RB2) with a charging power of P ch = 15   k W for low SOC. The shown values are the optimal threshold values for the rule-based control and are chosen for further studies.
The battery current for the first flywheel configuration is shown in Figure 6. The battery-only configuration is the original BEB without the additional KESS, whereas the other three represent the HESS with different control strategies. Positive battery current implies discharging, whereas negative values are equivalent to recharging the battery. All three configurations show a significant reduction of the peak battery current compared to the battery-only bus. Furthermore, nearly all the recharging energy was supplied to the flywheel for the HESS in contrast to the BEB, resulting in no negative battery current for the three configurations of the HESS. Aside from the different threshold values, the course of RB1 and RB2 are very similar, whereas the battery current for the NMPC shows more low frequency behavior and appears smoother.
Figure 7 presents the respective state of charge of the battery and the flywheel depending on the control strategy. The difference between the battery SOC at the end and the beginning of the driving cycle is the depth of discharge (DOD) of the cycle. The DOD plays a role in the amount of battery recharging, but it is not equivalent to the ageing of the battery which depends on the energy throughput. This fact can be observed by comparing the battery-only configuration and the NMPC controlled HESS which both result in similar DOD. However, the course of S O C bat for the battery-only configuration shows more high-frequency components which is a sign for frequent charging and discharging. This is confirmed by the higher peaks of the battery current for the non-hybrid electric bus shown above.
The lower part of Figure 7 shows the course of the flywheel SOC. It is noticeable that for the NMPC, the KESS comes close to its lower SOC limit much earlier than for the rule-based control strategies, but all of them finish close to each other at S O C fw 50 %. Due to the implemented slack variable for the NMPC, it briefly falls below the lower limit of 41% at t 1350   s during a power peak before rising again. Nevertheless, the comparability between the rule-based controls and the NMPC is still given as this drop below the lower limit was very brief and hence the operating limits can be considered equal.

4.2. Flywheels

The influence of the three KESS configurations is examined within this part. Therefore, the battery current along driving cycle E11 for the NMPC is shown in Figure 8. It can be seen that for all three configurations, the battery current remains positive with a short exception at the end of the driving cycle for the third configuration. This means that the battery always supplies power to the electric drive or the flywheel and all the recuperation power recharges the respective KESS. During acceleration phases such as around t 160   s , the battery current of FW3 was the lowest, followed by FW1 and last by FW2. This order is reversed for low battery currents or standstill such as at t 400   s , representing the order of the available energy of the KESSs. During recuperation, the battery supplied the greatest current to the KESS with the lowest available energy (FW3), whereas during acceleration the HESS with the highest available energy (FW2) resulted in the lowest battery current.
Furthermore, there are two unique peaks at t 170   s and 320 s for configuration three, which consists of the KESS with the lowest available energy. These peaks are caused by the fact that this KESS reached its minimum SOC rather quickly and therefore the battery supplied the high-power peaks. Moreover, configuration one shows battery current peaks at the beginning of several acceleration periods such as at t 340   s . As this KESS has the lowest maximum power of 100 k W , the battery must supply the remaining power between the demand of the electric drive and the maximum possible power of the KESS. This is confirmed by a smaller peak at the same time instant for FW3 which has a maximum power of 130 k W .
Table 6 reports the overall results for the E11 driving cycle, while Table 7 reports the detailed results along the BR driving cycle. The first column represents the non-hybrid BEB for the respective driving cycle. It can be seen that the NMPC as the control strategy increased the battery lifetime the most, as well as the HESS including FW2 achieved the longest battery lifetime out of the KESS configurations. For some HESS configurations, the maximum battery current for the rule-based control is higher than for the stand-alone battery system. This effect is due to a high-power peak with the KESS being already fully discharged at this point, leading to a higher battery peak current because of the additional bus weight due to the KESS. Additional data about the average (AVG) and standard deviation (SD) of the C-rate of the battery can be found in Appendix A.
Figure 9 shows the estimated battery lifetime increase for both driving cycles depending on the control strategies and the HESS configurations. The prolongation of the battery lifetime for each control strategy is bigger for the BR driving cycle than for E11, which is caused by its more intense cycling characteristics. The NMPC produced the best results through all KESS configurations and the two driving cycles. Furthermore, FW2 increased the battery lifetime the most, closely followed by FW1 and then by FW3. Overall, an estimated battery lifetime increase of over 25% can be achieved for both driving cycles.

5. Discussion

The main research question of this paper was whether the estimated battery lifetime of a BEB could be prolonged by the addition of a flywheel as a secondary energy storage. The presented results indicate that both the RMS and the peaks of the battery current were significantly reduced along both examined driving cycles, taking into account the increased curb mass of the bus. The lowest energy throughput was achieved by the NMPC for KESS configuration two with an extension of the estimated battery lifetime of 25.4% for the E11 and 28.3% for the BR driving cycle. This clearly demonstrates that a flywheel can substantially increase the lifetime of the battery within a BEB. However, there were various simplifications made. The reference speed and thus the requested power of the electric drive for the NMPC was assumed to be perfectly known beforehand, which does not reflect the real operation of a service bus. Uncertainty factors such as traffic, passenger load, outside temperature, bus stops, and aggressiveness of the driver have a significant impact on the power demand profile of the electric bus [47]. Therefore, the power demand prediction should be investigated in the future and implemented into the NMPC algorithm to consider some uncertainty factors of the driving cycle. In comparison to the NMPC, the rule-based control strategies resulted in shorter battery life increase, but both prolonged the battery lifetime by over 20% for FW2. To further improve the rule-based control strategies, smaller increments for the threshold optimisation values could be applied. Moreover, improvements in the charge controller of RB2 could include charging during low recuperation or a variable charging power depending on the current SOC of the flywheel.
Furthermore, the battery ageing model could be improved as well. Even though the applied energy throughput model which includes a weighting factor depending on the battery current seemed sufficient for the first general study, more parameters which also contribute to the battery ageing should be included as weighting factors as well. The battery cell’s temperature, the SOC and the DOD are such ageing factors. In addition, an ageing model including the two-stage linear ageing process of LTO batteries could be considered according to Han et al. [35,36]. Furthermore, the calendar ageing could be implemented as it was implemented in the weighted energy throughput model.
The evaluation of the influence of the KESS sizing showed an extension of the battery lifetime for flywheels with higher energy capacity, despite their increased overall mass which led to a higher power demand. Thus, it appears that the mass of the KESS only had a small impact as the curb mass of the bus of 10.5 t was much heavier than the KESS mass. The correlation between a higher KESS energy capacity and a longer battery lifetime seems plausible as S O C fw at the start of the driving cycle was always set at 90%, and therefore there was more energy available for the KESS with a higher capacity. This additional energy was used instead of the battery, resulting in a reduced battery energy throughput. Although the operating strategy of a fully charged KESS in the beginning and a discharged one in the end of the driving cycle is indisputable, the advantage of a higher amount of energy stored initially should be corrected in further examinations. This could be realised by ensuring the same SOC at the beginning and the end of the driving cycle. Moreover, the peaks of the battery current were reduced to a higher degree by the KESSs with a higher maximum power. However, the PMSM of these systems had higher losses which resulted in increased overall power losses. Due to the correlation between maximum power and available energy as well as the limited number of examined KESSs, the influence of the maximum power on the battery lifetime should be exactly derived in the future. Therefore, the investigation of the maximum power of the FW on the battery ageing should be carried out in future studies.
The next step after the presented variation of maximum power and energy capacity of the KESS would be a proper sensitivity analysis regarding the KESS sizing. In addition to the KESS sizing and battery ageing, the efficiency map of both storage systems, ecological aspects, the sizing of the battery and the lifecycle costs of the whole system can be included. Within this scope, the aforementioned parameters could be added to the cost function of the NMPC to improve this control strategy. By including, e.g., the efficiency of the PMSM of the flywheel, the overall losses could be reduced by avoiding inefficient operating points of the electric machine. Similarly, operating points of the battery which have a bigger impact on its lifetime can be avoided, based on a more elaborate battery ageing model which considers influential parameters such as its SOC. The sensitivity analysis should further be carried out both for a higher quantity of driving cycles and for each driving cycle individually.

6. Conclusions

A hybrid energy storage system consisting of a kinetic energy storage system and a battery was investigated for electric buses, with a special focus on the lifetime extension of the battery. The simulation analysis was mainly based on the battery electric bus operating on the E11 route in Finland. Therefore, model-based design was used to simulate the mobile KESSs. The implemented battery ageing model considered the energy throughput of the battery and the C-rate with a weighting factor. Two different types of control strategies were developed and applied, namely a rule-based and a nonlinear model predictive control. A version of the rule-based one included a charge controller which kept the KESS within an operating range by the battery for certain conditions. The NMPC made use of the reference speed of the driving cycles and adjusted the power of the two ESSs accordingly.
The energy management strategies were applied to the HESS along the E11 and BR driving cycle. The analysis regarding the battery ageing in comparison to the non-hybrid battery electric bus resulted in a significant battery life increase of over 25% for the NMPC for both cycles. The rule-based strategies prolong the battery lifetime by over 20% as well, with the one including the KESS charge controller achieving slightly better results. Moreover, the influence of the maximum power and the available energy of the KESS was examined. The results showed that a higher energy capacity reduced the energy throughput of the battery the most, despite having a higher overall power demand due to their increased mass.
The research question of this study, whether the battery lifetime of an electric bus can be increased by the addition of a flywheel, was answered with promising results. Furthermore, the influence of the KESS size as well as the driving cycle was demonstrated. Nonetheless, there are various topics regarding this paper which could be investigated in the future. First, the total cost of ownership of the vehicle should be examined in detail. Second, a proper sensitivity analysis regarding the sizing of the KESS could be conducted as well. Third, the design of the flywheel’s PMSM should further include the operating points of the energy management strategy. Finally, the battery ageing model could also be improved by including more operating parameters, e.g., the temperature and the SOC of the battery.

Author Contributions

Conceptualization, P.G., K.K. and J.V.; Investigation, P.G.; Methodology, P.G., K.K., J.V., P.M. and M.S.; Project administration, S.R. and K.T.; Resources, K.K. and J.V.; Software, P.G.; Supervision, S.R. and K.T.; Writing—original draft, P.G.; Writing—review & editing, K.K., J.V., P.M., M.S., S.R. and K.T. All authors have read and agreed to the published version of the manuscript.

Funding

This research received no external funding.

Conflicts of Interest

The authors declare no conflict of interest.

Abbreviations

The following abbreviations are most common in this manuscript:
BEBBattery electric bus
BRBraunschweig driving cycle
E11Espoo bus line 11
FW1Flywheel configuration one
FW2Flywheel configuration two
FW3Flywheel configuration three
NMPCNonlinear model predictive control
RBRule-based
RB1Rule-based control without KESS charge controller
RB2Rule-based control with KESS charge controller
THThreshold

Appendix A

Table A1. Average and standard deviation of the battery C-rate along the E11 driving cycle.
Parameter FW1FW2FW3Unit
BEBRB1RB2NMPCRB1RB2NMPCRB1RB2NMPC
AVG traction C-rate0.600.360.350.350.350.350.340.370.370.37 C
SD traction C-rate0.640.320.280.260.370.260.220.370.300.33 C
AVG recup. C-rate0.31--0.003-----0.01 C
SD recup. C-rate0.24--0.002-----0.01 C
Table A2. Average and standard deviation of the battery C-rate along the BR driving cycle.
Parameter FW1FW2FW3Unit
BEBRB1RB2NMPCRB1RB2NMPCRB1RB2NMPC
AVG traction C-rate0.680.440.440.420.430.430.420.460.450.45 C
SD traction C-rate0.770.440.320.280.420.310.210.490.360.36 C
AVG recup. C-rate0.610.140.140.12-----0.01 C
SD recup. C-rate0.470.030.030.03-----0.04 C

References

  1. European Environment Agency (EEA). Greenhouse Gas Emissions from Transport in Europe. 2019. Available online: https://www.eea.europa.eu/data-and-maps/indicators/transport-emissions-of-greenhouse-gases/transport-emissions-of-greenhouse-gases-12 (accessed on 3 June 2020).
  2. General Secretariat of the European Council. European Council (23 and 24 October 2014) Conclusions, EUCO 169/14, CO EUR 13, CONCL 5. arXiv 2014, arXiv:1011.1669v3. [Google Scholar]
  3. Li, Z.; Khajepour, A.; Song, J. A comprehensive review of the key technologies for pure electric vehicles. Energy 2019, 182, 824–839. [Google Scholar] [CrossRef]
  4. Farhadi, M.; Mohammed, O. Energy Storage Technologies for High-Power Applications. IEEE Trans. Ind. Appl. 2016, 52, 1953–1962. [Google Scholar] [CrossRef]
  5. GKN Develops Electric Flywheel Hybrid System for Buses. Available online: https://www.sae.org/news/2015/02/gkn-develops-electric-flywheel-hybrid-system-for-buses (accessed on 10 December 2020).
  6. Conteh, M.A.; Nsofor, E.C. Composite flywheel material design for high-speed energy storage. J. Appl. Res. Technol. 2016, 14, 184–190. [Google Scholar] [CrossRef]
  7. Lambert, T.N.; Washburn, C.M.; Davis, D.J.; Anderson, B.J.; Calkins, D.; Stong, J.; Massey, L. Next Generation Composite Materials for Flywheel Development; Sandia National Laboratories: Albuquerque, NM, USA, 2012.
  8. Itani, K.; De Bernardinis, A.; Khatir, Z.; Jammal, A. Comparative analysis of two hybrid energy storage systems used in a two front wheel driven electric vehicle during extreme start-up and regenerative braking operations. Energy Convers. Manag. 2017, 144, 69–87. [Google Scholar] [CrossRef]
  9. Ratniyomchai, T.; Hillmansen, S.; Tricoli, P. Recent developments and applications of energy storage devices in electrified railways. IET Electr. Syst. Transp. 2014, 4, 9–20. [Google Scholar] [CrossRef]
  10. Hedlund, M.; Lundin, J.; de Santiago, J.; Abrahamsson, J.; Bernhoff, H. Flywheel energy storage for automotive applications. Energies 2015, 8, 10636–10663. [Google Scholar] [CrossRef] [Green Version]
  11. Ayodele, T.; Ogunjuyigbe, A.; Oyelowo, N. Hybridisation of battery/flywheel energy storage system to improve ageing of lead-acid batteries in PV-powered applications. Int. J. Sustain. Eng. 2020, 13, 337–359. [Google Scholar] [CrossRef]
  12. Sabri, M.F.; Danapalasingam, K.A.; Rahmat, M.F. A review on hybrid electric vehicles architecture and energy management strategies. Renew. Sustain. Energy Rev. 2016, 53, 1433–1442. [Google Scholar] [CrossRef]
  13. Mouratidis, P.; Schüßler, B.; Rinderknecht, S. Hybrid Energy Storage System consisting of a Flywheel and a Lithium-ion Battery for the Provision of Primary Control Reserve. In Proceedings of the 8th International Conference on Renewable Energy Research and Applications (ICRERA), Brasov, Romania, 3–6 November 2019. [Google Scholar]
  14. Hou, J.; Sun, J.; Hofmann, H. Control development and performance evaluation for battery/flywheel hybrid energy storage solutions to mitigate load fluctuations in all-electric ship propulsion systems. Appl. Energy 2018, 212, 919–930. [Google Scholar] [CrossRef]
  15. Sessa, S.D.; Tortella, A.; Andriollo, M.; Benato, R. Li-ion battery-flywheel hybrid storage system: Countering battery aging during a grid frequency regulation service. Appl. Sci. 2018, 8, 2330. [Google Scholar] [CrossRef] [Green Version]
  16. Sessa, S.D.; Andriollo, M.; Tortella, A. Simulation Results from a Kinetic-Electrochemical Energy Storage Model for Network Frequency Regulation. In Proceedings of the AEIT International Annual Conference (AEIT), Florence, Italy, 18–20 September 2019; pp. 1–6. [Google Scholar] [CrossRef]
  17. Jaafar, A.; Akli, C.R.; Sareni, B.; Roboam, X.; Jeunesse, A. Sizing and energy management of a hybrid locomotive based on flywheel and accumulators. IEEE Trans. Veh. Technol. 2009, 58, 3947–3958. [Google Scholar] [CrossRef] [Green Version]
  18. Dhand, A.; Pullen, K. Optimal energy management for a flywheel-assisted battery electric vehicle. Proc. Inst. Mech. Eng. Part D J. Automob. Eng. 2015, 229, 1672–1682. [Google Scholar] [CrossRef] [Green Version]
  19. Foley, I. Williams Hybrid Power—Flywheel energy storage. Engine Expo 2013. [Google Scholar] [CrossRef]
  20. Hansen, J.; O’Kain, D. An Assessment of Flywheel High Power Energy Storage Technology for Hybrid Vehicles; Technical Report; Oak Ridge National Laboratory: Oak Ridge, TN, USA, 2011.
  21. Plomer, J.; First, J. Flywheel energy storage retrofit system for hybrid and electric vehicles. In Proceedings of the Smart Cities Symposium Prague (SCSP 2015), Prague, Czech Republic, 24–25 June 2015; pp. 1–6. [Google Scholar] [CrossRef]
  22. Daberkow, P.A.; Ehlert, M.; Kaise, D. Electric Car Operation and Flywheel Energy Storage. In Conference on Future Automotive Technology; Lienkamp, M., Ed.; Springer: Wiesbaden, Germany, 2013. [Google Scholar] [CrossRef]
  23. Olivier, B.; Vinasse, J.M.; Lajnef, W.; Azzopardi, S.; Woirgard, E. Principle, design and experimental validation of a flywheel-battery hybrid source for heavy-duty electric vehicles. IET Electr. Power Appl. 2007, 1, 643–656. [Google Scholar]
  24. Itani, K.; De Bernardinis, A.; Khatir, Z.; Jammal, A. Energy management of a battery-flywheel storage system used for regenerative braking recuperation of an Electric Vehicle. In Proceedings of the 42nd Annual Conference of the IEEE Industrial Electronics Society, Florence, Italy, 23–26 October 2016; pp. 2034–2039. [Google Scholar] [CrossRef]
  25. Itani, K.; De Bernardinis, A.; Khatir, Z.; Jammal, A. Integration of different modules of an electric vehicle powered by a battery-flywheel storage system during traction operation. In Proceedings of the IEEE International Multidisciplinary Conference on Engineering Technology (IMCET), Beirut, Lebanon, 2–4 November 2016; pp. 126–131. [Google Scholar] [CrossRef]
  26. Santucci, A.; Sorniotti, A.; Lekakou, C. Power split strategies for hybrid energy storage systems for vehicular applications. J. Power Sources 2014, 258, 395–407. [Google Scholar] [CrossRef] [Green Version]
  27. Lajunen, A. Lifecycle costs and charging requirements of electric buses with different charging methods. J. Clean. Prod. 2018, 172, 56–67. [Google Scholar] [CrossRef]
  28. Kivekäs, K.; Lajunen, A.; Vepsäläinen, J.; Tammi, K. City bus powertrain comparison: Driving cycle variation and passenger load sensitivity analysis. Energies 2018, 11, 1755. [Google Scholar] [CrossRef] [Green Version]
  29. Lajunen, A.; Lipman, T. Lifecycle cost assessment and carbon dioxide emissions of diesel, natural gas, hybrid electric, fuel cell hybrid and electric transit buses. Energy 2016, 106, 329–342. [Google Scholar] [CrossRef]
  30. Vepsäläinen, J.; Kivekäs, K.; Otto, K.; Lajunen, A.; Tammi, K. Development and validation of energy demand uncertainty model for electric city buses. Transp. Res. Part D Transp. Environ. 2018, 63, 347–361. [Google Scholar] [CrossRef]
  31. Groot, J. State-of-Health Estimation of Li-Ion Batteries: Cycle Life Test Methods. Ph.D. Thesis, Chalmers University of Technology, Göteborg, Sweden, 2012. Available online: http://komar.in/files/JensGroot.pdf (accessed on 6 February 2021).
  32. Vetter, J.; Novák, P.; Wagner, M.R.; Veit, C.; Möller, K.C.; Besenhard, J.O.; Winter, M.; Wohlfahrt-Mehrens, M.; Vogler, C.; Hammouche, A. Ageing mechanisms in lithium-ion batteries. J. Power Sources 2005, 147, 269–281. [Google Scholar] [CrossRef]
  33. Ecker, M.; Nieto, N.; Käbitz, S.; Schmalstieg, J.; Blanke, H.; Warnecke, A.; Sauer, D.U. Calendar and cycle life study of Li(NiMnCo)O2-based 18,650 lithium-ion batteries. J. Power Sources 2014, 248, 839–851. [Google Scholar] [CrossRef]
  34. Spotnitz, R. Simulation of capacity fade in lithium-ion batteries. J. Power Sources 2003, 113, 72–80. [Google Scholar] [CrossRef]
  35. Han, X.; Ouyang, M.; Lu, L.; Li, J. A comparative study of commercial lithium ion battery cycle life in electric vehicle: Capacity loss estimation. J. Power Sources 2014, 268, 658–669. [Google Scholar] [CrossRef]
  36. Han, X.; Ouyang, M.; Lu, L.; Li, J. Cycle life of commercial lithium-ion batteries with lithium titanium oxide anodes in electric vehicles. Energies 2014, 7, 4895–4909. [Google Scholar] [CrossRef] [Green Version]
  37. Rothgang, S.; Rogge, M.; Becker, J.; Sauer, D.U. Battery design for successful electrification in public transport. Energies 2015, 8, 6715–6737. [Google Scholar] [CrossRef] [Green Version]
  38. Jafari, M.; Gauchia, A.; Zhao, S.; Zhang, K.; Gauchia, L. Electric Vehicle Battery Cycle Aging Evaluation in Real-World Daily Driving and Vehicle-to-Grid Services. IEEE Trans. Transp. Electrif. 2017, 4, 122–134. [Google Scholar] [CrossRef]
  39. Namor, E.; Torregrossa, D.; Sossan, F.; Cherkaoui, R.; Paolone, M. Assessment of battery ageing and implementation of an ageing aware control strategy for a load leveling application of a lithium titanate battery energy storage system. In Proceedings of the IEEE 17th Workshop on Control and Modeling for Power Electronics (COMPEL 2016), Trondheim, Norway, 27–30 June 2016; pp. 1–6. [Google Scholar] [CrossRef] [Green Version]
  40. Schneider, M. Ganzheitlicher Modellbasierter Entwurf von Kinetischen Energiespeichern in Außenläuferbauform. Ph.D. Thesis, TU Darmstadt, Darmstadt, Germany, 2019. [Google Scholar]
  41. Quurck, L.; Richter, M.; Schneider, M.; Franz, D.; Rinderknecht, S. Design and practical realization of an innovative flywheel concept for industrial applications. Tech. Mech. 2017, 37, 151–160. [Google Scholar] [CrossRef]
  42. Carter, R.; Cruden, A.; Hall, P.J. Optimizing for efficiency or battery life in a battery/supercapacitor electric vehicle. IEEE Trans. Veh. Technol. 2012, 61, 1526–1533. [Google Scholar] [CrossRef]
  43. Adamy, J. Nichtlineare Systeme und Regelungen, 2nd ed.; Springer: Berlin/Heidelberg, Germany, 2014; Volume 2. [Google Scholar] [CrossRef]
  44. Huang, Y.; Wang, H.; Khajepour, A.; He, H.; Ji, J. Model predictive control power management strategies for HEVs: A review. J. Power Sources 2017, 341, 91–106. [Google Scholar] [CrossRef]
  45. Bemporad, A.; Morari, M.; Ricker, N. Model Predictive Control Toolbox for Use with MATLAB, 2nd ed.; The MathWorks Inc.: Natick, MA, USA, 2015. [Google Scholar]
  46. Song, Z.; Hofmann, H.; Li, J.; Hou, J.; Han, X.; Ouyang, M. Energy management strategies comparison for electric vehicles with hybrid energy storage system. Appl. Energy 2014, 134, 321–331. [Google Scholar] [CrossRef]
  47. Vepsäläinen, J.; Ritari, A.; Lajunen, A.; Kivekäs, K.; Tammi, K. Energy Uncertainty Analysis of Electric Buses. Energies 2018, 11, 3267. [Google Scholar] [CrossRef] [Green Version]
Figure 1. Bus line 11 in Espoo, Finland (Map data ©2020 OpenStreetMaps).
Energies 14 00899 g001
Figure 2. Topology of the electric powertrain, consisting of the hybrid energy storage system, the battery and KESS feeding inverter and the electric drive connected to the final drive.
Energies 14 00899 g002
Figure 3. The Thévenin equivalent circuit model of the battery and the relationship between battery open-circuit voltage uoc and SOC. (a) Thévenin equivalent circuit model. (b) Open-circuit voltage uoc over SOC [28].
Energies 14 00899 g003
Figure 4. Flow-chart of the rule-based control strategy.
Energies 14 00899 g004
Figure 5. Layout of the nonlinear model predictive control algorithm.
Energies 14 00899 g005
Figure 6. Extract of battery current i bat along the E11 driving cycle for FW1.
Energies 14 00899 g006
Figure 7. State of charge of battery S O C bat and KESS S O C fw along the E11 driving cycle for FW1.
Energies 14 00899 g007
Figure 8. Battery current i bat along the E11 driving cycle for the NMPC.
Energies 14 00899 g008
Figure 9. Battery life increase for KESS configurations (left: RB1, middle: RB2, right: NMPC).
Energies 14 00899 g009
Table 1. Overview of flywheels used in racing cars and vehicles [5,19,20].
ApplicationNamePeak Power in kWEnergy in WhMass in kgMax. Speed in rpm
Racing carsGKN Porsche GT3R Flywheel18037557
GKN Audi e-tron 2013 Flywheel1509727
Flybrid Systems LLP1101112560,000
Light-duty &
heavy-duty
vehicles
GKN Gyrodrive FW Hybrid System1203606036,000
Ricardo UK Ltd.602203060,000
Powerthru19066714752,500
L-3 CMM *300200040012,000
HyKinesys1003005020,000
Flywheel Energy Systems Inc.12075015028,000
* L-3 Communications Magnet-Motor GmbH.
Table 2. Characteristic parameters of the BR and E11 driving cycle [29].
ParameterValueUnit
BRE11
Duration17401548 s
Distance10.910.2 k m
Max. speed58.258.4 k m / h
Average speed22.523.8 k m / h
Number of stops2818-
Stops per km2.61.7-
Max. acceleration2.41.6 m / s 2
Max. deceleration3.61.9 m / s 2
Aggressiveness0.240.15 m / s 2
Table 3. Parameters of the battery electric bus model [28,30].
ParameterSymbolValueUnit
GeneralCurb mass m v 10,500 k g
Vehicle frontal area A v 6.2 m 2
Coefficient of drag C d 0.5
Differential gear ratio i g 4.93
Differential gear efficiency η g 98
Tire dynamic radius r t 0.43 m
Total inertia at output axle J t 1.95 k g m 2
Rolling resistance coefficient f rr 0.008
Air density (for T a = 6   ° C ) ρ a 1.32 k g / m 3
Ambient temperature T a −6 ° C
Auxiliary power demand P aux 5.16 k W
MotorMaximum motor power P max 180 k W
Number of pole pairsp6
Stator armature inductance L s 0.3 m H
Stator resistance R s 157 m Ω
BatteryNumber of cells in series x 1 300-
Number of cells in parallel x 2 4-
Nominal voltage u b 690 V
Energy capacity E b 55.2 k Wh
Coulombic nominal capacity Q nom 80 Ah
Internal resistance R int 87.5 m Ω
Internal capacitance C ø 0.8 F
Table 4. Parameters of the mobile KESS configurations.
ParameterSymbolValueUnit
FW1FW2FW3
Maximum power P max 100150130 k W
Available kinetic energy E avl 1.101.500.75 k Wh
Maximum kinetic energy E max 1.932.381.40 k Wh
Inertia of rotor J r 4.636.284.37 k g   m 2
Energy density of rotor u r 7.438.725.43 Wh / k g
Maximum speed n m , max 1655215,79014,520 rpm
Base speed limit n m , fwk 11,60688988923 rpm
Minimum state of charge S O C min 413545%
Number of pole pairsp566-
Inner diameter of rotor d i 332360342 m m
Outer diameter of rotor d o 435467430 m m
Height of rotor h r 743768720 m m
Diameter of containment d c 465497460 m m
Height of containment h c 833858810 m m
Mass of rotor m r 148172138 k g
Mass of stator m s 161204165 k g
Mass of containment m c 606758 k g
Overall mass of KESS m KESS 368442361 k g
Table 5. Optimal threshold values of charge controller for the KESS configurations.
ParameterSymbolE11BRUnit
Configuration FW1FW2FW3FW1FW2FW3
Charging power P ch 015015010020020020 k W
Traction TH P thr , trac 403030304030503050305030 k W
Recuperation TH P thr , rec 000000000000 k W
Table 6. Comparative results of the mobile KESS configurations along the E11 driving cycle.
Parameter FW1FW2FW3Unit
BEBRB1RB2NMPCRB1RB2NMPCRB1RB2NMPC
Max. battery current2721511531233021546830430490 A
RMS battery current62.538.636.234.340.434.632.142.238.238.8 A
Battery energy losses147564944624539675557 Wh
KESS energy losses-903905916102610661050938954977 Wh
Energy throughput29.124.924.523.624.224.023.225.925.724.9 Ah
Battery life increase-16.918.723.420.421.425.412.313.317.0%
Table 7. Comparative results of the mobile KESS configurations along the BR driving cycle.
Parameter FW1FW2FW3Unit
BEBRB1RB2NMPCRB1RB2NMPCRB1RB2NMPC
Max. battery current34635028615728632895352331120 A
RMS battery current78.849.743.740.448.242.637.753.745.745.3 A
Battery energy losses26310581699877601228887 Wh
KESS energy losses-100210461060117411971201105911091123 Wh
Energy throughput42.234.834.433.134.333.932.936.235.634.5 Ah
Battery life increase-21.022.527.422.824.528.316.618.322.1%
Publisher’s Note: MDPI stays neutral with regard to jurisdictional claims in published maps and institutional affiliations.

