
Evaluating the Use of Displacement Ventilation for Providing Space Heating in Unoccupied Periods Using Laboratory Experiments, Field Tests and Numerical Simulations

 ,
, 
Abstract
:1. Introduction
2. Literature Review
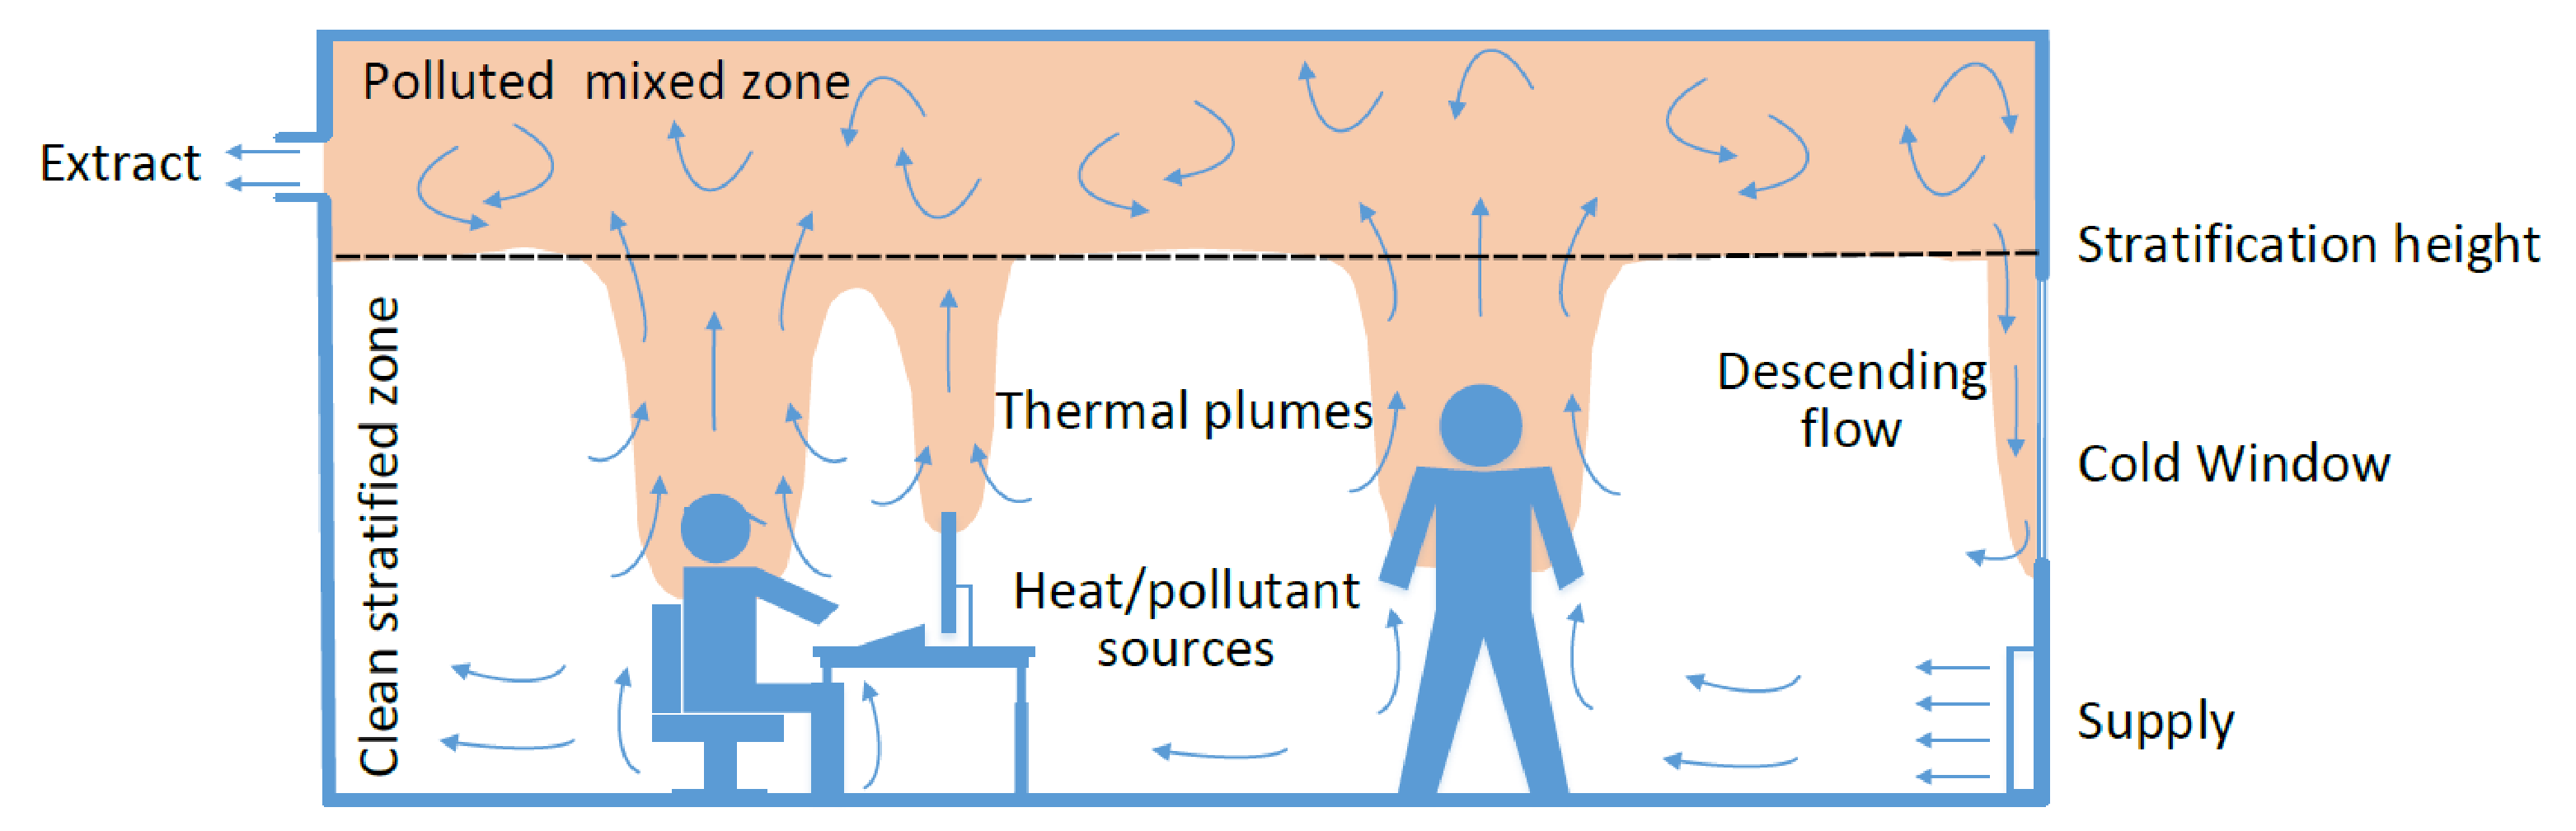
3. A Novel Application of Displacement Ventilation in Cold Climates
4. Method
4.1. Experimental Tests
4.1.1. Lab Tests
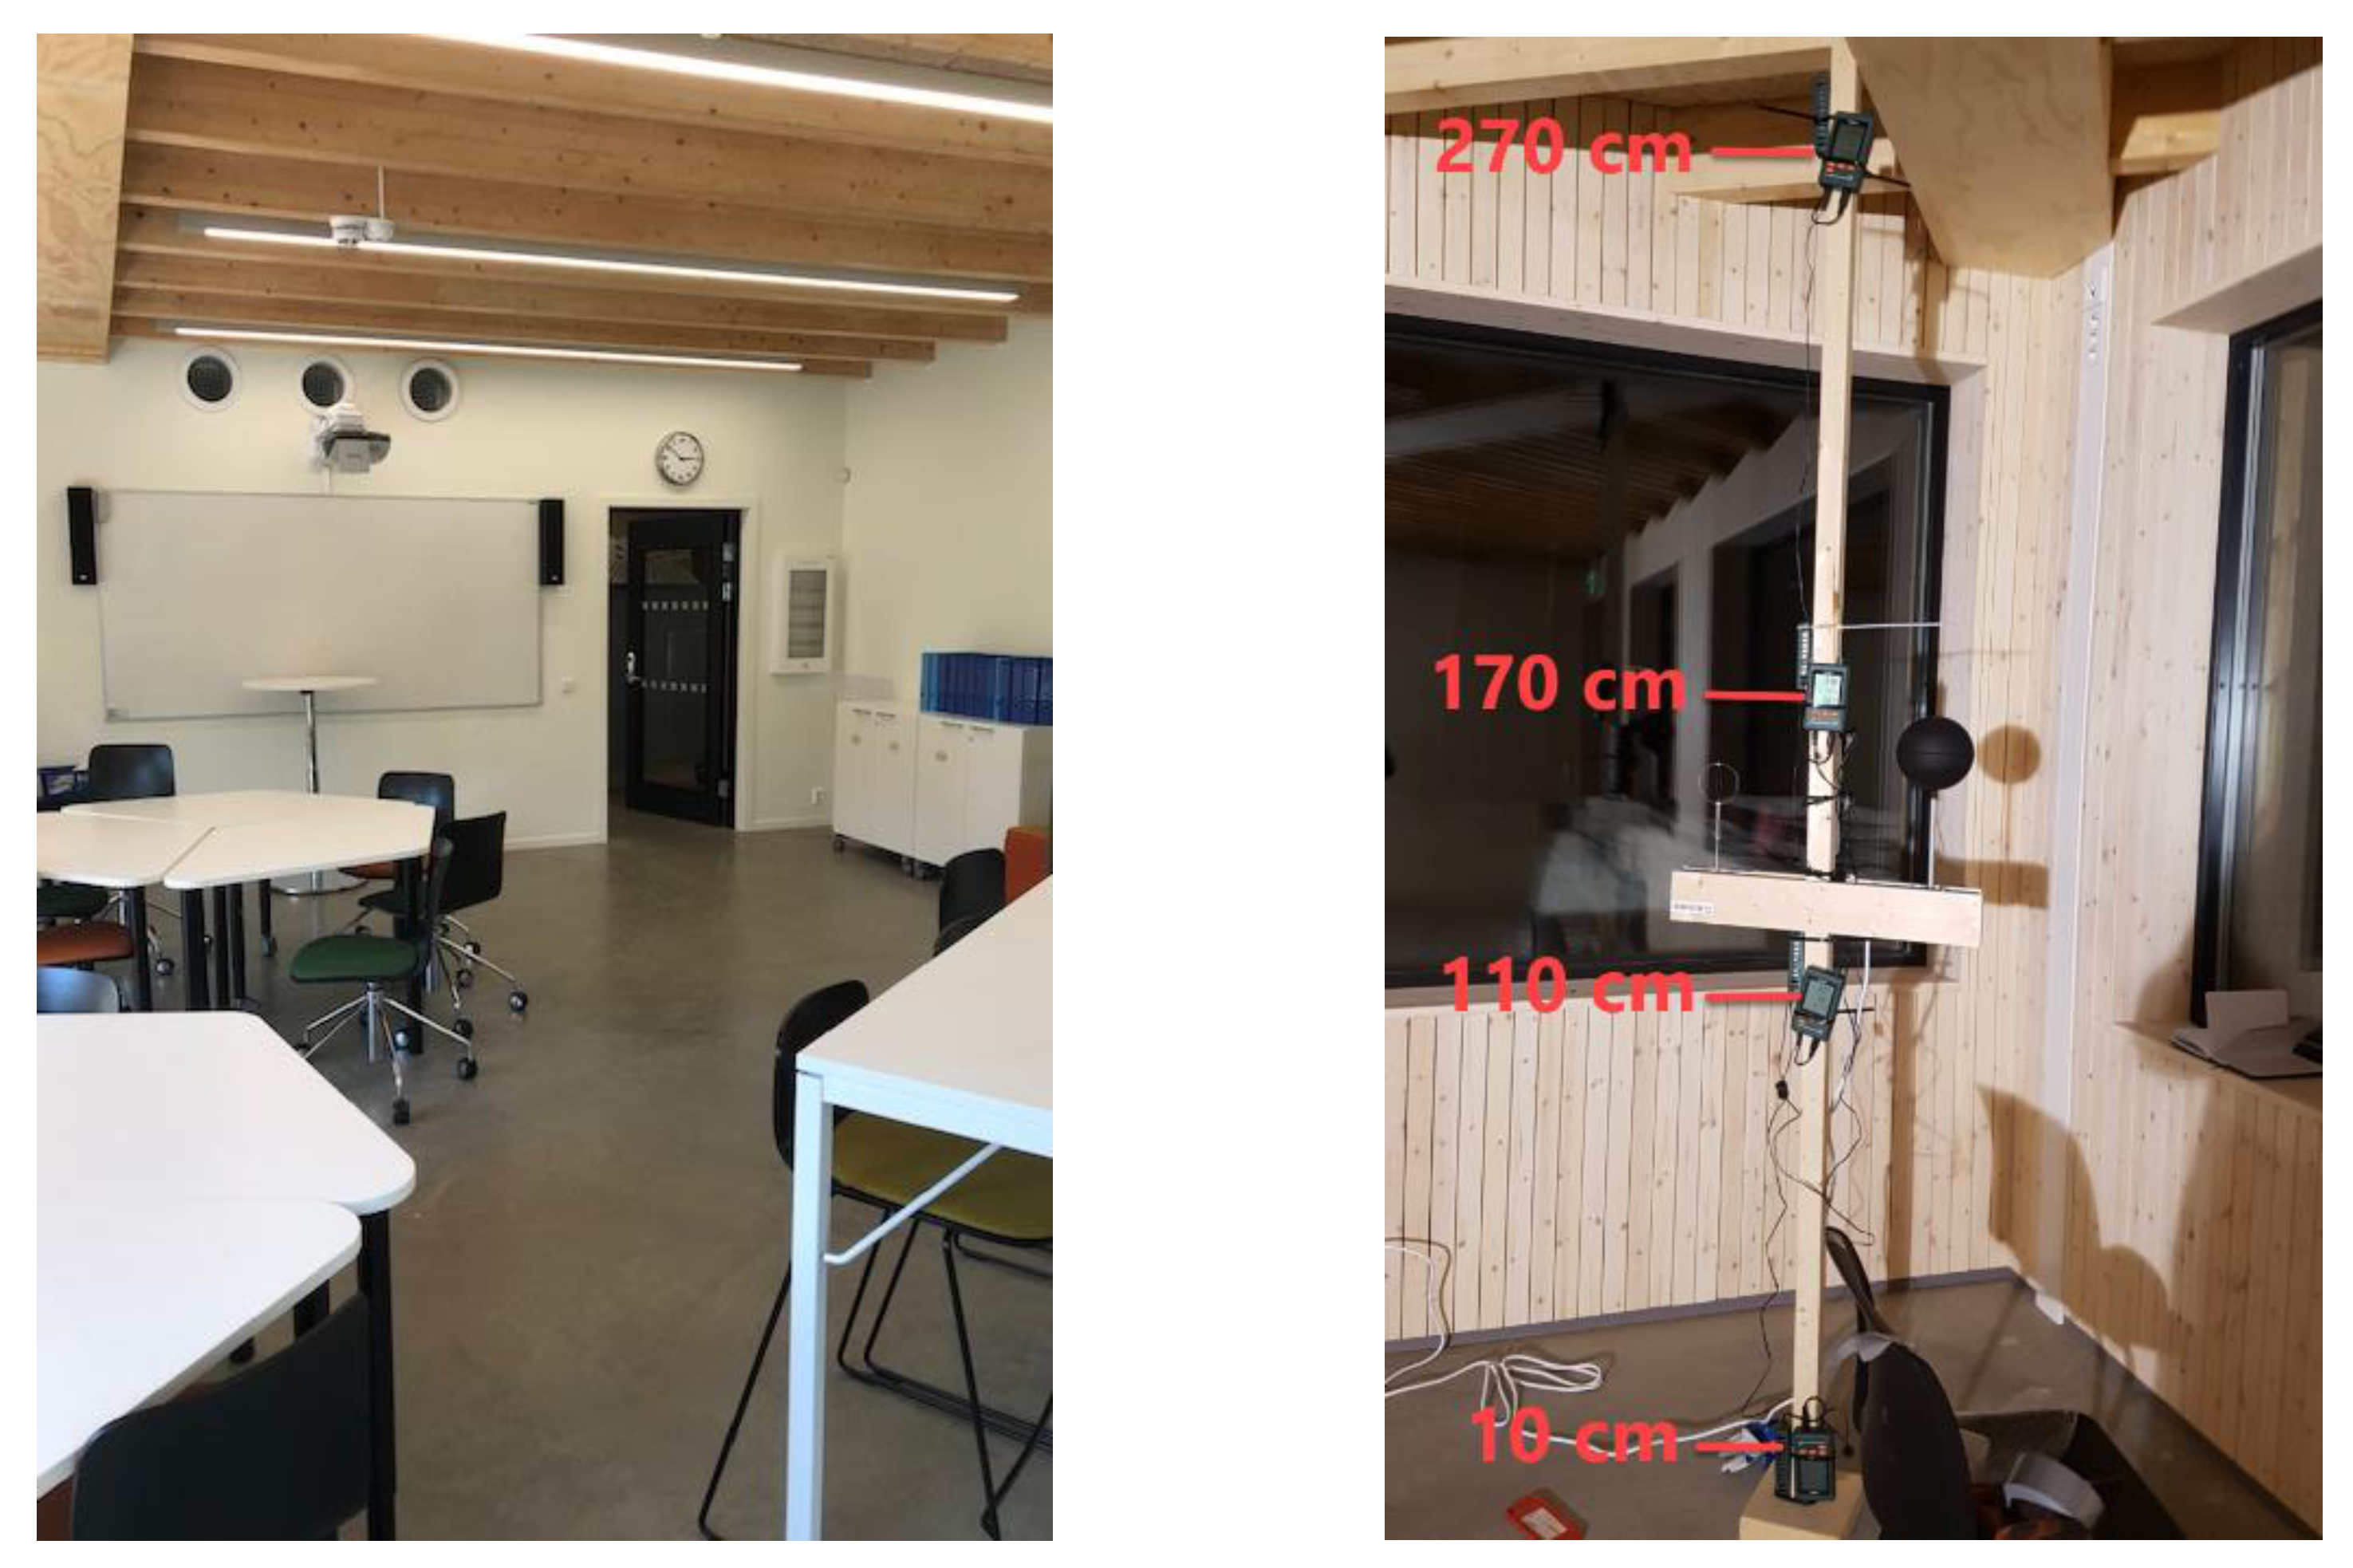
4.1.2. Field Test
4.2. Simulation Studies
4.2.1. Lab Test
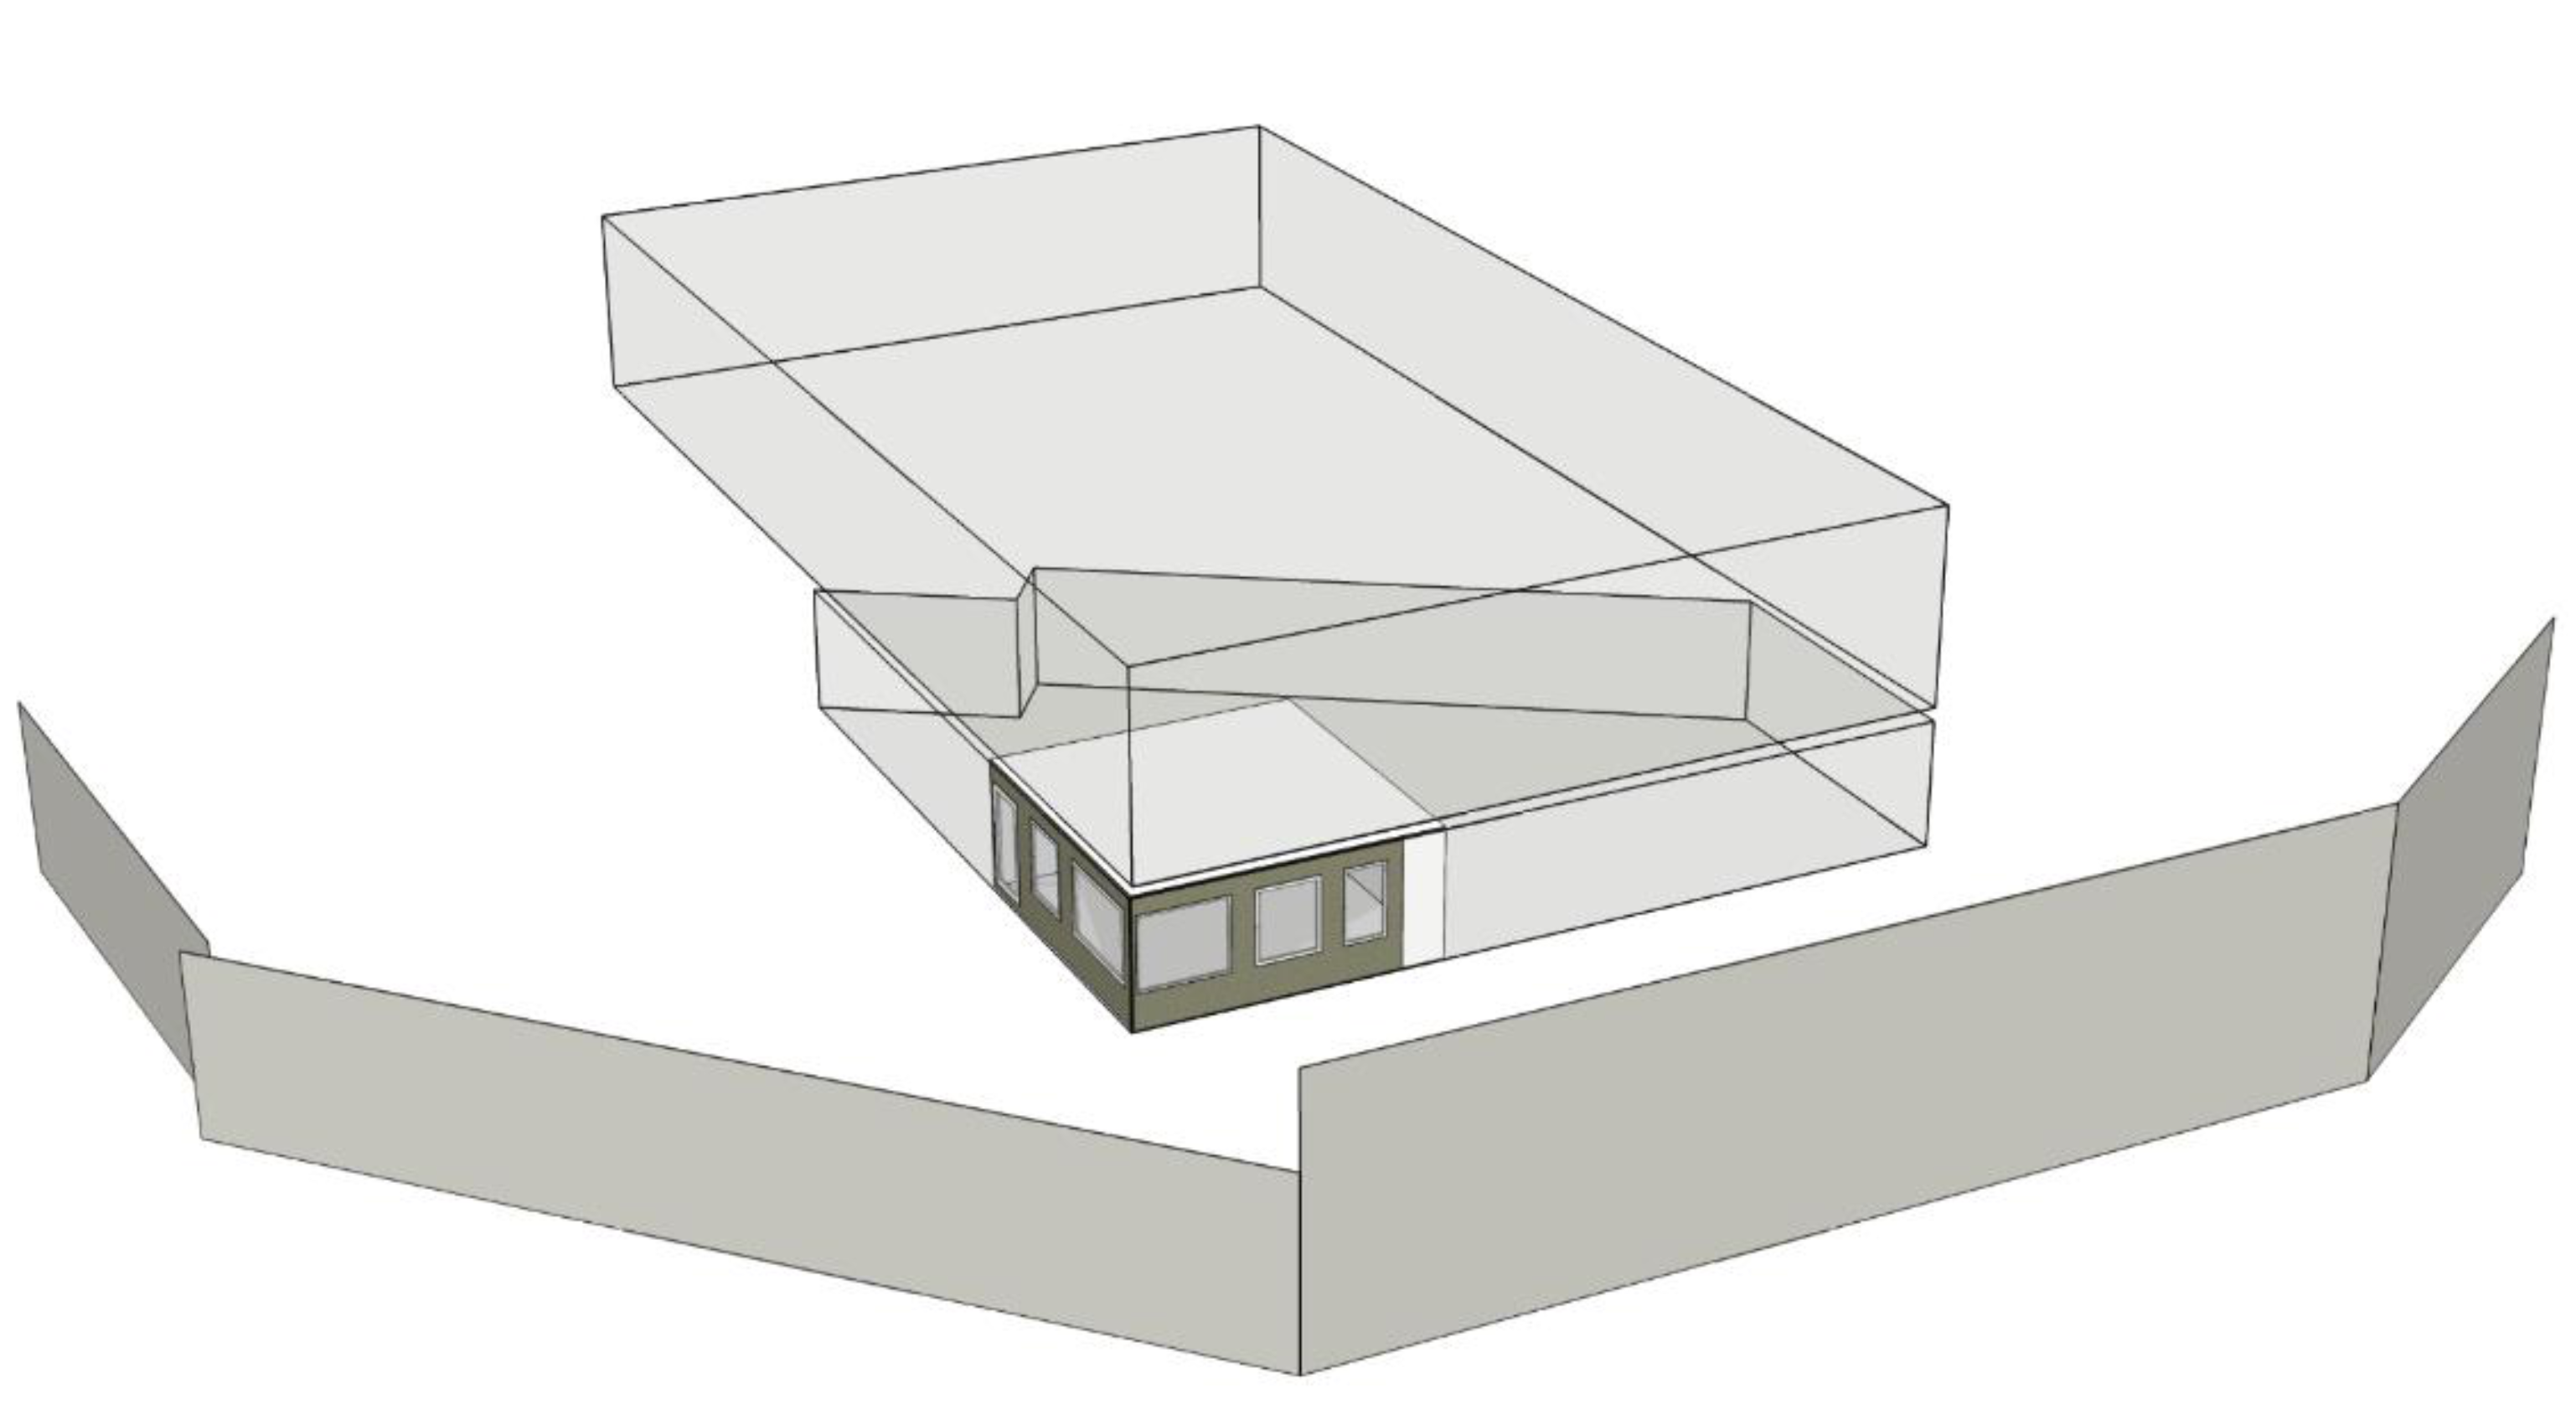
4.2.2. Field Test
5. Results
5.1. Experimental Results
5.1.1. Lab Test
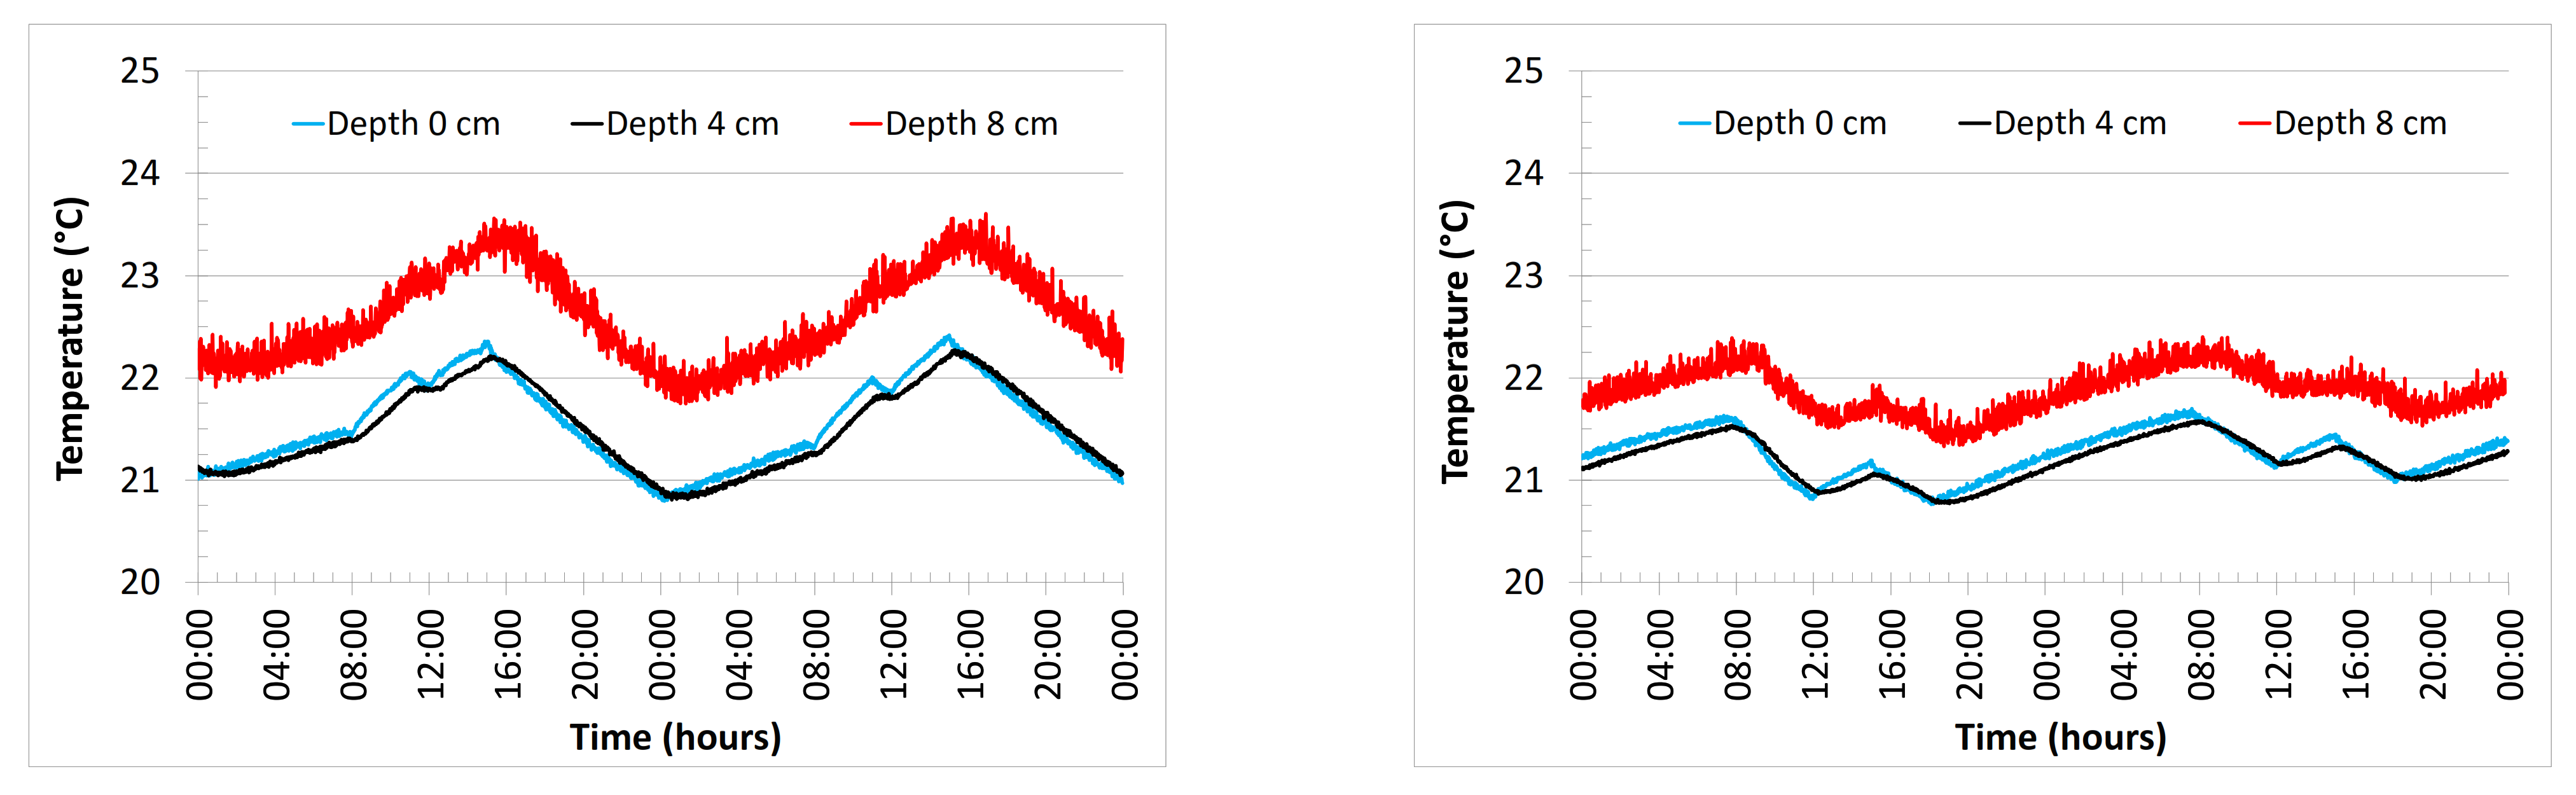
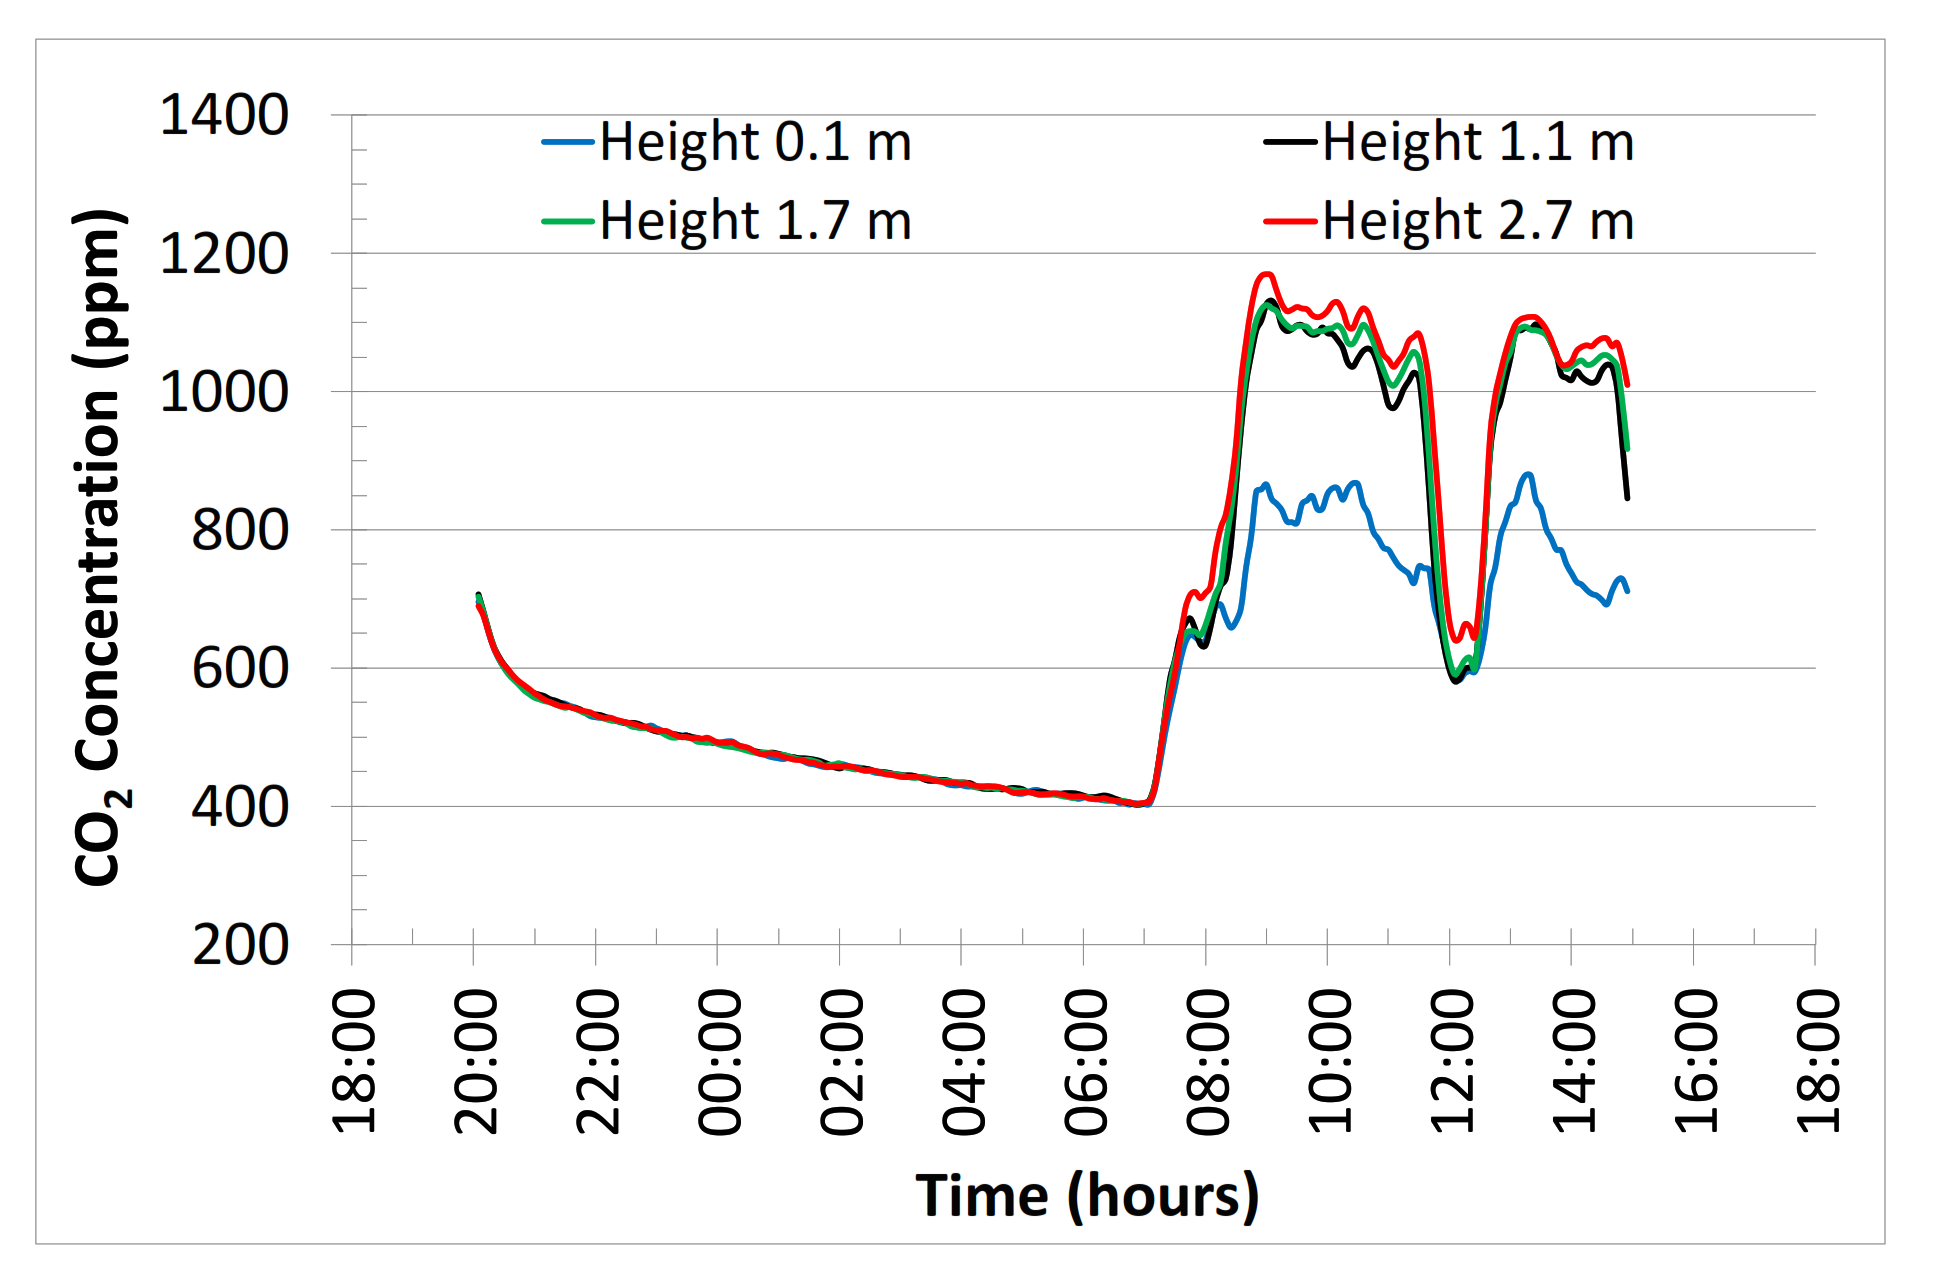
5.1.2. Field Test
5.2. Simulation Results
5.2.1. Lab Test
5.2.2. Field Test
6. Discussion and Conclusions
Author Contributions
Funding
Institutional Review Board Statement
Informed Consent Statement
Data Availability Statement
Acknowledgments
Conflicts of Interest
References
- Zhang, J. Integrating IAQ control strategies to reduce the risk of asymptomatic SARS CoV-2 infections in classrooms and open plan offices. Sci. Technol. Built Environ. 2020, 26, 1013–1018. [Google Scholar] [CrossRef]
- Dorgan, C.B.; Dorgan, C.E.; Kanarek, M.S.; Willman, A.J. Health and productivity benefits of improved indoor air quality. Ashrae Trans. 1998, 104, 658–666. [Google Scholar]
- Šujanová, P.; Rychtáriková, M.; Sotto Mayor, T.; Hyder, A. A healthy, energy-efficient and comfortable indoor environment, a review. Energies 2019, 12, 1414. [Google Scholar] [CrossRef] [Green Version]
- Maroni, M.; Seifert, B.; Lindvall, T. Indoor Air Quality: A Comprehensive Reference Book; Elsevier: Amsterdam, The Netherlands, 1995. [Google Scholar]
- Santos, H.R.; Leal, V.M. Energy vs. ventilation rate in buildings: A comprehensive scenario-based assessment in the European context. Energy Build. 2012, 54, 111–121. [Google Scholar] [CrossRef]
- BRE. BREEAM International New Construction 2016; Building Research Establishment: Watford, UK, 2016. [Google Scholar]
- USGBC. LEED v4.1 Building Design and Construction; Green Building Council: Washington, DC, USA, 2020. [Google Scholar]
- ASHRAE. Ventilation for Acceptable Indoor Air Quality (ASHRAE Standard 62.1-2016); American Society of Heating, Refrigerating, and Air-Conditioning Engineers, Inc.: Atlanta, GA, USA, 2016. [Google Scholar]
- Kosonen, R.; Melikov, A.; Mundt, E.; Mustakallio, P.; Nielsen, P.V. REHVA Guidebook, No. 23: Displacement Ventilation; REHVA: Brussels, Belgium, 2017. [Google Scholar]
- Causone, F.; Olesen, B.W.; Corgnati, S.P. Floor heating with displacement ventilation: An experimental and numerical analysis. HvacR Res. 2010, 16, 139–160. [Google Scholar] [CrossRef]
- Martinopoulos, G.; Papakostas, K.T.; Papadopoulos, A.M. A comparative review of heating systems in EU countries, based on efficiency and fuel cost. Renew. Sustain. Energy Rev. 2018, 90, 687–699. [Google Scholar] [CrossRef]
- de Klijn-Chevalerias, M.; Javed, S. The Dutch approach for assessing and reducing environmental impacts of building materials. Build. Environ. 2017, 111, 147–159. [Google Scholar] [CrossRef]
- Jiang, Z.; Chen, Q.; Lee, K. Air Distribution Effectiveness With Stratified Air Distribution Systems; Final Report for ASHRAE RP-1373; ASHRAE: Atlanta, GA, USA, 2009. [Google Scholar]
- Ouazia, B.; Thompson, A.; Macdonald, I.; Booth, D.; Tardif, M. Contaminant Removal Effectiveness of Displacement Ventilation Systems During Heating Season; Summary Results from Three Field Studies. Ashrae Trans. 2012, 118, 292–299. [Google Scholar]
- Halton Inc. Displacement Ventilation Design Guide; Halton Oy: Helsinki, Finland, 2000. [Google Scholar]
- Price Industries. Fundamentals of Displacement Ventilation. In Price Engineer’s HVAC Handbook–A Comprehensive Guide to HVAC Fundamentals; Price Industries Limited: Winnipeg, MB, Canada, 2011. [Google Scholar]
- Skistad, H.; Mundt, E.; Nielsen, P.V.; Hagström, K.; Railio, J. REHVA Guidebook No. 1: Displacement Ventilation in Non-Industrial Premises; REHVA: Brussels, Belgium, 2002. [Google Scholar]
- Chen, Q.; Glicksman, L. System Performance Evaluation and Design Guidelines for Displacement Ventilation; American Society of Heating, Refrigerating, and Air-Conditioning Engineers, Inc.: Atlanta, GA, USA, 2003. [Google Scholar]
- AEC. Displacement Ventilation Design Guide: K-12 Schools. Final Report for Public Interest Energy Research Program, California Energy Commission; Architectural Energy Corporation: Sacramento, CA, USA, 2006. [Google Scholar]
- Scheff, P.A.; Paulius, V.K.; Huang, S.W.; Conroy, L.M. Indoor air quality in a middle school, Part I: Use of CO2 as a tracer for effective ventilation. Appl. Occup. Environ. Hyg. 2000, 15, 824–834. [Google Scholar] [CrossRef]
- de Gennaro, G.; Dambruoso, P.R.; Loiotile, A.D.; Di Gilio, A.; Giungato, P.; Tutino, M.; Marzocca, A.; Mazzone, A.; Palmisani, J.; Porcelli, F. Indoor air quality in schools. Environ. Chem. Lett. 2014, 12, 467–482. [Google Scholar] [CrossRef]
- Jovanović, M.; Vučićević, B.; Turanjanin, V.; Živković, M.; Spasojević, V. Investigation of indoor and outdoor air quality of the classrooms at a school in Serbia. Energy 2014, 77, 42–48. [Google Scholar]
- Congedo, P.M.; D’Agostino, D.; Baglivo, C.; Tornese, G.; Zacà, I. Efficient solutions and cost-optimal analysis for existing school buildings. Energies 2016, 9, 851. [Google Scholar] [CrossRef] [Green Version]
- Fisk, W.J. The ventilation problem in schools: Literature review. Indoor Air 2017, 27, 1039–1051. [Google Scholar] [CrossRef] [Green Version]
- Daisey, J.M.; Angell, W.J.; Apte, M.G. Indoor air quality, ventilation and health symptoms in schools: An analysis of existing information. Indoor Air 2003, 13, 53–64. [Google Scholar] [CrossRef]
- Norbäck, D.; Wieslander, G.; Zhang, X.; Zhao, Z. Respiratory symptoms, perceived air quality and physiological signs in elementary school pupils in relation to displacement and mixing ventilation system: An intervention study. Indoor Air 2011, 21, 427–437. [Google Scholar] [CrossRef] [PubMed]
- Holland, D.; Livchak, A. Improving indoor air quality in schools by utilizing displacement ventilation system. Proc. Indoor Air 2002, 4, 278–282. [Google Scholar]
- Mundt, E. The Performance of Displacement Ventilation Systems-Experimental and Theoretical Studies. Ph.D. Thesis, Royal Institute of Technology (KTH), Stockholm, Sweden, 1996. [Google Scholar]
- Nielsen, P.V. Temperature and Air Velocity Distribution in Rooms Ventilated by Displacement Ventilation. In Proceedings of the 7th International Symposium on Ventilation for Contaminant Control (Ventilation 2003), Sapporo, Japan, 5–8 August 2003. [Google Scholar]
- Mateus, N.M.; da Graça, G.C. A validated three-node model for displacement ventilation. Build. Environ. 2015, 84, 50–59. [Google Scholar] [CrossRef]
- DOE. “EnergyPlus.”; Version 9.2.0; US Department of Energy: Washington, DC, USA, 2019; [Computer Software].
- EQUA. “IDA Indoor Climate and Energy”; Version 4.8; Simulations AB: Stockholm, Sweden, 2018; [Computer Software]. [Google Scholar]
- Skåret, E. Ventilasjonsteknikk; Institute of Heating, Ventilation and Sanitary Techniques: Trondheim, Norway, 1986. Textbook (In Norwegian) [Google Scholar]
- Koganei, M.; Holbrook, G.T.; Olesen, B.W.; Woods, J.E. Modeling the Thermal and Indoor Air Quality Performance of the Vertical Displacement Ventilation Systems. Indoor Air 1993, 93, 241–246. [Google Scholar]
- Sandberg, E.; Koskela, H.; Hautalampi, T. Convective Flows and Vertical Temperature Gradient with the Active Displacement Air Distribution. In Proceedings of the Roomvent 98: 6th International Conference on Air Distribution in Rooms, Stockholm, Sweden, 14–17 June 1998. [Google Scholar]
- Dokka, T.H. Modelling of Indoor Air Quality in Residential and Commercial Buildings. Ph.D. Thesis, Norwegian University of Science and Technology (NTNU), Trondheim, Norway, 2020. [Google Scholar]
- Yamanaka, T.; Kotani, H.; Xu, M. Zonal Models to Predict Vertical Contaminant Distribution in Room with Displacement Ventilation Accounting for Convection Flows Along Walls. In Proceedings of the Roomvent–10th International Conference on Air Distribution in Rooms, Helsinki, Finland, 13–15 June 2007; FINVAC; FINVAC. [Google Scholar]
- Okutan, G.M. Scale Model Studies of Displacement Ventilation. Bachelor’s Thesis, Massachusetts Institute of Technology, Cambridge, MA, USA, 1995. [Google Scholar]
- Brohus, H.; Nielsen, P.V. Contaminant Distribution Around Persons in Rooms Ventilated by Displacement Ventilation. In Proceedings of the ROOMVENT ’94, Fourth International Conference on Air Distribution in Rooms, Cracow, Poland, 15–17 June 1994. [Google Scholar]
- Brohus, H.; Nielsen, P.V. Personal exposure in displacement ventilated rooms. Indoor Air 1996, 6, 157–167. [Google Scholar] [CrossRef]
- Akimoto, T.; Nakano, J.; Tanabe, S.; Kimura, K. Experimental study on indoor thermal environment of floor-supply displacement ventilation system under various heat load conditions. J. Archit. Plan. 1998, 63, 27–34. [Google Scholar] [CrossRef] [Green Version]
- Yuan, X.; Chen, Q.; Glicksman, L.R. Performance evaluation and design guidelines for displacement ventilation. Ashrae Trans. 1999, 105, 298. [Google Scholar]
- Yuan, X.; Chen, Q.; Glicksman, L.R.; Hu, Y.; Yang, X. Measurements and computations of room airflow with displacement ventilation. Ashrae Trans. 1999, 105, 340. [Google Scholar]
- Xu, M.; Yamanaka, T.; Kotani, H.; Higashimoto, T. Effect of cooled or heated wall on vertical distribution of temperature and contaminant concentration in rooms with displacement ventilation. J. Archit. Plan. Environ. Eng. 2001, 544, 17–23. [Google Scholar]
- Xu, M.; Yamanaka, T.; Kotani, H. Vertical profiles of temperature and contaminant concentration in rooms ventilated by displacement with heat loss through room envelopes. Indoor Air 2001, 11, 111–119. [Google Scholar] [CrossRef]
- Mundt, E. Non-buoyant pollutant sources and particles in displacement ventilation. Build. Environ. 2001, 36, 829–836. [Google Scholar] [CrossRef]
- Cheong, K.W.D.; Yu, W.J.; Kosonen, R.; Tham, K.W.; Sekhar, S.C. Assessment of thermal environment using a thermal manikin in a field environment chamber served by displacement ventilation system. Build. Environ. 2006, 41, 1661–1670. [Google Scholar] [CrossRef]
- Cheong, K.W.D.; Yu, W.J.; Sekhar, S.C.; Tham, K.W.; Kosonen, R. Local thermal sensation and comfort study in a field environment chamber served by displacement ventilation system in the tropics. Build. Environ. 2007, 42, 525–533. [Google Scholar] [CrossRef]
- Wachenfeldt, B.J.; Mysen, M.; Schild, P.G. Air flow rates and energy saving potential in schools with demand-controlled displacement ventilation. Energy Build. 2007, 39, 1073–1079. [Google Scholar] [CrossRef]
- Trzeciakiewicz, Z. An experimental analysis of the two-zone airflow Pattern Formed in a room with displacement ventilation. Int. J. Vent. 2008, 7, 221–231. [Google Scholar] [CrossRef]
- Yu, W.J.; Cheong, K.W.D.; Tham, K.W.; Sekhar, S.C.; Kosonen, R. Thermal effect of temperature gradient in a field environment chamber served by displacement ventilation system in the tropics. Build. Environ. 2007, 42, 516–524. [Google Scholar] [CrossRef]
- Lin, Z.; Chow, T.T.; Tsang, C.F.; Chan, L.S.; Fong, K.F. Effect of air supply temperature on the performance of displacement ventilation (Part I)-thermal comfort. Indoor Built Environ. 2005, 14, 103–115. [Google Scholar] [CrossRef]
- Lin, Z.; Chow, T.T.; Tsang, C.F.; Fong, K.F.; Chan, L.S. CFD study on effect of the air supply location on the performance of the displacement ventilation system. Build. Environ. 2005, 40, 1051–1067. [Google Scholar] [CrossRef]
- Kang, Y.; Wang, Y.; Zhong, K. Effects of supply air temperature and inlet location on particle dispersion in displacement ventilation rooms. Particuology 2011, 9, 619–625. [Google Scholar] [CrossRef]
- Kobayashi, N.; Chen, Q. Floor-supply displacement ventilation in a small office. Indoor Built Environ. 2003, 12, 281–291. [Google Scholar] [CrossRef]
- Lin, Y.J.P.; Lin, C.L. A study on flow stratification in a space using displacement ventilation. Int. J. Heat Mass Transf. 2014, 73, 67–75. [Google Scholar] [CrossRef]
- Mathisen, H.M. Displacement ventilation-the influence of the characteristics of the supply air terminal device on the airflow pattern. Indoor Air 1991, 1, 47–64. [Google Scholar] [CrossRef]
- Zhang, T.; Lee, K.; Chen, Q. A simplified approach to describe complex diffusers in displacement ventilation for CFD simulations. Indoor Air 2009, 19, 255–267. [Google Scholar] [CrossRef]
- Cehlin, M.; Moshfegh, B. Numerical modeling of a complex diffuser in a room with displacement ventilation. Build. Environ. 2010, 45, 2240–2252. [Google Scholar] [CrossRef]
- Park, H.J.; Holland, D. The effect of location of a convective heat source on displacement ventilation: CFD study. Build. Environ. 2001, 36, 883–889. [Google Scholar] [CrossRef]
- Rees, S.J.; McGuirk, J.J.; Haves, P. Numerical investigation of transient buoyant flow in a room with a displacement ventilation and chilled ceiling system. Int. J. Heat Mass Transf. 2001, 44, 3067–3080. [Google Scholar] [CrossRef]
- Deevy, M.; Sinai, Y.; Everitt, P.; Voigt, L.; Gobeau, N. Modelling the effect of an occupant on displacement ventilation with computational fluid dynamics. Energy Build. 2008, 40, 255–264. [Google Scholar] [CrossRef]
- Zhong, K.; Kang, Y.; Wang, Y. Effect of source location on particle dispersion in displacement ventilation rooms. Particuology 2008, 6, 362–368. [Google Scholar] [CrossRef]
- Matsumoto, H.; Matsusaki, A.; Ohba, Y. CFD Simulation of Air Distribution in Displacement Ventilated Rooms with a Moving Object. In Proceedings of the Roomvent Congress, University of Coimbra, Coimbra, Portugal, 5–8 September 2004. [Google Scholar]
- Matsumoto, H.; Ohba, Y. The influence of a moving object on air distribution in displacement ventilated rooms. J. Asian Archit. Build. Eng. 2004, 3, 71–75. [Google Scholar] [CrossRef] [Green Version]
- Mazumdar, S.; Yin, Y.; Guity, A.; Marmion, P.; Gulick, B.; Chen, Q. Impact of Moving Objects on Contaminant Concentration Distributions in an Inpatient Ward with Displacement Ventilation. HvacR Res. 2010, 16, 545–563. [Google Scholar] [CrossRef]
- Li, Y.; Fuchs, L.; Sandberg, M. Numerical prediction of airflow and heat-radiation interaction in a room with displacement ventilation. Energy Build. 1993, 20, 27–43. [Google Scholar] [CrossRef]
- Faure, X.; Le Roux, N. Time dependent flows in displacement ventilation considering the volume envelope heat transfers. Build. Environ. 2012, 50, 221–230. [Google Scholar] [CrossRef]
- Wu, X.; Olesen, B.W.; Fang, L.; Zhao, J. A nodal model to predict vertical temperature distribution in a room with floor heating and displacement ventilation. Build. Environ. 2013, 59, 626–634. [Google Scholar] [CrossRef]
- Lin, Z.; Chow, T.T.; Tsang, C.F.; Fong, K.F.; Chan, L.S. Effects of headroom on the performance of the displacement ventilation system. Indoor Built Environ. 2006, 15, 333–346. [Google Scholar] [CrossRef]
- Hashimoto, Y.; Yoneda, H. Numerical Study on the Influence of a Ceiling Height for Displacement Ventilation. In Proceedings of the 11th International IBPSA Conference, Glasgow, Scotland, UK, 27–30 July 2009. [Google Scholar]
- Lin, Z.; Chow, T.T.; Tsang, C.F. Effect of door opening on the performance of displacement ventilation in a typical office building. Build. Environ. 2007, 42, 1335–1347. [Google Scholar] [CrossRef]
- Xing, H.; Hatton, A.; Awbi, H.B. A study of the air quality in the breathing zone in a room with displacement ventilation. Build. Environ. 2001, 36, 809–820. [Google Scholar] [CrossRef]
- Xing, H.; Awbi, H.B. Measurement and calculation of the neutral height in a room with displacement ventilation. Build. Environ. 2002, 37, 961–967. [Google Scholar] [CrossRef]
- Lau, J.; Chen, Q. Floor-supply displacement ventilation for workshops. Build. Environ. 2007, 42, 1718–1730. [Google Scholar] [CrossRef]
- Fatemi, I.; Wang, B.C.; Koupriyanov, M.; Tully, B. Experimental study of a non-isothermal wall jet issued by a displacement ventilation system. Build. Environ. 2013, 66, 131–140. [Google Scholar] [CrossRef]
- Fernández-Gutiérrez, A.; González-Prieto, I.; Parras, L.; Gutiérrez-Castillo, P.; Cejudo-López, J.M.; del Pino, C. Experimental and numerical study of a small-scale and low-velocity indoor diffuser for displacement ventilation: Isothermal floor. Appl. Therm. Eng. 2015, 87, 79–88. [Google Scholar] [CrossRef]
- Magnier-Bergeron, L. Measurement, Analysis, and Modeling of Non-Isothermal Low-Velocity Displacement Ventilation Jets. Bachelor’s Thesis, Concordia University Montreal, Quebec, QC, Canada, 2015. [Google Scholar]
- Causone, F.; Baldin, F.; Olesen, B.W.; Corgnati, S.P. Floor heating and cooling combined with displacement ventilation: Possibilities and limitations. Energy Build. 2010, 42, 2338–2352. [Google Scholar] [CrossRef]
- Rees, S.J.; Haves, P. An experimental study of air flow and temperature distribution in a room with displacement ventilation and a chilled ceiling. Build. Environ. 2013, 59, 358–368. [Google Scholar] [CrossRef] [Green Version]
- Schiavon, S.; Bauman, F.S.; Tully, B.; Rimmer, J. Chilled ceiling and displacement ventilation system: Laboratory study with high cooling load. Sci. Technol. Built Environ. 2015, 21, 944–956. [Google Scholar] [CrossRef] [Green Version]
- Ouazia, B.; Tardif, M.; Macdonald, I.; Thompson, A.; Booth, D. In-situ performance of displacement ventilation system in Canadian schools with radiant heating systems. Ashrae Trans. 2011, 117, 207–220. [Google Scholar]
- Akimoto, T.; Nobe, T.; Tanabe, S.; Kimura, K. Experimental Study on Indoor Thermal Environment and Ventilation Performance of Floor-Supply Displacement Ventilation System. J. Archit. Plan. 1997, 62, 17–25. [Google Scholar] [CrossRef]
- Rimmer, J.; Tully, B.; Guity, A. A Field Study of the Air Change Effectiveness of Overhead Air Distribution and Displacement Ventilation in Healthcare. Proceedings of IAQ 2010, Kuala Lumpur, Malaysia, 10–12 November 2010. [Google Scholar]
- Breum, N.O. Ventilation efficiency in an occupied office with displacement ventilation—A laboratory study. Environ. Int. 1992, 18, 353–361. [Google Scholar] [CrossRef]
- Olmedo, I.; Nielsen, P.V.; Ruiz de Adana, M.; Jensen, R.L.; Grzelecki, P. Distribution of exhaled contaminants and personal exposure in a room using three different air distribution strategies. Indoor Air 2012, 22, 64–76. [Google Scholar] [CrossRef]
- Wu, X.; Fang, L.; Olesen, B.W.; Zhao, J.; Wang, F. Air distribution in a multi-occupant room with mixing or displacement ventilation with or without floor or ceiling heating. Sci. Technol. Built Environ. 2015, 21, 1109–1116. [Google Scholar] [CrossRef] [Green Version]
- Behne, M. Indoor air quality in rooms with cooled ceilings.: Mixing ventilation or rather displacement ventilation? Energy Build. 1999, 30, 155–166. [Google Scholar] [CrossRef]
- Cermak, R.; Melikov, A.K.; Forejt, L.; Kovar, O. Performance of personalized ventilation in conjunction with mixing and displacement ventilation. HvacR Res. 2006, 12, 295–311. [Google Scholar] [CrossRef]
- Cermak, R.; Melikov, A.K. Air quality and thermal comfort in an office with underfloor, mixing and displacement ventilation. Int. J. Vent. 2006, 5, 323–352. [Google Scholar] [CrossRef]
- Yin, Y.; Xu, W.; Gupta, J.K.; Guity, A.; Marmion, P.; Manning, A.; Gulick, B.; Zhang, X.; Chen, Q. Experimental study on displacement and mixing ventilation systems for a patient ward. HvacR Res. 2009, 15, 1175–1191. [Google Scholar] [CrossRef] [Green Version]
- Smedje, G.; Mattsson, M.; Wålinder, R. Comparing mixing and displacement ventilation in classrooms: Pupils’ perception and health. Indoor Air 2011, 21, 454–461. [Google Scholar] [CrossRef]
- Hu, S.; Chen, Q.; Glicksman, L.R. Comparison of energy consumption between displacement and mixing ventilation systems for different US buildings and climates. Ashrae Trans. 1999, 105, 453. [Google Scholar]
- Lin, Z.; Chow, T.T.; Fong, K.F.; Wang, Q.; Li, Y. Comparison of performances of displacement and mixing ventilations. Part I Thermal Comfort. Int. J. Refrig. 2005, 28, 276–287. [Google Scholar] [CrossRef]
- Lin, Z.; Chow, T.T.; Fong, K.F.; Tsang, C.F.; Wang, Q. Comparison of performances of displacement and mixing ventilations. Part II Indoor Air Quality. Int. J. Refrig. 2005, 28, 288–305. [Google Scholar]
- ENOVA. Enovas Byggstatistikk 2017 (in Norwegian); ENOVA SF: Trondheim, Norway, 2018. [Google Scholar]
- Georges, L.; Berner, M.; Mathisen, H.M. Air heating of passive houses in cold climates: Investigation using detailed dynamic simulations. Build. Environ. 2014, 74, 1–12. [Google Scholar] [CrossRef] [Green Version]
- Standard Norge. NS 3701: Kriterier for Passivhus Og Lavenergibygninger–Yrkesbygninger (Criteria for Passive Houses and Low Energy Buildings Non-Residential Buildings); Standard Norge: Oslo, Norway, 2012. [Google Scholar]
- Feist, W.; Schnieders, J.; Dorer, V.; and Haas, A. Re-inventing air heating: Convenient and comfortable within the frame of the Passive House concept. Energy Build. 2005, 37, 1186–1203. [Google Scholar] [CrossRef]
- Cablé, A.; Mysen, M.; Thunshelle, K. Can Demand-Controlled Ventilation replace space heating in buildings with low-energy demand? In Proceedings of the Indoor Air 2014, Hong-Kong, 7–12 July 2014.
- Powerhouse. Powerhouse Drøbak Montessori School, 2020. Available online: https://www.powerhouse.no/en/prosjekter/powerhouse-drobak-montesorri/ (accessed on 27 November 2020).
- Abugabbara, M.; Javed, S. Validation of TEKNOsim 6 According to CIBSE TM33. In Cold Climate HVAC Conference; Springer: Cham, Switzerland, 2018; pp. 665–676. [Google Scholar]
- CEN. EN 15265:2007: Energy Performance of Buildings–Calculation of Energy Needs for Space Heating and Cooling Using Dynamic Methods–General Criteria and Validation Procedures; CEN–European Committee for Standardization: Brussels, Belgium, 2007. [Google Scholar]
- ASHRAE. ASHRAE Standard 140-2014: Standard Method of Test for the Evaluation of Building Energy Analysis Computer Programs; American Society of Heating, Refrigerating, and Air-Conditioning Engineers, Inc.: Atlanta, GA, USA, 2014. [Google Scholar]
- CEN. EN ISO 7726:2001: Ergonomics of the Thermal Environment-Instruments for Measuring Physical Quantities; CEN–European Committee for Standardization: Brussels, Belgium, 2001. [Google Scholar]
- CEN. EN 16798-1:2019: Energy Performance of Buildings–Part 1: Indoor Environmental Input Parameters for Design and Assessment of Energy Performance of Buildings Addressing Indoor Air Quality, Thermal Environment, Lighting and Acoustics; CEN–European Committee for Standardization: Brussels, Belgium, 2019. [Google Scholar]
- CEN. EN 16798-2:2019: Energy Performance of Buildings–Part 2: Indoor Environmental Input Parameters for Design and Assessment of Energy Performance of Buildings Addressing Indoor Air Quality, Thermal Environment, Lighting and Acoustics—Interpretation of the Requirements in EN 16798–1; CEN—European Committee for Standardization: Brussels, Belgium, 2019. [Google Scholar]
- Mundt, E.; Mathisen, H.M.; Nielsen, P.V.; Moser, A. REHVA Guidebook, No. 2: Ventilation Effectiveness; REHVA: Brussels, Belgium, 2004. [Google Scholar]
- Hansson, P.; Stymne, H. A Technique to Improve the Performance of Displacement Ventilation During Cold Climate Conditions. In Proceedings of the 17th AlVC Conference, Gothenburg, Sweden, 17–20 September 1996. [Google Scholar]
- Lastovets, N.; Kosonen, R.; Jokisalo, J. The comparison of design airflow rates with dynamic and steady-state displacement models in varied dynamic conditions. Build. Simul. 2020. [Google Scholar] [CrossRef]
- ASHRAE. ASHRAE Handbook: Fundamentals 2017; American Society of Heating, Refrigerating, and Air-Conditioning Engineers, Inc.: Atlanta, GA, USA, 2017. [Google Scholar]
- Sandberg, M.; Mattsson, M. The Effect of Moving Heat Sources Upon the Stratification in Rooms Ventilated by Displacement Ventilation. In Proceedings of the 3rd International Conference on Air Distribution in Rooms (ROOMENT 92), Aalborg, Denmark, 2–4 September 1992. [Google Scholar]
- Brohus, H.; Balling, K.D.; Jeppesen, D. Influence of movements on contaminant transport in an operating room. Indoor Air 2006, 16, 356–372. [Google Scholar] [CrossRef] [PubMed]


| System | Design Parameter | Value |
|---|---|---|
 | Floor area (heated)Air volume (heated) | 886 m2 3340 m3 |
 | U-value external wall | 0.14 W/m2K |
 | U-value roof | 0.09 W/m2K |
 | U-value slab on ground | 0.10 W/m2K |
 | U-value window (average value) | 0.75 W/m2K |
 | Infiltration at 50 Pa | 0.50 ach |
 | Normalized heat capacity (medium-heavy building) | 81 Wh/m2K |
 | Average airflowHeat recovery efficiencySpecific fan power | 4.0–8.0 m3/hm2 86% 0.60 kW/m3/s |
 | Cooling capacity, cooling coilFree cooling from geothermal wells | 17 W/m2 15 kW |
 | Heating capacity, heating coilHeating from geothermal heat pump | 20 W/m2 15 kW |
 | Lighting average load | 3 W/m2 |
 | PV-system module areaEfficiencyPeak load | 145 m2 21% 30 kW |
| System | Net Energy Demand (kWh/m2/year) | Coefficient of Performance (COP) | Delivered Energy (kWh/m2/year) |
|---|---|---|---|
| Space heating (by air) | 18.7 | 4.5 | 4.2 |
| Domestic hot water | 3.2 | 3.0 | 1.1 |
| Fans | 3.7 | - | 3.7 |
| Pumps | 1.0 | - | 1.0 |
| Lighting | 6.6 | - | 6.6 |
| Plug loads | 13.0 | - | 13.0 |
| Ventilation cooling | 1.8 | 15.0 | 0.1 |
| Total | 48.1 | - | 29.6 |
| PV Production | - | - | −37.0 |
| Net Delivered Energy | - | - | −7.4 |
| Category | Minimum Operative Temperature for Heating (°C) | Vertical Air Temperature Difference [Seated] (K) | CO2 Concentrations above Outdoors (ppm) |
|---|---|---|---|
| I | 21 | 2 | 550 |
| II | 20 | 3 | 800 |
| III | 19 | 4 | 1350 |
| 1V | 18 | - | 1350 |
Publisher’s Note: MDPI stays neutral with regard to jurisdictional claims in published maps and institutional affiliations. |
© 2021 by the authors. Licensee MDPI, Basel, Switzerland. This article is an open access article distributed under the terms and conditions of the Creative Commons Attribution (CC BY) license (http://creativecommons.org/licenses/by/4.0/).
Share and Cite
Javed, S.; Ørnes, I.R.; Dokka, T.H.; Myrup, M.; Holøs, S.B. Evaluating the Use of Displacement Ventilation for Providing Space Heating in Unoccupied Periods Using Laboratory Experiments, Field Tests and Numerical Simulations. Energies 2021, 14, 952. https://0-doi-org.brum.beds.ac.uk/10.3390/en14040952
Javed S, Ørnes IR, Dokka TH, Myrup M, Holøs SB. Evaluating the Use of Displacement Ventilation for Providing Space Heating in Unoccupied Periods Using Laboratory Experiments, Field Tests and Numerical Simulations. Energies. 2021; 14(4):952. https://0-doi-org.brum.beds.ac.uk/10.3390/en14040952
Chicago/Turabian StyleJaved, Saqib, Ivar Rognhaug Ørnes, Tor Helge Dokka, Maria Myrup, and Sverre Bjørn Holøs. 2021. "Evaluating the Use of Displacement Ventilation for Providing Space Heating in Unoccupied Periods Using Laboratory Experiments, Field Tests and Numerical Simulations" Energies 14, no. 4: 952. https://0-doi-org.brum.beds.ac.uk/10.3390/en14040952