Article

Techno-Economic Analysis of Biodiesel Production from Microbial Oil Using Cardoon Stalks as Carbon Source

1
Department of Economics Engineering Society and Business Organization (DEIM), University of Tuscia, Largo dell’Università s.n.c., Loc. Riello, 01100 Viterbo, Italy
2
Department of Industrial Engineering, University of Salerno, 84084 Fisciano, Italy
3
Department of Agricultural, Food and Environmental Sciences, University of Perugia, Borgo XX Giugno 74, 06121 Perugia, Italy
*
Author to whom correspondence should be addressed.
Submission received: 4 February 2021 / Revised: 26 February 2021 / Accepted: 5 March 2021 / Published: 8 March 2021

Abstract

:
Today one of the most interesting ways to produce biodiesel is based on the use of oleaginous microorganisms, which can accumulate microbial oil with a composition similar to vegetable oils. In this paper, we present a thermo-chemical numerical model of the yeast biodiesel production process, considering cardoon stalks as raw material. The simulation is performed subdividing the process into the following sections: steam explosion pre-treatment, enzymatic hydrolysis, lipid production, lipid extraction, and alkali-catalyzed transesterification. Numerical results show that 406.4 t of biodiesel can be produced starting from 10,000 t of lignocellulosic biomass. An economic analysis indicates a biodiesel production cost of 12.8 USD/kg, thus suggesting the need to increase the capacity plant and the lipid yield to make the project economically attractive. In this regard, a sensitivity analysis is also performed considering an ideal lipid yield of 22% and 100,000 t of lignocellulosic biomass. The biodiesel production costs related to these new scenarios are 7.88 and 5.91 USD/kg, respectively. The large capacity plant combined with a great lipid yield in the fermentation stage shows a biodiesel production cost of 3.63 USD/kg making the product competitive on the current market of biofuels by microbial oil.

Graphical Abstract

1. Introduction

The production of biodiesel or oleochemical precursor starting from varied vegetable oils, such as rapeseed, soybean, palm, peanut, sunflower, and waste cooking oils, is a promising alternative to fossil-based fuels. However, it increasingly requires attention in economic and environmental terms [1,2,3]. Due to the growing demand for biofuel production, it has become evident that other renewable resources (especially non-vegetable oils) should be imminently considered so that there is not competition with food production [4].
Biodiesel production using microbial oil, involving very different raw materials and representing a sustainable and energetically favorable process, has significantly involved recent research activities [5,6,7,8,9]. Microbial oil, also known as single cell oil (SCOs), is accumulated by oleaginous microorganisms during a fermentation process and using a variety of carbon substrates, including glucose, xylose, acetic acid, glycerol, and ethanol [10]. In particular, oleaginous yeasts show promising characteristics as for example their rapid growth rate and high lipid contents (up to 60% of their cell dry weight) when subjected to specific operating conditions [11,12,13]. Moreover, they have obvious advantages if compared to conventional vegetable oils thanks to their short life cycle and very low farm land use [14].
The accumulated microbial oil is primarily made of triacylglycerols (TAG) with fatty acid composition rich in C16 (e.g., palmitic and palmitoleic acids) and C18 (e.g., stearic, oleic, linoleic, and a-linoleic acids) [15,16], similarly to vegetables oils, and can be considered a good candidate to be used as a precursors of biodiesel [17]. The chemical process for biodiesel production, commonly known as transesterification, involves a reaction in which the glycerol group of triacylglycerol is replaced with a short-chain alcohol. Several methods are proposed in literature for this transesterification reaction [3,18,19,20,21].
In addition to vegetable oils, the attention of the research community is also focused on alternative and definitely cheaper carbon sources for microbial oil accumulation by oleaginous yeasts, such as agro-industrial wastes and non-food crops [22]. Different pre-treatments are effective on the lignocellulosic biomasses to make more accessible carbohydrates, thus facilitating the yeast growth and lipid accumulation [23]. However, this preliminary chemical transformation of the feedstock introduces degradation products that may influence the correct yeast growth and metabolism [24]. Based on these considerations, recent authors have reported the necessary operating conditions to optimize the lipids production process, evaluated for different kinds of lignocellulosic biomass [25]. In this context, Cardoon (Cynara cardunculus), a wild robust perennial plant native to the Mediterranean region [26], represents a very interesting medium to the oil production starting from its marginal residues [27]. Cardoon is not cultivated as a food crop [28] but shows high growth rates (i.e., 10–12 t/ha from Italians cultivations) [29,30] together with low water and nutrients consumption. Therefore, it can be successfully associated with lignocellulosic biorefinery approach [31]. Unlike common agricultural crops, cardoon can grow in hostile soils and therefore severely limit the occupation of land dedicated to the cultivation of food products.
The biorefinery performance has been widely studied in the literature [32,33] through productivity analyses, energy balances, and techno-economic evaluations for different process configurations, often employing Aspen Plus Software [34,35,36]. However, to the best of authors’ knowledge, the entire production process of microbial biodiesel has not been studied so far. The development of appropriate and meticulous simulations, as reported by Garcia et al. [37], allows defining the economic feasibility and establishing the best operating conditions for a biorefinery process. Barletta et al. [38] simulated the flowsheet resulting from the economic optimization procedure of the lignocellulosic biorefinery superstructure. Meramo et al. [39] proposed a conceptual design of a biorefinery system from corn residues with the aim of reducing the accumulation of solid waste and producing bioethanol and succinic acid. To correctly model a microbial oil production as a renewable resource for biodiesel, it is necessary to know data and information related to kinetics and thermodynamics of the reactions in each step of the designed process [40,41]. From this perspective, several studies carried out in the literature adopted different assumptions for making the preliminary design of industrial plant. Koutinas et al. [42] calculated material balances by assuming two diverse stages during lipid fermentation based on stoichiometric equations in which the stoichiometric coefficients derived from experimental results [43]. Humbird et al. [44], in their report for biochemical conversion of lignocellulosic biomass to ethanol, available from the National Renewable Energy Laboratory (NREL), modeled the process using bioreactors with conversions of specific reactions determined on lab scale. The components and the physical properties of some of the solid constituents of lignocellulosic biomass and the fermentation process were taken from the NREL database for biofuels components [45].
Some researchers have explored the techno-economic feasibility of biodiesel production from microbial oil produced by microorganisms through the fermentation of glucose-based media [42,46,47].
In this paper, we develop a model of the entire microbial oil production process. The present research is the first attempt to develop a realistic simulation and to evaluate the design and techno-economic viability on industrial scale of the microbial oil production process as a renewable resource for biodiesel production starting from agro-industrial wastes such as cardoon stalks. The process is based on the use of Leucosporidium creatinivorum DBVPG 4794, a non-conventional yeast able to use both glucose and xylose as carbon substrates. Previous experimental results obtained by the authors for cardoon stalks composition, its cellulose enzymatic hydrolysis, and lipid fermentation were used, in order to obtain a more realistic analysis [22].
The remaining part of the paper is organized as follows: Section 2 reports the assumptions adopted to perform the design of the process, by focusing on the main phases, such as biomass pre-treatment, enzymatic hydrolysis, lipid production, lipid extraction, and biodiesel production. Section 3 provides the feasibility of the system in terms of mass and energy balances and economic analysis. Section 4 presents the concluding remarks.

2. Materials and Methods

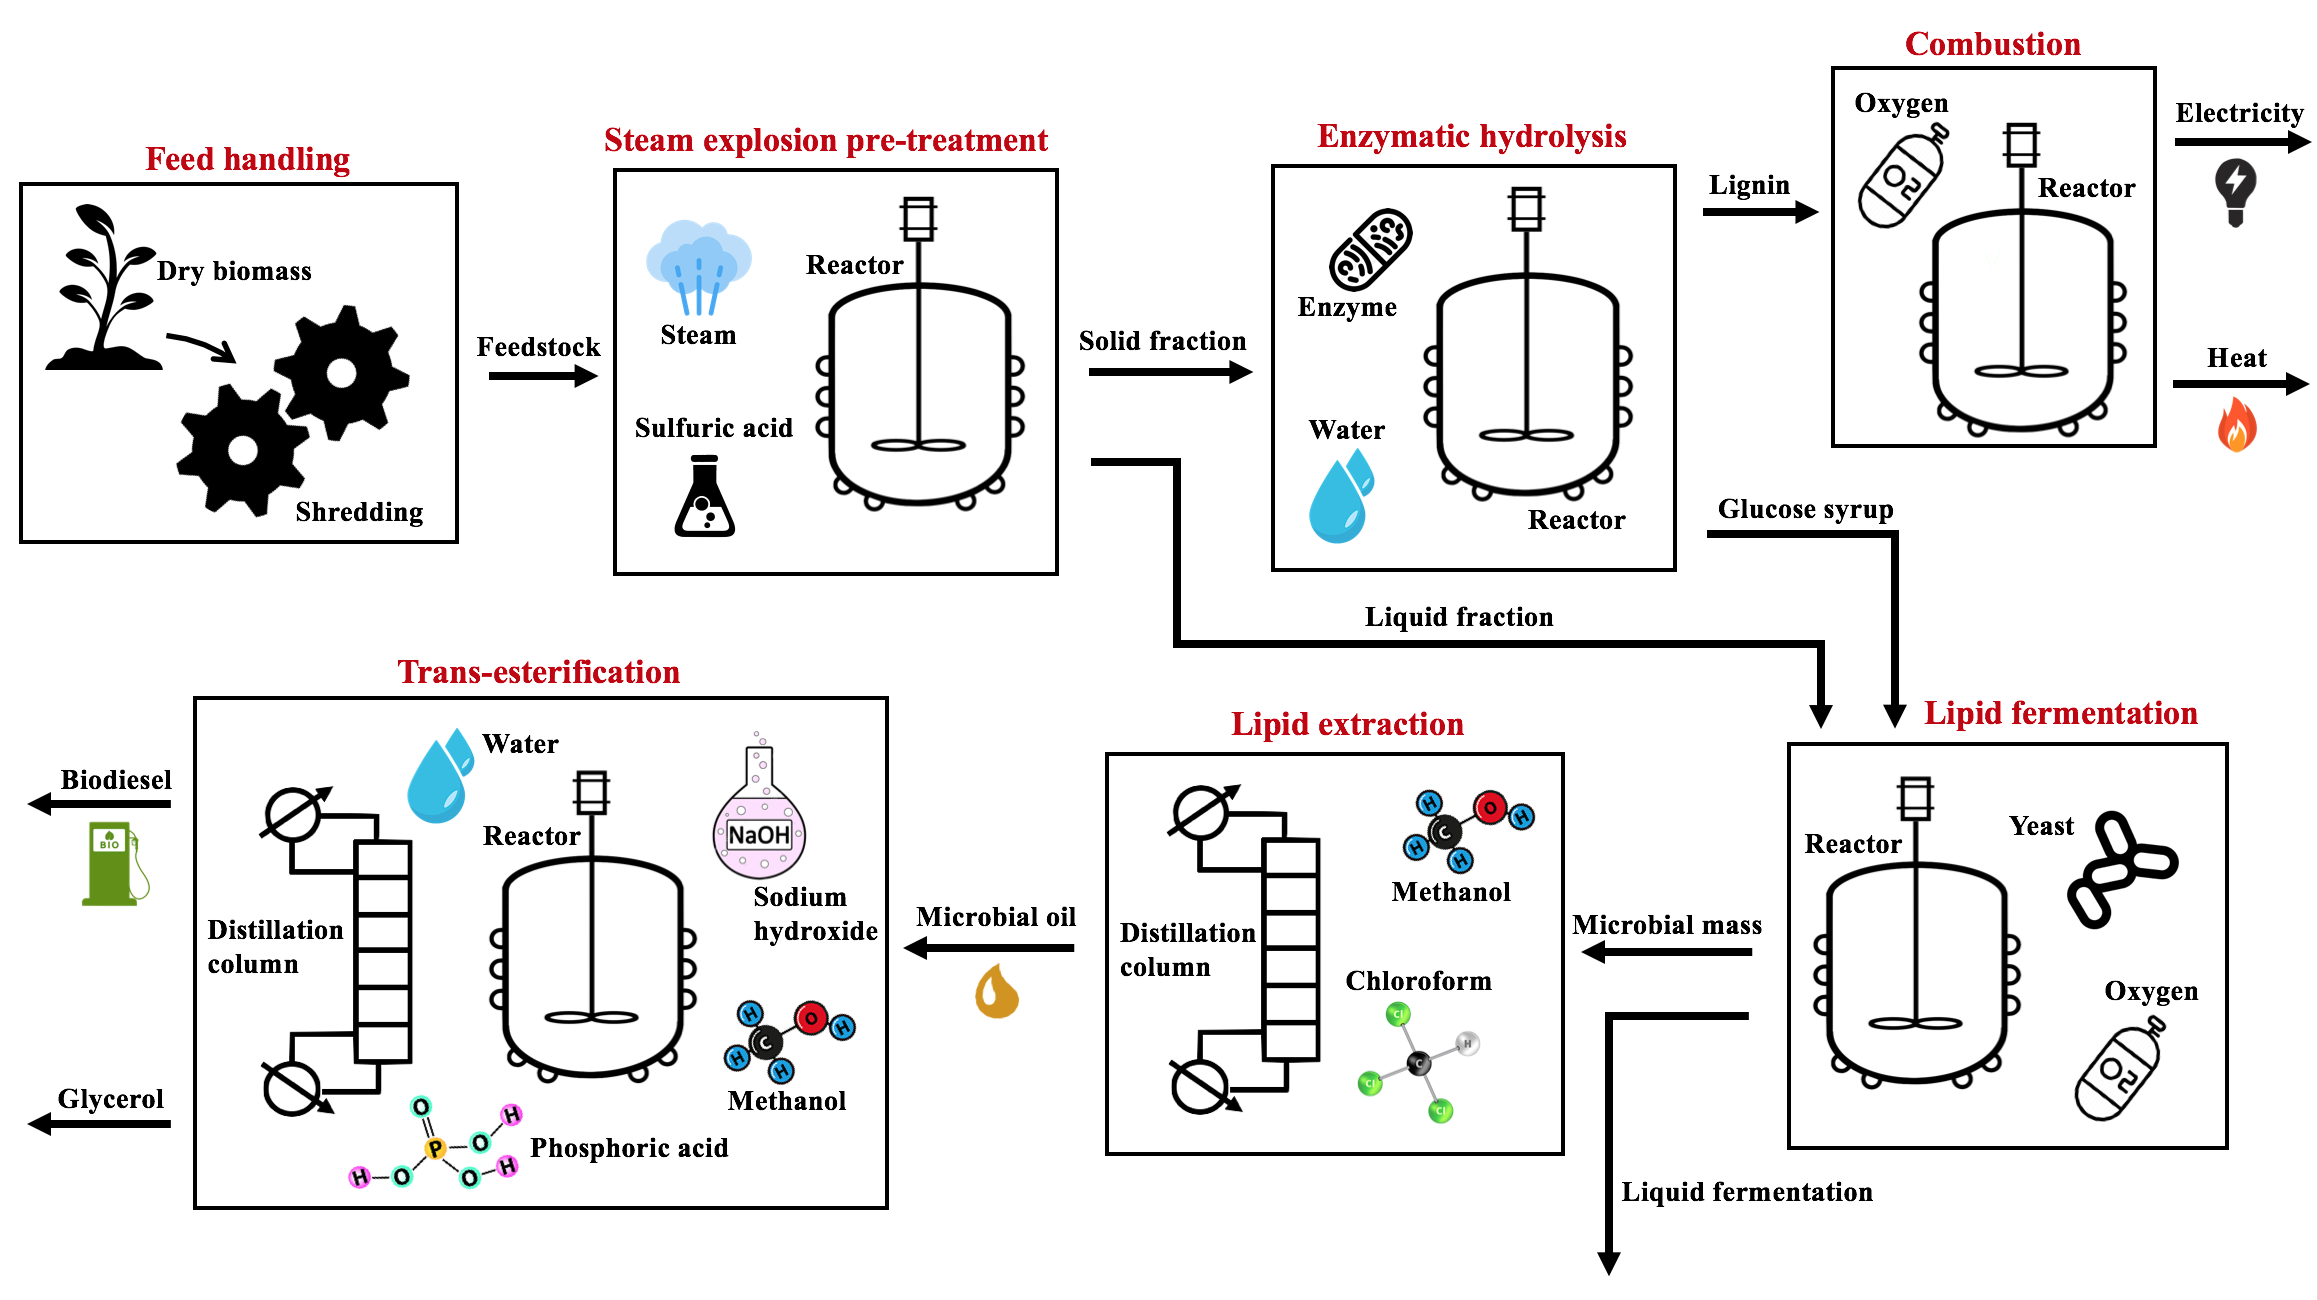
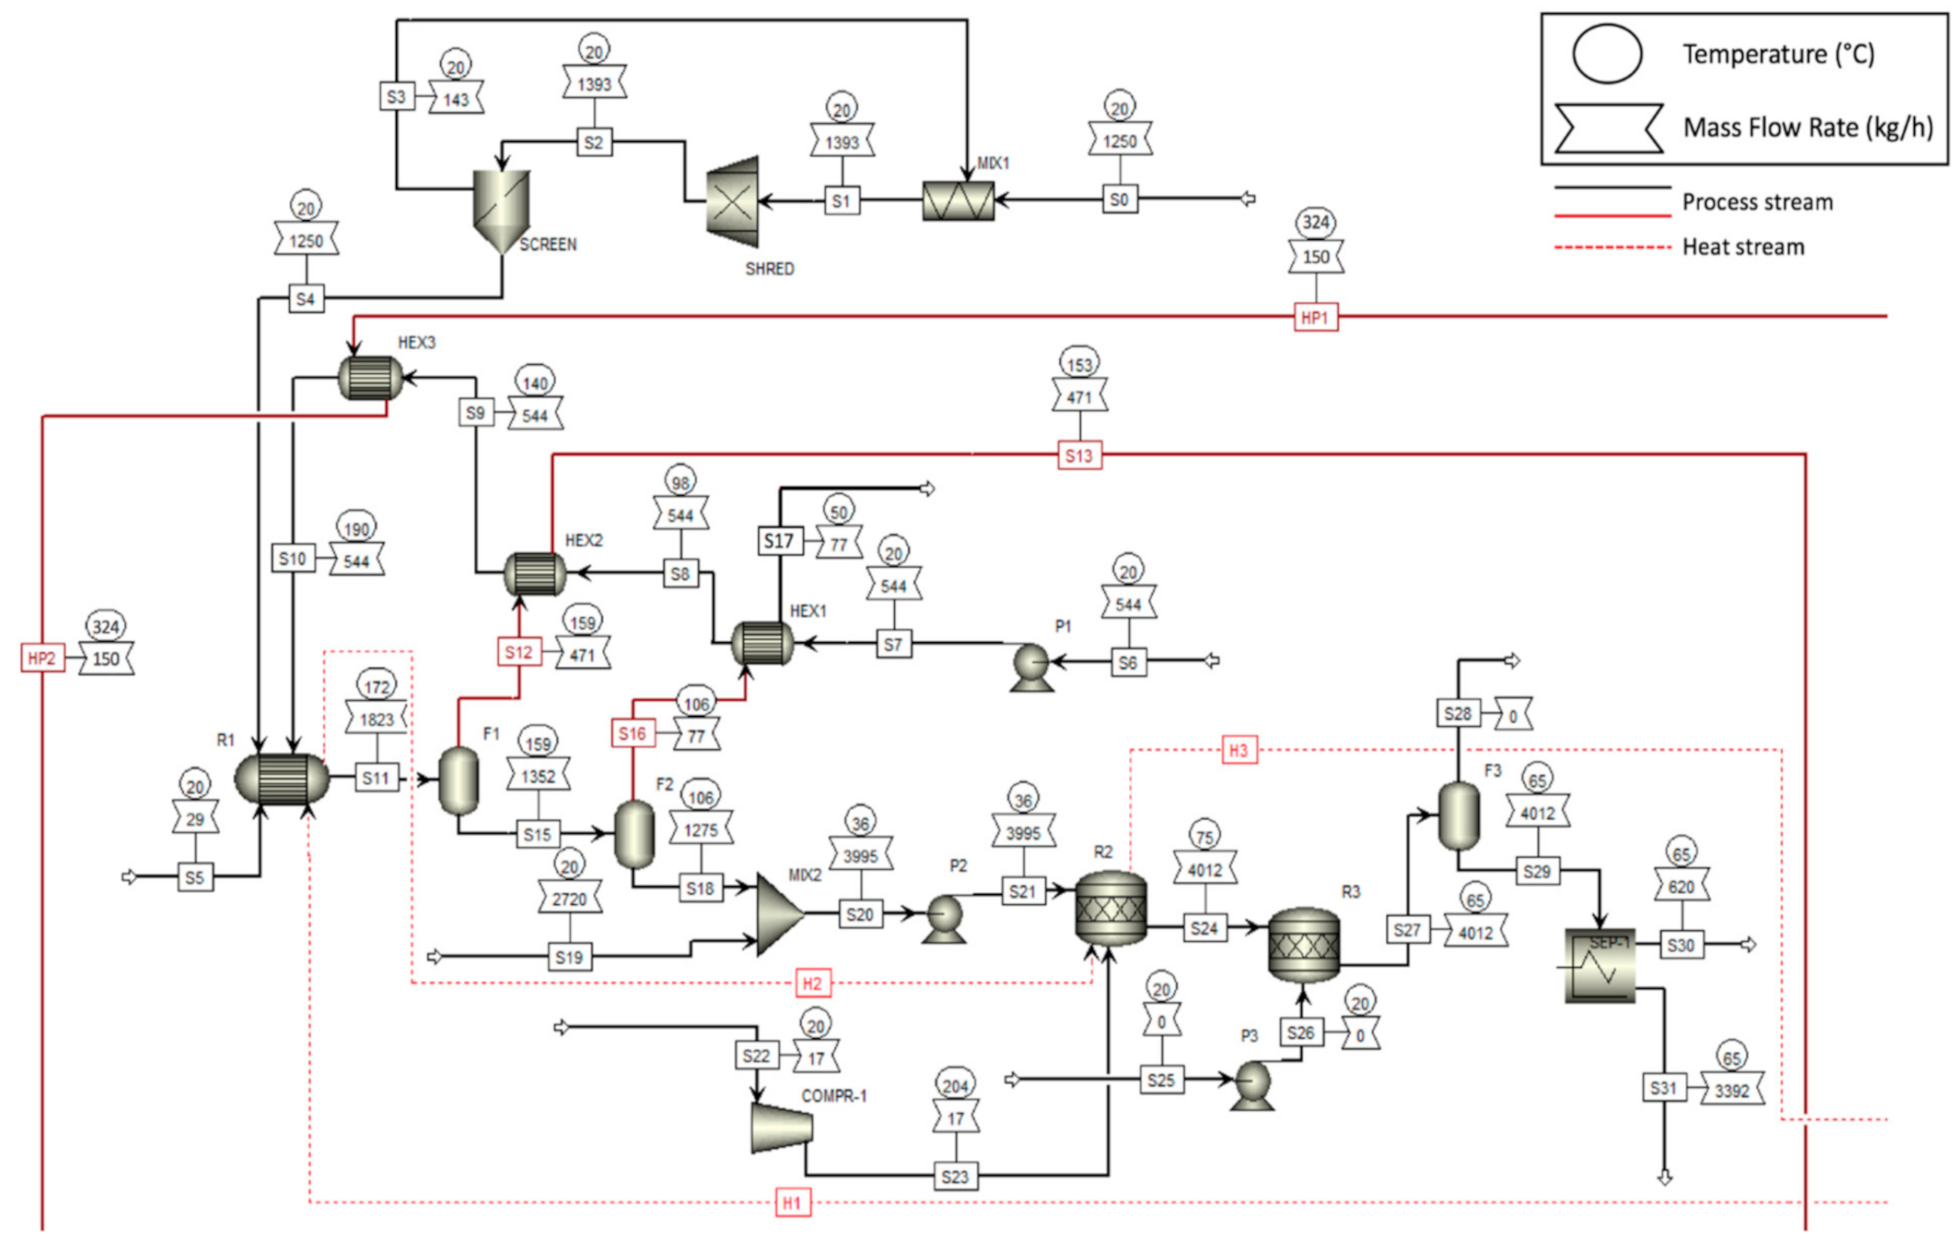
2.1. Process Simulation

The process simulation software, Aspen Plus [34] v10, is used to develop the entire biorefinery process for biodiesel production starting from a microbial oil and to calculate its mass and energy balances including the utility requirements. The simulation of a generic chemical process requires defining chemical components, selecting a thermodynamic model, modeling the process flowsheet, and setting up the operating conditions of all feed streams and unit operation models [48]. The NRTL (non-random two liquids) thermodynamic model is appropriately selected for extraction routes simulation on the basis of its good representativeness of polar mixtures in phase equilibrium calculations [3]. Moreover, it is used to calculate most of the binary interaction coefficients, taking the missing values from Humbird et al. [44]. UNIF-DMD (UNIFAC with Dortmund correction) method is instead used for the extraction of water and glycerol [49], and the Henry’s law is used to designate the non-condensable components (e.g., oxygen, nitrogen, and carbon dioxide) in the liquid phase. Conventional chemicals and unconventional compounds are defined using the Aspen Plus internal database and NREL component definitions [44] or literature data [42]. Each chemical transformation process is carried out in stoichiometric reactor blocks (RStoic) where mass balance calculations are associated with the extent of chemical reactions, but not with the kinetic behavior. Liquid–solid separation is performed via centrifuge filter blocks (CFuge) using the Stokes sedimentation model and the Shubert deliquoring model [48]. The Winn–Underwood–Gilliland method [50] (DSTWU module) is used to obtain initial estimates about the performance of distillation columns for the rigorous methods such as RadFrac module, the main block for simulating all types of multistage vapor–liquid fractionation operations in Aspen Plus. Column design is accompanied by the consideration of pressure drops between boiler and condenser correlated to the theoretical number of stages. Calculator blocks with Fortran language and design specifications are implemented to set the desired process parameters.
The simulation considers a plant capable of processing 10,000 t/year lignocellulosic biomass with 8000 operating hours per one year. The designed facility is based on lab-scale experimental results. Various organic streams of by-products are considered to produce steam and electricity to make the plant totally self-sufficient in energy. The combustor and turbogenerator subsystem are modeled with a simplified approach. Hot streams such as high-pressure steam and flash steam transfer a large part of their thermal content through counter-current heat exchangers simulated with a minimum temperature approach of 1 °C and a shortcut configuration.
The economic analysis, based on the 2017 U.S. dollars, is conducted to calculate discounted cash flow and to evaluate profitability for the modeled scenario employing Aspen Plus Economic Analyzer (Aspen PEA) v10 software [44,48]. The wastewater treatment area, although not developed in the current project, is appropriately taken into account in operating costs [42].
Cardoon stalks composition used for the simulation, shown in Table 1, was based on data determined experimentally for cardoon stalks produced in Italy [51]. The evaluation of extractives content was carried out by water/ethanol extraction. Due to lack of information, protein amount is inserted considering corn stover composition [44].
To correctly manage solids handling in Aspen Plus, it is necessary define a particle size distribution (PSD) expressed in terms of the mean particle size (35 mm) and standard deviation (5 mm).

2.1.1. Feed Handling and Steam Explosion Pre-Treatment

Figure 1 shows the Aspen Plus flowsheet of feed handling and steam-explosion pre-treatment in which each stream is accompanied by the corresponding temperature and mass flow rate values. The dashed red lines (H1, H2, and H3) represent the path of the heat flow extracted from the combustion reactor (R5) as thermal content of the gas.
Feedstock (S0) is milled using a mechanical size reduction process such as a hammer mill [52]. This operation, simulated in Aspen Plus using a crusher block (SHRED) and selecting a screen size of 3.2 mm, aims to increase the exposed surface area and so to improve the mass and energy transfer rates [53]. Milled feedstock is conveyed in a hydrothermal pre-treatment reactor (R1) and treated with a sulfuric acid (S5) loading of 0.025 g/g dry biomass to convert much of the starting hemicellulose carbohydrates to soluble sugars by hydrolysis reactions and to break down the biomass for subsequent enzymatic hydrolysis. The steam flow (S10), originating from 0.512 g of process water/g dry biomass, is introduced into the pre-treatment reactor (R1) with high temperature (190 °C) and pressure (22 atm). The reactor, operating at 172 °C and 7 atm, is simulated using a stoichiometric reactor block where the reaction yields are determined experimentally considering a residence time of 10 min and assuming that minor hemicellulose carbohydrates have the same reactions and conversions as xylan. Specifically, the reaction yields adopted generate a recovery of cellulose and hemicellulose in the hydrolysate slurry equal to 95.4% and 56.8%, respectively. Reactions and their corresponding yields considered are given in Table 2.
The hydrolysate slurry (S11) is flash-cooled through two adiabatic flash blocks (F1 and F2) at 5 and 1 atm, respectively, vaporizing a large amount of water along with some of acetic acid and of sugar degradation products such as furfural and 5-hydroxymthyl furfural. These flash vapors generated (S12 and S16) are used to partially heat the process water (S6) for hydrothermal pre-treatment [53]; the remaining thermal demand is satisfied with high-pressure steam (HP1) produced in a dedicated section of the plant.
A feed ratio of 4.8 g of ammonia gas (S22) per liter of hydrolysate, mixed into dilution water (S19), is used to raise pH from 1 to 5 in a conditioning reactor (R2) simulated as a stoichiometric reactor block with moderate temperature (75 °C) and a pressure of 5 atm [44]. A further stoichiometric reactor block (R3), operating at 65 °C and 5 atm, removes ammonia gas not converted by means of sulfuric acid (S25). Reactions and their corresponding yields considered are given in Table 3. The pressure drop after the conditioning process is modeled in a flash unit (F3) block.
At this point the liquid (S31) and solid fractions (S30) rich in depolymerized xylan and in lignocellulosic components, respectively, are then separated by a centrifuge filter (FILT-1).

2.1.2. Enzymatic Hydrolysis

Figure 2 shows the Aspen Plus flowsheet of enzymatic hydrolysis and combustion section. The dashed blue lines indicate the power flow generated by the multistage (T1 and T2) steam turbine.
The solid fraction (S30) is sent to the enzymatic hydrolysis reactor (R4), simulated with a stoichiometric block, where cellulose and hemicellulose are finally converted to hydrolyzed sugars using commercial enzyme (Cellic Ctec2, Novozymes, Denmark) and respecting precise working conditions (50 °C and 1 atm) [52]. The amount of enzyme used (S20) is determined based on dry biomass content (mostly cellulose and hemicellulose). In the present design, the total enzyme loading is 1.32 g/g dry biomass to achieve a 73.9% and 74.8% conversion to glucose and xylose, respectively. It is assumed that the minor hemicellulosic sugars are converted into their corresponding hydrolysate sugars with the same yield and reaction as xylan. Reactions and their corresponding yields considered for enzymatic hydrolysis are given in Table 4.
According to Humbird et al. [44], a temperature of 50 °C and an atmospheric pressure are maintained throughout the process to increase the enzyme activity. A process water steam (S32) is used to adjust the moisture content of the medium (S30) to 85% while potassium hydroxide (S20) and sulfuric acid (S20) are used to maintain the medium at pH 5. Once the conversion of major cardoon components to soluble sugars is complete, the slurry is filtered with a centrifuge filter (FILT-2) to separate the solid fraction (S36), rich in cellulose, and the lignin from the liquid fraction (S37), rich in hydrolysate sugars.
By-products such as all the lignin and the unconverted cellulose and hemicellulose from the feedstock (S36) are used for energy self-sufficiency of the plant and to reduce costs related to solid waste disposal. A combustion process able to manage a wet feed with moisture of 5% and considering an excess air equal to 10% is modeled with a stoichiometric reactor (R5). The air stream (S38) is moved into the combustion chamber (R5) by a fan (FAN1) after being pre-heated up 170 °C in a heat exchanger (HEX4). The thermal energy content of the gas (heat of combustion, H1) is removed [54] and used to thermally feed the reactors and the boiler. Flue gas (S41) at 900 °C is used to convert a treated feed water (S44) of 500 kg/h to high pressure stream (460 °C and 60 atm) through a heat exchanger (HEX5) and to pre-heat the air stream (S39) with their residual energy content. The flue gas is anyway expelled in the atmosphere at high temperature (above 160 °C, S43) to avoid corrosion phenomena due to the presence of potentially aggressive chemical compounds (e.g., sulphur dioxide). The generated high-pressure steam (S46) constitutes the working fluid of a multistage steam turbine (T1 and T2) operating at 65% isentropic efficiency; 30% of the total steam (HP1) is extracted from the turbine at a particular thermodynamic condition (324 °C and 20 atm) in order to be used in the biorefinery process, while the remaining part (S48) is expanded up to 0.1 atm in the second stage of the turbine to generate electricity (W2). The outlet stream (S49) is then condensed (COND) before being recycled.
The glucose-rich syrup (S37) is cooled to fermentation temperature and inoculated with the oleaginous yeast.

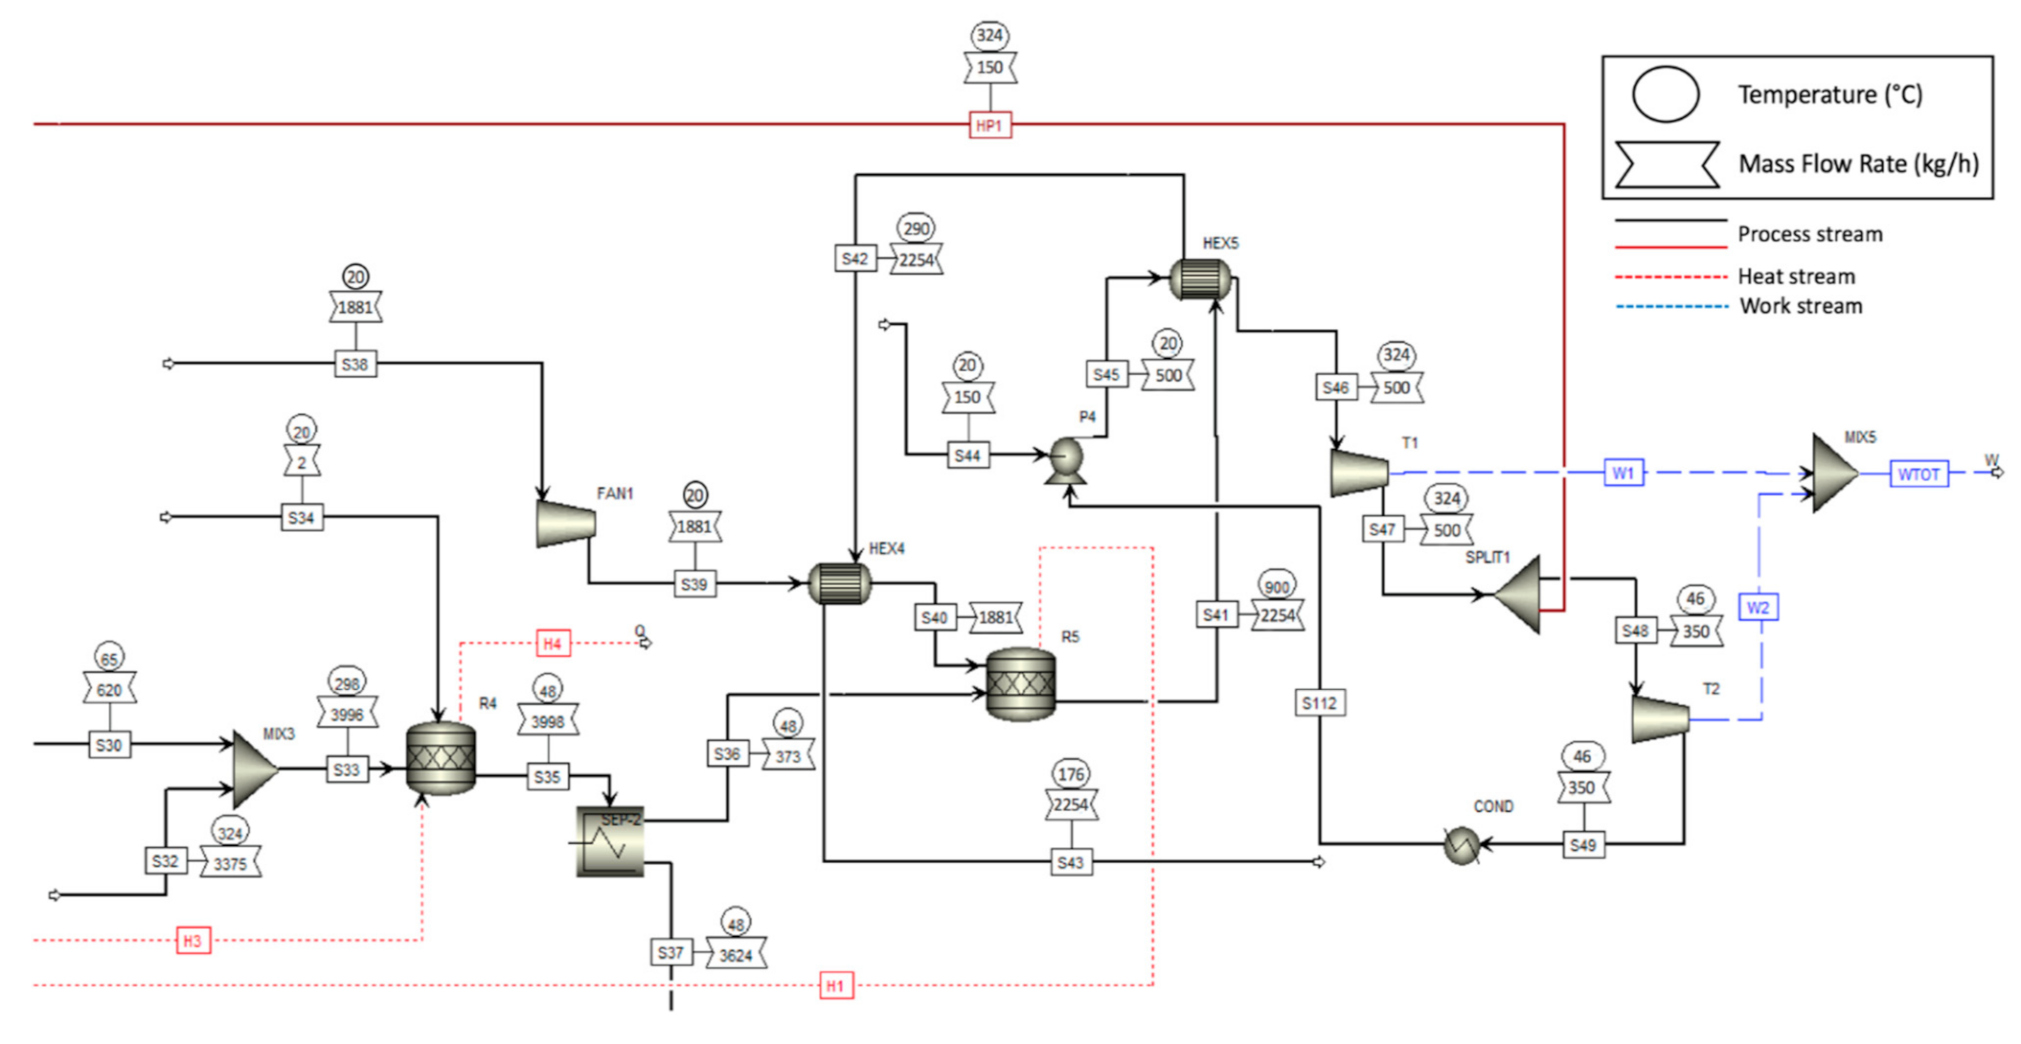
2.1.3. Lipid Production

The simulation of the microbial oil production process is one of the most complex and delicate steps due to the lack of chemical reactions in the literature that universally describe the phenomenon. As reported by Koutinas et al. [42], two different stages (microbial growth and intracellular oil accumulation) during the fermentation process are considered to calculate mass balances with a good approximation [52]. Each stage is represented by a chemical reaction where the stoichiometric coefficients are calculated based on experimental results obtained by Li et al. [43] using glucose as carbon source and the oleaginous yeast Rhodosporidium toruloides Y4. Evans and Ratledge [55] studied the yeast Candida curvata D, showing the possible and simultaneous use of glucose and xylose as carbon substrates in process fermentation. In order to use both glucose and xylose for microbial biomass production and subsequent lipid accumulation, cells of L. creatinivorum DBVPG 4794 are considered. The molecular equation for yeast (C4H6.5O1.9N0.7), necessary for the chemical reaction of the growth phase, is taken from Babel and Muller [56]. The nitrogen sources used during fermentation, such as peptone and yeast extract, are represented by amino acids (C5.35H9.85O2.45N1.5), whose components are described by an average molecular equation [42,56]. Unlike Koutinas et al. [42], we consider the lipid fraction of the yeast biomass (approximately 10% w/w) indispensable for microbial growth, assuming that the triolein is the only triglyceride produced throughout fermentation process. The overall microbial biomass yield and lipid yield are 0.150 g/g sugars and 0.135 g/g sugars, respectively [52]. Experimental studies stress how all the carbon substrate is consumed during the fermentation process [43]. Reactions and their corresponding yields considered for microbial growth and microbial oil accumulation are given in Table 5.
Figure 3 shows the Aspen Plus flowsheet of lipid production (microbial growth and intracellular oil accumulation).
The air stream (S52) is moved into the reactor by a fan (FAN2) and supplies the oxygen necessary to perform the microbial growth and the lipid accumulation reactions. The fermentation broth (S54) is initially subjected to a stage flash (F4) at atmospheric pressure to remove all traces of gas such as carbon dioxide and is heated (HEX6) to 60 °C to deactivate the enzymes in yeast cells. The necessary thermal energy is taken from the residual heat of the flash vapors (S13) generated during the steam-explosion pre-treatment. At this point, the microbial biomass (S59) containing the lipids is separated from fermentation liquid (S60) via a centrifuge filter (SEP-3). The moisture content of yeast cells (S65) is reduced to 2% using a convective dryer (DRYER) with the aim of increasing the biodiesel production efficiency during transesterification [42].

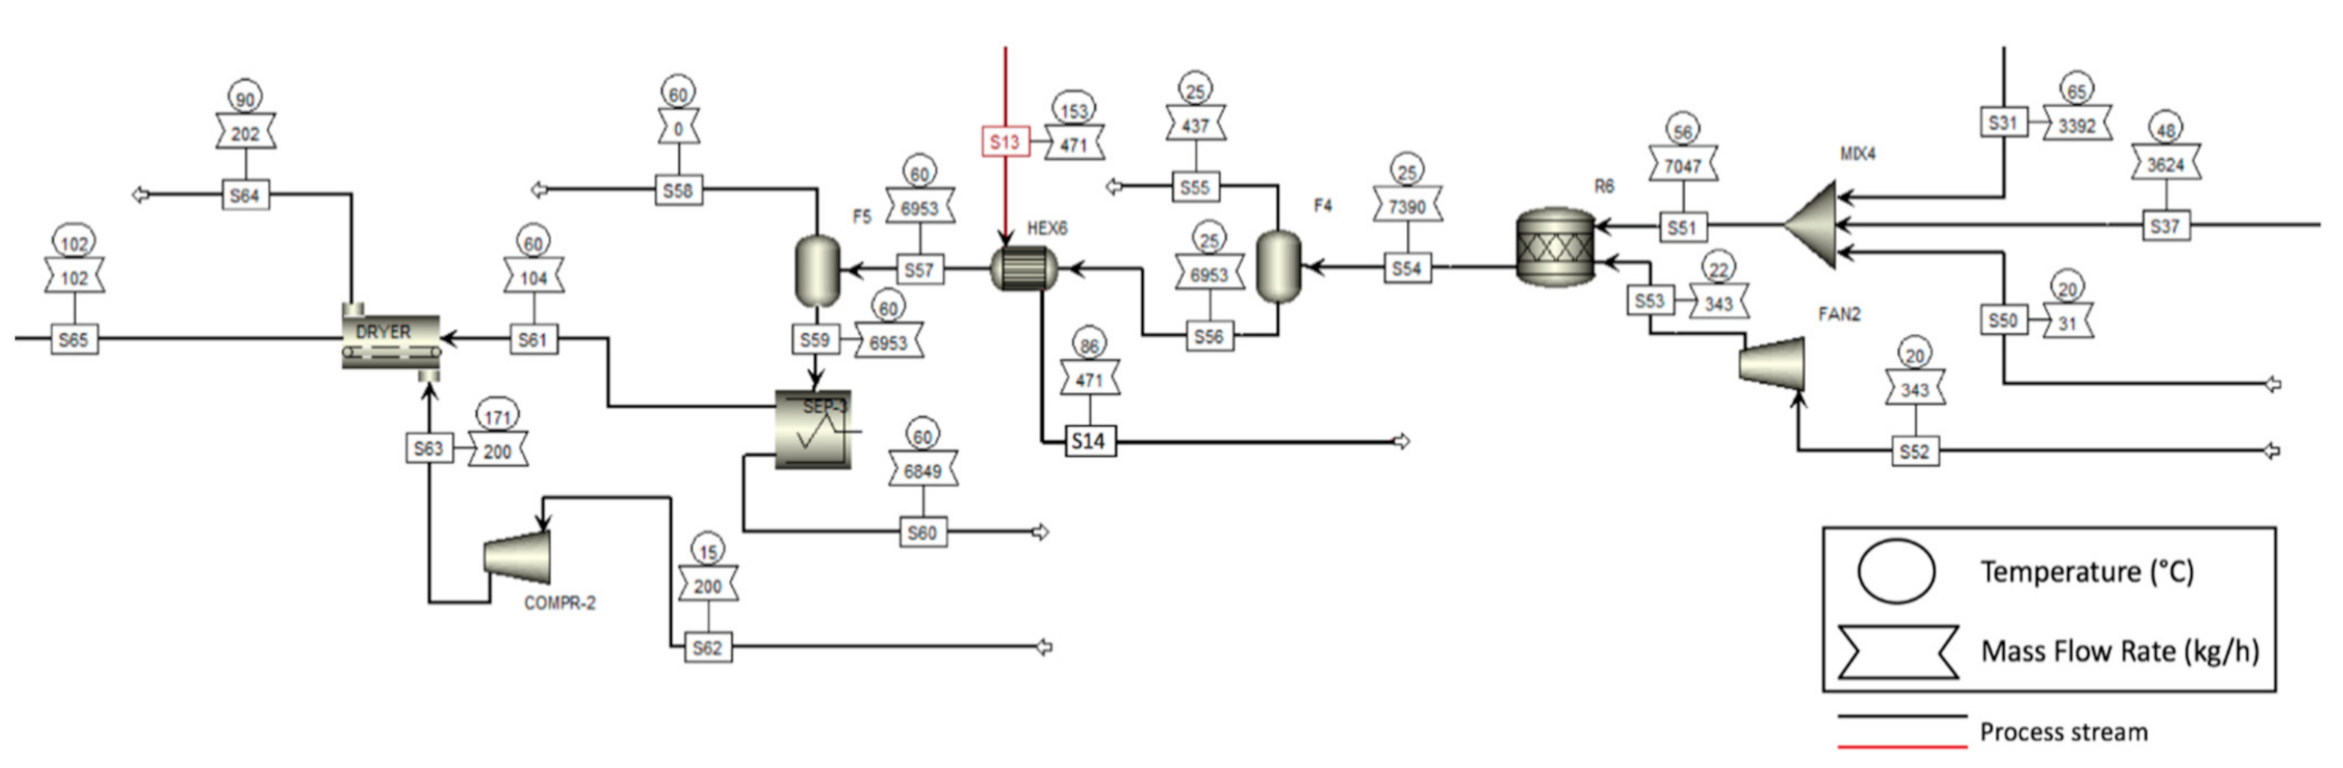
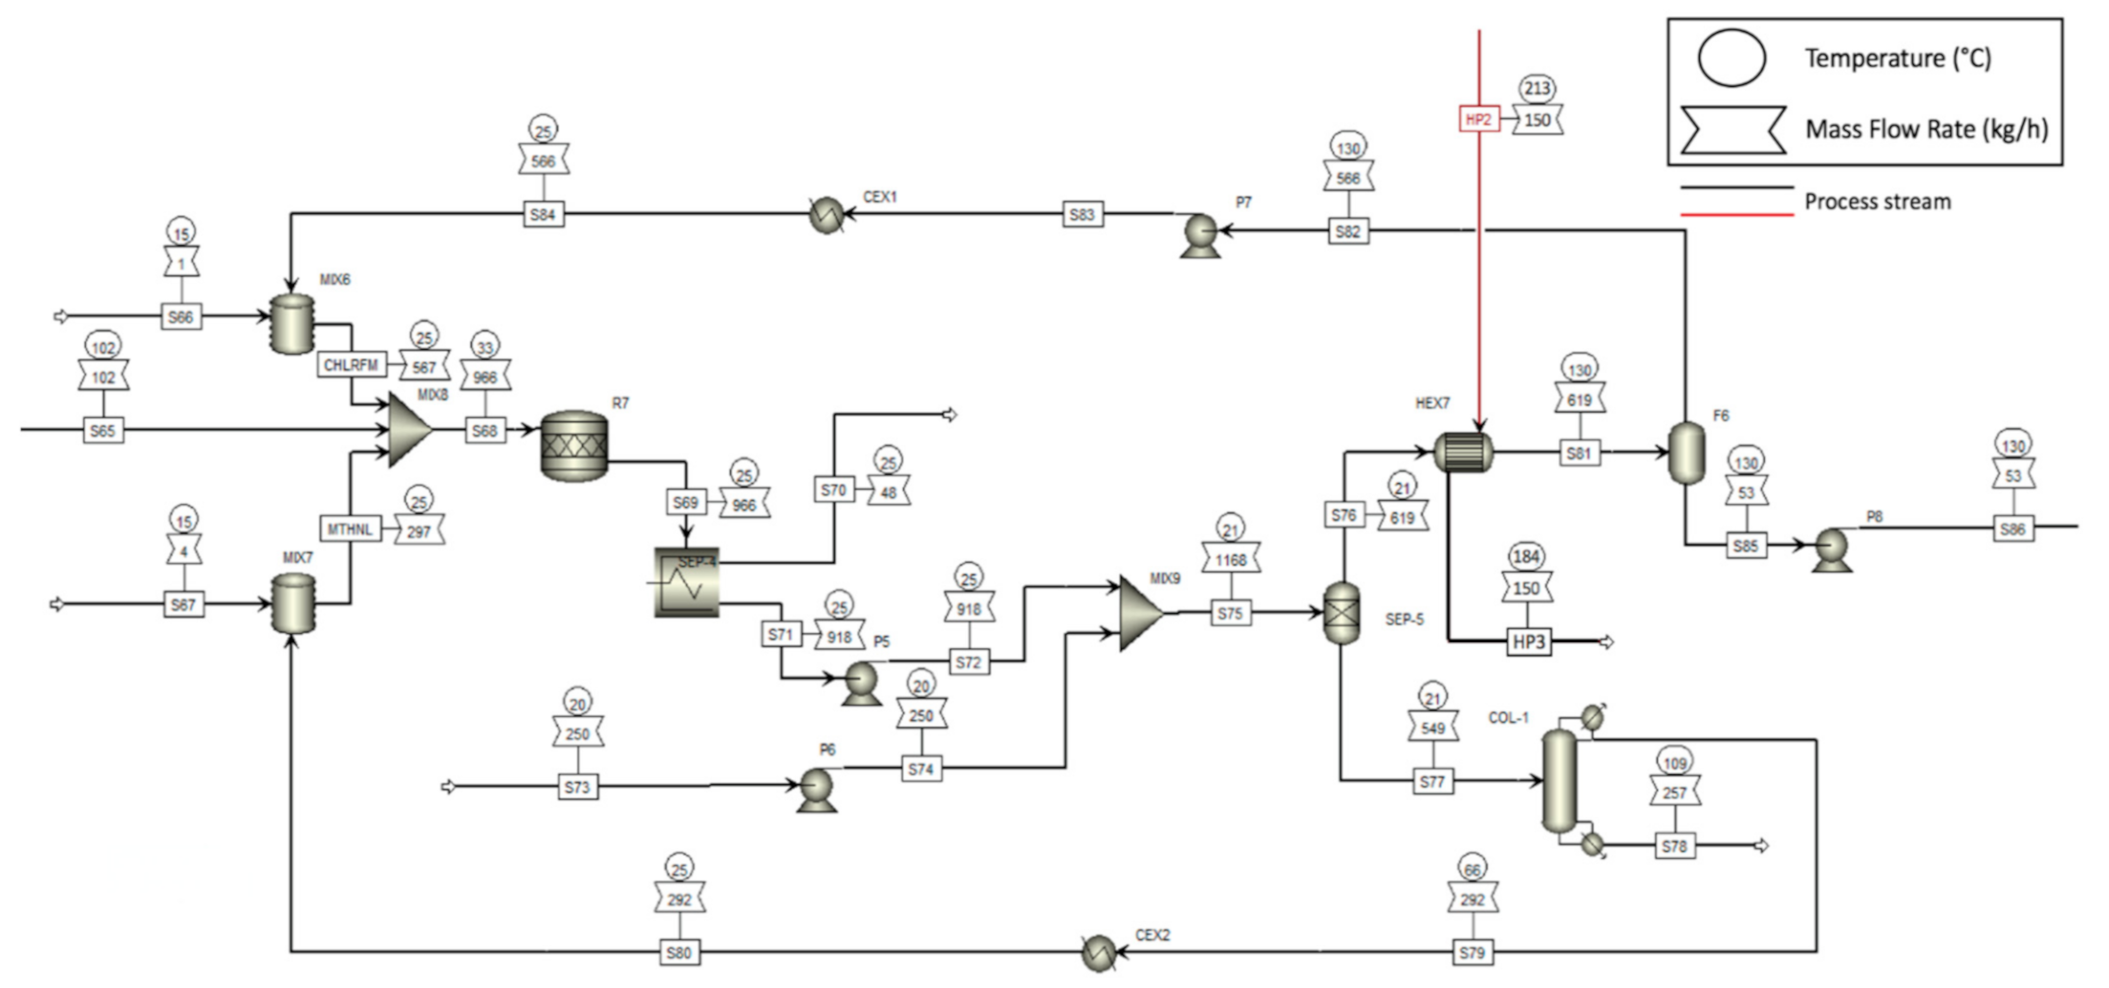
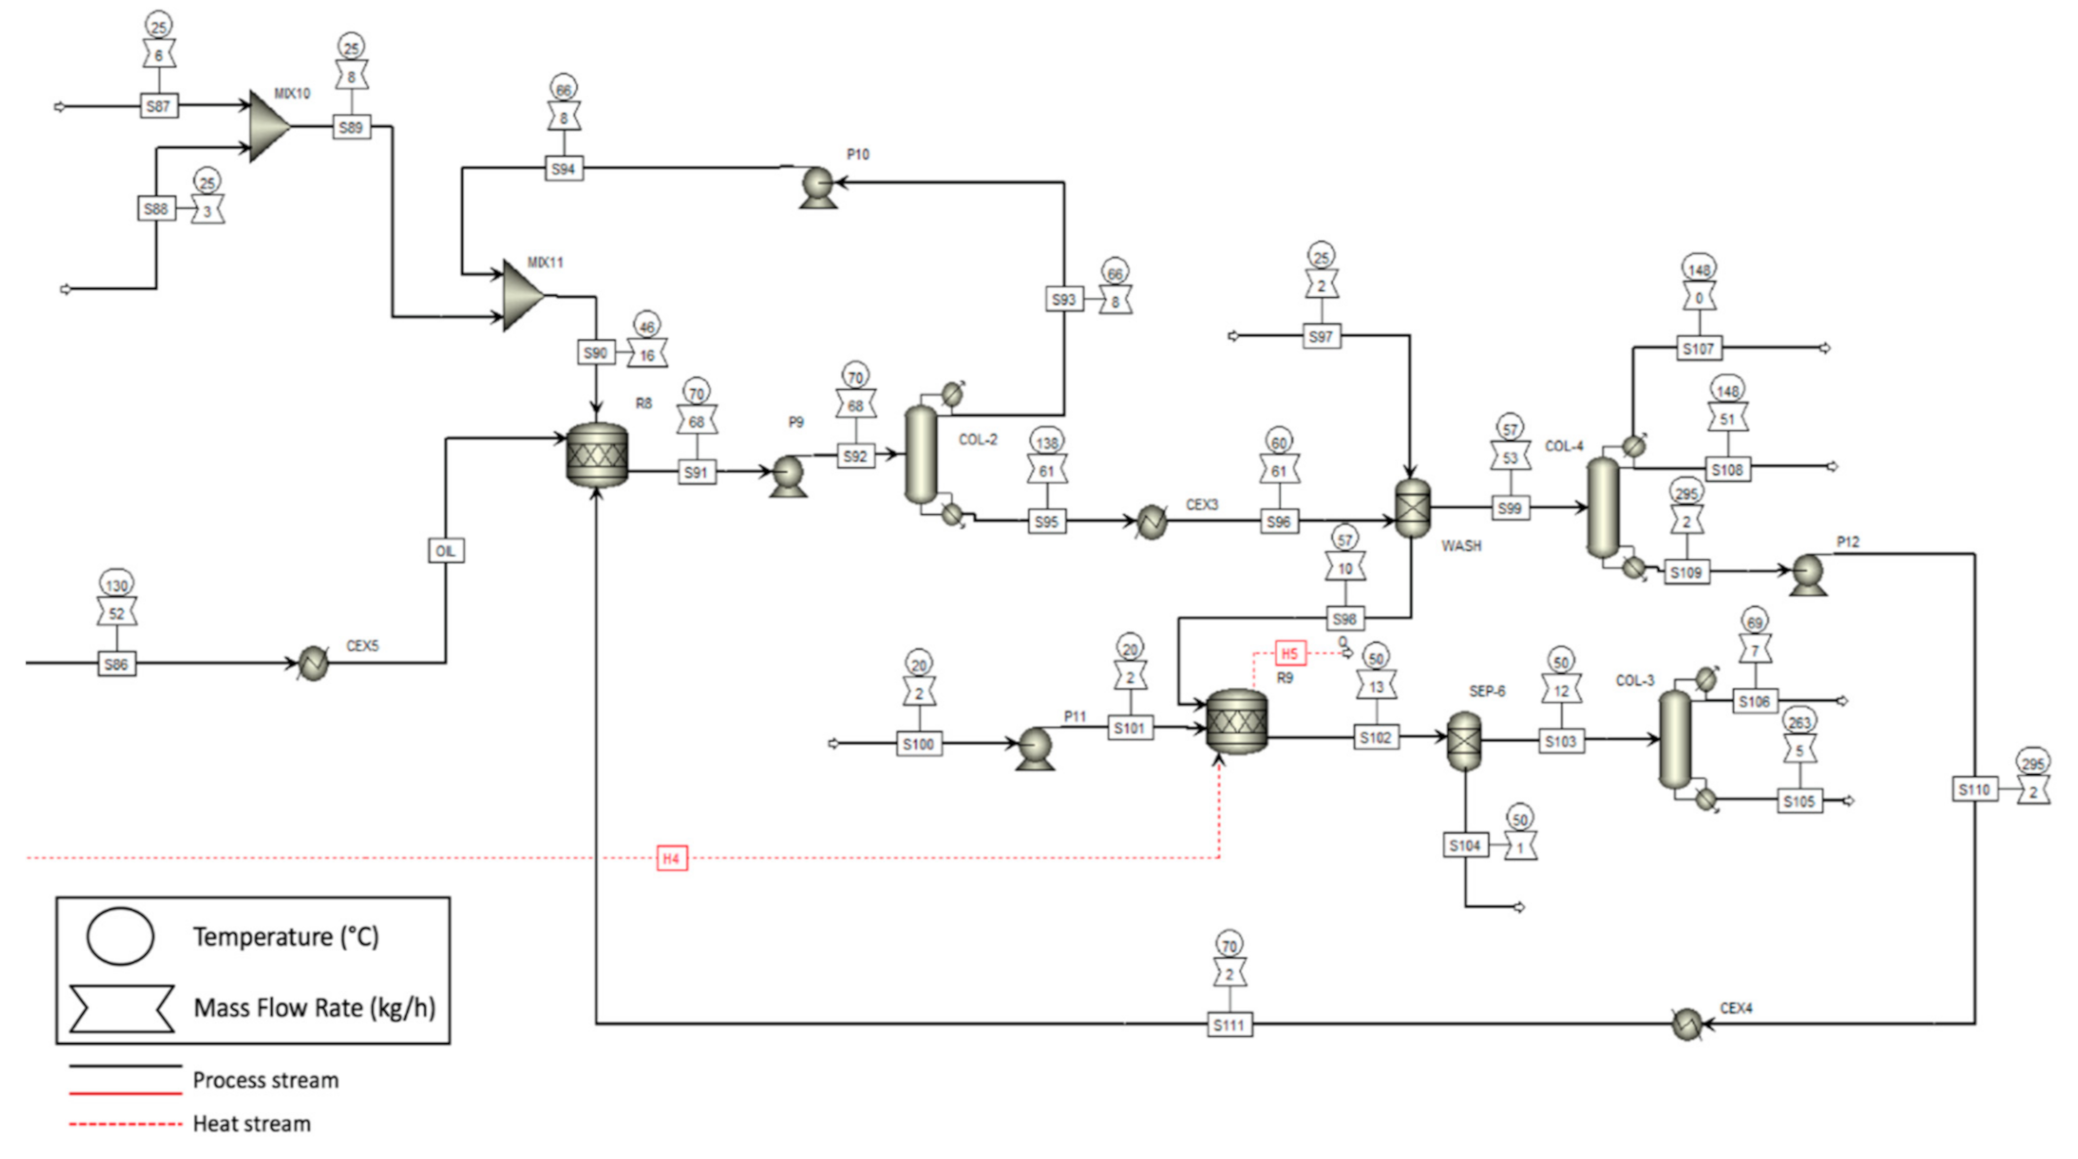
2.1.4. Lipid Extraction

Recent studies are focusing on microbial oil extraction methods, because the efficiency of biodiesel production process from microbial biomass is strongly connected to the oil extraction efficiency [57]. Here, we consider a solvent based lipid extraction method, which uses a methanol–chloroform mixture and has been successfully tested in several research activities [58,59]. Although this extraction method uses toxic and highly volatile solvents, it offers a high efficiency of extraction, and it requires lower energy inputs than mechanical techniques. Figure 4 shows the Aspen Plus flowsheet of the lipid fermentation, including the microbial growth and the microbial oil accumulation.
Methanol (S67), chloroform (S66), and dry microbial biomass (S65) are mixed (MIX8) under environmental conditions in a mass ratio of 6:12:1 [58]. Lipid extraction phase is simulated in a stoichiometric reactor (R7), assuming that all the lipids contained in the microbial biomass are transformed in oil. The solid fraction (S70), mainly characterized by the yeast residual biomass and separated from the homogeneous mixture (S71) rich in solvents and oil via a centrifuge filter (SEP-4), could be recovered and sent to an anaerobic digestion plant to for biogas production [52]. However, this aspect is not considered due to an insignificant revenue. Liquid stream is mixed with process water (S73) in 4:1 ratio for hydrophilic/hydrophobic phases separation via a decanter (SEP-5). The large difference in the boiling points between oil and chloroform greatly facilitates their separation process, which is achieved with a single flash unit (F6) operating at 130 °C and 0.5 atm. A sensibility analysis, where temperature variation was related to oil purity, is used to identify the best thermodynamic condition (minimum thermal load) considering a pressure of 0.5 atm. Water–methanol separation requires a multi-stage distillation column (COL-1) simulated in the current flowsheet using a RadFrac block with a total condenser and a kettle reboiler. Twelve stages and a reflux ratio equal to 1 are imposed to produce a distillate with a mole purity of 98.5%. A pressure drop of 0.4 atm between the boiler and the condenser is considered. Solvents (S79 and S82) are recycled, restoring their starting thermodynamic conditions, in order to decrease environmental impact and to reduce economic costs associated with their purchase.

2.1.5. Trans-Esterification

As evidenced by several authors, transesterification of triglycerides using sodium hydroxide as conventional homogeneous catalyst under a methanol–oil ratio of 6:1 represents the best condition for the transesterification process [3,19,60]. According to [60], 5% of sodium hydroxide (based on oil) is used to avoid a reduction of the catalytic activity and therefore to increase conversion of methyl esters. Figure 5 shows the Aspen Plus flowsheet of the alkali-catalyzed process.
A stoichiometric reactor block (R8), operating at 70 °C and 1 atm, is used to simulate the transesterification process (Table 6) considering a single acid methyl ester to represent biodiesel product and a 95% conversion of feedstock to model the reaction. Fresh methanol (S87) and sodium hydroxide (S88) are mixed under the atmospheric pressure prior to be conveyed to transesterification reactor (R8). Microbial oil (S86), completely composed of triolein, is cooled down to transesterification conditions before entering the reactor. Excess of methanol (S93) is recovered using a distillation column (COL-2) equipped with seven theoretical stages and a reflux ratio of 2. Vacuum distillation was used to keep the bottom temperature under 140 °C. A design specification is implemented to obtain a methanol recovery (in mass) of 98.5% varying the distillate rate. The methyl esters formed and residual amount of triglycerides (S99) are separated from sodium hydroxide and glycerol (S98) via a washing column (WASH) with four theoretical stages fed by 2.5 kg/h of fresh water (S97) [61,62]. The amounts of unconverted microbial oil, chloroform, methanol, and water in stream S99 are less than 4%. All the glycerol remains in stream S98 together with methanol, sodium hydroxide, and water. Sodium hydroxide is removed (R9) by adding phosphoric acid (S100) to precipitate trisodium phosphate (Table 6), which is then separated from glycerol fraction by gravity separator (SEP-6). Neutralization of catalyst is performed using a stoichiometric reactor (R9) operating at 50 °C and 1.1 atm. Glycerine purification is reproduced with a vacuum distillation column (COL-3) having six theoretical stages and a reflux ratio of 2. A design specification is implemented to obtain a glycerol purity (in mass) of 99% varying the bottom rate. The bottom stream (S105), defined as a high-quality by-product, is totally composed of glycerol. Water and methanol are removed as distillate stream (S106) together with a small fraction of glycerol. Methyl–oleate purification is reproduced with a vacuum distillation column (COL-4) having eight theoretical stages, a partial condenser, and a reflux ratio of 2. COL-4 is operated under vacuum to avoid degradation of the biodiesel product thanks to a not particularly high temperature. Water and methanol are removed in stream S107 as vent gases. Biodiesel product, obtained in stream S108 as liquid distillate, has a mass purity of 99.8%. The remaining amount of biodiesel remains at the bottom together with unconverted oil; this stream (S109) is cooled down (CEX4) before being directed again to the transesterification reactor (R8).

3. Results and Discussion

3.1. Simulation Results

3.1.1. Mass Balance

This section shows the relevant information of the entire flowsheet, necessary to understand both the composition of the main streams and the total efficiency of the biorefinery scheme. Hydrolysis reactions are catalyzed using 28.56 kg/h of dilute sulfuric acid (S5) and 544 kg/h of high-pressure steam (S10). After the steam-explosion pre-treatment, 296.1 kg/h of cellulose and 33.29 kg/h of hemicellulose are recovered in the hydrolysate slurry (S11), respectively, the 95.4% and the 58.6% of the starting amounts. The flash vapors (S12 and S16), used to pre-heat the process water (S6), consist mainly of 512 kg/h of steam and 6.86 kg/h of furfural; 17.01 kg/h of ammonia gas (S22) is introduced into the conditioning reactor to raise the pH of hydrolysate from 1 to 5–6. The solid fraction of the slurry (S30) is diluted with 3375 kg/h of fresh water and mixed with 1.879 kg/h of Cellic Ctec2 enzyme (S34) in order to promote the enzymatic hydrolysis reactions. The cellulose and xylan amounts are converted into 243.5 and 24.36 kg/h of glucose and xylose, respectively. The solid fraction of the outlet stream (S36), rich in lignin and having a mass flow rate of 373.8 kg/h, is used to produce heat and electricity, while the sugar-rich syrup (S37), before being inoculate with the oleaginous microorganisms, is mixed with the liquid fraction of the hydrolysate slurry (S31) containing a fair amount of xylose. In detail, 257 kg/h of glucose and 91.5 kg/h of xylose take part in the fermentation reactions, where 31.1 kg/h of amino acids (S50) are used to produce 47.1 kg/h of microbial biomass and 52.3 kg/h of lipids. To carry out the fermentation reactions, 72.0 kg/h of oxygen (S52, corresponding to 342.8 kg/h of air) is moved to the reactor (R6); this mass flow rate represents the stoichiometric requirement. The microbial biomass containing the lipids (S61) is separated from the inoculum (S60) and then treated with 281.7 kg/h of methanol (S67 and S80) and 563.9 kg/h of chloroform (S66 and S84) to extract 52.3 kg/h of microbial oil (S69). After removal of microbial biomass (S70), a mixture composed mainly of oil, methanol, and chloroform (S72) is mixed with 250 kg/h of fresh water (S73) to separate the hydrophilic/hydrophobic phases (S76 and S77). Over 99% of the total chloroform (S82) is recovered and recirculated, while all the microbial oil (S86) is conveyed to the trans-esterification reactor. In this context, starting from 52.2 kg/h of triolein, 51.5 kg/h of methyl oleate and 5.33 kg/h of glycerol are produced using 0.544 kg/h of sodium hydroxide (S88) as homogeneous catalyst and 13.1 kg/h of methanol (S87). Most of the methanol (98%) is recovered (S93), cooled, and recirculated. Glycerol and sodium hydroxide (S98) are separated from methyl oleate and methanol (S99) through a washing column using 2.5 kg/h of fresh water (S97).
Sodium hydroxide is removed by adding 0.444 kg/h of phosphoric acid diluted with 1.77 kg/h of fresh water (S100). Neutralization of catalyst produces 0.743 kg/h of trisodium phosphate (S104), a solid by-product expelled by a gravity separator. The bottom liquid (S105) of the glycerol purification column has a mass flow rate of 5.19 kg/h; this amount is totally (99.9% purity) composed of glycerol. The distillate liquid (S106), having a mass flow rate of 6.76 kg/h, contains 96.3% water.
The mixture of methyl oleate and methanol (S99) is subject to a distillation process where a partial condenser removes water and methanol (S107) as vent gases (0.133 kg/h). Methyl oleate product (S108), obtained as liquid distillate, has a mass flow rate of 50.8 kg/h and a mass purity of 99.8%. The bottom liquid (S109), rich in unconverted oil and with a mass flow rate of 1.66 kg/h, is recirculated to the trans-esterification reactor.

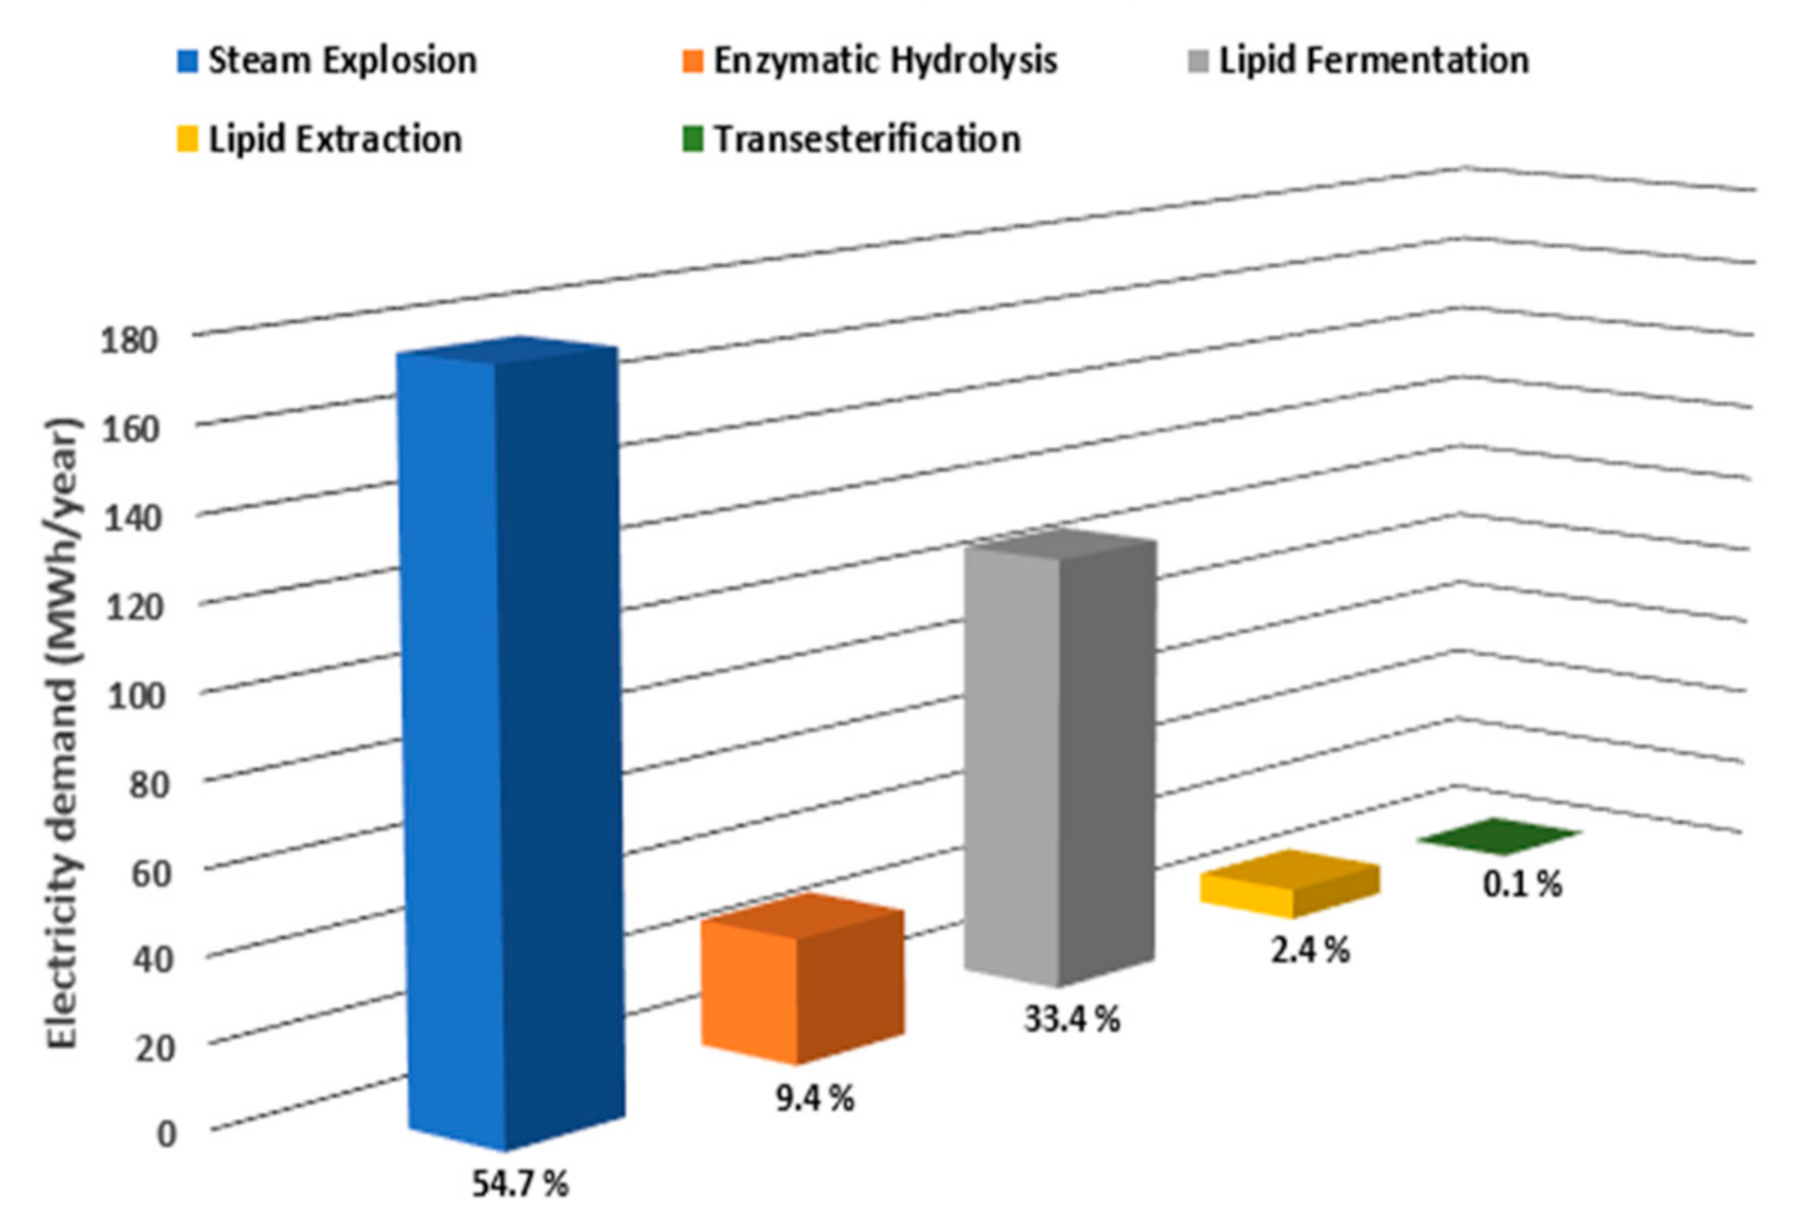
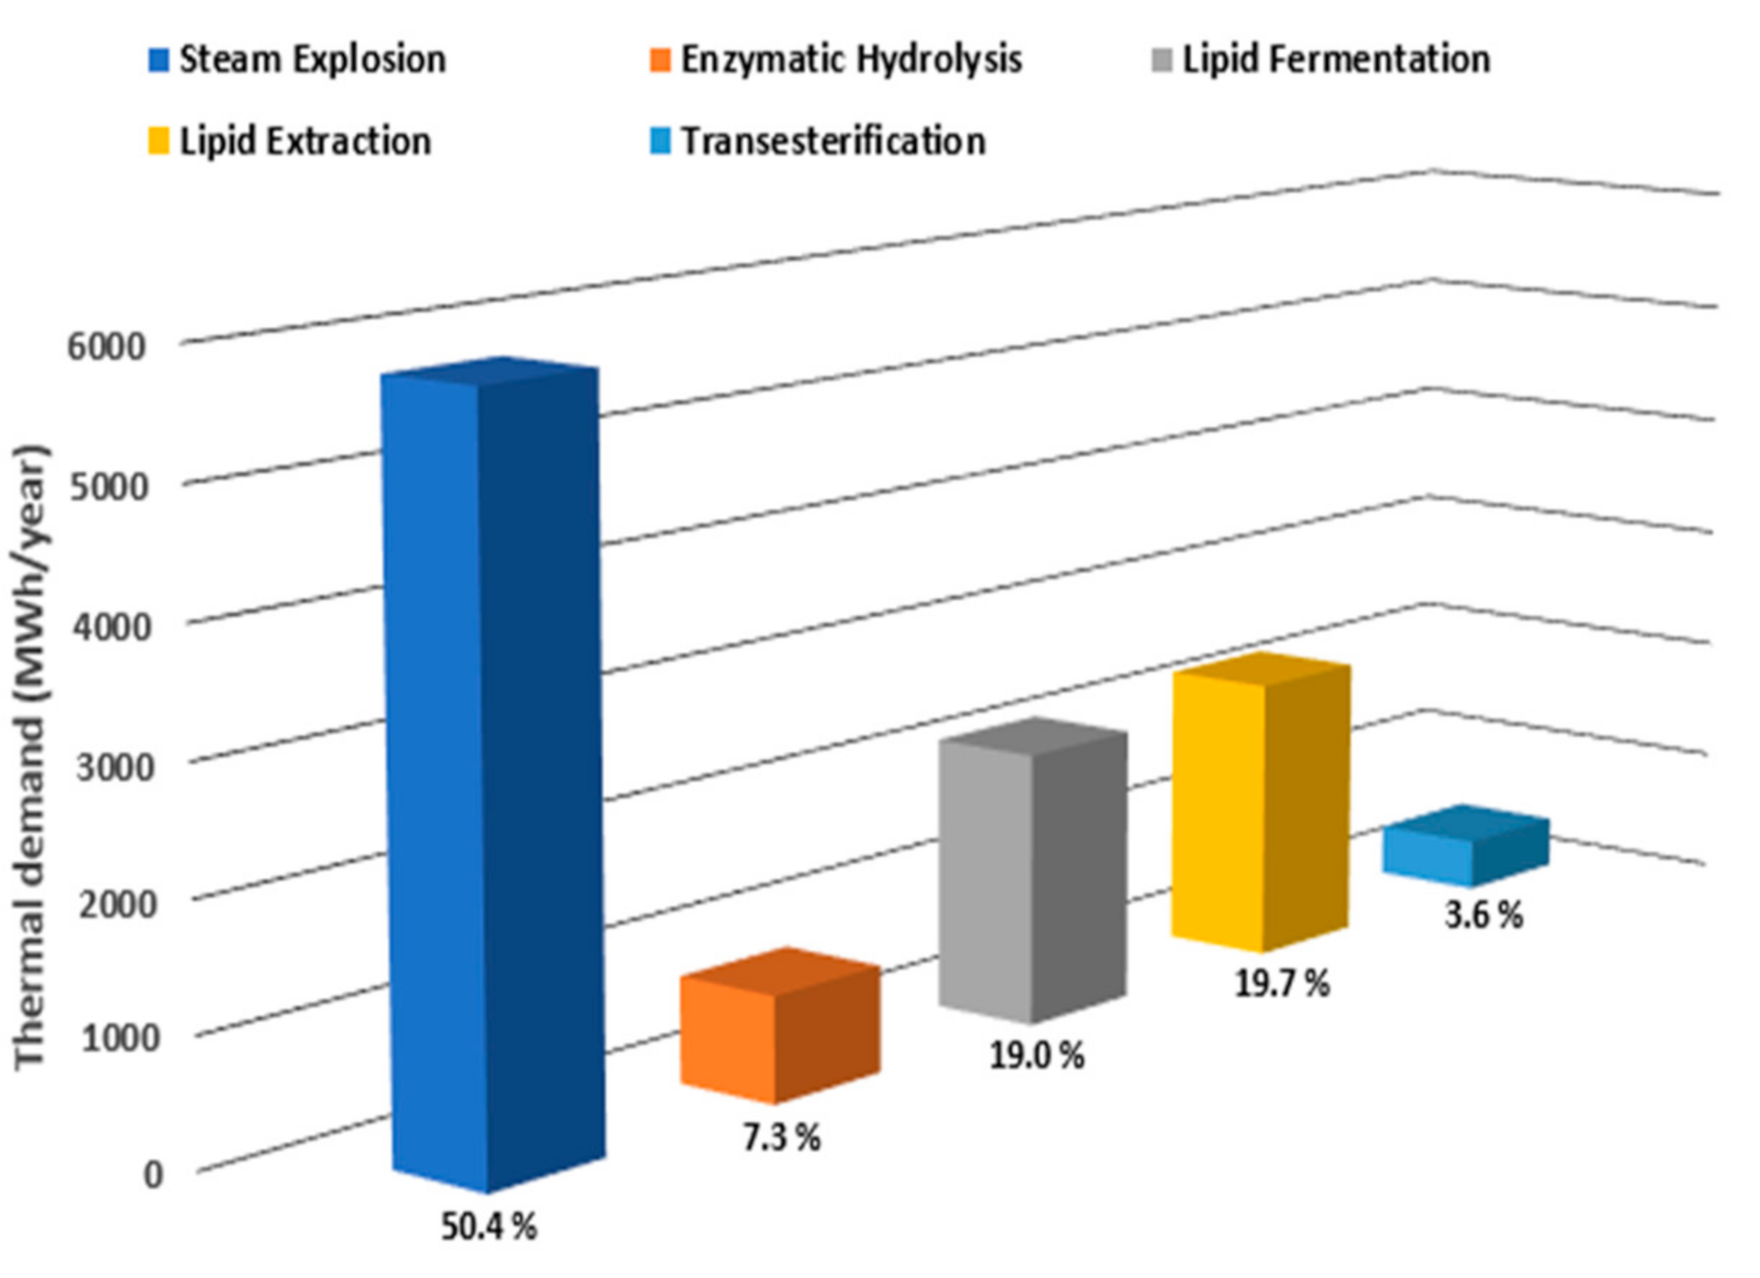
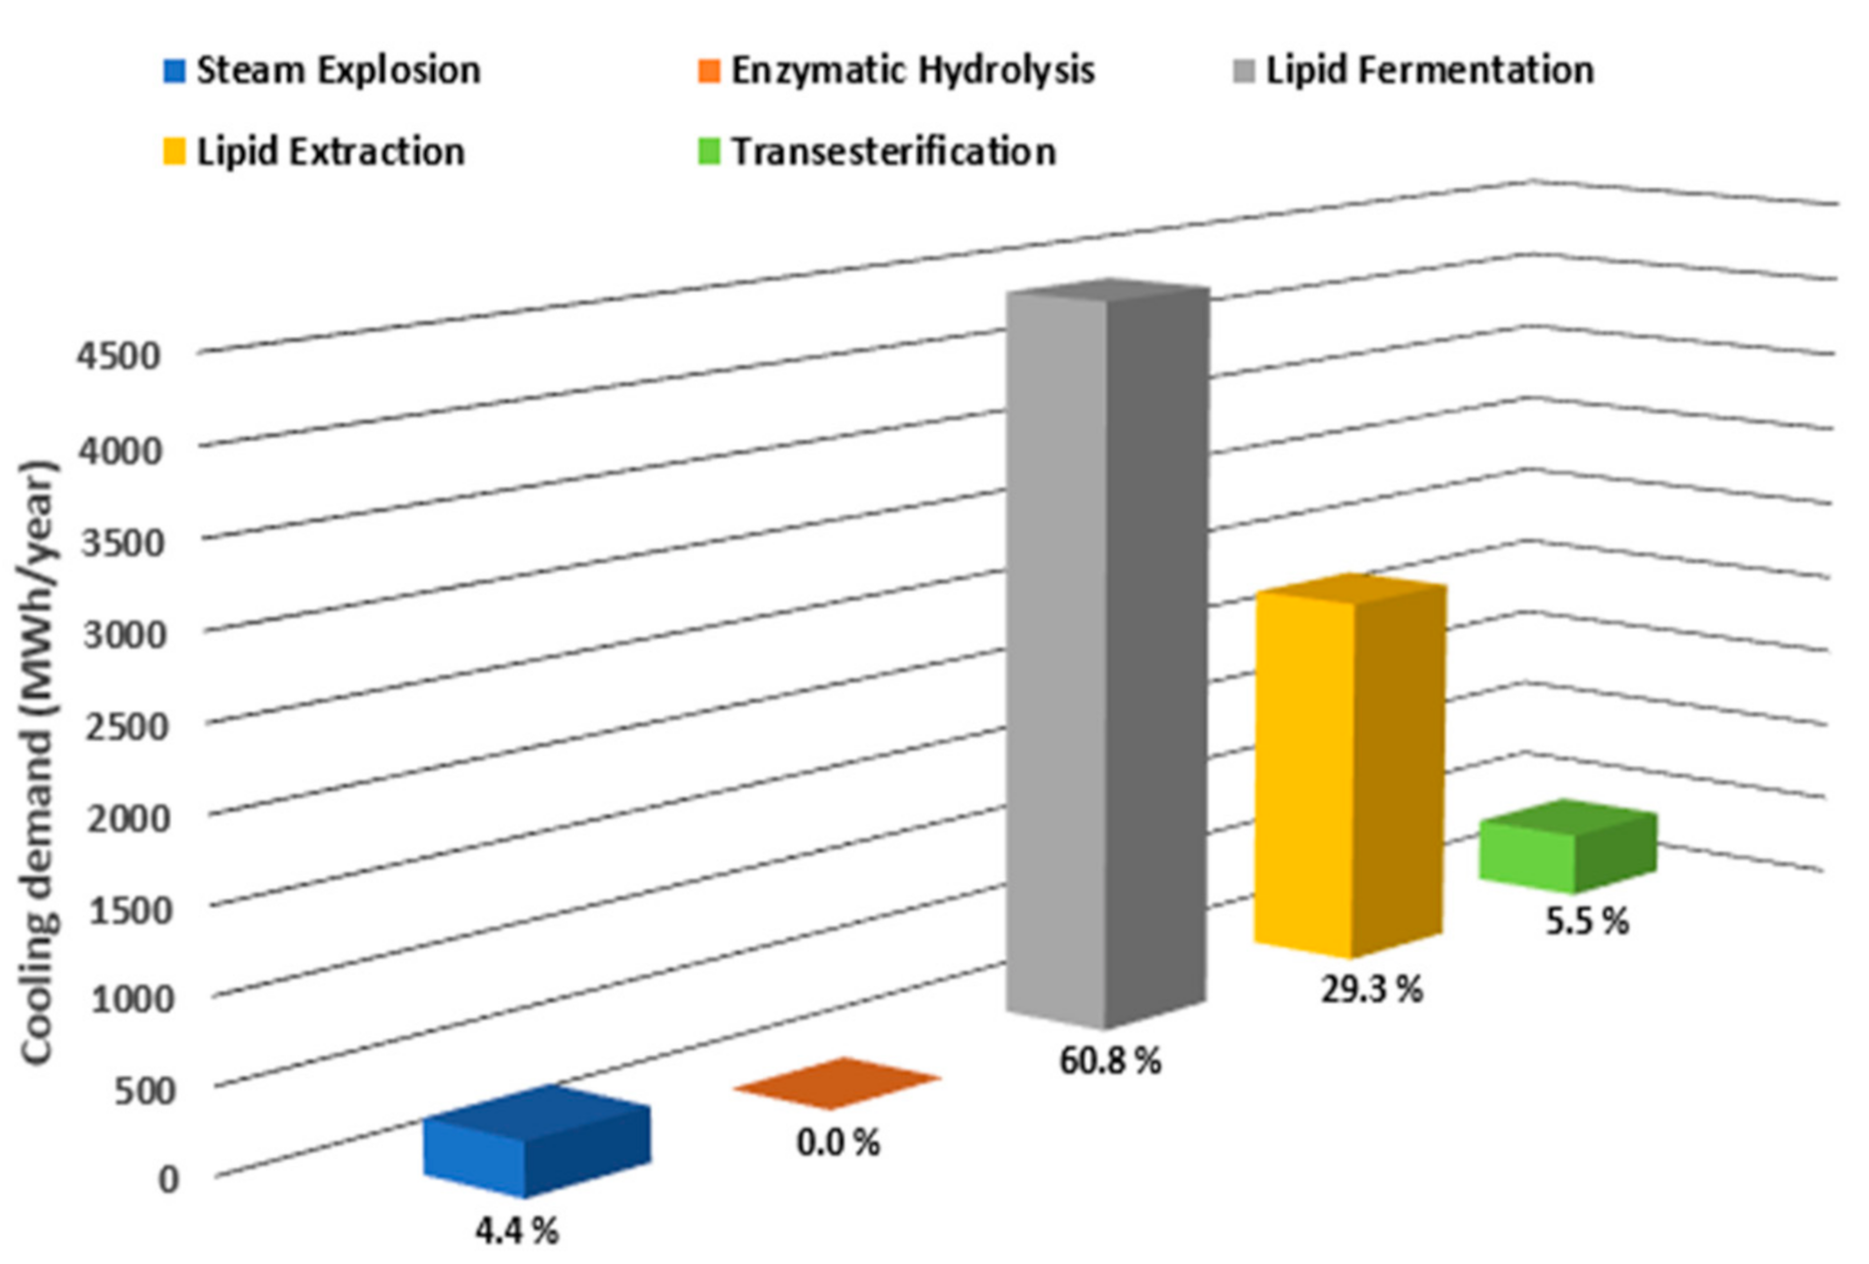
3.1.2. Energy Balance

The overall electricity demand, determined based on Aspen Plus process modeling results, was equal to 321.8 MWh/y. In the developed process, the electricity consumption is estimated using different approaches. Electricity consumption of centrifugal pumps, compressors, and fans is directly obtained from the numerical model. The power required for size reduction of the starting lignocellulosic biomass is determined through the following equation:
P = 5.31 S2 − 30.86 S + 25.99
where the specific energy requirement (P), expressed in kWh/ton, is related to hammer mill screen size (S) [63]. It is assumed that the used feedstock to be equivalent to corn stover at a moisture content of 12%. A specific energy consumption of 11.04 kWh/ton is obtained considering a size reduction of 3.2 mm, which is close to the results reported by Cadoche and Lopez [64]. A ratio of 1 kWh/m3 of feed flow rate is considered for centrifugal separators [65,66]. Figure 6 and Figure 7 respectively, show the electricity and thermal demand of each main phase of the process with the corresponding percentage distribution in relation to total requirement.
The steam explosion pre-treatment represents the most energy-intensive section with a consumption of 175.9 MWh/y. Here, the energy requirement for biomass grinding corresponds to about 60% (110.7 MWh/y) of the total demand. Other significant contributions in the different process areas are given by centrifugal separators whose energy consumptions can reach 56.5 MWh/y (e.g., in fermentation stage) based on the flow rate processed.
The overall thermal demand is 11,474 MWh/y, half of which (5778 MWh/y) is consumed in the high-temperature hydrothermal pre-treatment. The fermentation broth heating to deactivate the enzyme in yeast cells and the solvent recovery processes after lipid extraction require a significant heat input equal to 4441 MWh/y. In the transesterification section, despite the use of three distillation columns, there is a small heat demand (about 418 MWh/y) due to a low mass flow rate.
In this work, a total thermal integration is considered by employing in the process all the available heat sources [54,67]. Some by-product streams such as the flash vapors (S12 and S16) and the hydrolysate solid fraction (S36) are used to make the plant “thermal-neutral” and therefore self-sufficient in energy. The flash vapors, mainly composed of water and furfural, first pre-heat the compressed process water (S7 and S8) up to 170 °C for the hydrothermal pre-treatment and then deactivate the enzymes in the yeast cells at 60 °C (S56). The combustion system produces 1118 kW (about 8944 MWh/y) of heat (thermal content of the gas) and 500 kg/h of superheated steam (S46) at 460 °C and 60 atm, which is processed by a multistage turbine generator and then partially extracted (30%) from the first stage to provide heat where needed. The choice of processing only 200 kg/h of steam represents the right compromise to obtain output streams with the desired thermal characteristics. Flue gas (S41) is used to generate high pressure steam [54], which brings the pre-treatment steam (S10) to the operating temperature (190 °C) and subsequently heats the triolein–chloroform (S76) mixture up to 130 °C, thus promoting its separation. The heat of combustion (H1) satisfies the thermal energy requirements of the boilers in the distillation columns and of the reactors (see Table 7). It is worth noting that the heat duties significantly depend on temperature and mass flow rates. For example, the thermal energy necessary to glycerol and methyl oleate purification processes, differently from the methanol purification process, is low, as they treat small inlet mass flow rates. Distillation columns regulate the temperatures of their outlet streams (distillate and bottom fluid) and therefore the corresponding heat duty, varying the pressure in the boiler section. For this reason, in industrial applications, it is desirable to operate in vacuum conditions.
The remaining part of the steam (i.e., not extracted) is processed in the second stage of the turbine to produce 87.1 kW (696.8 MWh/y) used to power all the users in the plant. Sale of excess electricity, equal to 375 MWh/y, generates additional revenue.
The amount of heat extracted to promote the cooling processes is equal to 7215 MWh/y, whose percentage distribution between the main sections of the flowsheet is shown in Figure 8. Most of the heat removed (6499 MWh/y) is used to maintain the environmental conditions (25 °C) in the fermentation reactor and for solvents recovery operations during the microbial oil extraction.
Cooling operations are simulated considering essentially two types of utilities: water and refrigerant 1 generation (propane). Refrigerant at −25 °C is used to restore the environmental conditions of the recovered products, while cold water at 20 °C is used in the condensers of the distillation columns and to maintain appropriate operating conditions in some stoichiometric reactors (Table 8).

3.1.3. Economic Analysis

The ultimate purpose of this chemical process simulation is to determine the economics of biodiesel production starting from microbial oil. This approach is used to understand biodiesel’s potential in the marketplace when compared with traditional production processes and to guide future research in order to modify or optimize the production chain. In light of these considerations, the analysis developed is used to determine a fundamental economic parameter, such as the biodiesel production cost [68], whose value is directly related to feasibility project. As evidenced by Humbird et al. [44], the first step is to determine the total capital investment (TCI), which is strongly related to the total equipment cost, but also to several other indirect costs. The total equipment cost, representing the installation cost, takes into account all operations and materials needed to make the equipment functional (e.g., piping, foundation, wiring). In the current work, it is considered a simplified approach in which the purchased equipment cost, evaluated by Aspen PEA based on the construction material (carbon steel) and size, is increased by 60%. This methodology differs from the common factored approach [44,69,70], but it provides similar results. Proratable and field expenses, home office engineering and construction activities, project contingency, and other costs (start-up, permits, etc.) related to construction are computed to give the total indirect costs. Each of these economic items represents a certain fraction of the total equipment cost [44]. The fixed capital investment (FCI) is given by the sum of direct (TDC) and indirect (TIC) costs. Total capital cost, as reported in Equation (2), also includes working capital (WC), assumed to be 5% of the fixed capital investment [44,53].
TCI = (TDC + TIC) + WC = FCI + WC
The above mentioned economic considerations are summarized in Table 9.
The production cost (PC) is calculated by Equations (3) and (4) considering the manufacturing costs (MC), including total production costs (TPC), fixed costs (FC), byproduct sales (BS), and the yearly biodiesel production (PR) [71].
PC = MC/PR
MC = TPC + FC − BS
The total production costs (TPC) represents the sum of utilities, raw materials, operating labor, maintenance, supervision, operation charges, plant overhead, and general and administrative expenses (G & A). Fixed costs include taxes and depreciation. It is assumed that the plant is depreciated over 10 years (10%/year) via the straight-line depreciation method, and the taxes correspond to 15% of the total capital investment (TCI) [53]. Utilities and raw materials costs are chosen based on Aspen Plus database and literature references, respectively. Coolants cost adopted is related to amount of heat exported (Table 10). The electricity produced by the generator group is able to totally satisfy the energy demand of each section of the plant and so it is not necessary to withdraw from the power grid.
The total cost of each raw material is listed in Table 11 and is determined based on Aspen Plus process modeling results. In this context, it is also essential to consider the residual value of some by-products such as glycerol and trisodium phosphate. Solvents used during the microbial oil extraction and the transesterification are recovered and recycled to minimize the costs associated to their purchase. A cost of waste liquid treatment equal to 0.10 USD/t is considered [42].
Manufacturing costs of biodiesel including total production and fixed costs are reported in Table 12. The staff consists of five operators (one for each main section of the plant) whose wage rate is assumed to be 20 USD/h.
Based on the results reported in Table 12 and the Equations (2)–(4), Table 1 the cost of biodiesel production from microbial oil is 12.8 USD/kg. Koutinas et al. [42] estimated a biodiesel cost production of 5.9 USD/kg, a value almost entirely attributed to microbial oil cost production (5.5 USD/kg), considering an annual production capacity of 10,000 t microbial oil and a price of glucose of 400 USD/t. At a scale of 100 t/y microbial oil production, Parsons et al. [72] determined a minimum estimated selling price of about 14 USD/kg using sucrose and wheat straw and showed how this value was reduced to 7–8 USD/kg on scaling of 10,000 t/y. The unitary production cost of microbial oil is significantly affected by the productivity of the microbial fermentation and the market price of the raw material used. It is evident that the fermentation stage where low microbial oil concentrations are achieved represents the most critical section of the entire plant. Although the oleaginous yeast adopted uses both glucose and xylose as carbon sources, the conversion yields imposed and the low plant capacity play a key role in the economic viability. The economic values found are very high when compared with the common chemicals and fuels, but the same is not true when high-value plant or animal fats are substituted from the potential utilization of these microbial oils. Richardson et al. [73] estimated that the cost of plant-derived lipids containing C-linolenic acid and therefore with similar composition to microbial oils produced by several oleaginous microorganisms to be 45–50 USD/kg. Ratledge and Cohen [74] obtained a lipid production cost from algae of 21 USD/kg, while Alabi et al. [75] reported a variable cost between 7.64 USD/L and 14.44 USD/L. However, low lipid production cost (about 2.25 USD/kg) from algae can also be achieved under particular conditions [76].
A sensitivity analysis is performed to identify effects of the microbial fermentation productivity and of the plant capacity on the economy of the project. The biodiesel cost production is estimated considering first a lipid yield of 22% and then a plant capacity of 100,000 t/y lignocellulosic biomass. According to many scholars, the lipid yield on the glucose consumed can reach 22% under ideal conditions [74,77,78]. An increase in biodiesel production rate of 62.9% is obtained by optimizing the fermentation stage. Against manufacturing cost practically unchanged, the biodiesel cost production equal to 7.88 USD/kg is subject to a reduction of 38.4% compared to the base case studied. The standard flowsheet is modified in order to consider the influence of a different mass flow rate (capacity plant) assumed to be 100,000 t/y on the same economic item. An exponential scaling expression, given by Equation (5), is used to evaluate the new purchased equipment cost:
C = C0 × (S/S0)n
where C is the cost of the process unit, C0 is the cost of the reference unit, S is the capacity of the process unit, S0 is the capacity of the reference unit, and n is the capacity scaling exponent, assumed equal to 0.67 [79] for all equipment. The turbo-generator group, being able to satisfy the electrical and thermal demands of each block thanks to the increase of the processed flow rate, keeps utilities cost limited. On the other hand, the large amount of feedstock treated requires a greater number of qualified personnel, considered to be 10 operators per shift. In conclusion, a biodiesel production cost of 5.91 USD/kg (equal to a reduction of 53.8% compared the initial case) is determined. Under this perspective, the plant shows very promising results if compared with literature studies based on the same production process [42].
A biodiesel production cost of 3.63 USD/kg is found by combining the ideal lipid yield with the new plant size. The economic values obtained are not yet comparable with the vegetable oil prices [42], characterized by considerable price swings with upward trending, but this may be evidence that biodiesel production from microbial oil could become a competitive scenario to vegetables oils.
Furthermore, in order to increase the economic sustainability of the process, the use of microbial oil, without the transesterification step, in triple blends with organic solvents and fossil diesel as alternative fuel for diesel engines could be analyzed in a future work. This strategy allows the improvement of the fuel properties of triglycerides, and it has actually been analyzed only with vegetable oils [80,81].

4. Conclusions

This paper evaluated the technical and economic feasibility on an industrial scale of biodiesel production from of microbial oil using cardoon stalks as raw material. The process was designed and rigorously simulated through a thermo-chemical model, employing technical data from laboratory results and pilot plant operation. A detailed study of a plant processing 10,000 t of feedstock per year and producing 406.4 t of biodiesel per year was carried out to analyze the performances and to investigate the production costs of biodiesel through the use of the yeast L. creatinivorum DBVPG 4794.
The economic evaluation results indicated that microbial biodiesel production cost is equal to 12.8 USD/kg, much higher than the current market price of biodiesel (about 0.9 USD/kg). In this scenario, the total capital investment was about 13 million USD and the total operating cost was about 2 million USD.
However, we demonstrated that the plant capacity has a significant effect on the unit production cost, which could be decreased by over 50%, down to 5.9 USD/kg, sizing the plant to obtain and annual production of 100,000 t of feedstock.
We also evaluated the effect of lipid yield (from 13.5% to 22%) to the economic feasibility, and we demonstrated that the production cost could be further reduced to 3.63 USD/kg for a production plant with a capacity of 100,000 t/year.
The results of this techno-economic assessment provide insights on the economic competitiveness of producing microbial biodiesel from cardoon stalks via the microbial oil route.

Author Contributions

Conceptualization: M.B.; formal analysis: D.B.; funding acquisition: S.U.; investigation: M.C.; methodology: M.B., M.C. and D.B.; project administration: S.U. and P.B.; resources: S.U. and P.B.; supervision: M.B. and D.B.; writing—original draft: M.C.; writing—review and editing: M.B., I.B. and D.B. All authors have read and agreed to the published version of the manuscript.

Funding

The study has received financial support by the Ministry of Education, University and Research (MIUR)—Italy, in the frame of the project PON 2015–2020: “ARS01_00985 BIOFEEDSTOCK—Development of Integrated Technological Platforms for Residual Biomass Exploitation”.

Institutional Review Board Statement

Not applicable.

Informed Consent Statement

Not applicable.

Data Availability Statement

Data sharing not applicable.

Conflicts of Interest

The authors declare no conflict of interest.

References

  1. Felizardo, P.; Neiva Correia, M.J.; Raposo, I.; Mendes, J.F.; Berkemeier, R.; Bordado, J.M. Production of biodiesel from waste frying oils. Waste Manag. 2006, 26, 487–494. [Google Scholar] [CrossRef]
  2. Pinzi, S.; Pilar dorado, M. Feedstocks for advanced biodiesel production. In Advances in Biodiesel Production; Elsevier: Amsterdam, The Netherlands, 2012; pp. 69–90. [Google Scholar]
  3. Zhang, Y.; Dubé, M.A.; McLean, D.D.; Kates, M. Biodiesel production from waste cooking oil: 1. Process design and technological assessment. Bioresour. Technol. 2003. [Google Scholar] [CrossRef]
  4. Manaf, I.S.A.; Rahim, M.H.A.; Govindan, N.; Maniam, G.P. A first report on biodiesel production from Aglaia korthalsii seed oil using waste marine barnacle as a solid catalyst. Ind. Crops Prod. 2018, 125, 395–400. [Google Scholar] [CrossRef]
  5. Tamilalagan, A.; Singaram, J.; Rajamohan, S. Generation of biodiesel from industrial wastewater using oleaginous yeast: Performance and emission characteristics of microbial biodiesel and its blends on a compression injection diesel engine. Environ. Sci. Pollut. Res. 2019, 26, 11371–11386. [Google Scholar] [CrossRef] [PubMed]
  6. Koutinas, A.A.; Papanikolaou, S. Biodiesel production from microbial oil. In Handbook of Biofuels Production; Elsevier: Amsterdam, The Netherlands, 2011; pp. 177–198. ISBN 9780857090492. [Google Scholar]
  7. Han, S.; Kim, G.-Y.; Han, J.-I. Biodiesel production from oleaginous yeast, Cryptococcus sp. by using banana peel as carbon source. Energy Rep. 2019, 5, 1077–1081. [Google Scholar] [CrossRef]
  8. Patel, A.; Arora, N.; Pruthi, V.; Pruthi, P.A. Biological treatment of pulp and paper industry effluent by oleaginous yeast integrated with production of biodiesel as sustainable transportation fuel. J. Clean. Prod. 2017, 142, 2858–2864. [Google Scholar] [CrossRef]
  9. Deeba, F.; Patel, A.; Arora, N.; Pruthi, V.; Pruthi, P.A.; Negi, Y.S. Amaranth seeds (Amaranthus palmeri L.) as novel feedstock for biodiesel production by oleaginous yeast. Environ. Sci. Pollut. Res. 2018, 25, 353–362. [Google Scholar] [CrossRef]
  10. Papanikolaou, S.; Diamantopoulou, P.; Chatzifragkou, A.; Philippoussis, A.; Aggelis, G. Suitability of Low-Cost Sugars as Substrates for Lipid Production by the Fungus Thamnidium elegans. Energy Fuels 2010, 24, 4078–4086. [Google Scholar] [CrossRef]
  11. Leiva-Candia, D.E.; Pinzi, S.; Redel-Macías, M.D.; Koutinas, A.; Webb, C.; Dorado, M.P. The potential for agro-industrial waste utilization using oleaginous yeast for the production of biodiesel. Fuel 2014, 123, 33–42. [Google Scholar] [CrossRef]
  12. Gouda, M.K.; Omar, S.H.; Aouad, L.M. Single cell oil production by Gordonia sp. DG using agro-industrial wastes. World J. Microbiol. Biotechnol. 2008, 24, 1703–1711. [Google Scholar] [CrossRef]
  13. Chebbi, H.; Leiva-Candia, D.; Carmona-Cabello, M.; Jaouani, A.; Dorado, M.P. Biodiesel production from microbial oil provided by oleaginous yeasts from olive oil mill wastewater growing on industrial glycerol. Ind. Crops Prod. 2019, 139, 111535. [Google Scholar] [CrossRef]
  14. Yoo, C.; Jun, S.Y.; Lee, J.Y.; Ahn, C.Y.; Oh, H.M. Selection of microalgae for lipid production under high levels carbon dioxide. Bioresour. Technol. 2010. [Google Scholar] [CrossRef] [PubMed]
  15. Meng, X.; Yang, J.; Xu, X.; Zhang, L.; Nie, Q.; Xian, M. Biodiesel production from oleaginous microorganisms. Renew. Energy 2009. [Google Scholar] [CrossRef]
  16. Guil-Guerrero, J.; Navarro-Juárez, R.; López-Martínez, J.; Campra-Madrid, P.; Rebolloso-Fuentes, M. Functional properties of the biomass of three microalgal species. J. Food Eng. 2004, 65, 511–517. [Google Scholar] [CrossRef]
  17. Cho, H.U.; Park, J.M. Biodiesel production by various oleaginous microorganisms from organic wastes. Bioresour. Technol. 2018, 256, 502–508. [Google Scholar] [CrossRef]
  18. Rashid, U.; Anwar, F. Production of Biodiesel through Base-Catalyzed Transesterification of Safflower Oil Using an Optimized Protocol. Energy Fuels 2008, 22, 1306–1312. [Google Scholar] [CrossRef]
  19. Glisic, S.; Skala, D. The problems in design and detailed analyses of energy consumption for biodiesel synthesis at supercritical conditions. J. Supercrit. Fluids 2009, 49, 293–301. [Google Scholar] [CrossRef]
  20. Vlad, E.; Bildea, C.S.; Pleşu, V.; Marton, G.; Bozga, G. Process design of biodiesel production from rapeseed oil. Chem. Eng. Trans. 2010. [Google Scholar] [CrossRef]
  21. Meher, L.C.; Vidya Sagar, D.; Naik, S.N. Technical aspects of biodiesel production by transesterification—A review. Renew. Sustain. Energy Rev. 2006. [Google Scholar] [CrossRef]
  22. Tasselli, G.; Filippucci, S.; Borsella, E.; D’Antonio, S.; Gelosia, M.; Cavalaglio, G.; Turchetti, B.; Sannino, C.; Onofri, A.; Mastrolitti, S.; et al. Yeast lipids from cardoon stalks, stranded driftwood and olive tree pruning residues as possible extra sources of oils for producing biofuels and biochemicals. Biotechnol. Biofuels 2018. [Google Scholar] [CrossRef]
  23. Kahr, H.; Pointner, M.; Krennhuber, K.; Wallner, B.; Jäger, A. Lipid production from diverse oleaginous yeasts from steam exploded corn cobs. Agron. Res. 2015, 13, 318–327. [Google Scholar]
  24. Yu, X.; Zheng, Y.; Dorgan, K.M.; Chen, S. Oil production by oleaginous yeasts using the hydrolysate from pretreatment of wheat straw with dilute sulfuric acid. Bioresour. Technol. 2011, 102, 6134–6140. [Google Scholar] [CrossRef]
  25. Zhang, J.; Zhou, H.; Liu, D.; Zhao, X. Pretreatment of lignocellulosic biomass for efficient enzymatic saccharification of cellulose. In Lignocellulosic Biomass to Liquid Biofuels; Elsevier: Amsterdam, The Netherlands, 2019; pp. 17–65. ISBN 9780128159361. [Google Scholar]
  26. Wiklund, A. The genus Cynara L. (Asteraceae-Cardueae). Bot. J. Linn. Soc. 1992, 109, 75–123. [Google Scholar] [CrossRef]
  27. Torres, C.M.; Ríos, S.D.; Torras, C.; Salvadó, J.; Mateo-Sanz, J.M.; Jiménez, L. Sustainability analysis of biodiesel production from Cynara Cardunculus crop. Fuel 2013, 111, 535–542. [Google Scholar] [CrossRef]
  28. Cravero, V.; Martin, E.; Crippa, I.; Anido, F.L.; García, S.M.; Cointry, E. Fresh biomass production and partitioning of aboveground growth in the three botanical varieties of Cynara cardunculus L. Ind. Crops Prod. 2012, 37, 253–258. [Google Scholar] [CrossRef]
  29. Ciancolini, A.; Alignan, M.; Pagnotta, M.A.; Vilarem, G.; Crinò, P. Selection of Italian cardoon genotypes as industrial crop for biomass and polyphenol production. Ind. Crops Prod. 2013, 51, 145–151. [Google Scholar] [CrossRef]
  30. Angelini, L.G.; Ceccarini, L.; Nassi o Di Nasso, N.; Bonari, E. Long-term evaluation of biomass production and quality of two cardoon (Cynara cardunculus L.) cultivars for energy use. Biomass Bioenergy 2009, 33, 810–816. [Google Scholar] [CrossRef]
  31. Shatalov, A.A.; Pereira, H. Biorefinery of Energy Crop Cardoon(Cynara cardunculus L.)-Hydrolytic Xylose Production as Entry Point to Complex Fractionation Scheme. J. Chem. Eng. Process Technol. 2011, 2, 8. [Google Scholar] [CrossRef]
  32. Galanopoulos, C.; Giuliano, A.; Barletta, D.; Zondervan, E. An integrated methodology for the economic and environmental assessment of a biorefinery supply chain. Chem. Eng. Res. Des. 2020, 160, 199–215. [Google Scholar] [CrossRef]
  33. Mabrouk, A.; Erdocia, X.; Alriols, M.G.; Labidi, J. Economic analysis of a biorefinery process for catechol production from lignin. J. Clean. Prod. 2018, 198, 133–142. [Google Scholar] [CrossRef]
  34. Aspen Technology Inc. Aspen Plus ® User Guide; Aspen Technology Inc.: Bedford, MA, USA, 2000. [Google Scholar]
  35. Facci, A.L.; Ubertini, S. Meta-heuristic optimization for a high-detail smart management of complex energy systems. Energy Convers. Manag. 2018, 160, 341–353. [Google Scholar] [CrossRef]
  36. Loreti, G.; Facci, A.L.; Baffo, I.; Ubertini, S. Combined heat, cooling, and power systems based on half effect absorption chillers and polymer electrolyte membrane fuel cells. Appl. Energy 2019, 235, 747–760. [Google Scholar] [CrossRef]
  37. García, A.; Alriols, M.G.; Llano-Ponte, R.; Labidi, J. Energy and economic assessment of soda and organosolv biorefinery processes. Biomass Bioenergy 2011, 35, 516–525. [Google Scholar] [CrossRef]
  38. Giuliano, A.; Poletto, M.; Barletta, D. Process Design of a Multi-Product Lignocellulosic Biorefinery. In Computer Aided Chemical Engineering; Elsevier B.V.: Amsterdam, The Netherlands, 2015; Volume 37, pp. 1313–1318. [Google Scholar]
  39. Meramo, S.; Ojeda, K.A.; Sánchez, E.L. Integrated Biorefinery from Corn Waste Biomass: A Case Study in the North of Colombia. Int. J. Chem. Tech. Res. 2018, 11, 33–40. [Google Scholar]
  40. Phan, A.N.; Phan, T.M. Biodiesel production from waste cooking oils. Fuel 2008, 87, 3490–3496. [Google Scholar] [CrossRef]
  41. van Kasteren, J.M.N.; Nisworo, A.P. A process model to estimate the cost of industrial scale biodiesel production from waste cooking oil by supercritical transesterification. Resour. Conserv. Recycl. 2007, 50, 442–458. [Google Scholar] [CrossRef] [Green Version]
  42. Koutinas, A.A.; Chatzifragkou, A.; Kopsahelis, N.; Papanikolaou, S.; Kookos, I.K. Design and techno-economic evaluation of microbial oil production as a renewable resource for biodiesel and oleochemical production. Fuel 2014, 116, 566–577. [Google Scholar] [CrossRef]
  43. Li, Y.; Zhao, Z.K.; Bai, F. High-density cultivation of oleaginous yeast Rhodosporidium toruloides Y4 in fed-batch culture. Enzyme Microb. Technol. 2007, 41, 312–317. [Google Scholar] [CrossRef]
  44. Humbird, D.; Davis, R.; Tao, L.; Kinchin, C.; Hsu, D.; Aden, A.; Schoen, P.; Lukas, J.; Olthof, B.; Worley, M.; et al. Process Design and Economics for Biochemical Conversion of Lignocellulosic Biomass to Ethanol: Dilute-Acid Pretreatment and Enzymatic Hydrolysis of Corn Stover; U.S. Department of Energy Office of Scientific and Technical Information: Oak Ridge, TN, USA, 2011.
  45. Wooley, R.J.; Putsche, V. Development of an ASPEN PLUS Physical Property Database for Biofuels Components; U.S. Department of Energy Office of Scientific and Technical Information: Oak Ridge, TN, USA, 1996.
  46. Li, Q.; Du, W.; Liu, D. Perspectives of microbial oils for biodiesel production. Appl. Microbiol. Biotechnol. 2008, 80, 749–756. [Google Scholar] [CrossRef]
  47. Zhu, L.Y.; Zong, M.H.; Wu, H. Efficient lipid production with Trichosporonfermentans and its use for biodiesel preparation. Bioresour. Technol. 2008, 99, 7881–7885. [Google Scholar] [CrossRef]
  48. ASPEN PLUS Chemical Engineering Applications; Wiley: Hoboken, NJ, USA, 2017; ISBN 9788578110796.
  49. Bell, J.C.; Messerly, R.A.; Gee, R.; Harrison, A.; Rowley, R.L.; Wilding, W.V. Ternary liquid-liquid equilibrium of biodiesel compounds for systems consisting of a methyl ester + glycerin + water. J. Chem. Eng. Data 2013. [Google Scholar] [CrossRef]
  50. Luyben, W.L. Distillation Design and Control Using AspenTM Simulation; John Wiley & Sons, Inc.: Hoboken, NJ, USA, 2006; ISBN 9780471785255. [Google Scholar]
  51. Bertini, A.; Gelosia, M.; Cavalaglio, G.; Barbanera, M.; Giannoni, T.; Tasselli, G.; Nicolini, A.; Cotana, F. Production of Carbohydrates from Cardoon Pre-Treated by Acid-Catalyzed Steam Explosion and Enzymatic Hydrolysis. Energies 2019, 12, 4288. [Google Scholar] [CrossRef] [Green Version]
  52. Barbanera, M.; Castellini, M.; Tasselli, G.; Turchetti, B.; Cotana, F.; Buzzini, P. Prediction of the environmental impacts of yeast biodiesel production from cardoon stalks at industrial scale. Fuel 2021, 283, 118967. [Google Scholar] [CrossRef]
  53. Ashraf, M.T.; Schmidt, J.E. Process simulation and economic assessment of hydrothermal pretreatment and enzymatic hydrolysis of multi-feedstock lignocellulose—Separate vs combined processing. Bioresour. Technol. 2018, 249, 835–843. [Google Scholar] [CrossRef]
  54. Damartzis, T.; Michailos, S.; Zabaniotou, A. Energetic assessment of a combined heat and power integrated biomass gasification–internal combustion engine system by using Aspen Plus®. Fuel Process. Technol. 2012, 95, 37–44. [Google Scholar] [CrossRef]
  55. Evans, C.T.; Ratledge, C. A comparison of the oleaginous yeast, Candida curvata, grown on different carbon sources in continuous and batch culture. Lipids 1983, 18, 623–629. [Google Scholar] [CrossRef]
  56. Babel, W.; Muller, R. Correlation between cell composition and carbon conversion efficiency in microbial growth: A theoretical study. Appl. Microbiol. Biotechnol. 1985, 22. [Google Scholar] [CrossRef]
  57. Ranjith Kumar, R.; Hanumantha Rao, P.; Arumugam, M. Lipid Extraction Methods from Microalgae: A Comprehensive Review. Front. Energy Res. 2015, 2. [Google Scholar] [CrossRef] [Green Version]
  58. Peralta-Ruiz, Y.; González-Delgado, A.-D.; Kafarov, V. Evaluation of alternatives for microalgae oil extraction based on exergy analysis. Appl. Energy 2013, 101, 226–236. [Google Scholar] [CrossRef]
  59. Kumar, L.R.; Yellapu, S.K.; Tyagi, R.D.; Drogui, P. Cost, energy and GHG emission assessment for microbial biodiesel production through valorization of municipal sludge and crude glycerol. Bioresour. Technol. 2020, 297, 122404. [Google Scholar] [CrossRef]
  60. Xie, W.; Huang, X.; Li, H. Soybean oil methyl esters preparation using NaX zeolites loaded with KOH as a heterogeneous catalyst. Bioresour. Technol. 2007, 98, 936–939. [Google Scholar] [CrossRef]
  61. Demirbaş, A. Biodiesel fuels from vegetable oils via catalytic and non-catalytic supercritical alcohol transesterifications and other methods: A survey. Energy Convers. Manag. 2003, 44, 2093–2109. [Google Scholar] [CrossRef]
  62. Dorado, M.P.; Ballesteros, E.; Mittelbach, M.; López, F.J. Kinetic Parameters Affecting the Alkali-Catalyzed Transesterification Process of Used Olive Oil. Energy Fuels 2004, 18, 1457–1462. [Google Scholar] [CrossRef]
  63. Mani, S.; Tabil, L.G.; Sokhansanj, S. Grinding performance and physical properties of wheat and barley straws, corn stover and switchgrass. Biomass Bioenergy 2004, 27, 339–352. [Google Scholar] [CrossRef]
  64. Cadoche, L.; López, G.D. Assessment of size reduction as a preliminary step in the production of ethanol from lignocellulosic wastes. Biol. Wastes 1989, 30, 153–157. [Google Scholar] [CrossRef]
  65. Szepessy, S.; Thorwid, P. Low Energy Consumption of High-Speed Centrifuges. Chem. Eng. Technol. 2018, 41, 2375–2384. [Google Scholar] [CrossRef] [Green Version]
  66. Milledge, J.J.; Heaven, S. Disc Stack Centrifugation Separation and Cell Disruption of Microalgae: A Technical Note. Environ. Nat. Resour. Res. 2011, 1. [Google Scholar] [CrossRef] [Green Version]
  67. Martis, R.; Al-Othman, A.; Tawalbeh, M.; Alkasrawi, M. Energy and Economic Analysis of Date Palm Biomass Feedstock for Biofuel Production in UAE: Pyrolysis, Gasification and Fermentation. Energies 2020, 13, 5877. [Google Scholar] [CrossRef]
  68. Sotoft, L.F.; Rong, B.-G.; Christensen, K.V.; Norddahl, B. Process simulation and economical evaluation of enzymatic biodiesel production plant. Bioresour. Technol. 2010, 101, 5266–5274. [Google Scholar] [CrossRef]
  69. Peters, M.S.; Timmerhaus, K.D.; West, R.E. Plant Design and Economics for Chemical Engineers, 5th ed.; McGraw-Hill: New York, NY, USA, 2003; ISBN 9789896540821. [Google Scholar]
  70. Garrett, D.E. Chemical Engineering Economics; Springer: Dordrecht, The Netherlands, 1989; ISBN 978-94-011-6546-4. [Google Scholar]
  71. Vinet, L.; Zhedanov, A. A ‘missing’ family of classical orthogonal polynomials. J. Phys. A Math. Theor. 2011, 44, 085201. [Google Scholar] [CrossRef]
  72. Parsons, S.; Abeln, F.; McManus, M.C.; Chuck, C.J. Techno-economic analysis (TEA) of microbial oil production from waste resources as part of a biorefinery concept: Assessment at multiple scales under uncertainty. J. Chem. Technol. Biotechnol. 2019, 94, 701–711. [Google Scholar] [CrossRef]
  73. Richardson, J.W.; Johnson, M.D.; Outlaw, J.L. Economic comparison of open pond raceways to photo bio-reactors for profitable production of algae for transportation fuels in the Southwest. Algal Res. 2012, 1, 93–100. [Google Scholar] [CrossRef]
  74. Ratledge, C.; Cohen, Z. Microbial and algal oils: Do they have a future for biodiesel or as commodity oils? Lipid Technol. 2008, 20, 155–160. [Google Scholar] [CrossRef]
  75. Alabi, A.; Tampier, M.; Bibeau, E. Microalgae Technologies & Processes for Biofuels-Bioenergy Production in British Columbia: Current Technology, Suitability & Barriers to Implementation; Final Report Submitted to British Columbia Innovation Council; British Columbia Innovation Council: Vancouver, BC, Canada, 2009. [Google Scholar]
  76. Davis, R.; Aden, A.; Pienkos, P.T. Techno-economic analysis of autotrophic microalgae for fuel production. Appl. Energy 2011, 88, 3524–3531. [Google Scholar] [CrossRef]
  77. Ratledge, C.; Wynn, J.P. The Biochemistry and Molecular Biology of Lipid Accumulation in Oleaginous Microorganisms. Adv. Appl. Microb. 2002, 1–52. [Google Scholar] [CrossRef]
  78. Papanikolaou, S.; Aggelis, G. Biotechnological valorization of biodiesel derived glycerol waste through production of single cell oil and citric acid by Yarrowia lipolytica. Lipid Technol. 2009, 21, 83–87. [Google Scholar] [CrossRef]
  79. Remer, D.S.; Chai, L.H. Design cost factors for scaling-up engineering equipment. Chem. Eng. Prog. 1990, 86, 77–82. [Google Scholar]
  80. Aguado-Deblas, L.; Hidalgo-Carrillo, J.; Bautista, F.M.; Luna, D.; Luna, C.; Calero, J.; Posadillo, A.; Romero, A.A.; Estevez, R. Acetone Prospect as an Additive to Allow the Use of Castor and Sunflower Oils as Drop-In Biofuels in Diesel/Acetone/Vegetable Oil Triple Blends for Application in Diesel Engines. Molecules 2020, 25, 2935. [Google Scholar] [CrossRef]
  81. Aguado-Deblas, L.; Hidalgo-Carrillo, J.; Bautista, F.M.; Luna, C.; Calero, J.; Posadillo, A.; Romero, A.A.; Luna, D.; Estévez, R. Biofuels from Diethyl Carbonate and Vegetable Oils for Use in Triple Blends with Diesel Fuel: Effect on Performance and Smoke Emissions of a Diesel Engine. Energies 2020, 13, 6584. [Google Scholar] [CrossRef]
Figure 1. Flowsheet of feed handling and steam explosion pre-treatment as simulated using Aspen Plus.
Energies 14 01473 g001
Figure 2. Flowsheet of enzymatic hydrolysis and combustion section as simulated using Aspen Plus.
Energies 14 01473 g002
Figure 3. Flowsheet of lipid production as simulated using Aspen Plus.
Energies 14 01473 g003
Figure 4. Flowsheet of lipid extraction with chloroform–methanol mixture as simulated using Aspen Plus.
Energies 14 01473 g004
Figure 5. Flowsheet of transesterification as simulated using Aspen Plus.
Energies 14 01473 g005
Figure 6. Distribution of electricity needs expressed in MWh/y and considering an operating period of 8000 h/y.
Energies 14 01473 g006
Figure 7. Distribution of thermal needs expressed in MWh/y and considering an operating period of 8000 h/y.
Energies 14 01473 g007
Figure 8. Distribution of removed heat expressed in MWh/y and considering an operating period of 8000 h/y.
Energies 14 01473 g008
Table 1. Cardoon stalks composition used for process simulation.
ComponentComposition (Dry wt %)
Cellulose30.52
Xylan14.52
Mannan0.45
Galactan1.06
Arabinan1.15
Acetate5.02
Pectine4.67
Lignin14.21
Ash8.80
Protein3.10
Extractives16.51
Moisture (bulk wt %)15.00
Table 2. Conversion for reaction considered in the steam explosion pre-treatment (R1).
StoichiometryFractional Conversion of ComponentFractional Conversion
Cellulose + Water → Glucose Cellulose 0.041
Cellulose → HMF + 2 WaterCellulose 0.006
Xylan + Water → XyloseXylan 0.386
Xylan → Furfural + 2 WaterXylan 0.075
Mannan + Water → MannoseMannan 0.386
Mannan → HMF + 2 WaterMannan 0.010
Galactan + Water → GalactoseGalactan 0.386
Galactan → HMF + 2 WaterGalactan 0.010
Arabinan + Water → ArabinoseArabinan 0.386
Arabinan → Furfural + 2 WaterArabinan 0.075
Acetate → Acetic AcidAcetate 1.000
Lignin → Soluble LigninLignin0.050
Steam explosion pre-treatment at 172 °C, 7 atm, and at 10 min of residence time.
Table 3. Conversion for reaction considered in the neutralization (R2) and in the re-acidification (R3) processes.
StoichiometryFractional Conversion of ComponentFractional Conversion
Acetic Acid + Ammonia → Ammonium-AcetateAcetic Acid 0.037
Sulfuric Acid + 2 Ammonia → Ammonium-SulfateSulfuric Acid 0.041
Arabinose → TARArabinose 0.006
Galactose → 1.2 TARGalactose 0.356
Mannose → 1.2 TARMannose 0.386
Sulfuric Acid + 2 Ammonia → Ammonium-SulfateAmmonia1.000
Neutralization process at 75 °C and 5 atm. Re-acidification process at 65 °C and 5 atm.
Table 4. Conversion for reaction considered in the enzymatic hydrolysis (R4).
StoichiometryFractional Conversion of ComponentFractional Conversion
Cellulose + Water → GlucoseCellulose0.739
Xylan + Water → XyloseXylan0.748
Mannan + Water → MannoseMannan0.748
Galactan + Water → GalactoseGalactan0.748
Arabinan + Water → ArabinoseArabinan0.748
Enzymatic hydrolysis at 50 °C, 1 atm, and 48 h of residence time.
Table 5. Conversion for reaction considered in the lipid fermentation (R6); these reactions occur in series.
StoichiometryFractional Conversion of ComponentFractional Conversion
Glucose + 3.41 Oxygen + 0.52 Aminoacids → 1.12 Microbial Biomass + 3.75 Carb. Dioxide + 4.41 Water + 0.01 TrioleinGlucose0.230
Xylose + 2.41 Oxygen + 0.52 Aminoacids → 1.12 Microbial Biomass + 2.75 Carb. Dioxide + 3.41 Water + 0.01 TrioleinXylose0.190
Glucose + 1.2 Oxygen → 0.06 Triolein + 2.58 Carb. Dioxide + 2.88 WaterGlucose0.510
Xylose + 0.2 Oxygen → 0.06 Triolein + 1.58 Carb. Dioxide + 1.88 WaterXylose0.420
Microbial growth and lipid accumulation at 25 °C, 1 atm, and 168 h of residence time.
Table 6. Conversion for reaction considered in the transesterification (R8) and neutralization of catalyst (R9).
StoichiometryFractional Conversion of ComponentFractional Conversion
Triolein + 3 Chloroform → 3 M. Oleate + GlycerolTriolein0.981
3 Sod. Hydroxide + Phosp. Acid → Tris. Phospate + 3 WaterSod. Hydroxide1.000
Transesterification at 70 °C and 1 atm. Neutralization of catalyst at 50 °C and 1 atm.
Table 7. Summary of energetic requirements satisfied with the heat of combustion.
Aspen Plus BlockHeat Duty (MWh/y)
R12610
R22202
R4838
R913
COL-1 (Reboiler)1826
COL-2 (Reboiler)80
COL-3 (Reboiler)115
COL-4 (Reboiler)210
Total7894
Table 8. Summary of energetic requirements satisfied with the utilities.
Aspen Plus BlockUtility IDUtility Duty (MWh/y)
R3Cooling water318.4
R8Cooling water6.4
COL-1 (Condenser)Cooling water1515
COL-2 (Condenser)Cooling water59.2
COL-3 (Condenser)Cooling water108
COL-4 (Condenser)Cooling water22.9
CEX3Cooling water183.2
CEX4Cooling water2.4
CEX5Cooling water13.6
R6Refrigerant 14691
R7Refrigerant 1108
CEX1Refrigerant 1406
CEX2Refrigerant 185.9
Table 9. Project cost worksheet including total direct costs and total capital investment expressed in USD.
Equipment purchased cost4,836,000
Equipment installed cost7,737,600
Total direct costs (TDC)7,737,600
Prorateable expenses (10% of TDC)773,760
Field expenses (10% of TDC)773,760
Home office and construction fee (20% of TDC)1,547,520
Project contingency (10% of TDC)773,760
Other costs (10% of TDC)773,760
Total indirect costs (TIC)4,642,560
Fixed capital investment (FCI)12,380,160
Working capital (5% of FCI)619,008
Total capital investment (TCI)12,999,168
Table 10. Utilities used in the bio-refinery process.
Utilities Utility CostCost UnitRateRate UnitCost Per Hour (USD/h)
Cooling water2.12 × 10−7 USD/kJ813,395kJ/h0.17
Refrigerant 12.71 × 10⁻⁶USD/kJ209,811kJ/h0.57
Total utilities cost (USD/year) = 5920.
Table 11. Raw materials and byproduct prices.
Raw MaterialAmount (t/y)Unit Cost (USD/t)Total Cost (kUSD/y)
Biomass d10,00040400
Sulfuric acid b233.76715.7
Ammonia b136506.8
Enzyme d6.6300019.8
Amino acids c250.4800200.3
Methanol b80.921117.1
Chloroform b8.32111.8
Sodium hydroxide b4.44952.1
Potassium hydroxide b9.768908.7
Phosphoric acid b3.58042.8
Process water b55,1360.2011.1
Air7272--
By-product
Glycerol a 41.6150062.4
Trisodium phosphate a5.95002.9
Waste treatment
Liquid c62,4880.106.2
a [27], b [42], c [53], d vendor quotation.
Table 12. Total production and fixed costs of biodiesel expressed in USD/year.
Utilities266,720
Raw materials386,200
Labor and supervision800,000
Maintenance210,384
Operating charges200,000
Plant overhead50,519
General and Administration100,872
Total production cost (TPC)2,014,695
Depreciation (10% of TCI)1,299,917
Taxes (15% of TCI)1,949,875
Total fixed costs (FC)3,249,792
Byproduct sales (BS)91,600
Manufacturing costs (MC)5,199,187
Publisher’s Note: MDPI stays neutral with regard to jurisdictional claims in published maps and institutional affiliations.

