
A New Method of Regulating the Cooling Capacity of a Cooling System with CO2


1
Department of Thermal and Fluid Flow Machines, Faculty of Energy and Fuels, AGH University of Science and Technology, Mickiewicza 30 Av., 30-059 Cracow, Poland
2
Division of Refrigeration and Air Conditioning, Institute of Thermal and Process Engineering, Faculty of Mechanical Engineering, Cracow University of Technology, Jana Pawla II 37 Av., 31-864 Cracow, Poland
*
Author to whom correspondence should be addressed.
Energies 2021, 14(7), 1922; https://0-doi-org.brum.beds.ac.uk/10.3390/en14071922
Submission received: 28 February 2021
/
Revised: 19 March 2021
/
Accepted: 29 March 2021
/
Published: 31 March 2021
(This article belongs to the Special Issue Alternative and Emerging Cooling and Heating Technologies)
Abstract
:New guidelines set by international organizations for refrigeration companies cause that natural working fluids such as carbon dioxide are increasingly used in new refrigeration systems. Carbon dioxide (R-744) is used in freezing, cooling, or air conditioning installations, in which the cooling load fluctuates hourly. To adapt the cooling capacity of the evaporator to the current cooling load of the cooled space, a number of control elements are used. The paper proposes a new method of regulating the cooling capacity for a one-stage refrigeration cycle with the R-744 refrigerant and an internal heat exchanger (IHX). The proposed method involves using an additional evaporator and combines the possibility of regulating the cooling capacity with the possibility of energy efficiency ratio (EER) improvement. The energy analysis of the proposed method of regulating the cooling capacity was performed and the results were compared with the control method. The control method was using the compressor hot gas bypass valve which allows the flow of hot vapor refrigerant to the suction side. The energy analysis was carried out for both subcritical and supercritical cycles using the energy equations. For each of the considered methods, the characteristics of the change in the EER as a function of the reduction of the cooling capacity in both supercritical and subcritical cycles were determined. It was found that when the cooling capacity decreased by 50%, the hot gas bypass regulating method was around 30% less efficient compared to the proposed additional evaporator regulating method.
1. Introduction
Environmental problems associated with the operation of refrigeration systems with synthetic refrigerants inspire scientists around the world to look for alternative technologies to fluorinated greenhouse gases (F-gases) [1,2]. Natural refrigerants such as ammonia, hydrocarbons (butane, propane, isobutane), or carbon dioxide attract attention because of their insignificant environmental impact compared to synthetic refrigerants [3]. The use of fluorinated gases has been limited, while cooling systems often use indirect working fluids such as chilled water, slurry ice, or cold storage systems based, for example, on phase change materials [4].
1.1. Carbon Dioxide as a Refrigerant
Among the natural refrigerants, carbon dioxide, known as R-744, which was first proposed as a refrigerant in the 19th century, is very popular among scientists [5]. CO2 is a non-toxic and non-flammable gas, which is environmentally friendly and therefore does not cause serious problems during the operation of refrigeration equipment [6,7]. Additionally, carbon dioxide from fossil fuel combustion may be used in cooling systems. In this way, CO2 emissions to the atmosphere, which have been increasing in recent years as a result of increased demand for electricity, can be reduced [8]. Despite no adverse environmental impact, carbon dioxide as a refrigerant causes technical problems, mainly due to the high pressures occurring in the system. Thus, systems with CO2 require special materials that are resistant to high pressures.
The pressure in the high-temperature heat exchanger is the main factor influencing the energy efficiency ratio (EER) of transcritical carbon dioxide cooling systems. The EER is the ratio of a refrigeration system’s cooling capacity to the power of a compressor. Thus, the high CO2 pressure at the high-temperature heat exchanger should be controlled to maximize the EER [9,10]. In recent years, numerous thermodynamic analyses of transcritical installations with carbon dioxide, aimed at suggesting the optimal operating conditions for such installations, have been carried out [11,12,13]. Ge and Tassou [14] reported that the optimal pressure in the gas cooler, i.e., the pressure for which the EER reaches its maximum value, depends on the ambient air temperature, as shown in Figure 1. As can be seen, the EER increases with decreasing ambient air temperature for a given gas cooler pressure. Additionally, when the ambient air temperature decreases, lower values of the pressure are optimal to obtain maximum EER. Therefore, it is desirable to cool down the cooling air before it enters the gas cooler [15].
Another problem with using CO2 is connected with its critical point parameters. The critical temperature of CO2 is about 31 °C at 73.8 bar, so at a temperature of the upper heat source greater than 31 °C, the carbon dioxide is in a supercritical state. As a result, the condensation cannot take place in the high-pressure heat exchanger, which significantly decreases the performance, in terms of EER, of the entire system [16]. Thus, scientists have proposed numerous methods of increasing the EER. One of them is mechanical subcooling, which involves placing subcooling equipment after the gas cooler to cool down the R-744 flowing from the gas cooler [17]. Consequently, the R-744 goes to an evaporator with a lower vapor quality, which results in an improvement of the system efficiency. Sánchez et al. [18] reported that using mechanical subcooling can improve the coefficient of performance (COP) of the carbon dioxide transcritical cooling system by 16.1% compared to the system without any improvements. Another possibility of increasing the efficiency is using the internal heat exchanger (IHX), which can improve the EER by 6.2% compared to a traditional carbon dioxide transcritical cooling system [18]. Using both, the mechanical subcooling and IHX allows reducing the temperature of the refrigerant exiting the gas cooler, which results in higher efficiency of the system. However, some methods focus on decreasing the irreversibility of the refrigeration cycle. These methods include for example using a multi-ejector [19] or vortex tube [20] instead of a traditional expansion valve.
1.2. Methods of Regulating Cooling Capacity and Their Influence on EER
The results of scientific studies and the application of new technical solutions have increased the interest in the popularity of CO2 as a refrigerant [21,22,23]. CO2 is used in cooling installations in supermarkets, air-conditioned rooms, vehicles air conditioning systems [24,25,26], as well as in heating installations with heat pumps [27]. Regardless of the application, refrigeration systems with carbon dioxide, similarly to typical refrigeration systems, undergo constant thermal fluctuations on the low-temperature side of the system, which is a consequence of thermal conditions changes in a cooled space [28]. Changing the cooling load of refrigerated rooms results from various factors, including variations in hourly, daily, and seasonal outdoor temperature, the cooled space, or unintentional heat gains. Therefore, the operation time of refrigeration devices with full cooling capacity load is not constant and is usually a small part of the compressor’s operating time. To limit the maximum thermal power of the evaporator, it is possible to use different regulation systems and methods in order to adapt the power of the lower heat exchanger to the current cooling load [29,30,31]. Some of them do not regulate the compressor capacity, which means that the compressor maintains maximum power despite the reduced cooling load. This solution adversely affects the EER, which also translates into low cost-effectiveness [32,33,34].
Most often, the cooling capacity is regulated by changing the compressor capacity stepwise or continuous ways. The stepwise regulation methods include the ON/OFF method involving switching off individual cylinders of the piston compressor or a method based on the use of variable-speed engines. The continuous regulation of compressor capacity involves adjusting the rotational speed of the compressor by using a frequency inverter or feeding hot refrigerant to the suction or intake side of the compressor. The compressor capacity control allows reducing its energy consumption, which, with a reduced thermal load of the evaporator, allows increasing the EER. With a decrease in thermal efficiency, not all of these methods limit the power consumption of the compressor, which makes them economically unviable. Limiting the consumption of electricity is important in the context of constant changes in the regulations regarding the production and distribution of electrical power [35].
As shown in Section 1.1 and Section 1.2, the studies available in the open literature focus either on improving the EER or on regulating the cooling capacity of transcritical CO2 cooling systems. Therefore, this paper proposes and describes a new method of regulating a cooling capacity of a transcritical carbon dioxide refrigeration system. The proposed method combines the possibility of regulating the cooling capacity with the improvement of the EER by using an additional evaporator. Using the additional evaporator allows not only regulating the cooling capacity but also decreasing the ambient air temperature, which positively impacts the EER, which in turn, may have some applied value for the cooling industry. The proposed method is investigated theoretically and compared with an exemplary cooling capacity regulation system, i.e., compressor bypass, which, to the best of the authors’ knowledge, has not been done before. Of course, modeling of energy processes can be performed with the use of special application software as shown for example in the works [36,37,38]. However, in this work, the calculations for the considered methods of regulating the cooling capacity are performed using the energy conservation equations.
2. System Description
2.1. Installation with a Hot Gas Bypass Valve
One of the methods of continuous regulation of cooling capacity is the hot gas bypass method based on the feed of hot refrigerant to the suction side. This method allows regulating the mass flow rate of the refrigerant passing through the evaporator. The use of the hot gas bypass valve in a transcritical cooling system with a medium temperature (MT) evaporator and an internal heat exchanger (IHX) is shown in Figure 2.
The working principle of the system shown in Figure 2 is as follows. In the case of a full cooling load, the bypass valve is closed and all refrigerant flows through the compressor. As a result, the pressure, temperature, and enthalpy of the refrigerant increases. Then, the refrigerant is cooled down under constant pressure first in the gas cooler by ambient air, then in the IHX by giving off heat to the refrigerant flowing from the MT evaporator. Next, the pressure of the cooled refrigerant is reduced to the intermediate value by the expansion valve and the refrigerant flows to the receiver. In the case of the subcritical cycle, the refrigerant is in a liquid phase due to large overcooling obtained in the gas cooler and IHX, and thus the dry vapor refrigerant mass flow rate equals zero. As a result, all refrigerant flows through the expansion valve to the MT evaporator and then to the IHX, and the cycle is complete. If the system works in the supercritical cycle, the refrigerant is separated into gas and liquid phases in the receiver. The liquid-phase refrigerant is expanded to the evaporation pressure and flows through the MT evaporator. The refrigerant from the MT evaporator is combined with the expanded dry vapor refrigerant, and the cycle is complete.
In the case of the reduced cooling load, the working principle is the same as in the case of full cooling load, but a part of the hot refrigerant mass flow rate after passing the compressor is expanded in the hot gas bypass valve and directed to the suction side, where it connects with the refrigerant flowing from the evaporator. In this case, the refrigerant mass flow rate passing through the other devices of the installation, except the compressor, is lower. As a result of the decreased mass flow rate of the medium flowing through the evaporator, its thermal power decreases. At the same time, the compressor performs the same or more work. The effect of applying the above regulation method is a significant reduction in the value of the EER in relation to its initial value (without bypass). This method is often used as compressor protection against a sudden drop in suction pressure, especially during the start-up of the installation, which protects the compressor against being shut down due to the low-pressure switch being triggered. However, when using this method for continuous regulation of the cooling load, it can be observed that the power of the compressor does not decrease with the cooling capacity, which significantly reduces the EER.
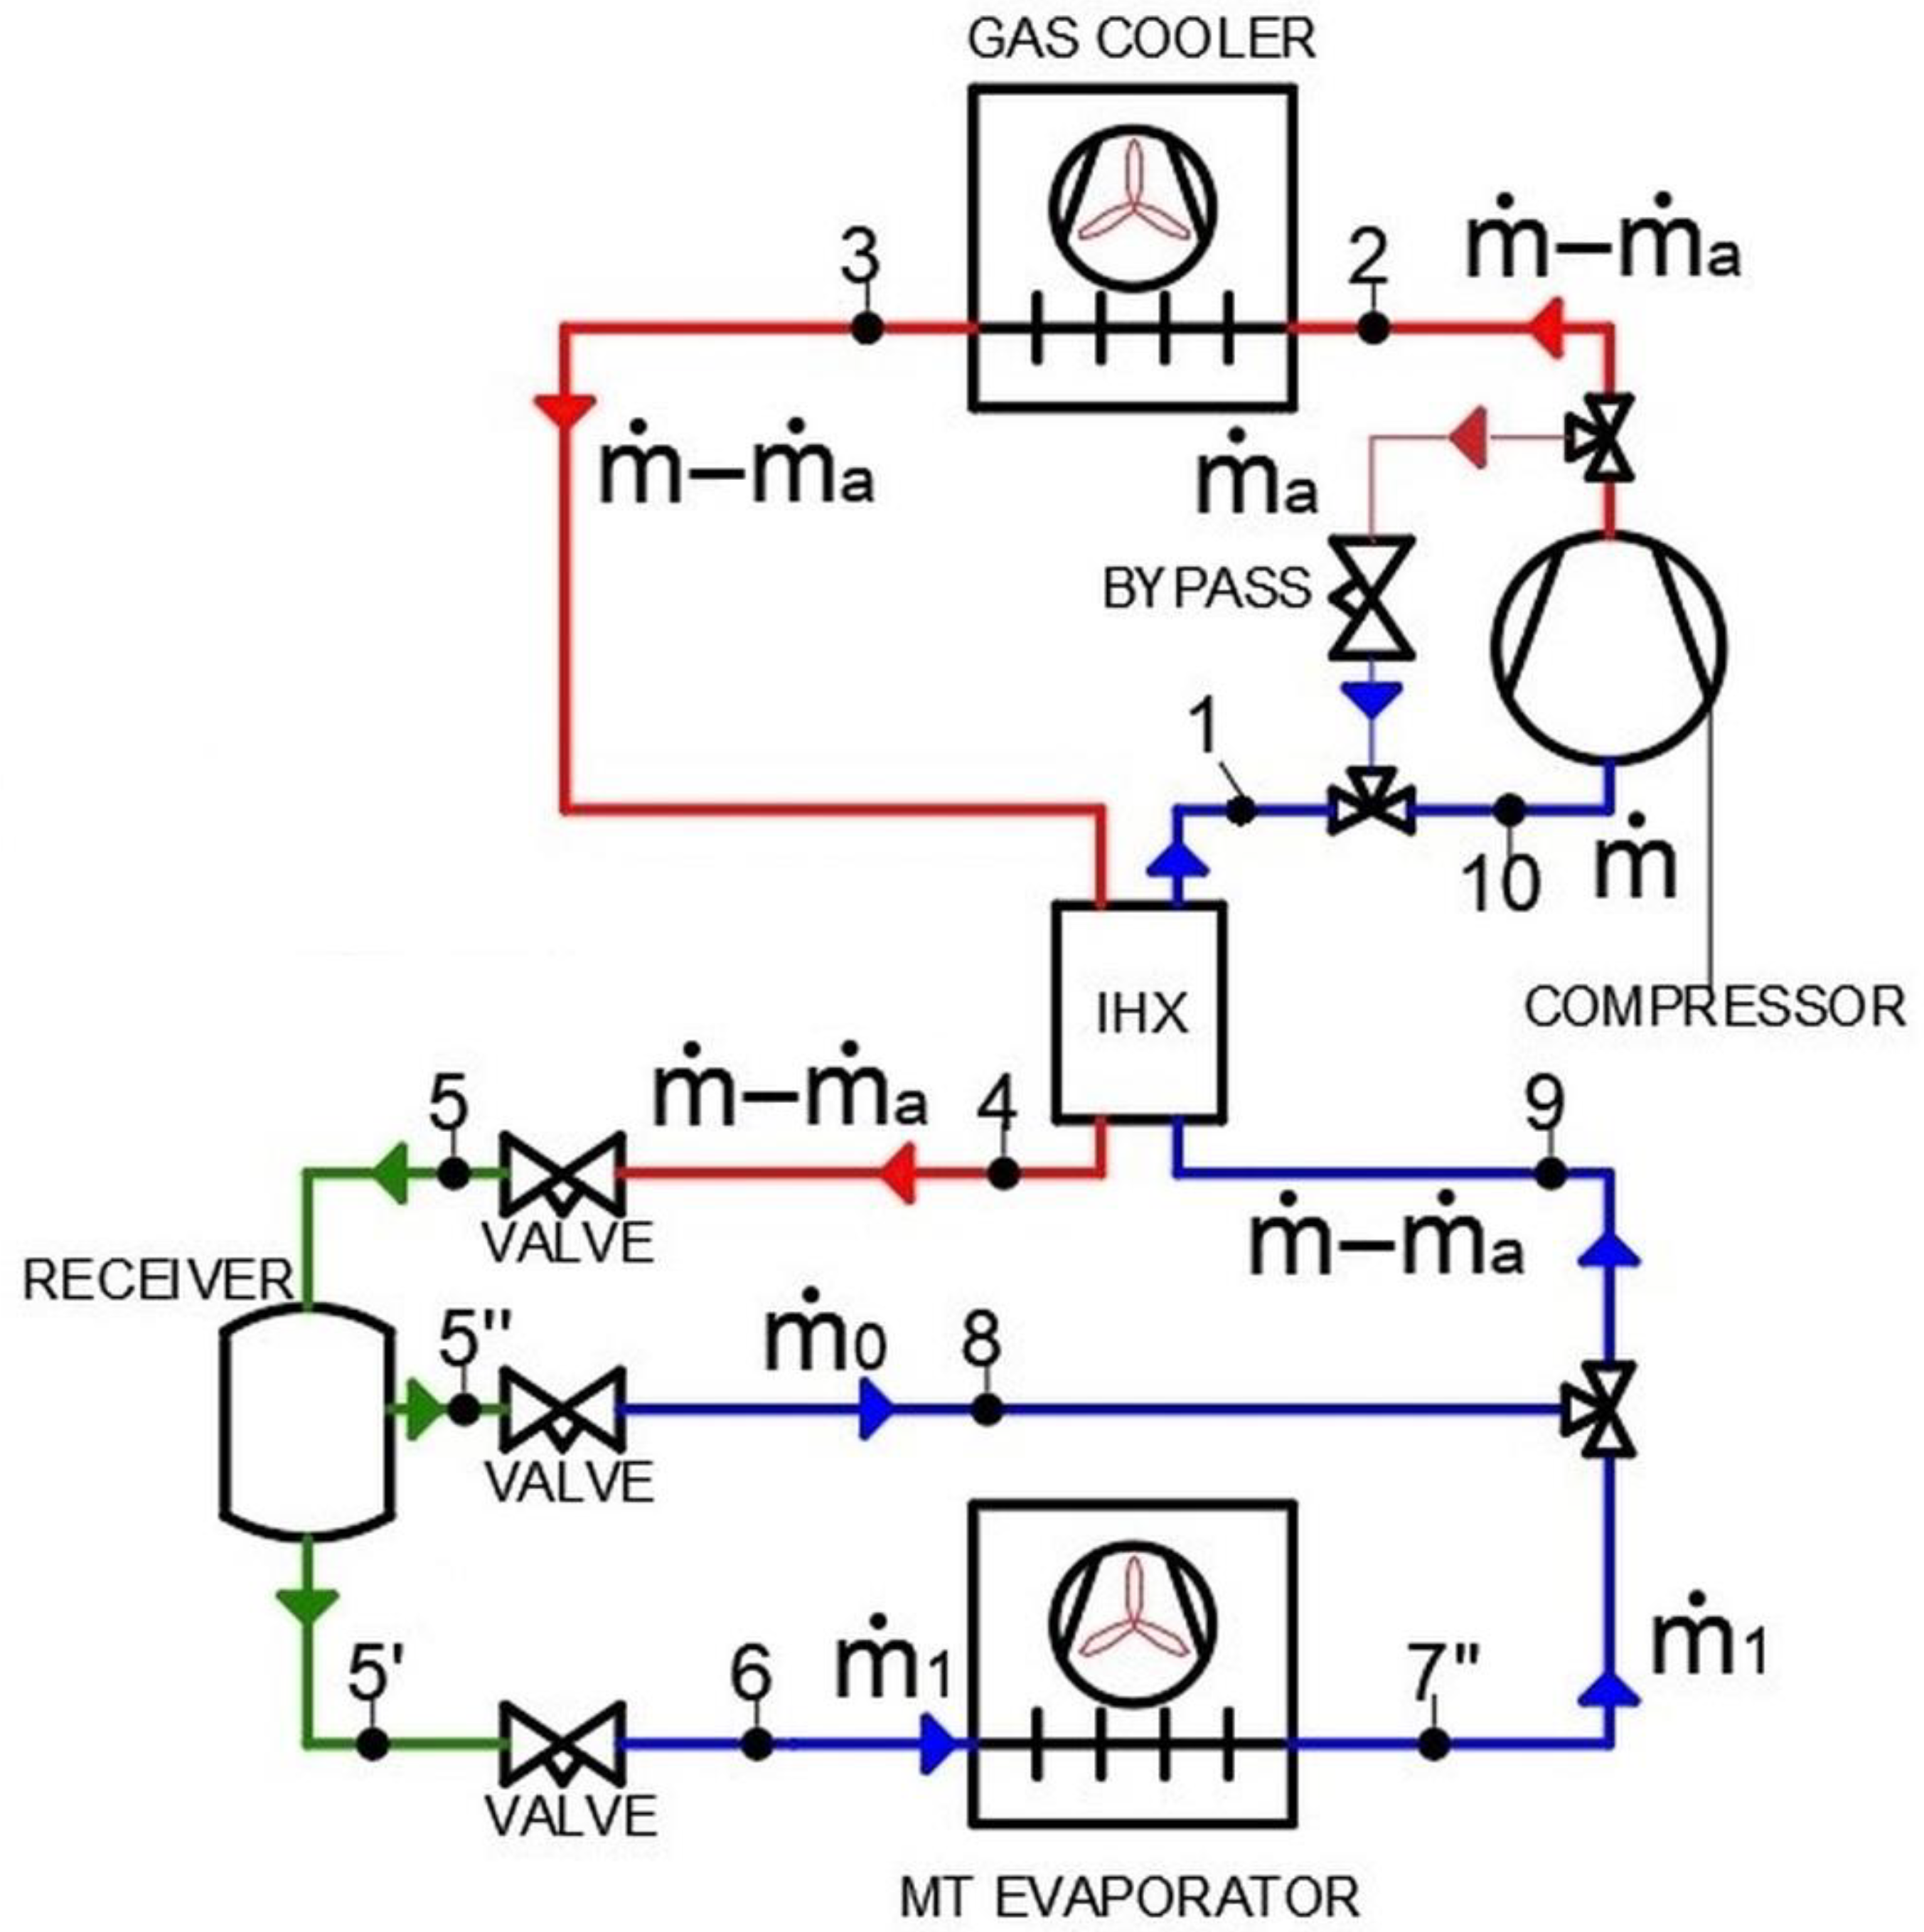
2.2. Installation with an Additional Evaporator—Air Cooler
An alternative method of regulating the cooling capacity is to use an additional evaporator (air cooler), which is shown in Figure 3. This method of regulation involves using the difference between the maximum and instantaneous cooling capacity. If the system works with a full cooling load, all refrigerant flows through the MT evaporator. The working principle of the system shown in Figure 3 is then the same as the working principle of the system from Figure 2 operating with a full load, which is described in detail in Section 2.1.
During a reduced cooling load, a part of the refrigerant at evaporating pressure (point 6 in Figure 3) is directed through the three-way valve to the additional evaporator, where evaporates, cooling the ambient air. The cooled ambient air is then directed to the gas cooler/condenser. At the same time, the rest of the refrigerant flows through the MT evaporator, providing a useful cooling capacity. The ratio of the refrigerant mass flow rate flowing through the additional evaporator to the refrigerant mass flow rate flowing through the MT evaporator depends on the required cooling capacity, i.e., as the cooling capacity decreases, the more refrigerant flows through the additional evaporator. Nevertheless, after the evaporation process is completed, the carbon dioxide from both evaporators, i.e., the additional and MT evaporator, are combined and the cycle is finished. As a result of using the additional evaporator, air cooling the gas cooler possess lower temperature. The lower temperature of the upper heat source allows condensation or cooling of the refrigerant at lower pressure values, which translates into reduced compressor power. The value of high pressure in the upper heat source is of particular importance for a system with carbon dioxide, where it can reach values of up to around 100 bar. Therefore, the advantage of this method of regulating cooling systems with CO2 is not only reducing the compressor power but also reducing the pressure value during the compression process.
In the installation with the additional evaporator, as in the hot gas bypass method, the cooling regulation is carried out by changing the value of the mass flow rate of CO2 passing through the evaporator, which should be proportional to the current cooling load. In the additional evaporator, the mass flow rate of the working medium ma is used to cool down the ambient air. The cooled air has a lower temperature compared to the original value, which translates into a lowering of the pressure on the high-temperature side of the system. By using this method, one can expect a reduction in the required compressor power and a decrease in cooling capacity. Consequently, the EER should decrease to a much lesser value compared to the compressor bypass method.
On the other hand, the additional evaporator regulation method requires using supplementary equipment, i.e., the additional evaporator and an additional fan. The fan is aimed to force the flow of the air through the additional evaporator. Thus, it complicates the whole installation and it should be remembered that the fan needs to be powered. Hence, before installing an additional evaporator in a cooling system, a thorough analysis of the individual case is required to make sure that the benefits resulting from installing an additional evaporator outweigh the losses.
3. Computational Model
3.1. Initial Conditions
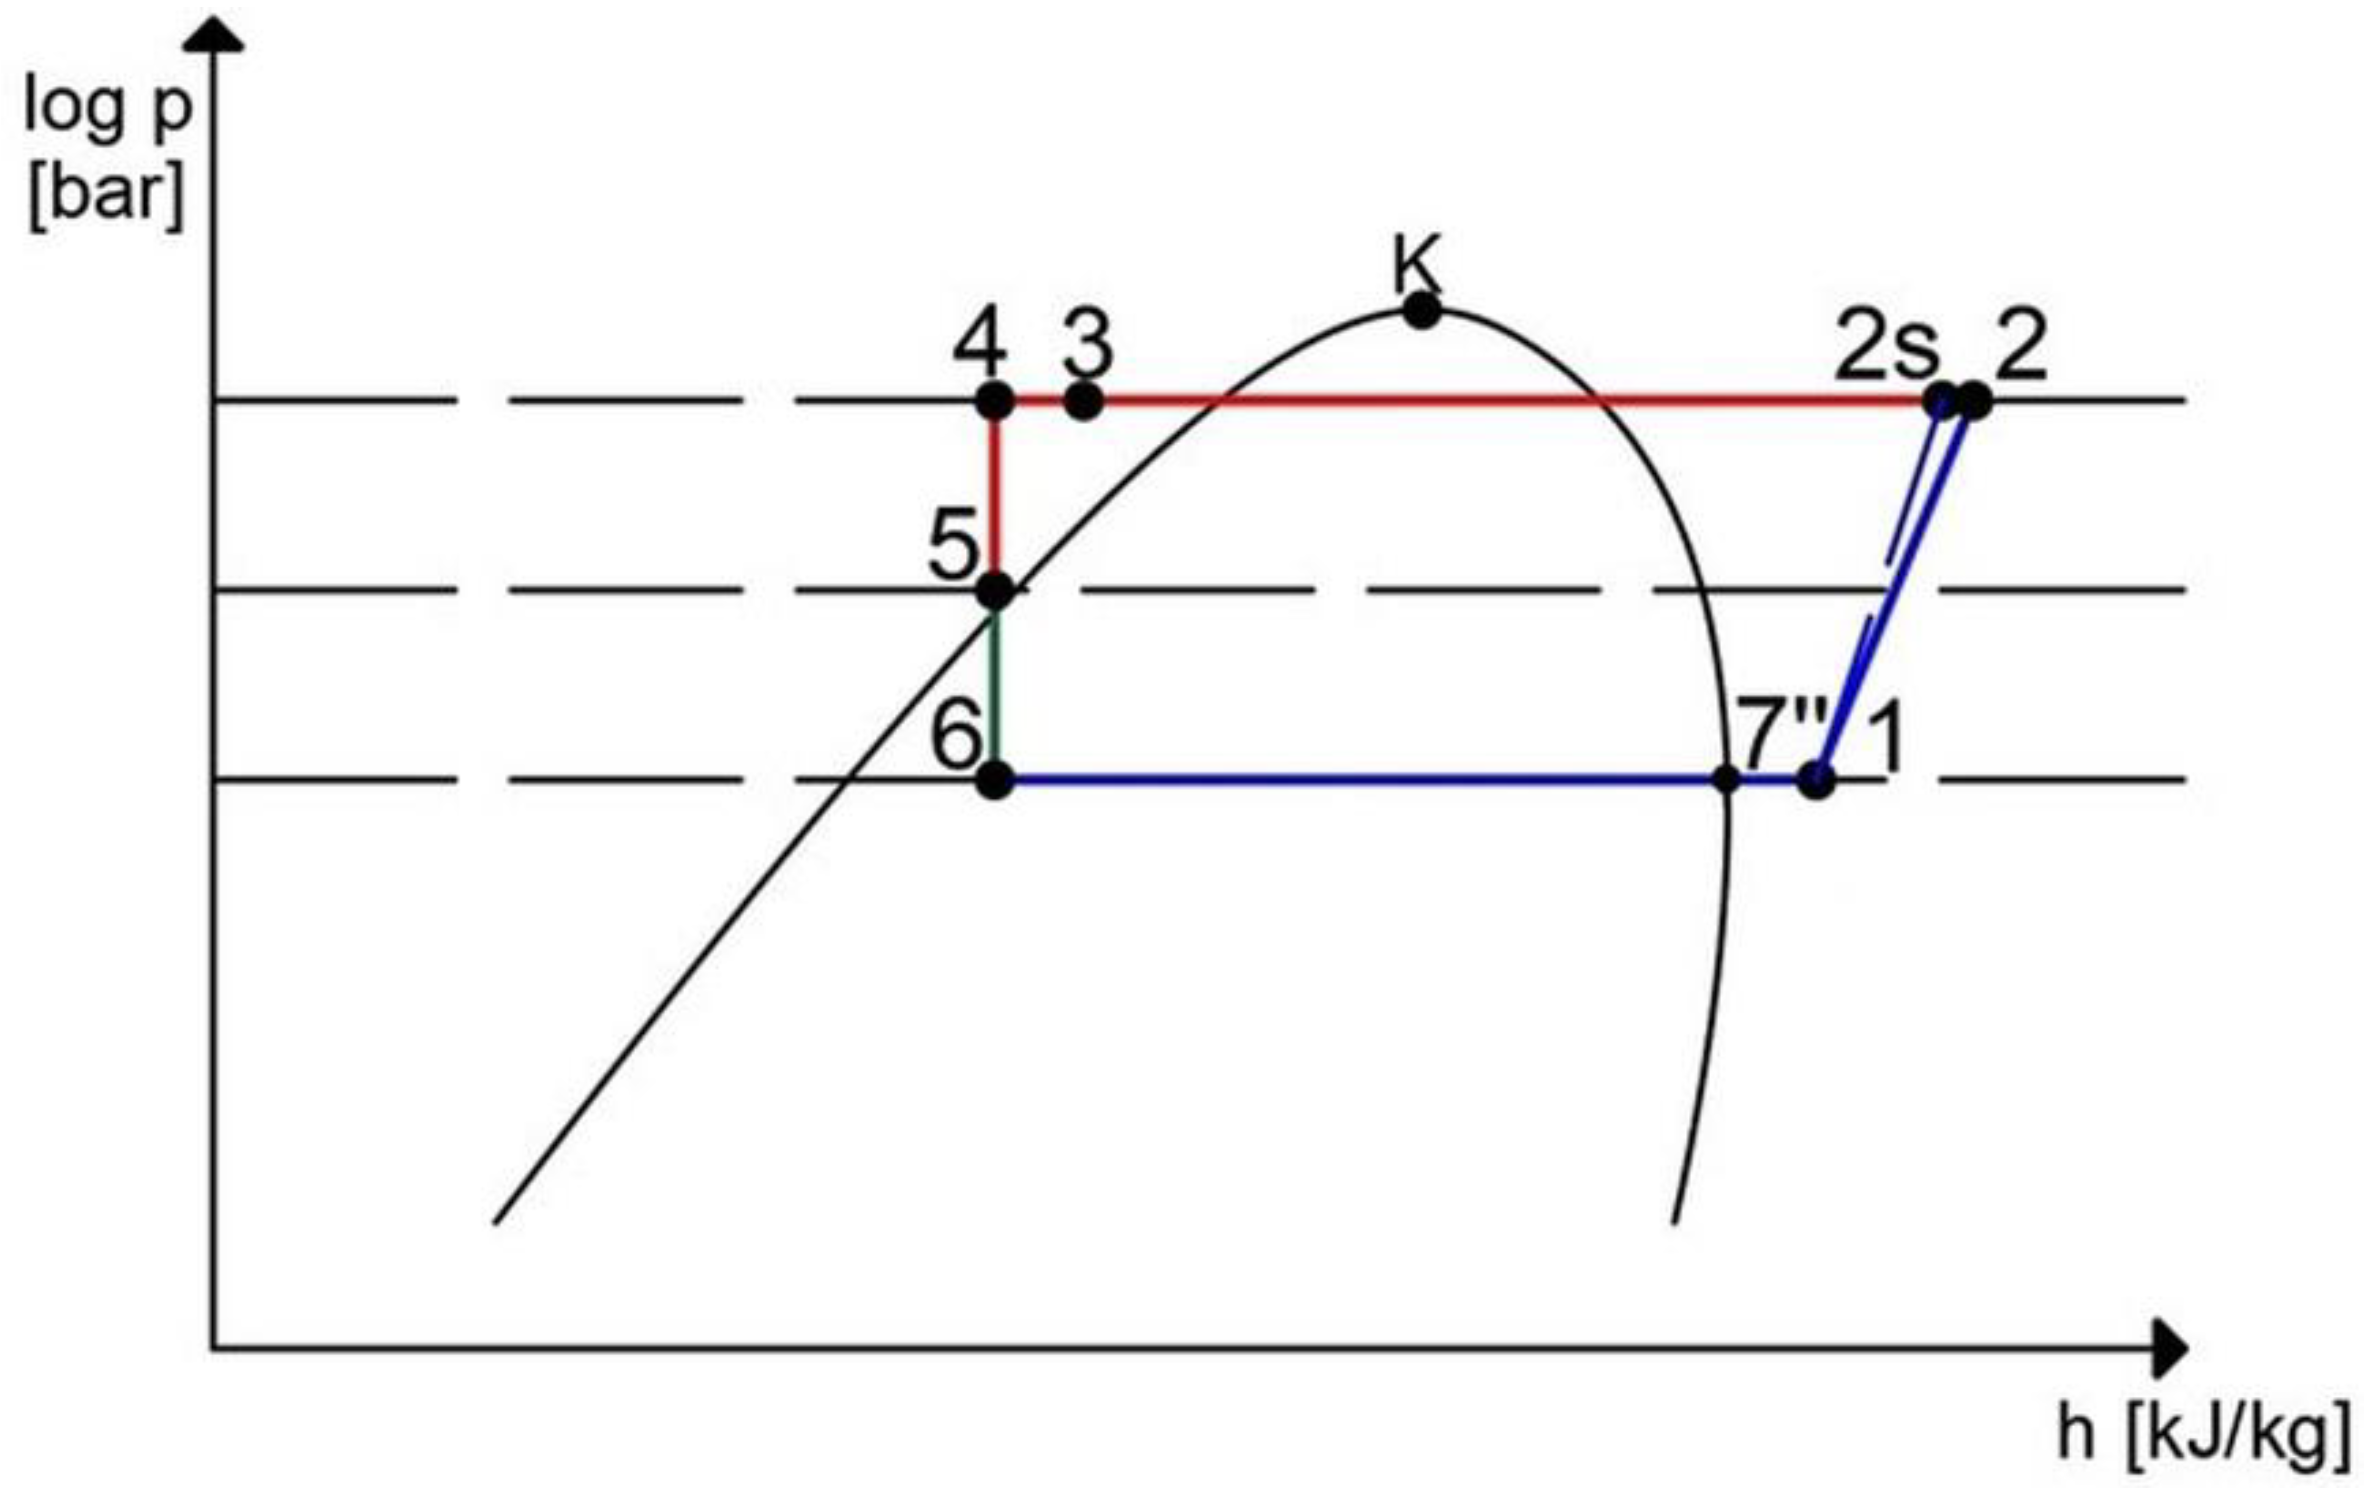
The analysis of cooling capacity regulation methods for previously described refrigeration systems is carried out for the subcritical and supercritical cycles. In the subcritical cycle, the initial ambient air temperature is 15 °C, while in the supercritical cycle 35 °C. The subcritical and supercritical circuits under consideration are presented in Figure 4 and Figure 5, respectively, using the log(p)-h graphs.
Figure 4 and Figure 5 show the distribution of individual characteristic points whose location results from the thermodynamic changes of the refrigerant occurring in the refrigeration device. It should be noted that both Figure 4 and Figure 5 relate to Figure 2, as well as Figure 3, wherein Figure 4 concerns the operation of the systems in a subcritical cycle, while Figure 5 concerns the systems working in a supercritical cycle. In the subcritical cycle, a large overcooling of the refrigerant is used in the IHX exchanger, which means that after the expansion of the medium to an intermediate pressure it remains in the liquid phase, and in the liquid container, there is no phase separation into the gas and liquid phase. The energy analysis of the cooling capacity regulation systems for the subcritical and supercritical cycles is performed based on the following assumptions.
The evaporating temperature t0 and the evaporating pressure p0 remain constant during the regulation process. The intermediate pressure pIP in the receiver remains constant at 45 bar. When regulating the cooling capacity using an additional evaporator, the high pressure of carbon dioxide pk changes in proportion to the ambient air temperature tair at the inlet of the gas cooler. During the regulation of the cooling capacity using a compressor bypass, the parameters of the upper and the lower heat source remain constant (it was assumed that the air mass flow rate is regulated by the fan speed and its value is proportional to the mass of CO2 in the heat exchanger). The enthalpy h of the refrigerant before and after the compressor changes. In each of the analyzed cases, the temperature of the refrigerant leaving the gas cooler/condenser is 5K higher than the ambient air temperature. The unit heat flow qIHX in the IHX remains constant. The vapor quality x of the CO2 at pIP pressure is dependent on the refrigerant temperature at the outlet of the IHX. When regulating the cooling capacity using the additional heat exchanger, the enthalpy of the refrigerant before the compressor remains constant. The change in the enthalpy h9 resulting from the mixing of the enthalpy flows, h7″ and h8, is not taken into account. The air mass flow rate cooling the gas cooler contains a constant amount of moisture. Table 1 presents the initial parameters of the cooling system with carbon dioxide for the ambient air temperature of 15 and 35 °C.
3.2. Energy Equations for a Cooling Capacity Regulation Method with the Additional Evaporator
The total mass flow rate of refrigerant compressed in the compressor is the sum of the refrigerant mass flow rate passing through the evaporator and the mass flow rate of saturated vapor from the refrigerant receiver, as shown in Equation (1):
The mass flow rate of dry saturated vapor is dependent on the vapor quality of the CO2 wet vapor after expansion to the pIP pressure of 45 bar and the mass flow rate passing through the evaporator. This relationship is described by Equation (2):
The vapor quality x varies with the temperature of the refrigerant flowing out of the IHX. As described in Section 2.2, if the cooling load decreases, a part of the refrigerant flows through the additional evaporator cooling the ambient air. As a result of the lower ambient air temperature, the temperature of CO2 changes at the outlet of the gas cooler and the IHX exchanger. The lower temperature of the refrigerant before the expansion valve causes the refrigerant to expand to lower CO2 vapor quality. The calculations assume that the mass flow rate of the refrigerant in the evaporator remains constant for a given cooling capacity. Therefore, in order to maintain constant pressure in the receiver, the received amount of dry saturated vapor should be proportional to the vapor quality. If the working medium is sufficiently cooled, after being expanded from high pressure (HP) to intermediate pressure (IP), the refrigerant remains in the liquid phase, and thus = 0.
The initial cooling capacity Q0 is proportional to the amount of mass flow rate of the refrigerant passing through the evaporator. The cooling capacity at the start of the process is expressed by Equation (3):
The h in both Equation (3) and any other suitable equation is the enthalpy of the refrigerant at the characteristic point defined in Figure 2, Figure 3, Figure 4 and Figure 5.
The compressor power Nc needed to compress the refrigerant is expressed by Equation (4):
In the ideal Linde refrigeration cycle, it is assumed that refrigerant compression in the refrigeration compressors is an isentropic process. In fact, the compression is accompanied by an increase in entropy, e.g., as a result of the friction of the compressor’s pistons against the cylinder wall and the supply of heat from the hot walls of the cylinder to the refrigerant. To determine the enthalpy of the refrigerant at the outlet from the compressor, the isentropic efficiency ηis of the process should be determined. This efficiency is described using Equation (5) [14]:
where Rp is determined as the ratio of the discharge pressure to the compressor suction pressure. The actual enthalpy at the end of the compression process is determined by Equation (6):
The paper assumes that the high pressure of carbon dioxide on the gas cooler side is correlated with the ambient air temperature. The calculations assume that the ambient air temperature corresponds to the air temperature at the inlet to the gas cooler, while changes in the ambient air temperature, resulting from cooling the air by the additional heat exchanger, cause a change in the pressure (in bar) in the gas cooler in accordance with Equation (7) [14]:
Equation (7) was created by optimizing the high pressure at the high-temperature heat exchanger and was described by Ge and Tassou [14]. In the model, it is assumed that in each analyzed case the system achieves the optimum value of high pressure in accordance with the Equation (7).
When the thermal load is reduced, a part of the refrigerant mass flow rate from the MT evaporator is passed through the additional evaporator (air cooler), where evaporates and lowers the temperature of the ambient air entering the gas cooler. The air temperature tair,out at the inlet to the gas cooler is calculated from the conservation of energy of the additional evaporator and is given by Equation (8):
where tair,in tair,out, Qi, , and cp is the ambient air temperature at the inlet to the additional evaporator (°C), the ambient air temperature at the outlet from the additional evaporator and entering the gas cooler (°C), cooling load decrease (W), air mass flow rate (kg/s), and air specific heat capacity (J/(kgK)), respectively. The specific heat capacity of air is assumed to be 1000 J/(kgK). The cooling load decrease Qi is proportional to the mass flow rate of the refrigerant flowing through the additional evaporator. For the adopted assumptions, the cooling load decrease is calculated from Equation (9):
The coefficient a is defined as the ratio of the cooling load decrease Qi to the nominal cooling load Q0. Parameter a can have values from the interval <0; 1>, where the value 0 corresponds to the nominal conditions of the refrigeration system. The value “1” means feeding the whole refrigerant stream to the additional evaporator, which hypothetically translates into inhibition of the heat dissipation process from the cooled environment.
As a result of the decrease in air temperature at the inlet of the gas cooler, the high pressure of carbon dioxide decreases in accordance with the Equation (7). The compressor power Nc,i after reducing the cooling load by Qi is calculated using Equation (10):
The enthalpy at the end of the compression process h2,i is dependent on the high pressure of carbon dioxide and calculated for each analyzed case of cooling capacity reduction. The energy efficiency ratio (EER) is defined as the ratio of the heat supplied to the evaporator to the power of the compressor. At the initial moment, the EER for each analyzed condition is described by Equation (11):
As a result of the reduction of cooling capacity by Qi and the decrease of compressor power, the EERi is described by Equation (12):
A relative decrease in compressor power due to the lowering of the air temperature, relative to the compressor’s initial power, is described by Equation (13):
The relative change in the EER after reducing the refrigerating load, relative to the initial value is given by Equation (14):
3.3. Energy Equations for a Cooling Capacity Regulation Method with the Hot Gas Bypass Valve
Energy conservation equations for the regulating system with a bypass valve are less complicated compared to the system with the additional evaporator. As a result of the mixing of the hot refrigerant vapors with the refrigerant from the evaporator, the temperature and enthalpy of the refrigerant before and after the compressor increases. It should be remembered that the temperature of the refrigerant before the compressor should not be too high because the temperature of the CO2 during the compression process may reach a very high value, which may even damage the system. The calculations assume that the remaining parameters of the system, listed in Table 1, remain constant.
The power of the compressor, resulting from the reduction of the cooling load by Qi, is calculated using Equation (15):
The enthalpy at point 2 changes as a result of shifting the point 10, which results from the mixing of the mass flow rates and during the regulation of the cooling capacity. Enthalpy h10, which corresponds to the enthalpy at the suction line, is calculated using the conservation of energy for point 10 (Figure 2) as follows:
The total R-744 mass flow rate (Equation (17)) is the sum of the refrigerant mass flow rate from the evaporator, the dry vapor mass flow rate , and the mass flow rate of refrigerant from the bypass valve , proportional to the refrigeration load reduction Qi.
The mass flow rate is calculated using Equation (18):
The decrease in cooling capacity is calculated from Equation (19):
Similar to the previous regulation method, the nominal value of the EER is determined using Equation (11), and then the EERi is calculated during cooling regulation through Equation (12). The instantaneous energy efficiency ratio is referenced to the nominal value and is calculated on the basis of Equation (14).
4. Results
The calculations were carried out using CoolPro software described in [39], available on the manufacturer’s website, and using the energy equations presented in Section 3.2 and Section 3.3. The compressor power decrease, achieved thanks to the additional evaporator used for reducing the ambient air temperature in the supercritical and subcritical cycles, was evaluated. The analysis was performed for 5 different air mass flow rates passing through the additional evaporator, and then through the gas cooler/condenser, for both the supercritical and subcritical cycles. The air mass flow rate was: 8.5 kg/s, 3.4 kg/s, 1.7 kg/s, 1.1 kg/s, and 0.85 kg/s. The calculations were carried out for subsequent cooling capacity decrease values (Qi) for supercritical (initial ambient air temperature of 35 °C) and subcritical cycle (initial ambient air temperature of 15 °C).
The changes in the temperature of cooling air, i.e., the air cooled in the additional evaporator and then passing through the gas cooler, are shown in Figure 6a,b for supercritical and subcritical cycles, respectively. As can be seen, the air temperature decreases linearly as the cooling capacity decreases for both, supercritical and subcritical cycles. This is because as the cooling capacity decreases, more refrigerant flows through the additional evaporator and cools down the air. The temperature of the air decreases more for lower air mass flow rates. When the cooling capacity decreases by 80%, the air temperature decreases by about 1 °C, and 8 °C for the air mass flow rate of 8.5 kg/s, and 0.85 kg/s, respectively, compared to the air temperature in the system working with initial cooling capacity. The temperature drop is similar for both, supercritical and subcritical cycles. Additionally, based on Figure 6a, it is evident that the air temperature for its mass flow rate of 1.7 kg/s, 1.1 kg/s, and 0.85 kg/s decreases below the carbon dioxide critical temperature, i.e., 31 °C. As explained in the Introduction, reducing the temperature of the cooling air impacts significantly on the EER, and lowering the temperature of the cooling air is expected to improve the EER.
Figure 7a,b show the pressure changes in the gas cooler as a function of the cooling capacity drop for different air mass flow rates for supercritical, and subcritical cycles, respectively. For both, the supercritical and subcritical cycles, the pressure decreases linearly as the cooling capacity decreases, and a greater decline is observed for lower air mass flow rates. Compared to the gas cooler pressure during working with nominal cooling capacity, the gas cooler pressure can be reduced by a maximum value of 18.5 bar, and 12.7 bar for supercritical, and subcritical cycles, respectively, when cooling capacity drop is 80%.
Nevertheless, in the supercritical cycle, the pressure curve for the air mass flow rate of 0.85 kg/s differs from the other curves. Initially, the pressure decreases linearly with the cooling capacity drop. However, when the cooling capacity drop is greater than about 65%, the pressure takes a constant value of 75 bar. Such a result is achieved because the temperature of the cooling air, for the air mass flow rate of 0.85 kg/s and the cooling capacity drop greater than 65%, is lower than 27 °C (see Figure 6a), and according to Equation (7), the optimal pressure is 75 bar for the air temperatures in the range of 20–27 °C. It is worth mentioning that although the pressure for the supercritical cycle is reduced significantly when cooling capacity decreases, the pressure does not decrease below its critical value of 73.8 bar for CO2. Nevertheless, any pressure drop should reduce the compressor power, which positively impacts the efficiency of the system.
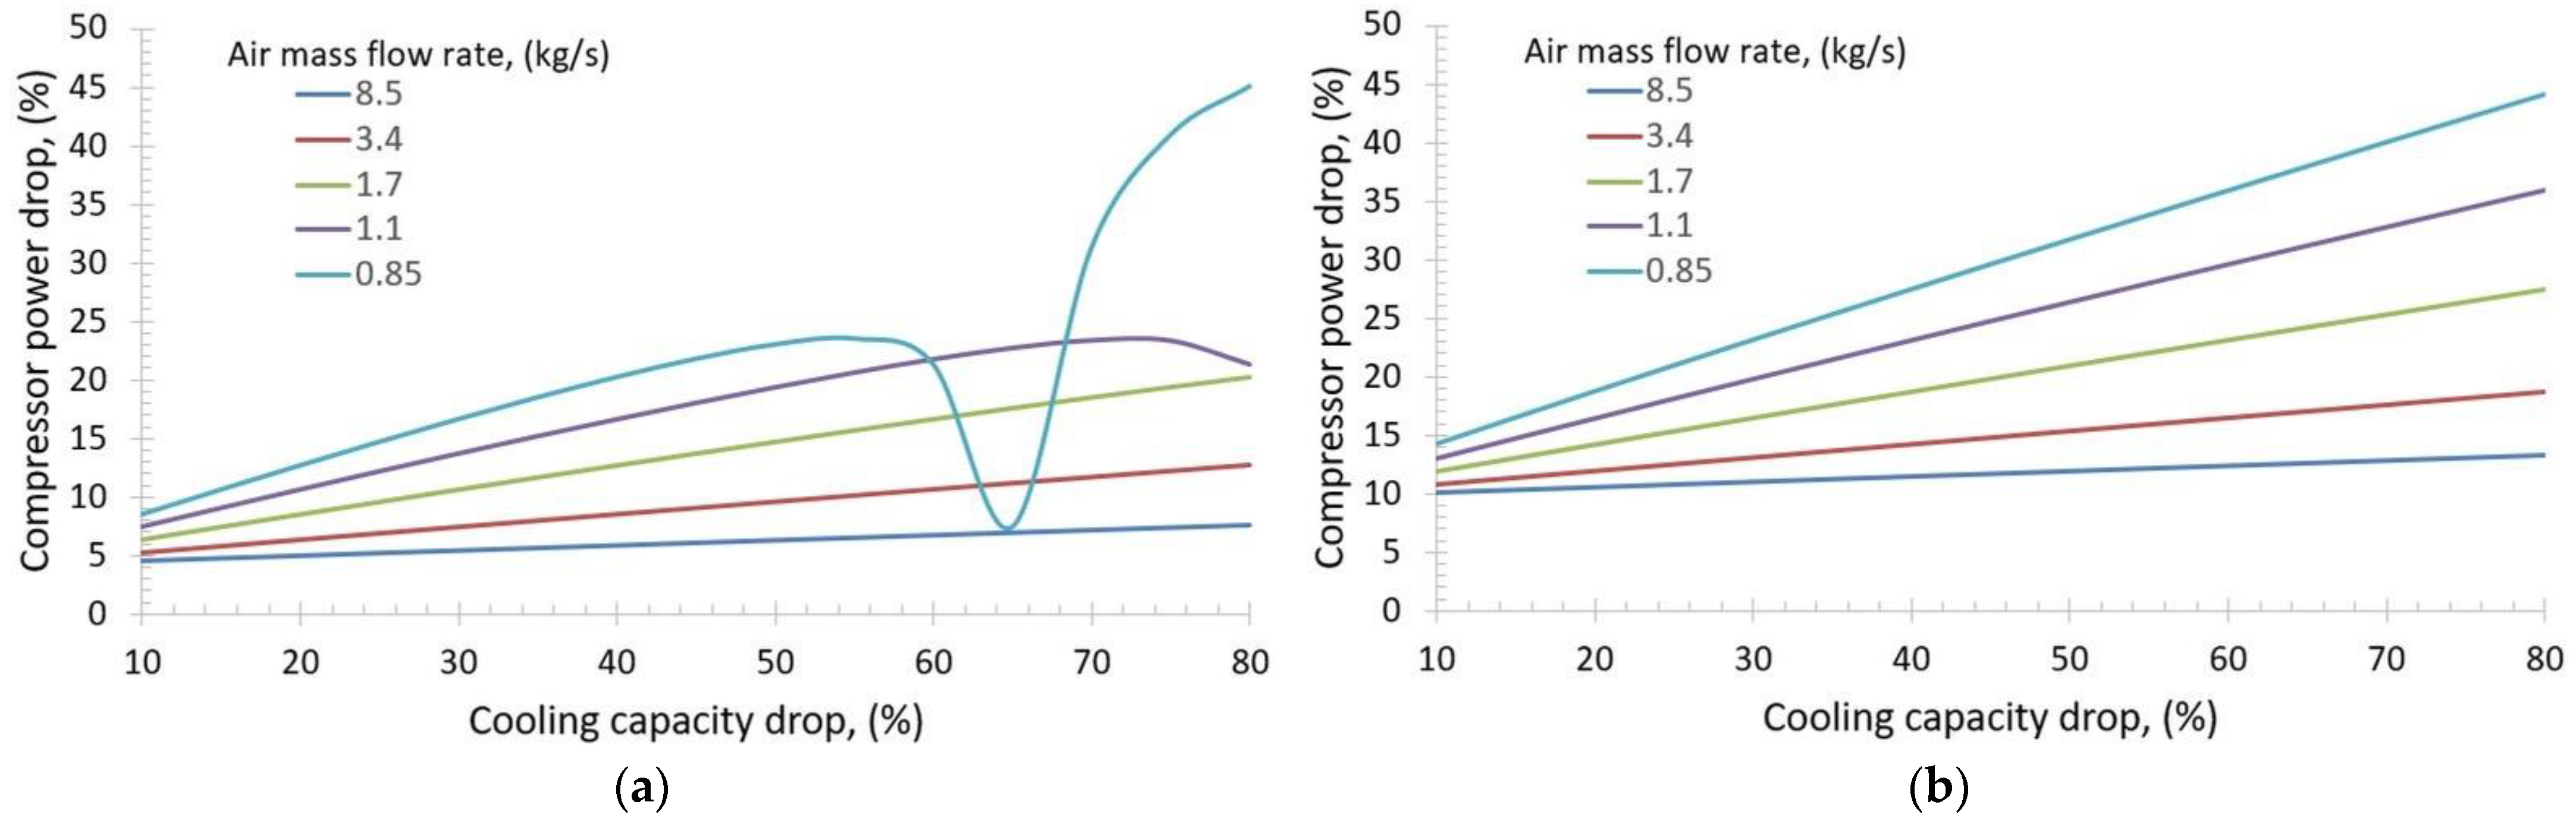
The relative compressor power drop depending on the cooling capacity drop is shown in Figure 8a,b for supercritical and subcritical cycles, respectively, for the five analyzed air mass flow rates. The graphs show that for both the supercritical and subcritical cycles, according to the adopted assumptions, the compressor power drops for each value of the air mass flow rate along with the reduction of the cooling load. It is observed that at each analyzed point a larger decrease of the compressor power is obtained with a smaller air mass flow rate through the additional evaporator. For the subcritical cycle (Figure 8b), for most of the analyzed points, a relative decrease in compressor power was larger compared to the supercritical cycle (Figure 8a). When the cooling capacity decreases by 80%, the compressor power decreases by a maximum value of 45% for both supercritical, and subcritical cycles, compared to the initial compressor power.
Although the course of all compressor power drop curves is similar, there is one exception—the curve for the supercritical cycle for the air mass flow rate of 0.85 kg/s. For that air mass flow rate, the compressor power drop increases initially, as the cooling capacity decreases. Nevertheless, as the cooling capacity drop increases to 65%, the compressor power drop suddenly decreases. Such a phenomenon may be caused by the fact that as the cooling capacity drop is 65%, the temperature of the ambient air and the optimal pressure in the gas cooler are close to the critical point of the carbon dioxide, where the isotherms are strongly curved. Thus, the enthalpy of CO2 at the outlet of the gas cooler increases which contributes to higher vapor quality of the refrigerant after the expansion to the intermediate pressure pIP. As a result, according to Equations (1) and (2), the dry saturated vapor mass flow rate of the refrigerant increases, while the refrigerant mass flow rate flowing through the MT evaporator decreases. Consequently, as the refrigerant mass flow rate through the MT evaporator decreases, the enthalpy of the refrigerant after passing the MT evaporator increases. Thus, higher compressor power is required due to the higher enthalpy of the refrigerant.
Based on Figure 8a, it can be assumed that depending on the cooling capacity drop, there exists a certain minimum value of the air mass flow rate below which a refrigeration system should not work due to a sudden increase in the compressor’s power. In the case of the system analyzed in this paper, the minimum value of the air mass flow rate is 0.85 kg/s. However, it does not mean that the proposed method of regulating the cooling capacity is not applicable for air mass flow rate below 0.85 kg/s. The performance of the system for lower values of the air mass flow rate should be calculated before implementing the proposed method of regulating the cooling capacity into the real refrigeration system. Additionally, each refrigeration system may work under different operating conditions, i.e., evaporation or condensation temperatures and pressures, thus each system should be analyzed individually.
Figure 9a,b show the energy efficiency ratio in the function of cooling capacity drop for two cooling capacity regulation methods, i.e., hot gas bypass and additional evaporator, for supercritical and subcritical cycles, respectively. The EER decreases with increasing cooling capacity drop for the supercritical cycle and both cooling capacity regulation methods. In the case of the subcritical cycle, the EER generally decreases with the decreasing cooling capacity, however, there is a small increase of the EER for the cooling capacity drop of 10%. Such a result is caused by the fact that for the abovementioned cooling capacity drop, the compressor power drop is greater than the cooling capacity drop. Thus, the EER for this cooling capacity drop is greater than the EER of the system working with the initial cooling capacity.
Comparing the influence of the two cooling capacity regulation methods, the EER is higher for the installation with the additional evaporator than the installation with the hot gas bypass. This result is more evident for the subcritical cycle. Additionally, the EER of the subcritical installation is about 4 times higher than the EER of the supercritical installation. As mentioned in the Introduction, the refrigerant in a supercritical state does not condense in the high-pressure heat exchanger, which leads to low values of the EER.
Figure 10a,b show the relative change of the EER in the function of cooling capacity drop for both regulation systems in relation to its original value. Figure 10a concerns the supercritical cycle, while Figure 10b the subcritical cycle. As the cooling capacity decreases, the EER for the two operation modes decreases. The change in the EER depends on the air mass flow rate through the additional evaporator. At lower values of the air mass flow rate, the EER decreases slower.
A comparative analysis of the described methods of regulation of the cooling capacity shows that using the additional evaporator causes a smaller decrease in the EER than when using a hot gas bypass valve method. The maximum decrease of the cooling capacity of the system (by 80%) causes the drop of the EER by 64% for the air mass flow rate of 0.85 kg/s for both the supercritical and subcritical cycles, compared to the initial EER value. For the hot gas bypass method, the decrease of the EER under the same conditions is 93%, and 97% for supercritical and subcritical cycles, respectively.
When modeling the control system with the hot gas bypass, one must remember about the increase in the enthalpy of the refrigerant before and after the compressor, which in turn leads to a large increase in the temperature of CO2. Therefore, the compressor bypass system cannot be used for significant decreases in cooling capacity, caused by e.g., temperature fluctuations on the low-temperature side of the system. For example, when the cooling capacity drops by 50%, the EER of the system with the hot gas bypass decreases by about 50% (see Figure 10a,b). For the same cooling capacity drop, the EER of the system with the additional evaporator decreases by only 20–40%, depending on the air mass flow rate. Therefore, the method of regulating the cooling capacity by using the additional evaporator provides a smaller decrease in the EER than the hot gas bypass method.
5. Conclusions
The two cooling capacity regulation methods, i.e., the additional evaporator method and the hot gas bypass method, were analyzed and compared. The results presented in the paper are theoretical and should be confirmed in further experimental studies. The results of the performed calculations show that when the cooling capacity decreases, using the additional evaporator allows reducing the temperature of the ambient air cooling the evaporator, and decreases the compressor power. It has been found that the reduction of the compressor power has been greater in the case of the subcritical cycle, as opposed to the supercritical cycle. For example, decreasing the cooling capacity by 50% reduced the compressor power by 25% in the supercritical cycle, and by 35% in the subcritical cycle at the air mass flow rate of 0.85 kg/s. In both, the supercritical and subcritical cycles, the compressor power drop depended on the air mass flow rate through the additional evaporator. Lower air mass flow rate resulted in a larger decrease in the compressor power with respect to its initial value. This was caused by the fact that as the air mass flow rate decreased, the temperature of the air decreased to lower values, and consequently, the pressure in the gas cooler decreased.
The cooling capacity regulation method with the additional evaporator achieved better results compared to the hot gas bypass method regarding the energy efficiency ratio. With an exemplary decrease in the cooling capacity by 50%, the EER decreased to 65% of the initial value in the supercritical cycle, and up to 73% in the subcritical cycle for the air mass flow rate of 0.85 kg/s. Additionally, reducing the cooling capacity by 10% increased the EER by 10% for the additional evaporator method in the subcritical cycle. With a 50% decrease in cooling capacity, the use of a compressor bypass valve changes the EER to 45% of the initial value in the supercritical system and 36% in the subcritical system. Thus, with this decrease in cooling capacity, the method of regulating the cooling capacity using a compressor bypass valve is around 30% less efficient than the additional evaporator method. The EER significantly decreases with the increasing reduction of cooling load, especially for the hot gas bypass method.
The outcomes presented in this paper are a result of theoretical calculations, hence the authors are planning to investigate experimentally the performance of the proposed method of regulating the cooling capacity in further research. The experimental verification is possible in any transcritical carbon dioxide refrigeration system after some changes, including installing the additional evaporator, fan, pipe system, and of course appropriate measuring devices and data acquisition system.
Author Contributions
The contribution of co-authors in creating the paper is: conceptualization, A.B. and L.M.; methodology, A.B.; software, A.B.; validation, A.B., K.S., and J.K.; formal analysis, K.S., J.K., and E.R.; investigation, A.B.; resources, A.B., L.M., and J.K.; data curation, A.B.; writing—original draft preparation, A.B., J.K.; writing—review and editing, K.S., L.M., and E.R.; visualization, A.B., J.K.; supervision, L.M., K.S.; project administration, L.M., K.S.; funding acquisition, L.M., K.S. All authors have read and agreed to the published version of the manuscript.
Funding
The paper was founded from government money Faculty of Energy and Fuels number 16.16.210.476 (research subsidy).
Institutional Review Board Statement
Not applicable.
Informed Consent Statement
Not applicable.
Data Availability Statement
The data presented in this study are available on request from the corresponding author.
Conflicts of Interest
The authors declare no conflict of interest.
Nomenclature
| a | Ratio of Qi to Q0 |
| COP | Coefficient of performance |
| cp | Specific heat capacity of air, J/(kgK) |
| EER | Energy efficiency ratio |
| EERi | Reduced energy efficiency ratio |
| EERN | Nominal energy efficiency ratio |
| h1 | Enthalpy of the refrigerant before the compressor, J/kg |
| h10 | Enthalpy of the refrigerant before the compressor during cooling regulation with a compressor bypass valve, J/kg |
| h2 | Enthalpy of the refrigerant after the compressor, J/kg |
| h2,i | Enthalpy of the refrigerant after the compressor during cooling regulation, J/kg |
| h2s | Isentropic compression enthalpy of the refrigerant, J/kg |
| h6 | Enthalpy of the refrigerant before the medium-temperature evaporator, J/kg |
| h7″ | Enthalpy of the refrigerant after the medium-temperature evaporator, J/kg |
| HP | High pressure |
| IHX | Internal heat exchanger |
| IP | Intermediate pressure |
| MT | Medium temperature |
| Dry vapor refrigerant mass flow rate, kg/s | |
| Mass flow rate of the refrigerant in the evaporator, kg/s | |
| Mass flow rate of the refrigerant proportional to the reduction of the cooling load, kg/s | |
| Air mass flow rate, kg/s | |
| Total mass flow rate of the refrigerant, kg/s | |
| Nc | Compressor power, W |
| Nc,i | Reduced compressor power, W |
| pIP | Intermediate pressure, bar |
| pk | High pressure, bar |
| popt | Optimal high pressure, bar |
| p0 | Evaporating pressure, bar |
| qIHX | Unit heat flow in the internal heat exchanger, kJ/kg |
| Q0 | Nominal cooling capacity, W |
| Qi | Cooling capacity decrease, W |
| Rp | Pressure ratio |
| tair | Ambient air temperature, °C |
| tair,in | Inlet ambient air temperature, °C |
| tair,out | Outlet ambient air temperature, °C |
| t0 | Evaporating temperature, °C |
| x | Vapor quality |
| ΔEER | Relative change in EER |
| ΔN | Relative change in compressor power |
| ηis | Isentropic efficiency |
References
- WHO. The Montreal Protocol on Substances that Deplete the Ozone Layer; WHO: Montreal, QC, Canada, 1987. [Google Scholar]
- FCCC. The Kyoto Protocol to the United Nations Framework Convention on Climate Change; FCCC: Kyoto, Japan, 1997.
- Wang, R.Z.; Li, Y. Perspectives for natural working fluids in China. Int. J. Refrig. 2007, 30, 568–581. [Google Scholar] [CrossRef]
- Zheng, G.; Jing, Y. Air Conditioning: Selecting the Optimal Cool Storage System. Energy Environ. 2007, 18, 251–257. [Google Scholar] [CrossRef]
- Pearson, A. Carbon dioxide—New uses for an old refrigerant. Int. J. Refrig. 2005, 28, 1140–1148. [Google Scholar] [CrossRef]
- ISO. ISO 817:2014. Refrigerants—Designation and Safety Classification; ISO: Geneva, Switzerland, 2014. [Google Scholar]
- Bieniek, A.; Pysz, M.; Mika, Ł. Alternatywne czynniki chłodnicze R-1234yf oraz R-744 stosowane w samochodowej instalacji klimatyzacyjnejod 2017 roku. Zesz. Nauk. Inst. Gospod. Surowcami Miner. Energią Pol. Akad. Nauk 2018, 103, 117–132. [Google Scholar] [CrossRef]
- Sineviciene, L.; Sotnyk, I.; Kubatko, O. Determinants of energy efficiency and energy consumption of Eastern Europe post-communist economies. Energy Environ. 2017, 28, 870–884. [Google Scholar] [CrossRef]
- Sarkar, J.; Bhattacharyya, S.; Gopal, M.R. Optimization of a transcritical CO2 heat pump cycle for simultaneous cooling and heating applications. Int. J. Refrig. 2004, 27, 830–838. [Google Scholar] [CrossRef]
- Dai, B.; Liu, S.; Li, H.; Sun, Z.; Song, M.; Yang, Q.; Ma, Y. Energetic performance of transcritical CO2 refrigeration cycles with mechanical subcooling using zeotropic mixture as refrigerant. Energy 2018, 150, 205–221. [Google Scholar] [CrossRef]
- Sharma, V.; Fricke, B.; Bansal, P. Comparative analysis of various CO2 configurations in supermarket refrigeration systems. Int. J. Refrig. 2014, 46, 86–99. [Google Scholar] [CrossRef]
- Srinivasan, K.; Sheahen, P.; Sarathy, C.S.P. Optimum thermodynamic conditions for upper pressure limits of transcritical carbon dioxide refrigeration cycle. Int. J. Refrig. 2010, 33, 1395–1401. [Google Scholar] [CrossRef]
- Ma, Y.; Liu, Z.; Tian, H. A review of transcritical carbon dioxide heat pump and refrigeration cycles. Energy 2013, 55, 156–172. [Google Scholar] [CrossRef]
- Ge, Y.T.; Tassou, S.A. Performance evaluation and optimal design of supermarket refrigeration systems with supermarket model “superSim”. Part II: Model applications. Int. J. Refrig. 2011, 34, 540–549. [Google Scholar] [CrossRef] [Green Version]
- Belusko, M.; Liddle, R.; Alemu, A.; Halawa, E.; Bruno, F. Performance evaluation of a CO2 refrigeration system enhanced with a dew point cooler. Energies 2019, 12, 1079. [Google Scholar] [CrossRef] [Green Version]
- Bruno, F.; Belusko, M.; Halawa, E. CO2 Refrigeration and Heat Pump Systems—A Comprehensive Review. Energies 2019, 12, 2959. [Google Scholar] [CrossRef] [Green Version]
- Gullo, P. Advanced thermodynamic analysis of a transcritical R744 booster refrigerating unit with dedicated mechanical subcooling. Energies 2018, 11, 3058. [Google Scholar] [CrossRef] [Green Version]
- Sánchez, D.; Catalán-Gil, J.; Cabello, R.; Calleja-Anta, D.; Llopis, R.; Nebot-Andrés, L. Experimental analysis and optimization of an R744 transcritical cycle working with a mechanical subcooling system. Energies 2020, 13, 3204. [Google Scholar] [CrossRef]
- Gullo, P.; Hafner, A.; Banasiak, K. Thermodynamic performance investigation of commercial R744 booster refrigeration plants based on advanced exergy analysis. Energies 2019, 12, 354. [Google Scholar] [CrossRef] [Green Version]
- Liu, Y.; Sun, Y.; Tang, D. Analysis of a CO2 transcritical refrigeration cycle with a vortex tube expansion. Sustainability 2019, 11, 2021. [Google Scholar] [CrossRef] [Green Version]
- Bellos, E.; Tzivanidis, C. A Theoretical Comparative Study of CO2 Cascade Refrigeration Systems. Appl. Sci. 2019, 9, 790. [Google Scholar] [CrossRef] [Green Version]
- Lorentzen, G. Revival of carbon dioxide as a refrigerant. Int. J. Refrig. 1994, 17, 292–301. [Google Scholar] [CrossRef]
- Purohit, N.; Sharma, V.; Sawalha, S.; Fricke, B.; Llopis, R.; Dasgupta, M.S. Integrated supermarket refrigeration for very high ambient temperature. Energy 2018, 165, 572–590. [Google Scholar] [CrossRef]
- Girotto, S.; Minetto, S.; Neksa, P. Commercial refrigeration system using CO2 as the refrigerant. Int. J. Refrig. 2004, 27, 717–723. [Google Scholar] [CrossRef]
- Gullo, P.; Hafner, A.; Banasiak, K. Transcritical R744 refrigeration systems for supermarket applications: Current status and future perspectives. Int. J. Refrig. 2018, 93, 269–310. [Google Scholar] [CrossRef]
- Haida, M.; Smolka, J.; Hafner, A.; Ostrowski, Z.; Palacz, M.; Madsen, K.B.; Försterling, S.; Nowak, A.J.; Banasiak, K. Performance mapping of the R744 ejectors for refrigeration and air conditioning supermarket application: A hybrid reduced-order model. Energy 2018, 153, 933–948. [Google Scholar] [CrossRef]
- Rony, R.; Yang, H.; Krishnan, S.; Song, J. Recent Advances in Transcritical CO2 (R744) Heat Pump System: A Review. Energies 2019, 12, 457. [Google Scholar] [CrossRef] [Green Version]
- Cabello, R.; Sánchez, D.; Llopis, R.; Torrella, E. Experimental evaluation of the energy efficiency of a CO2 refrigerating plant working in transcritical conditions. Appl. Therm. Eng. 2008, 28, 1596–1604. [Google Scholar] [CrossRef]
- Chesi, A.; Esposito, F.; Ferrara, G.; Ferrari, L. Experimental analysis of R744 parallel compression cycle. Appl. Energy 2014, 135, 274–285. [Google Scholar] [CrossRef]
- Sarkar, J. Optimization of ejector-expansion transcritical CO2 heat pump cycle. Energy 2008, 33, 1399–1406. [Google Scholar] [CrossRef]
- Llopis, R.; Cabello, R.; Sánchez, D.; Torrella, E. Energy improvements of CO2 transcritical refrigeration cycles using dedicated mechanical subcooling. Int. J. Refrig. 2015, 55, 129–141. [Google Scholar] [CrossRef] [Green Version]
- Yang, J.L.; Ma, Y.T.; Liu, S.C. Performance investigation of transcritical carbon dioxide two-stage compression cycle with expander. Energy 2007, 32, 237–245. [Google Scholar] [CrossRef]
- Bellos, E.; Tzivanidis, C. A comparative study of CO2 refrigeration systems. Energy Convers. Manag. X 2019, 1, 100002. [Google Scholar] [CrossRef]
- Torrella, E.; Sánchez, D.; Llopis, R.; Cabello, R. Energetic evaluation of an internal heat exchanger in a CO2 transcritical refrigeration plant using experimental data. Int. J. Refrig. 2011, 34, 40–49. [Google Scholar] [CrossRef]
- Borowski, P.F. Adaptation strategy on regulated markets of power companies in Poland. Energy Environ. 2019, 30, 3–26. [Google Scholar] [CrossRef]
- Krzywanski, J.; Sztekler, K.; Szubel, M.; Siwek, T.; Nowak, W.; Mika, Ł. A comprehensive three-dimensional analysis of a large-scale multi-fuel CFB boiler burning coal and syngas. Part 1. The CFD model of a large-scale multi-fuel CFB combustion. Entropy 2020, 22, 964. [Google Scholar] [CrossRef]
- Krzywanski, J.; Sztekler, K.; Szubel, M.; Siwek, T.; Nowak, W.; Mika, L. A comprehensive, three-dimensional analysis of a large-scale, multi-fuel, CFB boiler burning coal and syngas. Part 2. Numerical simulations of coal and syngas co-combustion. Entropy 2020, 22, 856. [Google Scholar] [CrossRef] [PubMed]
- Sztekler, K.; Kalawa, W.; Mika, L.; Krzywanski, J.; Grabowska, K.; Sosnowski, M.; Nowak, W.; Siwek, T.; Bieniek, A. Modeling of a combined cycle gas turbine integrated with an adsorption chiller. Energies 2020, 13, 515. [Google Scholar] [CrossRef] [Green Version]
- Bell, I.H.; Wronski, J.; Quoilin, S.; Lemort, V. Pure and pseudo-pure fluid thermophysical property evaluation and the open-source thermophysical property library coolprop. Ind. Eng. Chem. Res. 2014, 53, 2498–2508. [Google Scholar] [CrossRef] [Green Version]
Figure 1.
Variation of EER with pressure in the gas cooler and ambient air temperature for transcritical carbon dioxide cooling system, where tair is the temperature of ambient air [14].
Figure 1.
Variation of EER with pressure in the gas cooler and ambient air temperature for transcritical carbon dioxide cooling system, where tair is the temperature of ambient air [14].

Figure 2.
The refrigeration system with the hot gas bypass valve. —total refrigerant mass flow rate, (kg/s); —refrigerant mass flow rate through the bypass, (kg/s); —dry vapor refrigerant mass flow rate, (kg/s); —refrigerant mass flow rate through the evaporator, (kg/s).
Figure 2.
The refrigeration system with the hot gas bypass valve. —total refrigerant mass flow rate, (kg/s); —refrigerant mass flow rate through the bypass, (kg/s); —dry vapor refrigerant mass flow rate, (kg/s); —refrigerant mass flow rate through the evaporator, (kg/s).

Figure 3.
The refrigeration system with the additional evaporator (air cooler). —total refrigerant mass flow rate, (kg/s); —refrigerant mass flow rate through the additional evaporator, (kg/s); —dry vapor refrigerant mass flow rate, (kg/s); —refrigerant mass flow rate through the evaporator, (kg/s).

Figure 4.
Subcritical carbon dioxide cycle at the beginning of the analysis.

Figure 5.
Supercritical carbon dioxide cycle at the beginning of the analysis.

Figure 6.
Cooling air temperature in the function of cooling capacity drop for different air mass flow rates in: (a) Supercritical cycle; (b) Subcritical cycle.
Figure 6.
Cooling air temperature in the function of cooling capacity drop for different air mass flow rates in: (a) Supercritical cycle; (b) Subcritical cycle.

Figure 7.
Optimal pressure in the gas cooler in the function of cooling capacity drop for different air mass flow rates in: (a) Supercritical cycle; (b) Subcritical cycle.
Figure 7.
Optimal pressure in the gas cooler in the function of cooling capacity drop for different air mass flow rates in: (a) Supercritical cycle; (b) Subcritical cycle.

Figure 8.
Relative compressor power drop in the function of cooling capacity drop for different air mass flow rates in: (a) Supercritical cycle; (b) Subcritical cycle.
Figure 8.
Relative compressor power drop in the function of cooling capacity drop for different air mass flow rates in: (a) Supercritical cycle; (b) Subcritical cycle.

Figure 9.
Energy efficiency ratio in the function of cooling capacity drop for different air mass flow rates (additional evaporator regulation method), and for hot gas bypass regulation method in: (a) Supercritical cycle; (b) Subcritical cycle.
Figure 9.
Energy efficiency ratio in the function of cooling capacity drop for different air mass flow rates (additional evaporator regulation method), and for hot gas bypass regulation method in: (a) Supercritical cycle; (b) Subcritical cycle.

Figure 10.
Relative energy efficiency ratio in the function of cooling capacity drop for different air mass flow rates (additional evaporator regulation method), and for hot gas bypass regulation method in: (a) Supercritical cycle; (b) Subcritical cycle.
Figure 10.
Relative energy efficiency ratio in the function of cooling capacity drop for different air mass flow rates (additional evaporator regulation method), and for hot gas bypass regulation method in: (a) Supercritical cycle; (b) Subcritical cycle.


Table 1.
Parameters of the R-744 air conditioning system at the beginning of the analysis.
| Cycle | tair, (°C) | pk, (bar) | tref, out, (°C) | p0, (bar) | t0, (°C) | pIP, (bar) | Q0, (kW) | m1 (kg/s) | m0, (kg/s) | qIHX (kJ/kg) |
|---|---|---|---|---|---|---|---|---|---|---|
| Subcritical | 15 | 64.62 | 20 | 30 | −5 | 45 | 10 | 0.043 | 0 | 26.6 |
| Supercritical | 35 | 93.5 | 40 | 30 | −5 | 45 | 10 | 0.048 | 0.03 | 26.6 |
Table 2.
Parameters of the subcritical cycle (characteristics points).
| Point | p, (bar) | t, (°C) | x, (-) |
|---|---|---|---|
| 1 | 30.0 | 10.0 | − |
| 2s | 64.6 | 69.0 | − |
| 2 | 64.6 | 79.5 | − |
| 3 | 64.6 | 20.0 | − |
| 4 | 64.6 | 11.0 | − |
| 5 | 45.0 | 9.5 | − |
| 6 | 30.0 | −5.0 | 0.15 |
| 7″ | 30.0 | −5.0 | 1.00 |
Table 3.
Parameters of the supercritical cycle (characteristics points).
| Point | p, (bar) | t, (°C) | x, (-) |
|---|---|---|---|
| 1 | 30.0 | 10.0 | − |
| 2s | 93.5 | 100.6 | − |
| 2 | 93.5 | 121.2 | − |
| 3 | 93.5 | 40.0 | − |
| 4 | 93.5 | 14.6 | − |
| 5 | 45.0 | 10.0 | 0.38 |
| 5′ | 45.0 | 10.0 | 0 |
| 5″ | 45.0 | 10.0 | 1.00 |
| 6 | 30.0 | −5.0 | 0.16 |
| 7″ | 30.0 | −5.0 | 1.00 |
| 8 | 30.0 | −5.0 | 0.96 |
| 9 | 30.0 | −5.0 | 0.98 |
Publisher’s Note: MDPI stays neutral with regard to jurisdictional claims in published maps and institutional affiliations. |
© 2021 by the authors. Licensee MDPI, Basel, Switzerland. This article is an open access article distributed under the terms and conditions of the Creative Commons Attribution (CC BY) license (https://creativecommons.org/licenses/by/4.0/).
Share and Cite
MDPI and ACS Style
Bieniek, A.; Kuchmacz, J.; Sztekler, K.; Mika, L.; Radomska, E. A New Method of Regulating the Cooling Capacity of a Cooling System with CO2. Energies 2021, 14, 1922. https://0-doi-org.brum.beds.ac.uk/10.3390/en14071922
AMA Style
Bieniek A, Kuchmacz J, Sztekler K, Mika L, Radomska E. A New Method of Regulating the Cooling Capacity of a Cooling System with CO2. Energies. 2021; 14(7):1922. https://0-doi-org.brum.beds.ac.uk/10.3390/en14071922
Chicago/Turabian StyleBieniek, Artur, Jan Kuchmacz, Karol Sztekler, Lukasz Mika, and Ewelina Radomska. 2021. "A New Method of Regulating the Cooling Capacity of a Cooling System with CO2" Energies 14, no. 7: 1922. https://0-doi-org.brum.beds.ac.uk/10.3390/en14071922
Note that from the first issue of 2016, this journal uses article numbers instead of page numbers. See further details here.