Article

Zeolite NaY-Copper Composites Produced by Sintering Processes for Adsorption Heat Transformation—Technology, Structure and Performance

1
Department Thermal Systems and Buildings, Fraunhofer Institute for Solar Energy Systems (ISE), Heidenhofstr. 2, D-79110 Freiburg, Germany
2
Department of Powder Technology, Fraunhofer Institute for Manufacturing Technology and Advanced Materials (IFAM), D-28359 Bremen, Germany
*
Author to whom correspondence should be addressed.
Submission received: 1 March 2021 / Revised: 26 March 2021 / Accepted: 30 March 2021 / Published: 1 April 2021
(This article belongs to the Special Issue Advances on Adsorption Heat Pumps, Stores and Systems)

Abstract

:
In adsorption heat pumps, the adsorbent is typically combined with heat conducting structures in order to ensure high power output. A new approach for the direct integration of zeolite granules into a copper structure made of short copper fibers is presented here. Zeolite NaY granules with two different grain sizes are coated with copper fibers and powder and sintered to larger structures. The sorption dynamics of these structures were measured and evaluated in terms of heat and mass transfer resistances and compared to the loose grain configuration of the same material. We found that the thermal conductivity of such a composite structure is approximately 10 times higher than the thermal conductivity of an adsorbent bed with NaY granules. Sorption equilibrium measurements with a volumetric method indicate that the maximum uptake is not altered by the manufacturing process. Furthermore, the impact of the adsorbent–metal structure on the total thermal mass of an adsorption heat exchanger is evaluated. The price of the superior thermal conductivity is a 40% higher thermal mass of the adsorption heat exchanger compared to the loose grain configuration.

Graphical Abstract

1. Introduction

Thermally-driven adsorption heat pumps have the advantages of low environmental impact and efficient use of low-grade heat sources [1,2,3,4]. They are, however, still not wide-spread in the market because of deficiencies regarding costs and efficiency in comparison to conventional vapor compression heat pumps. In order to overcome those limitations intensive research and development activities have been undertaken regarding the development of new adsorbents with high adsorbing ability [5,6,7] and thermodynamic features matching the working conditions, highly efficient evaporation and condensation elements [8,9], and more efficient heat exchanger designs [10,11].
A large variety of nanoporous adsorbents like zeolites (13X, NaY, 4A), zeo-types (SAPO-34, TiAPSO), and metal organic frameworks (aluminum fumarate, CAU-10) were tested for their application in adsorption heat pump systems [5,6,7]. Among those, the highest technological readiness level was reached for zeolites and zeo-type materials like SAPO-34 [1,4,12]. All those adsorbents are characterized by a low intrinsic thermal conductivity [10,11]. In order to obtain high power densities of the adsorption systems, the adsorbent is combined with heat exchanger structures, typically made from metals like aluminum, copper, or steel. The heat exchanger structure has the task to transfer the heat from the adsorbent to a heat transfer fluid cycle (and vice versa). Since the adsorption process is a coupled heat and mass transfer process, it is important to minimize all transport resistances in order to achieve a high power density of the adsorption heat exchanger [10]. Various designs have been developed over the past years [11,13,14].
For adsorbents with granular shape (or particles >200 µm) round tubes, i.e., lamella heat exchangers as presented by Riffel et al., or flat tubes, i.e., lamella heat exchangers as presented by Kowsari et al., are widely used [15,16]. Numerous approaches, especially for the frequently applied silicagel, have been presented aiming to increase the bed thermal conductivity. Demir et al. [17], Rezk et al. [18], and Askalany et al. [19] studied the effect of metal additives on the thermal conductivity of a silicagel adsorbent bed. More recently, Kulakowska et al. [20] followed a similar approach with smaller silicagel granules and carbon nanotubes. Eun et al. [21] presented a combination of silicagel with expanded graphite and claimed to have achieved very high thermal conductivities (>10 W/(m·K)) with this approach [21], although the transient measurement method applied is little reliable for adsorbents due to bias from ad- and desorption thermal effects. The use of binders within the bed and between granules and the heat exchanger surface can also improve the heat transfer [22,23].
If the adsorbent particle size is decreased further (<100 µm) the adsorbent can be mixed with a binder and this slurry can be used for coating various heat exchanger geometries [10,24]. A flat tube-lamella heat exchanger is coated with a zeo-type material TiAPSO by Bendix et al. [24], and with SAPO34 by Freni et al. [25] and Dawoud [26]. In addition, Ammann et al. performed research on the reduction of heat and mass transfer resistances of binder-based SAPO-34 coatings for the use in heat exchangers [23,27,28]. Palomba et al., coated a graphite heat exchanger structure with SAPO-34 [29].
Another approach is the partial support transformation (PST) technique—here zeo-type materials like SAPO-34 or AlPO-5 can be directly crystallized on an aluminum substrate [30]. Fibrous aluminum structures were used by Wittstadt et al. in combination with the PST technique in order to crystallize thin layers (approx. 50 µm) on a structure with a quite good thermal conductivity of up to 9 W/(m·K) [31]. These aluminum structures were used to develop a flat-tube fibrous structure adsorption heat exchanger by Wittstadt et al. [32].
Although the combination of the “thermally active” adsorbent with metal structures will significantly increase the power density of adsorption heat exchangers, the main disadvantage of this approach is the additional dead thermal mass of the metal brought into the adsorption heat exchanger. The efficiency of an adsorption cycle depends strongly on the quantity of the dead thermal mass within the adsorption heat exchanger and thus the dead thermal mass of the adsorbent metal composite structure [10,33]. It is, therefore, indispensable to optimize the design of the composite structure with respect to the following aspects:
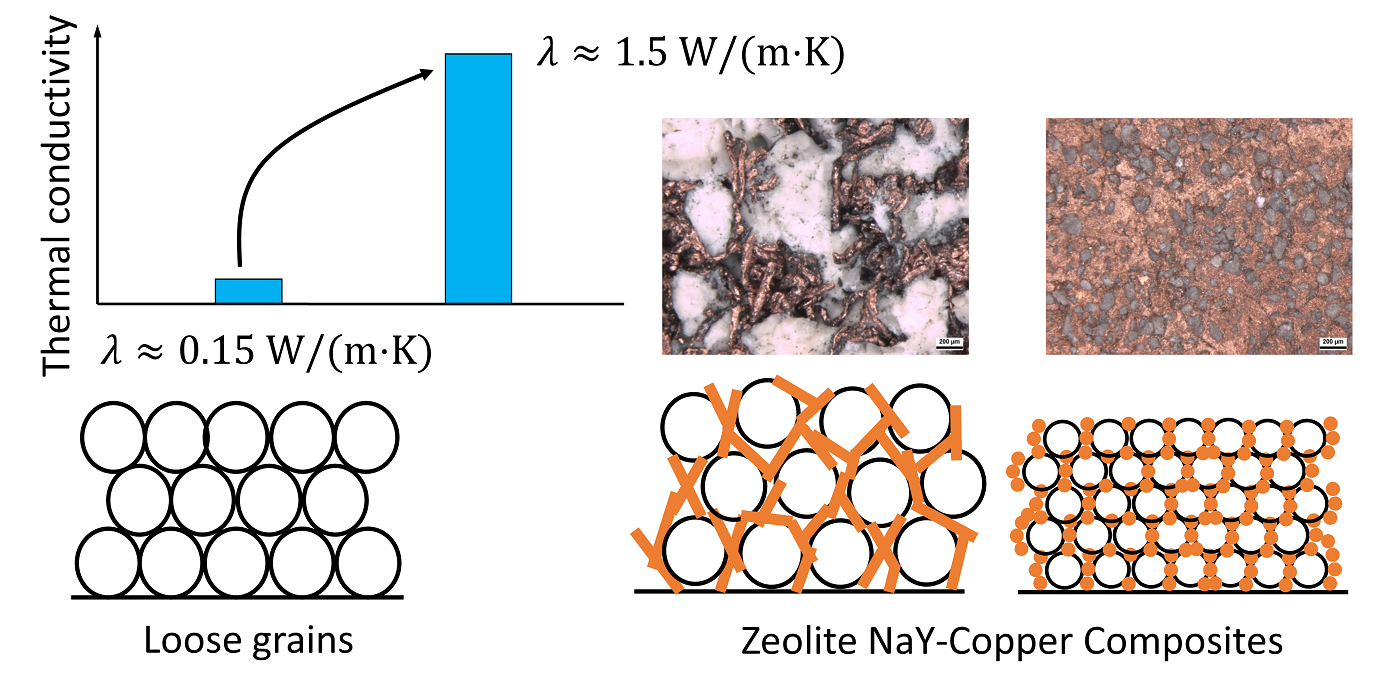
  • short diffusion and thermal transport lengths in the adsorption material
  • low mass transfer resistance in the macroporous structure
  • low thermal contact resistance between adsorbent and heat exchanger
  • high thermal conductivity and low thermal capacity of the heat exchanger
  • low amount of heat transfer fluid in the hydraulic cycle, since the dead thermal mass of the heat transfer fluid must be considered [33].
A common approach for the optimization is to use heat exchanger structures with large surfaces, allowing the application of relatively thin films of the adsorbent, and short diffusion and thermal transport lengths. Brazed or sintered metal fibers [31,34,35], metal foams [34], or brazed metal textiles are examples of structures offering significantly increased surfaces in comparison to conventional lamella heat exchangers [10]. The latter, however, have the advantage of well-established cheap processes for the production, including the heat transfer fluid cycle and the well-directed thermal conductivity of the lamellas. Besides, support structures with very fine and highly complex geometries like metal foams may lead to difficulties for the deposition processes of the adsorbent. The transport mechanisms of reactants and reaction products in PST processes are different in the confined space of the foam pores in comparison to larger reaction volumes of lamella heat exchangers. This can lead to changed reaction kinetics and products. Similarly, it is difficult to control the slurry coating of the inner regions of, e.g., very fine fiber structures.
In addition to the common approach of bringing the adsorbent onto the surface of prefabricated metal structures, also the reverse way has been followed at laboratory scale, i.e., the formation of the metal heat exchanger inside a pre-existing geometry of adsorbent. An example is the casting of a metal melt into a bulk of zeolite pellets [36]. More recently, at the Fraunhofer IFAM an adapted method has been proposed. This method is derived from earlier developments for the production of open porous metal foams [37], aluminum-polymer-hybrid structures [38], and metal-embedded electronics [39,40] and is based on the “transplantation” of adsorption material granules from a polymer surface to the surface of a cast open porous metal structure.
The main consideration associated with the direct combination of metal and adsorbents like zeolite by casting is the degeneration of the adsorption material due to the thermal shock and the high temperatures associated with the casting process (e.g., >700 °C for aluminum or 1000 °C for copper alloys). The degeneration of, e.g., zeolites, depends strongly on the humidity of the atmosphere during thermal exposure [12,41]. This aspect is less controlled in typical casting shop conditions.
The approach that we study in this paper for the direct integration of adsorption material into a metal heat exchanger during its production is based on sintering instead of casting techniques. The main advantages are the precisely controlled atmosphere and the possibility to process metals with higher melting temperatures like copper. In order to evaluate the feasibility and potential of this approach, we manufactured two different small-scale (e.g., diameter approximately 50 mm) samples.
The evaluation of adsorption experiments on small samples as presented here can give important information on the performance of an adsorption heat exchanger made from similar structures. For this purpose, it is desirable to identify the limiting processes in order to optimize them for the desired application before designing and manufacturing the whole heat exchanger.
One possibility is the modeling of heat and mass transfer with more complex models [16,42,43,44,45,46], or simplified models [47,48,49], and the identification of heat and mass transfer parameters. As soon as these parameters are identified and geometric dependencies are known and fed into the model, rigorous optimization of the adsorption heat exchanger design is possible as carried out by Lanzerath et al. [50], Kowsari et al. [16], and Velte [51]. Although this method is quite powerful, it requires a great effort for modeling, parameter identification, and optimization.
Thus, we assess another method based on driving temperature equivalents in this paper. This method was suggested and discussed on different conferences [35,52], and used by Wittstadt [45] for the evaluation of adsorption heat exchanger measurements and later by Velte [51] for the optimization of adsorption heat exchangers. Ammann et al. [23] published recently a paper with a concise description of this method and its application to measurements of silicagel granules. Based on these works, we present a further refined approach here.
Summing up all the points risen here we can formulate the main research questions as follows:
  • How good is the performance of NaY-copper composites in terms of overall sorption dynamics in comparison to a NaY loose grains configuration?
  • Is heat or mass transfer dominating the overall sorption dynamics of NaY-copper composites?
  • How big is the impact of the additional copper in NaY-copper composites on the overall thermal mass of an adsorption heat exchanger compared to a loose grain configuration?

2. Materials and Methods

2.1. Manufacturing Process

Y-zeolite Na BF-K (binder free) from CWK, Germany, was obtained in the shape of round granules with a diameter of 2.5 mm. As no smaller granules were available, the material was milled in a cross-beater mill (Retsch SR300, Retsch GmbH, Haan, Germany) with 810 turns/min and a 0.75 mm sieve. The milled zeolite (<0.75 mm) was afterwards sieved in different fractions 0–63 µm, 63–125 µm, 125–400 µm and 400–750 µm. The fractions 63–125 µm and 400–750 µm were used to produce two different samples.
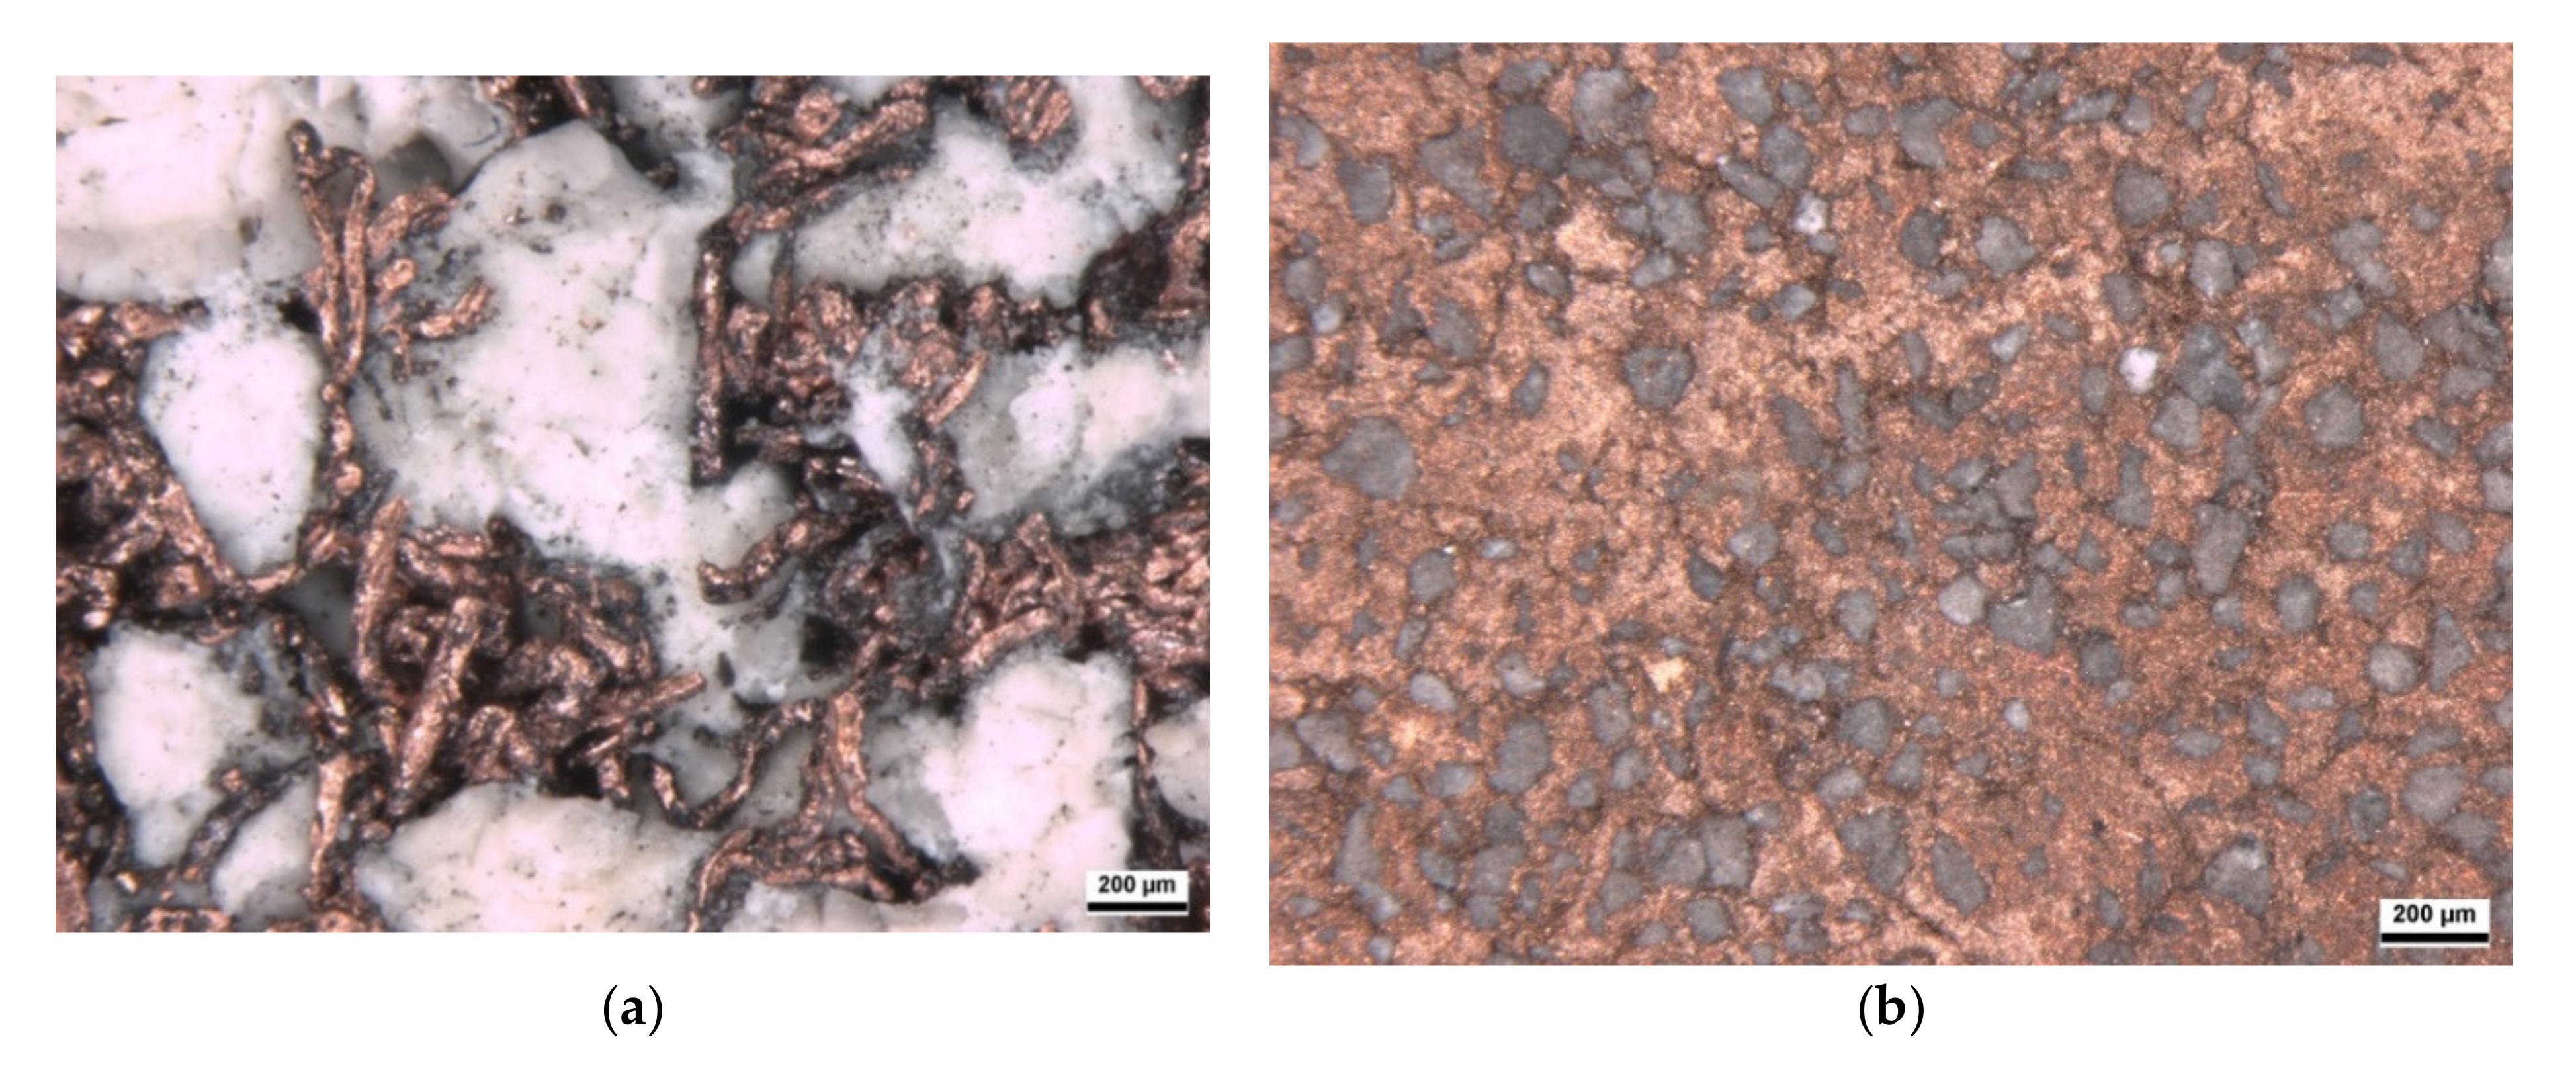
  • we55: 10 g milled zeolite of the fraction 400–750 µm was moistened with 2.5 g water. Afterwards, 3.8 g SILIKOPHEN P 80/X (Evonik, Essen, Germany) binder was added to the zeolite bulk and stirred manually. Then 30 g technically pure Cu-fibers (STAX micro F08, Deutsches Metallfaserwerk, Neidenstein, Germany) were added and the mixture was stirred slowly. The mixture was filled into a cylindrical die with 50 mm diameter and compacted with a press (MATRA, Matra-Werke GmbH, Hainburg, Germany) with a force of 100 kN. The sample was dried, first at room temperature, and afterwards at 420 °C. Sintering was done for 3 h at 600 °C in hydrogen atmosphere in a sintering furnace (ThermalTechnology LLC, Santa Rosa, CA, USA).
  • we95: in comparison to sample we55, 10 g milled zeolite of the fraction 63–125 µm and Cu powder (25 g, Schlenk Offset 6127) were used for the mixture. The compaction was done with part of the mixture, again in a 50 mm die. Because of the different compaction behavior of this mixture the compaction force was reduced to 20 kN. The sample was then treated in the same way as sample we55.
Both samples were brazed on a copper support plate in order to ensure a good thermal coupling to the carrier plate of the kinetic measurement setup.
Furthermore, a loose grain sample with the particle size 400–750 µm was also prepared under the same conditions for direct comparison with we55. The sample was designed with the same adsorbent mass and the same area as the sample we55. The resulting geometry, composition in terms of masses of the different parts of the three samples are listed in Table 1. For the determination of the adsorbent dry mass the sample was heated to 95 °C and dried under vacuum (rotary vane pump), then it was cooled to 40 °C and exposed to pure water vapor at 56 mbar (35 °C saturation temperature). The water uptake was measured volumetrically. The adsorbent dry mass was then calculated out of the water uptake and the equilibrium loading of zeolite NaY under these conditions (0.294 g/g).
The surface structure of the sintered Cu-zeolite composite was checked by optical microscopy (LEICA M205 C, Leica Microsystems GmbH, Wetzlar, Germany), see Figure 1.

2.2. Characterization Methods

The thermal conductivity of the samples was determined with a divided-bar apparatus, shown in Figure 2. The samples were placed with slight pressure between two quadratic aluminum plates. Good thermal contact between the sample and the aluminum plates is ensured by contact foils. The measurement follows the stationary approach, i.e., the upper aluminum plate is electrically heated with constant power to a temperature of about 30 °C, the lower plate is cooled to a constant temperature of about 20 °C. The thermal conductivity was calculated from the temperature difference Δ T which was measured using two Pt-100-thermocouples integrated into the aluminum plates and the electric power applied. Systematic thermal losses of the measurement arrangement were taken into account by preceding the measurements with calibration samples with known thermal conductivity.
In order to study the dynamic behavior of the samples under typical adsorption/desorption conditions, a variety of methods were used that are described briefly in the following. The experimental set-up for sorption kinetic measurements was described earlier [42,51,53,54].
First, the surface temperature of the samples was measured under a dry nitrogen atmosphere while the temperature of the carrier plate was changed rapidly (large temperature jump, LTJ). The measurement of the surface temperature was conducted with an infrared sensor (Heitronics KT15, Heitronics, Wiesbaden, Germany) through a ZnSe vacuum viewport. The sensor is focussed on a narrow spot (diameter 3–5 mm) on the top of the sample. The measured temperature depends on the surface emissivity of the sample. Prior to the measurement calibration is carried out to determine the surface emissivity. The nitrogen pressure was kept constant for these “inert-LTJ” measurements. The measurement conditions are listed in Table 2. With an appropriate numerical simulation model an overall heat transfer resistance can be identified by fitting the simulation model to the measured surface temperature of the sample as detailed in [42].
Second, the samples were measured under water vapor atmosphere while the temperature of the carrier plate was changed rapidly. This is the LTJ method as described earlier by Aristov et al. [55] and, for the set-up at the Fraunhofer ISE, described first by Sapienza et al. [53]. During these LTJ measurements in a closed volume, the pressures in the measurement chamber and the dosing chamber were measured with two pressure sensors (MKS Baratron 627B, Andover, MA, USA). With the ideal gas law, the water vapor uptake of the samples is calculated from the measured pressure, the volume of the chambers (41.82 dm3 and 0.92 dm3), and the temperature of the water vapor (two thin film Pt-100 sensors placed in the chambers). The studied temperature and pressure conditions are listed in Table 3. It should be noted that the temperature conditions in a sorption heat pump or chiller will be higher for the zeolite NaY/water working pair. The choice of these conditions was made due to restrictions of the measurement set-up to desorption temperatures below 95 °C.
Third, the samples were measured under water vapor atmosphere while the pressure was successively raised from 0.01 mbar to a saturation pressure of approximately 52.4 mbar. The temperature of the carrier plate was kept constant during the measurement at 40 °C. With these successive small pressure jumps (SPJ) under isothermal conditions the adsorption equilibrium uptake is calculated for the 40 °C isotherm. Since this is a volumetric measurement, the uptake is calculated with the ideal gas law out of the measured pressure difference for each small pressure jump and summed up successively. These measurements are important for answering the question of the impact of the manufacturing process on the sorption equilibrium properties. Before starting the small pressure jumps, the sample was heated to 95 °C and desorbed against a rotary vane vacuum pump ( p < 0.01 mbar) for 4 h to allow for an initial loading below 0.005 kg/kg.
In order to compare the sorption equilibrium of the NaY-copper composites with NaY zeolite, the equilibrium data of powder material (Köstrolith NaY P-TR, 2 kg charge, July 2017, similar to the NaY zeolite in the samples we55 and we95) were measured at the Fraunhofer ISE in a volumetric isothermal apparatus (“vstar”, Quantachrome Instruments, Boynton Beach, FL, USA) as well as two different gravimetric apparatuses (“dvs”, Surface Measurement Systems, Wembley, UK and “dsc” (TG-DSC 111, Setaram Instrumentation, Caluire-et-Cuire, France). More information about the “dsc” measurements was published before by Lenzen et al. [56].

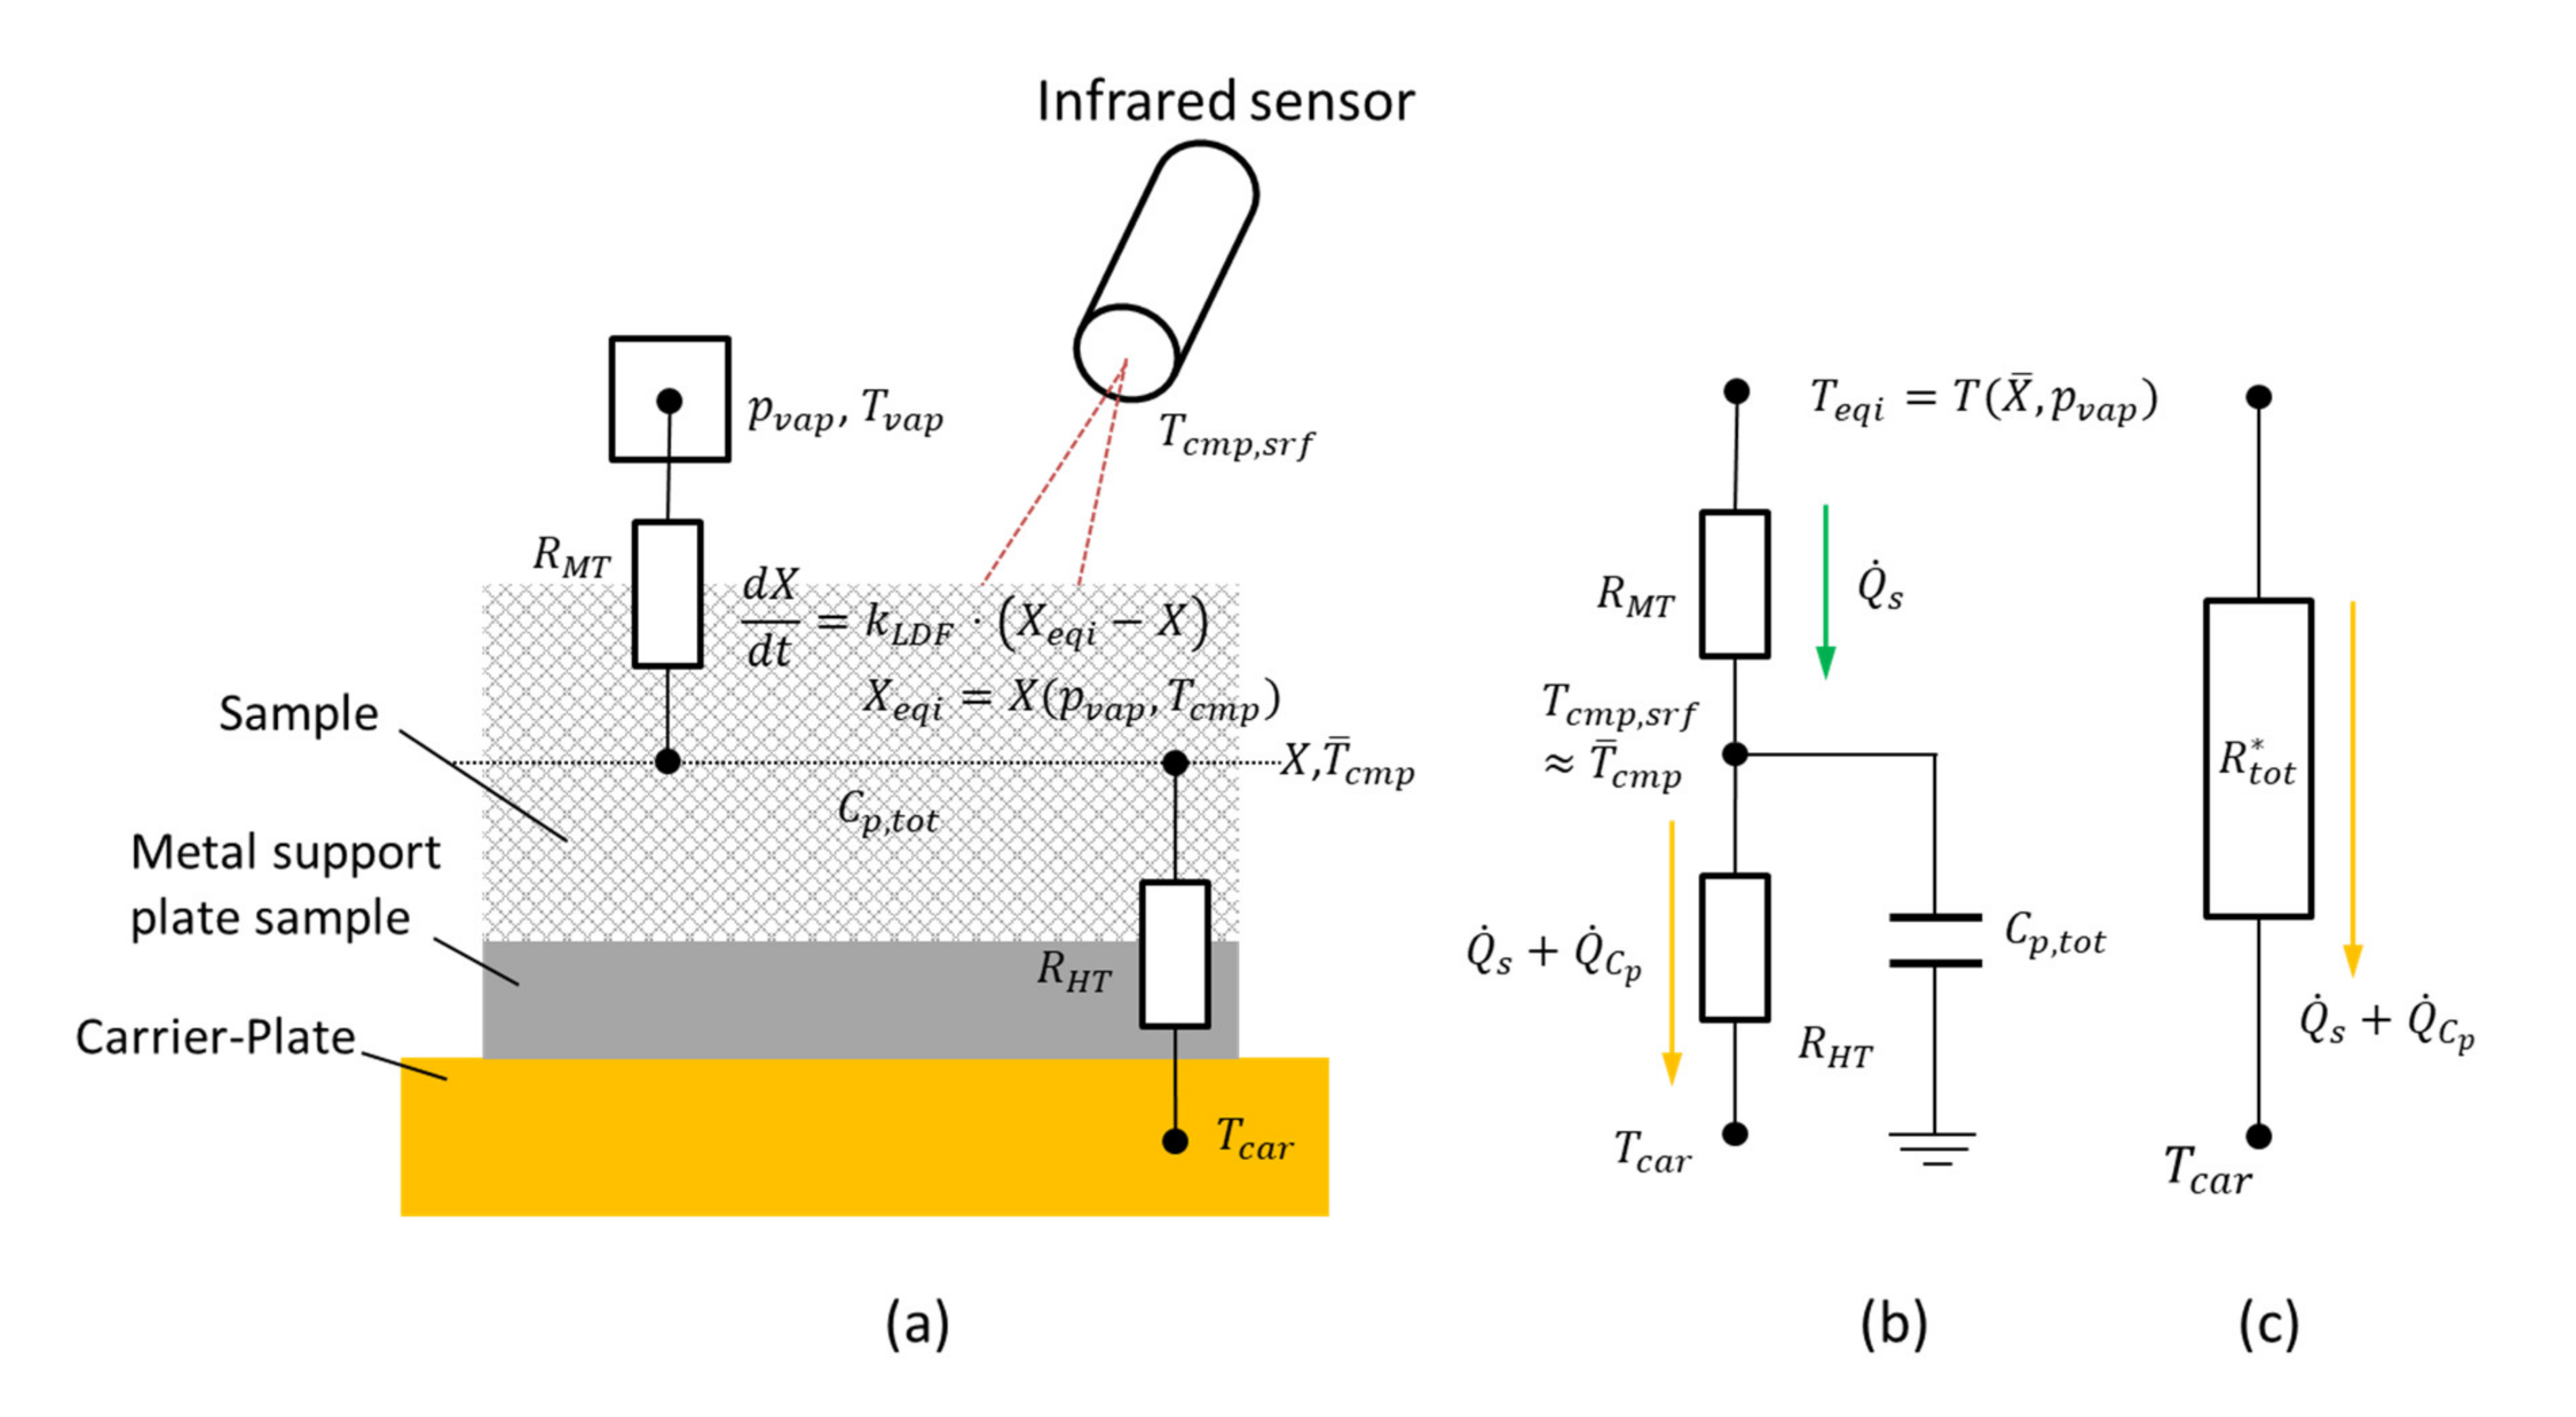
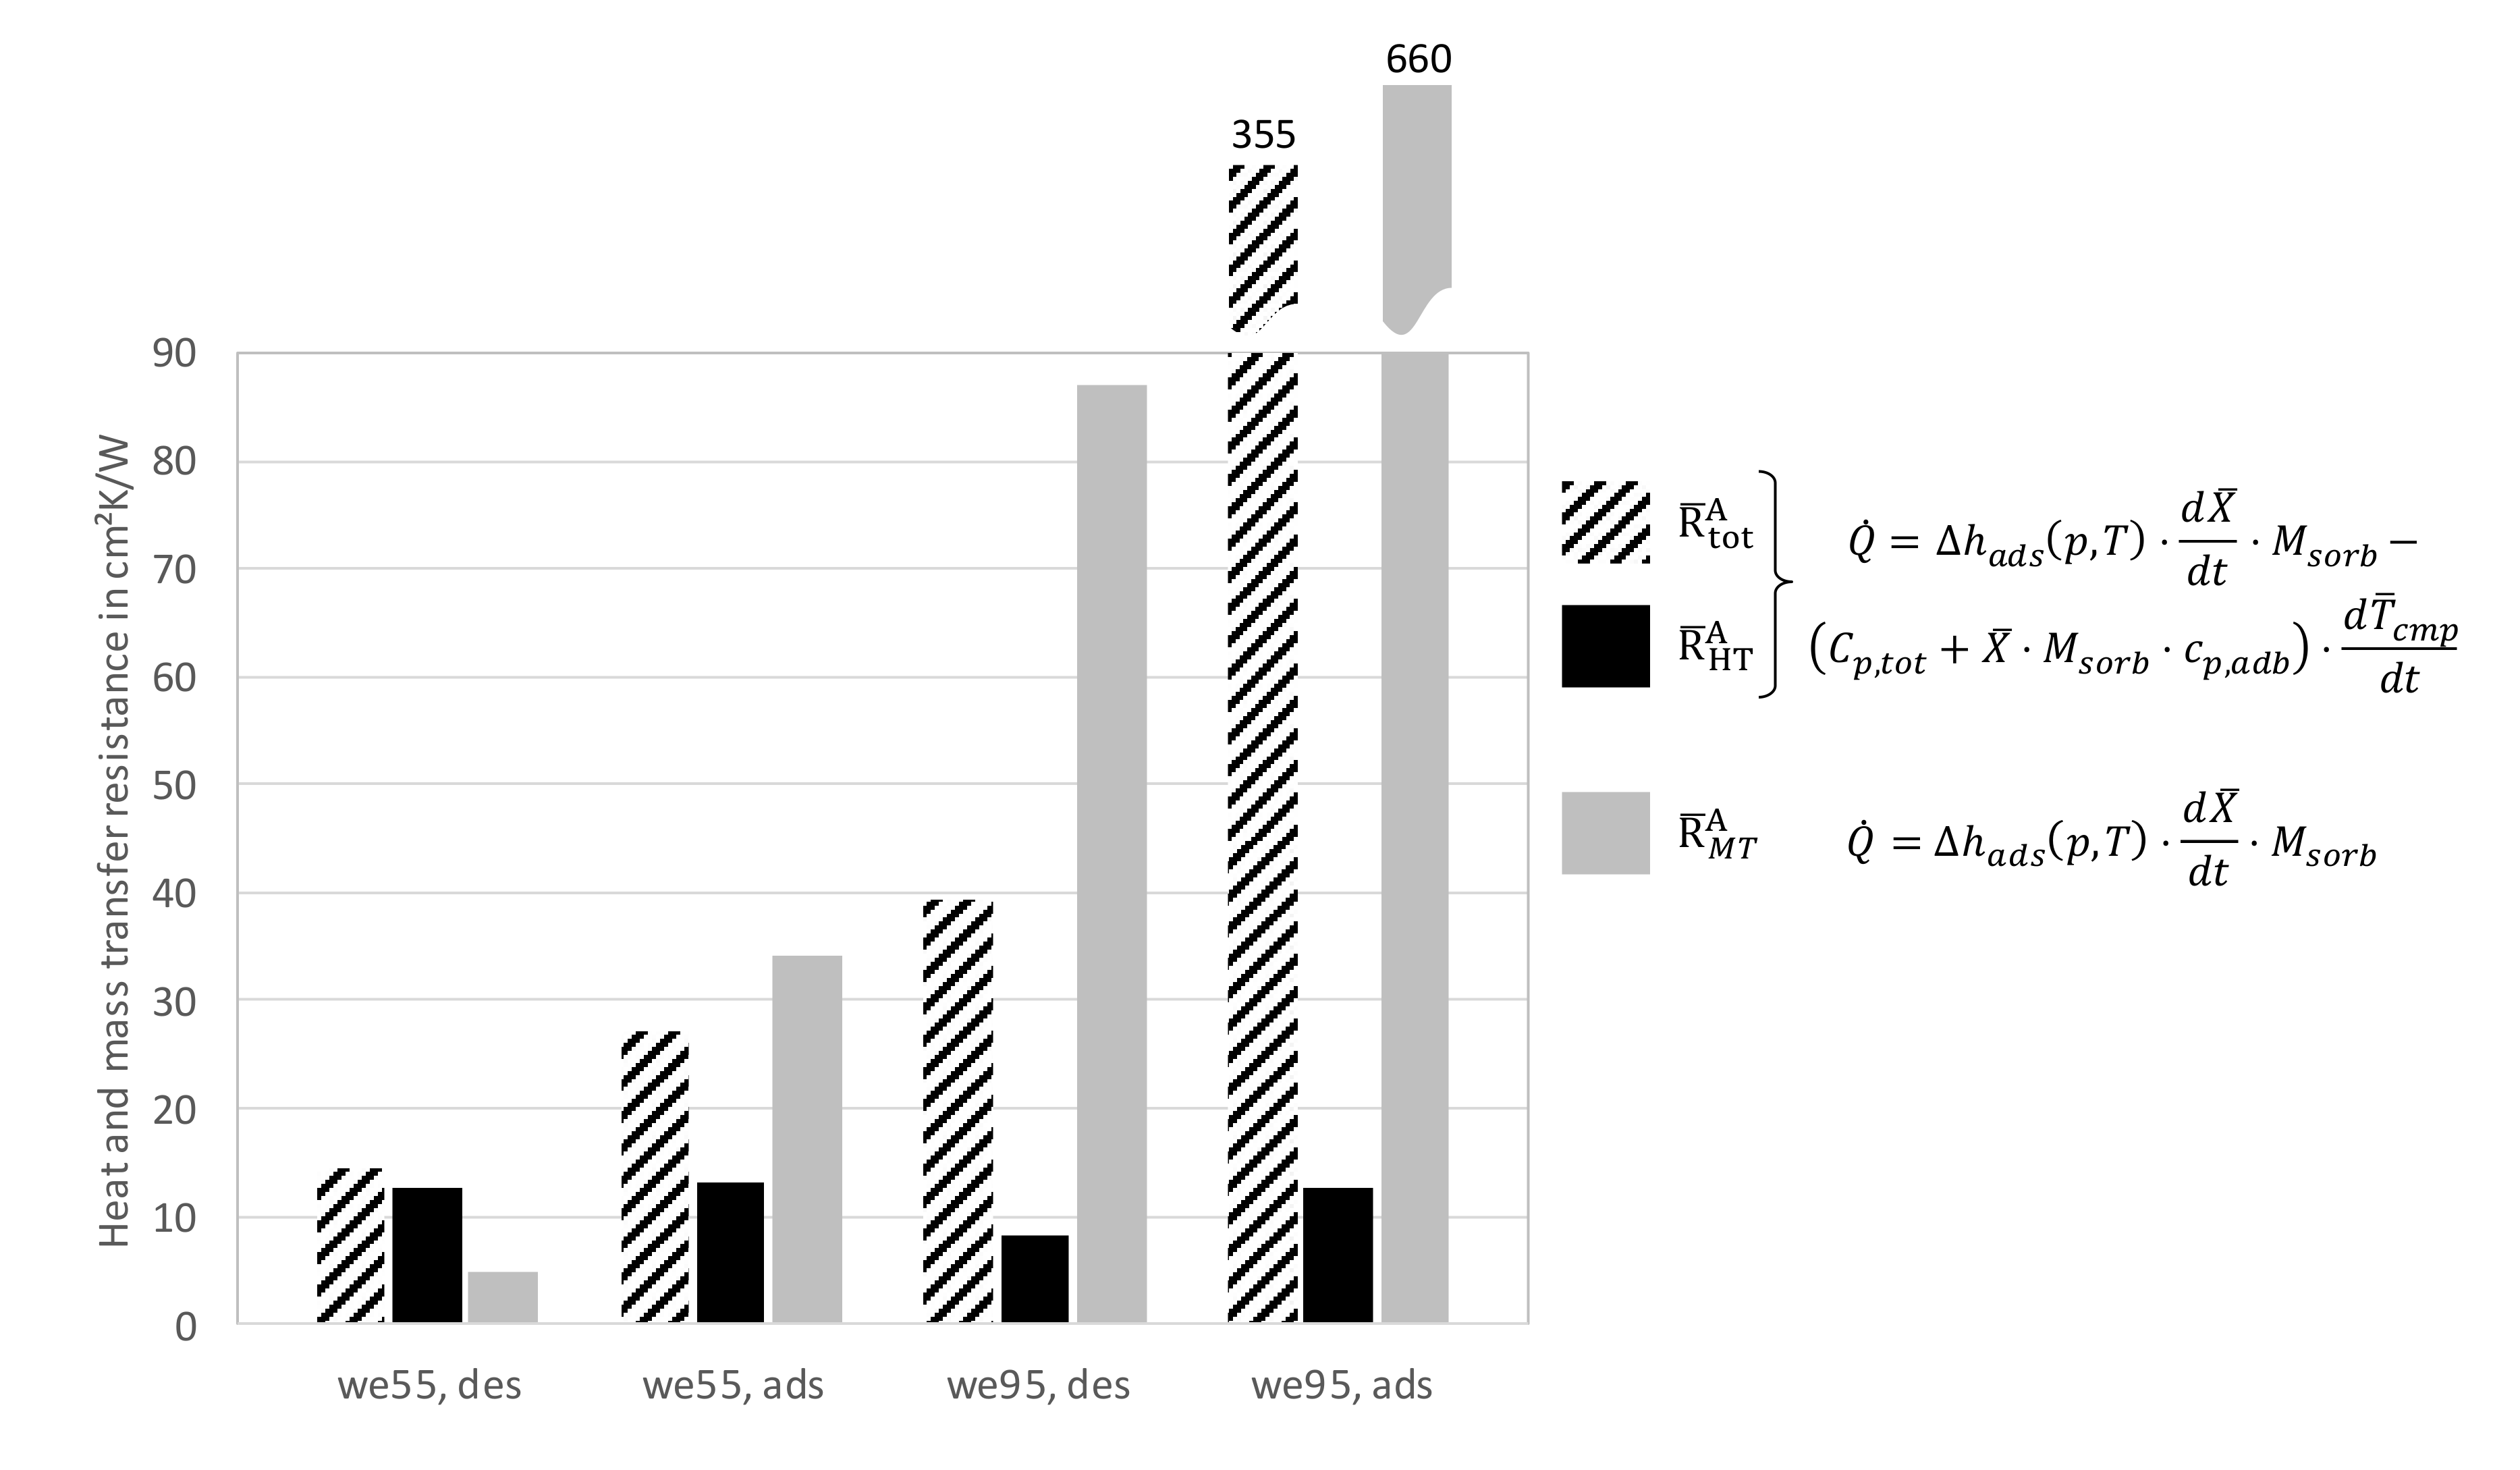
2.3. Evaluation of Heat and Mass Transfer Resistances

The basis of this method is a simple model with a heat transfer resistance and a mass transfer resistance as it is suggested by Lanzerath [49], Graf et al. [47], and Ammann et al. [23] for a loose grain configuration and adapted by Velte for an adsorbent metal composite structure [51]. This simple model is shown in Figure 3a for convenience. As shown in Figure 3b, the driving temperature equivalent for mass transfer is the difference between the equilibrium temperature of the adsorbent–metal composite T eqi and its actual mean temperature T ¯ c m p . For the actual temperature we use the measured surface temperature of the sample as a proxy. This simplifying assumption is necessary since the actual mean temperature of the composite cannot be determined in the experiment. The equilibrium temperature T eqi is calculated from the equilibrium data of the adsorbent with the actual loading X (determined from the mass balance of the measuring chamber, see Section 2.2) and the measured vapor pressure p v a p . The mass transfer resistance is calculated according to Equation (1) with the sorptive heat flux term Q · s .
R M T = T e q i T ¯ c m p Q · s
The heat transfer resistance is calculated according to Equation (2) from the temperature differences and the total heat flux term Q · s + Q · C p , which takes into account the change of the sample temperature.
R H T = T ¯ c m p T c a r Q · s + Q · C p
The sorption heat flux term is calculated according to Equation (3) with the adsorption enthalpy given in Equation (5).
Q · s = Δ h a d s p , T · d X ¯ d t · M s o r b
The total heat flux term in Equation (4) for the calculation of the heat transfer resistance accounts for the temperature change of the sample, i.e., the charging or discharging of the thermal capacitance as shown in Figure 3b. In Equation (4), C p , t o t is the total thermal capacity of the (dry) sample, c p , a d b is the specific heat capacity of the adsorbate, and Δ h a d s is the adsorption enthalpy given in Equation (5) with the adsorption potential A = R T ln p rel . For the specific heat capacity of the adsorbate c p , a d b we use the value of liquid water c p , l T .
Q · s + Q · C p = Δ h a d s p , T · d X ¯ d t · M s o r b C p , t o t + X ¯ · M s o r b · c p , a d b · d T ¯ c m p d t
Δ h a d s p , T = Δ h l v T + A p , T
Please note that the heat and mass transfer resistances in Equations (1) and (2) are resistances without capacitive effects. These resistances are directly related to the physical heat and mass transfer parameters and their values can be compared directly in order to judge whether heat or mass transfer is the limiting process. Another point is the calculation of a total heat and mass transfer resistance (or impedance) as suggested by Ammann et al. [23] and shown in Figure 3c.
Since we use two different heat flux terms for the calculation of these resistances, we cannot simply add our values for R M T and R H T as suggested by Ammann et al. [23]. Instead, if we want to calculate the total heat and mass transfer impedance (which includes capacitive effects) we will have to use Equation (6). The value of R t o t * is relevant for measurements that do not include the surface temperature. In this case we cannot differentiate between heat and mass transfer. Furthermore, this impedance is not directly related to the physical heat and mass transfer parameters because it is biased by the capacitive effects.
R t o t * = T e q i T c a r Q · s + Q · C p
Regarding the time averaging method and the choice of the evaluation time of the heat and mass transfer resistances we will stick to the definition of Ammann et al. [23] in the following. The time averaged heat transfer resistance is given in Equation (7), the time averaged mass transfer resistance is given in Equation (8), and the time averaged total heat and mass transfer resistance is given in Equation (9). The integrals in Equations (7)–(9) are evaluated from the beginning of the measurement ( t = 0   s ) to the time when 80% of the equilibrium loading is reached ( t = t 80 ).
R ¯ H T = 0 t 80 T ¯ c m p T c a r d t 0 t 80 Q · s + Q · C p d t
R ¯ M T = 0 t 80 T e q i T ¯ c m p d t 0 t 80 Q · s d t
R ¯ t o t = 0 t 80 T e q i T c a r d t 0 t 80 Q · s + Q · C p d t
A comparison of samples with different sizes is possible if the mean values of the resistances are scaled with a geometric sample property, such as its area A or its volume. According to Equation (10) the area-scaled resistances are calculated.
R ¯ A = R ¯ · A

3. Results

3.1. Evaluation of Thermophysical Quantities

The main sample properties in terms of geometry, metal and adsorbent mass were already listed in Table 1. For the evaluation and the understanding of the inert-LTJ and LTJ measurements it is important to evaluate the overall thermal mass of the sample as detailed by Gluesenkamp et al. for adsorption heat exchangers [33]. These data are listed in Table 4 for all samples. The corresponding thermo-physical material properties are listed in Table 5. The relevance of the evaluated quantities will be explained in the following:
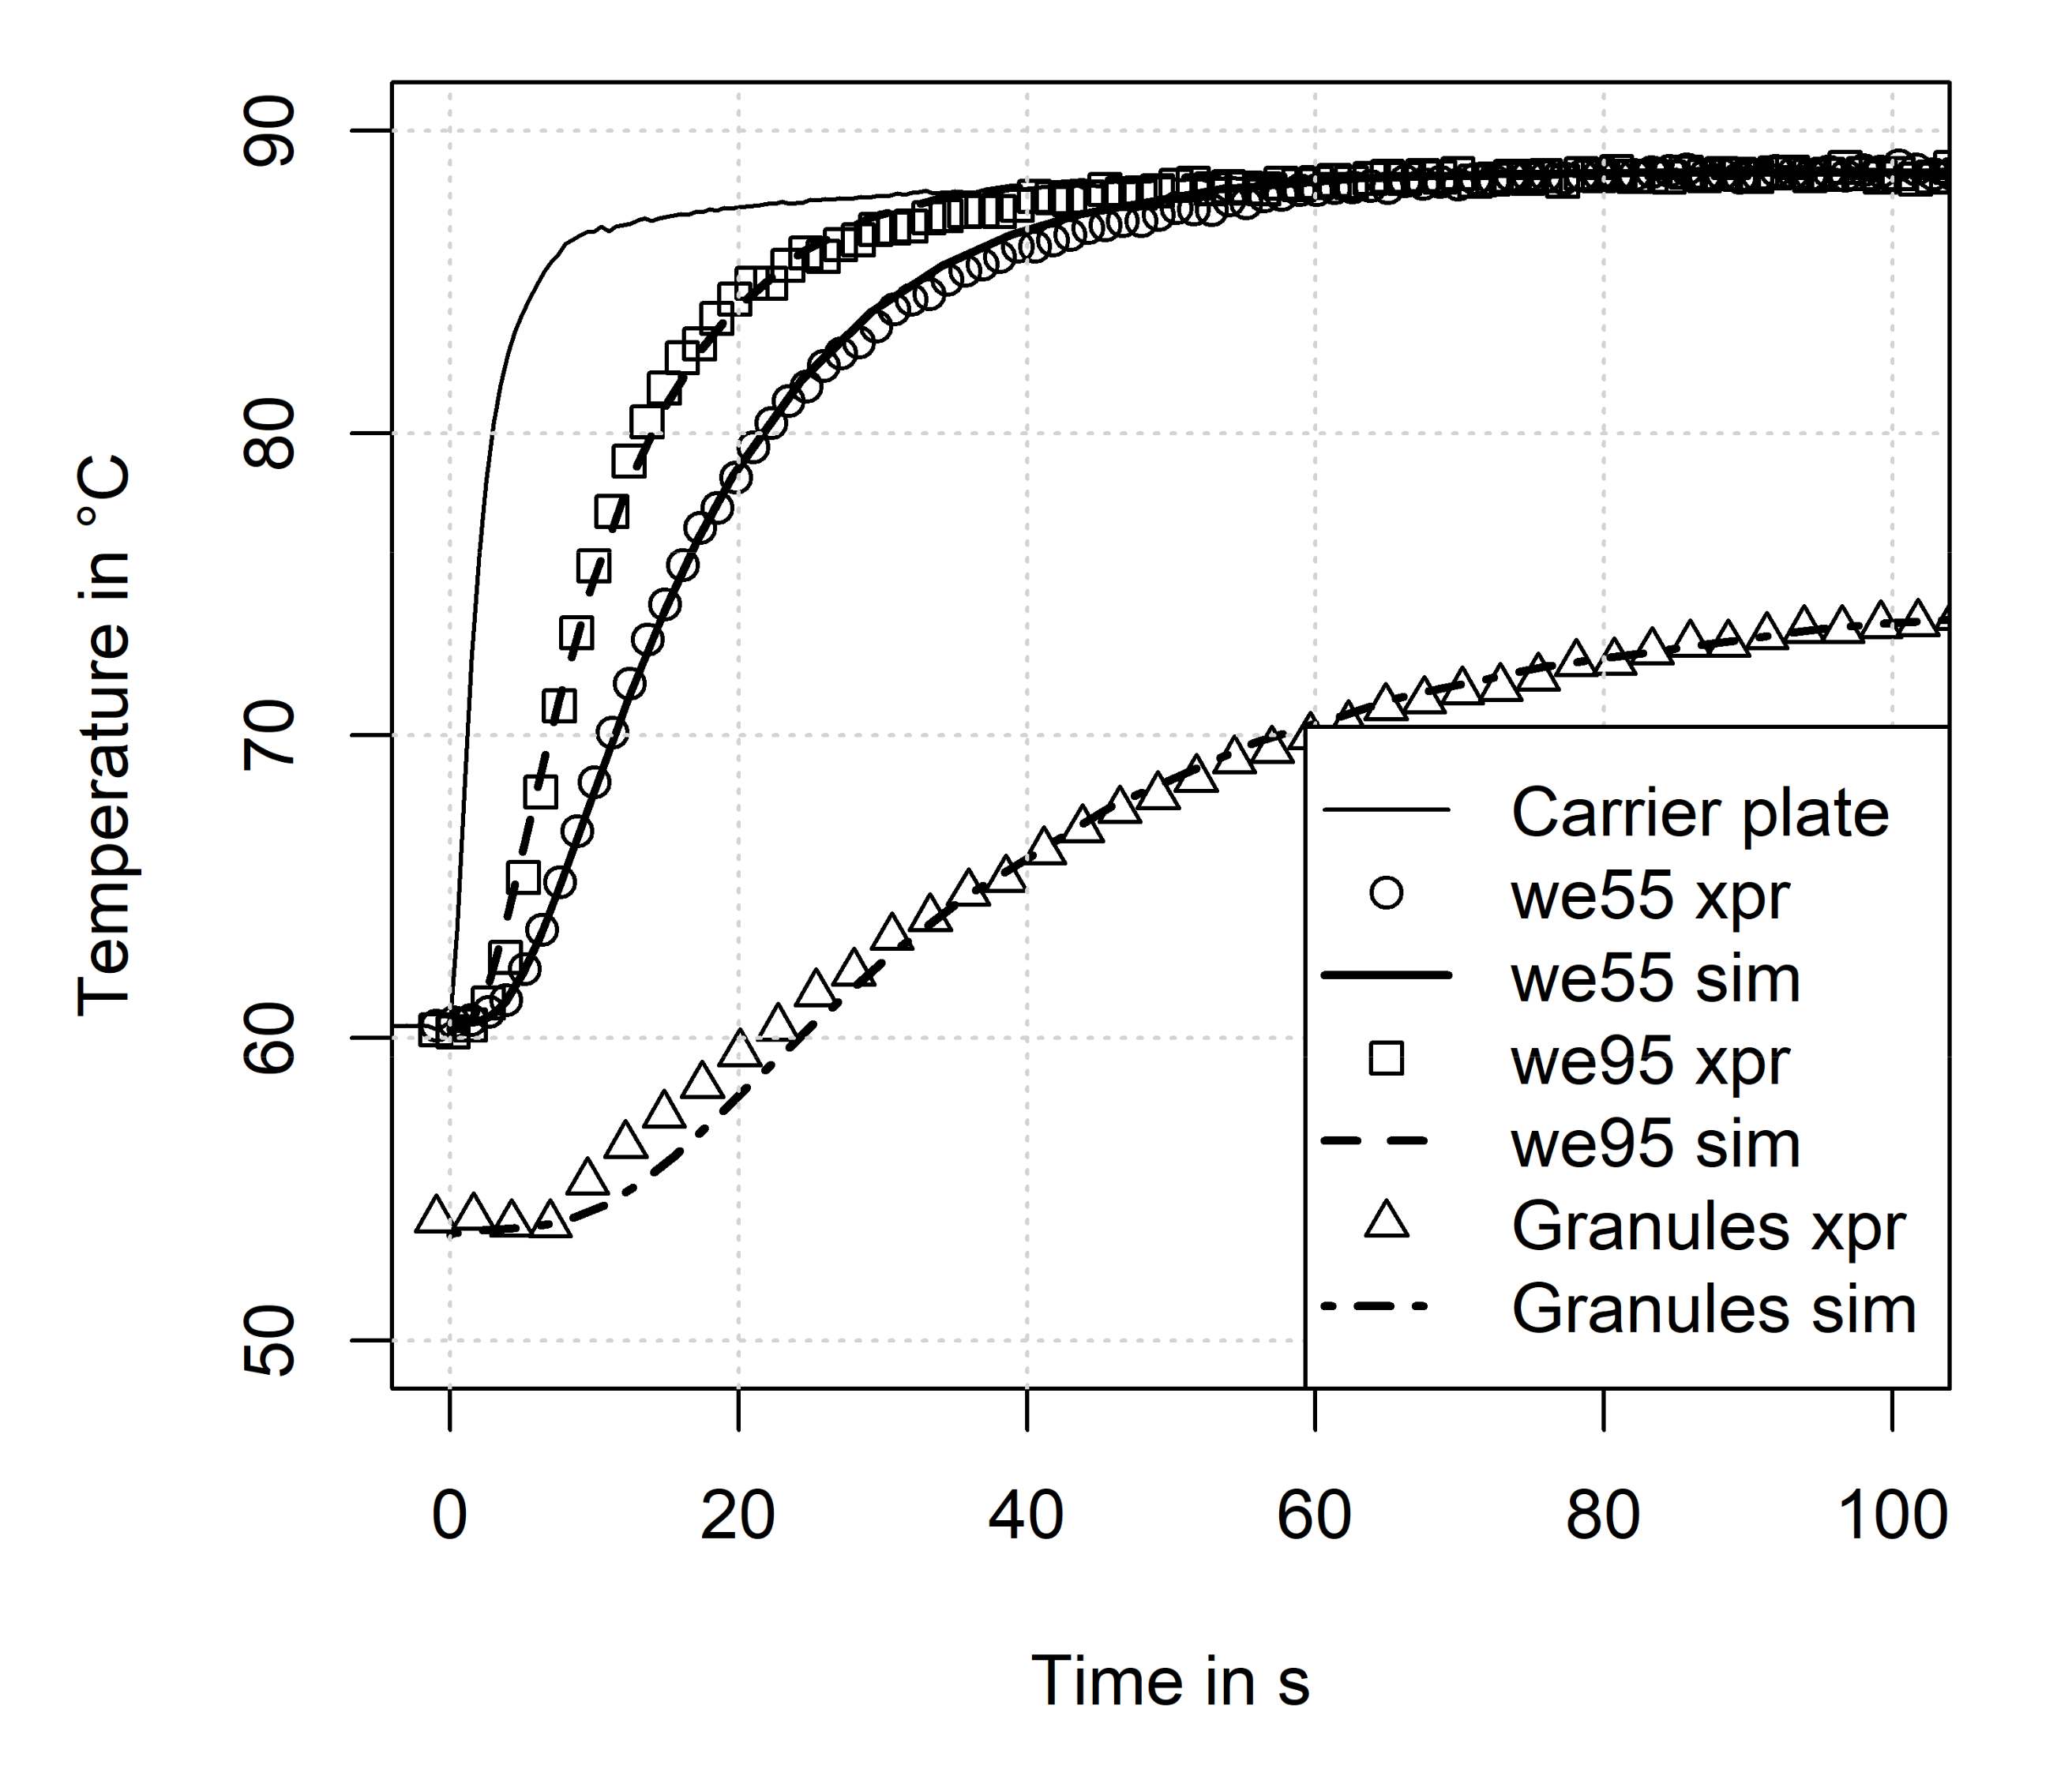
  • The overall thermal mass is relevant for the interpretation of the inert-LTJ experiments. The higher the thermal mass, the longer the equilibration of the temperature takes if the samples have the same thermal resistance.
  • The adsorbent mass per composite volume is an important quantity for the heat exchanger design: the higher this figure, the more compact the heat exchanger will be. This is the basis for a high power density.
  • The specific thermal mass (STM) per adsorbent mass according to Gluesenkamp et al., in Equation (11) is an indicator for the efficiency that can be achieved if the structure is applied in an adsorption heat exchanger [33]. The lower this quantity is, the more efficient a simple adsorption cycle without heat recovery will be as less heat is required to change the adsorption heat exchanger temperature between adsorption and desorption.
S T M = C p , t o t M s o r b
If we compare the adsorbent mass per composite volume of sample we55 with the adsorbent bed density of 524 kg/m3 (Granules) it can be stated that the additional copper fibers are almost entirely placed in the void space between the particles. However, the STM of the composite is more than twice as high as the adsorbent specific heat capacity. The comparison to the directly crystallized aluminum fibers with an STM of 1.91 kJ/(kg·K) shows that the two samples we55 and we95 have a slightly higher STM, but the difference is between 21% and 34% relative to the aluminum fiber sample [42].

3.2. Heat Transfer Properties

The overall thermal conductivity of the samples was measured with the method described in Section 2.2. The data are listed in Table 6 for a mean temperature of 25 °C and an estimated loading of 0.29 g/g.
The samples we55 and we95 including the support plate were measured with the inert-LTJ method. According to the evaluation method developed earlier by Velte et al. [42], the resulting parameters are listed in Table 7. The thermal conductivity of the composite is nearly the same for both samples within the uncertainty. Since sample we55 is thicker than sample we95 there is a pronounced difference in the overall thermal resistance between the two samples—sample we95 has a 30% lower thermal resistance than sample we55.
The overall heat transfer resistance is calculated according to Equation (12). The factor 1/3 for the calculation of the composite heat transfer resistance follows from the model of a spatially equally distributed heat source term [60]. This model holds true for heating up and cooling down the sample without adsorption (inert-LTJ) and also in the case of adsorption or desorption this is a good approximation. In Equation (12) the heat transfer resistance of the support plate is neglected due to the high thermal conductivity of copper. Furthermore, the thermal contact between adsorbent–metal composite and support plate α m t , s o r b is assumed to be ideal. Thus, this term is neglected in case of the adsorbent–metal composite samples.
R ¯ H T , t o t A = 1 α c a r , m t + 1 α m t , s o r b + 1 3 d c m p λ c m p
In Figure 4 the measured and simulated surface temperatures of the inert-LTJ measurement of the three samples are shown. The simulations were conducted with a transient, one-dimensional heat transfer model according to Velte et al. [42]. The measured and the simulated surface temperatures are in good agreement, the mean deviation is below 2.3%. It should be noted that all three samples were measured under the same temperature conditions. The large deviation between the initial and end temperatures of the adsorbent-metal composite samples and the “Granules” sample results from the thermal losses between the sample and the surrounding measuring chamber. These losses do not play a role if the overall heat transfer resistance of the sample is low. Since the overall heat transfer resistance of the “Granules” sample is more than 10 times higher compared to the adsorbent–metal composite samples the impact of the thermal losses on the measured surface temperature is remarkable.

3.3. Sorption Equilibrium Data

The sorption equilibrium data obtained for the two composite samples we55 and we95 by SPJ compared to volumetric adsorption measurements of the initial adsorbent power (Figure 5) show that all datasets match for a pressure >50 Pa within their error bars. The uncertainty σ of the incremental uptake Δ X is calculated according to Equation (13), where Δ M is the water uptake that is calculated with the ideal gas law. This uncertainty of the incremental uptake has to be summed up in case of successive pressure jumps as shown in Figure 5. A more detailed error propagation analysis for this measurement set-up can be found elsewhere [51].
σ Δ X = σ Δ M M s o r b + Δ M M s o r b 2 · σ M s o r b
For the lower pressure region there are pronounced differences between the measurements that cannot be explained only with the measurement uncertainties. Sample we95 was measured three times under the same temperature and pressure conditions but with different adsorption times (increasing from #1 to #3). With increasing adsorption time, the results of sample we95 get closer to the results of sample we55 in the pressure region <50 Pa. From the evaluation of the sorption dynamics we will show below that sample we95 has a strong mass transfer limitation, especially at low pressure. Thus, we think that the difference between those samples is mainly because sample we95 has not enough time to reach the equilibrium in the lower pressure range. However, both samples show strong deviations from the equilibrium measurements of the NaY powder in the low pressure region <50 Pa. There may be also a mass transfer limitation in the equilibrium measurements of the powder, or the powder differs from the granular adsorbent in that pressure region.
In order to calculate the equilibrium loading, pressure, and temperature, the equilibrium data have to be fitted to an equilibrium model. We decided to use the common and simple Dubinin model as the large and erratic variance in the data would not allow to sufficiently inform more sophisticated models.
In Figure 6 the Dubinin-transformed results for the volumetric measurements on we55 and we95 are shown with the results of gravimetric measurements performed at the Fraunhofer ISE (“dvs” and “dsc” apparatuses). Furthermore, a dataset of Pinheiro et al., is shown [57]. This dataset contains gravimetric measurement data. There is a huge difference between volumetric (SPJ) and gravimetric data (dvs, dsc, data of Pinheiro et al. [57]) if the adsorption potential is higher than 500 kJ/kg, as was shown earlier by Velte [51]. The basic problem with the volumetric measurement data is the measurement uncertainty of the pressure in the range between 5 and 50 Pa. Here, typical measurement uncertainties of 5–10 Pa have a strong impact on the adsorption potential. The uncertainties of the specific adsorbed volume W are calculated according to Equation (14) where ρ l is the density of liquid water.
σ W = σ X ρ l T + X ρ l 2 T · ρ l T · σ T
The uncertainties of the adsorption potential are calculated according to Equation (15) with the adsorption potential A = R T ln p rel .
σ A = A p · σ p + A T · σ T
Furthermore, the pressure increase due to the inevitable leakage will bias the results to a lower adsorption potential. For this reason, we used only the gravimetric measurement data for the gaussian process regression (GPR) [60,61]. This results in a look-up table for W(A), which is used for calculating the equilibrium loading for a given set of temperatures and pressures.

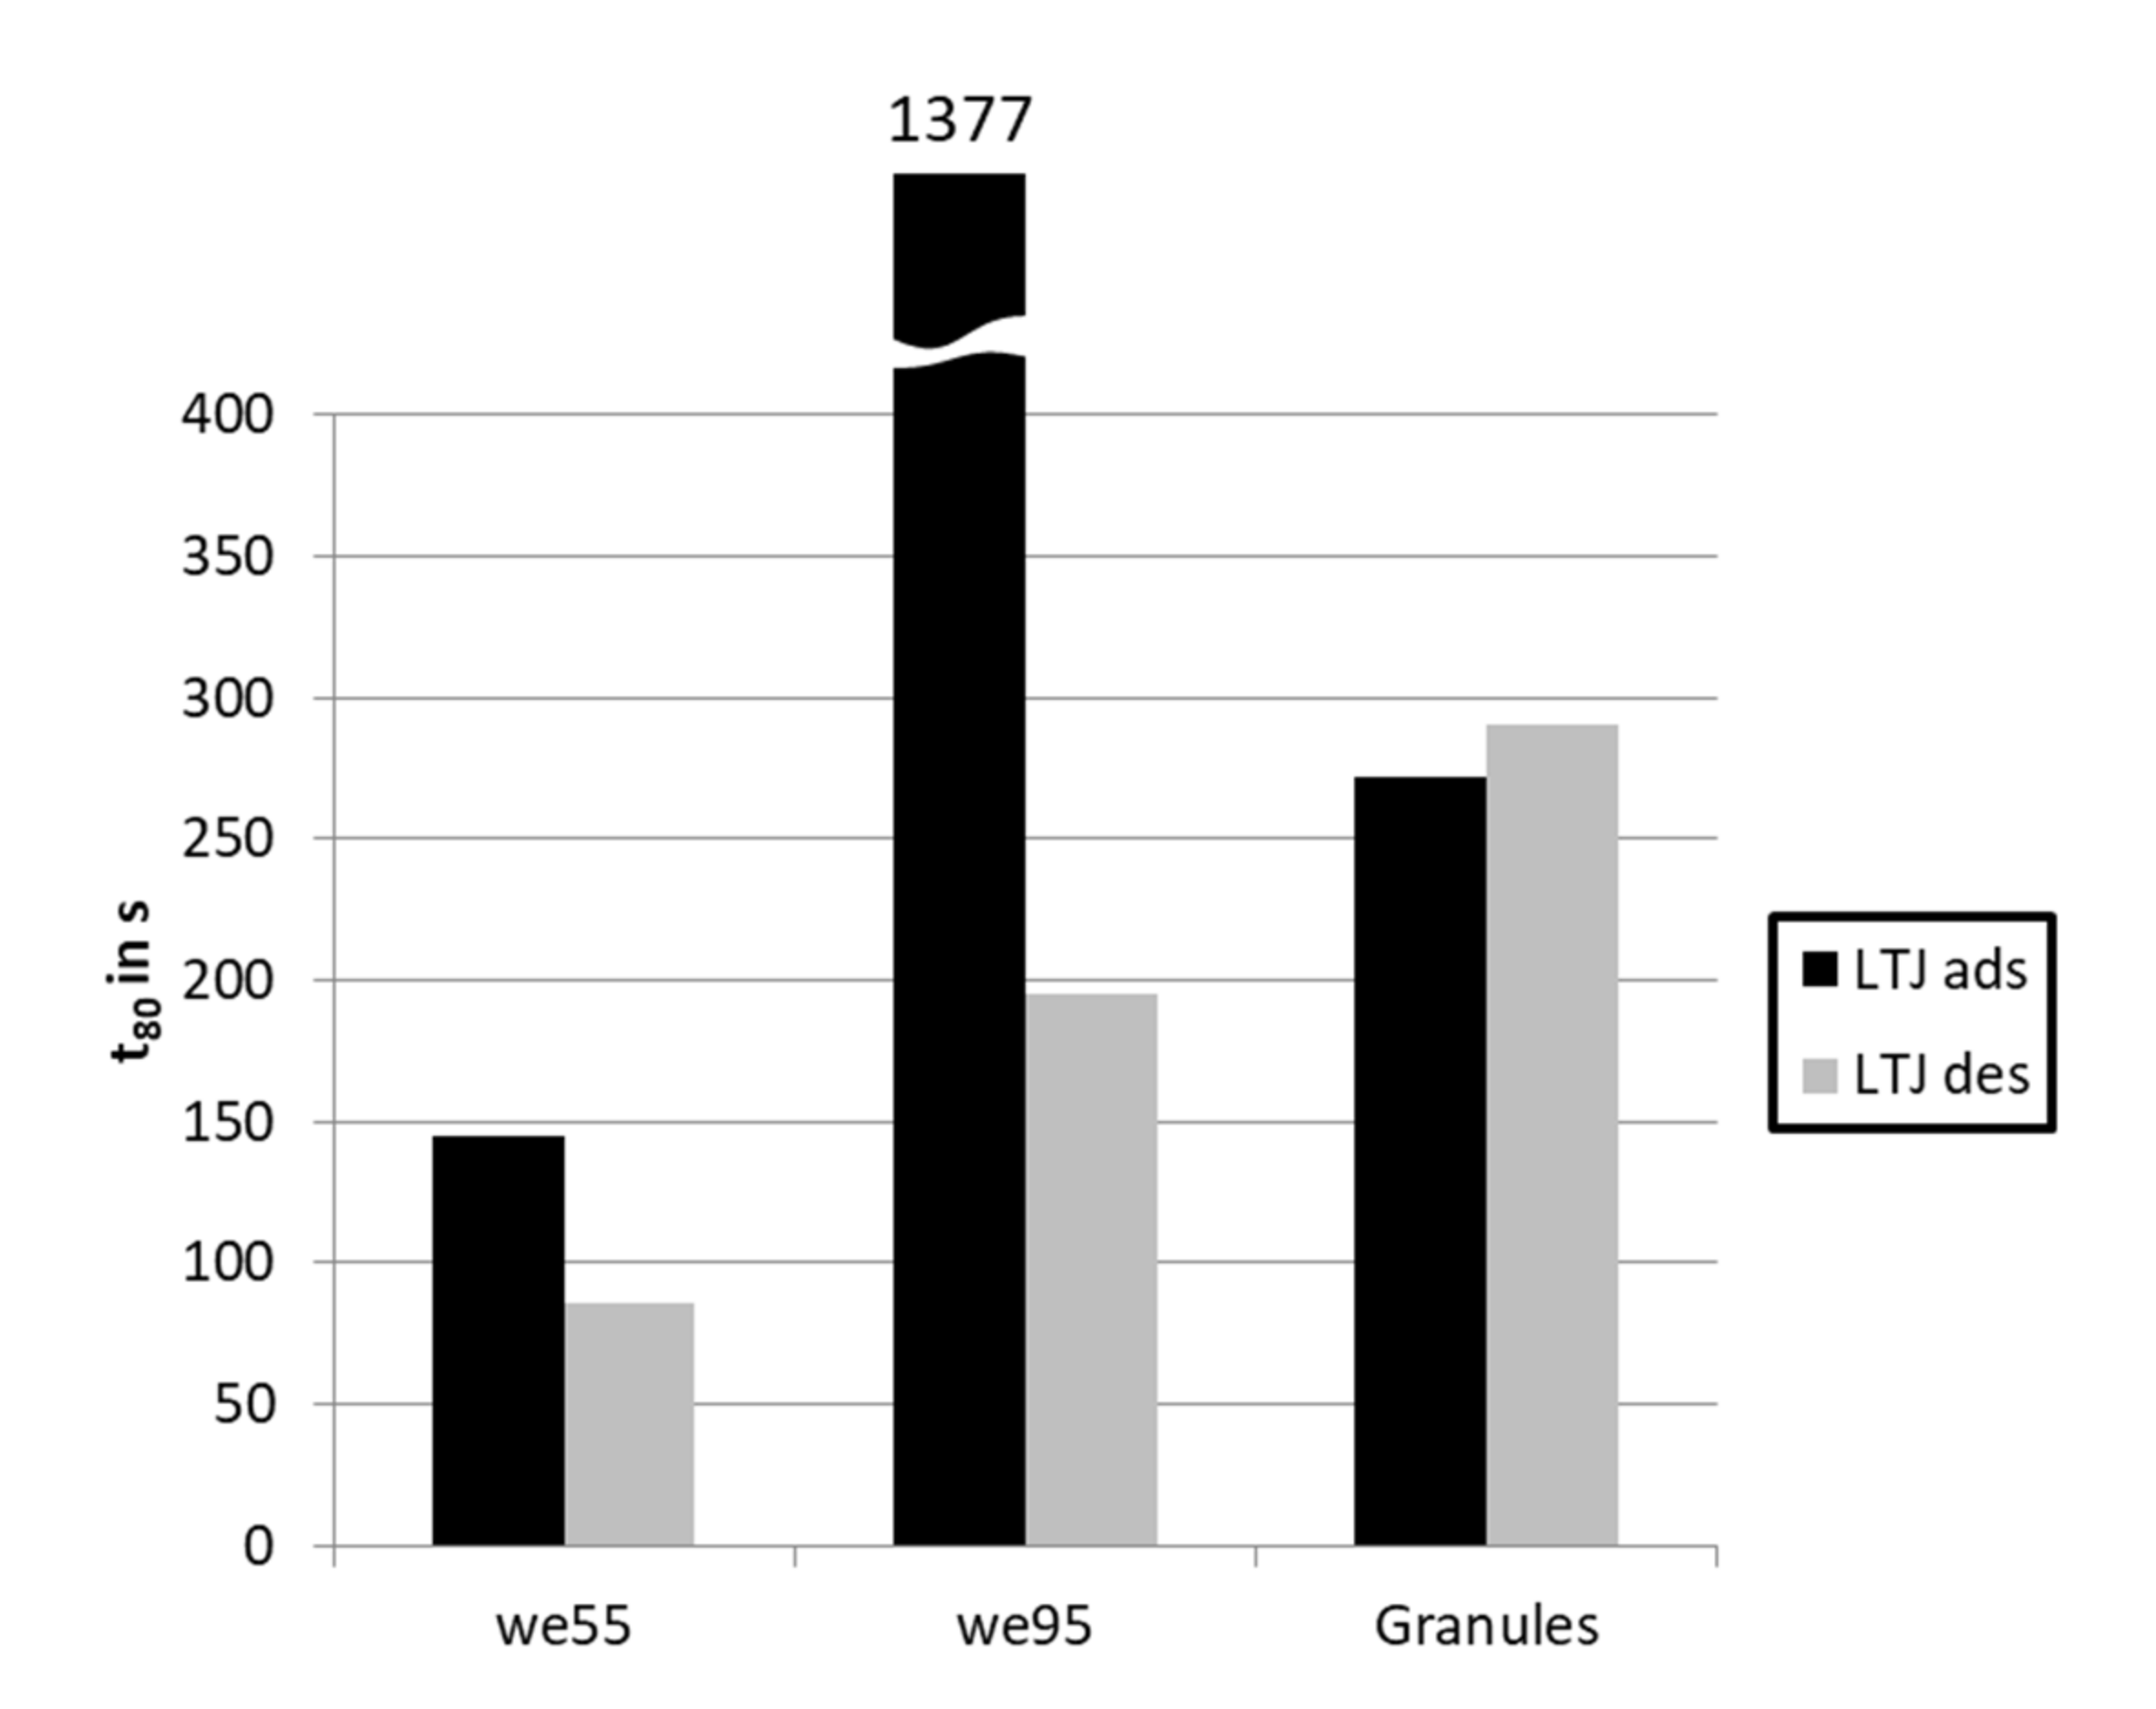
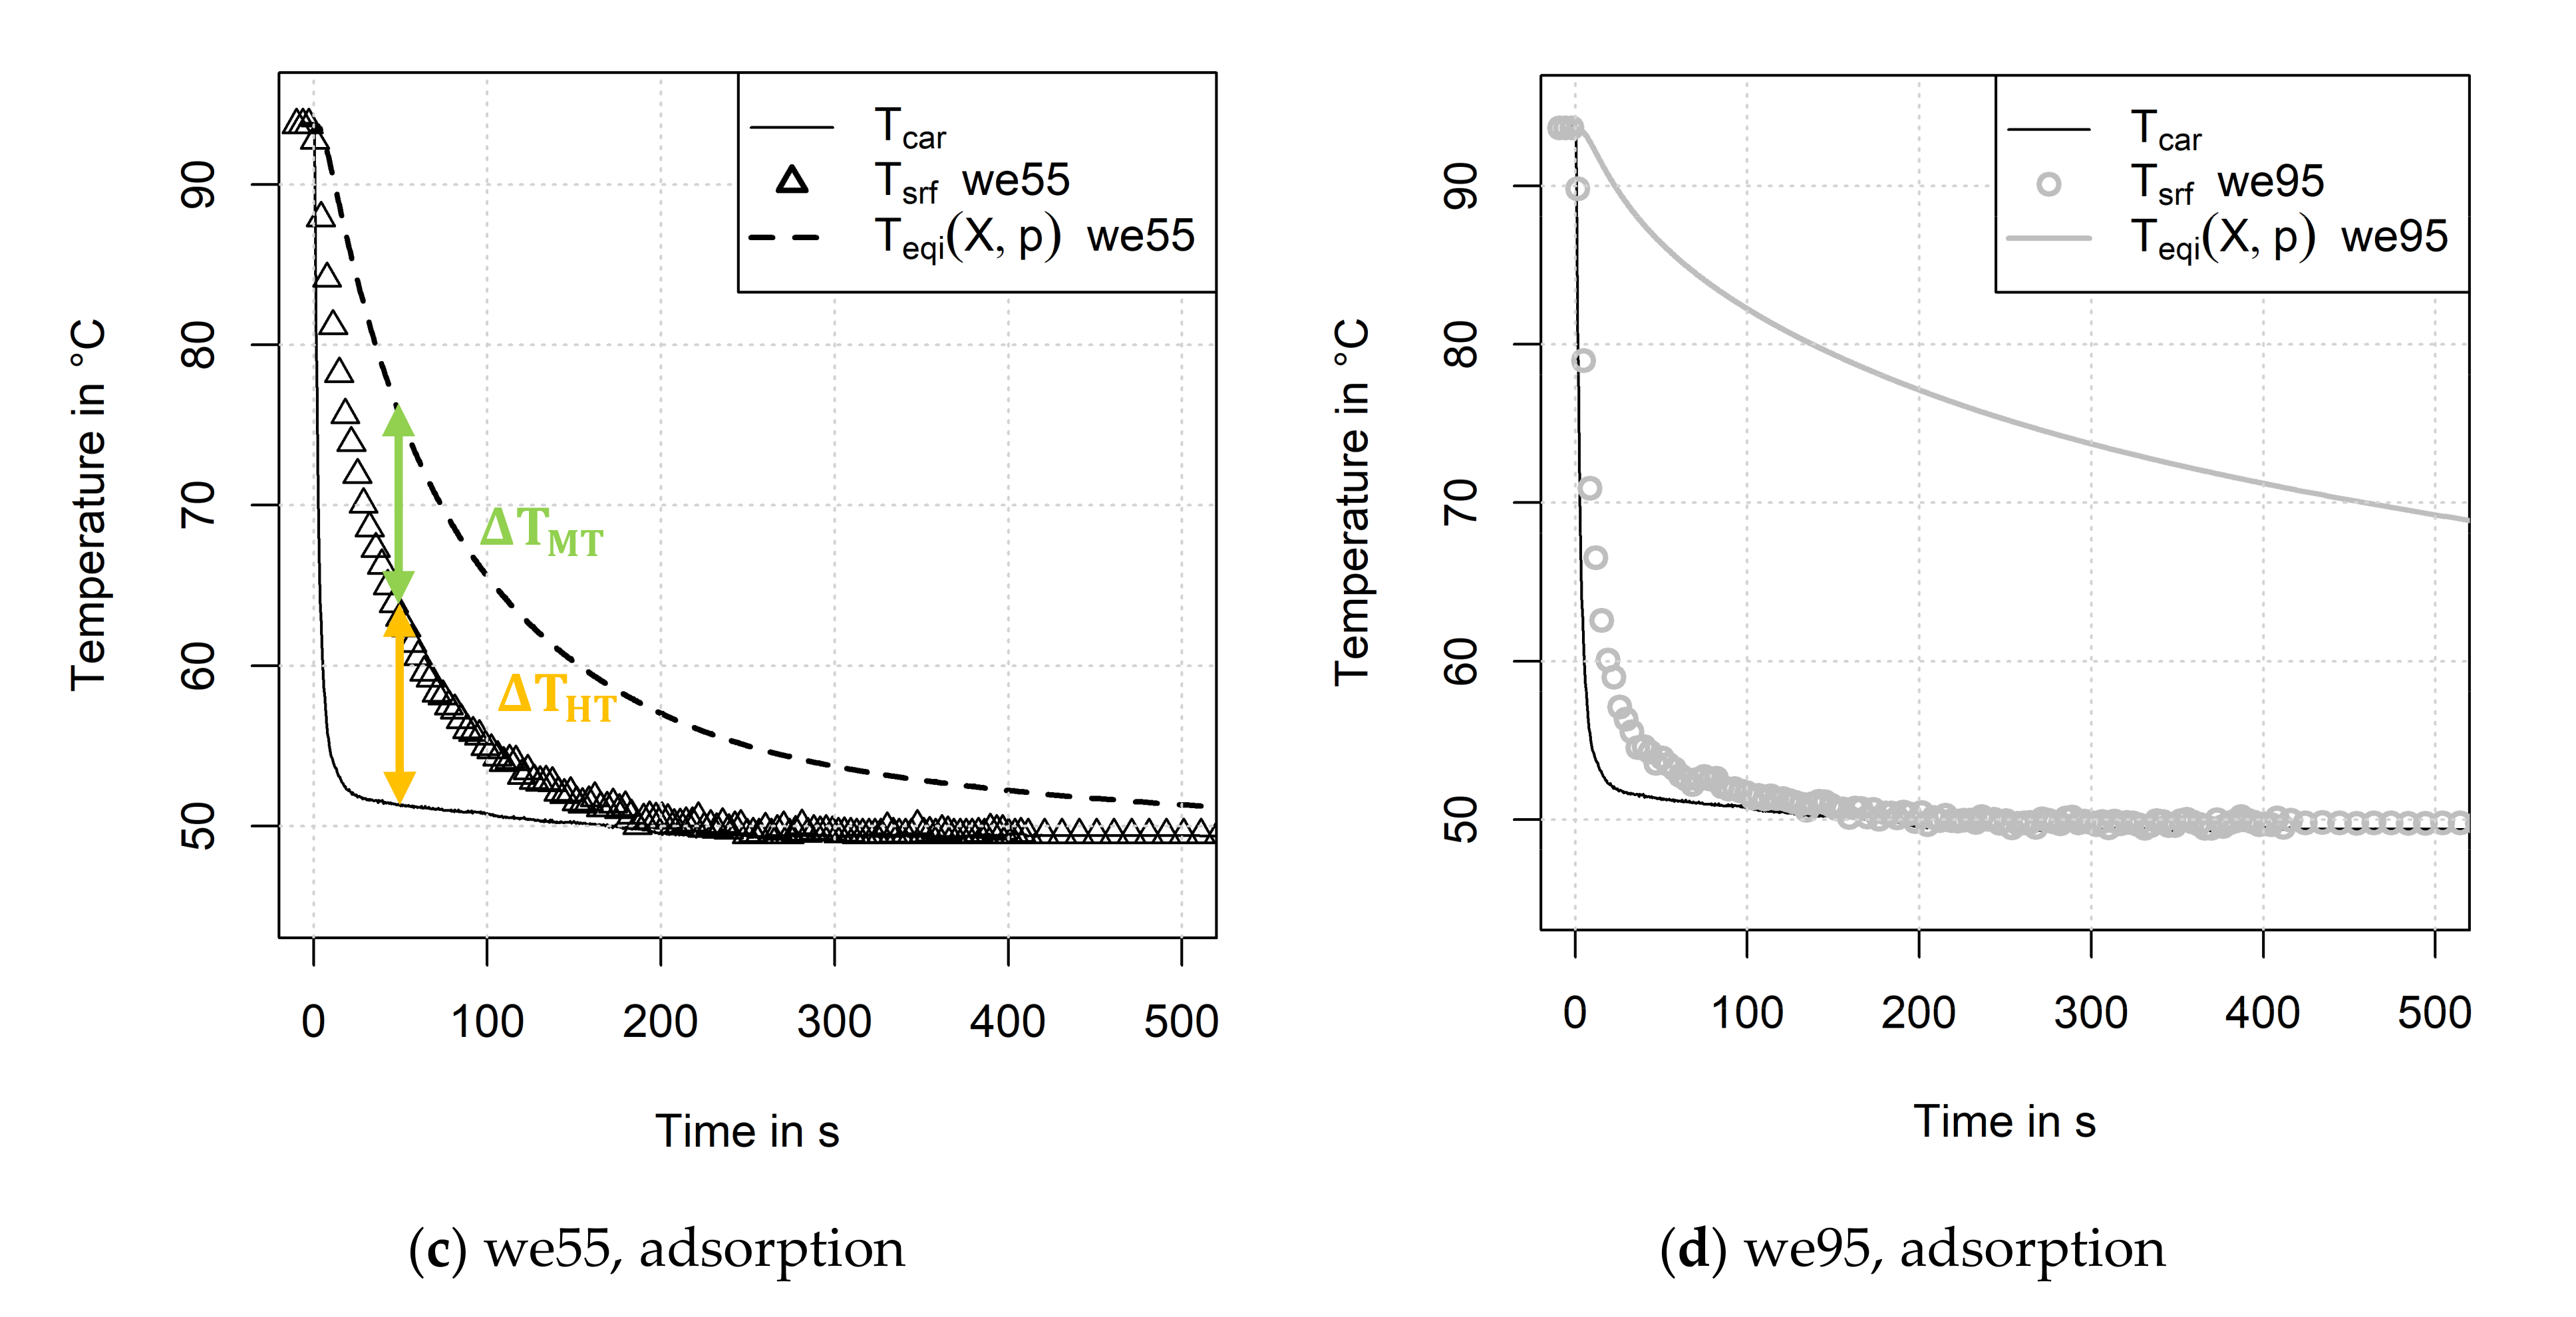
3.4. Evaluation of Sorption Dynamics

The results of the LTJ measurements as listed in Table 3 are shown in Figure 7. The adsorption takes much longer than desorption for both samples. Furthermore, sample we95 is slower than sample we55, both in adsorption and desorption, although it has lower heat transfer characteristics as shown in Table 7.
For a quantitative comparison of the four measurements, different dynamic quantities are given in Table 8 and in Figure 8 for convenience. The main finding regarding sample we55 is the fast sorption dynamics in adsorption and desorption compared to the “Granules” sample. The improved heat transfer in the adsorbent–metal composite “we55” improves the sorption dynamics. However, the overall heat transfer resistance of sample “we55” is approximately 10 times lower than the overall heat transfer resistance of the sample “Granules”. The improvement in sorption dynamics is not as good as the improvement in heat transfer resistance. It can be concluded that with the improved thermal conductivity of the sample the mass transfer becomes the limiting factor for the overall performance.
Furthermore, it can be seen in Table 8 and in Figure 8 that the adsorption of sample we95 takes nearly 10 times longer than the adsorption of sample we55. In the case of desorption, the factor is below 3. From these findings it can be deduced that the main limitation of sample we95 is the mass transfer.
In order to further support this deduction, we evaluated the equilibrium temperature T e q i X , p as described in Section 2.3 and show it together with the measured surface temperature T s r f and the carrier plate temperature T c a r in Figure 9 in a first step. The difference between the surface temperature of the sample Tsrf and the carrier plate temperature Tcar is a measure for the heat transfer limitation, the difference between Teqi(X,p) and Tsrf is a measure for the mass transfer limitation as shown in Figure 9c. A qualitative analysis of the temperature plots in Figure 9 yields:
  • desorption of we55 is only heat transfer limited
  • adsorption and desorption of we95 is only mass transfer limited
  • adsorption of we55 is both heat- and mass transfer limited.
A quantitative analysis was carried out with the calculation of Equations (1) and (2) to determine the heat and mass transfer resistances. The time-dependent curves of the two resistances for the desorption measurement of sample we55 are shown in Figure 10. It is worth noting that there was no fitting of a function necessary to calculate the time derivatives for the surface temperature and the uptake. The time derivatives were calculated directly out of the measured signals with the “grad”-function in the package “numDeriv” in the statistical computing software “R” (version 4.0.2).
In Figure 11 the mean values of the heat and mass transfer resistances, according to Equations (7)–(9), and scaled with their sample area R ¯ A are shown as bar plots. The first point of the analysis is the comparison of the heat transfer resistance (black bar) with the mass transfer resistance (gray bar). Except for the adsorption measurement of we55, all measurements are completely dominated by the mass transfer resistance. If we compare the adsorption and the desorption measurements it is obvious that the mass transfer resistance in the desorption measurement is much lower than it is in the adsorption measurement of both samples. It is worth noting that the total heat and mass transfer resistance R ¯ t o t A * is not the sum of R ¯ H T A and R ¯ M T A . As discussed in Section 2.3, in the evaluation of R ¯ t o t A * the mass transfer resistance will be underestimated—here by a factor between 2 and 2.5 for the mass transfer dominated measurements of sample we95. In case of the more heat transfer dominated adsorption measurement of sample we55, the bias is not that strong.
This quantitative analysis makes it possible to compare the heat transfer resistances with the results of the inert-LTJ measurements in Table 7. The values for R ¯ H T A in Figure 11 are in good agreement with the results of the inert-LTJ measurement in Table 7. The measurement of the “Granules” sample is governed completely by the heat transfer resistance, which is approximately 150 cm2K/W. This high value is only exceeded in the adsorption measurement of sample we95. This behavior is also reflected by the dynamic quantities as listed in Table 8—the higher the heat and mass transfer resistances are, the higher the dynamic figures.
For the explanation of this pronounced mass transfer limitation of both samples in the adsorption measurements we compare some figures and mass transfer mechanisms in the following:
  • The mass transfer in the adsorbent metal composite happens on a macro pore level. Here, a characteristic flow path length and the mean diameter of the macro pores have an impact on the flow of water vapor through the structure [62,63]. The characteristic flow path length is in the range of the sample height: here 3.5 mm for we95 and 5.3 mm for we55. A mean macro pore diameter was not measured so far but we can assume that the macro pores of sample we55 are larger than the macro pores of sample we95 from the microscopic imaging in Figure 1. Since the macro pore mass transfer processes (viscous flow and Knudsen diffusion) strongly depend on the absolute pressure [43,62,64], this could be an explanation for the difference between adsorption (low pressure, high mass transfer resistance) and desorption (high pressure, low mass transfer resistance).
  • The vapor transport within the adsorbent particles will happen on macro- or mesopore level, here the characteristic path length is 30–70 µm for we95 and around 200 µm for we55. The mean macro- or mesopore diameter should be the same for both samples, since we use different sieve fractions from the same material. From measurements of the loose grain configuration as carried out by Girnik and Aristov [65,66] with different granule diameters, we would expect a higher resistance for sample we55 if the vapor transport within the adsorbent particles played a role. Instead, we observed an inverse behavior: sample we95 with small granule diameter is much slower than sample we55 with larger granules. Thus, we can assume that the vapor transport within the adsorbent particles is not important for the overall sorption dynamics.
  • The mass transfer on the micro pore level of the adsorbent crystals in the particles is likely dominated by the diffusion of the adsorbate within the adsorbent crystals. Here, the mass transfer resistance should be the same for both samples, since we use different sieve fractions from the same material with the same properties on the micro pore level. Thus, the mass transfer on the micro pore level is also not important for the overall sorption dynamics.
We can conclude that the high mass transfer resistance of both samples in the adsorption measurement comes mainly from the mass transfer in the macro pores of the adsorbent metal composite. For a geometric optimization the first step would be the manufacturing of structures that have larger and connected macropores.

3.5. Comparison with Other Adsorbent Metal Structures

How good is the performance of the adsorbent metal structure presented here in relation to other adsorbent (metal) structures? The answer to this question requires some considerations.
Since the measurement of the structures presented here was limited to a maximum temperature of 95 °C in desorption, the conditions of the LTJ experiment do poorly reflect the conditions in a real-world application. Thus, the comparison of mass transfer resistances with other measurements on zeolite metal structures under different conditions could be misleading. This point also affects the evaluation of the mean power per unit area or unit volume of the structure as carried out by Velte et al. [35] on SAPO-34 metal composite structures. However, the heat transfer resistance is independent from these considerations and it is a possibility to compare our results with other structures on this basis.
In Table 9 the thermal conductivity of different adsorbent beds, adsorbent-metal mixtures and adsorbent-metal composites are listed. Further sources can be found in the review of Caprì et al. [11]. The thermal conductivity of an adsorbent bed typically is in the range of 0.1–0.2 W/(m·K). By using metallic additives this value can be increased so that it is in the range of 0.14–0.6 W/(m·K) with a mass fraction of the metal between 5–15%. The structures studied here have a metal mass fraction of approximately 70% with heat conductivities in the range of 1.8–2.3 W/(m·K). This is less than the thermal conductivity ranging between 3–6 W/(m·K) that was achieved with fibrous aluminum structures [51]. It can be stated that the thermal conductivity of the structures studied here are very high compared to beds with metallic additives. However, to achieve these high heat conductivities a relatively large amount of metal is required. Since this additional “dead” thermal mass of the adsorption heat exchanger will lower the efficiency in an adsorption cycle without heat recovery, the impact on the adsorption heat exchanger overall thermal capacity is studied in Section 3.6.
It has to be noted that there are also other innovative concepts, e.g., the combination of silicagel with expanded graphite studied by Eun et al. [21], that can boost the thermal conductivity of the silicagel bed by a factor of 100.

3.6. Heat Exchanger Design

Another important question besides the measurement of sorption dynamics and the comparison of dynamic figures and the heat- and mass transfer resistance is the heat exchanger design. One of the crucial figures for the application in a heat transformation process is the overall thermal mass of the heat exchanger as detailed by Gluesenkamp et al. [33]. For this evaluation the heat exchanger design with flat tubes as proposed by Bendix et al. [24] for binder-based coatings and studied also by Kowsari [16] for granules is chosen as the basis. The overall thermal mass C p , t o t includes the metal mass of the heat exchanger, the adsorbent mass as well as the mass of the heat transfer fluid in the tubes. This quantity is listed in Table 10 for the empty heat exchanger (without adsorbent) and the heat exchanger with adsorbent or metal adsorbent composite structure.
From the data in Table 10 it can be concluded that the use of the sintered structure studied here raises the thermal mass of the heat exchanger by approximately 40% compared to an aluminum heat exchanger with lamellas and granules. This is a disadvantage for the efficiency if the adsorption heat exchanger is applied in an adsorption cycle without heat recovery. The advantage of the sintered structure is the high thermal conductivity which will raise the power density of the adsorption heat exchanger. However, for a fair comparison of the power density of the “granules” heat exchanger with the adsorbent-metal composite heat exchanger both components would have to be optimized in terms of pitch of the lamellas, distance of the flat tubes, and other geometric parameters.
The disadvantage in terms of efficiency holds not true if the adsorbent–metal composite is used in an advanced sorption cycle with heat recovery, for example a thermal wave cycle as first suggested by Shelton et al. [68]. Here, it is crucial to provide a high thermal conductivity within the “adsorbent bed” to achieve a high efficiency [69]. This makes the adsorbent–metal composites studied here an interesting option.

4. Conclusions

We have shown that the proposed zeolite NaY-copper composites have a high thermal conductivity in the range of 1.8–2.3 W/(m·K) compared to the loose grain configuration. Consequently, this reduction of the heat transfer resistance leads to superior sorption dynamics for at least one of the zeolite NaY-copper composite structures (we55). It can be stated that much attention has to be paid to the mass transfer processes within the macro pores of the structure. Despite this superior heat transfer properties, the mass transfer becomes an issue. Especially for structures with small granules and small metal particles (sample we95) the mass transfer dominates the process. Both samples (we55 and we95) have a much higher mass transfer resistance under adsorption conditions than under desorption conditions. Regarding the overall heat and mass transfer resistance, the higher thermal conductivity of sample we55 overcompensated the higher mass transfer resistance in direct comparison to the “granules” sample. Another issue is the additional thermal mass that is brought into the adsorption heat exchanger with the proposed zeolite NaY-copper composite. The ratio of thermal mass to adsorbent mass is about 40% higher for the composite heat exchanger than it is for the loose grain heat exchanger. In adsorption cycles with heat recovery this disadvantage will not play out. Thus, the application of a zeolite NaY-copper composite heat exchanger in an advanced sorption cycle with heat recovery might become an interesting option.

Author Contributions

Conceptualization, A.V.; methodology, G.F., E.L., A.V.; sample preparation, J.W., J.B.; measurements J.W., A.V.; evaluation, A.V.; data curation, A.V.; writing—original draft preparation, J.W., A.V.; writing—review and editing, J.W., G.F., E.L., A.V.; visualization, J.W., A.V.; supervision, G.F., J.B.; project administration, G.F., J.B.; funding acquisition, G.F., J.B. All authors have read and agreed to the published version of the manuscript.

Funding

This work was funded by the Fraunhofer Zukunftsstiftung, Project “Harvest”.

Institutional Review Board Statement

Not applicable.

Data Availability Statement

The minimal dataset that supports the central findings is presented in the article.

Acknowledgments

We gratefully acknowledge that Max Baumgartner carried out the volumetric and gravimetric measurements of the adsorption equilibrium on powder samples at the Fraunhofer ISE.

Conflicts of Interest

The authors declare no conflict of interest.

Nomenclature and Indices

SymbolUnitDescription
AJ/kgAdsorption potential
TKTemperature
pPaPressure
Xg/gLoading
Q · WHeat flux
C p , e f f J/KEffective heat capacity
R K/WHeat or mass transfer resistance
R J/(kg·K)Specific gas constant
Δ h ads J/kgAdsorption enthalpy
M sorb kgAdsorbent mass
Δ h l v J/kgEvaporation/condensation enthalpy
c p J/(kg·K)Specific heat capacity
R t o t * K/WHeat and mass transfer impedance (* indicates capacitive effects)
R ¯ K/WTime averaged heat or mass transfer resistance
R ¯ A cm2K/WArea scaled time averaged heat or mass transfer resistance
S T M J/(kg·K)Specific thermal mass
α W/(m2·K)Heat transfer coefficient
λ W/(m·K)Thermal conductivity
IndexDescription
initInitial value
endEnd value
satSaturation
N2Nitrogen
eqiEquilibrium
cmpComposite
vapVapour
sSorptive term
MTMass transfer
HTHeat transfer
C p Capacitive term
cmpComposite
carCarrier plate
adbAdsorbate
lLiquid
relRelative
totTotal
effEffective
mtMetal

References

  1. Wienen, J.; Neubert, M.; Lang, R.; Tiemeier, H. Results from field trial with gas heat pump Zeotherm by Vaillant. In Thermally Driven Heat Pumps for Heating and Cooling; Kühn, A., Ed.; Universitätsverlag der TU: Berlin, Germany, 2013. [Google Scholar]
  2. Núñez, T.; Mittelbach, W.; Henning, H.-M. Development of an adsorption chiller and heat pump for domestic heating and air-conditioning applications. Appl. Therm. Eng. 2007, 27, 2205–2212. [Google Scholar] [CrossRef]
  3. Schicktanz, M.; Nuñez, T. Modelling of an adsorption chiller for dynamic system simulation. Int. J. Refrig. 2009, 32, 588–595. [Google Scholar] [CrossRef]
  4. Meunier, F. Adsorption heat powered heat pumps. Appl. Therm. Eng. 2013, 61, 830–836. [Google Scholar] [CrossRef]
  5. Henninger, S.; Schmidt, F.; Henning, H.-M. Water adsorption characteristics of novel materials for heat transformation applications. Appl. Therm. Eng. 2010, 30, 1692–1702. [Google Scholar] [CrossRef]
  6. Henninger, S.K.; Ernst, S.-J.; Gordeeva, L.G.; Bendix, P.; Fröhlich, D.; Grekova, A.D.; Bonaccorsi, L.; Aristov, Y.; Jaenchen, J. New materials for adsorption heat transformation and storage. Renew. Energy 2017, 110, 59–68. [Google Scholar] [CrossRef]
  7. Henninger, S.K.; Jeremias, F.; Kummer, H.; Schossig, P.; Henning, H.-M. Novel Sorption Materials for Solar Heating and Cooling. Energy Procedia 2012, 30, 279–288. [Google Scholar] [CrossRef]
  8. Volmer, R.; Eckert, J.; Füldner, G.; Schnabel, L. Evaporator development for adsorption heat transformation devices–Influencing factors on non-stationary evaporation with tube-fin heat exchangers at sub-atmospheric pressure. Renew. Energy 2017, 110, 141–153. [Google Scholar] [CrossRef]
  9. Lanzerath, F.; Seiler, J.; Erdogan, M.; Schreiber, H.; Steinhilber, M.; Bardow, A. The impact of filling level resolved: Capillary-assisted evaporation of water for adsorption heat pumps. Appl. Therm. Eng. 2016, 102, 513–519. [Google Scholar] [CrossRef] [Green Version]
  10. Schnabel, L.; Füldner, G.; Velte, A.; Laurenz, E.; Bendix, P.; Kummer, H.; Wittstadt, U. Innovative Adsorbent Heat Exchangers: Design and Evaluation. In Innovative Heat Exchangers; Bart, H.-J., Scholl, S., Eds.; Springer International Publishing: Cham, Switzerland, 2018; pp. 363–394. [Google Scholar]
  11. Caprì, A.; Frazzica, A.; Calabrese, L. Recent Developments in Coating Technologies for Adsorption Heat Pumps: A Review. Coatings 2020, 10, 855. [Google Scholar] [CrossRef]
  12. Henninger, S.; Munz, G.; Ratzsch, K.-F.; Schossig, P. Cycle stability of sorption materials and composites for the use in heat pumps and cooling machines. Renew. Energy 2011, 36, 3043–3049. [Google Scholar] [CrossRef]
  13. Wang, R.; Xia, Z.; Wang, L.; Lu, Z.; Li, S.; Li, T.; Wu, J.; He, S. Heat transfer design in adsorption refrigeration systems for efficient use of low-grade thermal energy. Energy 2011, 36, 5425–5439. [Google Scholar] [CrossRef]
  14. Sharafian, A.; Bahrami, M. Assessment of adsorber bed designs in waste-heat driven adsorption cooling systems for vehicle air conditioning and refrigeration. Renew. Sustain. Energy Rev. 2014, 30, 440–451. [Google Scholar] [CrossRef]
  15. Riffel, D.B.; Wittstadt, U.; Schmidt, F.P.; Núñez, T.; Belo, F.A.; Leite, A.P.; Ziegler, F. Transient modeling of an adsorber using finned-tube heat exchanger. Int. J. Heat Mass Transf. 2010, 53, 1473–1482. [Google Scholar] [CrossRef]
  16. Kowsari, M.M.; Niazmand, H.; Tokarev, M.M. Bed configuration effects on the finned flat-tube adsorption heat exchanger performance: Numerical modeling and experimental validation. Appl. Energy 2018, 213, 540–554. [Google Scholar] [CrossRef]
  17. Demir, H.; Mobedi, M.; Ülkü, S. The use of metal piece additives to enhance heat transfer rate through an unconsolidated adsorbent bed. Int. J. Refrig. 2010, 33, 714–720. [Google Scholar] [CrossRef] [Green Version]
  18. Rezk, A.; Al-Dadah, R.; Mahmoud, S.; Elsayed, A. Effects of contact resistance and metal additives in finned-tube adsorbent beds on the performance of silica gel/water adsorption chiller. Appl. Therm. Eng. 2013, 53, 278–284. [Google Scholar] [CrossRef]
  19. Askalany, A.A.; Henninger, S.K.; Ghazy, M.; Saha, B.B. Effect of improving thermal conductivity of the adsorbent on performance of adsorption cooling system. Appl. Therm. Eng. 2017, 110, 695–702. [Google Scholar] [CrossRef]
  20. Kulakowska, A.; Pajdak, A.; Krzywanski, J.; Grabowska, K.; Zylka, A.; Sosnowski, M.; Wesolowska, M.; Sztekler, K.; Nowak, W. Effect of Metal and Carbon Nanotube Additives on the Thermal Diffusivity of a Silica Gel-Based Adsorption Bed. Energies 2020, 13, 1391. [Google Scholar] [CrossRef] [Green Version]
  21. Eun, T.-H.; Song, H.-K.; Han, J.H.; Lee, K.-H.; Kim, J.-N. Enhancement of heat and mass transfer in silica-expanded graphite composite blocks for adsorption heat pumps. Int. J. Refrig. 2000, 23, 64–73. [Google Scholar] [CrossRef]
  22. Pino, L.; Aristov, Y.; Cacciola, G.; Restuccia, G. Composite materials based on zeolite 4A for adsorption heat pumps. Adsorption 1997, 3, 33–40. [Google Scholar] [CrossRef]
  23. Ammann, J.; Ruch, P.; Michel, B.; Studart, A.R. Quantification of heat and mass transport limitations in adsorption heat exchangers: Application to the silica gel/water working pair. Int. J. Heat Mass Transf. 2018, 123, 331–341. [Google Scholar] [CrossRef]
  24. Bendix, P.; Füldner, G.; Möllers, M.; Kummer, H.; Schnabel, L.; Henninger, S.; Henning, H.-M. Optimization of power density and metal-to-adsorbent weight ratio in coated adsorbers for adsorptive heat transformation applications. Appl. Therm. Eng. 2017, 124, 83–90. [Google Scholar] [CrossRef]
  25. Freni, A.; Bonaccorsi, L.; Calabrese, L.; Caprì, A.; Frazzica, A.; Sapienza, A. SAPO-34 coated adsorbent heat exchanger for adsorption chillers. Appl. Therm. Eng. 2015, 82, 1–7. [Google Scholar] [CrossRef]
  26. Dawoud, B. Water vapor adsorption kinetics on small and full scale zeolite coated adsorbers; A comparison. Appl. Therm. Eng. 2013, 50, 1645–1651. [Google Scholar] [CrossRef]
  27. Ammann, J.; Michel, B.; Studart, A.R.; Ruch, P.W. Sorption rate enhancement in SAPO-34 zeolite by directed mass transfer channels. Int. J. Heat Mass Transf. 2019, 130, 25–32. [Google Scholar] [CrossRef]
  28. Ammann, J.; Michel, B.; Ruch, P.W. Characterization of transport limitations in SAPO-34 adsorbent coatings for adsorption heat pumps. Int. J. Heat Mass Transf. 2019, 129, 18–27. [Google Scholar] [CrossRef]
  29. Palomba, V.; Vasta, S.; Giacoppo, G.; Calabrese, L.; Gulli‘, G.; La Rosa, D.; Freni, A. Design of an Innovative Graphite Exchanger for Adsorption Heat Pumps and Chillers. Energy Procedia 2015, 81, 1030–1040. [Google Scholar] [CrossRef] [Green Version]
  30. Bauer, J.; Herrmann, R.; Mittelbach, W.; Schwieger, W. Zeolite/aluminum composite adsorbents for application in adsorption refrigeration. Int. J. Energy Res. 2009, 33, 1233–1249. [Google Scholar] [CrossRef]
  31. Wittstadt, U.; Füldner, G.; Andersen, O.; Herrmann, R.; Schmidt, F. A New Adsorbent Composite Material Based on Metal Fiber Technology and Its Application in Adsorption Heat Exchangers. Energies 2015, 8, 8431–8446. [Google Scholar] [CrossRef]
  32. Wittstadt, U.; Füldner, G.; Laurenz, E.; Warlo, A.; Große, A.; Herrmann, R.; Schnabel, L.; Mittelbach, W. A novel adsorption module with fiber heat exchangers: Performance analysis based on driving temperature differences. Renew. Energy 2017, 110, 154–161. [Google Scholar] [CrossRef]
  33. Gluesenkamp, K.R.; Frazzica, A.; Velte, A.; Metcalf, S.; Yang, Z.; Rouhani, M.; Blackman, C.; Qu, M.; Laurenz, E.; Rivero-Pacho, A.; et al. Experimentally Measured Thermal Masses of Adsorption Heat Exchangers. Energies 2020, 13, 1150. [Google Scholar] [CrossRef] [Green Version]
  34. Fink, M.; Andersen, O.; Seidel, T.; Schlott, A. Strongly Orthotropic Open Cell Porous Metal Structures for Heat Transfer Applications. Metals 2018, 8, 554. [Google Scholar] [CrossRef] [Green Version]
  35. Velte, A.; Herrmann, R.; Andersen, O.; Wittstadt, U.; Füldner, G.; Schnabel, L. Experimental Characterization of Aluminum Fibre/SAPO-34 Composites for Adsorption Heat Pump Applications. In Proceedings of the Heat Powered Cycles Conference, Heat Powered Cycles, Nottingham, UK, 28–30 June 2016. [Google Scholar]
  36. Busse, P.; Mittelbach, W.; Schmitz, G. Preparation of Sorption Memory Element, Useful as a Adsorber/Desorber Unit in Solid Sorption Heat Pump, Comprises Filling a Form with a Pouring of Sorbent Material; and Infiltrating into Gaps of Pouring, and Forming Open-Pourous Solid Body. DE102005001056 A1, published 01 July 2006. Available online: https://patents.google.com/patent/DE102005001056A1 (accessed on 2 December 2020).
  37. Berg, A.; Baumeister, J.; Rausch, G.; Busse, M.; Schnabel, L.; Bauer, J. Application of Aluminium Sponges in the Adsorption Refrigeration Engineering. In Proceedings of the International Conference on Porous Metals and Metallic Foams (MetFoam), Montreal, QC, Canada, 5–7 September 2007. [Google Scholar]
  38. Berg, A.; Weise, J.; Rausch, G.; Haesche, M.; Wostmann, F.J.; Busse, M. Druckgusstechnische Herstellung von offenporösen Aluminiumschäumen und Aluminium-Polymer-Hybridstrukturen. Giesserei 2005, 92, 24–27. [Google Scholar]
  39. Busse, M.; Wöstmann, F.-J.; Müller, T.; Melz, T.; Spies, P. Intelligente Gussteile–Einsatz adaptronischer Komponenten in Kombination mit Gussteilen. Giesserei 2006, 93, 48–53. [Google Scholar]
  40. Pille, C. In-process embedding of piezo sensors and RFID transponders into cast parts for autonomous manufacturing logistics. In Proceedings of the Smart Systems Integration 2010: 4th European Conference & Exhibition on Integration Issues of Miniaturized Systems–MEMS, MOEMS, ICs and Electronic Components, Como, Italy, 23–24 March 2010; Gessner, T., Ed.; VDE-Verl: Berlin, Germany, 2010. [Google Scholar]
  41. Henninger, S.K.; Hügenell, D.I.F.P.P.; Baumgartner, B.E.M.; Kummer, D.C.H.; Jeremias, F. “Stabisorp-2 (BWE12001): Untersuchung des Degradationsverhaltens von Sorptionsmaterialien und Verbundsystemen zur Wärmespeicherung und -transformation,” Fraunhofer Institut für Solare Energiesysteme (ISE). Available online: https://pudi.lubw.de/detailseite/-/publication/61779-STABISORP-2.pdf (accessed on 2 December 2020).
  42. Velte, A.; Füldner, G.; Laurenz, E.; Schnabel, L. Advanced Measurement and Simulation Procedure for the Identification of Heat and Mass Transfer Parameters in Dynamic Adsorption Experiments. Energies 2017, 10, 1130. [Google Scholar] [CrossRef] [Green Version]
  43. Füldner, G. Stofftransport und Adsorptionskinetik in porösen Adsorbenskompositen für Wärmetransformationsanwendungen. Ph.D. Thesis, University of Freiburg, Freiburg, Germany, 2015. [Google Scholar]
  44. Leinekugel-Le-Cocq, D.; Tayakout-Fayolle, M.; Le Gorrec, Y.; Jallut, C. A double linear driving force approximation for non-isothermal mass transfer modeling through bi-disperse adsorbents. Chem. Eng. Sci. 2007, 62, 4040–4053. [Google Scholar] [CrossRef]
  45. Wittstadt, U. Experimentelle und modellgestützte Charakterisierung von Adsorptionswärmeübertragern. Ph.D. Thesis, Fakultät III–Prozesswissenschaften, Technische Universität Berlin, Berlin, Germany, 2018. [Google Scholar]
  46. Freni, A.; Maggio, G.M.; Cipiti, F.; Aristov, Y.I. Simulation of water sorption dynamics in adsorption chillers: One, two and four layers of loose silica grains. Appl. Therm. Eng. 2012, 44, 69–77. [Google Scholar] [CrossRef]
  47. Graf, S.; Lanzerath, F.; Bardow, A. The IR-Large-Temperature-Jump method: Determining heat and mass transfer coefficients for adsorptive heat transformers. Appl. Therm. Eng. 2017, 126, 630–642. [Google Scholar] [CrossRef]
  48. Graf, S.; Lanzerath, F.; Sapienza, A.; Frazzica, A.; Freni, A.; Bardow, A. Prediction of SCP and COP for adsorption heat pumps and chillers by combining the large-temperature-jump method and dynamic modeling. Appl. Therm. Eng. 2016, 98, 900–909. [Google Scholar] [CrossRef]
  49. Lanzerath, F. Modellgestützte Entwicklung von Adsorptionswärmepumpen; Hochschulbibliothek der Rheinisch-Westfälischen Technischen Hochschule Aachen: Aachen, Germany, 2013. [Google Scholar]
  50. Lanzerath, F.; Bau, U.; Seiler, J.; Bardow, A. Optimal design of adsorption chillers based on a validated dynamic object-oriented model. Sci. Technol. Built Environ. 2015, 21, 248–257. [Google Scholar] [CrossRef] [Green Version]
  51. Velte, A. Experimentelle Arbeiten und Entwicklung von numerischen Modellen zur Analyse und Optimierung von erweiterten Adsorptionskreisläufen für die Wärmeversorgung von Gebäuden. Ph.D. Thesis, Technische Fakultät, Universität Freiburg, Freiburg, Germany, 2019. [Google Scholar]
  52. Wittstadt, U.; Laurenz, E.; Velte, A.; Füldner, G. Using Driving Temperature Difference Equivalents to Compare Heat and Mass Transport Limitations in Sorption Modules and Adsorption Heat Exchangers: Poster at the Sorption Friends Conference, 14–16.09.2015, Milazzo, Sicily, Italy. Available online: http://www.sorptionfriends.org/poster/ (accessed on 24 April 2017).
  53. Sapienza, A.; Velte, A.; Girnik, I.; Frazzica, A.; Füldner, G.; Schnabel, L.; Aristov, Y. “Water–Silica Siogel” working pair for adsorption chillers: Adsorption equilibrium and dynamics. Renew. Energy 2017, 110, 40–46. [Google Scholar] [CrossRef]
  54. Farrusseng, D.; Daniel, C.; Hamill, C.; Casaban, J.; Didriksen, T.; Blom, R.; Velte, A.; Fueldner, G.; Gantenbein, P.; Persdorf, P.; et al. Adsorber heat exchanger using Al-fumarate beads for heat-pump applications—A transport study. Faraday Discuss. 2020, 225, 384–402. [Google Scholar] [CrossRef] [PubMed]
  55. Aristov, Y.; Dawoud, B.; Glaznev, I.; Elyas, A. A new methodology of studying the dynamics of water sorption/desorption under real operating conditions of adsorption heat pumps: Experiment. Int. J. Heat Mass Transf. 2008, 51, 4966–4972. [Google Scholar] [CrossRef]
  56. Lenzen, D.; Bendix, P.; Reinsch, H.; Fröhlich, D.; Kummer, H.; Möllers, M.; Hügenell, P.P.C.; Gläser, R.; Henninger, S.; Stock, N. Scalable Green Synthesis and Full-Scale Test of the Metal-Organic Framework CAU-10-H for Use in Adsorption-Driven Chillers. Adv. Mater. 2018, 30. [Google Scholar] [CrossRef]
  57. Pinheiro, J.M.; Salústio, S.; Valente, A.A.; Silva, C.M. Adsorption heat pump optimization by experimental design and response surface methodology. Appl. Therm. Eng. 2018, 138, 849–860. [Google Scholar] [CrossRef]
  58. Qiu, L. Thermal Properties of Framework Materials: Selected Zeolites, Clathrates and an Organic Diol. Ph.D. Thesis, Dalhousie University, Halifax, NS, Canada, 2000. [Google Scholar]
  59. Green, D.W. Perry’s Chemical Engineers’ Handbook, 8th ed.; McGraw-Hill: New York, NY, USA, 2008. [Google Scholar]
  60. Schwamberger, V. Thermodynamische und numerische Untersuchung eines neuartigen Sorptionszyklus zur Anwendung in Adsorptionswärmepumpen und -kältemaschinen = Thermodynamic and Numerical Investigation of a Novel Sorption Cycle for Application in Adsorption Heat Pumps and Chillers. Ph.D. Thesis, Karlsruher Institut für Technologie (KIT), Karlsruhe, Germany, 2016. [Google Scholar]
  61. Desai, A.; Schwamberger, V.; Herzog, T.; Jänchen, J.; Schmidt, F.P. Modeling of Adsorption Equilibria through Gaussian Process Regression of Data in Dubinin’s Representation: Application to Water/Zeolite Li-LSX. Ind. Eng. Chem. Res. 2019, 58, 17549–17554. [Google Scholar] [CrossRef]
  62. Kast, W.; Hohenthanner, C.-R. Mass transfer within the gas-phase of porous media. Int. J. Heat Mass Transf. 2000, 43, 807–823. [Google Scholar] [CrossRef]
  63. Kast, W. Adsorption aus der Gasphase—Ingenieurwissenschaftliche Grundlagen und technische Verfahren; VCH: Weinheim, Germany, 1988. [Google Scholar]
  64. Kast, W. Der diffusive Stofftransport im Übergansgebiet zwischen Kontinuum und Knudsen-Region. Chem. Ing. Tech. 2001, 73, 1150–1153. [Google Scholar] [CrossRef]
  65. Girnik, I.S.; Aristov, Y.I. Dynamic optimization of adsorptive chillers: The “AQSOA™-FAM-Z02–Water” working pair. Energy 2016, 106, 13–22. [Google Scholar] [CrossRef]
  66. Girnik, I.S.; Aristov, Y.I. Dynamics of water vapour adsorption by a monolayer of loose AQSOA™-FAM-Z02 grains: Indication of inseparably coupled heat and mass transfer. Energy 2016, 114, 767–773. [Google Scholar] [CrossRef]
  67. Bonaccorsi, L.; Bruzzaniti, P.; Calabrese, L.; Freni, A.; Proverbio, E.; Restuccia, G. Synthesis of SAPO-34 on graphite foams for adsorber heat exchangers. Appl. Therm. Eng. 2013, 61, 848–852. [Google Scholar] [CrossRef]
  68. Shelton, S.V.; Wepfer, W.J.; Miles, D.J. Square wave analysis of the solid-vapor adsorption heat pump. Heat Recover. Syst. CHP 1989, 9, 233–247. [Google Scholar] [CrossRef]
  69. Sun, L.; Feng, Y.; Pons, M. Numerical investigation of adsorptive heat pump systems with thermal wave heat regeneration under uniform-pressure conditions. Int. J. Heat Mass Transf. 1997, 40, 281–293. [Google Scholar] [CrossRef]
Figure 1. Surface structure of Cu-zeolite composites after sintering, (a) sample we55, (b) sample we95.
Energies 14 01958 g001
Figure 2. Divided-bar thermal apparatus for the determination of the thermal conductivity.
Energies 14 01958 g002
Figure 3. Coupled heat and mass transfer linear driving force (LDF) model of an adsorbent–metal composite (a). The surface temperature is measured with an infrared sensor; this is (approximately) the temperature of the composite T ¯ c m p . Model reduction to resistance–capacitance model (b) by using driving temperature equivalents for the mass transfer equation. Further model reduction to a single resistance/impedance model (c).
Energies 14 01958 g003
Figure 4. Measured (xpr) and simulated (sim) surface temperature for the samples “we55”, “we95”, and “Granules” after an inert large temperature jump of 60 → 90 °C at t = 0 s under dry nitrogen atmosphere at 44 mbar absolute pressure. The measured temperature of the carrier plate is shown as well (“Carrier plate”). It is the same temperature for all measurements.
Energies 14 01958 g004
Figure 5. Equilibrium data for the 40 °C isotherm of powder material (“vstar” measurements) and the samples we55 and we95 (“SPJ” measurements). Lines are meant as a guide to the eye.
Energies 14 01958 g005
Figure 6. Dubinin-transformed equilibrium data for different gravimetric measurements of powder material (“dvs” and “dsc” measurements) and the volumetric measurements of samples we55 and we95 (“SPJ” measurements) as well as a dataset of Pinheiro et al. [57] (“Lit. ref. 60 °C”).
Energies 14 01958 g006
Figure 7. Sorption dynamics of we55 and we95 in terms of loading difference in adsorption (a) and desorption (b). Error propagation analysis of the loading difference is done according to Equation (13).
Energies 14 01958 g007
Figure 8. Dynamic figure t80 for LTJ measurements on all three samples.
Energies 14 01958 g008
Figure 9. Evaluation of temperatures according to Figure 3b allowing to deduce the effective driving temperature differences for heat and mass transfer as indicated in the lower left plot for samples we55 and we95.
Energies 14 01958 g009aEnergies 14 01958 g009b
Figure 10. Area-scaled heat and mass transfer resistance R A curves of sample we55 desorption measurement, the end time t 80 for the evaluation of mean values R ¯ A is shown as a vertical line.
Energies 14 01958 g010
Figure 11. Heat and mass transfer resistances scaled with the sample area R ¯ A of sample we55 and sample we95. The two heat flux term formulations are given here according to Equation (3).
Energies 14 01958 g011
Table 1. Geometric data and mass of the adsorbent–metal composite samples.
Sample Namewe55we95Granules
Support Plate 1Sample Carrier 2
Length in mm50 ± 0.150 ± 0.150 ± 0.1
Width in mm50 ± 0.150 ± 0.150 ± 0.1
Thickness in mm2 ± 0.12 ± 0.1-
Mass in g46.6 ± 0.5 +46.6 ± 0.5 +20.5 ± 0.5 ++
Sample
Diameter in mm49 ± 0.548.5 ± 0.5-
Height in mm5.3 ± 0.13.5 ± 0.14.9 ± 0.5
Area in cm218.9 ± 0.418.5 ± 0.419.0 ± 0.5
Mass of copper particles in g18.4 ± 0.510.2 ± 0.5-
Mass of binder in g1.290.75-
Adsorbent mass (dry) in g5.0 ± 0.33.3 ± 0.24.8 ± 0.3
Particle size of adsorbent in µm400…75063…125400…750
1 Copper; 2 Aluminum; + including brazing solder; ++ including boundary sheets.
Table 2. Conditions for inert-LTJ measurements.
Measurement T i n i t [°C] T e n d [°C] p N 2 [mbar]
inert-LTJ 1609044
inert-LTJ 2906044
Table 3. Conditions for LTJ measurements. The initial pressure is set and the end pressure depends on the mass of the adsorbent (the more adsorbent the lower the end pressure in the adsorption measurement).
Measurement T i n i t [°C] T e n d [°C] p i n i t [mbar] T s a t [°C]
LTJ ads93.849.417.014.9
LTJ des49.594.031.224.7
Table 4. Thermal masses and related quantities of the samples.
Sample Namewe55we95Granules
Sample Properties
Thermal mass of support/carrier in J/K17.0417.0418.41
Thermal mass of composite/adsorbent in J/K12.567.474.08
Overall thermal mass in J/K29.5924.5022.49
Evaluation Quantities
Overall thermal mass per sample area in J/(K·cm2)1.581.371.20
Adsorbent mass per composite volume in kg/m3480510524
Specific thermal mass (STM) of composite in kJ/(kg·K)2.512.260.85
Table 5. Thermo-physical material properties.
PropertyValueSource
Specific heat capacity of adsorbent in J/(kg*K), mean value for temperature range 50…95 °C850Function [57], data [58]
Specific heat capacity of binder in J/(kg*K)1000estimated
Specific heat of copper in J/(kg*K)382[59]
Specific heat of aluminum900[59]
Table 6. Overall thermal conductivity measured with divided bar apparatus.
SampleThermal Conductivity in W/(m·K)
we551.7
we951.3
Table 7. Heat transfer parameters determined with inert-LTJ method.
SampleMeasurement Thermal Conductivity of Composite/Adsorbent λ c m p in W/(m·K) Heat Transfer Coefficient between Sample and Carrier Plate α c a r , m t in W/(m2·K) Overall Heat Transfer Resistance R ¯ H T , t o t A in (cm2·K)/W
we5560 → 90 °C,
N2 44 mbar
1.9 ± 0.22400 ± 37014 ± 1
90 → 60 °C,
N2 44 mbar
2.0 ± 0.22400 ± 35013 ± 1
we9560 → 90 °C, N2 44 mbar2.3 ± 0.32100 ± 12010 ± 1
90 → 60 °C, N2 44 mbar1.8 ± 0.22600 ± 28010 ± 1
Granules 400…750 µm60 → 90 °C, N2 44 mbar0.15 ± 0.022300 ± 250150 ± 20
90 → 60 °C, N2 44 mbar0.14 ± 0.022300 ± 250150 ± 20
Table 8. Main dynamic quantities of the LTJ measurements on samples “we55”, “we95”, and “Granules” according to Sapienza et al. [53] t 80 , ( t 90 ): time when 80% (90%) of the equilibrium loading is reached, t 80 - t 15 : time span between 15% and 80% equilibrium loading.
SampleMeasurement
LTJ
t 80 in s t 90 in s t 80 t 15 in s
we55ads145238129
des8612575
we95ads137723521337
des195337176
Granulesads272447259
des290444273
Table 9. Thermal conductivity of adsorbent beds, adsorbent–metal mixtures, and adsorbent–metal composites.
DescriptionMass Fraction of Metal/AdditivesParticle DiameterThermal Conductivity of Adsorbent (Bed) or Adsorbent-Metal Composite in W/(m·K)Source
silicagel-Bed-3…5 mm0.1 +Demir et al. [17]
silicagel-Bed-100…160 µm0.17 ++Kulakowska et al. [20]
silicagel-Bed with metallic additives5…15%3…5 mm0.14…0.36 +Demir et al. [17], Rezk et al. [18]
silicagel-Bed with metallic additives or carbon-nanotubes5…15%100…160 µm0.3…0.6 ++Kulakowska et al. [20]
silicagel/expanded graphite 10…18 +++Eun et al. [21]
Zeolite with binders10…40% 0.2…0.4 >Pino et al. [22]
Zeolite NaY Bed-400…750 µm0.12…0.16 *This work
Zeotype SAPO-34 on fibrous aluminum structure40…70%20…50 µm (layer thickness)3…6 *Velte et al. [42], Velte [51]
NaY zeolite Granules in copper matrix70%400…750 µm1.8…2.3 *This work
SAPO-34 on expanded natural graphite up to 24 **Bonaccorsi et al. [67]
+ water vapor atmosphere, 1–20 mbar; ++ argon atmosphere, Laser Flash Analysis; +++ atmospheric pressure (air); > atmospheric pressure (air), hot wire method; * nitrogen atmosphere, 10–40 mbar inert-LTJ method; ** atmospheric pressure (air), guarded plate method.
Table 10. Thermal masses, adsorbent mass, and ratio of thermal mass and adsorbent mass of three different shapes of the adsorbent.
AdsorbentMaterial C p , t o t (w/o Adsorbent) in kJ C p , t o t in kJ M s o r b in kg C p , t o t / M s o r b in kJ/kg
Granules NaYAl1.41.70.394.5
Coating TiAPSOAl 1.52.00.454.4
sint-struc NaYCu1.62.40.376.5
Publisher’s Note: MDPI stays neutral with regard to jurisdictional claims in published maps and institutional affiliations.

