
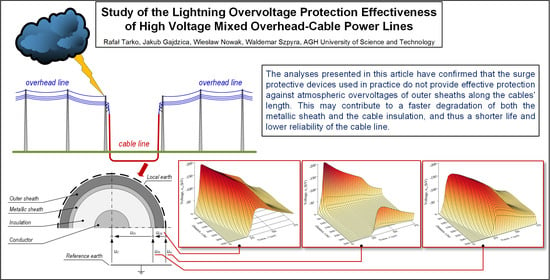
Study of the Lightning Overvoltage Protection Effectiveness of High Voltage Mixed Overhead Cable Power Lines


Department of Electrical Engineering and Power Engineering, Faculty of Electrical Engineering, Automatics, Computer Science and Biomedical Engineering, AGH University of Science and Technology, al. Mickiewicza 30, 30-059 Krakow, Poland
*
Author to whom correspondence should be addressed.
Energies 2021, 14(8), 2329; https://0-doi-org.brum.beds.ac.uk/10.3390/en14082329
Submission received: 15 March 2021
/
Revised: 14 April 2021
/
Accepted: 17 April 2021
/
Published: 20 April 2021
(This article belongs to the Section F: Electrical Engineering)
Abstract
:In this paper, the effectiveness of lightning overvoltage protection of cables in high voltage overhead cable lines has been analyzed. Because of the high overvoltage level, the cables are protected by surge arresters and by metallic sheath earthing. However, in practice, quite a lot of cases of electricity-evoked damage to the cable outer sheaths are observed, proving that the effectiveness of the protection used is insufficient. As a result, the cables are exposed to environmental factors, especially moisture penetration, which contributes to cable degradation. To explain the causes of this situation, simulation studies were carried out to determine the relevant factors affecting the level of expected overvoltages. The circuit-field model of the overhead cable line in EMTP-ATP, COMSOL and MATLAB software was used for determining overvoltages on the main cable insulation and the outer protective sheath. The studies reveal that the efficiency of the cable insulation overvoltage protection is ensured regardless of the lightning strike location and the crest value of its current. However, the obtained results confirm that no matter the applied protection, the cable outer sheaths may be exposed to overvoltages with higher values than those of the main insulation. Although the analysis was performed for 110 kV lines, the conclusions are general and are also applicable to power lines with higher rated voltages.
1. Introduction
Electricity transmission in high and extra-high voltage networks is realized mainly through the overhead lines. However, there are numerous reasons why power cables are being used more and more frequently for this purpose. Despite their high cost, cable lines remain the only option for electric power transmission in the areas where, e.g., crossing terrain obstacles, supplying electricity to highly urbanized areas or high cost of acquiring the area for overhead lines are involved.
High and extra high voltage power networks with solely cable lines are rare. Most commonly, the mixed overhead cable lines are applied. This, however, causes the cable exposition to overvoltages evoked by direct lightning strikes to overhead power lines [1,2,3,4,5,6]. Figure 1 has shown the cross-section of high power single-conductor cables with indicated overvoltages on insulation uin and on outer sheath uos.
Overvoltages uin are generated due to an increase of conductor voltage uc and metallic sheath voltage um. Owing to the potentially high level of overvoltages, the cable insulation is protected by surge arresters installed in the places where the cable line is connected with the overhead line [7]. The outer sheath of the cable, being also an insulation of the metallic sheath, is protected by metallic sheath earthing. Surge arresters are used only in the case of one-sided earthing or cross bonding of metallic sheaths to provide protection against temporary overvoltage caused by short-circuit currents [8,9].
Because of the metallic sheath earthing, overvoltages uos are considered to be many times smaller than overvoltages uin. However, in practice, numerous cases of electricity-evoked damage have been observed on the outer sheaths [10], which may suggest that they are also exposed to significant overvoltage impacts. This kind of situation may take place due to a high increase in metallic sheath voltage um as compared to the earth voltage ue in the surrounding cable (Figure 1). The continuity of the cable outer sheath is very important for the reliable operation of the power line and is an indicator of other external cable damage. In addition, the outer insulating sheath breakdown can also lead to increase currents flowing in the metallic sheaths and thus increase energy losses in the cable line [11].
This paper focuses on the analysis of the efficiency of cable protection against lightning overvoltages in the high voltage mixed overhead cable lines. For this purpose, multivariant simulations were performed to determine the level of expected overvoltages uin and uos (Figure 1). Determining the values of these overvoltages requires an application of the models of electromagnetic phenomena that take place in mixed overhead cable lines during lightning discharges. In order to do so, comprehensive and recognized circuit models are used most commonly. They allow us to precisely and effectively, determine the nodal voltages uc and um that are the results of complex wave phenomena that occur in power lines. However, circuit models do not allow us to determine the ue voltage that stems from electromagnetic phenomena caused by lightning surge currents flowing from tower earthing electrodes to the surrounding soil. For this reason, in order to determine the ue voltages, it is necessary to apply models that use the electromagnetic field theory. Such an original approach, consisting of the combination of circuit and field models, was used in the analysis and is the subject of this paper. Thus, the analysis of the efficiency of cable protection against lightning overvoltages in the high voltage mixed overhead cable lines has been developed in two stages. In the first stage of the complex circuit model of the analysed mixed overhead cable line 110 kV was developed in an EMTP-ATP program (Section 2). The model was used to determine uc and um voltages, and, on their basis, the uin overvoltage on the cable’s main insulation (Section 3). In the second stage, the electromagnetic model of tower earthing system was developed in COMSOL program. This model was used to determine the ue ground voltage around the cables and uos overvoltages on the cable’s outer sheaths (Section 4). Because of the complexity of modelling the rod earthing system, it has been simplified to the shape of a hemisphere. Moreover, the mapping of the hemisphere model in a MATLAB environment allowed for significant reduction of the computation time without diminishing the accuracy in relation to the rod model.
The analysis presented in this paper concerns the effectiveness of overvoltage protection of 110 kV lines. However, its general conclusions can also be applied to lines with higher rated voltages.
2. Circuit Model of High Voltage Mixed Overhead CABLE Line
The subject of the study is an idealized 110 kV single-circuit overhead cable power line, arrayed as in Figure 2. The overhead section consists of equal length spans LS = 350 m hanging between towers T1, T3, T5, …, T13 and T2, T4, T6, …, T14. The cable line of length LC = k ∙ 350 m, k ∈ {1, 3, 9} is laid in the earth between towers T1 and T2.
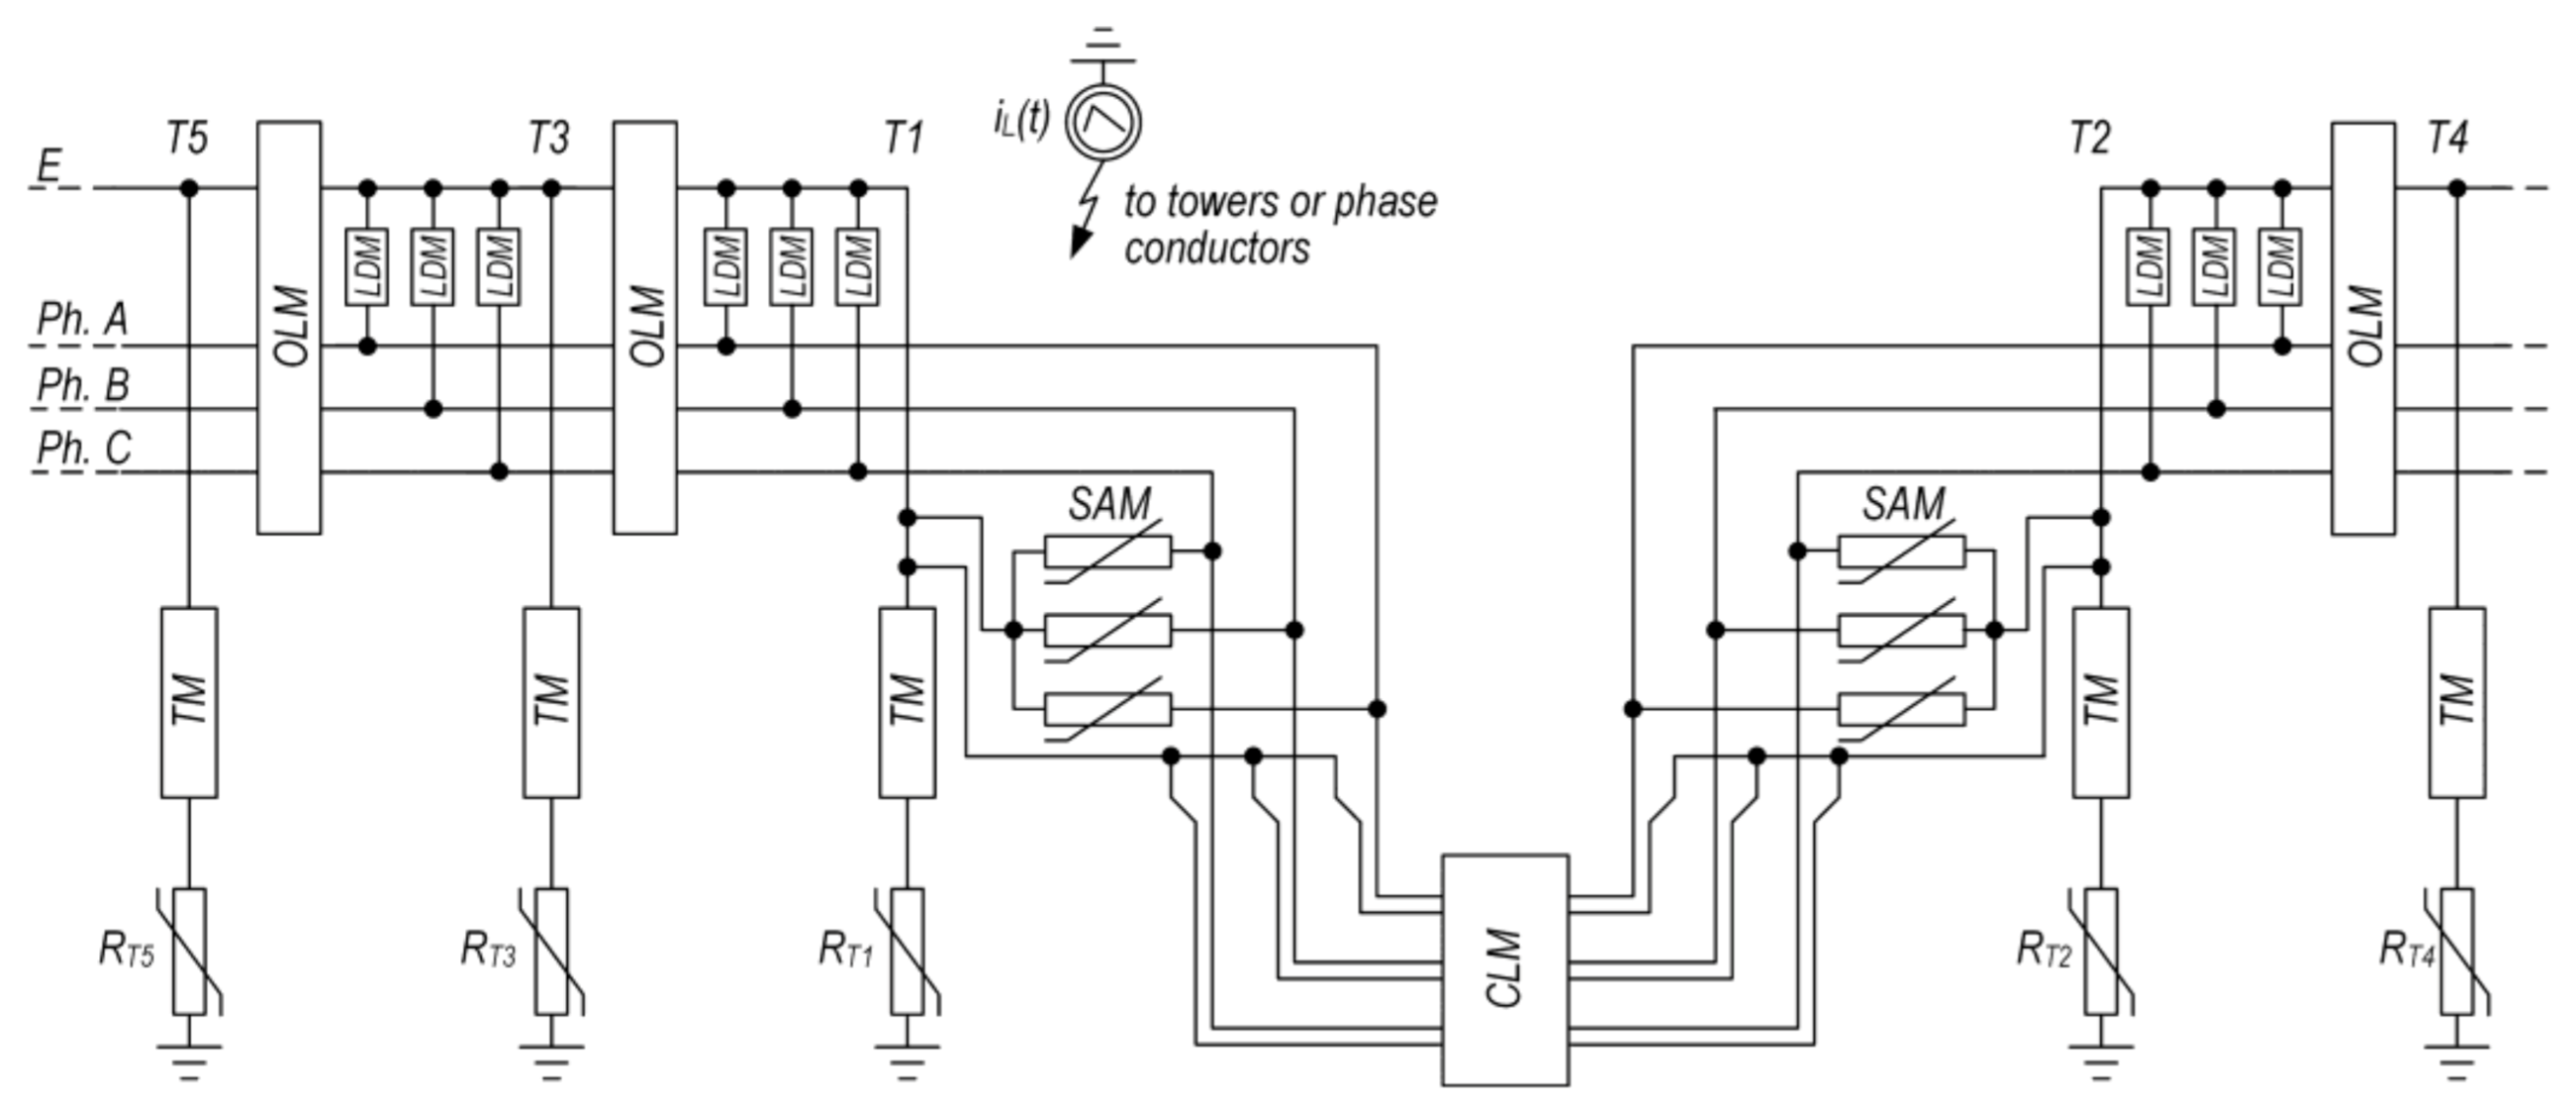
The basis on which voltages uc = uc(x,t) and um = um(x,t) as well as overvoltages uin(x,t) = uc − um (Figure 1) can be determined for given time t and place x in the cable line is a model of surge phenomena taking place in particular elements of the analyzed line. A fragment of the model is schematically presented in Figure 3.
Terminal supports T1 and T2 have been highlighted in the scheme with a CLM cable line model in-between. It was made of three single-conductor cables 64/110 kV 2XS(FL)2Y (according to IEC 60840), arranged in a flat formation, where there is a conductor cross-section equals to 800 mm2, and a metallic sheath cross-section 95 mm2. The lightning impulse test voltage of the cable is equal to 550 kV, whereas that of outer sheath totals to 37.5 kV, as provided by [12]. A CLM model was represented in EMTP-ATP software in the form of frequency-dependent six-conductor distributed parameter lines.
Tower models TM are represented by idealized geometric solids. This representation makes it possible to assume a tower model being a single conductor lossless distributed parameter line [13,14], the surge impedance ZT (Ω) of which is calculated with a formula for the cone shape:
where h is the height of the tower, and r is the radius of tower base. The parameters of T1 and T2 terminal tower model are as follows: length of the line, 17.1 m; surge impedance, 120 Ω; and propagation velocity, 255 m/μs. The parameters of the Ti intermediate tower (i = 3, 4, … n) model are as follows: length of the line, 20.6 m; surge impedance, 141 Ω; and propagation velocity, 255 m/μs.
The tower models TM are connected with an overhead line earth wire E on one side, and with a nonlinear impulse footing resistance RTi on the following side. The applied footing resistance surge model assumes an apparent increase of transverse dimension of earth as a consequence of electric discharges in the ground around the earthing system after the soil ionization initiate current value Ig has been exceeded. The footing surge resistances are represented as lumped-parameter elements, the values of which are calculated with the following equation [13,14]:
where Rst is the footing static resistance, and Ig is the soil ionization initiate current. Current Ig depends on the ionization electric field intensity Eg and soil resistivity ρE:
The AC voltage sources of power frequency, whose amplitudes correspond to the highest voltage for equipment, are connected to the conductors of phases A, B, and C. Their phase is so selected as to create the biggest insulation system hazard during the lightning discharges.
OLM models of overhead frequency-dependent four-conductor distributed parameters lines are placed between the neighboring towers. In these models the corona effect was neglected. This phenomenon can cause a reduction in the resulting overvoltages in the range of 5% ÷ 20% and is therefore often neglected in more rigorous estimates [14,15].
It is important to establish the number of towers and spans needed for the correct representation of wave phenomena in cable lines and in the neighboring towers T1, T2, T3, T4. The conducted analysis reveals that n = 14 spans of overhead lines fit this purpose. The end spans are assumed to be infinitely long. In practice, this signifies that with the assumed end span lengths, the wave effects in the cable line and supports T1, T2, T3, and T4 will not be disturbed by waves reflected from the line ends, short-circuited by the voltage sources, till the end of the simulation.
For determining the time tb from the moment the lightning strikes to the flashover, the line insulator impulse strength models involving the Leader Development Method (LDM) were used. This method assumes that the electric discharge consists of two subsequent stages: streamer phase with duration time TS and a leader phase with duration time TL. Accordingly, we have tb = TS + TL. Time TS was determined from the average voltage on the insulation system spark gap [16]:
where D is the spark gap length (m), u(t) is the voltage (kV) and TS is the time (μs). After time t ≥ TS, the leader development is analyzed and its length L is the solution of the differential equation [13]:
with the initial condition L(TS) = 0. The flashover finishes when the leader connects the insulation system electrodes in the spark gap, i.e., when L(TS + TL) = D. Parameters k and E0 are determined based on experimental analyses and their values proposed for practical applications are presented, among others, in the publication [13].
The first negative downward stroke is of fundamental importance when assessing the hazard of lightning discharges of high and extra-high voltage power facilities. It is this type of discharge (according to [13,17] in almost 90% of cases) which dominates in objects up to several tens of meters high and in plain areas. As a model of the first negative downward stroke, a current source iL(t) with a concave front current source crest value IF and variable front time was used. This source, depending on the lightning strike to the considered overhead line, is connected to the corresponding tower or phase wire. The following function proposed by CIGRE to describe the lightning current shape was adopted for the analysis [13]:
where: A, B—constants (kA/μs), I1, I2—constants (kA), t1, t2—time constants (μs). The parameters of current expressed with Equation (6) are determined for a given crest value of lightning current IF and the corresponding maximal front steepness Sm:
and front time tf:
The front steepness Sm expressed with Equation (7) is a median of conditional distribution (Sm|IF), whereas the front time tf expressed with Formula (8) is a median of conditional distribution (tf|IF). The lightning current crest value IF is a random variable described with a log-normal distribution [13]:
where M—median, and θ—slope parameter. The following values of M and θ suggested by CIGRÉ were adopted in the analysis: M = 61.1 kA, θ = 1.330 for current IF ≤ 20 kA and M = 33.3 kA, θ = 0.605 for current IF > 20 kA.
Lightning protection of overhead power lines is not completely reliable and lightning strikes to the phase wire of the line are probable, even though the line is equipped with earth wires. This results in the generation of traveling waves with significant crest values, exposing the overhead and cable line insulation. The line insulation can be also significantly hazarded when a lightning discharge intercepted by the earth wires evokes a backflashover in the overhead line. A direct lightning strike to a line phase conductor is likely when the crest value of its current is lower than a certain critical crest value IC, i.e., IF ≤ IC. The IC value depends on the mutual location of earth wires and line phase conductors, being a consequence of the applied towers. The electrogeometric model of line protection lightning zone [13,15,18,19,20] was used to determine the IC value. This model connects the striking distance rc (m) to the conductors with the crest value IF (kA) of the lightning current [19]:
and with the striking distance rg to the earth, being 80% of the rc distance. When lightning strikes the earth wires or towers, they are provided significant voltages as in relation to the ground and phase conductors, which can, under unfavorable conditions (high value of the tower footing resistance or insufficient impact strength of the line insulators) lead to backflashovers. In most cases, this phenomenon is considered with the assumption that the lightning strikes on the line support, as in that situation the resulting overvoltages are highest. The higher the crest value of the lightning current, the more probable the occurrence of the backflashover. For a given tower footing resistance and a given impulse strength of the line insulators, the backflashover will occur when critical crest value ICbf is exceeded, i.e., when IF ≥ ICbf.
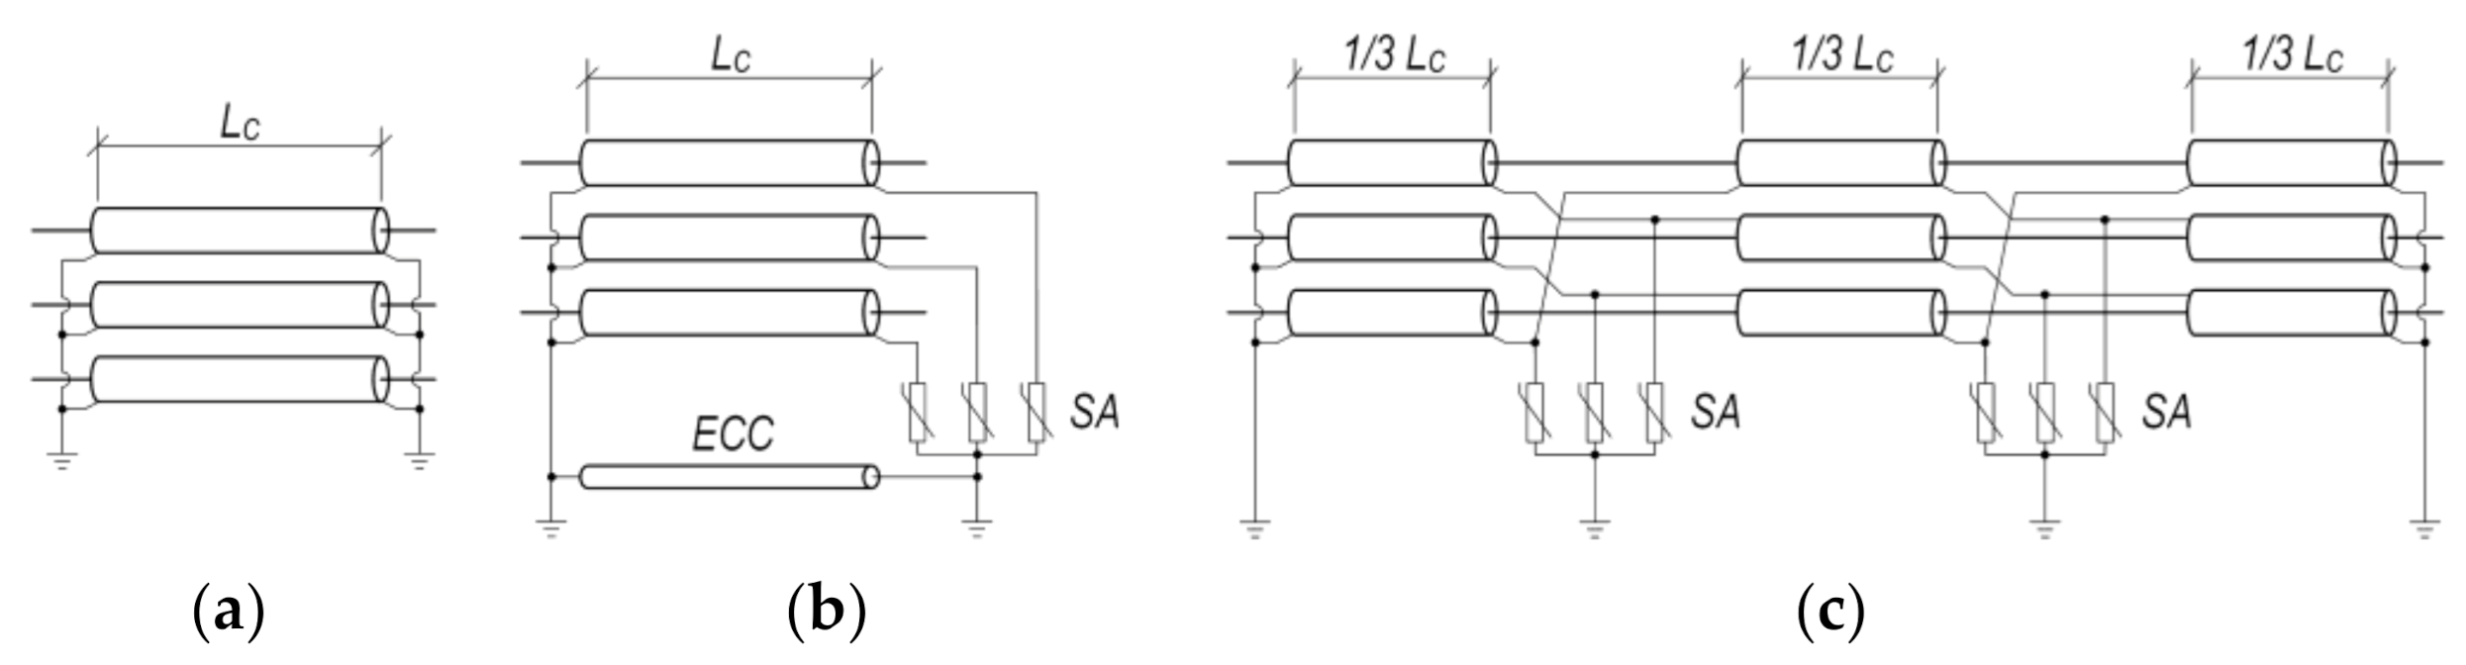
As shown in Figure 3, the surge arresters SAM installed on terminal supports are considered to limit surges on the cable insulation. The dynamic arrester model proposed by WG3.4.11IEEE [21] has been adopted. In addition to arresters protecting the cable insulation, surge arresters SA must also be used to protect the cable outer sheaths in certain cable line configurations. In this paper, three basic cable line configurations are considered (Figure 4).
The first of them is the BEB (Both-Ends Bonding) configuration with double point bonding of the metallic sheath (Figure 4a). The applicability of this array is limited to short sections of the line due to energy losses in the metallic sheath. For longer cable lines, the SPB (Single-Point Bonding) configuration is used, where metallic sheaths are not earthed at one of the line ends (Figure 4b). This solution eliminates energy losses in the metallic sheaths, but requires additional surge protection at the unearthed end and an ECC (Earth Continuity Conductor) cable. The third configuration is the CB (Cross Bonding) arrangement, in which the metallic sheaths are cross-bonded (Figure 4c). In this array, both ends of the cable line are earthed, while arresters are installed at the crossing points.
The model presented in this chapter was analyzed with the EMTP-ATP computer program. A multivariate analysis of overvoltages uin = uin(x,t) on the conductor insulation was performed, and the results are presented in chapter 3. The obtained results also provided bases for the next stage of analyses, the purpose of which was to determine the voltage ue = ue(x,t) in the cable immediate vicinity, and so determine overvoltages uos = uos(x,t) on the metallic sheath insulation.
3. Analysis of Overvoltages on Cable Line Insulation
The overvoltages on the cable line conductor insulation were analyzed assuming lightning strikes with different crest current values IF to terminal support T1 and to the all others intermediate supports T3, T5, ..., T13. Lightning strikes to both the phase conductor (IF ≤ IC) and the tower (IF > IC) were considered. The determined critical crest current value IC for tower T1 equals to 8.8 kA, while for the other intermediate towers IC = 35.9 kA.
Figure 5 shows the time curves of voltages uin at selected points of the cable line in the BEB system, where LC = 350 m. The considered case concerns a frequent practical situation of replacing one span of an overhead line with a cable line. Figure 5a shows uin voltages caused by a lightning strike with a crest value IF = IC = 8.8 kA to the phase wire on terminal support T1. These waveforms have the shape of pulses with a front time of 4÷6 μs and a slowly sloping wave tail, which results from the shape of the lightning current and the wave phenomena occurring in the analyzed system. The crest values of these pulses are close to the value of residual voltage Upl = 259 kV (10 kA, 8/20 μs) of the surge arresters installed at both ends of the cable. Analogous voltage waveforms uin are shown in Figure 5b, except that they were generated by a lightning strike with a crest current IF = IC = 35.9 kA to the phase wire in intermediate support T3. A current of this value causes a flashover in the insulation system of tower T3 and consequently a discharge of cable line capacitance by the resulting short-circuit. This results in an oscillatory decay of the uin voltage values to zero. Thanks to the use of surge arresters, in this case the crest values of overvoltages are also close to their residual voltage, Upl = 259 kV.
Figure 6 shows the time curves of voltage uin caused by lightning strikes to towers T1 and T3. They refer to two characteristic crest values of the lightning current: IF = 33.3 kA, which is the median of distribution (9) and IF = 115.4 kA, whose probability of exceedance is 2%. The presented waveforms have an aperiodic shape, with a much smaller front steepness than that of uin voltages caused by lightning strikes to the phase wires presented in Figure 5. The values of these overvoltages are proportional to the crest values of lightning currents. Moreover, in the case of lightning strikes to tower T3, the values of the overvoltages and their growth rates are much smaller than those of strikes to tower T1. This is because a much smaller part of the lightning current flows into the cable metallic sheath than when striking tower T1. Thanks to the surge arresters installed at both ends of the line, the highest instantaneous values of voltages uin do not or slightly exceed the value of residual voltage Upl.
The values and shape of overvoltages on the cable insulation are influenced by the tower footing parameters. This is illustrated with the overvoltage time waveforms in Figure 7, caused by the lightning strikes with a crest current of 115.4 kA to T1 (Figure 7a) and T3 (Figure 7b) towers. With the increase of tower footing resistance Rst and soil resistivity ρE, the level of voltage uin increases. In the case of a lightning strike to tower T3, with higher values of Rst and ρE, a backflashover may occur in the tower insulation system, changing the shape of uin overvoltages (Figure 7b). The backflashover at tower T1 is not possible due to the effect of the cable capacitance.
The analysis revealed that the shapes and values of uin overvoltages for the other configurations and metallic sheath earthing do not differ significantly. This is illustrated in Figure 8 and Figure 9, which show the same patterns of uin overvoltages as in Figure 5 and Figure 6. However, they were determined for the SPB configuration with cable line length LC = 1050 m (Figure 8) and CB configuration with cable line length LC = 3150 m (Figure 9).
The analyses have shown that the effectiveness of the cable insulation surge protection is ensured irrespective of the location of the lightning strike and the crest value of its current, or the length and configuration of the connection and earthing of the metallic sheaths. This is due to the use of surge arresters connected between the conductors and metallic sheaths at both ends of the cable line. However, apart from uin overvoltages on the insulation, there are also uos overvoltages on the outer insulation sheaths of the cables. These surges have been analyzed in Section 4.
4. Analysis of Overvoltages on Cable Outer Insulating Sheaths
To assess the value of overvoltages on the cable outer insulating sheaths, further investigations were carried out using the already presented circuit model as well as electromagnetic field models of counterpoise tower systems, developed in COMSOL and MATLAB programs. The circuit model allowed for determining metallic sheath voltages um = um(x,t), whereas the field models allowed for calculating ground voltages ue = ue(x,t) in the immediate vicinity of the cable and, on this basis, the voltages on the outer sheath of the cable uos(x,t) = um − ue.
The metallic sheath voltages um are proportional to the lightning current. They are also damped and time-shifted along the cable length. This is illustrated in the example voltage waveforms for a cable line in the BEB configuration shown in Figure 10. The values of um voltages depend on whether the lightning strikes directly on the tower structure or on the phase wire. In the former case, the um voltages (Figure 10a) are caused by part of the lightning current flowing into the metallic sheath connected to the tower earthing system. In the case of a lightning striking the phase wire, um voltages (Figure 10b) are induced due to electromagnetic coupling of the metallic sheaths with the cable conductors. These cases significantly differ due to the voltage values. When a lightning strikes the tower structure, their values may be several hundred kilovolts, i.e., many times higher, than the voltages caused by lightning strikes to the phase wires. For this reason, the instances of direct lightning strikes to the tower structure were taken into account in the analysis of insulating sheath exposure. Similar conclusions also result from the studies of lines in the SPB configuration and in CB configuration.
The calculation of ue voltages requires prior determination of currents flowing into the tower earthing systems. An example of the lightning current distribution with the crest value IF = 115.4 kA, striking directly to the T1 tower structure has been visualized in Figure 11. It leads to the conclusion that from the point of view of cable sheath exposure, the most important are the currents flowing into the earthing systems of terminal supports T1 and T2. In the presented case, the crest values of these currents are equal to about 64% and 29% of the crest value of IF, respectively.
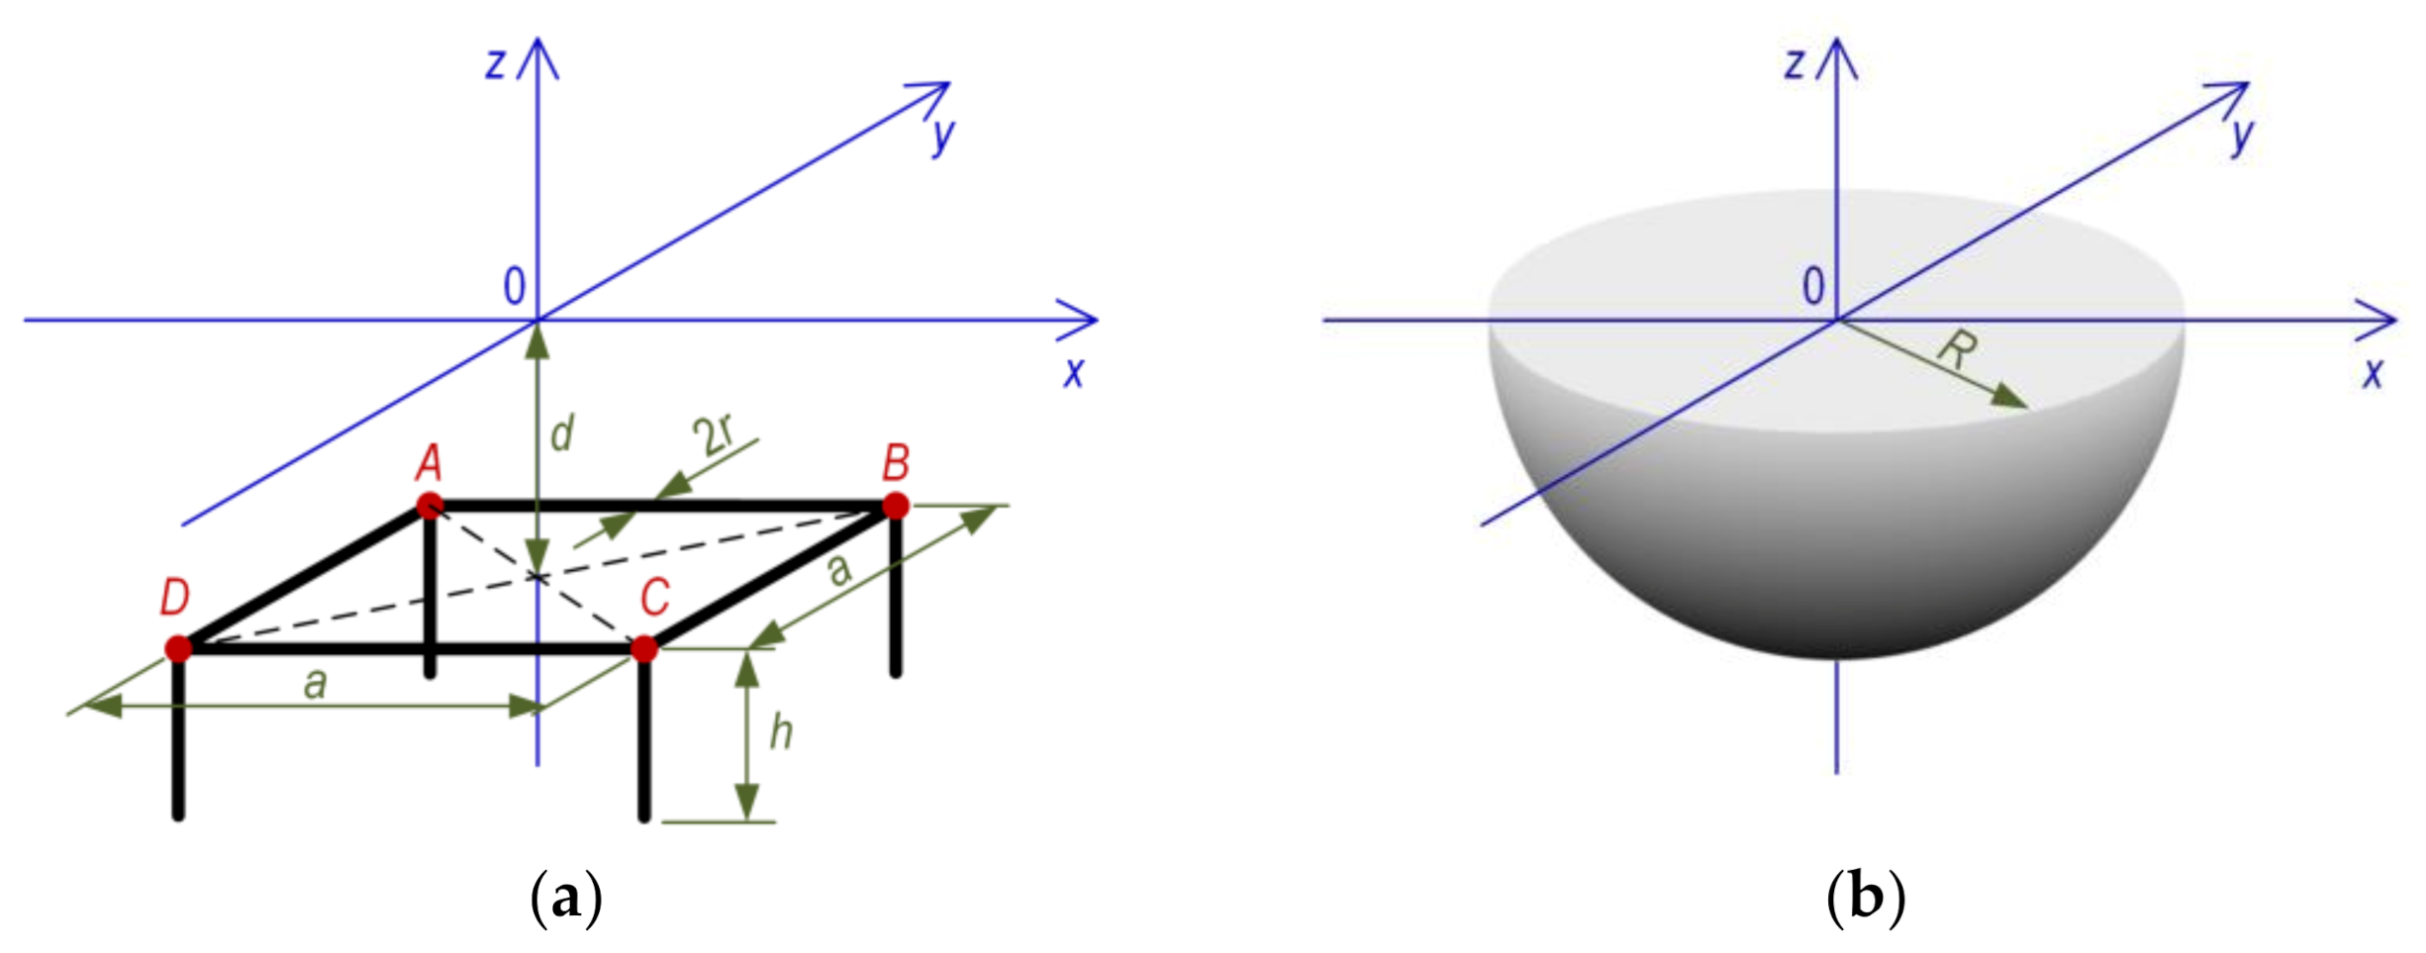
A geometrical model of the tower earthing system shown in Figure 12a was adopted for the calculation of ue voltages. This model consists of eight metal rods with radius r. Four of them form a square, situated horizontally in the ground at a depth d, with a side length a. Vertical rods with length h are connected to square vertices A, B, C, D. Each of the vertices is supplied with ¼ of the lightning current flowing to the tower earthing system. An alternative solution was also considered, i.e., the earthing model would be simplified to the form of a metal hemisphere with radius R and center at the origin of the coordinate system 0xyz (Figure 12b).
Figure 13 shows a comparison of exemplary distribution of voltages ue in the vicinity of the rod earthing (Figure 13a,c) and the hemispherical earthing (Figure 13b,d). The calculations for rod earthing were carried out with the COMSOL program. Hemispherical earthing calculations were conducted with a program developed by authors in the MATLAB environment, making use of the retarded potential theory. Presented voltage distributions refer to the lightning current with crest value IF = 115.4 kA, when lightning strikes a tower T1. A current reaching a crest value of 73.6 kA at time t = 11.14 μs flows into the tower earthing system.
The studies reveal that the hemispherical model is sufficient, as shown in Figure 14a,b, where the relative error distributions of the hemispherical model are shown with respect to the rod model. The largest error values occur in the immediate vicinity of the earth electrodes and are about 20% ÷ 25%. This rather large error value is not relevant because the voltage difference of the metallic sheath connected with the tower structure and earth in the vicinity of the earthing system is close to zero. However, the error decreases rapidly with the distance from the center of the earthing system (tower axis), and at a distance of about 12 m it does not exceed 1%. The main benefit of using the hemispherical model is the simplification of the modeling process and the significant reduction of the calculation time. For the above reasons, a simplified model was employed in the following analysis.
Exemplary time–space distributions of cable line voltages in the BEB configuration, determined for a lightning with current IF = 33.3 kA to tower T1 and tower earthing system parameters Rst = 10 Ω and ρE = 200 Ω∙m, are presented in Figure 15. Figure 15a illustrates the metallic sheath voltage um(x,t) and shows in greater detail the waveforms from Figure 10a. Figure 15b shows the voltage distribution ue(x,t) determined with a program developed in the MATLAB environment. These voltages are caused by currents flowing to the earth electrodes of terminal supports T1 and T2. On the other hand, Figure 15c shows the voltage distribution uos(x, t) = um(x,t) − ue(x,t), also being an overvoltage on the outer sheath of the cable.
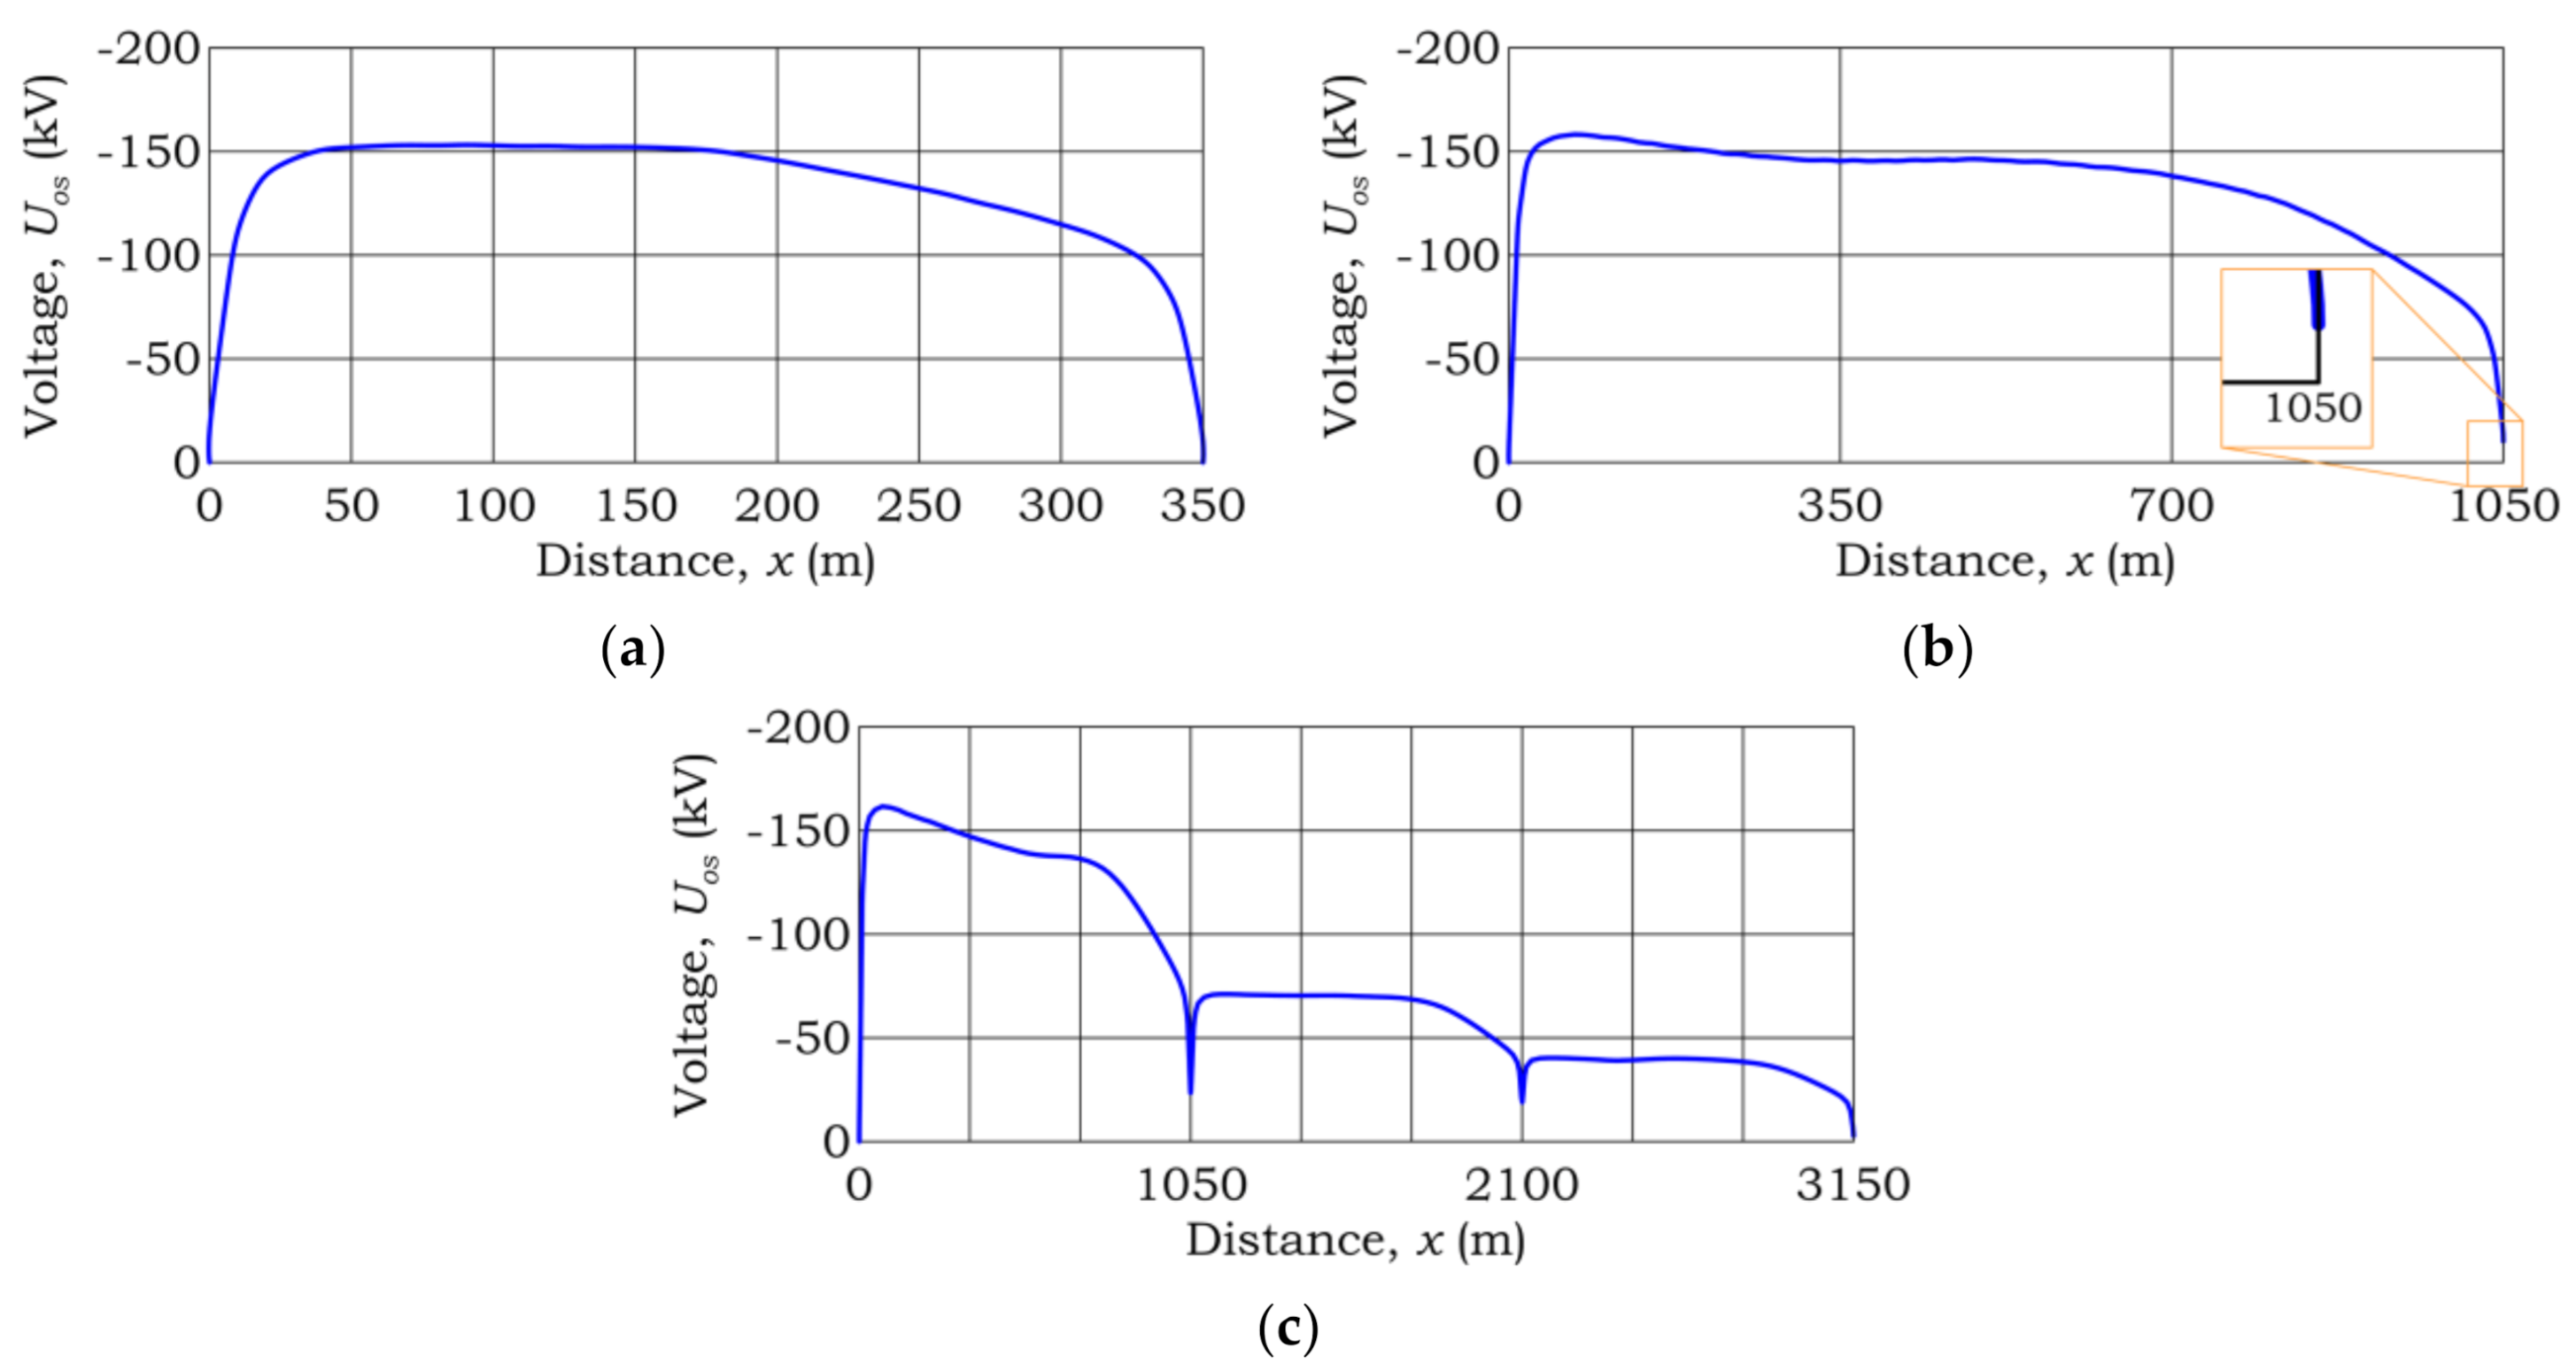
The highest instantaneous values of voltages uos are important when assessing the exposure of metallic sheath insulation. Figure 16 shows the voltage distributions along the cable lines with different metallic sheath configurations. Figure 16a illustrates the BEB configuration, where the sheath voltages at point x = 0 m (terminal support T1) and at point x = 350 m (terminal support T2) are zero, because at these points the metallic sheaths are connected to the support structures. In the area between towers T1 and T2, the sheath voltages increase and reach the highest value of about 150 kV, which is the effect of decreasing ue voltages with the increasing distance from the tower earthing system (Figure 15b). In the SPB configuration (Figure 16b), the distribution of uos(x) is similar to that of the BEB configuration, with the difference that at point x = 1050 m (terminal support T2), the voltage uos is not zero. This is caused by the assumption that the metallic sheaths are connected there to the tower earthing system by a surge arrester with residual voltage Upl = 22.5 kV (10 kA, 8/20 μs). In the CB configuration (Figure 16c), the distribution of uos(x) is different from that of the BEB and SPB configurations. This stems from the cross-bonding of metallic sheaths at points x = 1050 m and x = 2100 m and surge arresters are installed at these points. The highest voltage value occurs in the first section from the lightning-hit support T1 and is approximately equal to 160 kV. The distributions of the expected overvoltages on the outer sheaths, shown in Figure 16, was determined for the tower earthing system resistance Rst = 10 Ω with soil resistivity ρE = 200 Ω∙m and current value IF = 33.3 kA.
The analysis showed that the values of overvoltages Uos strongly increase with the increase of Rst and ρE and with the growth of crest lightning current IF. On the other hand, the configuration of metallic sheaths has less of an influence on the values of these overvoltages. This has been illustrated in Figure 17, which shows the values for metallic sheath configurations, selected values of Rst and ρE parameters, and two current values IF = 33.3 kA (Figure 17a) and IF = 115.4 kA (Figure 17b). The voltages shown in Figure 17a correspond to overvoltage values with the 50% probability that the value will be exceeded. In turn, the voltages in Figure 17b can be treated as statistical overvoltages in the insulation coordination procedures, as the probability of exceeding them is 2% [23,24].
Taking into account that the factors determining Uos overvoltages are the lightning current values and the parameters of the earthing system, which practically do not depend on the rated voltage of the line, a general conclusion can be drawn that comparable values of overvoltages will also occur in overhead cable lines with rated voltages higher than 110 kV. Thus, the median overvoltage Uos may range from about 150 kV to about 265 kV, while the statistical overvoltage values are from about 440 kV to about 850 kV. These values are many times higher than the normative sheath test voltages, which for high voltage cables range from 30 kV to 72.5 kV [12], depending on the test voltage of the cable main insulation (from 325 kV to 750 kV). Assuming that the actual strength of the outer sheath is twice as big as its withstand voltage, overvoltages with values corresponding to the median will damage the outer sheaths. This leads to the very important conclusion that the surge protective devices used in practice do not provide effective protection against atmospheric overvoltages of outer sheaths along the cables’ length. This protection is only effective in the immediate vicinity of earthing points of metallic sheaths and in places where surge arresters are connected to metallic sheaths. However, it must be taken into account that the risk of damage to the insulating sheaths also depends on the storm conditions typical of the world region and the probability of occurrence of lightning strikes to the terminal tower structures.
5. Conclusions
In this article presents an original circuit-field approach for analysingg lightning overvoltage in high voltage mixed overhead cable power lines. The developed computer models were used for a comprehensive analysis of overvoltages. The analysis rendered the evaluation of the surge protection’s effectiveness possible and not only of the main insulation but also of cables’ outer sheaths. The multi-variant research allowed us to define the impact of a number of factors on the expected values of the overvoltages.
The shape and values of overvoltages are most significantly influenced by the crest value of the lightning current, the location of the lightning strike on the overhead line, parameters of tower earthing systems and the applied surge protection. The overvoltage values are proportional to the crest value of the lightning current. The current crest value also determines whether the lightning is likely to strike a phase conductor or an earthed tower structure. Overvoltages are influenced by the location of the lightning strike on the overhead line, with the highest values for lightning discharges to the terminal supports. Therefore, it is sufficient for the assessment of the cable insulation exposure to consider lightning strikes to terminal supports. Another important factor affecting the surge level is the soil resistivity and tower earthing system resistance.
The analyses presented in this article have confirmed that the usage of surge arresters connected between the conductors and metallic sheaths at both ends of the cable line ensures the effectiveness of the surge protection of the cable insulation independently from the spot of a lightning strike, and its crest current. On the other hand, the surge protective devices used in practice do not provide effective protection against atmospheric overvoltages of outer sheaths along the cables’ length. This protection is only effective in the immediate vicinity of earthing points of metallic sheaths and in places where surge arresters are connected to metallic sheaths.
As a result of overvoltages, the outer insulating sheath of the cable may be damaged, additionally exposing it to moisture penetration. This may contribute to a faster degradation of both the metallic sheath and the cable insulation, and thus a shorter life and lower reliability of the cable line. For this reason, it is necessary to develop new ways of protecting the cables’ outer sheaths. This question is a subject for further research and its results will be presented in the authors’ future publications.
Author Contributions
Conceptualization, W.N. and R.T.; methodology, W.N. and R.T.; software, W.N., R.T., W.S. and J.G.; validation, W.N., R.T. and W.S.; formal analysis, W.N. and R.T.; investigation, J.G. and R.T.; writing—original draft preparation, W.N., R.T., W.S. and J.G.; writing—review and editing, R.T.; visualization, W.N., R.T.; supervision, R.T. All authors have read and agreed to the published version of the manuscript.
Funding
This research received no external funding.
Institutional Review Board Statement
Not applicable.
Informed Consent Statement
Not applicable.
Conflicts of Interest
The authors declare no conflict of interest.
References
- Colla, F.; Gatta, F.M.; Geri, A.; Lauria, S. Lightning overvoltages in HV-EHV “mixed” overhead-cable lines. In Proceedings of the 7th International Conference on Power Systems Transients (IPST’07), Lyon, France, 4–7 June 2007. [Google Scholar]
- Gatta, F.M.; Geri, A.; Lauria, S.; Maccioni, M. Statistical lightning simulations for a HV “mixed” overhead-cable line: Preliminary studies. In Proceedings of the 33rd International Conference on Lightning Protection, Estoril, Portugal, 25–30 September 2016. [Google Scholar] [CrossRef]
- Goertz, M.; Wenig, S.; Hirsching, C.; Kahl, M.; Suriyah, M.; Leibfried, T. Analysis of extruded HVDC cable systems exposed to lightning strokes. IEEE Trans. Power Del. 2018, 33, 3009–3018. [Google Scholar] [CrossRef]
- Gomes, T.V.; Schroeder, M.A.O.; Alipio, R.; de Lima, A.C.S.; Piantini, A. Investigation of overvoltages in HV underground sections caused by direct strokes considering the frequency-dependent characteristics of grounding. IEEE Trans. Electromagn. Compat. 2018, 60, 2002–2010. [Google Scholar] [CrossRef]
- Asif, M.; Lee, H.-Y.; Park, K.-H.; Shakeel, A.; Lee, B.-W. Assessment of overvoltage and insulation coordination in mixed HVDC transmission lines exposed to lightning strikes. Energies 2019, 12, 4217. [Google Scholar] [CrossRef] [Green Version]
- Lennerhag, O.; Lundquist, J.; Engelbrecht, C.; Karmokar, T.; Bollen, M.H.J. An improved statistical method for calculating lightning overvoltages in HVDC overhead line/cable systems. Energies 2019, 12, 3121. [Google Scholar] [CrossRef] [Green Version]
- International Council on Large Electric Systems, Working Group 21/33. TB 189. Insulation Co-Ordination for HV AC Underground Cable System; CIGRE: Paris, France, 2001. [Google Scholar]
- International Council on Large Electric Systems, Working Group B1.18. TB 283. Special Bonding of High Voltage Power Cables; CIGRE: Paris, France, 2005. [Google Scholar]
- International Council on Large Electric Systems, Working Group B1.50. TB 797. Sheath Bonding Systems of AC Transmission Cables—Design, Testing, and Maintenance; CIGRE: Paris, France, 2020. [Google Scholar]
- International Council on Large Electric Systems, Working Group B1.57. TB 815. Update of Service Experience of HV Underground and Submarine Cable Systems; CIGRE: Paris, France, 2020. [Google Scholar]
- International Council on Large Electric Systems, Working Group B1.60. TB 825. Maintenance of HV Cable Systems; CIGRE: Paris, France, 2021. [Google Scholar]
- International Electrotechnical Commission. IEC 60229. Electric Cables—Tests on Extruded Oversheaths with a Special Protective Function, 3rd ed.; International Electrotechnical Commission: Geneva, Switzerland, 2007. [Google Scholar]
- International Council on Large Electric Systems, Working Group 01. TB 63. Guide to Procedures for Estimating the Lightning Performance of Transmission Lines; CIGRE: Paris, France, 1991. [Google Scholar]
- IEEE Modeling and Analysis of System Transients Working Group. Modeling guidelines for fast front transient. IEEE Trans. Power Del. 1996, 11, 493–506. [Google Scholar] [CrossRef]
- Nowak, W.; Tarko, R. Computer modelling and analysis of lightning surges in HV substations due to shielding failure. IEEE Trans. Power Del. 2010, 25, 1138–1145. [Google Scholar] [CrossRef]
- Motoyama, H. Experimental study and analysis of breakdown characteristics of long air gaps with short tail lightning impulse. IEEE Trans. Power Del. 1996, 11, 972–979. [Google Scholar] [CrossRef]
- International Council on Large Electric Systems, Working Group C4.407. TB 549. Lightning Parameters for Engineering Applications; CIGRE: Paris, France, 2013. [Google Scholar]
- International Council on Large Electric Systems, Working Group C4.26. TB 704. Evaluation of Lightning Shielding Analysis Methods for EHV and UHV DC and AC Transmission Lines; CIGRE: Paris, France, 2017. [Google Scholar]
- IEEE Working Group on Lightning Performance of Transmission Lines. A simplified method for estimating lightning performance of transmission lines. IEEE Trans. Power App. Syst. 1985, PAS-104, 918–932. [Google Scholar] [CrossRef]
- Nowak, W.; Tarko, R. Lightning protection of substations and the effects of the frequency—Dependent surge impedance of transformers. In Electromagnetic Transients in Transformer and Rotating Machine Windings; Ch, S.Q., Ed.; IGI Global: Hershey, PA, USA, 2012; pp. 398–437. [Google Scholar] [CrossRef]
- IEEE Working Group 3.4.11. Modeling of metal oxide surge arresters. IEEE Trans. Power Del. 1992, 7, 302–309. [Google Scholar] [CrossRef]
- IEEE Guide for Bonding Shields and Sheaths of Single-Conductor Power Cables Rated 5 kV through 500 kV; IEEE Std 575-2014 476 (Revision of IEEE Std 575-1988); IEEE: New York, NY, USA, 2014; pp. 1–83. [CrossRef]
- International Electrotechnical Commission. IEC 60071-1:2019. Insulation Co-Ordination—Part 1: Definitions, Principles and Rules; International Electrotechnical Commission: Geneva, Switzerland, 2019. [Google Scholar]
- International Electrotechnical Commission. IEC 60071-2:2018. Insulation Co-Ordination—Part 2: Application Guidelines; International Electrotechnical Commission: Geneva, Switzerland, 2018. [Google Scholar]
Figure 1.
Cross-section of a high power single-conductor cable with indicated overvoltages on insulation and on outer sheath: uc—conductor voltage; um—metallic sheath voltage; ue—earth voltage; uin—overvoltage on insulation; uos—overvoltage on outer sheath.
Figure 1.
Cross-section of a high power single-conductor cable with indicated overvoltages on insulation and on outer sheath: uc—conductor voltage; um—metallic sheath voltage; ue—earth voltage; uin—overvoltage on insulation; uos—overvoltage on outer sheath.

Figure 2.
Analyzed high voltage mixed overhead cable power line.

Figure 3.
Fragment of mixed cable overhead line model: OLM—Overhead Line Model; CLM—Cable Line Model; TM—Tower Model; SAM—Surge Arrester Model; LDM—Leader Development Method model; Ph. A, B, C—phase wires; E—earth wire; RT—nonlinear footing tower resistance; T—tower number; iL(t)—lightning current model.

Figure 4.
Cable line configurations [9,22]: (a) Both-Ends Bonding BEB; (b) Single-Point Bonding SPB; (c) Cross Bonding CB. SA—Surge Arrester, ECC—Earth Continuity Conductor.

Figure 5.
Lightning overvoltages uin at the beginning, in the middle and at the end of cable line in the BEB configuration caused by lightning strikes to phase wire: (a) on tower T1 (IF = IC = 8.8 kA); (b) on tower T3 (IF = IC = 35.9 kA).
Figure 5.
Lightning overvoltages uin at the beginning, in the middle and at the end of cable line in the BEB configuration caused by lightning strikes to phase wire: (a) on tower T1 (IF = IC = 8.8 kA); (b) on tower T3 (IF = IC = 35.9 kA).

Figure 6.
Lightning overvoltages uin at the beginning, in the middle and at the end of cable line in the BEB configuration evoked by lightning strikes: (a) to tower T1; (b) to tower T3.
Figure 6.
Lightning overvoltages uin at the beginning, in the middle and at the end of cable line in the BEB configuration evoked by lightning strikes: (a) to tower T1; (b) to tower T3.

Figure 7.
Exemplary time curves of lightning overvoltages uin at the beginning of the cable line in the BEB configuration for various tower footing resistances Rst and soil resistivity ρE: (a) lightning strike to tower T1 (IF = 115.4 kA); (b) lightning strike to tower T3 (IF = 115.4 kA).
Figure 7.
Exemplary time curves of lightning overvoltages uin at the beginning of the cable line in the BEB configuration for various tower footing resistances Rst and soil resistivity ρE: (a) lightning strike to tower T1 (IF = 115.4 kA); (b) lightning strike to tower T3 (IF = 115.4 kA).

Figure 8.
Lightning overvoltages uin at the beginning, in the middle and at the end of cable line in SPB configuration evoked by lightning strikes: (a) to phase wire on tower T1 (IF = IC = 8.8 kA); (b) to phase wire on tower T3 (IF = IC = 35.9 kA); (c) to tower T1; (d) to tower T3.
Figure 8.
Lightning overvoltages uin at the beginning, in the middle and at the end of cable line in SPB configuration evoked by lightning strikes: (a) to phase wire on tower T1 (IF = IC = 8.8 kA); (b) to phase wire on tower T3 (IF = IC = 35.9 kA); (c) to tower T1; (d) to tower T3.

Figure 9.
Lightning overvoltages uin in selected places of the cable line in the CB configuration evoked by lightning strikes: (a) to phase wire on tower T1 (IF = IC = 8.8 kA); (b) to phase wire on tower T3 (IF = IC = 35.9 kA); (c) to tower T1; (d) to tower T3.
Figure 9.
Lightning overvoltages uin in selected places of the cable line in the CB configuration evoked by lightning strikes: (a) to phase wire on tower T1 (IF = IC = 8.8 kA); (b) to phase wire on tower T3 (IF = IC = 35.9 kA); (c) to tower T1; (d) to tower T3.

Figure 10.
Time curves of voltages um at the beginning, in the middle and at the end of cable line in the BEB configuration when the lightning strikes: (a) to tower T1; (b) to phase wire on tower T1 (IF = IC = 8.8 kA).
Figure 10.
Time curves of voltages um at the beginning, in the middle and at the end of cable line in the BEB configuration when the lightning strikes: (a) to tower T1; (b) to phase wire on tower T1 (IF = IC = 8.8 kA).

Figure 11.
Currents flowing into the earthing systems of individual towers for a line with a cable in the BEB configuration, when a lightning with crest current IF = 115.4 kA strikes to tower T1.
Figure 11.
Currents flowing into the earthing systems of individual towers for a line with a cable in the BEB configuration, when a lightning with crest current IF = 115.4 kA strikes to tower T1.

Figure 12.
Geometrical models of tower earthing system: (a) rod model; (b) hemispherical model.

Figure 13.
Exemplary voltage ue distribution in the vicinity of tower earthing system for Rst = 10 Ω and ρE = 200 Ω∙m: (a) rod model in xy plane for z = −1.2 m; (b) hemispherical model in xy plane for z = −1.2 m; (c) rod model in xz plane for y = 0 m; (d) hemispherical model in xz plane for y = 0 m.

Figure 14.
Relative error distributions for hemispherical earthing model referred to the rod model: (a) in plane xy for z = −1.2 m; (b) in plane xz for y = 0 m.
Figure 14.
Relative error distributions for hemispherical earthing model referred to the rod model: (a) in plane xy for z = −1.2 m; (b) in plane xz for y = 0 m.

Figure 15.
Time–space distributions of cable line voltages in the BEB configuration when lightning with current IF = 33.3 kA strikes to tower T1 (Rst = 10 Ω, ρE = 200 Ω∙m): (a) um—metallic sheath voltage; (b) ue—ground voltage around the cable; (c) uos—overvoltages in the outer sheath of the cable.
Figure 15.
Time–space distributions of cable line voltages in the BEB configuration when lightning with current IF = 33.3 kA strikes to tower T1 (Rst = 10 Ω, ρE = 200 Ω∙m): (a) um—metallic sheath voltage; (b) ue—ground voltage around the cable; (c) uos—overvoltages in the outer sheath of the cable.

Figure 16.
Distributions of overvoltages Uos on outer sheaths along the cable while current IF = 33.3 kA strikes tower T1 (Rst = 10 Ω, ρE = 200 Ω∙m): (a) BEB configuration; (b) SPB configuration; (c) CB configuration.
Figure 16.
Distributions of overvoltages Uos on outer sheaths along the cable while current IF = 33.3 kA strikes tower T1 (Rst = 10 Ω, ρE = 200 Ω∙m): (a) BEB configuration; (b) SPB configuration; (c) CB configuration.

Figure 17.
The highest overvoltages on the cable outer sheath in various metallic sheath bonding configurations and parameters Rst and ρE when lightning strikes to support T1 (a) for IF = 33.3 kA; (b) for IF = 115.4 kA: BEB—Both-Ends Bonding; SPB—Single-Point Bonding; CB—Cross Bonding.
Figure 17.
The highest overvoltages on the cable outer sheath in various metallic sheath bonding configurations and parameters Rst and ρE when lightning strikes to support T1 (a) for IF = 33.3 kA; (b) for IF = 115.4 kA: BEB—Both-Ends Bonding; SPB—Single-Point Bonding; CB—Cross Bonding.

Publisher’s Note: MDPI stays neutral with regard to jurisdictional claims in published maps and institutional affiliations. |
© 2021 by the authors. Licensee MDPI, Basel, Switzerland. This article is an open access article distributed under the terms and conditions of the Creative Commons Attribution (CC BY) license (https://creativecommons.org/licenses/by/4.0/).
Share and Cite
MDPI and ACS Style
Tarko, R.; Gajdzica, J.; Nowak, W.; Szpyra, W. Study of the Lightning Overvoltage Protection Effectiveness of High Voltage Mixed Overhead Cable Power Lines. Energies 2021, 14, 2329. https://0-doi-org.brum.beds.ac.uk/10.3390/en14082329
AMA Style
Tarko R, Gajdzica J, Nowak W, Szpyra W. Study of the Lightning Overvoltage Protection Effectiveness of High Voltage Mixed Overhead Cable Power Lines. Energies. 2021; 14(8):2329. https://0-doi-org.brum.beds.ac.uk/10.3390/en14082329
Chicago/Turabian StyleTarko, Rafał, Jakub Gajdzica, Wiesław Nowak, and Waldemar Szpyra. 2021. "Study of the Lightning Overvoltage Protection Effectiveness of High Voltage Mixed Overhead Cable Power Lines" Energies 14, no. 8: 2329. https://0-doi-org.brum.beds.ac.uk/10.3390/en14082329
Note that from the first issue of 2016, this journal uses article numbers instead of page numbers. See further details here.