Article

A CFD-Based Comparison of Different Positive Displacement Pumps for Application in Future Automatic Transmission Systems

1
Robert Bosch Automotive Steering GmbH, Richard-Bullinger-Straße 77, 73527 Schwaebisch Gmuend, Germany
2
Institute of Tribology and Energy Conversion Machinery, Clausthal University of Technology, Leibnizstraße 32, 38678 Clausthal-Zellerfeld, Germany
3
Institute of Applied Mechanics, Clausthal University of Technology, Adolph-Roemer-Straße 2A, 38678 Clausthal-Zellerfeld, Germany
*
Author to whom correspondence should be addressed.
Submission received: 24 March 2021 / Revised: 20 April 2021 / Accepted: 23 April 2021 / Published: 27 April 2021

Abstract

:
The efficiency requirements for hydraulic pumps applied in automatic transmissions in future generations of automobiles will increase continuously. In addition, the pumps must be able to cope with multiphase flows to a certain extent. Given this background, a balanced vane pump (BVP), an internal gear pump (IGP) and a three-dimensional geared tumbling multi chamber (TMC) pump are analyzed and compared by a computational fluid dynamics (CFD) approach with ANSYS CFX and TwinMesh. Furthermore, test bench measurements are conducted to obtain experimental data to validate the numerical results. The obtained numerical results show a reasonable agreement with the experimental data. In the first CFD setup, the conveying characteristics of the pumps with pure oil regarding volumetric efficiencies, cavitation onset and pressure ripple are compared. Both the IGP and the BVP show high volumetric efficiencies and low pressure ripples whereas the TMC shows a weaker performance regarding these objectives. In the second CFD setup, an oil-bubbly air multiphase flow with different inlet volume fractions (IGVF) is investigated. It can be shown that free air changes the pumping characteristics significantly by increasing pressure and mass flow ripple and diminishing the volumetric efficiency as well as the required driving torque. The compression ratios of the pumps appear to be an important parameter that determines how the multiphase flow is handled regarding pressure and mass flow ripple. Overall, the BVP and the IGP show both a similar strong performance with and without free air. In the current development state, the TMC pump shows an inferior performance because of its lower compression ratio and therefore needs further optimization.

1. Introduction

In the last few years and in the decades to come the automotive industry worldwide faces a great transformation. Classical internal combustion engine (ICE) powertrains are more and more replaced by hybrid or electrical powertrains for ecological reasons. This also influences the market of transmission systems. Looking at ICE powertrains, the market share of automatic transmission systems worldwide increased constantly for many years until now. This is because drivers favor the comfort of an automatic transmission over a manual one [1,2]. There are different types of automatic transmission systems. The most important type is the classical torque converter automatic transmission (AT), which was first invented and applied in the 1930s and 1940s in the United States. Besides that, continuous variable transmissions (CVT) and dual clutch transmissions (DCT) became more and more popular in the last decades [2]. All these transmission systems have in common that they require a hydraulic circuit to operate. To actuate clutches, brakes and shifting elements, a pressurized hydraulic fluid is required. In addition, the systems need to be lubricated and cooled by a certain flow rate of the automatic transmission oil [3]. This also applies to modern compactly constructed electrical drivetrain systems, such as the eAxle [4,5]. Because of their compactness and functional design, they require lubrication and cooling by a hydraulic fluid. Furthermore, there are electrical powertrains that include a two-speed automatic transmission for efficiency reasons or to achieve higher top speeds and starting torques [5]. These systems likewise require a hydraulic oil circuit to operate. Overall, this means that despite the ongoing transformation towards electrical powertrains, automatic transmissions will still be present for many years and need to be further improved and developed. Moreover, there are chances that hydraulic circuits are applied in some electrical drivetrains in the future. Therefore, the respective hydraulic pumps also need to be further developed and optimized, as they are essential for the function of the systems.
The requirements, which the pumps have to fulfil, have become stricter in recent years. On the one hand, this concerns the noise emission, as the powertrains themselves became quieter. Thus, the acoustic characteristics of the pumps have to be improved in order to avoid that their noise spectrum remains the only one that can be perceived. Generally, this means that the pressure ripple caused by the pump should be as low as possible. Analog to that a low ripple of the mass flow rate and volumetric flow rate is required. In addition, the overall efficiency of the pumps is becoming increasingly important. As the required power to operate the oil pump has to be branched off from the ICE, inefficient pumps can diminish the driving range and increase fuel consumption. This also applies if a small electric motor is used to run the pump, as the required power has to be branched off the battery.
Besides that, pump operation in multiphase flow conditions is a requirement that is becoming more and more important. On the one hand, this means that the pump has to cope with high rotational speeds without being damaged by cavitation erosion. On the other hand, the pump must function reliably when priming not only pure liquid oil but also air bubbles or oil foam. Oil foam formation is a common phenomenon in transmission systems despite the usage of anti-foaming agents. Additionally, the pump has to prime the oil from a tank through a suction nozzle. In different driving situations, it happens that the fluid level inside the tank tilts and the pump is suddenly priming big chunks or bubbles of air. Furthermore, there is often a certain amount of dissolved air apparent in hydraulic oils, which can outgas suddenly at pressure drops. Consequently, the pump is required to handle high inlet gas volume fractions (IGVF) of free air of up to 40%. Of course, this changes the operational characteristic significantly. For future transmission applications, these requirements are expected to become even stricter. Because of that, the question arises, if vane pumps, which are often applied in automatic transmission systems, are the most suitable positive displacement pump (PDP) type for these systems [6]. Therefore, besides a balanced vane pump, two other positive displacement pump types are investigated and compared to each other in this work by using a computational fluid dynamics (CFD) approach.
There are a few scientific contributions, which are investigating this issue and directly compare different pump types to each other. For example, the authors in [7] theoretically and experimentally compare different pump types for application in a CVT system. They found that roller vane pumps could be a promising and fitting solution. In [3], the influence of pump selection on the fuel economy of a DCT vehicle is investigated by the use of analytical models. The authors found that the application of a variable displacement vane pump instead of a gerotor pump results in a significantly better fuel economy. However, there is no study available that compares different pump types by means of extensive three-dimensional (3D)-CFD simulations. Generally, there are many scientific publications focusing on various aspects of positive displacement pumps through different simulative and experimental approaches. One simulative way is to use one-dimensional (1D) or zero-dimensional (0D) lumped parameter models to investigate basic operational characteristics. Examples for such studies are [8,9,10,11,12,13,14,15]. For more complex problems, 3D-CFD simulations are a way to gain a detailed insight into PDPs. As PDPs form rotating and deforming fluid volumes while they operate, the mesh generation is challenging. However, a few different ways to generate the appropriate grids were successfully applied. An overview of them can be found in [16]. Another challenge when performing CFD simulation of PDP are the inherent tight clearances, which determine the volumetric efficiency of the machines. Phenomena such as vapor cavitation and outgassing of dissolved air in PDPs are investigated in depth by CFD simulations in [17,18]. However, simulating a bubbly air–oil multiphase flow is difficult in positive displacement pumps because of the tight clearances, and therefore, there is a lack of such studies [19]. The authors presented their approach to model a bubbly oil–air multiphase flow in [20] and applied it successfully to a simplified two-dimensional (2D) case of a vane pump. In this work, this approach is transferred and applied to 3D pump geometries and validated by experimental data. The aim of this paper is to improve the understanding for the operational characteristic of the three different PDPs and compare them regarding their operation with and without free air.

2. Investigated Pump Types

2.1. Balanced Vane Pump (BVP)

As already mentioned, the vane pump is often applied as hydraulic supply in automatic transmission systems because of its high specific performance, good overall efficiency, adaptability and its beneficial acoustic characteristic. Weaknesses of the vane pump are its inferior quick start ability and a high susceptibility regarding dirt particles in the oil [6,21,22,23,24]. The inner parts of the investigated Bosch balanced vane pump with V d i s p l = 14.8 cm3/rev are shown in Figure 1a. Twelve vanes, which move radially in and out of the rotor in slots, slide along a cam ring and form displacement chambers for the fluid. The cam ring curve determines where the chamber volume is increasing and decreasing, and therefore, where fluid is primed into the chamber or pushed out. The investigated vane pump is a balanced vane pump, which means within one rotor revolution, two suction and two delivery ports are supplied. Both strokes are of the same height and the two delivery ports merge before the outlet. The occurring pressure forces consequently balance each other out. Further details regarding its function can be found in [20].

2.2. Internal Gear Pump (IGP)

As a second pump type, an Eckerle Technologies internal gear pump without a crescent with V d i s p l = 15 cm3/rev is investigated. It features a compensation ring to reduce the radial gap heights between the gear teeth in operation. Besides that, it has also a mechanism to reduce the axial gap heights. Advantages of this pump type are its high volumetric efficiency, its good quick start ability and its robustness against dirt particles. Its lower available displacement volume V d i s p l per overall installation space and its limited adaptability, as the IGP cannot be designed in such a way that it makes two strokes within one revolution, are two disadvantages of this pump type [6]. The inner parts of the investigated internal gear pump can be seen in Figure 1b. The pinion features 15 teeth and the ring gear 16 teeth. The suction side is located where the displacement chambers formed between the gears increase in size. The motion of the gears conveys the fluid from the suction to the delivery side, and in the delivery side, the chambers decrease in volume and the fluid is pushed out into the delivery port. Gaps between the tooth tips are kept very small in this pump by the aforementioned mechanical compensation mechanism using the pressure difference between suction and delivery side. Hence, the leakage flow through these gaps is minimized.

2.3. Tumbling Multi-Chamber Pump (TMC)

The third pump type to be investigated is the TMC pump. This is a new gear pump principle developed by Bosch in the last couple of years. The BVP and the IGP are both built up by two-dimensional shapes, whereas the TMC pump features three-dimensional shaped trochoid gears. The gears are aligned axially inside the housing. The TMC pump’s most important internal parts are displayed in Figure 2: the rotor (a), stator (b) and the hollow shaft (c). The hollow shaft is driven by a motor and transfers torque to the rotor via a slanting plate. A spring ensures that the hollow shaft and the rotor are always axially pushed against the stator to keep the existing leakage gaps coming from the manufacturing tolerances small. This preloading, furthermore, reduces the negative effects of occurring wear during the operation. Therefore, the pump parts can be molded from polymer materials, which leads to a great advantage regarding the manufacturing costs in the range of 30–50% compared to standard gear pumps at optimal annual production volumes.
Within one hollow shaft rotation, the rotor tumbles one tooth further inside the stator. The increasing and decreasing fluid volumes between rotor and stator push and pull fluid through the channels in the rotor, similar to an axial piston pump. The slanting plate acts as a valve plate and separates suction and delivery port. Further details of this pump’s function can be found in the work of Munih et al. [16].
The advantages of this pump type are low manufacturing cost, as the pump parts can be molded from a polymer material, high efficiency and its robustness against dirt particles [16]. The geometry of the teeth can be optimized for different applications. For our investigations, prototype injection molded pump parts without additional mechanical machining out of thermoset material are used due to their availability. These parts are from another application and were, therefore, optimized for a different medium and pressure range but with a suitable theoretical displacement volume of V d i s p l = 15.9 cm3/rev. The rotor has eight gear teeth, the stator has seven. A sectional view through the pump is provided in Figure 3. Orange arrows indicate the flow path from the suction to the delivery port.
A particular feature of the TMC pump is that due to its design, the rotor channels are always connected to the displacement chambers forming between rotor and stator. They present an additional fluid volume, which is not changing in size within the rotation. Therefore, the calculated compression ratio of this pump in the current development state is much lower compared to the two other pumps. However, it would be possible to change that by adjusting the rotor design.
The key properties and dimensions of all three pumps are summarized in Table 1.
In Table 1, the specific displacement volume V d i s p l / V c o r e is also listed. The volume V c o r e does not mean the total needed installation space of the pump with the housing and the shaft but only the volume enclosing the main internal parts of the pump. A higher value means that the pump achieves a high V d i s p l without using much space for the main internal parts. It can be clearly seen that the BVP has the highest value here. This is due to its design as a double stroke type.

3. CFD Models

3.1. Balanced Vane Pump (BVP)

The computational mesh of the BVP has a total of 7.8 million computational cells. The rotating and deforming displacement chambers are meshed with a structured hexahedral grid, which is generated with the commercial software TwinMesh. In radial direction, 24 cells are used to resolve the displacement chambers. In axial direction, there are 90 cells, and in circumferential direction, 1600 cells are used. The radial gaps between the vane tips and the cam ring are assumed to be 2 µm in height. As the grid has an O-shaped topology, all cell layers in the displacement chambers are also present in the radial gaps. The axial gaps, forming between the housing, the vanes and the rotor have a height of 8 µm on both sides. They are resolved by an unstructured mesh with 15 cell layers in the axial direction. The assumptions for the different gap heights result from the manufacturing tolerances of the pump parts and measurement data from earlier investigations. The spatial mesh resolution for the rotor and the gaps is derived from investigations of the authors presented in [20], where a grid convergence study on a 2D model of a BVP was performed. However, for the investigated 3D cases, a compromise between high spatial resolution and computational cost must be made. The details of the moving rotor mesh are displayed in Figure 4. The mesh nodes are kept fixed on the vane and rotor contour, while they can slide on the outer cam ring contour. Between the structured rotor mesh and the unstructured mesh of the stator parts, interfaces provide grid connections. Similar cell aspect ratios and cell volumes on both sides of the interfaces are especially important to achieve convergence. In the stator parts, all walls are refined with prism layers to ensure a y + < 30 value in the first cell layer near the wall. This value for the dimensionless wall distance y + is necessary to fulfil the mesh requirements of the wall function of the employed turbulence models in ANSYS CFX. The complete model with the corresponding boundary conditions (BC) can be seen in Figure 5a.
Although a double stroke balanced vane pump is investigated, both suction and delivery ports are merging in the pumps housing, so there is just one inlet and one outlet. Further meshing details of the axial gap mesh and the different grooves and notches can be seen in Figure 5b. It is especially important to resolve the grooves with a high spatial resolution, as very high pressure gradients and velocities occur at these locations.

3.2. Internal Gear Pump (IGP)

The computational mesh of the internal gear pump has a total of 8.2 million cells. In the structured mesh of the displacement chambers forming between the gears of pinion and gear ring, which is generated by TwinMesh, the grid nodes are kept fixed both on the contours of the gear ring and the pinion. As the pinion and gear ring are both rotating with different rotation rates, the mesh is divided into two separate parts, which are connected by an interface. The mesh nodes can slide on the interface, which is displayed in Figure 6a. Both mesh parts have 20 cells in radial direction. In axial direction, there are 50 cell layers. Circumferentially, there are about 2000 nodes on the pinion and gear ring. The topology of the two meshes is also O-shaped. The radial gaps are assumed to have a height of 5 µm, and the mesh in the gap region is displayed in Figure 6b.
Besides the radial gaps, there are also axial gaps between the housing and the gears, which have to be considered in the CFD simulation. They are assumed to be 5 µm in height and resolved with 18 cell layers in axial direction. The meshing of the stator parts is done with an unstructured grid with prism layers on the walls. The complete CFD model of the IGP with the respective boundary conditions is displayed in Figure 7a. Figure 7b shows the structured mesh of the axial gap and the unstructured mesh of the delivery port stator part.

3.3. Tumbling Multi-Chamber Pump (TMC)

The computational mesh of the TMC pump has a total cell count of 9.6 million cells. As mentioned in Section 2, the hollow shaft transfers torque to the rotor by a slanting plate. This means that the respective meshes for the fluid volume in the rotor and in the hollow shaft have different motion functions. The mesh of the displacement chambers forming between rotor and stator is generated by TwinMesh. In the gaps between the teeth, which are assumed to be 10 µm in height, 23 cell layers are used in θ-direction. In r-direction, there are 60 cell layers, while in φ-direction, there are 1500 elements over the total circumference. These meshing details are displayed in Figure 8.
Besides this apparent leakage path through the gaps between the teeth, there are other leakage paths from the delivery to the suction side, which have to be considered and incorporated in the model in order to get a correct estimation of the volumetric efficiency of the pump. The two spherical gaps, which are formed between stator and rotor, as the rotor slides in the stator, are assumed be 10 µm (inner spherical gap) and 20 µm (outer spherical gap) in height. They are displayed in Figure 9a. Both are resolved with 15 cell layers in r-direction. Between the rotor and the slanting plate of the hollow shaft, there is a gap, which is estimated to be 10 µm in height, and it is also resolved by 15 cells. The unstructured mesh of this rotor–shaft gap is displayed in Figure 9b. Finally, there is a gap between the hollow shaft and its journal bearing (see Figure 3), which is assumed to be 20 µm in height. High-pressure oil from the delivery port can flow back into the suction port through this gap. Therefore, it is incorporated in the CFD model of the TMC pump by resolving it with 15 cell layers in radial direction. The rotor channels and the hollow shaft are resolved with unstructured meshes. These can be seen in Figure 9b and Figure 10b.
All these tight gaps contribute to a higher total cell count of the TMC pump CFD model compared to the two other pumps. In Figure 10a, the complete CFD model with its boundary conditions and, in Figure 10b, the mesh of the fluid volume in the hollow shaft are displayed. It is clearly visible how delivery and suction ports are separated from each other by the hollow shaft geometry. At the interface to the rotor–shaft gap, the mesh needs to be especially fine in order to avoid high differences in cell volume and high aspect ratios at the interface. The suction port and the delivery port are resolved by unstructured meshes.

3.4. General CFD Setup and Boundary Conditions

For the numerical investigations, ANSYS CFX is used as CFD solver. To investigate all mentioned multiphase phenomena in one single setup is quite difficult, because a three-phase approach would be necessary. This would lead to further numerical difficulties and convergence issues. Therefore, it is decided to investigate the multiphase phenomena separately in two independent numerical setups. On the one hand, setup 1 incorporates cavitation phenomena by employing a homogeneous Euler–Euler two phase flow setting with a continuous liquid oil and a continuous oil vapor phase. The mass transfer between the two phases is modelled by the Rayleigh–Plesset Cavitation model. Setup 2 incorporates an inhomogeneous Euler–Euler multiphase flow regime with continuous liquid oil and disperse bubbles of free air. No mass transfer between the phases is considered. Both setups are explained in more details in [20]. Additionally, further investigations concerning model parameters are discussed in that article. The most important details of both numerical setups are listed in Table 2.
To spatially discretize the deforming and rotating displacement chambers of these three positive displacement pumps, a moving mesh approach is selected. As already mentioned, the commercial software TwinMesh is used for the grid generation. TwinMesh generates structured hexahedral meshes with a high cell quality, which is especially important for multiphase flow simulations [25]. The meshes are generated in advance for a certain angle step size and are then loaded into the ANSYS CFX solver by a Junction Box routine at the beginning of each time step. For most simulations, an angle step size of 0.5° is sufficient. For the simulations with an IGVF > 0, a smaller angle step size of 0.25° is required to obtain convergence. For the investigated rotational speeds from 500–6000 rpm, this leads to a time step size range from 1.61 · 10 5 s to 8.33 · 10 5 s. This ensures mean Courant numbers C < 5 at all investigated operating points for the three CFD models. As operating fluid, a typical transmission oil is used. The fluid properties of the oil are listed in Table 3.
At the inlet of the fluid domain in the suction ports, a pressure BC of 1 bar is set. In addition, the IGVF is applied there when setup 2 is used. At the outlet in the delivery port, another pressure BC with the investigated pressure load is used as well as a zero gradient BC for the volume fractions of the different phases.
To investigate and compare the pressure ripple in the delivery port of the pumps, a further tubular extension of the computational domain starting at the delivery port outlet of the pumps including an orifice is added. This can be seen in Figure 11. The tubular extension is identical for all three pumps and represents the setup at the test bench, where the experimental data are obtained. The new outlet pressure boundary condition for these cases is set to 1 bar, as the pressure drop over the orifice serves as the pressure load. The intention of this long tubular extension is to minimize the influence of the outlet boundary condition on the pressure ripple induced by the pumps that are monitored at the indicated point. The orifice diameter is adjusted until the time averaged pressure at the monitor point equals the desired pressure load.
Furthermore, the rotational speed of the rotor is set as a boundary condition for the Junction Box routine that loads the grids into the solver, and all simulations are performed at an inlet oil temperature of 20 °C.
It is important to mention that in all simulations conducted with setup 2 (IGVF of free air), all incorporated clearances in the CFD models for the three pumps have to be artificially enlarged to 30 µm height in order to obtain convergence. The multiphase flow setup 2 does not converge for smaller clearances. However, for setup 1 (cavitation) the original clearance height dimensions, which were mentioned before, are used for the CFD simulations.

4. Test Bench Measurements

In order to validate the numerical results, measurements are conducted. The respective test bench setup is schematically shown in Figure 12. High-frequency pressure and temperature sensors are placed in the suction and delivery port. Furthermore, the volumetric flow rate is measured on the delivery side. On the suction side, air is injected into the oil by a compressor. The IGVF of free air α a i r is determined in the suction area by a Flucon Concentration Gas System (CGS) Inline Aeration Meter, which derives the IGVF from measuring the complex fluid impedance of the mixture and comparing it to the complex fluid impedance of the pure liquid oil.
Furthermore, the required driving torque and the respective power demand of the motor are measured. Measurement data are obtained at 30 operating points with no air injection and at 27 operating points with 5–20% IGVF of free air. The pressure load is varied between 5 bar and 22.5 bar, and the rotational speed ranges from 500 rpm up to 6000 rpm. The inlet oil temperature is held constant at a value of 20 °C.
For validation purposes, an additional measurement campaign is performed with the BVP, where the displacement chamber pressure is recorded during the pump rotation by a high frequency pressure sensor, which is glued into the rotor. The experimental setup is analog to the work of Suzuki et al. [26] and Hieronymus et al. [27]. The pressure transducer in the rotor can be seen in Figure 13.
The measured pressure data are transferred to the data acquisition system by wires leading through the driving shaft and a slip ring. With this setup, measurements up to 3000 rpm and 22.5 bar pressure load can be performed.

5. Results

5.1. Setup Cavitation (IGVF = 0)

At first, the results obtained with the setup 1 (cavitation, see Table 2) are investigated. In 
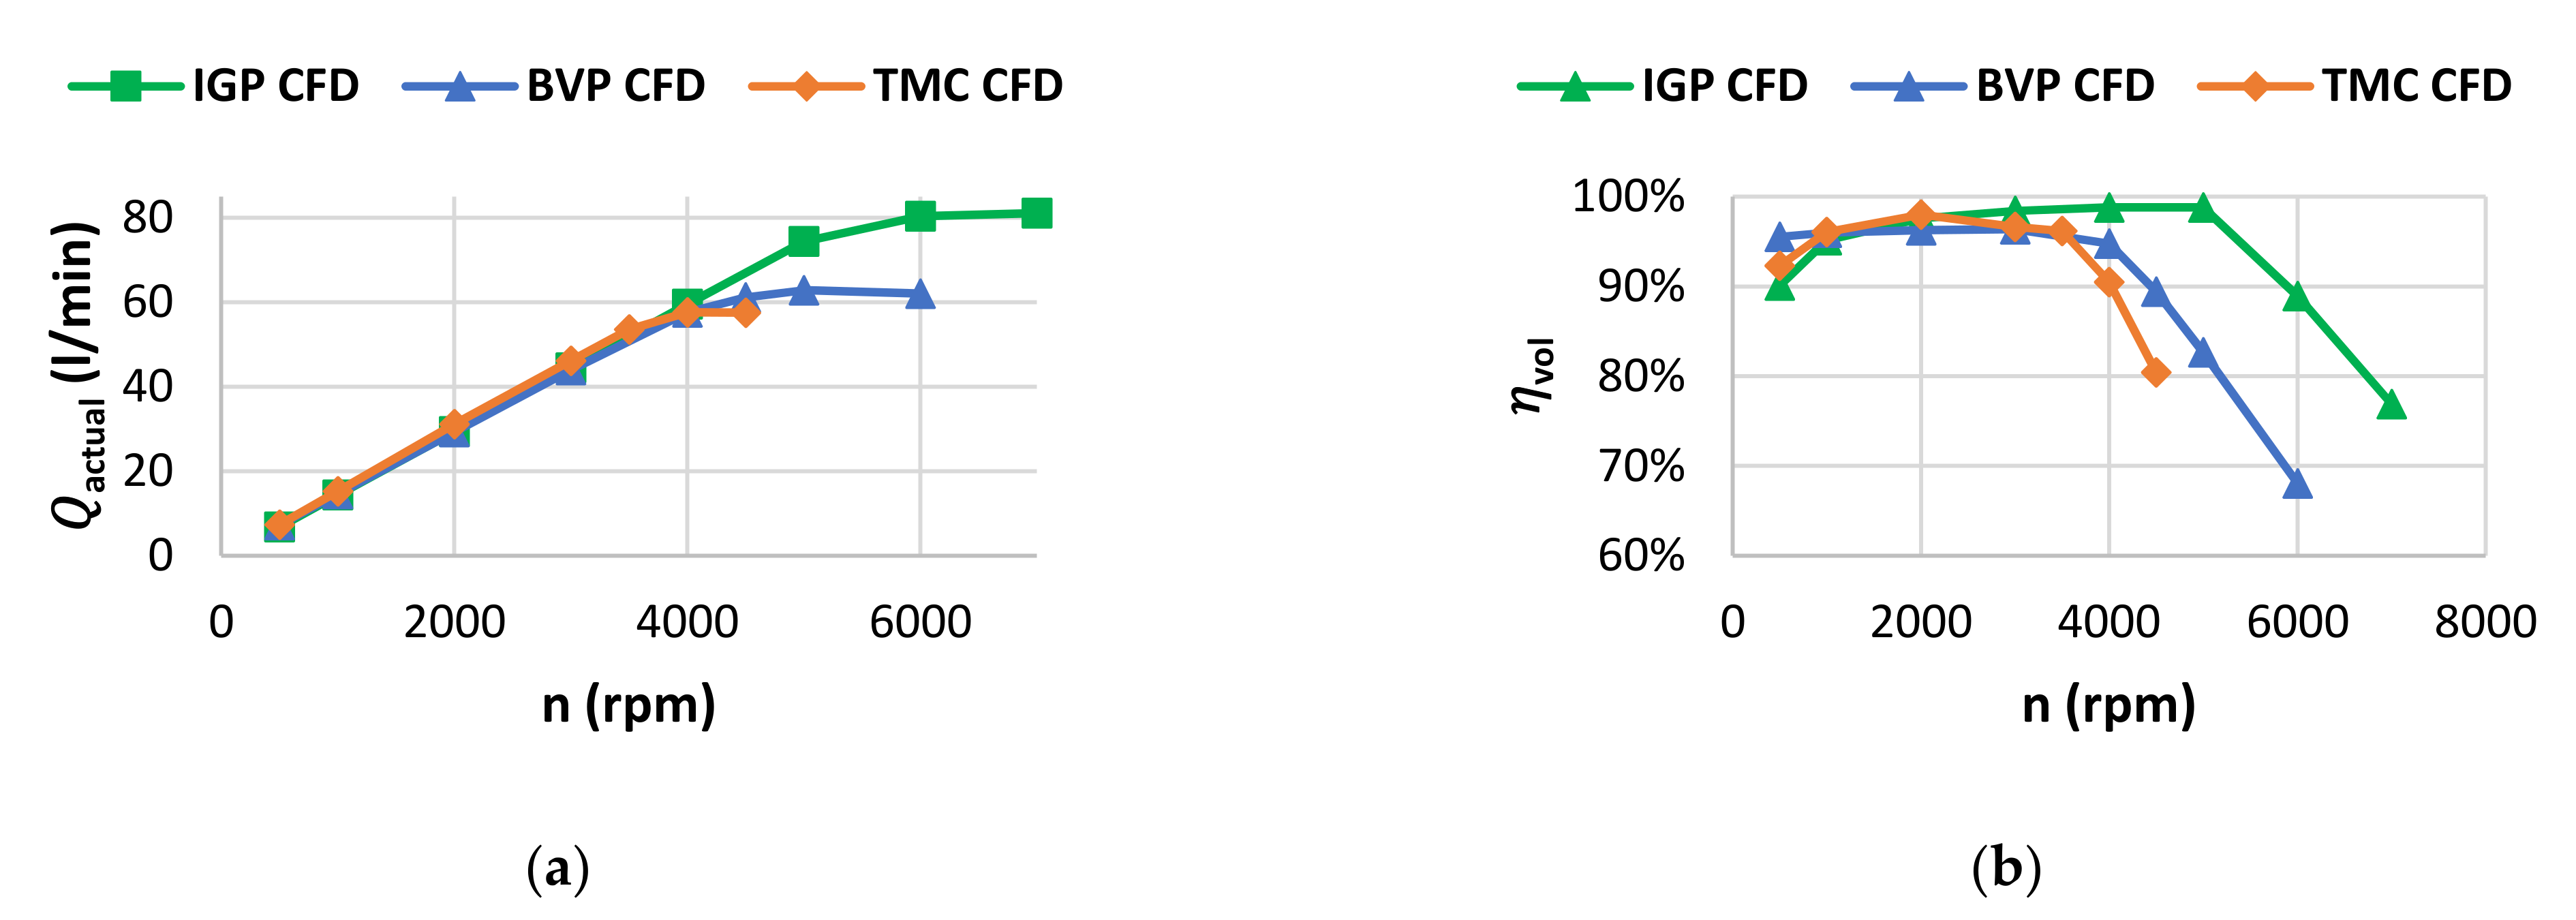
Figure 14, the conveying characteristics and the equivalent volumetric efficiencies of the three pumps are compared. The volumetric efficiencies are calculated as stated in Equation (1).
η v o l = Q a c t u a l Q t h e o = Q t h e o Q l e a k a g e Q t h e o   w i t h   Q t h e o = V d i s p l · n
In Figure 14a, it is visible that for the TMC pump, cavitation starts at about 3500 rpm. The maximum volumetric flow rate is restricted to a value of slightly below 60 L/min. At 4000 rpm, the BVP is the second pump to reach the cavitation onset, and at 5000 rpm, the IGP is the last one, reaching a volumetric flow rate of approximately 80 L/min. This can be explained by the different suction port geometries and filling strategies of the displacement chambers in the pumps. In the TMC pump, the flow has to perform a 180° turn in the stator suction port area in order to reach the channels in the rotor where the oil is sucked into the displacement chambers (see Figure 3). This leads to high velocities and a high pressure drop resulting in an early cavitation onset. This could be improved by designing a new suction port geometry with a radial inlet. The BVP has two suction ports where the fluid is fed into the displacement chambers, as it is of two-stroke type. Furthermore, the chambers are fed both axially and radially, which leads to higher flow cross section area, less pressure loss and, hence, a delayed cavitation onset. The IGP, however, has the highest flow cross section area in the suction port. Although it is of one-stroke type and only axially fed, the suction port is laid out with ample flow cross section area and small pressure losses. Therefore, the cavitation onset is further delayed to higher rotational speeds.
Additionally, it can be seen in Figure 14a that the three pumps show a slightly different gradient d Q a c t u a l d N for rotational speeds before the cavitation onset. As d Q a c t u a l d N V d i s p , the TMC pump has a slightly higher gradient and the BVP a slightly lower one with the gradient of the IGP staying between those two. This corresponds to the theoretical displacement volumes V d i s p of the pumps, which are listed in Table 1.
The volumetric efficiencies of the three pumps are in a quite similar range between 1000 and 3500 rpm, which can be obtained from Figure 14b. At lower rotational speeds the BVP seems to feature slightly higher volumetric efficiencies than the IGP and the TMC pump.
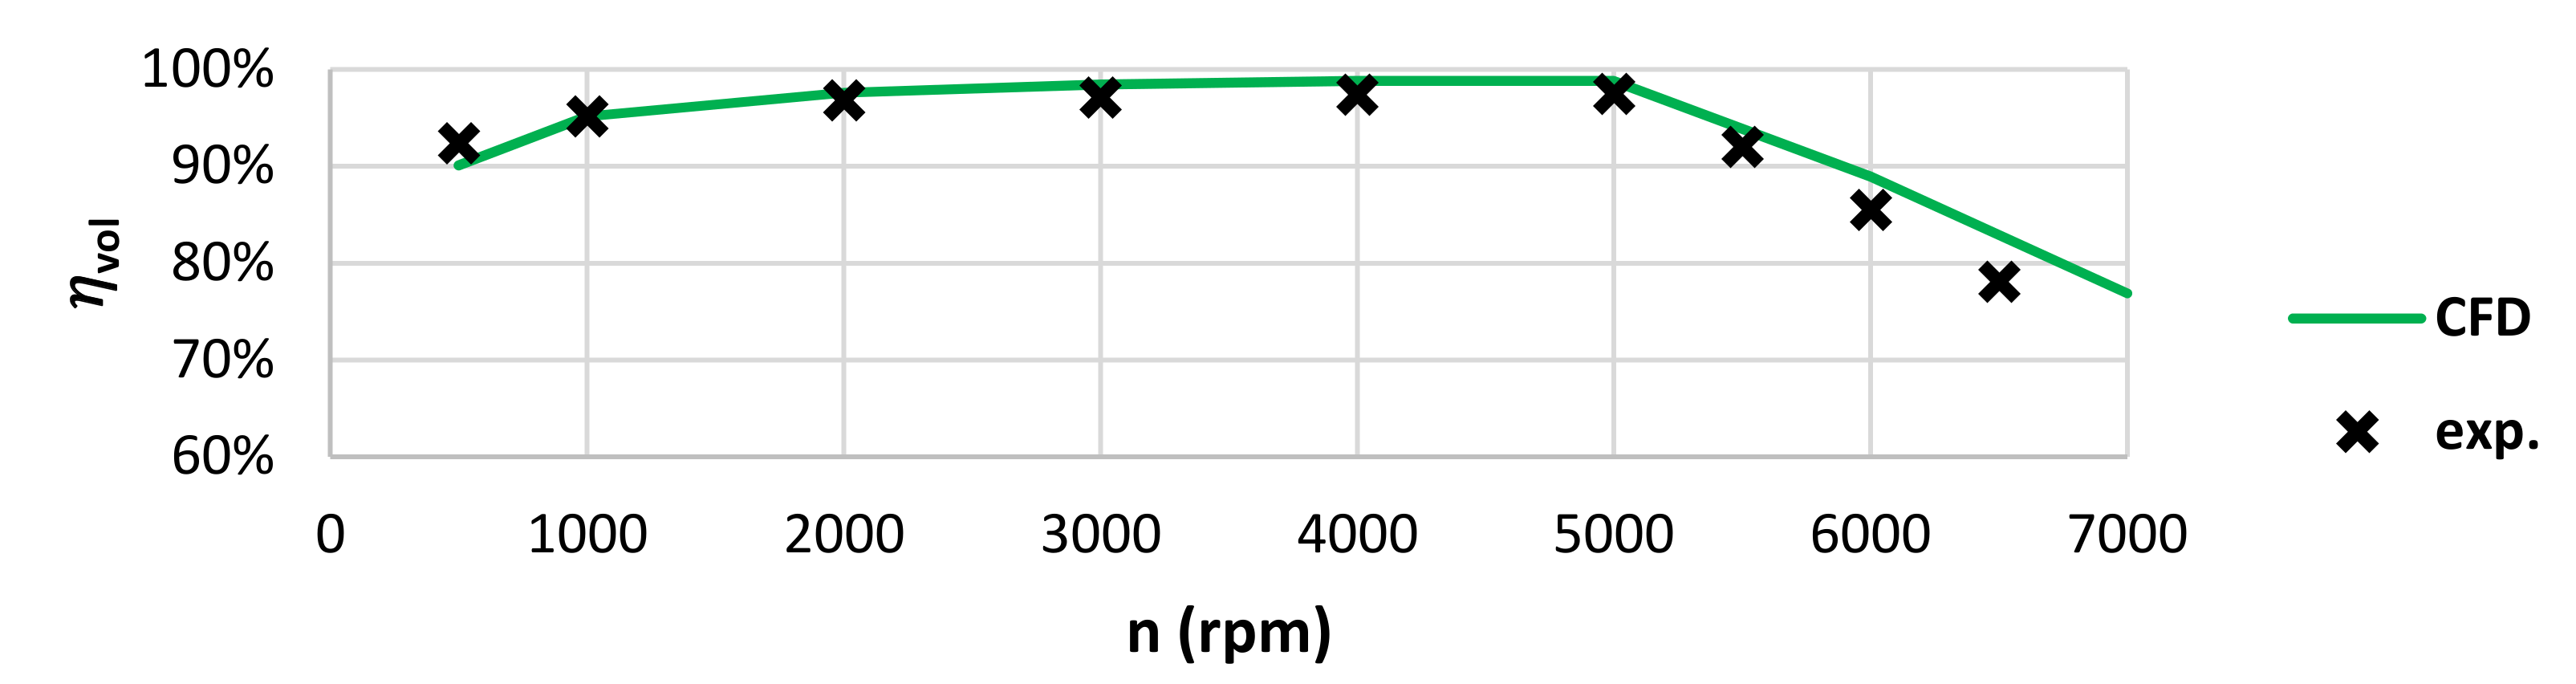
To validate the CFD model of the three investigated pumps, in Figure 15, Figure 16, Figure 17, the volumetric efficiencies obtained from the CFD simulations are compared with the experimental data.
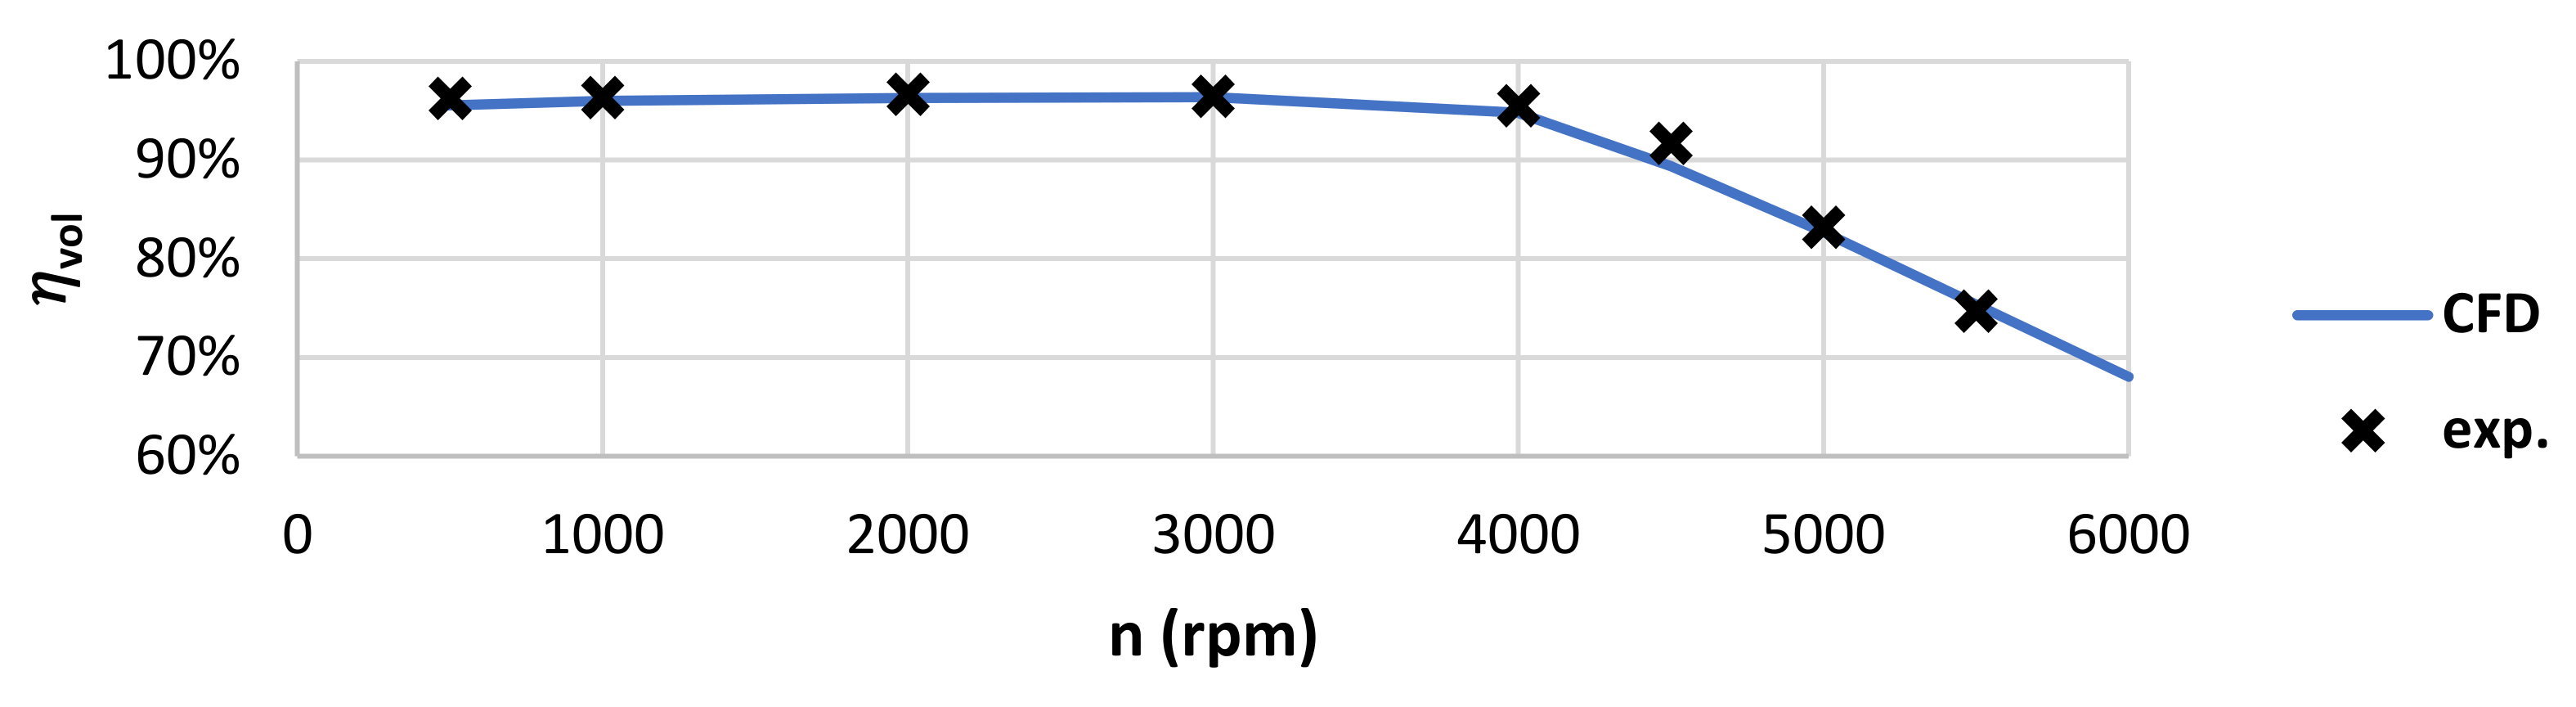
As it can be observed from Figure 15 and Figure 16, the CFD data show a good fit to the experimental data for the BVP and the IGP. By iteratively calibrating, the applied Rayleigh–Plesset cavitation model constants to F v a p = 90 and F c o n d = 0.01 , the cavitation onset is also captured quite well. However, the drop of the volumetric efficiency due to the onset of cavitation with increasing rotational speed is underestimated for all three pump types. This is probably because of the limitations of the Rayleigh–Plesset cavitation model. It only incorporates vapor cavitation, while in reality, we can expect vapor cavitation as well as outgassing of dissolved air from the oil limiting the suction capability of the pumps. The usage of a more sophisticated cavitation model could be a way to enhance this prediction.
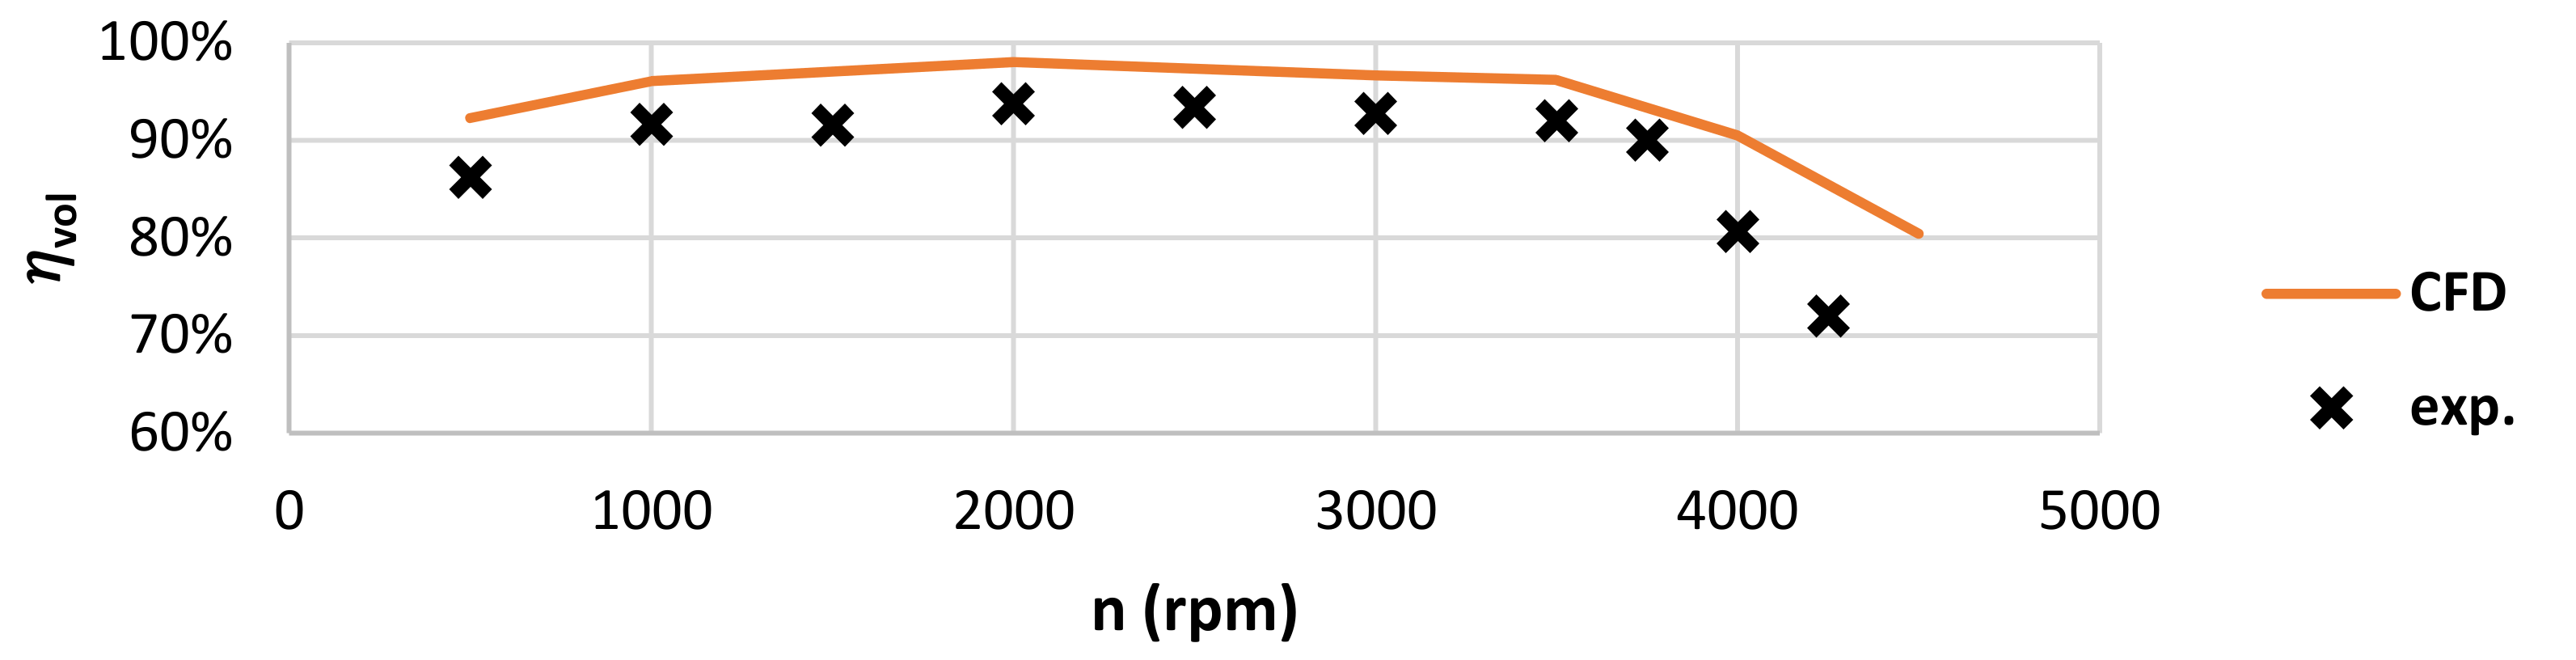
For the case of the TMC pump, it can be clearly seen in Figure 17 that the CFD prediction for the volumetric efficiency does not fit as well to the experimental data, as it does for the BVP and the IGP. The volumetric efficiency is considerably overpredicted in the CFD simulations. As the volumetric efficiency is governed by the internal leakages, most possibly a difference between the clearance heights assumed in the CFD model and the real clearance heights are responsible for this deviation. Besides the deviation in absolute value of the volumetric efficiency, the qualitative characteristic while increasing the rotational speed is captured quite well. This indicates that the CFD model itself is valid, but the assumptions for the gap heights need to be improved. However, it is quite difficult to determine the actual gap heights during pump operation. Furthermore, the gap height is kept constant in the CFD simulation. In reality, the rotor–stator system with the spring can dynamically move axially depending on the pressure distributions and the spring stiffness. This effect, which then enlarges the gap heights significantly, is not incorporated in the CFD simulations and could be a further reason for the deviation, which especially becomes higher at rotational speeds above 3500 rpm, when cavitation starts. Additionally, the limits of the employed cavitation model contribute to the higher deviations here.
Considering the experimental data, the TMC pump shows lower volumetric efficiencies than the BVP and the IGP, which are both on a similar, higher level. Apparently, the gap heights in the TMC pump are larger than assumed. One possibility to improve this would be to use a spring with a higher stiffness (see Figure 3). The force pushing the rotor against the stator would increase and the leakages would decrease. However, this would presumably also lead to an increased required driving torque and wear.
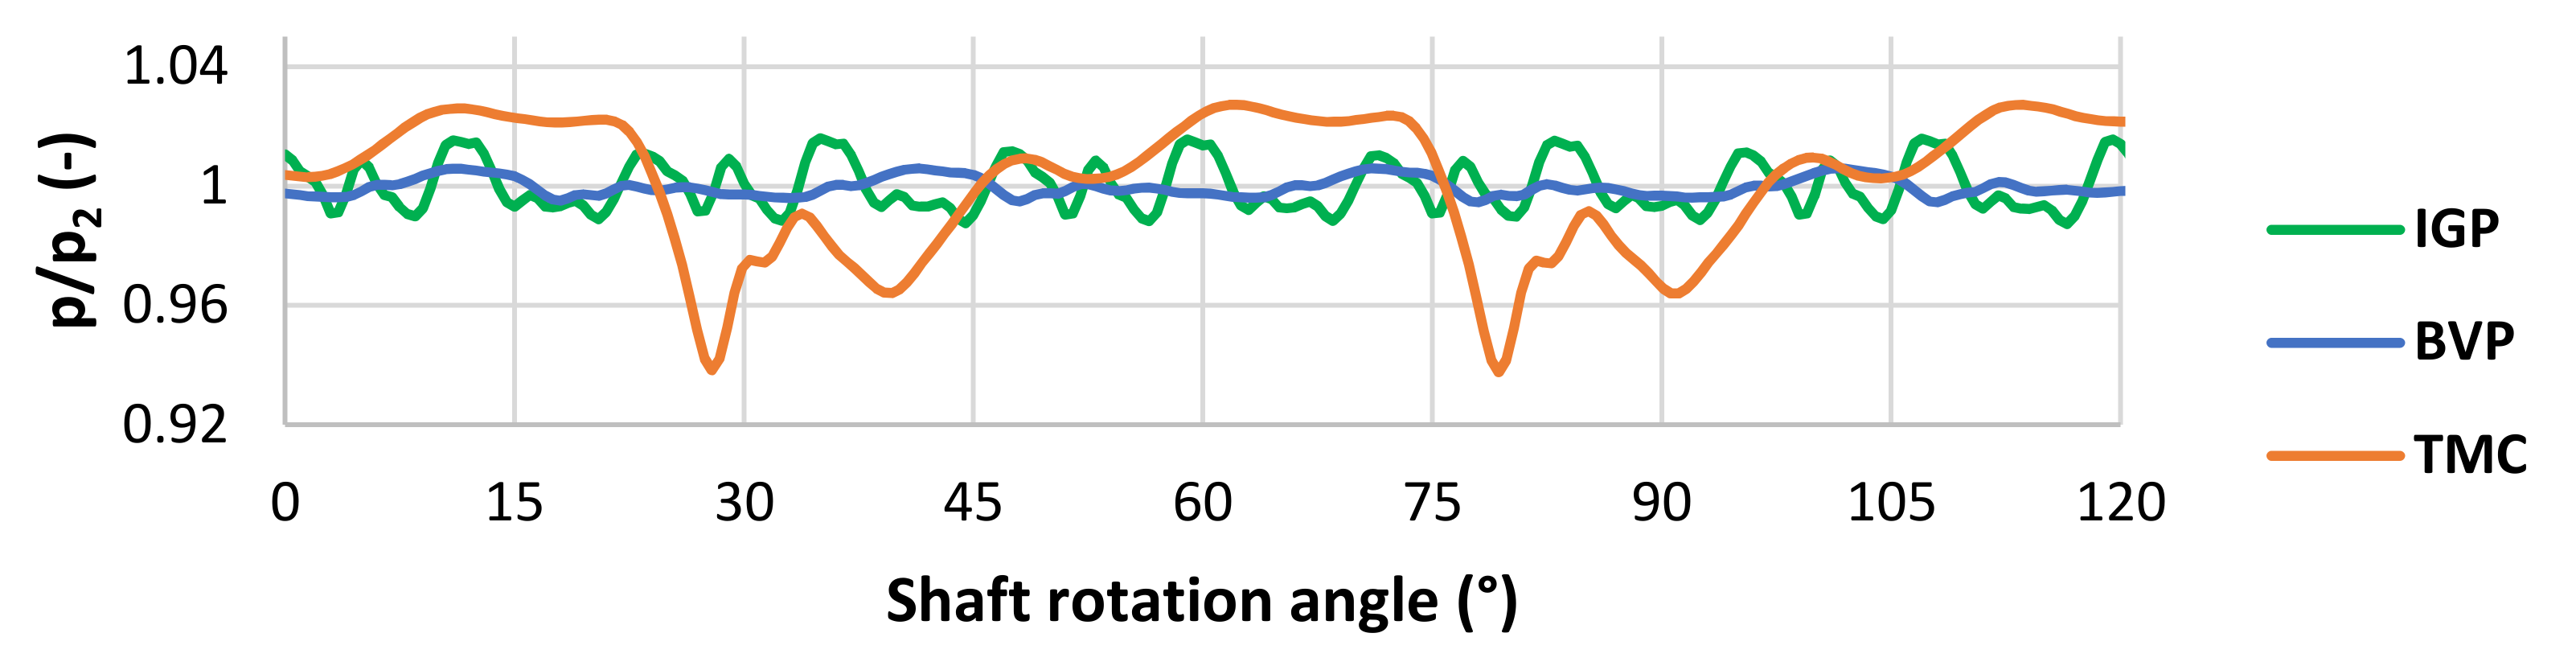
Besides the volumetric efficiency and the conveying characteristic, the instantaneous pressure profile inside a displacement chamber within one shaft rotation is quite distinctive for a pump’s operational characteristic. In 
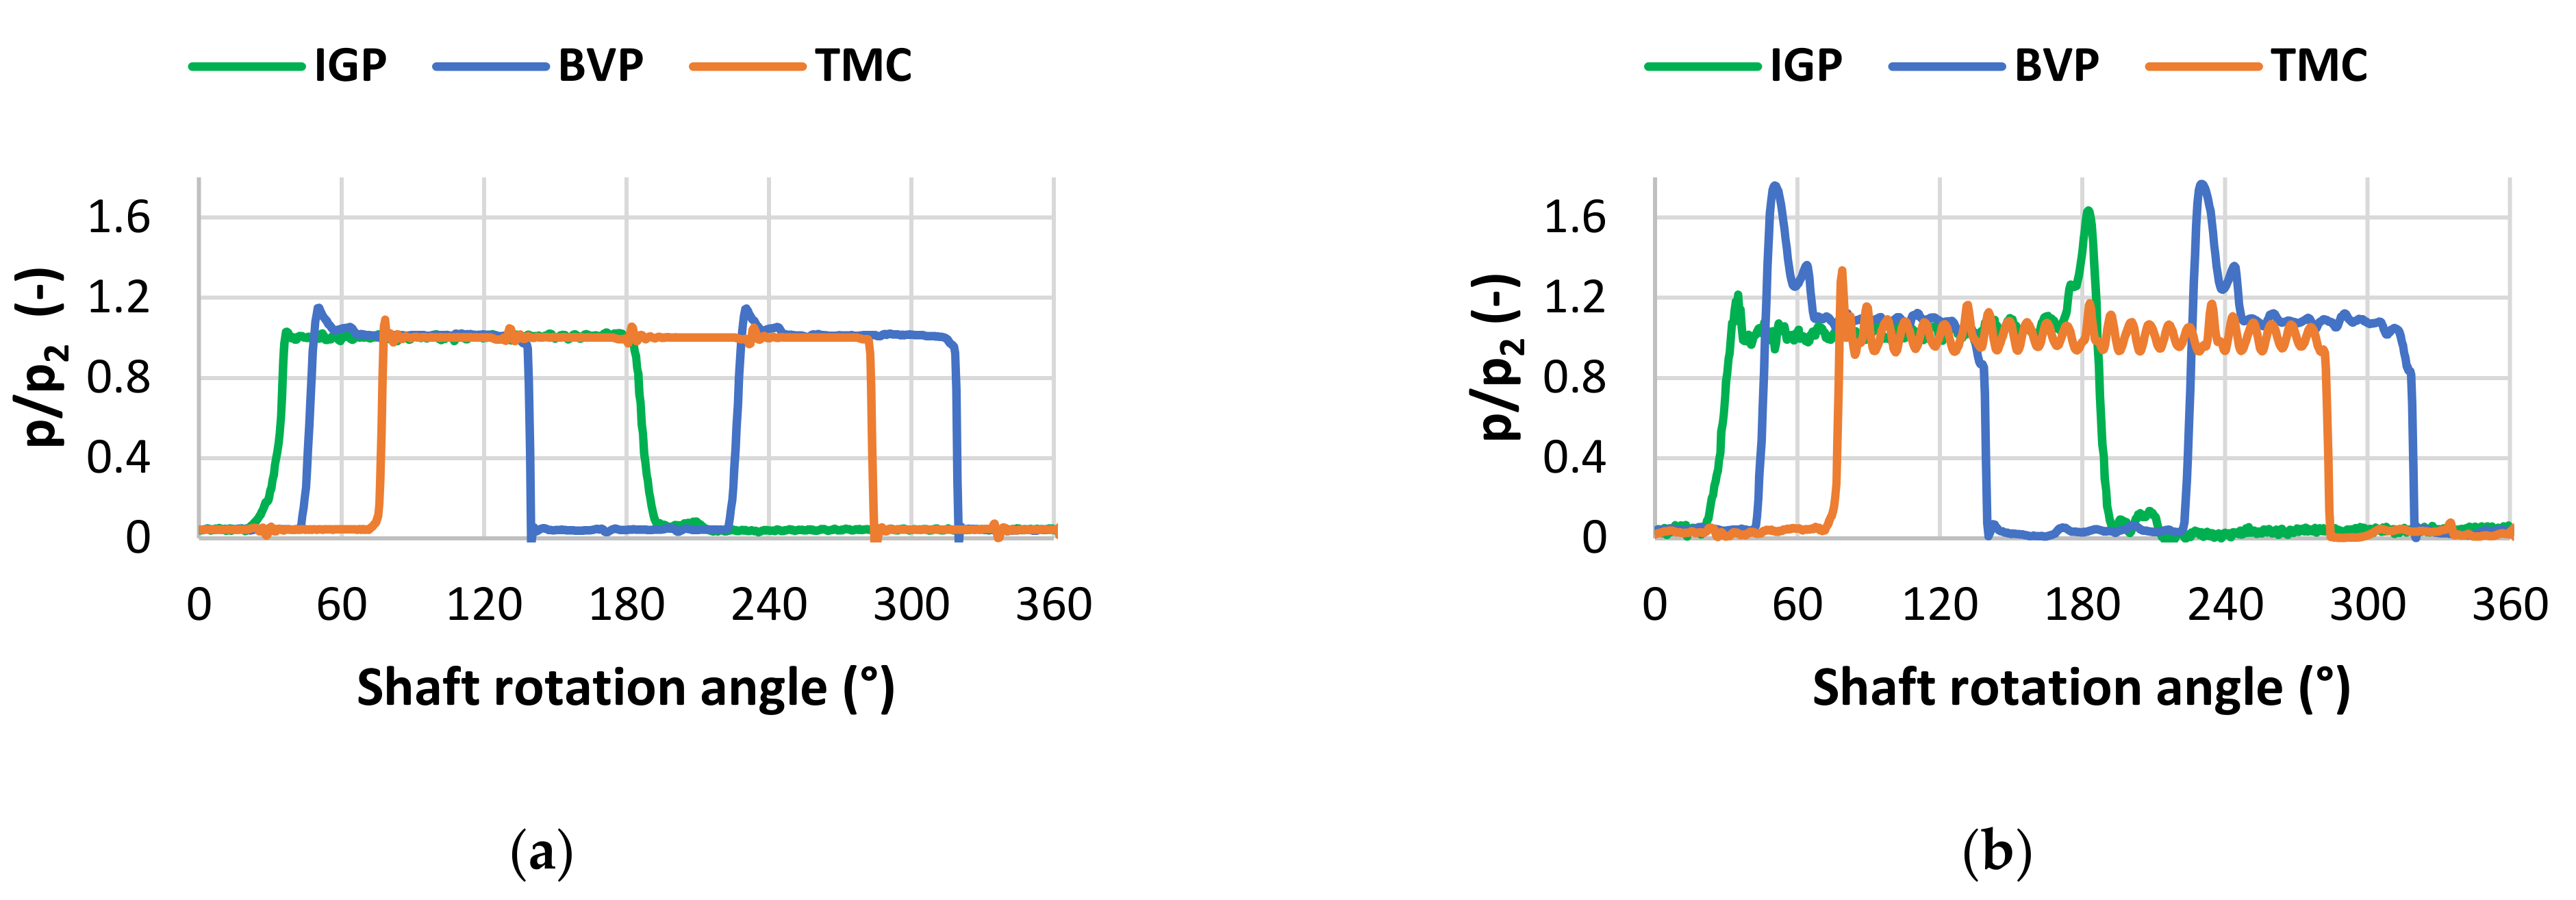
Figure 18, the pressure profiles gained by the CFD simulations for all three pumps are compared to each other at two different operating points. It has to be noted that for the BVP and the IGP, the shaft rotation angle equals the rotor rotation angle. For the TMC pump, because of the slanting plate, this is not the case. Within one shaft rotation of 360° the rotor undergoes a rotation of 51.42° around the tilted axis. However, to compare the pumps, in the following, all instantaneous displacement chamber profiles are plotted over the shaft rotation angle.
The first obvious difference between all three pumps is that the BVP undergoes two delivery pressure plateaus within one shaft revolution. Furthermore, it is obvious that the pressure surge, when the displacement chamber connects to the delivery port, has the highest values for the BVP. Increasing the rotational speed increases the pressure surge height further. For the IGP, a pressure surge occurring when the displacement chamber disconnects from the delivery port seems to be especially distinctive, while both other pumps do not really show a pressure surge at that point. This can be quite well observed in Figure 18b and is due to the fact that the displacement chambers are still decreasing in volume when they disconnect from the pressure port. Furthermore, the pressure ripple while the displacement chamber is connected to the delivery port shows the highest amplitudes for the TMC pump in Figure 18b.
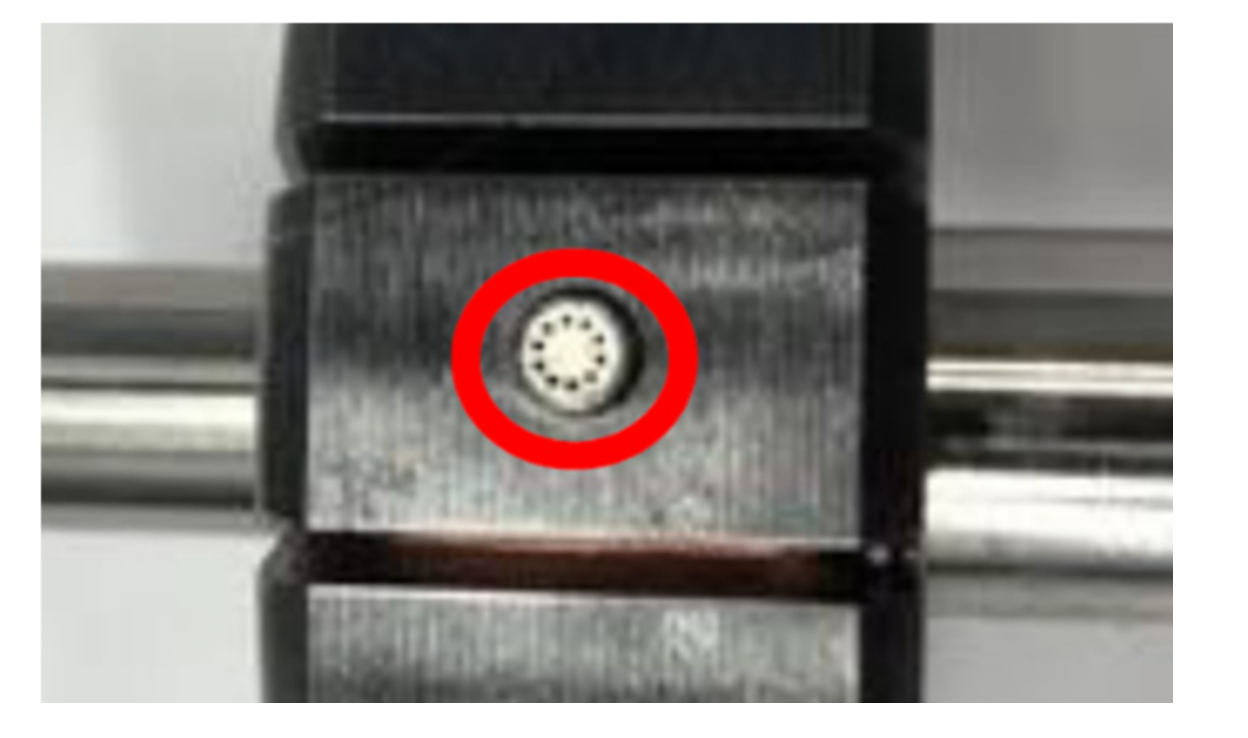
To validate the CFD model, test bench measurements are conducted with a pressure transducer placed in the rotor wall of the BVP, recording the instantaneous pressure profile (see Section 4). In 
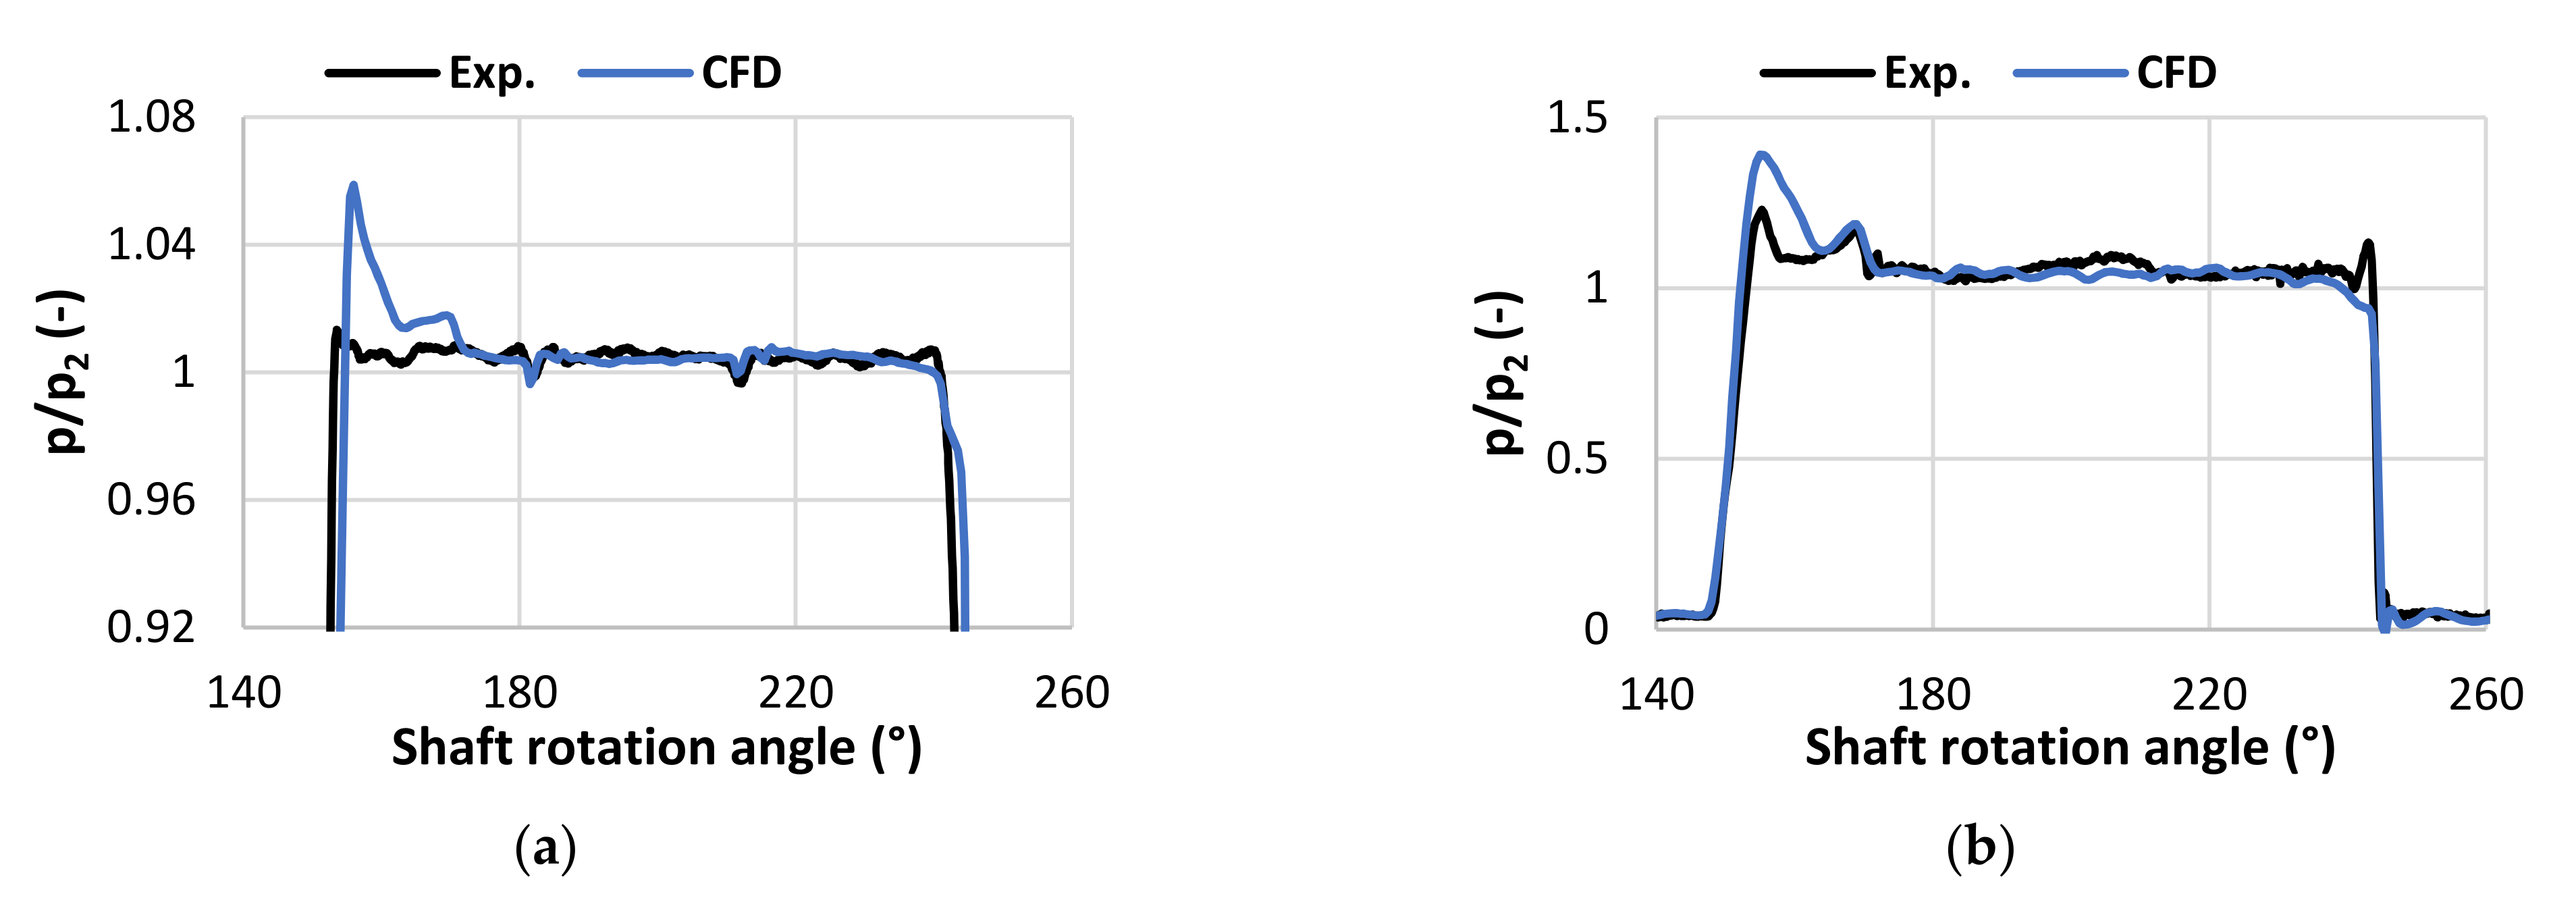
Figure 19, both CFD and experimental data are compared at two different operating points.
It is clearly visible that the CFD simulations overpredict the pressure surge appearing when the displacement chamber connects to the delivery port. This is, on the one hand, due to numerical reasons and a high sensitivity regarding the meshing of the radial gap area and has also been observed by the authors in [27] for CFD simulations with the solver STAR-CCM+. On the other hand, in the CFD simulations, the radial gap height is kept constant. In reality, the vanes can radially recede when the force balance is disturbed, and therefore, the pressure surge may be damped, while the vanes slide a bit back into the rotor. Because of these reasons, it is quite challenging to accurately predict this pressure surge in the simulations. Apart from that pressure surge, the pressure profiles obtained numerically fit quite well to the experimental data. In Figure 19a, it can be seen that especially the two minor pressure drops at 181 and 211° on the delivery port plateau are very well captured. Those pressure drops result from the two following displacement chambers connecting to the delivery port [27]. The thereby occurring pressure surges are also visible in the observed displacement chamber, as the pressure waves travel through radial and axial gaps between displacement chambers.
As the noise emission of pumps is an important aspect, in the following, the pressure ripple at the delivery port is analyzed, as it is described in Section 3.4. In Figure 20, the 30° periodicity in the pressure signal of the BVP can be easily related to the 12 vanes. In the signal of the IGP, a 24° periodicity can be obtained, which here relates to the 15 teeth of the pinion. For the TMC pump, the seven gear teeth in the stator lead to a periodicity of 51.42° in the time signal of the pressure ripple.
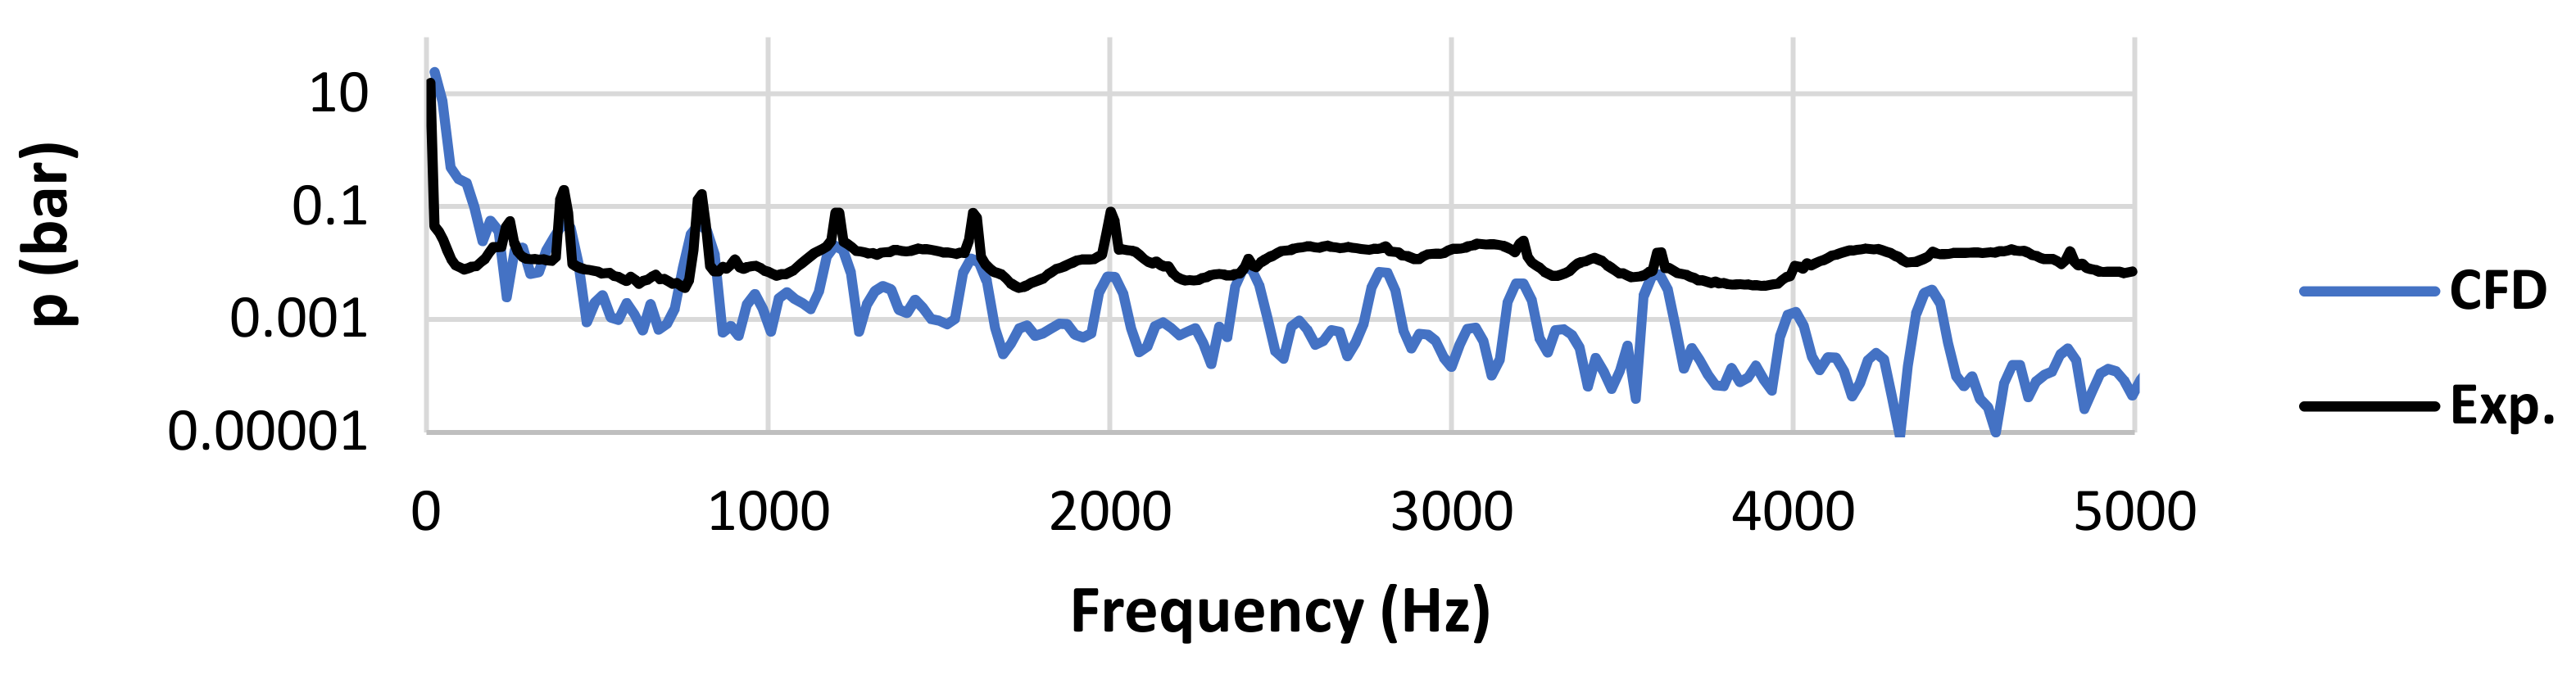
From the CFD simulations for this operating point follows the conclusion that the pressure ripple of the TMC pump seems to be significantly higher in amplitude compared to the BVP and the IGP. However, when comparing the pressure ripple obtained from the CFD simulations to the test bench measurement for the BVP in a FFT analysis frequency wise, Figure 21 shows a deviation of both curves over the whole frequency range. Although the first few blade passing frequencies are correctly captured, the pressure ripple amplitudes are underpredicted by the CFD simulation. This shortcoming may be due to the negligence of the dynamic vane movement of the BVP in the simulation model.
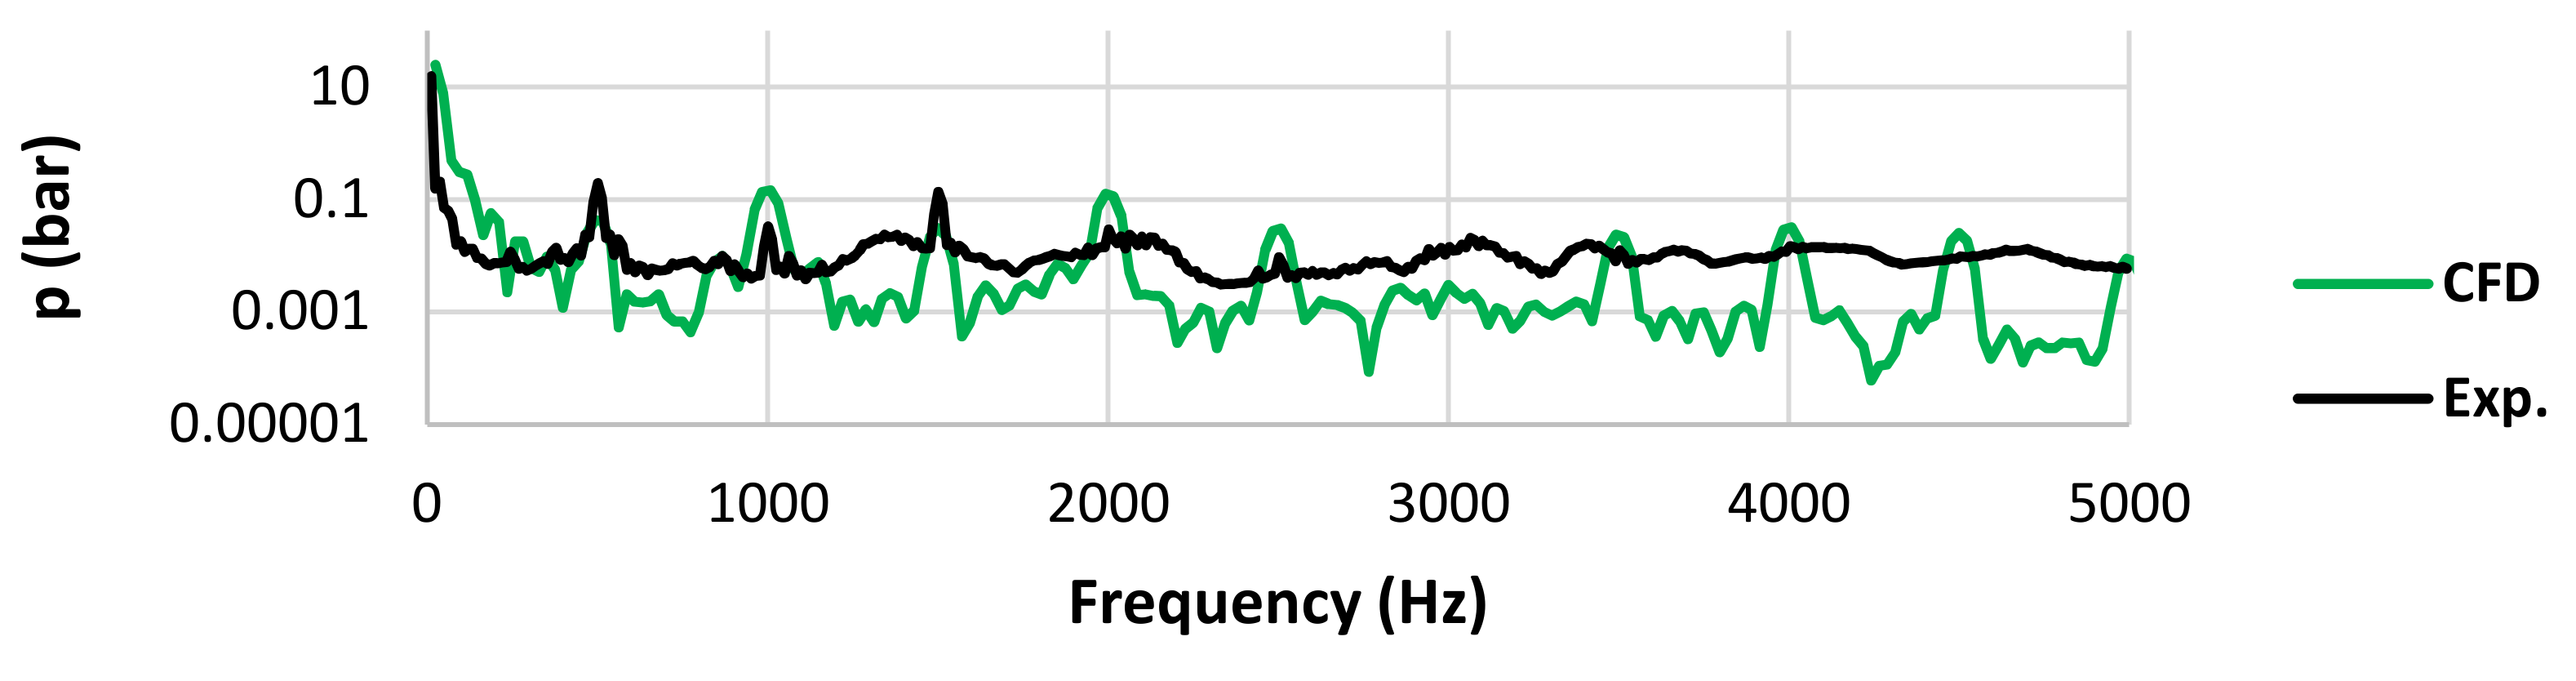
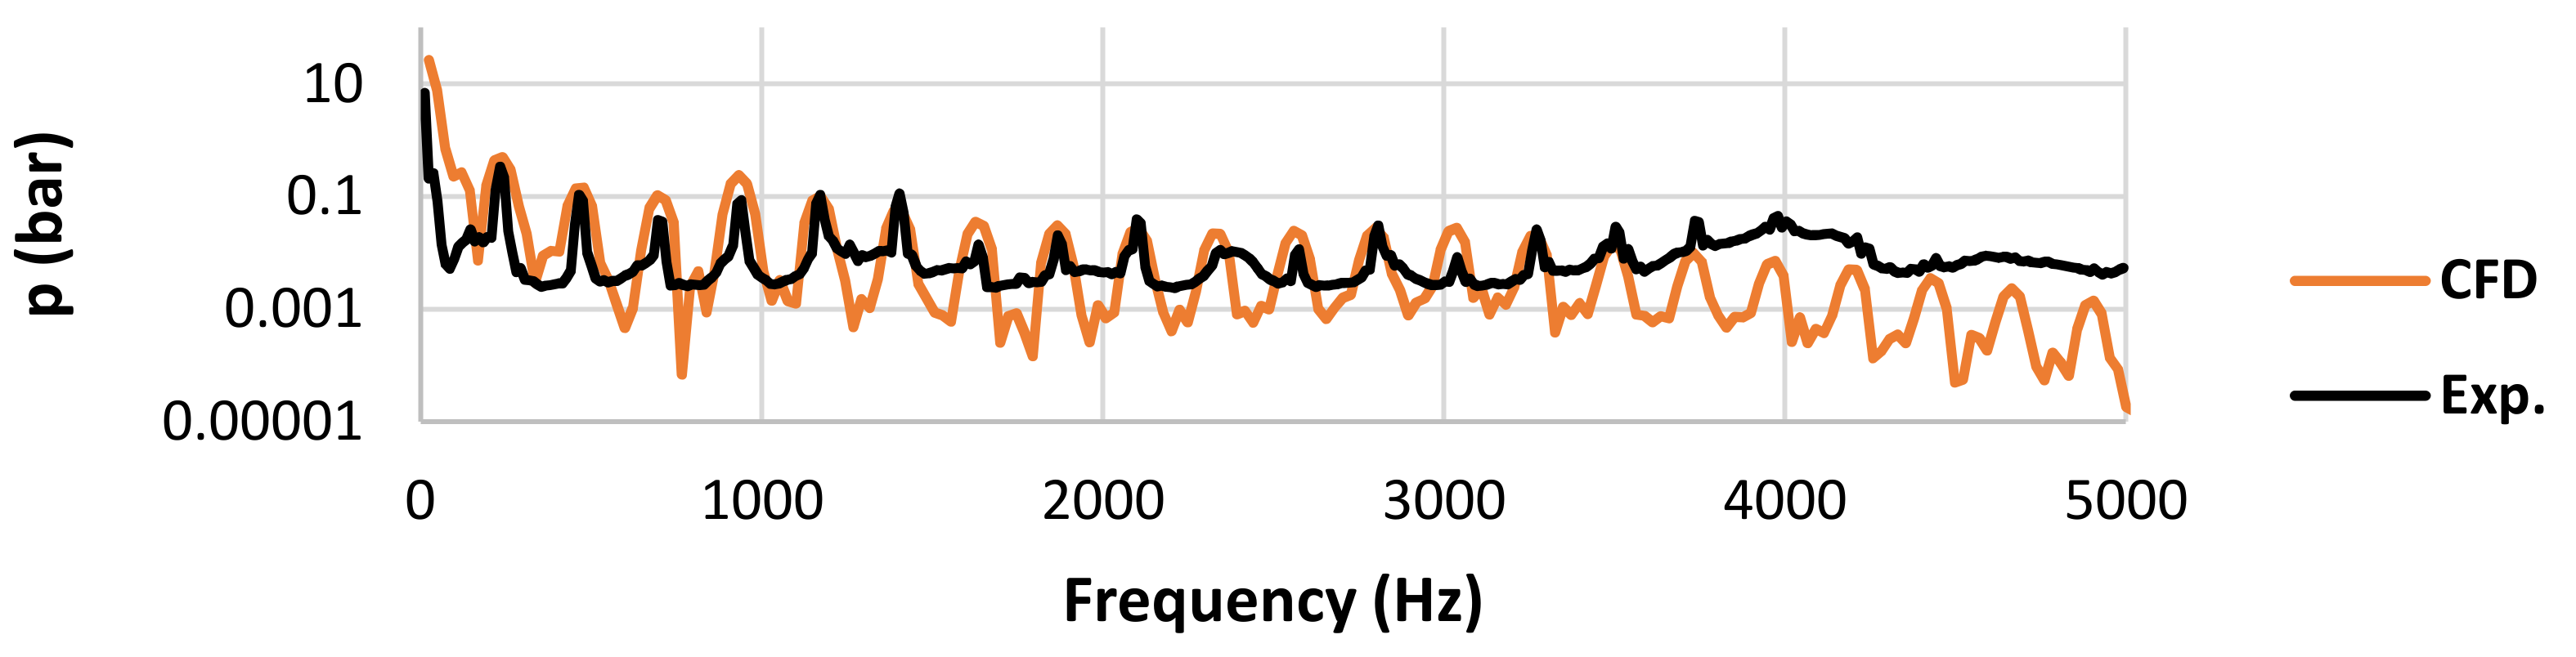
For both the IGP and the TMC pump, the deviation between CFD data and experimentally obtained data is smaller than for the BVP, which can be seen in Figure 22 and Figure 23. Both the blade passing frequencies and the amplitudes of the pressure ripple are reasonably captured in the low- and mid-frequency range. At higher frequencies, however, an increasing deviation can be observed for all pumps. Fluid structure interactions as well as additional vibrations in the test bench setup emerging from the driving engine and being transferred through the hydraulic circuit into the fluid, which are not incorporated in the CFD simulations, could be a reason for this.

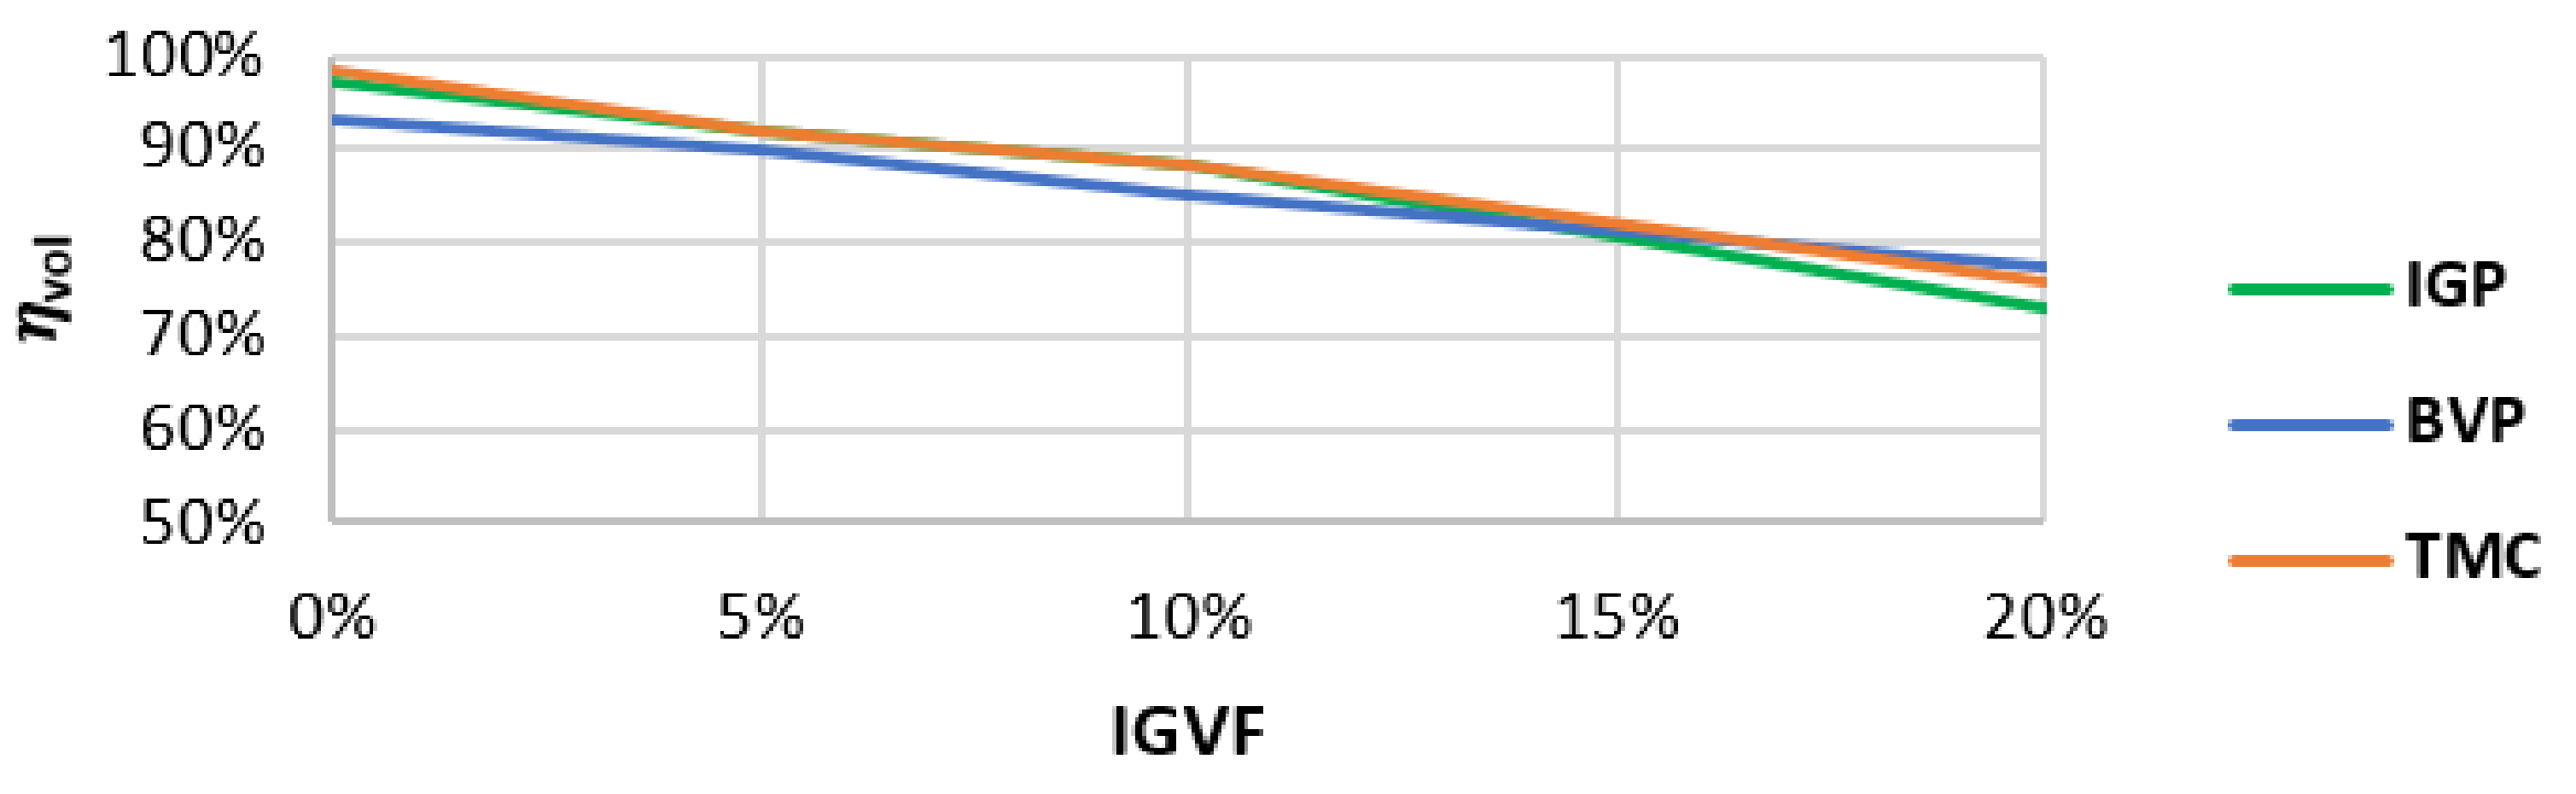
5.2. Setup Free Air (IGVF > 0)

When positive displacement pumps convey a multiphase flow with a nearly incompressible phase of oil and a strongly compressible phase of air, the volumetric efficiency decreases to a value below η v o l < 1 I G V F as the IGVF of air increases. The CFD setup 2 (IGVF of free air, see Table 2) is capable of predicting this drop for all three investigated pumps. The respective curves are displayed in Figure 24.
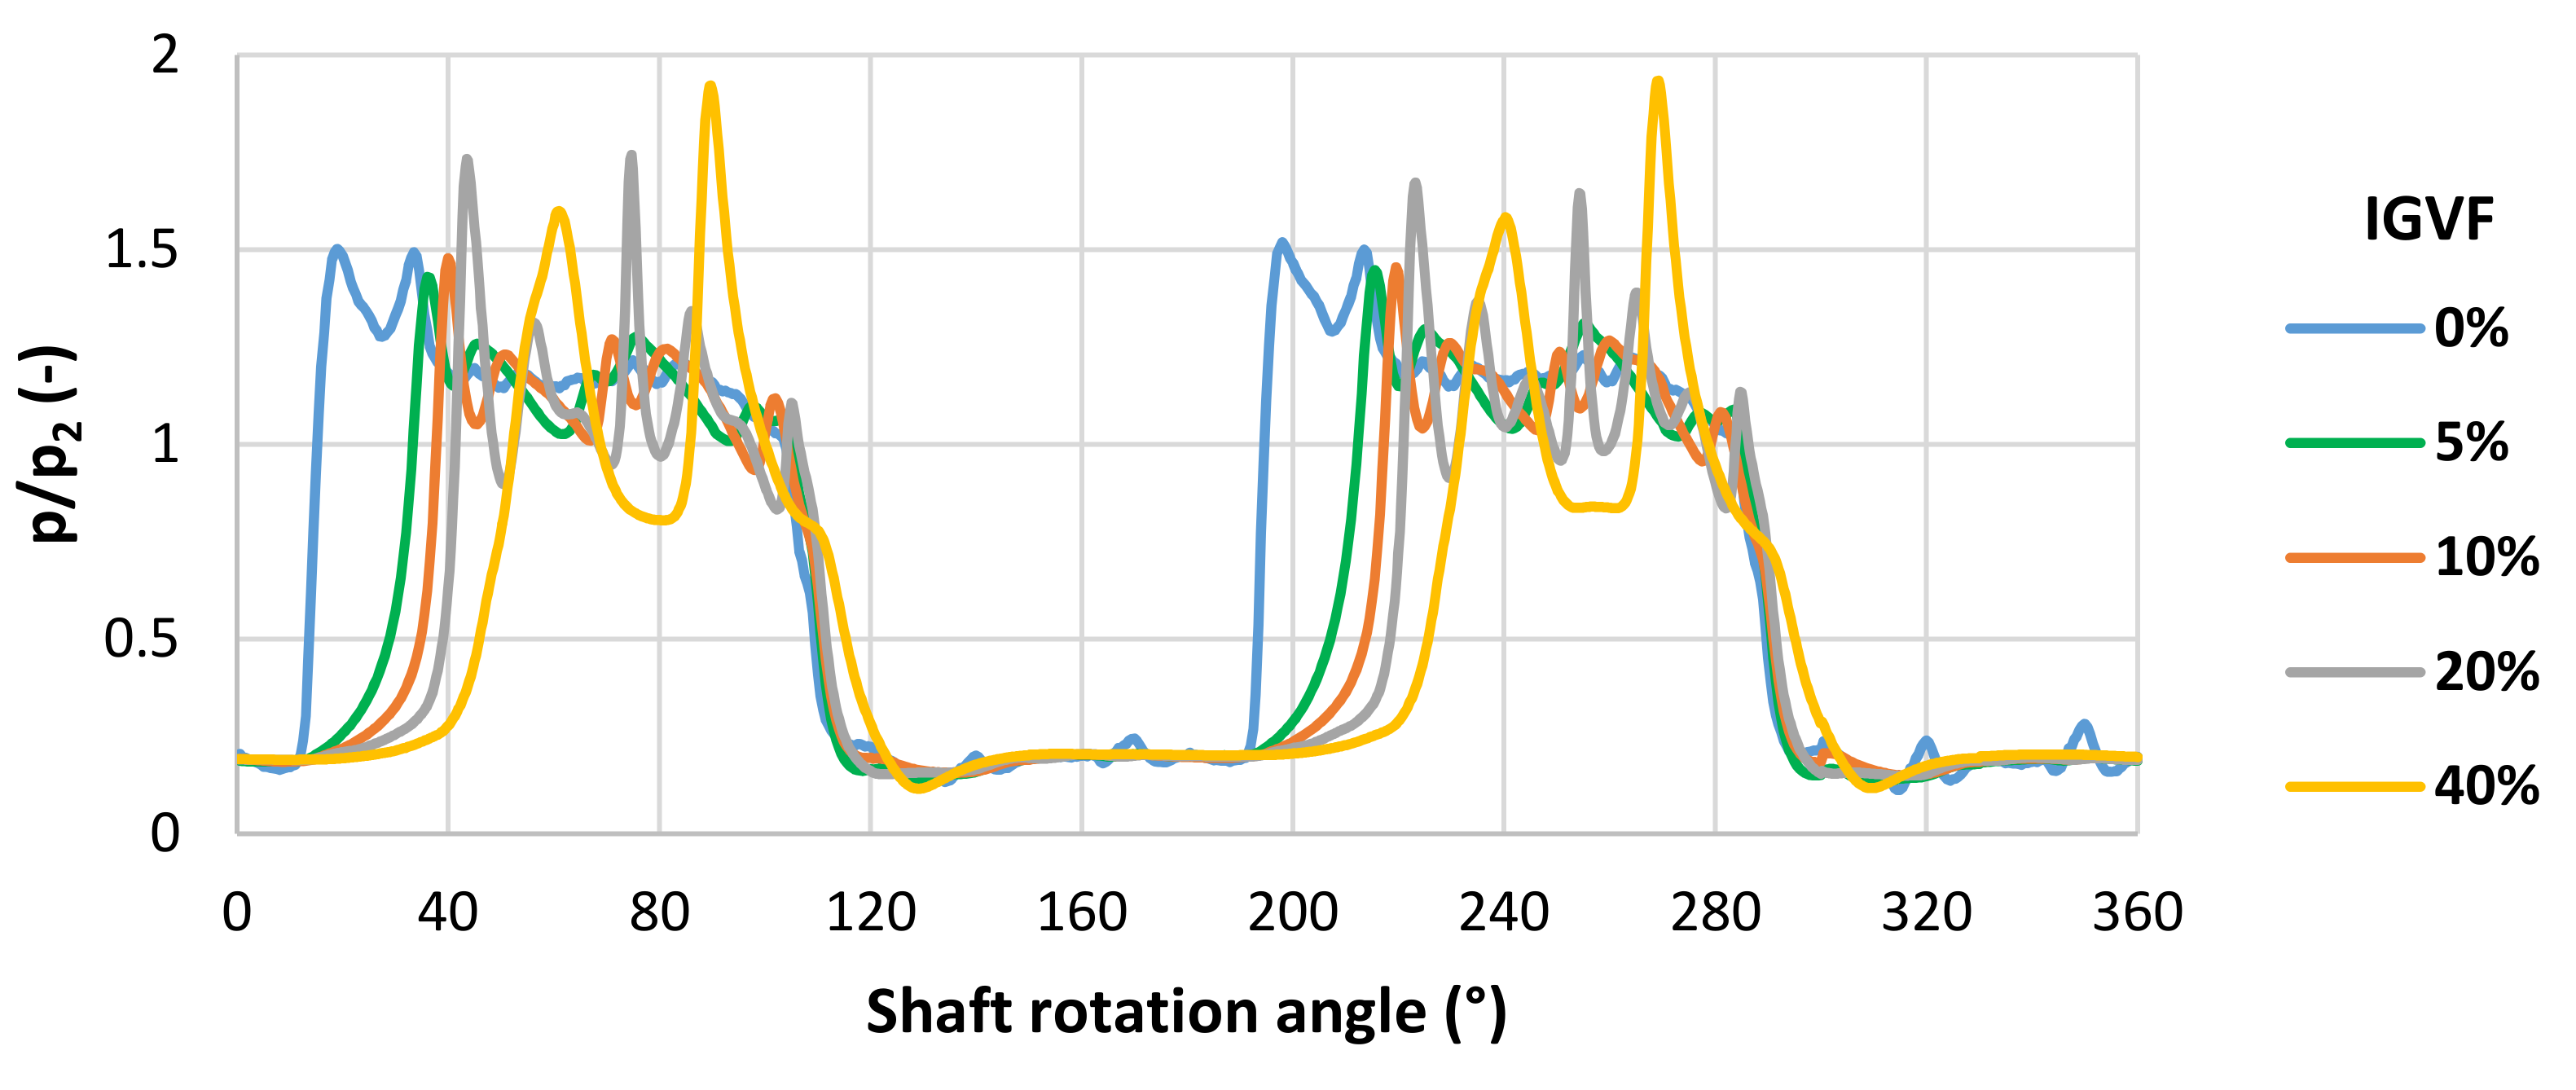
Besides the volumetric efficiency, the displacement chamber pressure profiles also change significantly when an IGVF > 0 is introduced. This was observed by the authors in [20] for a simplified 2D model of a BVP. In Figure 25, the influence of increasing the IGVF on the pressure profiles is shown for the BVP. With increasing IGVF, two effects occur. On the one hand, the pressure rise is delayed to higher shaft rotation angles with an increasing IGVF. The displacement chambers need more volume decline to achieve a pressure rise in the highly compressible mixture of oil and air than they need in pure oil. For the BVP, the pressure rise is delayed by 24.75° when the IGVF is at 10% compared to the pure oil with an IGVF = 0.
On the other hand, the pressure ripple while the displacement chamber is connected to the delivery port also increases with increasing IGVF. The increase in the amplitudes of the pressure ripple while the chamber is connected to the delivery port is especially strong in the BVP, as it can be seen in Figure 25 when comparing it to the other two pumps in Figure 26 and Figure 27.
The height of the pressure surge, when the displacement chamber is connected to the delivery port seems not to be much affected by introducing an IGVF. In the 2D investigations of the authors in [20], increasing the IGVF damped this pressure surge significantly. However, due to the missing third dimension, in the 2D case, this pressure surge is much higher, reaching values of p p 2 16 with pure oil. In the currently investigated 3D case of the BVP, this pressure surge is due to the grooves that are generally much smaller with values of p p 2 < 3 . Because of that, an increase in the IGVF does not lead to a significant reduction in this first pressure surge.
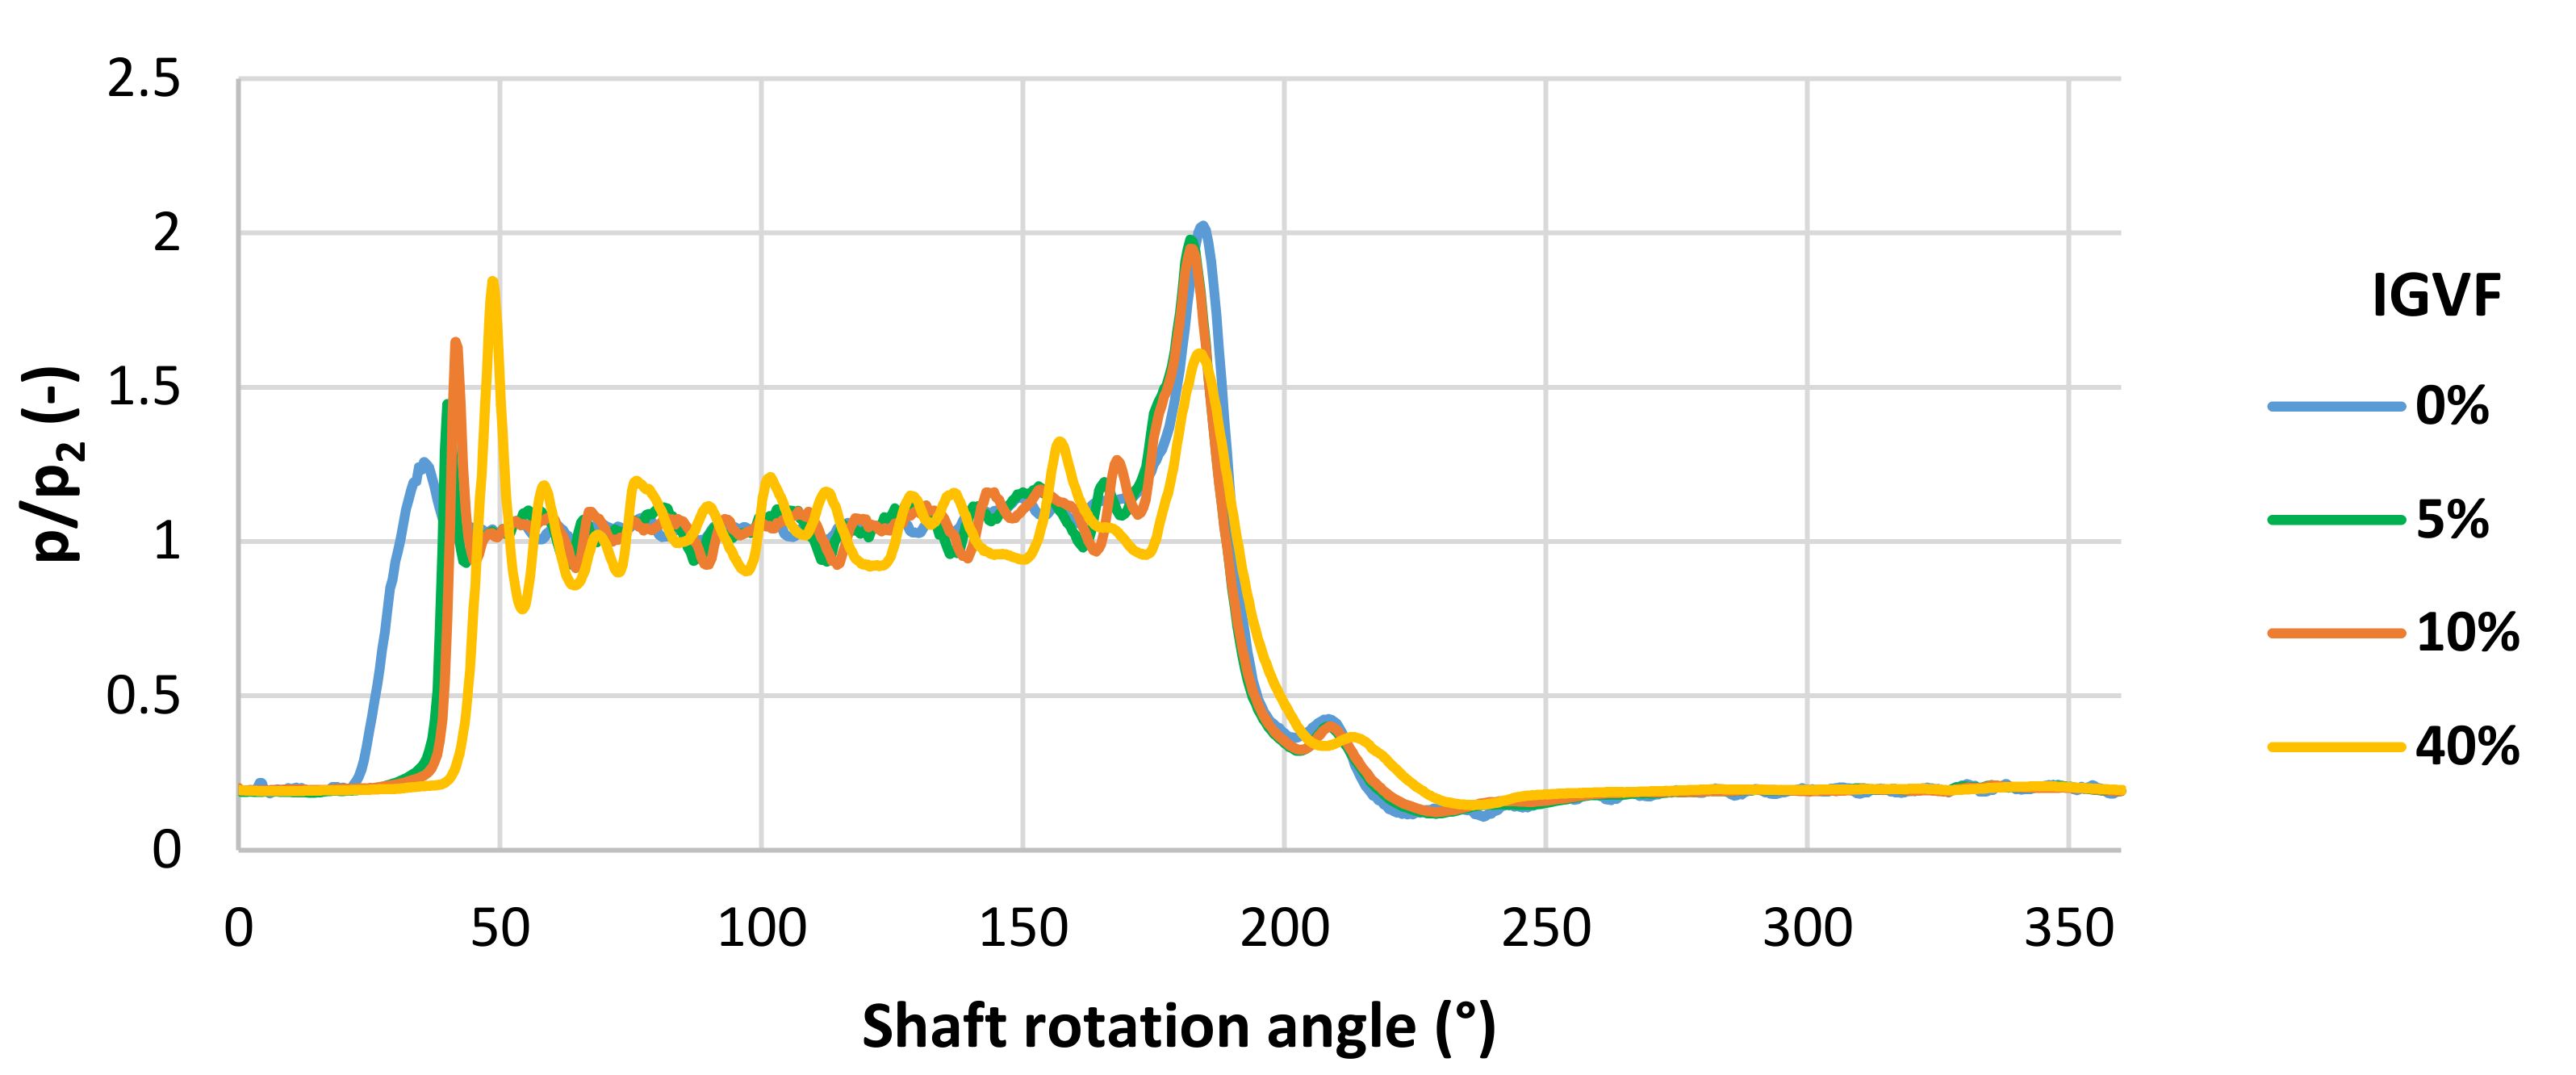
Looking at the pressure profiles for the IGP in Figure 26, an increase in the IGVF does not decrease the height of the pressure surge when the displacement chamber connects to the delivery port but even increases it. With pure oil, this pressure surge in the IGP is lower than in the BVP, which means that the pump has a superior design with optimized control times at this operating point. A high pressure surge is, therefore, prevented with pure oil. The increased compressibility with free air, however, leads because of the specific and optimized control times and the compression ratio to a higher pressure difference when the displacement chamber connects to the delivery port. Thus, the pressure surge is intensified with an increasing IGVF. Contrary to that effect, the appearing pressure surge when the delivery port is disconnected is reduced with an increasing IGVF. Analog to the BVP, the pressure ripple while the displacement chamber is connected to the delivery port increases while increasing the IGVF. However, the amplitudes of the pressure ripple on the delivery port plateau are much smaller in the IGP compared to the BVP. The delay of the pressure rise with increasing IGVF can likewise be observed in the IGP. The pressure rise is delayed by 15° when the IGVF is at 10% compared to the pure oil with an IGVF = 0.
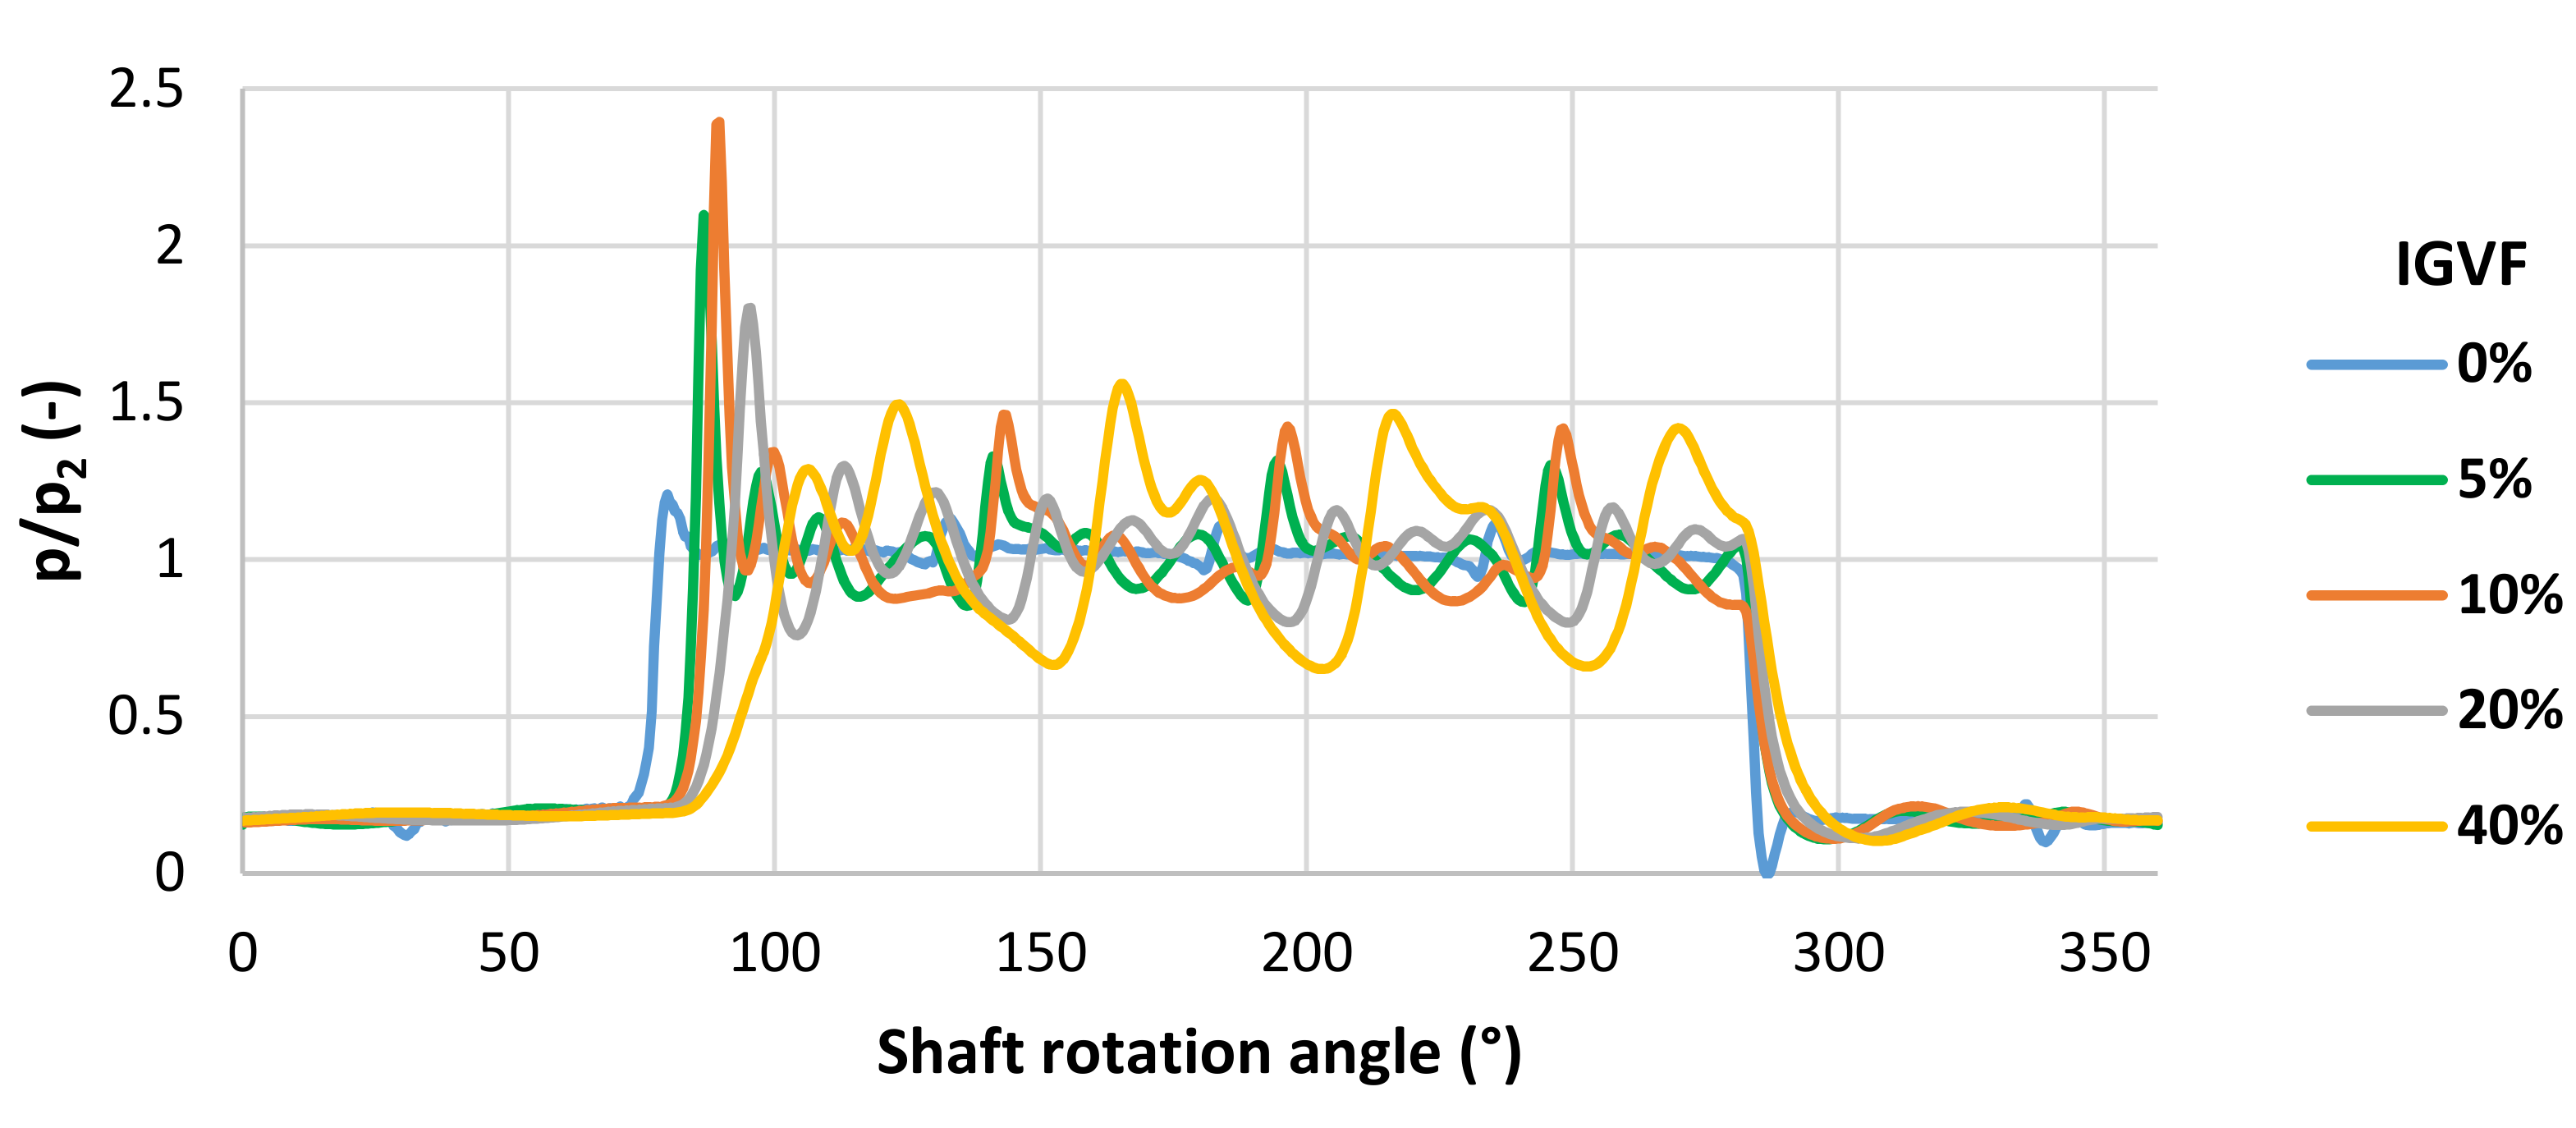
For the TMC pump, the same tendencies can be observed in Figure 27. The first pressure surge is intensified by increasing the IGVF up to 10%, but then declines when the IGVF is further increased to 20 and 40%. In addition, this first pressure surge reaches values of p p 2 > 2 for 5 and 10% IGVF, which is higher than at both other pumps.
The same trend as in the other pumps applies to the amplitudes of the pressure ripple on the delivery port plateau. However, after intensifying the amplitudes of the pressure ripple up to an IGVF of 10%, a further increase up to 20% seams to lead to a decline analog to the pressure surge. At 40% IGVF, however, an intensification can be seen in Figure 27 quite well again, and the pressure ripple amplitudes are the highest.
The delay of the pressure rise when an IGVF of 10% is applied compared to 0% is only 8.4° for the TMC pump. This appears to be due to the lower compression ratio of the displacement chambers compared to the other pumps (see Table 1). The rotor channels, which are always connected to the displacement chambers forming between stator and rotor gear teeth, are an additional volume, which decreases the effective compression ratio. Therefore, the delay of the pressure rise with an IGVF of 10% is significantly smaller for the TMC pump than for the other pumps.
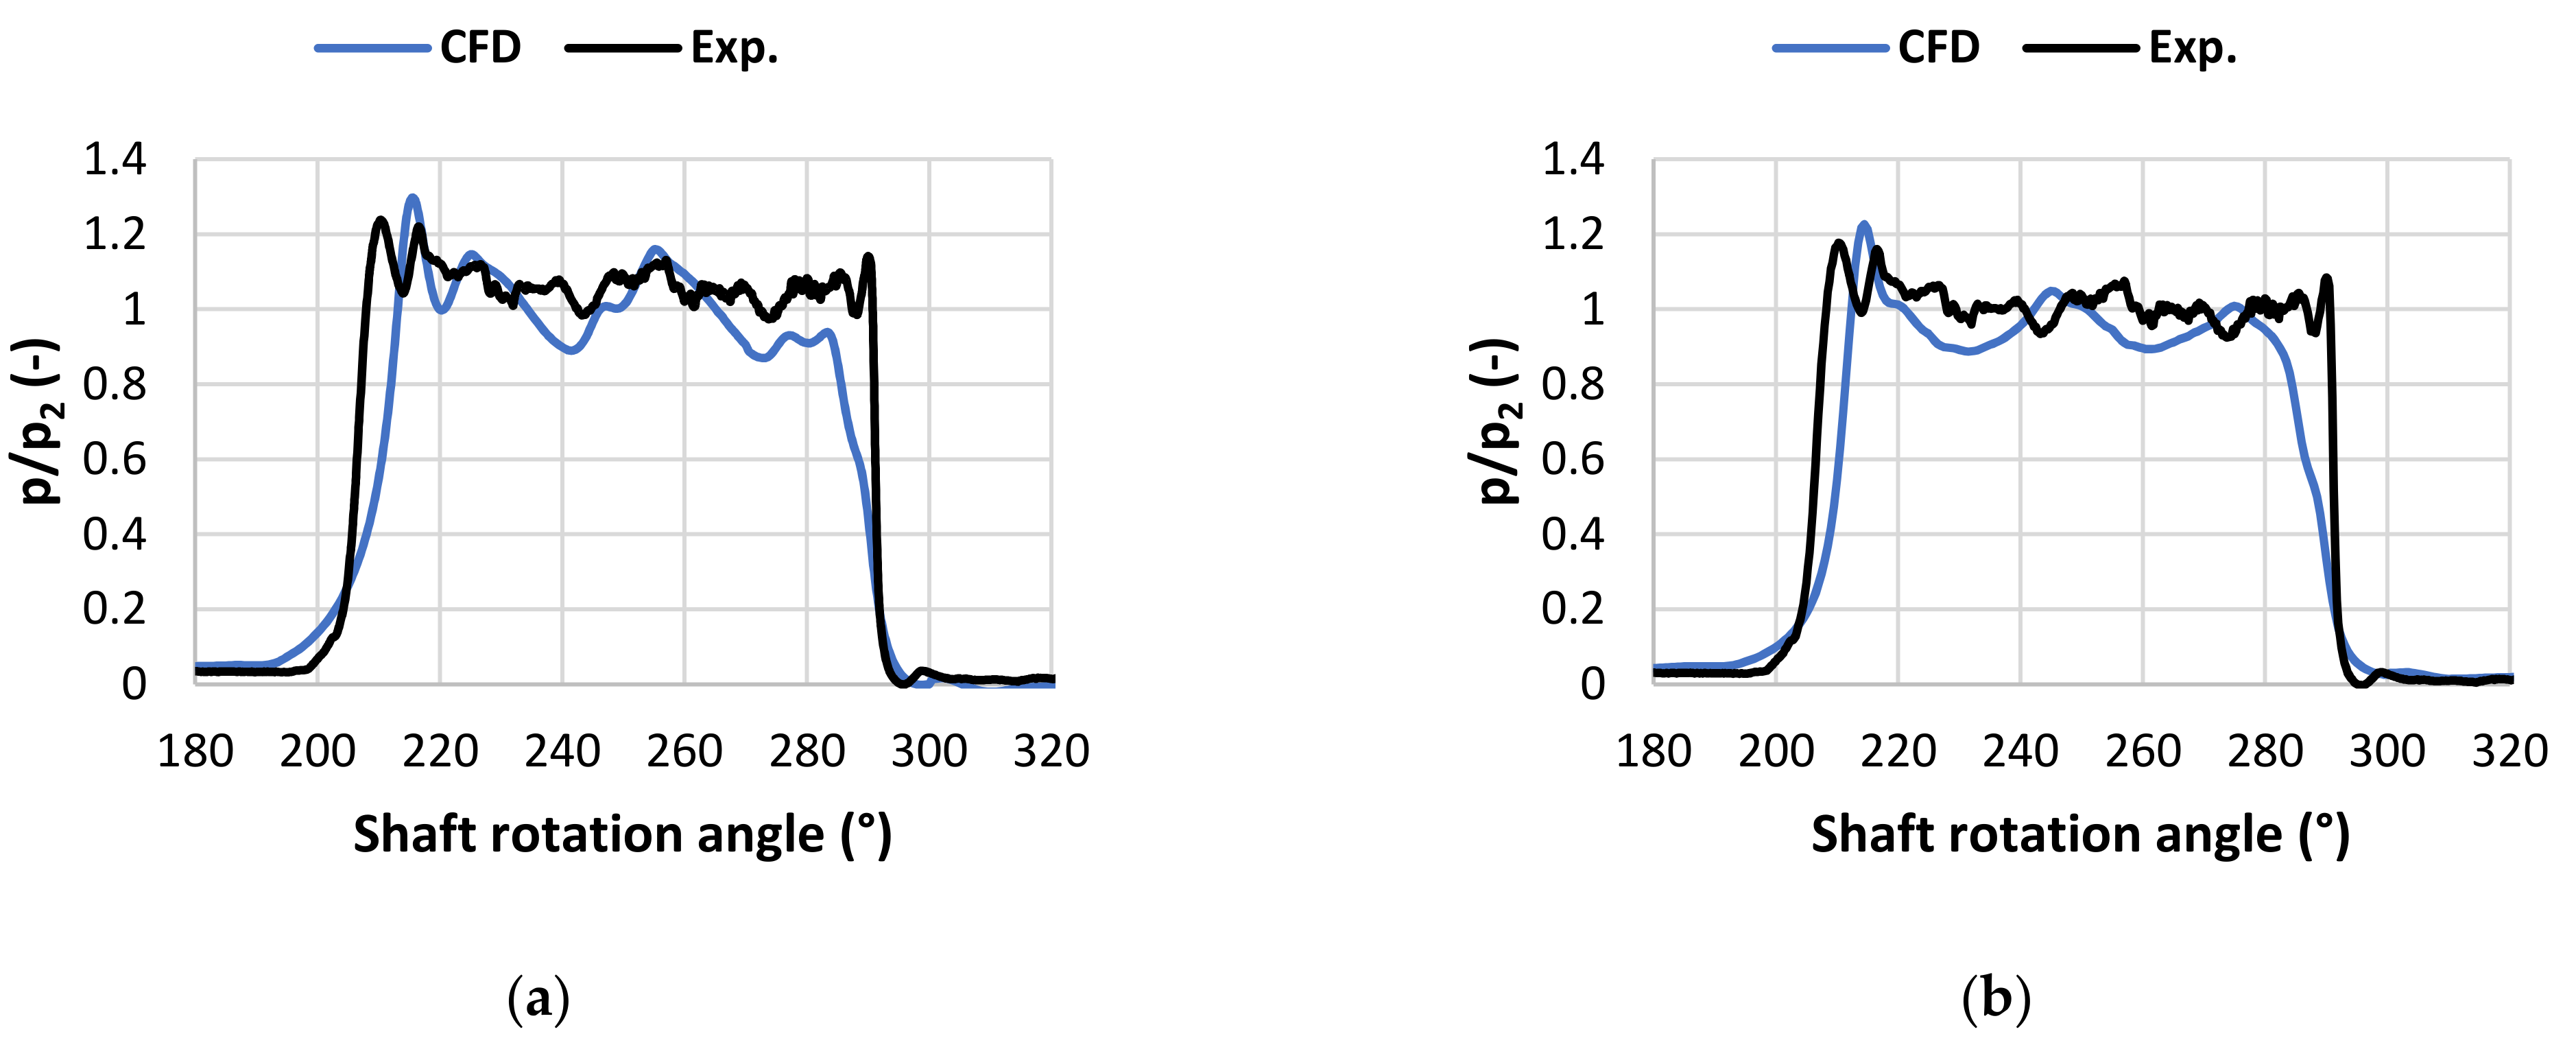
To validate the second CFD setup, experimental data for the displacement chamber pressure in the BVP are compared with data obtained from CFD simulations. Both profiles are plotted in Figure 28a,b for two different operating points. Due to limitations of the test bench measurement, it is not possible to record the displacement chamber pressure profile for an IGVF > 5%.
Both analyzed operating points show a reasonable fit of the CFD data to the experimentally obtained pressure profiles. The CFD data, however, show an earlier and slower pressure rise than in the experiment. This seems to be because the radial and axial gaps of the CFD model have to be enlarged to 30 µm for the simulations with an IGVF > 0 in order to obtain convergence. The real dimensions of the axial and radial gaps, which are used for the simulations with the CFD setup cavitation, are one order of magnitude smaller, as it is described in Section 3. Because of these artificially enlarged gaps, leakages through them are higher, and therefore, the pressure rise begins earlier and has a lower gradient as well as the pressure drop after the chamber disconnects from the delivery port begins earlier and is smoother.
The increased pressure ripple on the delivery port plateau is quite well captured by the CFD simulations, although it is a bit overpredicted. However, there are many assumptions in the multiphase flow modelling setup used in this work. This also applies to the experimental test setup. Although a precise measurement of the IGVF of air is possible by the CGS system, as described in Section 4, no information regarding the phase morphology of the disperse air phase is available. For the CFD simulations, however, a mean air bubble diameter of 0.1 mm is assumed. Bearing in mind those limitations of the numerical as well as of the experimental analysis, it can be stated that the fit of the displacement chamber pressure profile for the BVP is quite reasonable.
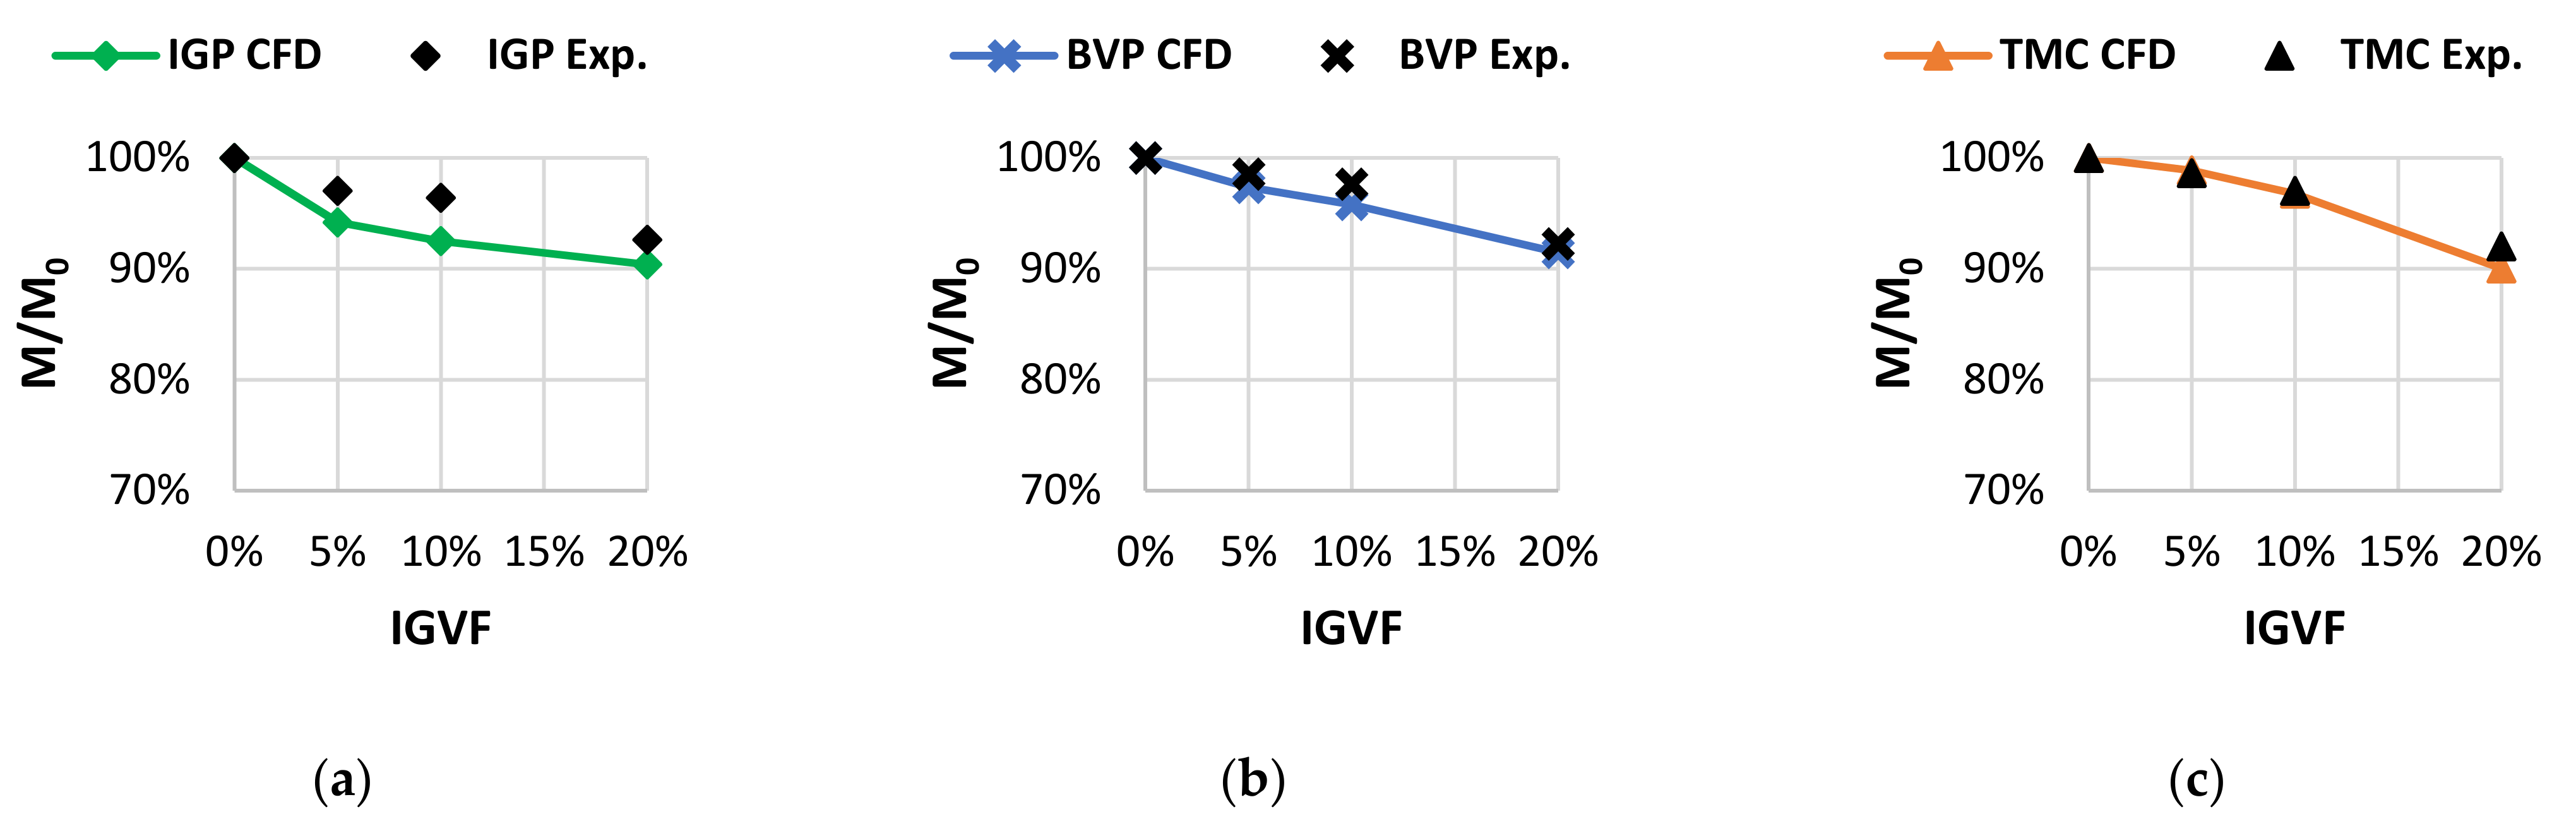
Another finding of the authors in [20] is that with an increasing IGVF, the required power demand of the 2D pump decreases. As it could be seen in this chapter, the increasing compressibility of the mixture with increasing IGVF leads to a significant delay of the pressure rise in the displacement chamber. The time fraction, when delivery pressure is present in the chamber within one rotation, therefore, is reduced (see Figure 25, Figure 26, Figure 27). This leads subsequently to a reduction in the mean required driving torque. This phenomenon is observed for all three investigated pumps. The required time-averaged driving torque M for an IGVF > 0 is compared to the required driving torque for pure oil M 0 and displayed in Figure 29. Besides the CFD results, data from the test bench measurements are also displayed.
The numerical results fit quite well to the experimental data for the BVP as well as for the TMC pump. For the IGP, the deviation is a bit higher, but the CFD simulations correctly predict the tendency of the driving torque drop, which can be seen in the experimental data.
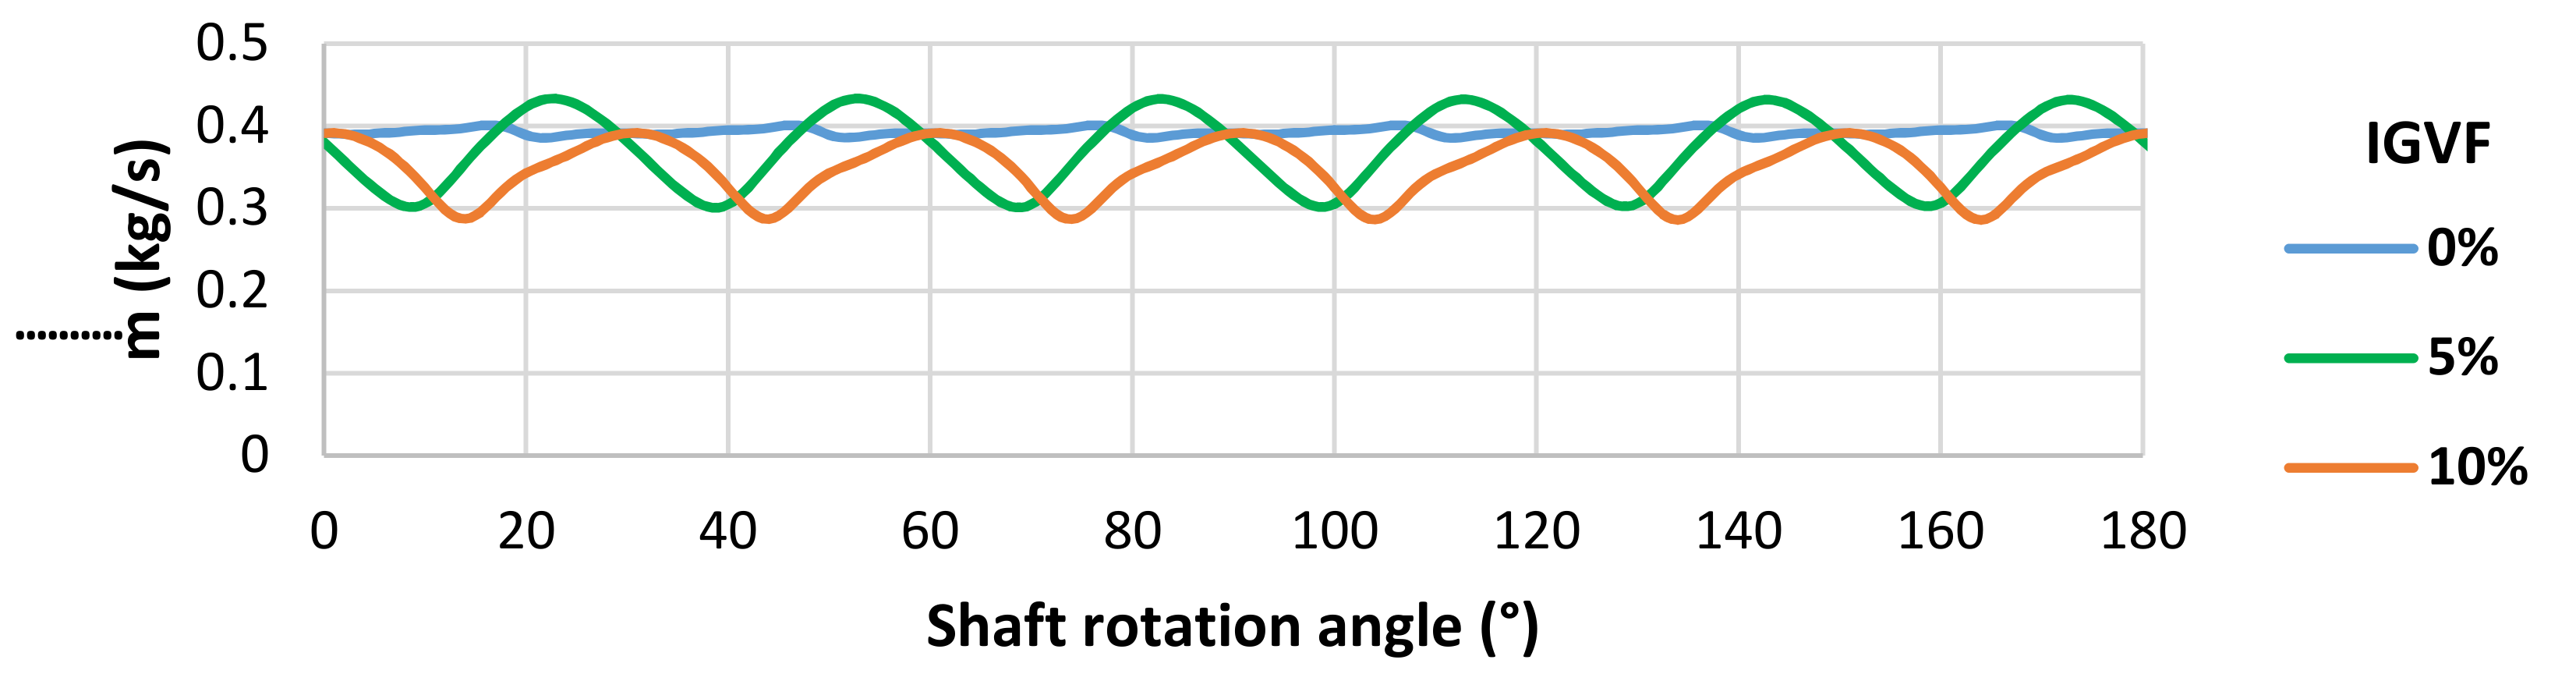
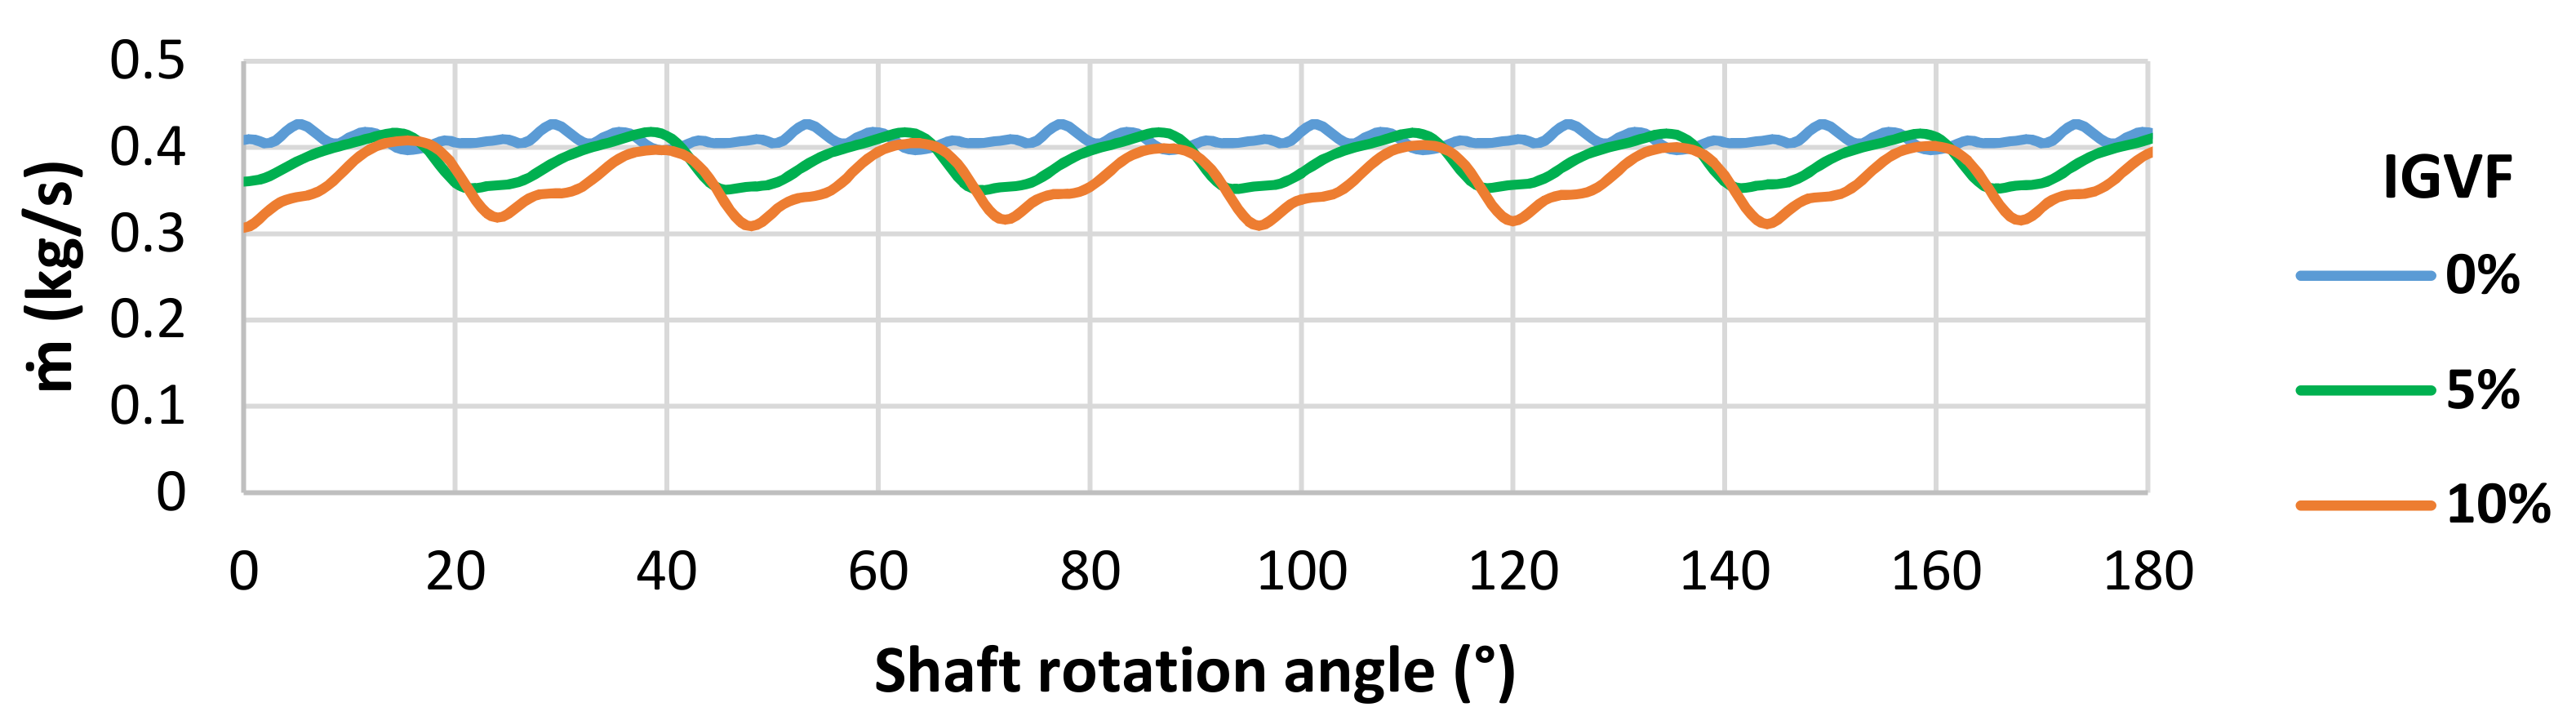
Besides the ripple in the displacement chamber pressure profile, the mass flow ripple at the delivery port outlet is another important aspect when analyzing multiphase flow pumping characteristics of a pump.
By increasing the IGVF, analog to the amplitude increase in the pressure ripple in the displacement chambers, the mass flow ripple at the delivery port outlet also increases. This can be observed in Figure 30 and Figure 31 for the BVP and the IGP, respectively. It seems that the increase in the mass flow ripple amplitudes in the BVP is a bit higher than it is in the IGP. This could be due to the difference in compression ratio. The BVP has a slightly lower compression ratio than the IGP (see Table 1). Of course, the time-averaged mass flow decreases when the IGVF rises. This is due to the falling mixture density of the fluid.
Compared to both other pump types, the outlet mass flow ripple increase when the IGVF is raised is significantly stronger in the TMC pump. This can be clearly seen in Figure 32. At 10% IGVF, there are shaft rotation angles where the mass flow is nearly at a value of zero. A further increase in the IGVF > 10% then leads to the occurrence of intermittent backflow of the oil–air mixture. An explanation for this phenomenon could be again the much lower compression ratio of the TMC pump compared to the IGP and the BVP. Because of that lower compression ratio, the mixture in the displacement chamber does not reach as high pressure levels before the chamber is connected to the delivery port and subsequently impinged with the delivery port pressure, as it does in both other pumps with higher compression ratios. Therefore, the pressure differences at that point in time are much higher in the TMC pump. This could also be observed in Figure 25, Figure 26, Figure 27 where the TMC pump showed the highest pressure surges with IGVF > 0 when the displacement chamber connects to the delivery port. Subsequently, a stronger backflow of the mixture from the delivery port into the displacement chamber while the fluid is pushed out can be expected. This results in a higher mass flow and pressure ripple. In the BVP and the IGP, the higher compression ratios lead to lower pressure differences when the displacement chambers connect to the delivery port. Consequently, lower pressure ripple and mass flow ripple at the outlet can be observed. Nevertheless, there is the potential to enhance the design of the TMC pump to achieve a higher compression ratio comparable to the other two pumps. This needs to be further investigated.

6. Conclusions

A numerical study to compare three different positive displacement pumps regarding the application in future automatic transmission system was presented in this paper.
In a first simulation setup, the characteristics of the pumps operating with pure oil and incorporating vapor cavitation were analyzed. Validating the numerical results regarding the volumetric efficiency with experimentally obtained data from the test bench, both the IGP and the BVP showed a reasonable match. A distinctively higher deviation between numerical and experimental results could be observed for the TMC pump, as the CFD results overpredicted the volumetric efficiency. As the TMC pump has additional and more complex leakage paths compared to the IGP and the BVP, the obtained volumetric efficiencies from the CFD simulations are very sensitive regarding the assumptions for the different leakage gap dimensions. For further validation, the instantaneous displacement chamber pressure profiles were experimentally recorded in the BVP and compared to the numerical data. A generally reasonable fit of the pressure profiles could be achieved. Besides the displacement chamber pressure, the outlet pressure ripple signals were compared with experimentally recorded data frequency wise and showed a reasonable fit for the IGP and the TMC pump. The deviation for the BVP was a bit higher. Here, the omitted dynamic motion of the vanes in the CFD model could be an explanation for this shortcoming. Generally, comparing outlet pressure ripples is challenging, as the test bench measurement data include fluid–structure interactions and vibrations from the driving engine, which are transmitted through the hydraulic circuit into the fluid.
In a second simulation setup, the operational characteristics of the pumps with an IGVF of free air in the oil were investigated and compared. Validation was performed by comparing the experimentally obtained displacement chamber pressure profiles for the BVP with the numerically obtained ones. Although there are many assumptions in the numerical models for the dispersed oil–air multiphase flow such as the mean bubble diameter as well as limitations in the experimental measurements, the data show a reasonable fit. Besides the displacement chamber pressure profiles, the drop of required driving torque and volumetric efficiency with increasing IGVF could also be predicted with a reasonable fit to the experimental data.
With both applied CFD setups, it was possible to compare the three pumps regarding the application in a future automatic transmission system for vehicles. For the operation without free air, the IGP showed the latest cavitation onset due to high flow cross sections and lower pressure losses in the suction port. Comparing the calculated volumetric efficiency of the three investigated pump types, the CFD data showed no significant difference at the most commonly used rotational speeds from 1000 to 3500 rpm. From the experimental data, however, it could be clearly observed that the TMC pump has a lower volumetric efficiency than both other pumps. Looking at the displacement chamber profiles of the three pumps, it became clear that the pressure ripple is highest for the TMC pump. This was also visible in the outlet pressure ripple signal in the delivery port, where the TMC pump showed the highest amplitudes as well.
Regarding the operation with an IGVF of free air, all three pumps showed the same phenomena in the displacement chamber pressure profiles when the IGVF was raised. The degree of these effects, however, varied for the different pumps. The BVP and the TMC showed a greater amplification of the pressure ripple on the delivery port plateau with rising IGVF than the IGP. Furthermore, the TMC pump showed the highest intensification of the pressure surge when the displacement chamber was connected to the delivery port. This was also the case for the outlet mass flow ripple. The TMC pump showed much higher amplitudes and at an IGVF > 10%, even intermittent backflow was observed. Both the IGP and the BVP showed a superior characteristic with a much smaller intensification of the mass flow ripple. The disadvantage of the TMC pump compared to the BVP and the IGP appeared to be due to the difference in compression ratio. Whereas the BVP and the IGP feature a compression ratio of 9.15 and 11.93, respectively, the TMC due to its design with rotor channels has a much lower compression ratio of 3.67. This fact leads to an inferior performance regarding mass flow and pressure ripple with an IGVF > 0.
Summarizing all numerical and experimental results, all three pumps showed a potential for future applications in automatic transmission systems. However, the BVP and the IGP showed the best performance both with and without free air in the transmission oil. The volumetric efficiencies were for both pumps on a high level. The BVP, furthermore, features a slightly more compact design, as it is a double stroke pump. The TMC pump showed inferior volumetric efficiencies and the earliest cavitation onset of all three pumps. Comparing the delivery port outlet pressure ripple, the TMC pump likewise showed an inferior performance with higher amplitudes than both other pump types for the cases with and without free air. This subsequently also leads to an inferior acoustic characteristic of the pump. Due to the lower compression ratio of the TMC pump, a higher outlet mass flow ripple could also be observed with free air. A further optimization of the TMC pump is necessary to achieve a similar performance such as the other two pumps in the investigated operating points. Adding grooves for pressure ripple reduction and increasing the compression ratio by adjusting the rotor design could be two possible measures to attain this goal. However, the promising potential of the TMC pump is the possibility to mold its parts from polymer materials, which can lead to lower total manufacturing costs.

Author Contributions

Conceptualization, T.L.; formal analysis, T.L.; investigation, T.L.; methodology, T.L.; project administration, T.L.; supervision, H.S. and G.B.; visualization, T.L.; writing—original draft, T.L.; writing—review and editing, T.L., T.H., H.S. and G.B. All authors have read and agreed to the published version of the manuscript.

Funding

This research received no external funding.

Institutional Review Board Statement

Not applicable.

Informed Consent Statement

Not applicable.

Data Availability Statement

The data presented in this study are available on request from the corresponding author.

Acknowledgments

Marian Kacmar is acknowledged for assistance with the TMC pump design and the procurements of the test samples, as well as for assistance with the test bench measurements. Furthermore, Stephan Beitler and his team from the ITR at the TU Clausthal are acknowledged for their great support at the test bench with all measurements. Artur Bohr from Eckerle Technologies is acknowledged for providing the internal gear pump test samples and for assistance with interpreting measurement data.

Conflicts of Interest

The authors declare no conflict of interest.

Nomenclature

CCourant number(-)
F v a p Vaporization calibration constant(-)
F c o n d Condensation calibration constant(-)
MTorque(Nm)
M 0 Torque at IGVF=0(Nm)
nRotational speed(L/min)
pPressure(Pa)
p 2 Mean pressure at the delivery port(Pa)
Q l e a k a g e Leakage volumetric flow rate(L/min)
Q a c t u a l Actual volumetric flow rate(L/min)
Q t h e o Theoretical volume flow rate(L/min)
rRadial coordinate(m)
V d i s p l Theoretical displacement volume(L)
V c o r e Volume enclosing main internal pump parts(L)
y + Dimensionless wall distance(-)
x, y, zCartesian coordinates(m)

Greek Letters

α a i r Inlet gas volume fraction of free air(-)
η v o l Volumetric efficiency(-)
θSpherical coordinate(rad)
φSpherical coordinate(rad)
ωAngular velocity(rad/s)

Abbreviations

0DZero-dimensional
1DOne-dimensional
2DTwo-dimensional
3DThree-dimensional
ATTorque converter automatic transmission
BCBoundary condition
BVPBalanced vane pump
CFDComputational fluid dynamics
CVTContinuous variable transmission
DCTDual clutch transmission
ExpExperiment
FFTFast Fourier transform
ICEInternal combustion engine
IGPInternal gear pump
IGVFInlet gas volume fraction
PDPPositive displacement pump
RANSReynolds-averaged Navier–Stokes
revRevolution
RPMRounds per minute (L/min)
SSTShear stress transport
TMCTumbling multi-chamber pump

References

  1. Xu, X.; Dong, P.; Liu, Y.; Hui, Z. Progress in Automotive Transmission Technology. Automot. Innov. 2018, 1, 87–210. [Google Scholar] [CrossRef] [Green Version]
  2. Naunheimer, H.; Fietkau, P.; Lechner, G. Automotive Transmissions: Fundamentals, Selection, Design, and Application, 2nd ed.; Springer: New York, NY, USA, 2011. [Google Scholar]
  3. Ahlawat, R.; Lee, B.; Fathy, H.K.; Stei, J.L.; Jung, D.; Guo, C. Effect of pump selection on fuel economy in a dual clutch transmission vehicle. In Proceedings of the 2009 American Control Conference, St. Louis, MO, USA, 10–12 June 2009; pp. 1371–1378. [Google Scholar]
  4. Höfer, A.; Herbel, M.; Schierle, D.; Peschkow, W.; Hamon, P. eAxle development and optimization regarding NVH, efficiency and power density. In 20. Internationales Stuttgarter Symposium; Springer: Berlin/Heidelberg, Germany, 2020; pp. 185–196. [Google Scholar]
  5. Güth, D.; Haupt, J.; Gassmann, T. Seamless-Shift Two-Speed eAxle with Torque Vectoring. VDI-Ber. 2018, 2328, 255–268. [Google Scholar]
  6. Ivantysyn, J.; Ivantysynova, M. Hydrostatische Pumpen und Motoren, 1st ed.; Vogel Verlag: Wuerzburg, Germany, 1993; pp. 358–361. [Google Scholar]
  7. Van der Sluis, F. A new pump for CVT applications. SAE Tech. Pap. 2003, 2003-01-3207.
  8. Battarra, M.; Blum, A.; Mucchi, E. Kinematics of a balanced vane pump with circular tip vanes. Mech. Mach. Theory 2019, 137, 355–373. [Google Scholar] [CrossRef]
  9. Battarra, M.; Mucchi, E. On the relation between vane geometry and theoretical flow ripple in balanced vane pumps. Mech. Mach. Theory 2020, 146, 103736. [Google Scholar] [CrossRef]
  10. Lu, Y.; Zhang, W.; Zhao, Y.-Y.; Wang, Z.-Z.; Shu, P.-C. Studies on several key problems of water hydraulic vane pump. Ind. Lubr. Tribol. 2011, 63, 134–141. [Google Scholar] [CrossRef]
  11. Fornarelli, F.; Lippolis, A.; Oresta, P.; Posa, A. Investigation of a pressure compensated vane pump. Energy Procedia 2018, 148, 194–201. [Google Scholar] [CrossRef]
  12. Truong, B.N.; Quang Truong, D.; Thanh Trung, N.; Kwan, A.K. Mathematical modeling of a variable displacement vane pump for engine lubrication. Int. Conf. Control Autom. Syst. 2015, 15, 1946–1951. [Google Scholar]
  13. Bianchi, G.; Fatigati, F.; Murgia, S.; Cipollone, R. Design and analysis of a sliding vane pump for waste heat to power conversion systems using organic fluids. Appl. Eng. 2017, 124, 1038–1048. [Google Scholar] [CrossRef]
  14. Neyrat, S.; Orand, N.; Jonquet, D. Modeling and Analysis of an Automatic Transmission Internal Gear Oil Pump with Cavitation. SAE Tech. Pap. 2005, 2005-01-2448.
  15. Zhao, X.; Vacca, A. Theoretical Investigation into the Ripple Source of External Gear Pumps. Energies 2019, 12, 535. [Google Scholar] [CrossRef] [Green Version]
  16. Munih, J.; Hočevar, M.; Petrič, K.; Dular, M. Development of CFD-based procedure for 3d gear pump analysis. Eng. Appl. Comput. Fluid Mech. 2020, 14, 1023–1034. [Google Scholar] [CrossRef]
  17. Rundo, M.; Altare, G.; Casoli, P. Simulation of the Filling Capability in Vane Pumps. Energies 2019, 10, 283. [Google Scholar] [CrossRef] [Green Version]
  18. Iannetti, A.; Stickland, M.T.; Dempster, W.M. A CFD and experimental study on cavitation in positive displacement pumps: Benefits and drawbacks of the ‘full’ cavitation model. Eng. Appl. Comput. Fluid Mech. 2016, 10, 57–71. [Google Scholar] [CrossRef] [Green Version]
  19. Patil, A. Performance Evaluation and CFD Simulation of Multiphase Twin-Screw Pumps. Ph.D. Thesis, Texas A & M University, College Station, TX, USA, 2013. [Google Scholar]
  20. Lobsinger, T.; Hieronymus, T.; Brenner, G. A CFD Investigation of a 2D Balanced Vane Pump Focusing on Leakage Flows and Multiphase Flow Characteristics. Energies 2020, 13, 3314. [Google Scholar] [CrossRef]
  21. Will, D.; Gebhardt, N. Hydraulik: Grundlagen, Komponenten, Systeme, 6th ed.; Springer: Berlin/Heidelberg, Germany, 2014; pp. 132–134. [Google Scholar]
  22. Giuffrida, A.; Lanzafame, R. Cam shape and flow rate in balanced vane pumps. Mech. Mach. Theory 2005, 40, 353–369. [Google Scholar] [CrossRef]
  23. Inaguma, Y. Theoretical Analysis of Mechanical Efficiency in Vane Pump. JTEKT Eng. J. 2010, 1007E, 28–35. [Google Scholar]
  24. Zouani, A.; Dziubinschi, G.; Marri, V. Optimal Vanes Spacing for Improved NVH Performance of Variable Displacement Oil Pumps. SAE Tech. Pap. 2017; 2017-01-1062. [Google Scholar]
  25. Hesse, J.; Spille-Kohoff, A.; Hauser, J.; Schulze-Beckinghausen, P. Structured meshes and reliable CFD simulations: TwinMesh for positive displacement machines. VDI-Ber. 2014, 2228, 297–308. [Google Scholar]
  26. Suzuki, K.; Nakamura, Y.; Yakabe, S.; Watanabe, H.; Nakamura, K. Characteristics Prediction of Vane Pump by CFD Analysis. KYB Tech. Rev. Technol. 2016, 53, 8–15. [Google Scholar]
  27. Hieronymus, T.; Lobsinger, T.; Brenner, G. Investigation of the Internal Displacement Chamber Pressure of a Rotary Vane Pump. Energies 2020, 13, 3341. [Google Scholar] [CrossRef]
Figure 1. Inner parts of the BVP (a) and the IGP without a crescent (b).
Energies 14 02501 g001
Figure 2. Rotor (a), stator (b) and hollow shaft (c) of the TMC pump.
Energies 14 02501 g002
Figure 3. Sectional view through the TMC pump.
Energies 14 02501 g003
Figure 4. Mesh of the displacement chambers (a) and details of the radial gap mesh (b) of the BVP.
Energies 14 02501 g004
Figure 5. Full CFD model with BCs (a) and meshing details of the axial gaps and grooves (b) of the BVP.
Energies 14 02501 g005
Figure 6. Mesh of the displacement chambers (a) and meshing details of the radial gaps (b) of the IGP.
Energies 14 02501 g006
Figure 7. Full CFD model with BCs (a) and meshing details of the axial gap and the delivery port groove (b) of the IGP.
Energies 14 02501 g007
Figure 8. Mesh of the displacement chambers (a) and meshing details of the gap between the gear teeth (b) of the TMC pump.
Energies 14 02501 g008
Figure 9. Meshing details of the inner and outer spherical gap (a) and of the rotor–shaft gap as well as of the rotor channels (b) of the TMC pump.
Energies 14 02501 g009
Figure 10. Full CFD model with BCs (a) and meshing details of the fluid volumes in the hollow shaft (b) of the TMC pump.
Energies 14 02501 g010
Figure 11. Tubular extension of the computational domain at the delivery port to investigate the outlet pressure ripple of the pumps in the CFD simulations.
Energies 14 02501 g011
Figure 12. Hydraulic scheme of the test bench.
Energies 14 02501 g012
Figure 13. Pressure transducer glued into the rotor of the BVP to record the instantaneous pressure profile in a displacement chamber.
Energies 14 02501 g013
Figure 14. Comparison of the CFD data for the conveying characteristics (a) and the volumetric efficiencies (b) at 22.5 bar pressure load and 20 °C oil temperature.
Energies 14 02501 g014
Figure 15. Volumetric efficiencies obtained from the CFD simulations and from the experiment for the IGP at 22.5 bar pressure load and 20 °C oil temperature.
Energies 14 02501 g015
Figure 16. Volumetric efficiencies obtained from the CFD simulations and from the experiment for the BVP at 22.5 bar pressure load and 20 °C oil temperature.
Energies 14 02501 g016
Figure 17. Volumetric efficiencies obtained from the CFD simulation and from the experiment for the TMC pump at 15 bar pressure load and 20 °C oil temperature.
Energies 14 02501 g017
Figure 18. Comparison of the CFD data for the displacement chamber pressure profiles at p 2 = 22.5 bar pressure load and 20 °C oil temperature for 1000 rpm (a) and 3000 rpm (b).
Energies 14 02501 g018
Figure 19. Displacement chamber pressure profiles of the BVP at p 2 = 22.5 bar pressure load and 20 °C oil temperature for 500 rpm (a) and 2000 rpm (b).
Energies 14 02501 g019
Figure 20. Comparison of the CFD data for the delivery port pressure ripple at 22.5 bar pressure load, 20 °C oil temperature and 2000 rpm.
Energies 14 02501 g020
Figure 21. Delivery port pressure ripple FFT analysis obtained from the CFD simulations and the experiment for the BVP at p 2 = 22.5 bar pressure load, 20 °C oil temperature and 2000 rpm.
Energies 14 02501 g021
Figure 22. Delivery port pressure ripple FFT analysis obtained from the CFD simulations and the experiment for the IGP at p 2 = 22.5 bar pressure load, 20 °C oil temperature and 2000 rpm.
Energies 14 02501 g022
Figure 23. Delivery port pressure ripple FFT analysis obtained from the CFD simulations and the experiment for the TMC at p 2 = 22.5 bar pressure load, 20 °C oil temperature and 2000 rpm.
Energies 14 02501 g023
Figure 24. Volumetric efficiencies obtained from the CFD simulations at p 2 = 5 bar pressure load, 20 °C oil temperature and 2000 rpm while increasing the IGVF.
Energies 14 02501 g024
Figure 25. Displacement chamber pressure profiles for the BVP obtained from the CFD simulations at p 2 = 5 bar pressure load, 20 °C oil temperature, 2000 rpm and different IGVF.
Energies 14 02501 g025
Figure 26. Displacement chamber pressure profiles for the IGP obtained from the CFD simulations at p 2 = 5 bar pressure load, 20 °C oil temperature, 2000 rpm and different IGVF.
Energies 14 02501 g026
Figure 27. Displacement chamber pressure profiles for the TMC pump obtained from the CFD simulations at p 2 = 5 bar pressure load, 20 °C oil temperature, 2000 rpm and different IGVF.
Energies 14 02501 g027
Figure 28. Displacement chamber pressure profiles for the BVP at 20 °C oil temperature, 2000 rpm, IGVF = 5% for (a) p 2 = 5 bar and (b) p 2 = 10 bar pressure load.
Energies 14 02501 g028
Figure 29. Required driving torques while increasing the IGVF at p 2 = 5 bar pressure load, 20 °C oil temperature and 2000 rpm for the (a) IGP, (b) BVP and (c) TMC pump.
Energies 14 02501 g029
Figure 30. Outlet mass flow ripple CFD data for the BVP at p 2 = 5 bar pressure load, 20 °C oil temperature and 2000 rpm at different IGVF.
Energies 14 02501 g030
Figure 31. Outlet mass flow ripple CFD data for the IGP at p 2 = 5 bar pressure load, 20 °C oil temperature and 2000 rpm at different IGVF.
Energies 14 02501 g031
Figure 32. Outlet mass flow ripple CFD data for the TMC at p 2 = 5 bar pressure load, 20 °C oil temperature and 2000 rpm at different IGVF.
Energies 14 02501 g032
Table 1. Key properties and dimensions of the investigated pumps.
Balanced Vane Pump (BVP)Internal Gear Pump (IGP)Tumbling Multi-Chamber Pump (TMC)
ManufacturerRobert Bosch Automotive Steering GmbHEckerle Technologies GmbHRobert Bosch GmbH
V d i s p l 14.8 cm3/rev15.0 cm3/rev15.9 cm3/rev
Number of displacement elements12157
Compression ratio9.1511.933.67
V d i s p l / V c o r e   0.0940.0580.034
External housing dimensions (axial length/diameter)90 mm/120 mm125 mm/150 mm185 mm/125 mm
Table 2. Overview of the two CFD setups for multiphase flow simulations.
Setup 1 (Cavitation)Setup 2 (IGVF of Free Air)
Simulation methodRANS, unsteadyRANS, unsteady
Euler–Euler approach homogeneousinhomogeneous
PhasesLiquid oilOil vaporLiquid oil Air (ideal gas)
Phase morphologyContinuousContinuousContinuousDispersed
Turbulence modelk-ω SSTk-ω SSTDispersed Phase Zero Equation
Interphase transfer-Particle Model, 0.1 mm mean bubble diameter
Mass transferRayleigh–Plesset, 2 µm mean bubble diameter-
Momentum transfer-Schiller Naumann
Heat transfer-Ranz Marshall
Turbulence transfer-SATO Enhanced Eddy Viscosity
Buoyancy-Density difference
Table 3. Fluid properties of the automatic transmission oil at 20 °C and 1 bar.
Density (kg/m3)843
Dynamic Viscosity (Pa · s)0.07485
Liquid Bulk Modulus (Pa) 1.5 · 10 9
Surface Tension Oil–Air (N/m) 2.5 · 10 2
Vapor Pressure (Pa)30
Specific Heat Capacity (J/(kg · K))1781
Thermal Conductivity (W/(m · K)) 0.142
Publisher’s Note: MDPI stays neutral with regard to jurisdictional claims in published maps and institutional affiliations.

