Article

Co-Digestion of Rice Straw with Cow Manure in an Innovative Temperature Phased Anaerobic Digestion Technology: Performance Evaluation and Trace Elements

by
Furqan Muhayodin
1,2,*,
Albrecht Fritze
1,
Oliver Christopher Larsen
1,
Marcel Spahr
3 and
Vera Susanne Rotter
1
1
Department of Environmental Technology, Chair of Circular Economy and Recycling Technology, Technische Universität Berlin, 10623 Berlin, Germany
2
Department of Farm Machinery and Power, University of Agriculture, Faisalabad 38000, Pakistan
3
Herbst Umwelttechnik GmbH, Goerzallee 305E, 14167 Berlin, Germany
*
Author to whom correspondence should be addressed.
Submission received: 30 March 2021 / Revised: 23 April 2021 / Accepted: 26 April 2021 / Published: 29 April 2021

Abstract

:
Rice straw is an agricultural residue produced in abundant quantities. Open burning and plowing back the straw to the fields are common practices for its disposal. In-situ incorporation and burning cause emissions of greenhouse gas and particulate matter. Additionally, the energy potential of rice straw is lost. Anaerobic digestion is a technology that can be potentially used to utilize the surplus rice straw, provide renewable energy, circulate nutrients available in the digestate, and reduce greenhouse gas emissions from rice paddies. An innovative temperature phased anaerobic digestion technology was developed and carried out in a continuous circulating mode of mesophilic and hyperthermophilic conditions in a loop digester (F1). The performance of the newly developed digester was compared with the reference digester (F2) working at mesophilic conditions. Co-digestion of rice straw was carried out with cow manure to optimize the carbon to nitrogen ratio and to provide the essential trace elements required by microorganisms in the biochemistry of methane formation. F1 produced a higher specific methane yield (189 ± 37 L/kg volatile solids) from rice straw compared to F2 (148 ± 36 L/kg volatile solids). Anaerobic digestion efficiency was about 90 ± 20% in F1 and 70 ± 20% in F2. Mass fractions of Fe, Ni, Co, Mo, Cu, and Zn were analyzed over time. The mass fractions of Co, Mo, Cu, and Zn were stable in both digesters. While mass fractions of Fe and Ni were reduced at the end of the digestion period. However, no direct relationship between specific methane yield and reduced mass fraction of Fe and Ni was found. Co-digestion of rice straw with cow manure seems to be a good approach to provide trace elements except for Se.

1. Introduction

Rice straw (RS) is an agricultural residue that is available in abundant supply. Approximately 846 million tons were produced in 2017 globally [1]. Present uses are limited to cooking, feeding animals, constructing buildings, and making paper [2]. However, the largest share of produced RS is left in the fields [2]. Open burning and plowing the straw back to the fields are common practices for its disposal, contributing to greenhouse gas emissions to the atmosphere [3,4], and its energy potential is also lost [5].
Anaerobic digestion (AD) may offer a promising approach to convert RS into biogas. It can play a dual role in producing renewable energy and treating waste [6]. RS also has good theoretical methane potential (TMP) and it can be calculated as proposed by Baserga [7], resulting in 207 to 211 L/kg VS [8]. Moreover, the specific methane yield (SMY) under different experimental conditions were reported by various authors in their studies, such as 231 L/kg VS [9], 120 L/kg VS [10], 226 L/kg VS [11], and 100 L/kg TS [12].
Although AD seems an attractive option for energy recovery based on its SMY, the main obstacle to this process is the microbial degradation of the lignocellulosic substrate like RS [5]. Various types of pre-treatments have been used to separate lignin from the cellulose so the cellulose can be anaerobically digested easily. The results of several studies showed the effectiveness of physical, thermal, chemical, and biological pre-treatments of RS [13,14,15,16]. Although pre-treatment of RS is effective, it often needs high energy input or chemicals that are not feasible for farm-scale applications.
There have been other developments in the field of AD of RS apart from the various pre-treatments. These developments include the usage of appropriate inoculum and co-substrates, optimal selection of mixing in the digesters, suitable organic loading rate (OLR), recycling of liquid digestate (LD) to the digesters, and supplementation of trace elements (TEs). These developments have been used to enhance the energy recovery in the AD of RS but are mostly implemented at the lab-scale or pilot-scale. The AD of RS at the farm-scale is still minimal in practice [17]. There is a need for the development of AD technology that can improve the degradation of RS without or with little pre-treatment and without external supplementation of TEs to make it feasible for farm-scale applications.
In this work, an innovative temperature-phased anaerobic digestion (TPAD) technology named “loop digester” was developed by Herbst Umwelttechnik in the “BioRist Project: A joint research project for innovative process technology for biogas production from rice straw“ [18]. The TPAD was carried out in a “Loop-digester”, working in a continuous process under circulating mesophilic and hyperthermophilic conditions. This process aims to digestion a substrate under both temperature conditions (two microbial environments) to enhance energy recovery in the form of SMY. This technology is patented for the European and Southeast Asian market with international patent no WO 2018/138368 AI owned by Herbst Umwelttechnik.
AD is a complex biological process. Temperature is one of the most significant parameters affecting the activities, survival, and growth of microorganisms [19]. Traditionally, thermophilic (55 °C) AD is less used than mesophilic (37 °C) because of its lower process stability and higher energy demand [20]. Several studies reported the advantage of the thermophilic AD by achieving higher biogas yield using the RS as a substrate [11,12,19]. However, temperature variation should not exceed 0.6 °C/day to maintain a stable process [21]. The advantages of mesophilic AD include less energy demand and better stability of the process. Therefore, combining mesophilic and thermophilic conditions by TPAD could bring the advantages of both temperature conditions [22]. TPAD technology usually consists of a first thermophilic stage with a short retention time. This stage acts as a pre-treatment step to improve the hydrolysis rate. It is followed by a longer mesophilic stage intending to effectively remove organic matter and degradation of soluble compounds released under thermophilic conditions [23].
There have been some studies investigating the TPAD technology. Ge et al. [22] evaluated a thermophilic-mesophilic TPAD technology against a mesophilic-mesophilic TPAD during the treatment of primary sludge. Han et al. [24] compared the performance of the TPAD technology (55 °C and 35 °C) with the conventional single-stage mesophilic approach (35 °C) for the treatment of the mixtures of primary and waste activated sludge. Similarly, Watts et al. [25] also compared the performance of the TPAD technology (47, 54, and 60 °C) with the conventional single-stage mesophilic (36 and 37 °C) treating waste activated sludge. Gianico et al. [23] proposed an inverse TPAD, different from the studies mentioned above [22,24,25]. The technology is named ultrasound-mesophilic-thermophilic (UMT) and is used for the treatment of sludge. The first step involves the hydrolysis of particulate organic matter and performs mechanically using ultrasounds. The second step occurs in a mesophilic digester. The third step is the thermophilic digester [23].
TPAD was carried out in two stages in these studies. Therefore, the substrate was not subjected to microbes working on both temperature conditions in a continuous mode. The working of these microbes in a continuous mode may have resulted in even better performance. Furthermore, only various sludges were investigated in these studies. TPAD has not been applied for the AD of any lignocellulosic substrate such as RS, which is available in abundant quantity. It is, therefore plausible, to apply TPAD for RS in an innovative continuous mode using a newly developed loop digester, The RS was co-digested with cow manure (CoM), while all the studies mentioned above, were used only for the treatment of various sludges [22,23,24,25]. The performance of the loop digester (F1) was compared with a conventional mesophilic digester (F2) using the key performance indicators (KPI) SMY, anaerobic digestion efficiency (ADE), and volumetric methane production rate (VMPR).
In addition to TPAD, the integration of appropriate microbes necessary to break down the lignocellulosic substrates can also be achieved by co-digestion [5]. Co-digestion of RS with various substrates has been proved to be very effective in both lab and pilot-scale experiments [5,26,27,28]. Co-digestion improves substrates treatability since it provides process stability, a better C/N ratio, increased biodegradation, adjust moisture content, a supply of TEs, and, therefore, enhance energy recovery [29,30]. Several TEs such as iron (Fe), nickel (Ni), zinc (Zn), molybdenum (Mo), selenium (Se), tungsten (W), cobalt (Co), and copper (Cu) are essential for enzyme cofactors involved in the biochemistry of methane (CH4) formation [31]. An appropriate amount of TEs is required to maintain the effective growth and metabolism of microorganisms. Various authors have reported the requirements of different TEs in the AD process [32,33,34,35]. A higher amount can cause inhibition due to the disruption of an enzyme’s structure and function [36]. Apart from these reported requirements of TEs in the AD process, some researchers also studied the effect of supplementation of TEs (Fe, Co, Ni, and Se) on CH4 yield during the mono-digestion of RS. They observed improvement in CH4 yield due to the supplementation of these TEs [37,38].
Co-digestion of RS has usually been investigated to adjust the C/N ratio [26,27,28]. Co-digestion may or may not provide enough TEs. Furthermore, maybe, depletion of TEs happened and adversely affected the performance of AD. These aspects were not well considered by the researchers in their studies [5,26,27,28].
The main purpose of this study was to evaluate and compare the performance of the newly developed F1 and the reference F2 during the co-digestion of RS with CoM. Therefore, a hypothesis was formulated that the “F1 (TPAD technology) would increase the performance of co-digestion of RS with CoM in terms of SMY, ADE, and VMPR”. Overall, this research work aimed to (1) investigate the performance of the F1 and F2 during the co-digestion of RS with CoM by evaluating the KPI; (2) identify the possible TEs accumulation/depletion and its effects on the CH4 yield; (3) quantify the TEs in the digesters and compare their concentrations with recommended literature values because a sufficient amount is essential for stable CH4 yield.

2. Materials and Methods

2.1. Substrates

A bale of RS (approximately 150 to 200 kg) was obtained from a farmer from northern Italy. The collected RS was cut into 10–30 mm pieces by a straw cutter (includes chopping, cutting, and milling) before adding to the digesters. The straw was stored in a dry place.
Fresh CoM was collected from a cow farm in Brandenburg near Berlin, Germany. The collection of CoM was conducted in four sets (CoM1, CoM2, CoM3, and CoM4) and stored in the lab during the experiment. The volume of each set varies on the duration of its usage approximately from 60 to 80 L. CoM1 was the first set of manure, and it was also used during the commissioning of the experiment. The detail about the duration of usage and storage of each set of manure is presented in Table 1 The samples of each set were taken on the first day of manure collection and used to analyze the reported parameters in Table 2. The manure was kept in the lab for feeding the digesters. For sampling, about 15 to 20 kg of RS was collected from random locations in the bale. It was size reduced with the straw cutter. Then a representative sample from this sample was taken for the analysis of the required parameters.
Prior to sampling, the CoM was mixed thoroughly. Several subsamples were taken and mixed to make a composite sample and used for analysis.
The general characteristics of RS and CoM, such as total solids (TS), volatile solids (VS), total C, total N, and C/N ratio, are presented in Table 2. Moreover, the content of crude protein (XP), crude fiber (XF), crude fat (XL), crude ash (XA), and TEs are presented in Table 2. All four sets of CoM were brought from the same source. All the analyzed parameters were similar in all sets. Therefore, it was assumed to have similar content of TEs in all sets of CoM and therefore only analyzed in CoM3 and CoM4.

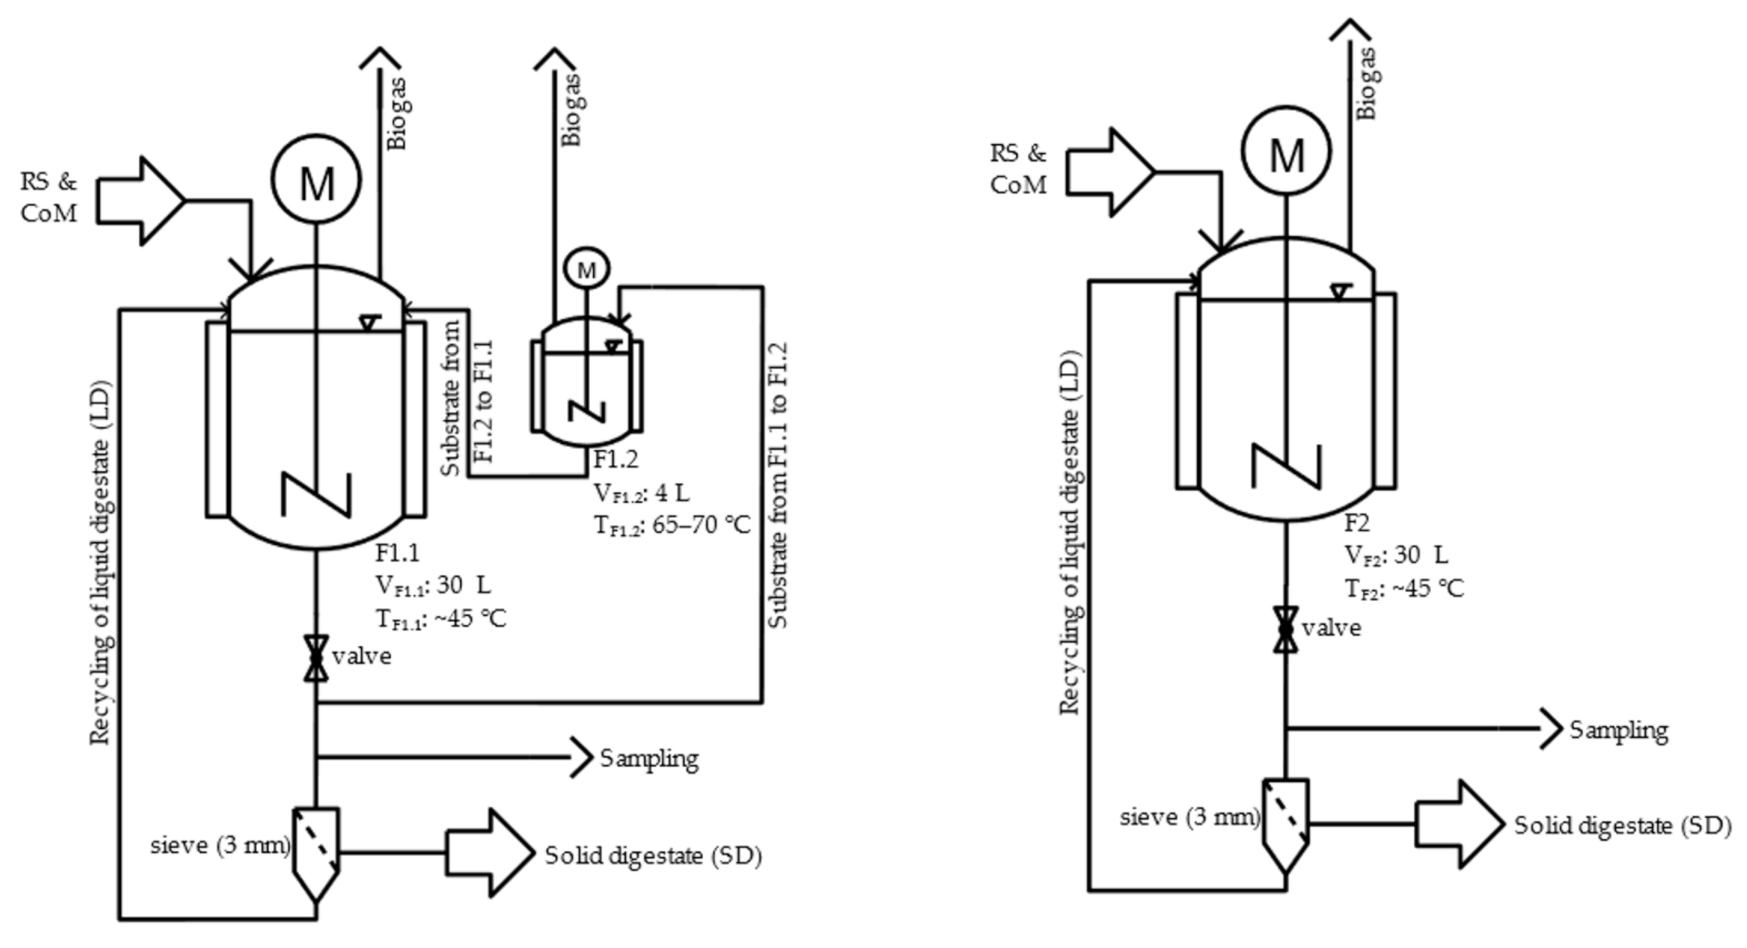
2.2. Experimental Setup

F1 consisted of two different continuously stirred tank reactors (CSTR) working in a loop. The working net volume of the first CSTR of F1 (F1.1) was 30 L, and the second CSTR (F1.2) was 4 L. These two CSTRs of F1 were operated at two temperature conditions. F1.1 was working at mesophilic (nearly 45 °C), while F1.2 was working on hyperthermophilic conditions (65–70 °C). F2 was working as a reference at mesophilic conditions (45 °C) with a net volume of 30 L. The digesters contained ports for various purposes such as biogas collection, mechanical agitation, temperature control, feeding, and removal of the substrates. The schematic diagram of both digesters is shown in Figure 1.

2.3. Experimental Design and Operation

The digesters used in this study were already working with RS and CoM. The sludge contained in both the digesters was used to continue the experiments in this study. Therefore, no external inoculum was used in this study for the commissioning.
Co-digestion of RS with CoM was carried out for 314 days. About 45 days were used for commissioning. The feeding was started with a relatively low OLR at 2.2 g VS L−1 d−1. The OLR and hydraulic retention time (tHR) during the experiment were changed in both digesters, as presented in Table 3. While tHR was 3 to 4 days in F1.2.
Also, four sets of CoM were used in the experiment, as presented in Table 1.
F1 and F2 were fed once a day, seven days a week, with a freshly prepared mixture of RS and CoM during the whole experiment. The amount of RS and CoM was different at different OLR. About 1.0 to 1.1 L of the substrate from F1.1 was fed into F1.2, and an almost similar amount was fed back to F1.1 daily. The LD was obtained manually by filtering the digestate through a sieve with a 3 mm mesh size. The LD was recycled to both digesters daily to dilute the substrates and to keep a constant TS content in the digesters. The solid digestate (SD) remained after the filtration process was discarded.

2.4. Sampling Plan

The process parameters such as FOS/TAC ratio (Flüchtige Organische Säuren/Totales Anorganisches Carbonat) and ammonium (NH4+) were analyzed every week while pH was measured on daily basis in both digesters. The pH and FOS/TAC ratio were determined as a single value immediately after collecting the digestate sample. For the analysis of TEs (Fe, Ni, Co, Mo, Cu, Zn, and Se), homogenous samples of 400 to 500 g digestate were taken bi-weekly during the experiment from F1 and F2 and measured as duplicate.

2.5. Analytical Methods

XP, XF, XL, and XA were determined according to standard procedures described by the Association of German Agricultural Analytic and Research Institutes [39]. Nitrogen-free extracts (XX) were mathematically estimated as the difference between organic matter values and analytically assessed organic compounds [40].
TS was determined per DIN EN 15,934 Sludge, treated biowaste, soil, and waste—Calculation of dry matter fraction after determination of dry residue or water content and VS were determined according to DIN EN 15,935 Sludge, treated biowaste, soil, and waste—Determination of loss on ignition. Analysis of total C and total N was conducted by Elemental Analyzer (Vario EL III, Elementar Analysensysteme GmbH, Langenselbold, Germany). The mass fractions of TEs (Fe, Ni, Co, Mo, Cu, Zn, and Se) were determined by inductively coupled plasma-optical emission spectroscopy (ICP-OES) (iCAP 6000, Thermo Fisher Scientific, Waltham, MA, USA) according to DIN EN 16,170 Sludge, treated biowaste, and soil—Determination of elements using inductively coupled plasma optical emission spectrometry (ICP-OES). The samples were prepared using aqua regia digestion according to DIN EN 16,174 Sludge, treated biowaste, and soil—Digestion of aqua regia soluble fractions of elements. All these analyses mentioned above were carried out in duplicates. Test kits from Macherey-Nagel were applied for the analysis of NH4+. The pH was determined with a pH-201 pH controller.
The FOS/TAC ratio was evaluated as a ratio between the total volatile fatty acids (VFAs) (expressed as mg/L of CH3COOH equivalent) and alkalinity (expressed as mg/L of CaCO3) [41]. The FOS/TAC ratio was determined in 50 mL of a sample employing a titration device as a two-step endpoint titration using a 0.5 M H2SO4 solution [41].
The volume of produced biogas was measured by using Elster’s diaphragm gas meter (BK-G4MT). Then the volume of dry gas was calculated in the normal state [42]. The biogas analysis (CH4, O2, H2S, and CO2) was performed using the gas analyzer SEWERIN Multitec® 545.

2.6. Calculation of the Theoretical Methane Potential

The TMP, expressed in L/kg VS, of RS and CoM, was calculated based on a method proposed by Baserga [7]. This method assumes that CH4 production from organic substrates mainly depends upon their content of XP, XL, XF, and XX. TMP of RS and CoM was estimated from the degradability of XP, XL, XF, and XX, for which the digestibility coefficients (dXP, dXL, dXF, and dXX) were: 26, 40, 61, and 47%, respectively [43]. Furthermore, the CH4 content of biogas was assumed to be 50%. Equation (1) was used for the calculation of TMP.
TMP [ L   kg   VS 1 ] = 0.5 × 700 × d XP × XP + 1250 × d XL × XL + 790 × d XF × XF + 790 ×   d XX × XX
Also, there is another method proposed by Buswell et al. [44] to estimate the TMP that assume the complete degradation of organic substrates. In this method, TMP is estimated from the elemental composition (the content of C, H, O, and N) of substrates. This method was not used to estimate TMP in this study but results from literature using RS as the main substrate was used for the comparison purpose.

2.7. Key Performance Indicators

The following KPI were used to evaluate the performance of both digesters.
SMY, expressed in L/kg VS, was defined as the total volume of CH4 produced throughout the digestion period per unit weight of the VS of the substrate [45]. It was used to express how efficiently the substrate converted to CH4 under the actual experimental conditions. The values of SMY presented in this study represent the CH4 produced by the RS only (CH4 produced by the CoM has been subtracted) as expressed in Equation (2).
Specific   Methane   Yield   ( SMY )     L / kg   VS = V _ CH 4 RS + CoM V _ CH 4   CoM   VS _ RS  
where V_CH4 (RS + CoM) is the volume of CH4 produced by co-digestion of RS with CoM, V_CH4 (CoM) is the theoretical volume of CH4 produced by CoM. VS_RS is the VS added by RS to the digesters.
ADE, expressed in %, was calculated as the ratio of SMY and TMP as presented in Equation (3).
Anaerobic   Digestion   Efficiency   ( ADE )   % = SMY TMP × 100
VMPR was used to show how much CH4 was produced per unit volume of the digester. VMPR expressed in L CH4/(L d) was calculated as in Equation (4).
Volumetric   Methane   Production   Rate   ( VMPR )   [ L   CH 4   L   d 1 ] =   v / V
where v is the volume of CH4 produced daily and V is the net volume of the digesters in L.
These KPI were calculated daily. The overall average of each of these indicators was used for the performance evaluation of both digesters.

2.8. Statistical Analysis

The mean values of SMY were compared using Student’s t-test. The difference was considered significant for a probability below 0.05 (p < 0.05). The correlation coefficient was used to determine the relationship between the change (accumulation or depletion) in mass fractions of TEs and SMY. These statistical analyses were performed using Microsoft Excel.

3. Results

3.1. Performance Evaluation of the Digesters F1 and F2

The estimated TMP (based on Baserga) of RS was 210 L/kg VS. The TMP of CoM2, CoM3, and CoM4 was 177, 178, and 172 L/kg VS, respectively. The TMP of three sets of CoM was comparable. The TMP of CoM1 was not estimated, and it was assumed to be similar to the other three sets since it was obtained from the same source. Additionally, the general characteristics of all four sets were similar, as shown in Table 2.
SMY and VMPR are two critical indices used to evaluate the performance of the AD process. SMY is an indicator of the raw substrate’s utilization efficiency. It shows how effectively the substrate has been converted to CH4. VMPR is an indicator of the efficiency of the digester and shows how much CH4 can be produced per unit working volume of the digester.
Figure 2 shows the SMY of RS during the co-digestion with CoM. A stable CH4 production was achieved in both digesters during the experiment. The overall average achieved SMY of RS in 314 days of the experiment was higher in F1 (189 ± 37 L/kg VS) than F2 (148 ± 36 L/kg VS). The whole experiment was divided into three different tHR in both digesters: tHR1, tHR2, and tHR3 having 35, 50, and 40 d, respectively. Furthermore, the C/N ratio of the input mixture (RS and CoM) was changed since four different sets of manure were used in the experiment. The C/N ratio was 26 and 29 at tHR1 and tHR2. While the C/N ratio of 28 and 31 were achieved at tHR3. As a result, the average SMY was 177 ± 42, 226 ± 31, and 187 ± 32 L/kg VS at 35, 50, and 40 d, respectively in F1. The average SMY was 140 ± 40, 182 ± 41, and 143 ± 29 L/kg VS at these tHR, respectively in F2.
For comparison, the ADE of RS from both the digesters is shown in Figure 3. The ADE of RS, on average, was 90 ± 20% in F1 and 70 ± 20% in F2 for the whole experiment.
The comparison of VMPR from both the digesters is shown in Figure 4. The overall VMPR was higher in F1 with an average value of 0.74 ± 0.18 L CH4/(L d) than F2 with an average value of 0.60 ± 0.17 L CH4/(L d).

3.2. pH in F1 and F2

The pH values of F1 and F2 were monitored daily and shown in Figure 5. The pH values of both digesters were in the range of 7.2 to 8.0 except for a few values of F2 that reached up to 8.2. The pH values were stable and showed a similar trend in both digesters. The average pH in F1 was 7.6 ± 0.1 and 7.8 ± 0.1 in F2.

3.3. FOS/TAC in F1 and F2

The FOS/TAC was analyzed and investigated in both digesters to study the process stability. The results are presented in Figure 6. The FOS/TAC values range from about 0.3 to 0.6 in F1 and 0.2 to 0.4 in F2. Higher values were observed in F1 (0.5 ± 0.1) compared to F2 (0.3 ± 0.1) during the whole digestion time. These results showed stable FOS/TAC values in both digesters as there was no gradual increase or decrease trend observed. The FOS/TAC was not analyzed during the first 60 days of the experiment due to technical limitations (no availability of titration device).

3.4. NH4+ in F1 and F2

The NH4+ was measured once per week in both digesters, and their values are also presented in Figure 6. The overall average values of NH4+ were 1.3 ± 0.1 g/L in F1 and 1.6 ± 0.2 g/L in F2. Usually, lower NH4+ values were observed in F1 compared to F2 during the whole digestion time. The general trend of NH4+ was similar in F1 and F2 as the values were a bit higher in the last stage of the digestion compared to the early stage.

3.5. Trace Elements over Time in F1 and F2

The mass fractions of TEs, including Co, Cu, Ni, Mo, Fe, Zn, and Se, were analyzed without change in the feeding (at OLR of 4.2 g VS L−1 d−1 for about 200 days) in the AD process. The mass fraction of each element is shown in Figure 7 and Figure 8 in both digesters except for Se, as its values were below the detection limit. There was no supplementation of TEs at any stage of the digestion. Since there was no addition of TEs and the measured mass fractions were assumed to be naturally occurring in RS and CoM.
Both digesters showed almost stable mass fractions for the Co, Mo, and Zn over digestion. Although the mass fraction of Cu fluctuated in both digesters, there was no gradual increase or decrease over time. The mass fraction of Ni decreased from 7.0 mg/kg TS to 4.4 mg/kg TS in F1 during the digestion time. Moreover, lower values (24 mg/kg TS) were observed at the end of the experiment compared to the start of the sampling (30.5 mg/kg TS) in F2. There was an apparent gradual decrease in the mass fraction of Fe in F1. Furthermore, the mass fraction of Fe decreased in F2 at the end of the experiment (1.4 g/kg TS) compared to its value at the start (2.0 g/kg TS).

3.6. Status of Trace Elements

TEs were analyzed during the digestion time in both digesters, and their average values are presented in Table 4. The average concentrations of Co, Cu, Fe, and Zn were similar in F1 and F2. Higher concentrations of Mo and Ni were available in F2 as compared to F1. Se was below the detection limit in both digesters.

4. Discussion

4.1. Substrate and Estimation of Its Theoretical Methane Potential

Muhayodin et al. [17] presented the general characteristics of RS in their review article, and the values obtained in this study (Table 2) were comparable with their reported values.
The method to estimate the TMP in this study is based on the assumption that CH4 production from organic substrates mainly depends on the amount of XP, XL, XF, and XX and their digestibility coefficients [7]. Another method, proposed by Buswell et al. [44], estimates the TMP that assumes the complete degradation of organic substrates. In this method, TMP is estimated from the elemental composition (the content of C, H, O, and N) of substrates. These two methods were compared to assess how closely they can estimate TMP to actual SMY. The estimated TMP of RS and CoM used in this study is presented in the results section.
Li et al. [27] reported the TMP as 443 L/kg VS and SMY as 267 L/kg VS during the co-digestion of RS with pig manure while using the substrates in a ratio of 1:1. In another study, these authors calculated the same TMP (443 L/kg VS) but different SMY as 196 L/kg VS during the co-digestion of RS with CoM [26]. Moreover, Mei et al. [28] estimated TMP as 357 L/kg VS and SMY as 250 L/kg VS when RS was co-digested with chicken manure. The results of these studies showed a high TMP as compared to their achieved SMY. The possible explanation could be that the organic substrates were not completely degraded during the AD, which was used to measure SMY. At the same time, its complete degradation was assumed for the estimation of TMP.
Amon et al. [46] established a CH4 energy value model for various energy crops based on the amount of XP, XL, XF, and XX. Various varieties of maize and cereals were used to measure SMY, and it was compared with corresponding TMP. The SMY and TMP were similar in their study. Similarly, Speckmaier et al. [47] conducted a study for maize silage, grass silage, and rapeseed oil. The TMP and SMY showed similar results. Mittweg et al. [48] compared TMP from maize using three different models with SMY determined by the Hohenheim biogas yield test. Two of the tested models showed a satisfactory performance compared to the mean SMY values.
The results of the studies mentioned above indicated that the method used in this study was better to estimate the TMP. Therefore, it can also help estimate the need for the raw substrate for the planned biogas plant.

4.2. Advantages of F1 over F2

The TMP of RS was 210 L/kg VS. However, the SMY of RS is often reported lower than TMP due to the difficulty in the degradation of tightly bound lignocellulosic material [5]. Therefore, several physical, biological, chemical, or thermal pre-treatments of the straw are often used to disassociate the polymers and expose the soluble components to improve the degradation and ultimately achieve higher SMY [5]. Previous studies have shown that the AD of RS can give different SMY under mesophilic conditions such as 231 L/kg VS [9], 120 L/kg VS [10], 226 L/kg VS [11], and 100 L/kg TS [12]. Apart from experimental conditions, different SMY may also depend upon the species and growing regions of RS. In this study, the average achieved SMY from F1 was 189 ± 37 L/kg VS which was significantly higher (28%) than F2 (148 ± 36 L/kg VS). The SMYs obtained in this study from both the digester were in the range reported in the above-mentioned studies.
The average SMY was 177 ± 42, 226 ± 31, and 187 ± 32 L/kg VS at 35, 50, and 40 d, respectively, in F1. The average SMY was 140 ± 40, 182 ± 41, and 143 ± 29 L/kg VS in F2. The SMY from F1 was always higher than F2 at all different tHR. This can be attributed to improved treatment of cellulose/fiber and the formation of acids such as acetic acids, formic acids, propionic acid and, butyric acid in F1. Besides, the SMY increased with the increase of tHR from both digesters. This phenomenon could be attributed to the improved degradation of cellulose and hemicelluloses present in the RS at higher tHR [49].
The C/N ratio of the input mixture was in a range from 26 to 31 in the experiment in both digesters. The range of recommended C/N ratio for the AD process is 20 to 30 [50]. Hence, the C/N ratio used in this study was in the range recommended in the literature except 31. The input mixture of RS and CoM4, which was used from day 246 to 314 (68 days) in the experiment, resulted in a C/N ratio of 31. The average SMY from F1 was 183 ± 42 L/kg VS during these 68 days, similar to its overall average SMY (189 ± 37 L/kg VS). In F2, a low SMY (126 ± 22 L/kg VS) was achieved compared to its overall average yield having a higher C/N ratio of the input mixture. These results suggest that the performance of F1 was better even at a higher C/N ratio compared to F2. Working with digester at the higher C/N ratio would be beneficial as it requires less amount of N rich co-substrate such as manures. Therefore, F1 could reduce the need of N-rich co-substrates.
On average, 90 ± 20% of theoretical CH4 (i.e., 210 L/kg VS) was achieved from F1. While on the other hand, the ADE was 70 ± 20% in F2. These results demonstrate that the digestion of RS in F1 was more efficient, having a 20% higher ADE. Li et al. [26] investigated the effect of various substrate ratios on the AD of RS with CoM. They reported ADE with various VS ratios ranges from 35% to 53%. Similarly, Li et al. [27] also studied the effect of various substrate ratios on the AD of RS with pig manure. Their achieved ADE at different VS ratios was from 45% to 60%. The values of ADE obtained by Li et al. [26,27] were lower than the values obtained in this study. It may be attributed to the use of different methods to estimate the TMP. The authors of these studies used a method proposed by Buswell et al. [44], which assume the complete degradation of organic matter and estimate higher TMP than the method proposed by Baserga et al. [7] in this study. Furthermore, the lower estimation of TMP in this study could be due to lower digestibility coefficients.
In addition to the SMY, the VMPR is another parameter used for the performance evaluation of the AD. The VMPR is an indicator of the efficiency of the digester. The VMPR was 0.74 ± 0.18 L CH4/(L d) in F1 and 0.60 ± 0.17 L CH4/(L d) in F2. The higher VMPR in F1 than F2 indicates higher disposal capacity per unit volume, and therefore potentially reducing the investment costs. Li et al. [27] have conducted co-digestion of RS with pig manure at OLRs of 3.0, 3.6, 4.2, 4.8, 6.0, 8.0, and 12.0 g VS L−1 d−1 and VMPR of about 0.7 to 0.8 was achieved at OLRs of (3.0–4.2) g VS L−1 d−1. Another similar study conducted by the same authors about the co-digestion of RS with CoM at the same OLRs reported VMPR of about 0.6 to 0.9 at OLRs of 3.0, 3.6, and 4.2 g VS L−1 d−1 [26].

4.3. Analysis of the Stability of the AD Process

The pH is usually used to assess the health of the AD process. The optimal pH for maximizing the activities of acidogenic and methanogenic microorganisms is known to be different [27]. The optimal pH for hydrolysis and acidogenesis is between 5.5 to 6.5 [27], whereas it is between 6.5 and 7.2 for methanogenesis [21]. Thus, the pH should be maintained within the correct range to reduce the inhibitory effects. The AD process is considered to be normal when the pH is in the range of 6.8 to 8.0 [27]. In this study, the pH values were in the range of 7.2 to 8.0 in both digesters considered normal. Although the pH in both digesters was in the normal range, the pH values of F1 were a bit lower than in F2 which can be attributed to a higher amount of VFAs.
VFAs are essential intermediate products formed during the AD process. VFAs are products of hydrolysis and acidogenesis, as well as substrates for methanogenesis. A correct balance between hydrolysis/acidogenesis and methanogenesis is indicated by a stable concentration of VFAs [27]. VFAs produced from hydrolysis and acidogenesis should be consumed by methanogenic bacteria in time to develop a stable AD process; otherwise, an accumulation of VFAs can result in inhibition [5,27].
NH3 is a by-product of the AD process and reacts with CO2 to form NH4+ and alkalinity [5]. The alkalinity is used to quantify the buffering capacity as it mitigates pH changes during the production of VFAs in the AD process [5,27].
The higher FOS/TAC values in F1 compared to F2 in Figure 6 indicated the higher availability of VFAs. The possible explanation could be the substrate was initially, at least partially digested by mesophilic bacteria in F1.1. Then, hyperthermophilic bacteria in F1.2 were able to break down the already partly digested substrate into lower organic acids and short-chained alcohols. Acetic acids were at least partly formed in F1.2 along with other lower organic acids. Finally, acetic acid in the substrate was converted into biogas in F1.1. Hence, F1 could accelerate the hydrolysis and conversion of VS into VFAs and encourage methanogenic activity. These findings were supported by the higher SMY obtained from F1 compared to F2.
RS was used in this study and it is a poorly degradable substrate like other lignocellulosic materials and hydrolysis (formation of VFAs) is considered the rate-limiting step [51]. The results of FOS/TAC from F1 showed its better ability to degrade the RS and produce higher CH4 compared to conventional mesophilic digestion. Therefore, loop technology can be considered for the AD of other substrates similar to RS like wheat straw, maize straw, etc., at various scales such as pilot and farm.
The FOS/TAC ratio is used to determine the stability of the AD process [52]. According to Li et al. [27], the AD process is considered stable when the FOS/TAC ratio is less than 0.4 whereas, when it is between 0.4 and 0.8, the process would be unstable. The AD process is severely unstable if this ratio is greater than 0.8. The optimum FOS/TAC ratio is 0.25 to approximately 0.5 as reported by Wan et al. [53]. In this study, the FOS/TAC ratio was 0.2 to 0.4 (with an average of 0.3 ± 0.1) in F2 within the limit values for the stable AD process as proposed in the studies mentioned above. The maximum FOS/TAC value in F1 was 0.6, which is out of the optimum range suggested in those studies, but the AD process was still stable with stable CH4 production. Although, FOS/TAC ratio in F1 was under the limit value (0.8) recommended by Fachagentur Nachwachsende Rohstoffe [54].
The degradation of proteins, peptides, and amino acids creates NH4+ [27]. NH4+ is considered the most crucial nutrient for methanogenic bacteria, and it is consumed during the AD of VFAs [5]. Thus, NH4+ is produced and consumed during the AD process. Analysis of concentrations of NH4+ showed its lower values in F1 (1.3 ± 0.1) compared to F2 (1.6 ± 0.2), as shown in Figure 6. Higher pH generally results in lower NH4+. The pH in F1 is lower than F2, but not a huge difference exists. There is another relationship between temperature and NH4+. Higher temperatures cause a higher proportion of NH3 and lower NH4+. Since the temperature of F1 (hyperthermophilic) was higher than F2, this could be the explanation of lower NH4+ in F1.
There was an increased concentration of NH4+ at the last stage of the digestion in both digesters. The possible reason could be, at this stage, the microbial growth reached a stable phase whereas the protein continued to degrade, which resulted in a bit increase in concentration. The NH4+ concentrations were maintained within a suitable range in both digesters. The highest NH4+ concentration was 1.8 g/L in F1 and 2.1 g/L in F2, which were lower than the inhibition level of 3.8 g/L [55].
These results mentioned above suggest that monitoring the trends of pH, NH4+ and FOS/TAC ratio is necessary to check the stability of the AD process.

4.4. Effects of Trace Elements on the AD Process

Various TEs such as Fe, Co, Ni, Mo, Se, and W have been shown to enhance methanogenesis [5]. The substrates usually supply TEs to the biogas digesters, and it is expected that the deficiency of these TEs may reduce the AD performance [56].
The mass fractions of Co, Cu, Ni, Mo, Fe, and Zn were analyzed over time to study their accumulation or depletion and their effect on SMY. The results revealed, no depletion or accumulation of Co, Mo, Cu, and Zn in both digesters since their mass fractions were stable during the digestion time as shown in Figure 7 and Figure 8. The possible explanation for the stable mass fractions of these TEs during the AD could be their constant availability in the RS and CoM (feeding substrates). A depletion of Ni and Fe was observed in both digesters. There was an apparent gradual decrease in the mass fraction of Fe in F1 over digestion time, as shown in Figure 7. In F2, the mass fraction of Fe was reduced from 2.0 to 1.4 g/kg TS on the last sampling day. The depletion can be attributed to the retention of these TEs that could have happened in the digesters. There is a probability that TEs may react with Fe-sulfide releasing Fe2+. The resulting Fe2+ may precipitates as hydroxides (Fe(OH)2) or carbonates (FeCO3) [57].
Mähnert [58] studied the depletion or accumulation of TEs (Fe, Cu, Zn) during the mono-digestion of maize silage, forage rye, beet silage, and cattle manure in one year lab-scale experiments. Their results showed a depletion of Cu and Zn when the maize silage or forage rye were used as input substrates while Fe remained stable or even increased. Ensiled sugar beet provided stable content of Cu and Zn, and there was an increase in the mass fraction of Fe. A digester fed with cattle manure showed almost stable contents for these TEs. The results obtained in our and Mähnert’s [58] studies showed that the different TEs could be influenced differently in the digesters. Some TEs deplete, but at the same time, others can be stable. TEs may be involved in many physicochemical processes due to the complexity of the AD process. The precipitation of TEs by sulfide, carbonate and phosphate and deposition in the digesters in the form of sludge could play an essential role in their depletion [57].
The Fe content gradually decreased (from 2.4 to 1.5 g/kg TS) in F1 from the start of analysis (day 95) till the end (day 299). Furthermore, Ni content was higher from day 95 to day 123 and then decreased but remained stable until the last sampling day. The depletion of Fe and Ni in F1 is shown in Figure 7 and the SMY in Figure 2. There was stable SMY, and no gradual decrease in SMY was observed due to the gradual depletion of Fe. Similarly, the trend of depletion of Fe and Ni in F2 as shown in Figure 8 did not correspond to SMY reduction. Additionally, the correlation coefficient between SMY and Fe and Ni were 0.13 and 0.10, respectively, in F1. Similarly, the coefficient was −0.07 and 0.2 for Fe and Ni, respectively, in F2. Therefore, no direct relationship can be found in the depletion of Fe and Ni with SMY in both digesters.
González-Suárez et al. [59] studied the depletion of Fe, Ni, Co, and Mn during mono-digestion of maize silage. At the end of the experiment (day 96), Fe and Co were decreased while the mass fraction of Ni and Mn was stable. A decrease of 11% in CH4 yield was observed at the OLR of 2.5 g VS L−1 d−1. The authors suggested that TEs in the inoculum were sufficient to support the CH4 production during the start-up but not enough to maintain the required amount during the more extended period in mono-digestion. The authors also conclude that the depletion of TEs can happen during the mono-digestion of maize straw in a long- term operation. It can cause the failure of the process due to the limitation of TEs. In contrast, in this study, co-digestion of RS with CoM was carried out and it seems like the co-substrate continuously provided TEs. The only depletion of Fe and Ni was observed in this study, and they have not resulted in lower microbial activity or instability in the digesters. Similarly, Mussoline et al. [5] also obtained higher content of Fe, Ni, and Co when the RS was co-digested with piggery wastewater and paper mill sludge compared to its mono-digestion. Therefore, the presence of these TEs in the co- substrates appeared to enhance CH4 yield due to higher microbial activity.
Besides the enhancement in CH4 yield, the availability of TEs in the digesters can also possibly affect the AD process stability. The pH and FOS/TAC remained stable during the whole duration of the experiment in both digesters. This suggests that the amount of TEs required by the methanogens to convert acids into methane during this co-digestion was available in the substrates. The process stability was not adversely affected by the TEs. Some authors also reported the effect of TEs on the process stability during the AD of various substrates, such as Lindorfer et al. [60] studied the effect of applying a mixture of TEs in the digester fed with energy crops and cattle manure. The FOS/TAC ratio was as high as 0.8 before the supplementation of TEs. Its value was reduced to 0.3 after the application of TEs in a few days. The enhanced consumption of VFAs by methanogens consequently increased the biogas yield. Pobeheim et al. [61] reported that the limitation of Ni and Co during the AD of model substrate for maize showed an adverse effect on process stability and biogas yield. The deficiency of these TEs resulted in the accumulation of VFAs and led to a strong decrease of the pH value, ultimately decreasing methanogenic bacteria’s activity. Although, the stable process was achieved with the increased supplementation of Ni and Co. Similarly, an increase in the utilization of VFAs rate by the supplementation of TEs was also observed by Ariunbaatar et al. [62] during the AD of food waste. Hence, it can be derived that the presence of TEs was also beneficial in maintaining the process stability in this study.

4.5. Comparison of Available Trace Elements with Recommended Values

Various authors have reported the requirement of different TEs in the AD process [32,33,34,35,63]. The recommended concentrations of TEs reported by different authors are summarized in Table 5.
The average concentration of Co found in F1 was 0.16 ± 0.0 mg/L and 0.19 ± 0.0 mg/L in F2. The observed concentrations from both digesters were within the range measured by Schattauer et al. [56], who investigated the abundance of TEs in various biogas plants [56]. Co concentrations in this study confirmed the recommendations given by Sahm et al. [32] and Bischofsberger et al. [63], as well as Takashima et al. [33]. Although, the values found in this study were lower than recommended by Kloss [35].
Average Cu concentrations were 5.2 ± 0.4 mg/L and 4.8 ± 0.5 mg/L in F1 and F2, respectively. The values of Cu from both digesters in this study lie in the range given by Sahm et al. [32].
Fe concentration was 258 ± 31.7 mg/L in F1 and 242 ± 27.6 mg/L in F2. The Fe values in this study covered the full range recommended by Kloss [35], Mudrack et al. [34], and Takashima et al. [33].
Mo concentration was found 0.31 ± 0.1 mg/L and 0.97 ± 0.1 mg/L in F1 and F2, respectively. The values obtained in this study cover the range given by Kloss [35] but lie above the values given by Bischofsberger et al. [63] and Mudrack et al. [34].
The concentration of Ni was observed in F1 with 0.74 ± 0.1 mg/L and in F2 with a value of 4.2 ± 0.5 mg/L. These values were above the quantities given by Bischofsberger et al. [63] and within a wide range by Takashima et al. [33] and reached the lower end of the values by Kloss [35]. Moreover, the average concentration of Ni in F2 was higher than in F1. It can be due to its higher background (in digester) concentration since it was also higher at the start of sampling day (95). A possible explanation could be the higher retention of Ni in F1. The retention of Ni can happen in the form of precipitation, such as NiNH4PO4.6H2O or NiKPO4.6H2O. The pH of the digester can also influence the extent of precipitation. Apart from precipitation, TEs including Ni can also be involved in sorption to the solid fraction, either biomass or inert suspended matter in the AD process [57].
The average concentration of Zn was 27.5 ± 1.6 mg/L and 24.5 ± 2.4 mg/L in F1 and F2, respectively. These values fall in a range reported by Schattauer et al. [56]. There were no recommended values given for the Zn in the literature.
The concentration of Se was below the detection limit in both digesters and could not be used for the comparison with the recommended values in the literature. Presumably, the supplementation of Se to achieve recommended values can also increase the CH4 yield.
The concentrations of investigated TEs were at least within the range of the recommended values in the literature except for Se. It can be concluded that the availability of TEs in both the digesters was due to the natural occurrence in the RS and CoM. There was no need for the addition of these TEs except Se as the substrates provided them during the co-digestion. It can be concluded that both digesters seem to have enough TEs except Se. One must consider that the absolute concentration of these TEs does not represent their availability to the microorganisms. These TEs could be fixed in insolvent compounds like phosphates, sulfates, sulfides, or carbonates and not available for microbial uptake. Further research on the availability of TEs during the co-digestion of RS with CoM is necessary to understand the actual amount of TEs available for microbial activity and their impact on the SMY.

5. Conclusions

A Co-digestion of RS was carried out with CoM in an innovative loop digester (F1) and reference digester (F2). The performance of the AD process was compared by evaluating the KPI. Higher SMY, ADE, and VMPR were achieved in F1 due to accelerated hydrolysis and VS conversion into VFAs. Furthermore, the AD process was stable in both digesters during the digestion period.
Co, Mo, Cu, and Zn were stable in both digesters, while the content of Fe and Ni reduced toward the end of the digestion. There was no direct relationship found between SMY and reduced content of TEs (Fe and Ni). Besides, the co-digestion of RS with CoM seems to be a good approach to provide TEs except for Se. There was a lack of Se, and its external supplementation may improve AD.
Further research should be focused on assessing bioavailable fractions of TEs and their impact on AD performance. Additionally, innovative loop digester technology should be applied for similar agricultural residues such as wheat and maize straw.

Author Contributions

Conceptualization, F.M.; methodology, F.M.; formal analysis, F.M.; resources, V.S.R., M.S.; data curation, F.M.; writing—original draft preparation, F.M.; writing—review and editing, A.F., O.C.L., M.S., V.S.R.; visualization, F.M., A.F.; supervision, V.S.R.; project administration, V.S.R.; funding acquisition, V.S.R. All authors have read and agreed to the published version of the manuscript.

Funding

Furqan Muhayodin is a doctoral student and funded by the Ministry of Higher Education Commission (HEC), Pakistan (SAP 50020935). This work was supported by the German Federal Ministry of Education and Research (BMBF) under the project “BIORIST”—A joint research project for innovative process technology for biogas production from rice straw (01LY1508A).

Institutional Review Board Statement

Not applicable.

Informed Consent Statement

Not applicable.

Acknowledgments

The authors extend their thanks and gratitude to Birgit Fischer for her technical support to analyze various samples in the lab during the experiments. We acknowledge support by the German Research Foundation and the Open Access Publication Fund of TU Berlin. Our sincere thanks to the two anonymous reviewers who provided critical constructive comments on the manuscript, which resulted in a significantly improved article.

Conflicts of Interest

The authors declare no conflict of interest.

Abbreviations

ADAnaerobic digestion
ADEAnaerobic digestion efficiency
BDLBelow detection limit
CoMCow manure
CSTRContinuously stirred tank reactors
FOS/TACRatio Flüchtige Organische Säuren/Totales Anorganisches Carbonat
ICP-OESInductively coupled plasma-optical emission spectroscopy
KPIKey performance indicators
LDLiquid digestate
OLROrganic loading rate (OLR)
RSRice straw
SDSolid digestate
SMYSpecific methane yield
TEsTrace elements
TMPTheoretical methane potential
TPADTemperature-phased anaerobic digestion
TSTotal solids
UMTUltrasound-mesophilic-thermophilic
VFAsVolatile fatty acids
VMPRVolumetric methane production rate
VSVolatile solids
XACrude ash
XFCrude fiber
XLCrude fat
XPCrude protein
XXNitrogen-free extracts

References

  1. FAOSTAT. Global Rice Production by Year. Food and Agriculture of the United Nations. Available online: http://faostat.fao.org (accessed on 19 March 2019).
  2. Sattar, A.; Arslan, C.; Ji, C.; Sattar, S.; Umair, M.; Zia Bakht, M. Quantification of temperature effect on batch production of bio-hydrogen from rice crop wastes in an anaerobic bio reactor. Int. J. Hydrog. Energy 2016, 41, 11050–11061. [Google Scholar] [CrossRef]
  3. Gadde, B.; Bonnet, S.; Menke, C.; Garivait, S. Air pollutant emissions from rice straw open field burning in India, Thailand and the Philippines. Environ. Pollut. 2009, 157, 1554–1558. [Google Scholar] [CrossRef]
  4. Glissmann, K.; Conrad, R. Fermentation pattern of methanogenic degradation of rice straw in anoxic paddy soil. FEMS Microbiol. Ecol. 2000, 31, 117–126. [Google Scholar] [CrossRef]
  5. Mussoline, W.; Esposito, G.; Lens, P.; Spagni, A.; Giordano, A. Enhanced methane production from rice straw co-digested with anaerobic sludge from pulp and paper mill treatment process. Bioresour. Technol. 2013, 148, 135–143. [Google Scholar] [CrossRef]
  6. Li, H.; Tan, F.; Ke, L.; Xia, D.; Wang, Y.; He, N.; Zheng, Y.; Li, Q. Mass balances and distributions of C, N, and P in the anaerobic digestion of different substrates and relationships between products and substrates. Chem. Eng. J. 2016, 287, 329–336. [Google Scholar] [CrossRef]
  7. Baserga, U. Landwirtschaftliche CO-Vergarungs-Biogasanlagen Biogas aus organischen Reststoffen und Energiegras. Forsch. Für Agrarwirtsch. Und Landtech. 1998, 1998, 1–11. [Google Scholar]
  8. Larsen, O.C.; Spahr, M.; Hoang, T.Q.T.; Fechter, L.; Rotter, V.S.; Fritze, A.; Linden, J. BioRist—Entwicklung und Integration eines innovativen Verfahrens zur Biogasherstellung aus Reisstroh in regionale Wertschöpfungsketten im ländlichen Raum in Südostasien unter Berücksichtigung nachhaltiger Entwicklung und Klimaschutz—Beispiel Vietnam; Technische Informationsbibliothek (TIB) Hannover: Hannover, Germany, 2019; Available online: http://live.icolor.vn/benvung/wp-content/uploads/2020/11/BioRist_2019_Final-report_GER.pdf (accessed on 29 April 2021).
  9. Mussoline, W.; Esposito, G.; Lens, P.; Garuti, G.; Giordano, A. Design considerations for a farm-scale biogas plant based on pilot-scale anaerobic digesters loaded with rice straw and piggery wastewater. Biomass Bioenergy 2012, 46, 469–478. [Google Scholar] [CrossRef]
  10. Lianhua, L.; Dong, L.; Yongming, S.; Longlong, M.; Zhenhong, Y.; Xiaoying, K. Effect of temperature and solid concentration on anaerobic digestion of rice straw in South China. Int. J. Hydrog. Energy 2010, 35, 7261–7266. [Google Scholar] [CrossRef]
  11. Contreras, L.M.; Schelle, H.; Sebrango, C.R.; Pereda, I. Methane potential and biodegradability of rice straw, rice husk and rice residues from the drying process. Water Sci. Technol. 2012, 65, 1142–1149. [Google Scholar] [CrossRef]
  12. Yu, Q.; Tian, Z.; Liu, J.; Zhou, J.; Yan, Z.; Yong, X.; Jia, H.; Wu, X.; Wei, P. Biogas Production and Microbial Community Dynamics during the Anaerobic Digestion of Rice Straw at 39–50 °C: A Pilot Study. Energy Fuels 2018, 32, 5157–5163. [Google Scholar] [CrossRef]
  13. Zhang, R.; Zhang, Z. Biogasification of rice straw with an anaerobic-phased solids digester system. Bioresour. Technol. 1999, 68, 235–245. [Google Scholar] [CrossRef]
  14. Ghosh, A.; Bhattacharyya, B.C. Biomethanation of white rotted and brown rotted rice straw. Bioprocess Eng. 1999, 20, 297–302. [Google Scholar] [CrossRef]
  15. He, Y.; Pang, Y.; Liu, Y.; Li, X.; Wang, K. Physicochemical Characterization of Rice Straw Pretreated with Sodium Hydroxide in the Solid State for Enhancing Biogas Production. Energy Fuels 2008, 22, 2775–2781. [Google Scholar] [CrossRef]
  16. Zhao, R.; Zhang, Z.; Zhang, R.; Li, M.; Lei, Z.; Utsumi, M.; Sugiura, N. Methane production from rice straw pretreated by a mixture of acetic-propionic acid. Bioresour. Technol. 2010, 101, 990–994. [Google Scholar] [CrossRef] [PubMed]
  17. Muhayodin, F.; Fritze, A.; Rotter, V.S. A Review on the Fate of Nutrients and Enhancement of Energy Recovery from Rice Straw through Anaerobic Digestion. Appl. Sci. 2020, 10, 2047. [Google Scholar] [CrossRef] [Green Version]
  18. CERT-Technical University of Berlin, Chair of Circular Economy and Recycling Technology. BioRist Project: Joint research Project for an Innovative Process Technology for Biogas Production from Rice Straw. Available online: http://www.biorist.tu-berlin.de (accessed on 10 March 2020).
  19. Sathish, S.; Chandrasekaran, M.; Parthiban, A. Effect of co-digestion agricultural-industrial residues: Various slurry temperatures. Int. J. Ambient Energy 2018, 39, 694–697. [Google Scholar] [CrossRef]
  20. Gavala, H.N.; Yenal, U.; Skiadas, I.V.; Westermann, P.; Ahring, B.K. Mesophilic and thermophilic anaerobic digestion of primary and secondary sludge. Effect of pre-treatment at elevated temperature. Water Res. 2003, 37, 4561–4572. [Google Scholar] [CrossRef]
  21. Appels, L.; Baeyens, J.; Degrève, J.; Dewil, R. Principles and potential of the anaerobic digestion of waste-activated sludge. Prog. Energy Combust. Sci. 2008, 34, 755–781. [Google Scholar] [CrossRef]
  22. Ge, H.; Jensen, P.D.; Batstone, D.J. Pre-treatment mechanisms during thermophilic-mesophilic temperature phased anaerobic digestion of primary sludge. Water Res. 2010, 44, 123–130. [Google Scholar] [CrossRef]
  23. Gianico, A.; Braguglia, C.M.; Gallipoli, A.; Mininni, G. Innovative two-stage mesophilic/thermophilic anaerobic degradation of sonicated sludge: Performances and energy balance. Environ. Sci. Pollut. Res. Int. 2015, 22, 7248–7256. [Google Scholar] [CrossRef]
  24. Han, Y.; Sung, S.; Dague, R.R. Temperature-phased anaerobic digestion of wastewater sludges. Water Sci. Technol. 1997, 36, 367–374. [Google Scholar] [CrossRef]
  25. Watts, S.; Hamilton, G.; Keller, J. Two-stage thermophilic-mesophilic anaerobic digestion of waste activated sludge from a biological nutrient removal plant. Water Sci. Technol. 2006, 53, 149–157. [Google Scholar] [CrossRef]
  26. Li, D.; Liu, S.; Mi, L.; Li, Z.; Yuan, Y.; Yan, Z.; Liu, X. Effects of feedstock ratio and organic loading rate on the anaerobic mesophilic co-digestion of rice straw and cow manure. Bioresour. Technol. 2015, 189, 319–326. [Google Scholar] [CrossRef] [PubMed]
  27. Li, D.; Liu, S.; Mi, L.; Li, Z.; Yuan, Y.; Yan, Z.; Liu, X. Effects of feedstock ratio and organic loading rate on the anaerobic mesophilic co-digestion of rice straw and pig manure. Bioresour. Technol. 2015, 187, 120–127. [Google Scholar] [CrossRef]
  28. Mei, Z.; Liu, X.; Huang, X.; Li, D.; Yan, Z.; Yuan, Y.; Huang, Y. Anaerobic Mesophilic Codigestion of Rice Straw and Chicken Manure: Effects of Organic Loading Rate on Process Stability and Performance. Appl. Biochem. Biotechnol. 2016, 179, 846–862. [Google Scholar] [CrossRef] [PubMed]
  29. Xu, R.; Zhang, K.; Liu, P.; Khan, A.; Xiong, J.; Tian, F.; Li, X. A critical review on the interaction of substrate nutrient balance and microbial community structure and function in anaerobic co-digestion. Bioresour. Technol. 2018, 247, 1119–1127. [Google Scholar] [CrossRef]
  30. Rabii, A.; Aldin, S.; Dahman, Y.; Elbeshbishy, E. A Review on Anaerobic Co-Digestion with a Focus on the Microbial Populations and the Effect of Multi-Stage Digester Configuration. Energies 2019, 12, 1106. [Google Scholar] [CrossRef] [Green Version]
  31. Demirel, B.; Scherer, P. Trace element requirements of agricultural biogas digesters during biological conversion of renewable biomass to methane. Biomass Bioenergy 2011, 35, 992–998. [Google Scholar] [CrossRef]
  32. Sahm, H. Biologie der Methan-Bildung (Biology of Methane Formation). Chem. Ing. Tech. 1981, 53, 854–863. [Google Scholar] [CrossRef]
  33. Takashima, M.; Speece, R.E.; Parkin, G.F. Mineral requirements for methane fermentation. Crit. Rev. Environ. Control 1990, 19, 465–479. [Google Scholar] [CrossRef]
  34. Mudrack, K.; Kunst, S. Biologie der Abwasserreinigung, 5th ed.; Spektrum Akademischer Verlag: Heidelberg/Berlin, Germany, 2003. [Google Scholar]
  35. Kloss, R. Planung von Biogasanlagen Nach Technischwirtschaftlichen Kriterien; R. Oldenbourg Verlag: München, Austria, 1986. [Google Scholar]
  36. Chen, Y.; Cheng, J.J.; Creamer, K.S. Inhibition of anaerobic digestion process: A review. Bioresour. Technol. 2008, 99, 4044–4064. [Google Scholar] [CrossRef]
  37. Mancini, G.; Papirio, S.; Riccardelli, G.; Lens, P.N.L.; Esposito, G. Trace elements dosing and alkaline pretreatment in the anaerobic digestion of rice straw. Bioresour. Technol. 2018, 247, 897–903. [Google Scholar] [CrossRef] [PubMed]
  38. Cai, Y.; Zhao, X.; Zhao, Y.; Wang, H.; Yuan, X.; Zhu, W.; Cui, Z.; Wang, X. Optimization of Fe2+ supplement in anaerobic digestion accounting for the Fe-bioavailability. Bioresour. Technol. 2018, 250, 163–170. [Google Scholar] [CrossRef] [PubMed]
  39. Verband Deutscher Landwirtschaftlicher Untersuchungs- und Forschungsanstalten. 125 Jahre Verband Deutscher Landwirtschaftlicher Untersuchungs- und Forschungsanstalten e.V: Eine Dokumentation; VDLUFA-Verl.: Darmstadt, Germany, 2013; ISBN 9783941273146. [Google Scholar]
  40. Siwek, H.; Włodarczyk, M.; Możdżer, E.; Bury, M.; Kitczak, T. Chemical Composition and Biogas Formation potential of Sida hermaphrodita and Silphium perfoliatum. Appl. Sci. 2019, 9, 4016. [Google Scholar] [CrossRef] [Green Version]
  41. Lossie, U.; Pütz, P. Targeted Control of Biogas Plants with the Help of FOS/TAC. Practice Report. Hach-Lange. Available online: http://it.hach.com (accessed on 1 April 2020).
  42. VDI-Gesellschaft Energietechhnik. Vergärung Organischer Stoffe (Fermentation of Organic Materials) VDI-Richtlinie 4630; VDI-Handbuch Energietechnik: Düsseldorf, Germany, 2006. [Google Scholar]
  43. Flachowsky, G. Stroh als Futtermittel: Ergebnisse und Erfahrungen bei der Strohaufbereitung und Beim Einsatz von Unterschiedlich Behandeltem Stroh als Futtermittel; VEB: Berlin, Germany, 1987. [Google Scholar]
  44. Buswell, A.M.; Mueller, H.F. Mechanism of methane fermentation. Ind. Eng. Chem. 1952, 44, 550–552. [Google Scholar] [CrossRef]
  45. Zeb, I.; Ma, J.; Frear, C.; Zhao, Q.; Ndegwa, P.; Yao, Y.; Kafle, G.K. Recycling separated liquid-effluent to dilute feedstock in anaerobic digestion of dairy manure. Energy 2017, 119, 1144–1151. [Google Scholar] [CrossRef] [Green Version]
  46. Amon, T.; Amon, B.; Kryvoruchko, V.; Machmüller, A.; Hopfner-Sixt, K.; Bodiroza, V.; Hrbek, R.; Friedel, J.; Pötsch, E.; Wagentristl, H.; et al. Methane production through anaerobic digestion of various energy crops grown in sustainable crop rotations. Bioresour. Technol. 2007, 98, 3204–3212. [Google Scholar] [CrossRef] [PubMed]
  47. Speckmaier, M.; Schlattmann, M.; Metzner, T.; Freising, A.G. Determining Biogas Yields from Co-Substrates in Semi-Continuously Operated Laboratory-Scale Digesters. Landtechnik 2005, 60, 340–341. [Google Scholar]
  48. Mittweg, G.; Oechsner, H.; Hahn, V.; Lemmer, A.; Reinhardt-Hanisch, A. Repeatability of a laboratory batch method to determine the specific biogas and methane yields. Eng. Life Sci. 2012, 12, 270–278. [Google Scholar] [CrossRef]
  49. Shi, X.S.; Dong, J.J.; Yu, J.H.; Yin, H.; Hu, S.M.; Huang, S.X.; Yuan, X.Z. Effect of Hydraulic Retention Time on Anaerobic Digestion of Wheat Straw in the Semicontinuous Continuous Stirred-Tank Reactors. Biomed Res. Int. 2017, 2017, 2457805. [Google Scholar] [CrossRef]
  50. Li, Y.; Park, S.Y.; Zhu, J. Solid-state anaerobic digestion for methane production from organic waste. Renew. Sustain. Energy Rev. 2011, 15, 821–826. [Google Scholar] [CrossRef]
  51. Andey, W.S.; Rivard, C.J.; Shiang, M.; Himmel, M.E. Anaerobic digestion of lignocellulosic biomass and wastes. Appl. Biochem. Biotechnol. 1991, 30, 165–183. [Google Scholar]
  52. Pezzolla, D.; Di Maria, F.; Zadra, C.; Massaccesi, L.; Sordi, A.; Gigliotti, G. Optimization of solid-state anaerobic digestion through the percolate recirculation. Biomass Bioenergy 2017, 96, 112–118. [Google Scholar] [CrossRef]
  53. Wan, C.; Zhou, Q.; Fu, G.; Li, Y. Semi-continuous anaerobic co-digestion of thickened waste activated sludge and fat, oil and grease. Waste Manag. 2011, 31, 1752–1758. [Google Scholar] [CrossRef] [PubMed]
  54. Leitfaden Biogas Von der Gewinnung zur Nutzung; 7. Auflage; Fachagentur Nachwachsende Rohstoffe; Deutsches Biomasse Forschungs Zentrum; Kuratorium für Technik und Bauwesen in der Landwirtschaft; Institut für Agrartechnologie und Biosystemtechnik; Druckerei Weidner: Rostock, Germany, 2016; ISBN 3000143335.
  55. Benabdallah El Hadj, T.; Astals, S.; Galí, A.; Mace, S.; Mata-Alvarez, J. Ammonia influence in anaerobic digestion of OFMSW. Water Sci. Technol. 2009, 59, 1153–1158. [Google Scholar] [CrossRef] [PubMed]
  56. Schattauer, A.; Abdoun, E.; Weiland, P.; Plöchl, M.; Heiermann, M. Abundance of trace elements in demonstration biogas plants. Biosyst. Eng. 2011, 108, 57–65. [Google Scholar] [CrossRef]
  57. Möller, K.; Müller, T. Effects of anaerobic digestion on digestate nutrient availability and crop growth: A review. Eng. Life Sci. 2012, 12, 242–257. [Google Scholar] [CrossRef]
  58. Mähnert, P. Kinetik der Biogasproduktion aus Nachwachsenden Rohstoffen und Gülle. Ph.D. Thesis, Humboldt-Universität zu Berlin, Berlin, Germany, 28 May 2007. [Google Scholar]
  59. González-Suárez, A.; Pereda-Reyes, I.; Oliva-Merencio, D.; Suárez-Quiñones, T.; José da Silva, A.; Zaiat, M. Bioavailability and dosing strategies of mineral in anaerobic mono-digestion of maize straw. Eng. Life Sci. 2018, 18, 562–569. [Google Scholar] [CrossRef]
  60. Lindorfer, H.; Ramhold, D.; Frauz, B. Nutrient and trace element supply in anaerobic digestion plants and effect of trace element application. Water Sci. Technol. 2012, 66, 1923–1929. [Google Scholar] [CrossRef]
  61. Pobeheim, H.; Munk, B.; Lindorfer, H.; Guebitz, G.M. Impact of nickel and cobalt on biogas production and process stability during semi-continuous anaerobic fermentation of a model substrate for maize silage. Water Res. 2011, 45, 781–787. [Google Scholar] [CrossRef]
  62. Ariunbaatar, J.; Esposito, G.; Yeh, D.H.; Lens, P.L.N. Enhanced Anaerobic Digestion of Food Waste by Supplementing Trace Elements: Role of Selenium (VI) and Iron (II). Front. Environ. Sci. 2016, 4, 142. [Google Scholar] [CrossRef] [Green Version]
  63. Bischofsberger, W.; Dichtl, N.; Rosenwinkel, K.H.; Seyfried, C.F.; Böhnke, B. Anaerobtechnik, 2nd ed.; Springer: Berlin, Germany, 2005. [Google Scholar]
Figure 1. Schematic diagram of the experimental setup with a recycling of liquid digestate; RS, Rice straw; CoM, Cow manure; F1.1 and F1.2, Loop digester; F2, Reference digester; LD, Liquid digestate; SD, Solid digestate.
Energies 14 02561 g001
Figure 2. (a) Specific methane yield of RS from F1 and F2. (b) arithmetic mean and standard deviation of the population (n = 314), indicated as error bars of 37.1 and 35.6 for F1 and F2 respectively. RS, Rice straw; tHR1,2,3, Hydraulic retention time (35, 50, 40 d).
Energies 14 02561 g002
Figure 3. (a) Anaerobic digestion efficiency of RS from F1 and F2. (b) Arithmetic mean and standard deviation of the population (n = 314), indicated as error bars of 20 and 20 for F1 and F2 respectively; tHR1,2,3, Hydraulic retention time (35, 50, 40 d).
Energies 14 02561 g003
Figure 4. (a) Volumetric methane production rate of RS from F1 and F2. (b) Arithmetic mean and standard deviation of the population (n = 314), indicated as error bars of 0.18 and 0.17 for F1 and F2 respectively; RS, Rice straw; tHR1,2,3, Hydraulic retention time (35, 50, 40 d).
Energies 14 02561 g004
Figure 5. (a) pH in F1 and F2 (b) Arithmetic mean and standard deviation of the population (n = 314), indicated as error bars of 0.13 and 0.13 for F1 and F2 respectively; tHR1,2,3, Hydraulic retention time (35, 50, 40 d).
Energies 14 02561 g005
Figure 6. (a) FOS/TAC and NH4+ in F1 and F2 (b) Arithmetic mean and standard deviation of the population, indicated as error bars with 0.15 and 0.22 for F1 and F2 for NH4+ (n = 37) and with 0.06 and 0.05 for F1 and F2 for FOS/TAC (n = 34) respectively. tHR1,2,3, Hydraulic retention time (35, 50, 40 d).
Energies 14 02561 g006
Figure 7. Trace elements in F1 over time. TEs, Trace elements.
Energies 14 02561 g007
Figure 8. Trace elements in F2 over time. TEs, Trace elements.
Energies 14 02561 g008
Table 1. CoM used during the experiment.
DigesterExperimental DayCoM
F1 and F21 to 50CoM1
51 to 172CoM2
173 to 245CoM3
246 to 314CoM4
CoM1,2,3,4, Cow manure in four sets.
Table 2. The values represent the arithmetic mean (Avg) with the range (min/max) of double or triple determination. The parameters with a single value have been received from an external lab.
ParameterRS
Avg (Min/Max)
CoM1
Avg (Min/Max)
CoM2
Avg (Min/Max)
CoM3
Avg (Min/Max)
CoM4
Avg (Min/Max)
TS (%)89.7 (89.6/89.8)5.8 (5.6/6.1)7.8 (7.8/7.9)8.4 (8.1/8.6)8.6 (8.6/8.6)
VS (% of TS)84.6 (84.6/84.6)75.0 (74.6/75.5)78.0 (78.0/78.0)75.4 (74.9/76.0)75.1 (74.9/75.4)
x_C (% of TS)40.9 (40.9/40.9)39.5 (39.4/39.6)40.4 (40.4/40.4)40.8 (40.6/41.1)40.8 (40.6/41.0)
x_N (% of TS)0.82 (0.82/0.83)1.82 (1.75/1.88)1.95 (1.93/1.97)2.24 (2.22/2.27)1.78 (1.77/1.80)
C/N_Calculated49.6 (49.4/49.8)21.8 (21.1/22.5)20.7 (20.5/20.9)18.2 (17.9/18.5)22.9 (22.5/23.2)
x_XP (% of TS)3.9NA19.422.721.5
x_XF (% of TS)38.3NA17.926.117.4
x_XL (% of TS)0.5NA2.92.22.3
x_XA (% of TS)15.8NA22.323.824.5
Fe (mg/kg TS)265 (262/267)NANA1115 (1058/1172)1431 (1382/1480)
Ni (mg/kg TS)1.69 (1.41/1.96)NANA2.62 (2.55/2.69)2.85 (2.84/2.86)
Co (mg/kg TS)0.59 (0.58/0.60)NANA0.88 (0.77/1.03)1.15 (1.12/1.18)
Mo (mg/kg TS)1.10 (1.08/1.11)NANA1.26 (1.23/1.29)1.16 (-/-)
Cu (mg/kg TS)NANANANA72.9 (70.8/75.1)
Zn (mg/kg TS)NANANANA296 (288/303)
Se (mg/kg TS)BDLBDLBDLBDLBDL
RS, Rice straw; CoM1,2,3,4, Cow manure in four sets; TS, Total solids; VS, Volatile solids; x, Mass fractions; XP, Crude protein; XF, Crude fiber; XL, Crude fat; XA, Crude ash; NA, Not analyzed; BDL, Below detection limit.
Table 3. OLR and tHR during the experiment.
DigesterExperimental DayOLR (g VS L−1 d−1)tHR (Days)
F1 and F21 to 503.435
51 to 953.250
96 to 3144.340
OLR, Organic loading rate; tHR, Hydraulic retention time.
Table 4. Status of TEs in F1 and F2. Average (arithmetic mean) of 15 values with standard deviation (±).
F1F2
TEsmg/L
Co0.16 ± 0.00.19 ± 0.0
Cu5.24 ± 0.44.81 ± 0.5
Fe258.2 ± 31.7242.0 ± 27.6
Mo0.31 ± 0.10.97 ± 0.1
Ni0.74 ± 0.14.20 ± 0.5
Zn27.46 ± 1.624.52 ± 2.4
SeBDLBDL
TEs, Trace elements; BDL, below detection limit.
Table 5. Recommended concentrations of TEs in the AD process.
TEsSahm [32]Takashima et al. [33]Mudrack et al. [34]Bischofsberger et al. [63] (Cited Sahm [32])Kloss [35]
mg/L
Co0.06>0.00059–0.120.003–0.060.060.5–20
Cu0.06–64----
Fe->0.28–50.41–10-10–200
Mo0.05>0.00096–0.0480.005–0.050.050.1–0.35
Ni0.0060.0059–50.005–0.50.0060.5–30
Zn-----
Se0.0080.079–0.79-0.0080.1–0.35
AD, Anaerobic digestion; TEs, Trace elements.
Publisher’s Note: MDPI stays neutral with regard to jurisdictional claims in published maps and institutional affiliations.

