
Inter-Provincial Power Transmission and Its Embodied Carbon Flow in China: Uneven Green Energy Transition Road to East and West


1
Institute of Geographic Sciences and Nature Resources Research, Chinese Academy of Sciences, Beijing 100101, China
2
College of Resources and Environment, University of Chinese Academy of Sciences, Beijing 100042, China
Energies 2022, 15(1), 176; https://0-doi-org.brum.beds.ac.uk/10.3390/en15010176
Submission received: 6 December 2021
/
Revised: 23 December 2021
/
Accepted: 24 December 2021
/
Published: 28 December 2021
(This article belongs to the Special Issue Climate Change and Sustainable Energy Transition)
Abstract
:Inter-provincial power transmission in China solved the problem of electricity production and consumption spatial mismatch, which also facilitated Chinese green energy transition and sustainable development. Aiming to understand the spatial patterns and main driving factors, this paper accounted the aggregate carbon intensity per electricity produced by each province, built the inter-provincial Out–Destination matrixes of carbon emission embodied in power transmission among 27 provincial areas of 2006 and 2019, and quantitatively analyzed the change in spatial patterns of carbon flow and carbon intensity difference between power inward and outward provinces. We found that the inter-provincial power transmission has led to the reduction in the national average carbon intensity per electricity produced from 0.855 kg/kWh in 2006 to 0.628 kg/kWh in 2019 and the green energy transition of all provinces. The spatial morphology characteristics of carbon flow show the ‘three corridors of West-East Power Transmission (WEPT)’ pattern, in which power is transmitted from some main thermal power-dominated provinces in central and north-west China to the eastern coastal provinces. Further, it resulted in the carbon leakage from electricity consumption of the coastal provinces and carbon overload of the hinterland provinces. Despite natural resource endowment, the location of the provinces in the national power grid, the national low-carbon energy transition strategy, as well as advances in long-distance ultra-high-voltage power transmission technologies were the main factors to the formation and evolution of Chinese electricity green transition.
1. Introduction
As the world’s largest electricity producer and consumer, China is facing a serious spatial imbalance of electricity supply and demand. Most of its energy resources, including coal, hydropower, wind, and solar power, are located in the hinterland provinces, while the load centers are mainly located in the eastern and southern coastal provinces [1,2,3]. Thus, a significant amount of interprovincial power transmission and trade is occurring to meet a spatial supply–demand imbalance, known as the West-East Power Transmission (WEPT) [4]. China is also the country with the highest carbon dioxide (CO2) emissions, with coal-fired thermal power generation accounting for over 50% of the total electricity generation [5]. Fossil power plant fleets emit vast amounts of air pollutants, such as CO2, sulfur dioxide (SO2), nitrogen oxide (NOx), and atmospheric inhalable particulate matter (PMx), which also pose human health risks [6,7,8]. China has taken several measures and policies to curb its fast–growing coal consumption and carbon emission since the 11th Five-year Plan (2006–2010) [9]. In 2020, China’s central government put forward targets to reach a carbon peak by 2030 and achieve carbon neutrality by 2060 [10,11,12]. In addition to promoting various low-carbon generation technologies (e.g., carbon capture and storage technologies), the Chinese government has also focused on raising the proportion of non-fossil energy and building a nationwide super grid to facilitate the development of clean energies such as hydro, wind, and solar power in the western hinterland provinces, from where it would be transmitted to the eastern coastal provinces to substitute for coal-fired generation [13,14,15]. Hence, inter-provincial power transmission is not only a measure to optimize the allocation of resources, but also the main measure for China’s green energy transition strategy implementation and relevant for several Sustainable Development Goals (SDGs) [16].
Since inter-regional power transmission results largely from a spatial imbalance between electricity supply and demand, existing studies have focused on descriptions of the transportation distribution; for example, the changing geography of electricity generation, transmission, and distribution of generating facilities [17,18]. As for Chinese WEPT, several scholars have explored its evolution, potential, economic and energy transition impact [2,7,19]. Given the high proportion of electricity in national carbon emissions, the decarbonization of the electricity sector has also become a popular research topic in recent years [15]. However, most studies have focused on analyzing the low carbon effects of the generation side and the demand side [20,21]. Few studies have explored the role of the inter-regional transmission grid [13,22]. Some scholars have focused attention on the forecasting of carbon reduction through inter-regional power transmission using a multi-regional optimizing model [15,23,24,25,26]. However, these studies barely touch on spatial features and the influential factors of the green transition process. Furthermore, few studies have focused on the province level, even though the province is the basic unit for Chinese CO2 reduction target planning and accounting.
In contrast to the perspective of energy economics, geographers pay more attention to the spatial pattern of the energy distribution and connections. Geographers do not think of space as the container of social life, but rather as constructed by social life [27]. This means that space is actively produced through the processes of connectivity, proximity, and differentiation and can be thought of as relationships that comprise multiple coexisting configurations and future possibilities. From a geographic perspective, energy production and the energy network between different regions are not just issues of resource development and consumption, but are the mixed product of social, political, environmental, and economic relations, with their scale, geographical reach, and functionality shaped by the prevailing distribution of social power and desire [17,18,28,29]. In modern China, power generation and transmission are important parts of energy security and are subsumed under China’s national plan and control. Further, in view of the growing concerns around air pollution and CO2 emissions, the government has formulated various policies on “green” electricity production and consumption, which have an impact on spatial locations and connections in electricity geography [30,31]. Thus, the underlying nature of power transmission and the power fuel mixed with varying endowments is not only a comprehensive reflection of the relationships between China’s different regions in terms of electricity production and consumption, but also a reflection of the country’s strategic thinking on regional energy balance, security guarantees, and green development.
In this study, the spatial characteristics of CO2 embodied in inter-provincial power transmission are investigated by building an inter-provincial power transmission out–destination matrix and calculating the aggregate carbon intensity per electricity produced by power source province. Then, the main factors driving the formation and differences of CO2 transmission spatial patterns are discussed. Compared to relative studies, this study faces several challenges, including building the inter-provincial power transmission matrix, accounting for the CO2 embodied in the power transmission matrix, and quantitatively exploring the different impacts of power transmission on provincial energy transition. This study overcame these challenges by integrating multi-source data, interviewing relative agents, and reviewing relative literature. Its contribution is threefold. First, despite energy communities concerning the decarbonization of electricity production and consumption, this study built the inter-provincial power transmission matrix and accounted the CO2 embodied in each inter-provincial power transmission line quantitatively. Second, this paper designed aggregate carbon intensity (ACI) per electricity produced and consumed, aiming to find the different impacts of Chinese energy green transition on different provinces. Furthermore, the CO2 embodied in power transmission was taken into consideration and the material and accounted ACI per electricity consumed were compared, deepening the research on electricity consumption carbon emissions. Third, the main factors from the energy transition, particularly with a territoriality and scaling lens, were discussed. The author expected this study could offer new insights on the research of Chinese energy green transition process and patterns, and facilitate the optimization of the sustainable development policy of China.
2. Methods and Materials
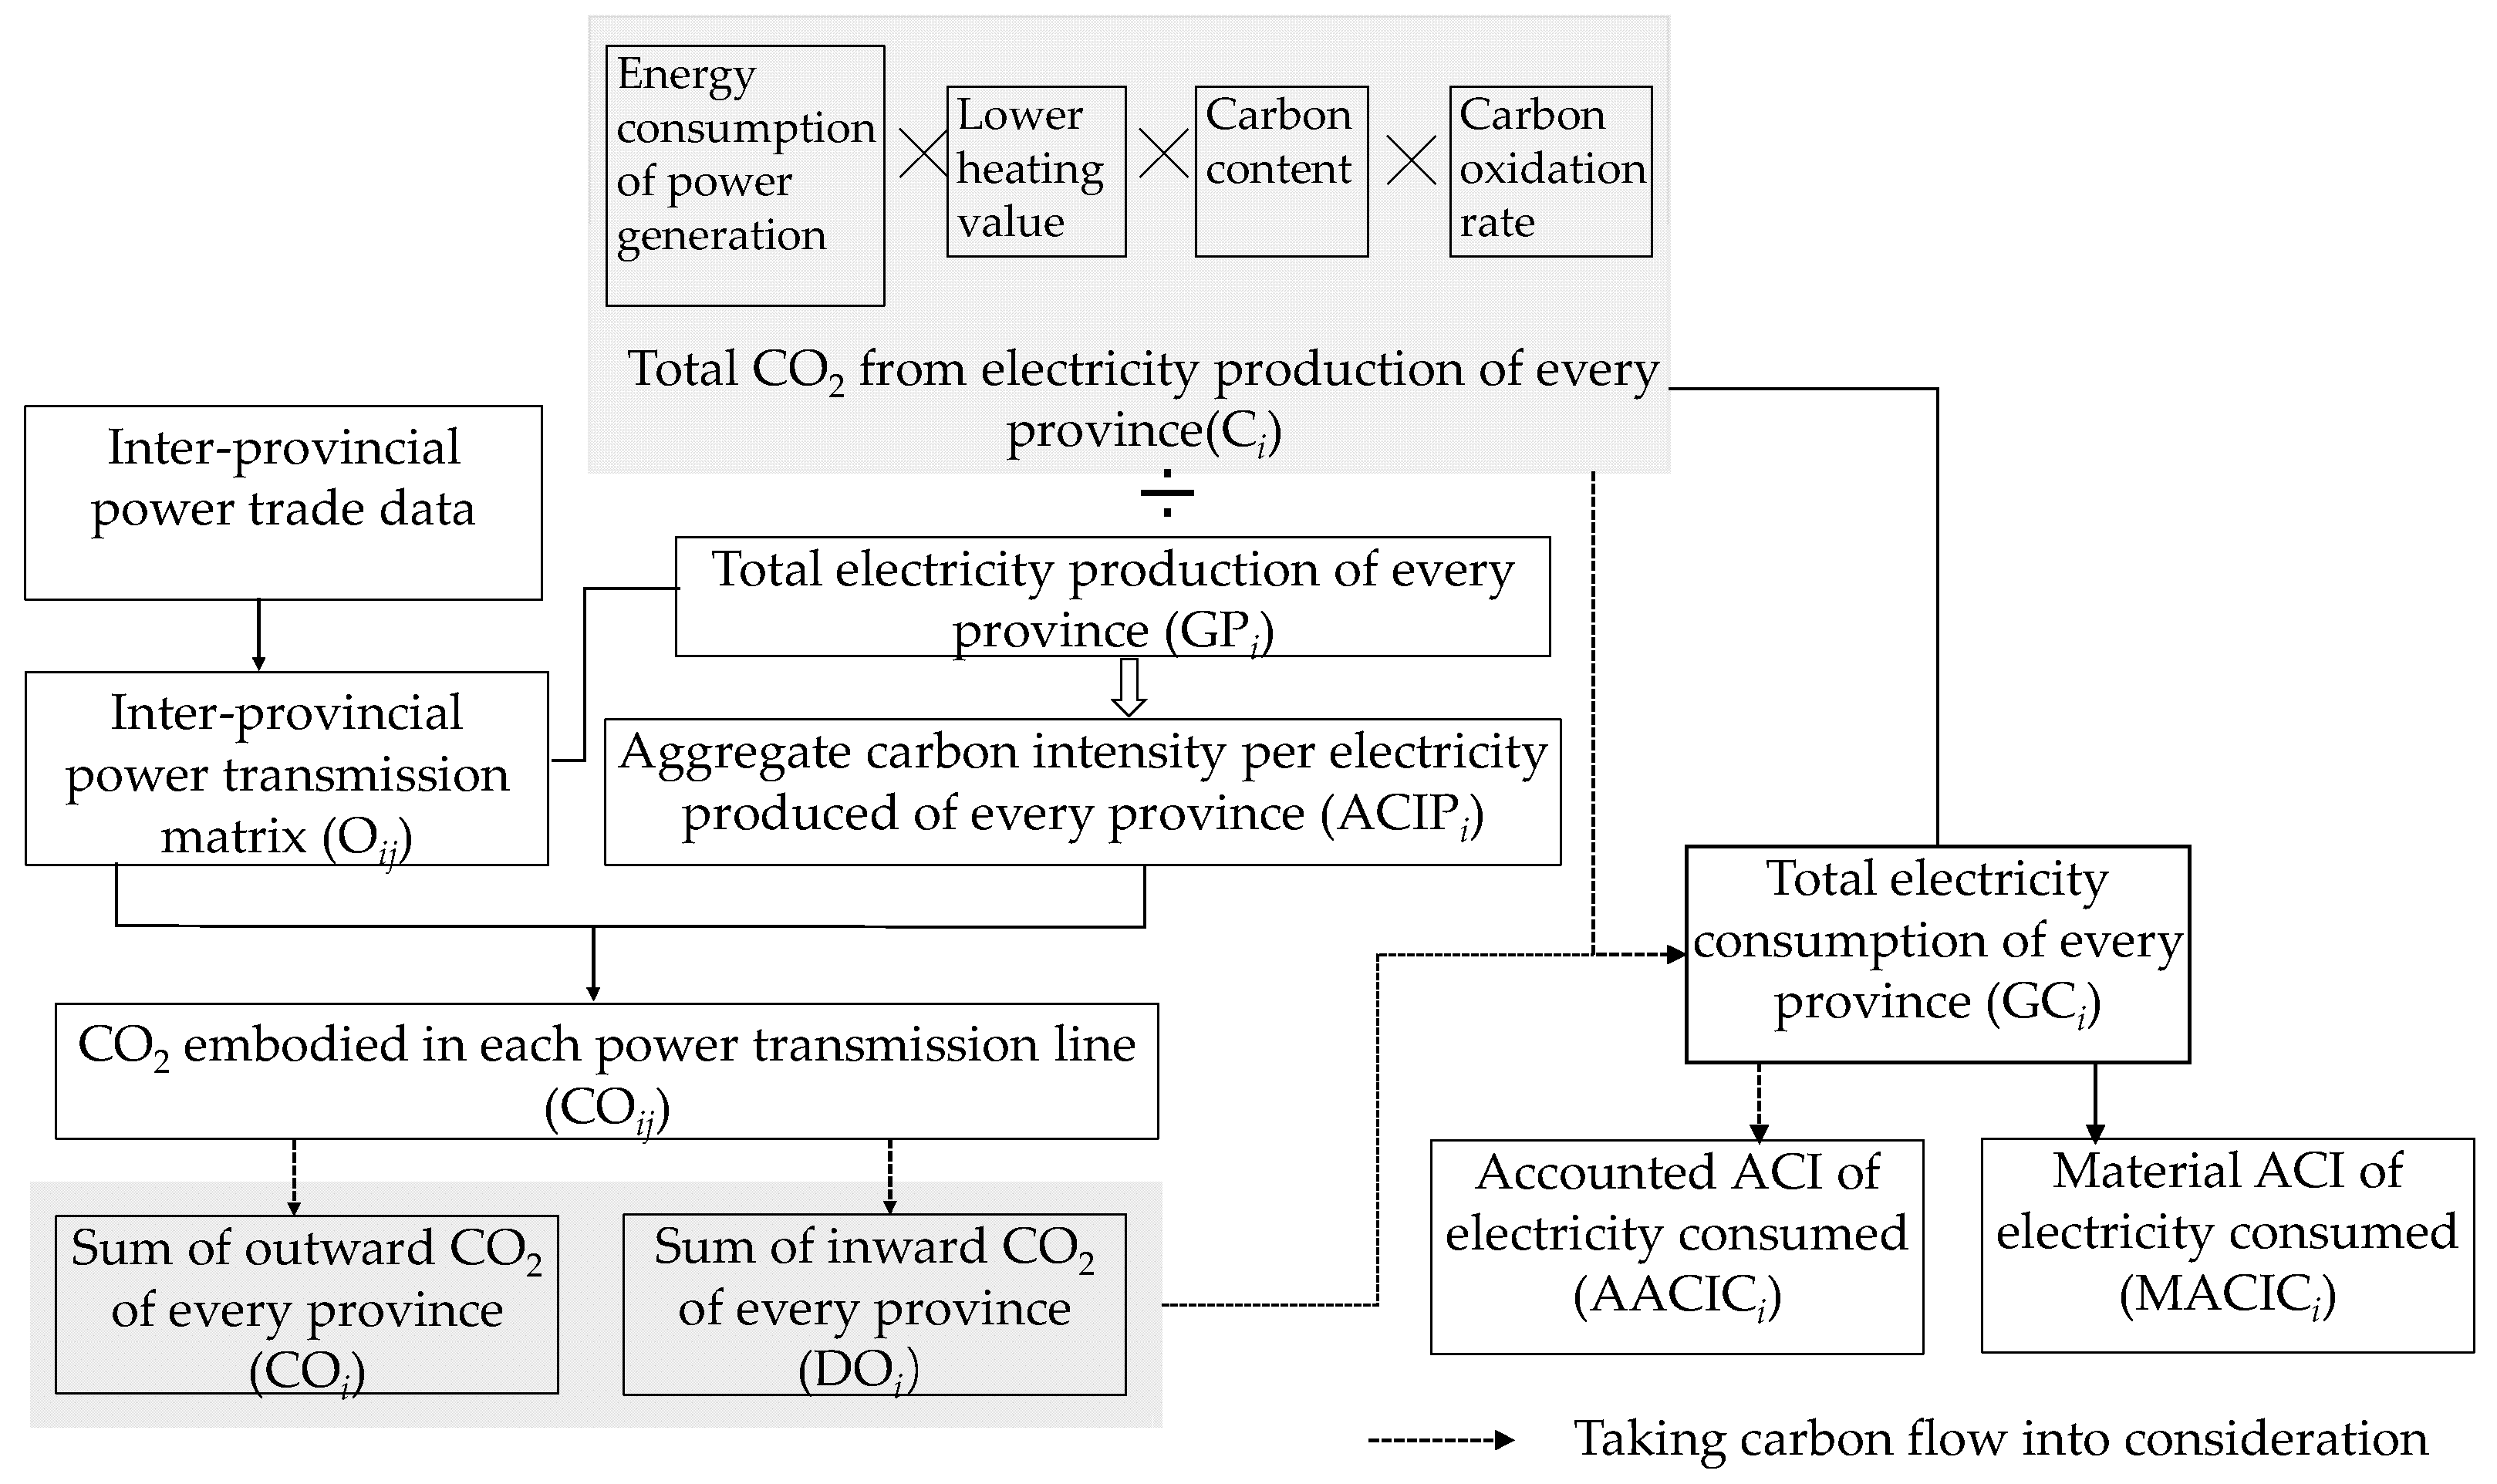
To analyze the CO2 embodied in the inter-provincial power transmission, the interprovincial power flow matrix must first be established, and the CO2 load on each line must be obtained. To this end, we must calculate the Aggregate Carbon Intensity per unit of electricity Produced (ACIP) in the province where the electricity flows out. The analysis scheme of this article is shown in the Figure 1.
2.1. Inter-Provincial Power Transmission Matrix
The power systems of the Chinese mainland are managed by two huge state-owned enterprises: The State Power Grid Corporation of China (SGCC) and the China Southern Power Grid (CSG). Although there is no published inter-provincial electricity out–destination matrix, the SGCC and CSG publish annual reports on inter-provincial electricity trade that provide detailed information on every inter-provincial power transmission line. Furthermore, because the earliest available data are from 2006 and the latest available data are from 2019, this paper took data from these two years as the research object.
Because some province pairs have more than one line, the amount of power transmission from one province to another should be the sum of the trading volume of all lines between them. By calculating all point-to-point electricity trade data of every province pair, we can build the inter-provincial electricity out–destination matrix:
In this table, refers to the electricity of area i flowing to area j, and it is also the electricity of area j accepting from area i. For n provinces, the total outward electricity flow of area i is , and there is The total inward electricity flow of area j is , and there is . According to electricity balance, there is .
2.2. CO2 Emissions Embodied in Electricity Transmission
There are several forms of power production in China, such as thermal, hydro, wind, solar, and nuclear power generation. Following the Intergovernmental Panel on Climate Change method [32], the total CO2 emissions from electricity production of province i in a year, is estimated by
where denotes energy consumption of province i based on fuel type k. ,, and are, respectively, the lower heating value, carbon content, and carbon oxidation rate of each type of fossil fuel k (Table 1). This study assumes that the same type of fossil fuel has the same lower heating value and carbon content in each province. In reality, these coefficients may differ based on their quality.
As shown in Table 1, it can be found that only thermal power generation using fossil fuels emits CO2, while hydro, nuclear, wind, and solar power generation, which are included in other energy, do not. To offer insights into how differences in fuels and installation structure affect provincial electricity CO2 emissions, this paper uses the aggregate carbon intensity per electricity produced () as indicator. This is defined as the ratio of total CO2 emissions from regional power generation () to the total electricity production () of province i and is expressed in kilograms of CO2 emissions per kilowatt-hours (kg/kWh) [35]. It can be shown as:
As for the carbon emission embodied in the electricity flow from province i to j,, it is the product of size of flow () and of source province:
By summing the amount of CO2 embodied in every out–forward transmission line of every source province, the amount of the CO2 overload,, can be calculated, which represents the CO2 emitted from electricity production in one province that is consumed in other provinces. It can be expressed as:
By summing all the CO2 embodied in inward power transmission, this study calculates the amount of CO2 leaked in every sink province,, which represents a province that imported electricity without emitting CO2. It can be expressed as:
In order to compare the impact of interprovincial power transmission to the CO2 load of power source and sink provinces, the aggregate carbon intensity of electricity consumed (ACIC) was accounted. There are two measures of ACIC. One is the ratio of total CO2 emitted by local power generation () to the amount of electricity really consumed (), which is the material aggregate carbon intensity of electricity consumed (), expressed as:
The other is the carbon intensity considering the CO2 embodied in the power transmission, which is defined as the ratio of the net CO2 emissions of production plus imports and minus exports to the amount of electricity really consumed (). It represents the accounted aggregate carbon intensity of electricity consumed (), expressed as:
If , the province i could be defined as a carbon overload province because it bears more CO2 emission from electricity production which is not really consumed locally. Otherwise, the province with is defined as a carbon leakage province because it bears fewer CO2 emissions from electricity production which is not produced locally.
2.3. Research Subject and Data Source
Limited by data availability, this study took mainland China’s 31 provincial-level administrative units, except for Hong Kong, Macao, and Taiwan, as research subjects. However, minor adjustments were made based on the spatial division of China’s power grids. In the North China Power Grid, the Beijing–Tianjin–Hebei region is divided into the Beijing–Tianjin–Tangshan Power Grid and the Southern Hebei Power Grid [36,37]. This division does not coincide with provincial boundaries, so this study merged them into one research unit. In addition, this study merged Jiangsu, Zhejiang, and Shanghai into one unit due to their close power connection. Therefore, there are 27 spatial units in this study.
3. Results
3.1. Huge Size of Inter-Provincial Power Transmission
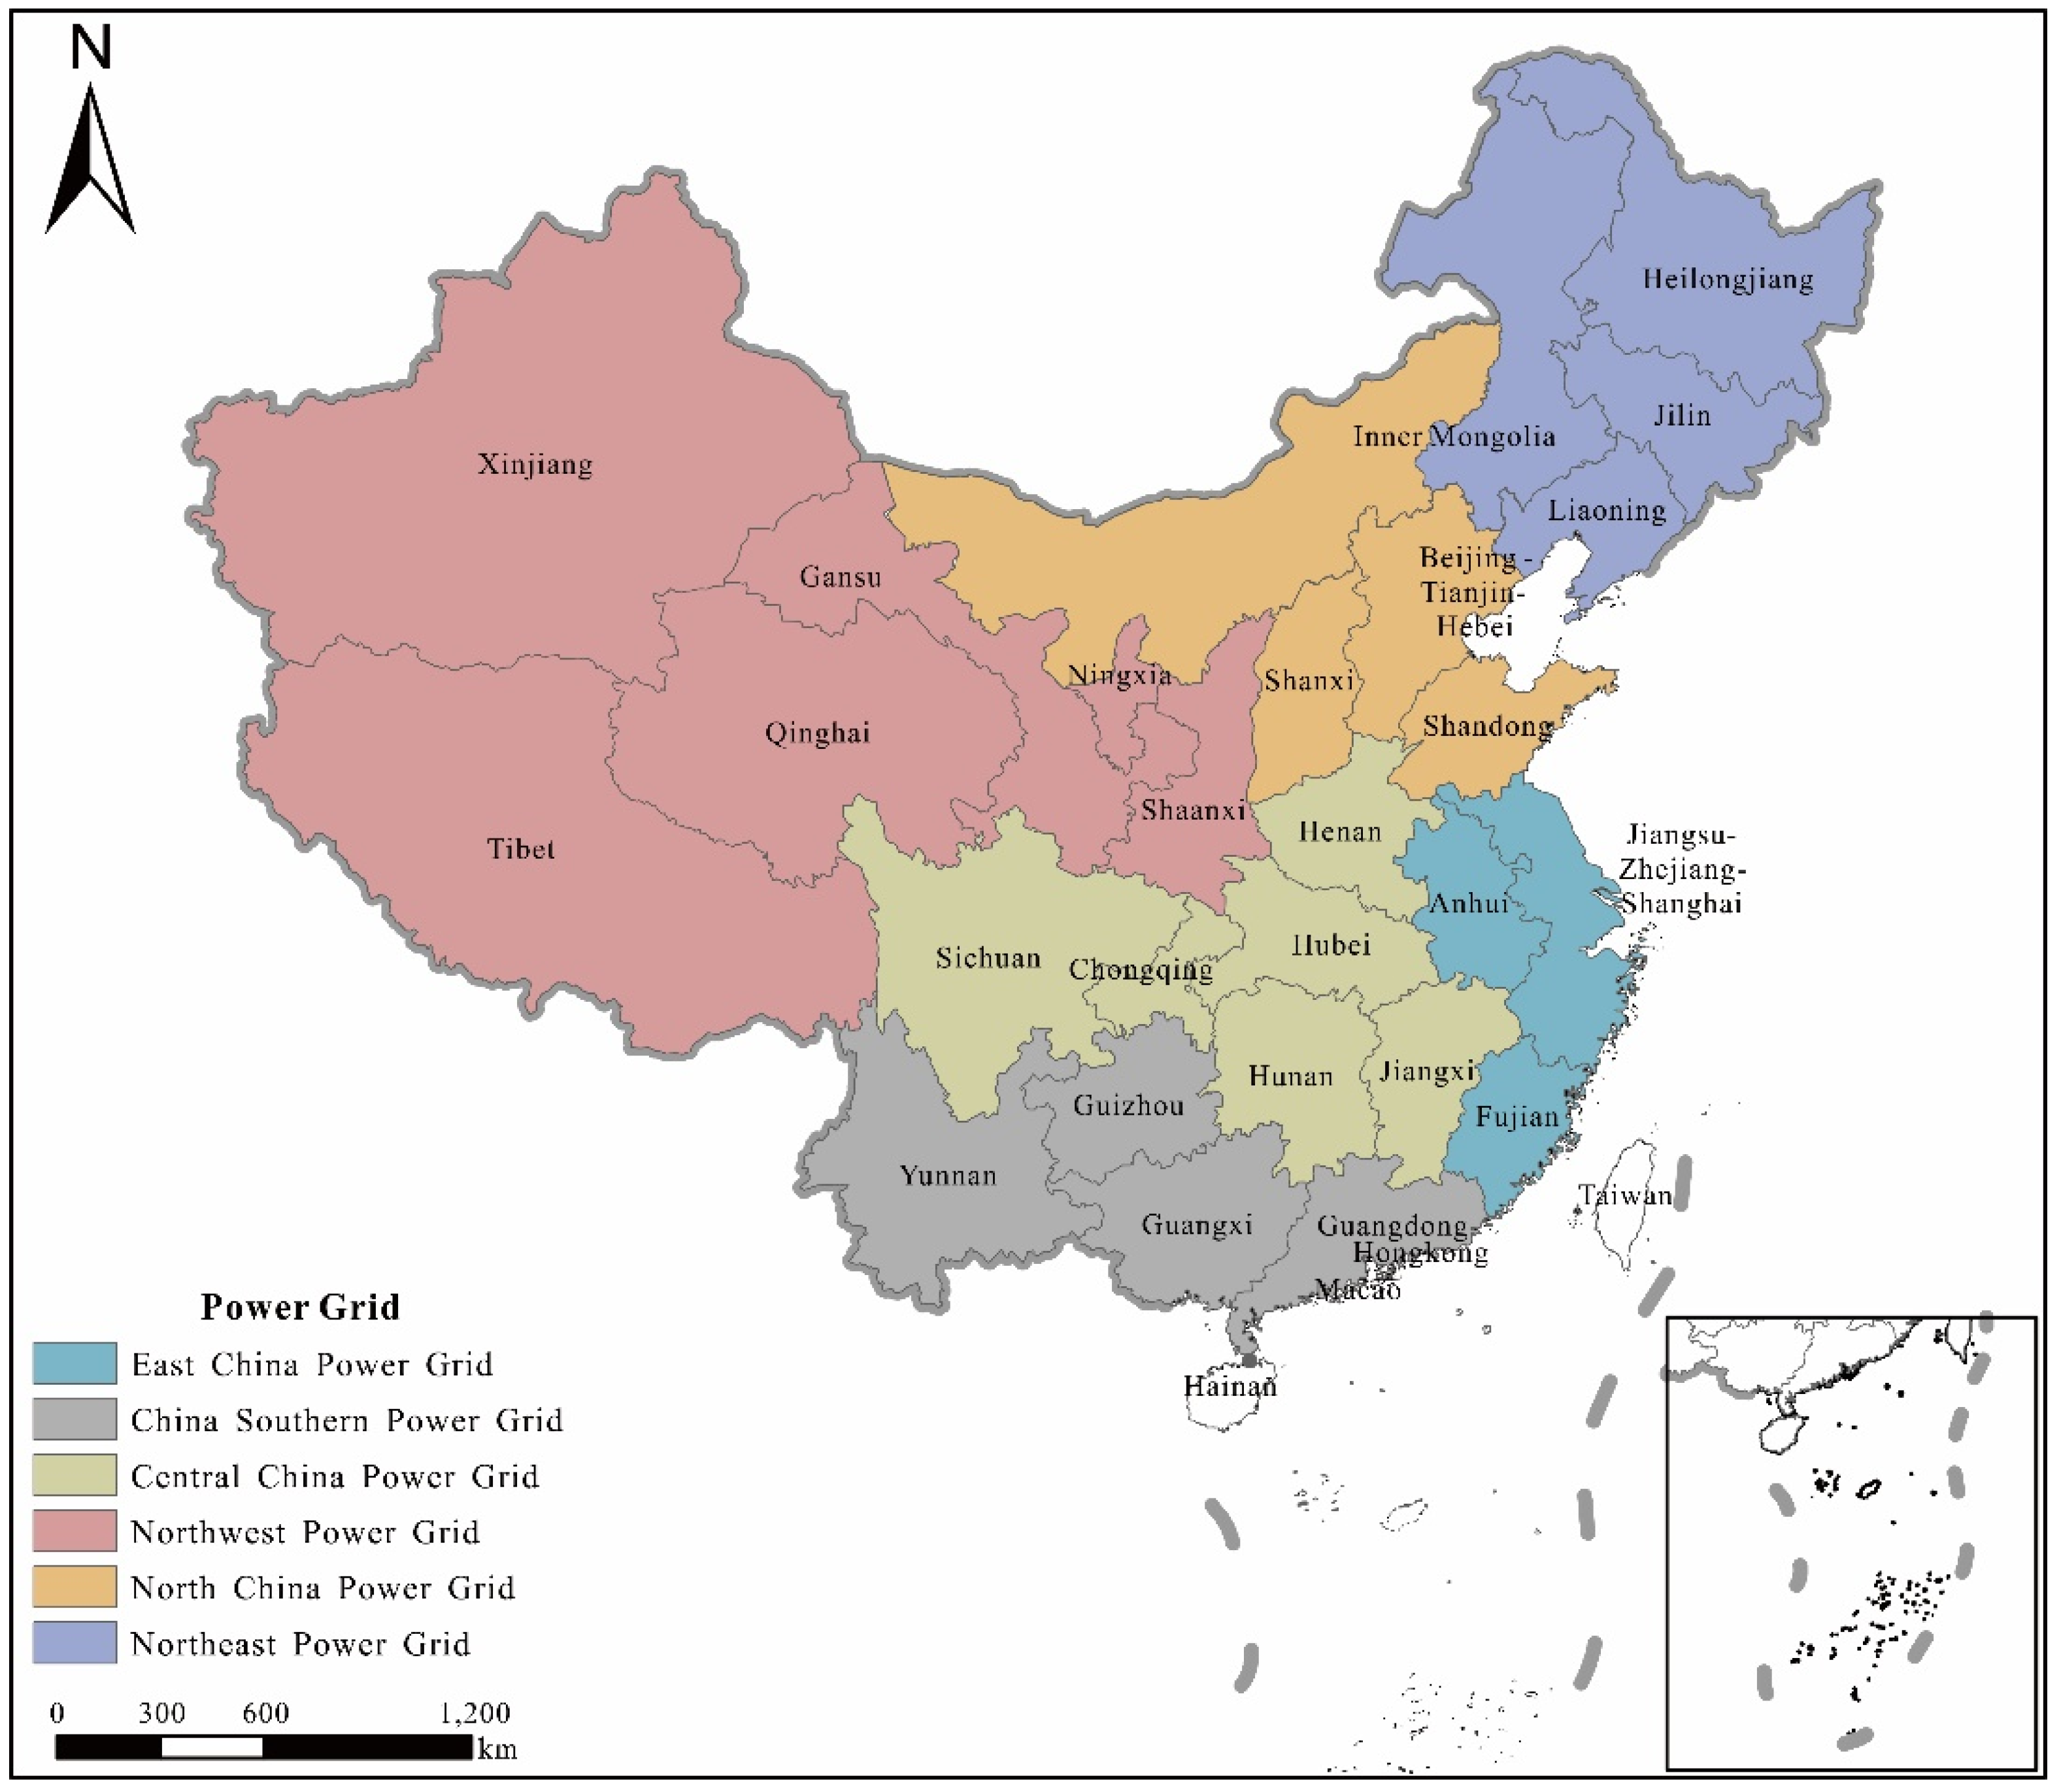
China’s power grid is a six-region power system managed under the SGCC and the CSG, which reflects the current division in network operation and power supply service across regions (Figure 2). The six regional power systems are the Northwest (Xinjiang, Gansu, Qinghai, Ningxia, Shaanxi, and Tibet), Northeast (Liaoning, Jilin, Heilongjiang, and East inner Mongolia), North (Beijing, Tianjin, Hebei, Shanxi, Shandong, and West inner Mongolia), Central (Hubei, Hunan, Jiangxi, Henan, Sichuan, and Chongqing), East (Shanghai, Jiangsu, Zhejiang, Fujian, and Anhui), and South (Guangdong, Guangxi, Yunnan, Guizhou, and Hainan).
Before 2000, most of power transmission occurred and was balanced inside provincial power grids from a security and control perspective. Since 2000, the Chinese government started up the Great Western Development Strategy to promote economic development in the western region and narrow the regional development gap, in which the development of electricity infrastructure was one of the main contents, including the building of hydropower stations, coal mines and coal-fired power station in West China. However, the electricity consumption in western provinces was relatively small because of a long period of lower economic growth. Therefore, China officially launched the WEPT project in 2000 to utilize coal and water resources in the Northeast, Northwest, and Southwest regions to generate electricity and transmit it to the eastern coastal area [43].
Previously, the WEPT project mainly transmitted the thermal power of Shanxi Province to the Beijing-Tianjin-Tangshan area that also belongs to the North China Power Grid, transmitted Gezhouba hydropower in Hubei Province of the Central China Power Grid to the Yangtze River Delta region of the East China Power Grid, and transmitted the thermal power from Guizhou and hydropower from Yunnan and Guangxi to Guangdong inside the South China Power Grid, which are known as the ‘three corridors of WEPT’. Furthermore, the government of China adjusted its energy development strategy to focus on the construction of energy bases mainly located in resource endowment provinces after 2003. With the construction of coal power, wind and solar clean energy bases in the northwest and the vigorous development of hydropower resources in the southwest, the surplus of power resources in the western region has grown rapidly [43]. On the other hand, the existing coal resources in the eastern coastal provinces were almost exhausted, and the clean energy development there is restricted by land and resource endowments, so the power gap is gradually increasing. At the same time, the progress of national power grid interconnection and Ultra High Voltage (UHV) transmission technology have made the long-distance power transmission more accessible and economical. All these changes promoted the rapid increase in the scale of inter-provincial power transmission. From 2006 to 2019, the size of the Chinese inter-provincial electricity flow increased from 325.01 billion kWh to 1444.1 billion kWh [44], which exceeded the times when electricity production and consumption were increasing (Figure 3). Furthermore, the number of inter-provincial electricity flow pairs increased from 64 to 85 during the same period.
3.2. Spatial Difference of ACIP in Different Provinces
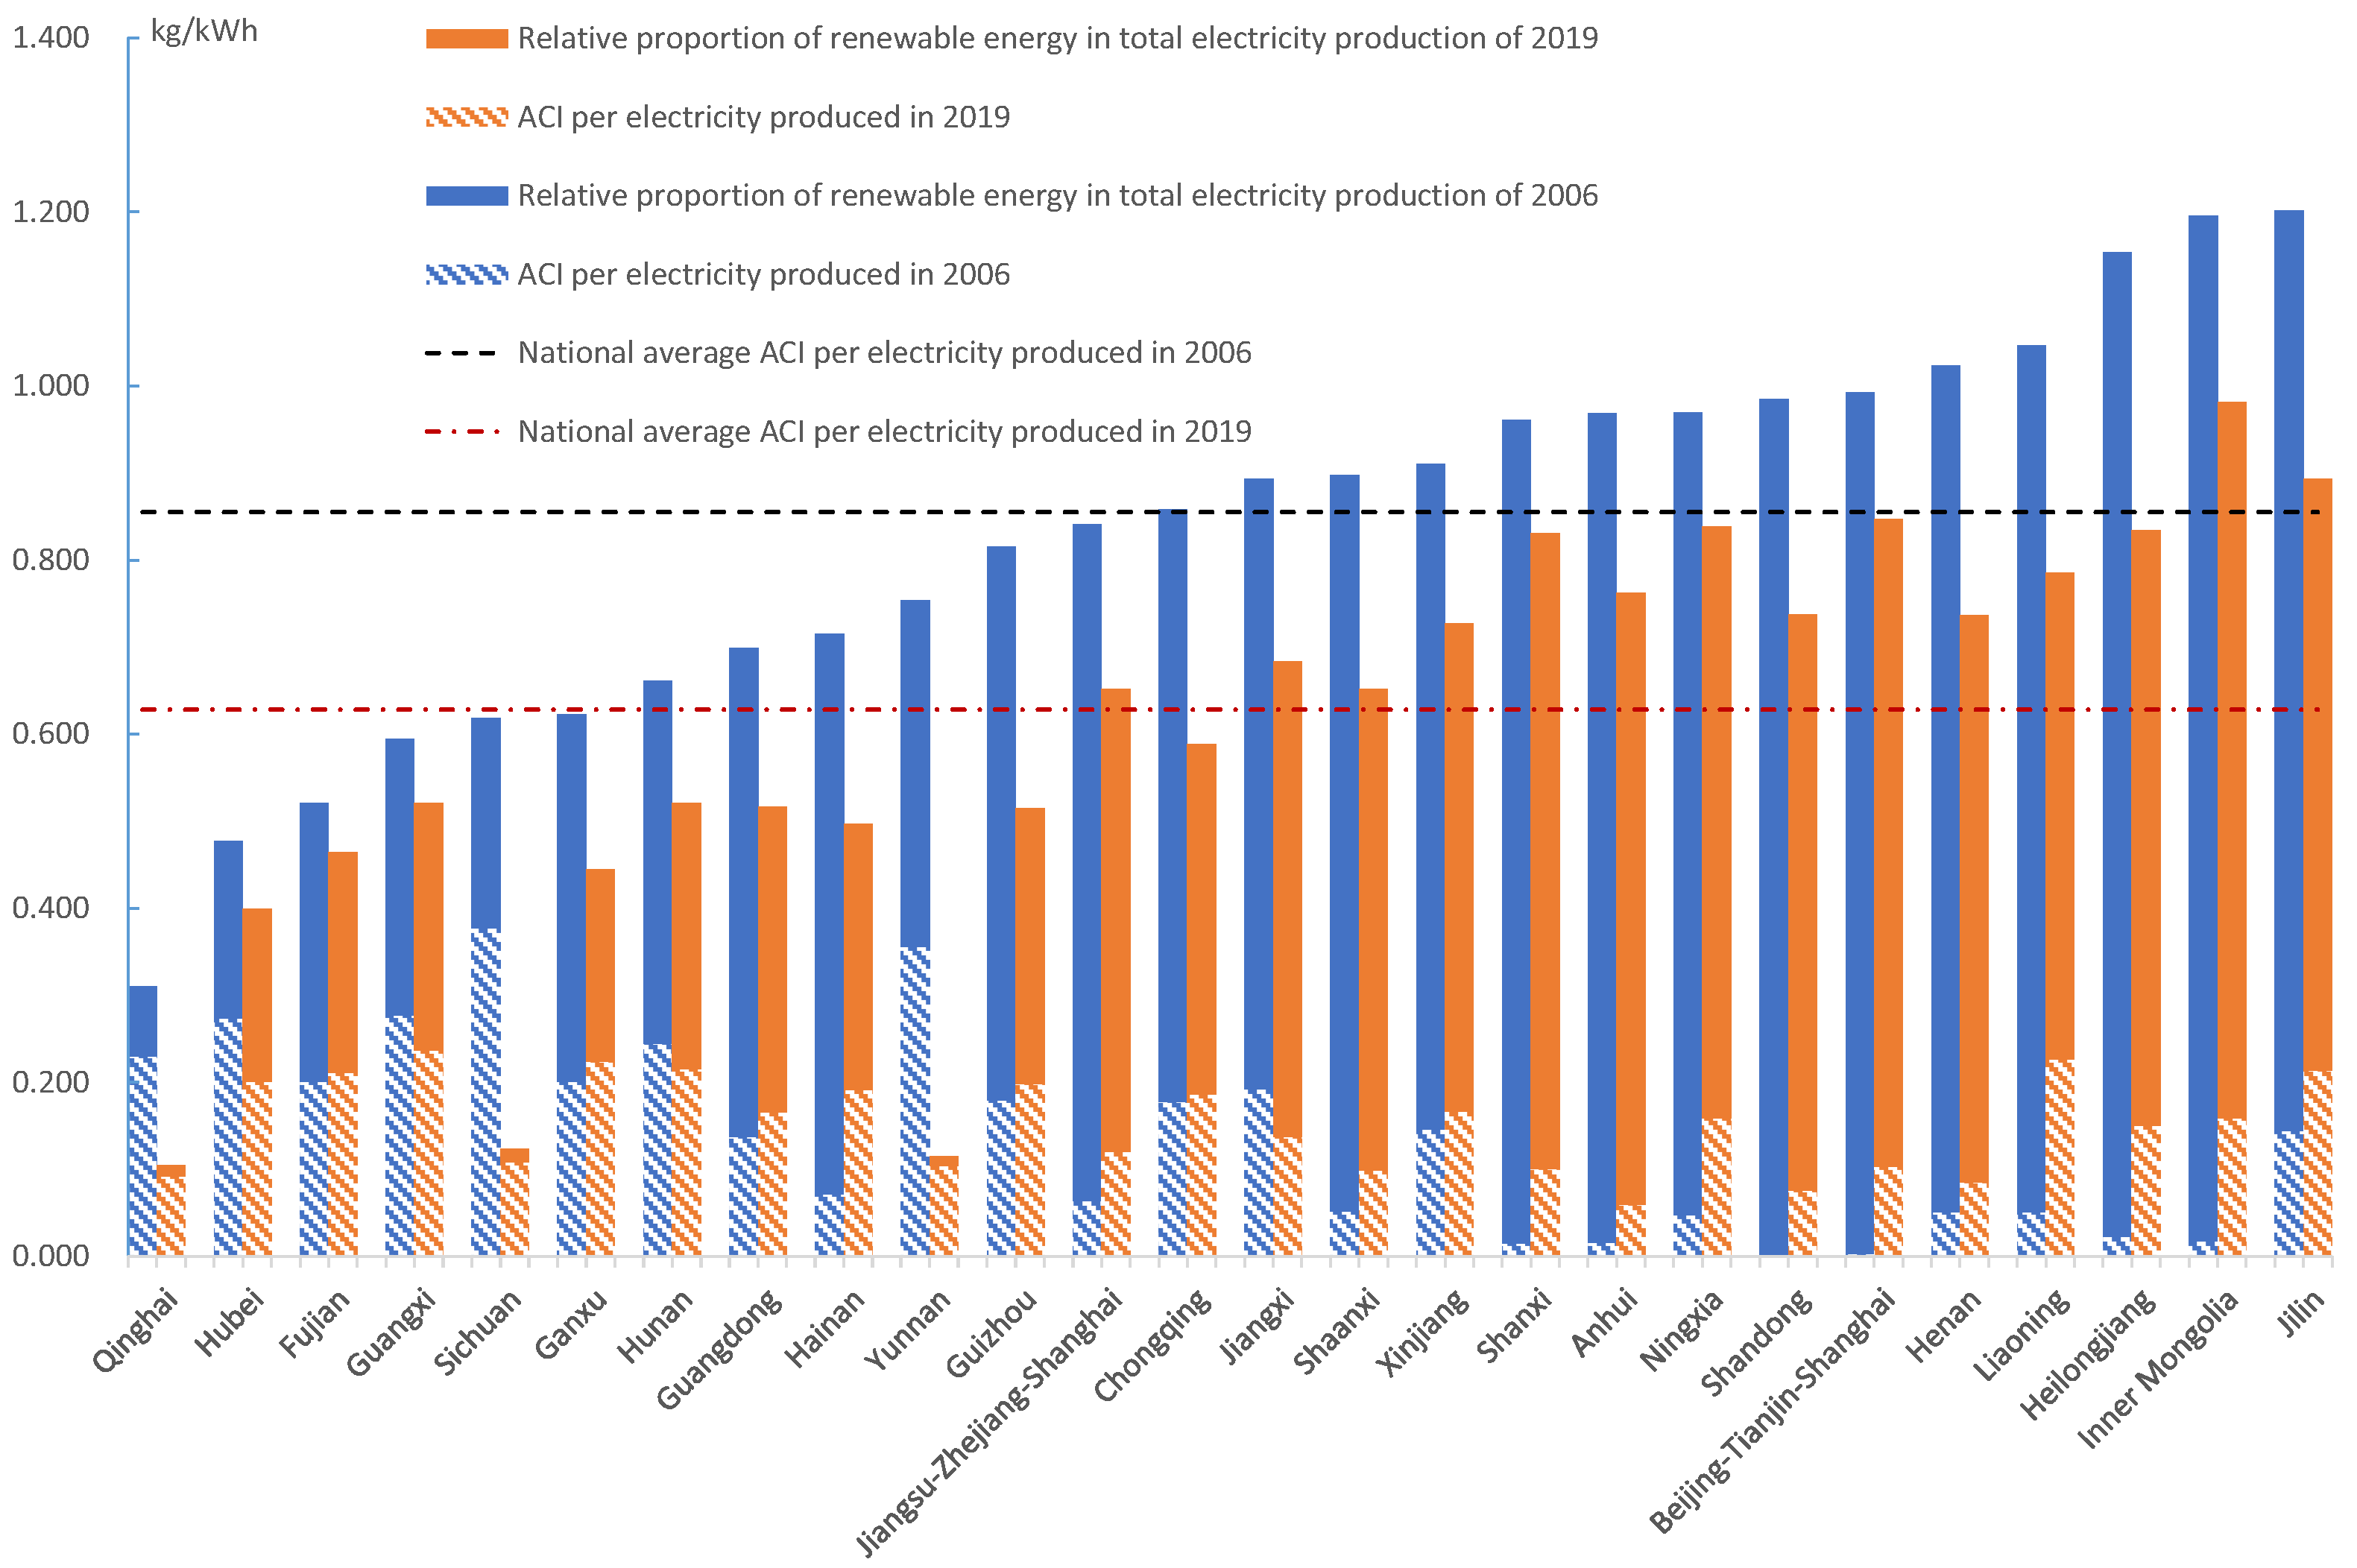
Existing studies have found that more than 30% of global energy-related CO2 emissions is attributable to emissions from electricity and heat production [34,45], mainly because of its heavy dependence on fossil fuels. As for China, the electricity generated by thermal power stations with coal as the primary fuel used to be more than 80% at the beginning of 21th century. There are two approaches to reducing CO2 emissions in the electricity production sector. One is to switch from using fossil fuels to non-fossil energy sources such as renewable energy; the other is to improve the thermal efficiency of electricity generation in fossil fuel powered plants [34]. Since the information on the thermal efficiency of electricity generation in the different provinces in the period was not available, this study assumed these provinces had the same level of heating and carbon content. Therefore, the spatial differences of CO2 emissions and ACIP would show the impact of the differences in fuel structures in the different provinces. Using Equations (1) and (2), the ACIPi is calculated from the perspective of the producers in different provinces in 2006 and 2019 as shown in Figure 4.
Differences in the structure of the power production sector lead into the different CO2 emission intensity per electricity produced (ACIP) in each province. The provinces with a higher proportion of clean energy power generation, such as hydropower, wind or solar power, will have lower ACIP values; while the provinces with a higher proportion of thermal power generation have higher ACIP values [46]. In Figure 4, the relative proportion of non-fossil fuel power generation of each province in 2006 and 2019 were also compared (data source: [33,42]). In 2006, Qinghai, Hubei, Fujian, and Guangxi provinces had the lowest ACIP value in the country, and the highest was in Jilin, Inner Mongolia, Heilongjiang, and Liaoning, which were dominated by coal power. By 2019, Yunnan and Sichuan, where hydropower was developed on a large scale, replaced Hubei and Fujian as the regions with the lowest ACIP behind Qinghai, while Inner Mongolia and Jilin remained the provinces with the highest ACIP, and Beijing-Tianjin-Hebei surpassed Heilongjiang to become the third highest value region of ACIP. Sichuan and Yunnan are two provinces with richer hydropower resources which account for 43% of the country’s total hydraulic reserves. In 2006, their proportions of non-fossil fuel power generation in provincial total electricity production were no more than 65%, and no more than 47.2% in Yunnan [42]. Further, the conversion efficiency of thermal power generation of these two provinces was much lower due to poor coal quality. For example, the conversion efficiency of thermal power generation of Sichuan in 2006 was only 20.6% [47], which lead to a relative higher ACIP even with higher proportion of hydropower generation. By 2019, the hydropower generation in Sichuan and Yunnan were developed greatly and their proportion of provincial electricity production all exceeded 85% [33], which lead to a significant decrease in ACIP. As for Inner Mongolia, Jilin, Beijing-Tianjin-Hebei, Shanxi, and Liaoning, electricity production is dominated by coal-fired power stations. In particular, Inner Mongolia’s ACIP is 1.5 times the national average, with its proportion of thermal power generated to provincial total power generated more than 82% in 2019 [33].
In 2005, China approved a ‘Renewable Energy Law’ aimed at promoting renewable energy in the country with financial subsidies and policy support. In 2011, China became the greatest country in terms of wind power and solar power installation [11]. In 2019, the capacity of non-fossil fuel installation on-grid in China reached 820.11 million kW and accounted for 40.80% of the total installed capacity [44], compared to the 139.21 million kW and 22.29% in 2006 [48]. Such an energy green transition lead to a decrease in ACIP. The national average ACIP decreased significantly from 0.855 kg/kWh in 2006 to 0.628 kg/kWh in 2019. The provinces with the most significant decline are mainly Yunnan and Sichuan. With the development of hydropower bases in the upper reaches of the Jinsha River, the Lancang River, the Yalong River, and the Dadu River all located in south-west of China, the proportion of hydropower in the power generation structure of Yunnan and Sichuan increased significantly, resulting in a drop of more than 75% in their ACIPs. In provinces and regions with relatively stable power generation structures, such as Hainan, Fujian, and Shanxi, the drop in ACIP is less than 10%.
3.3. Spatial Pattern of CO2 Emission Embodied in Inter-Provincial Power Transmission
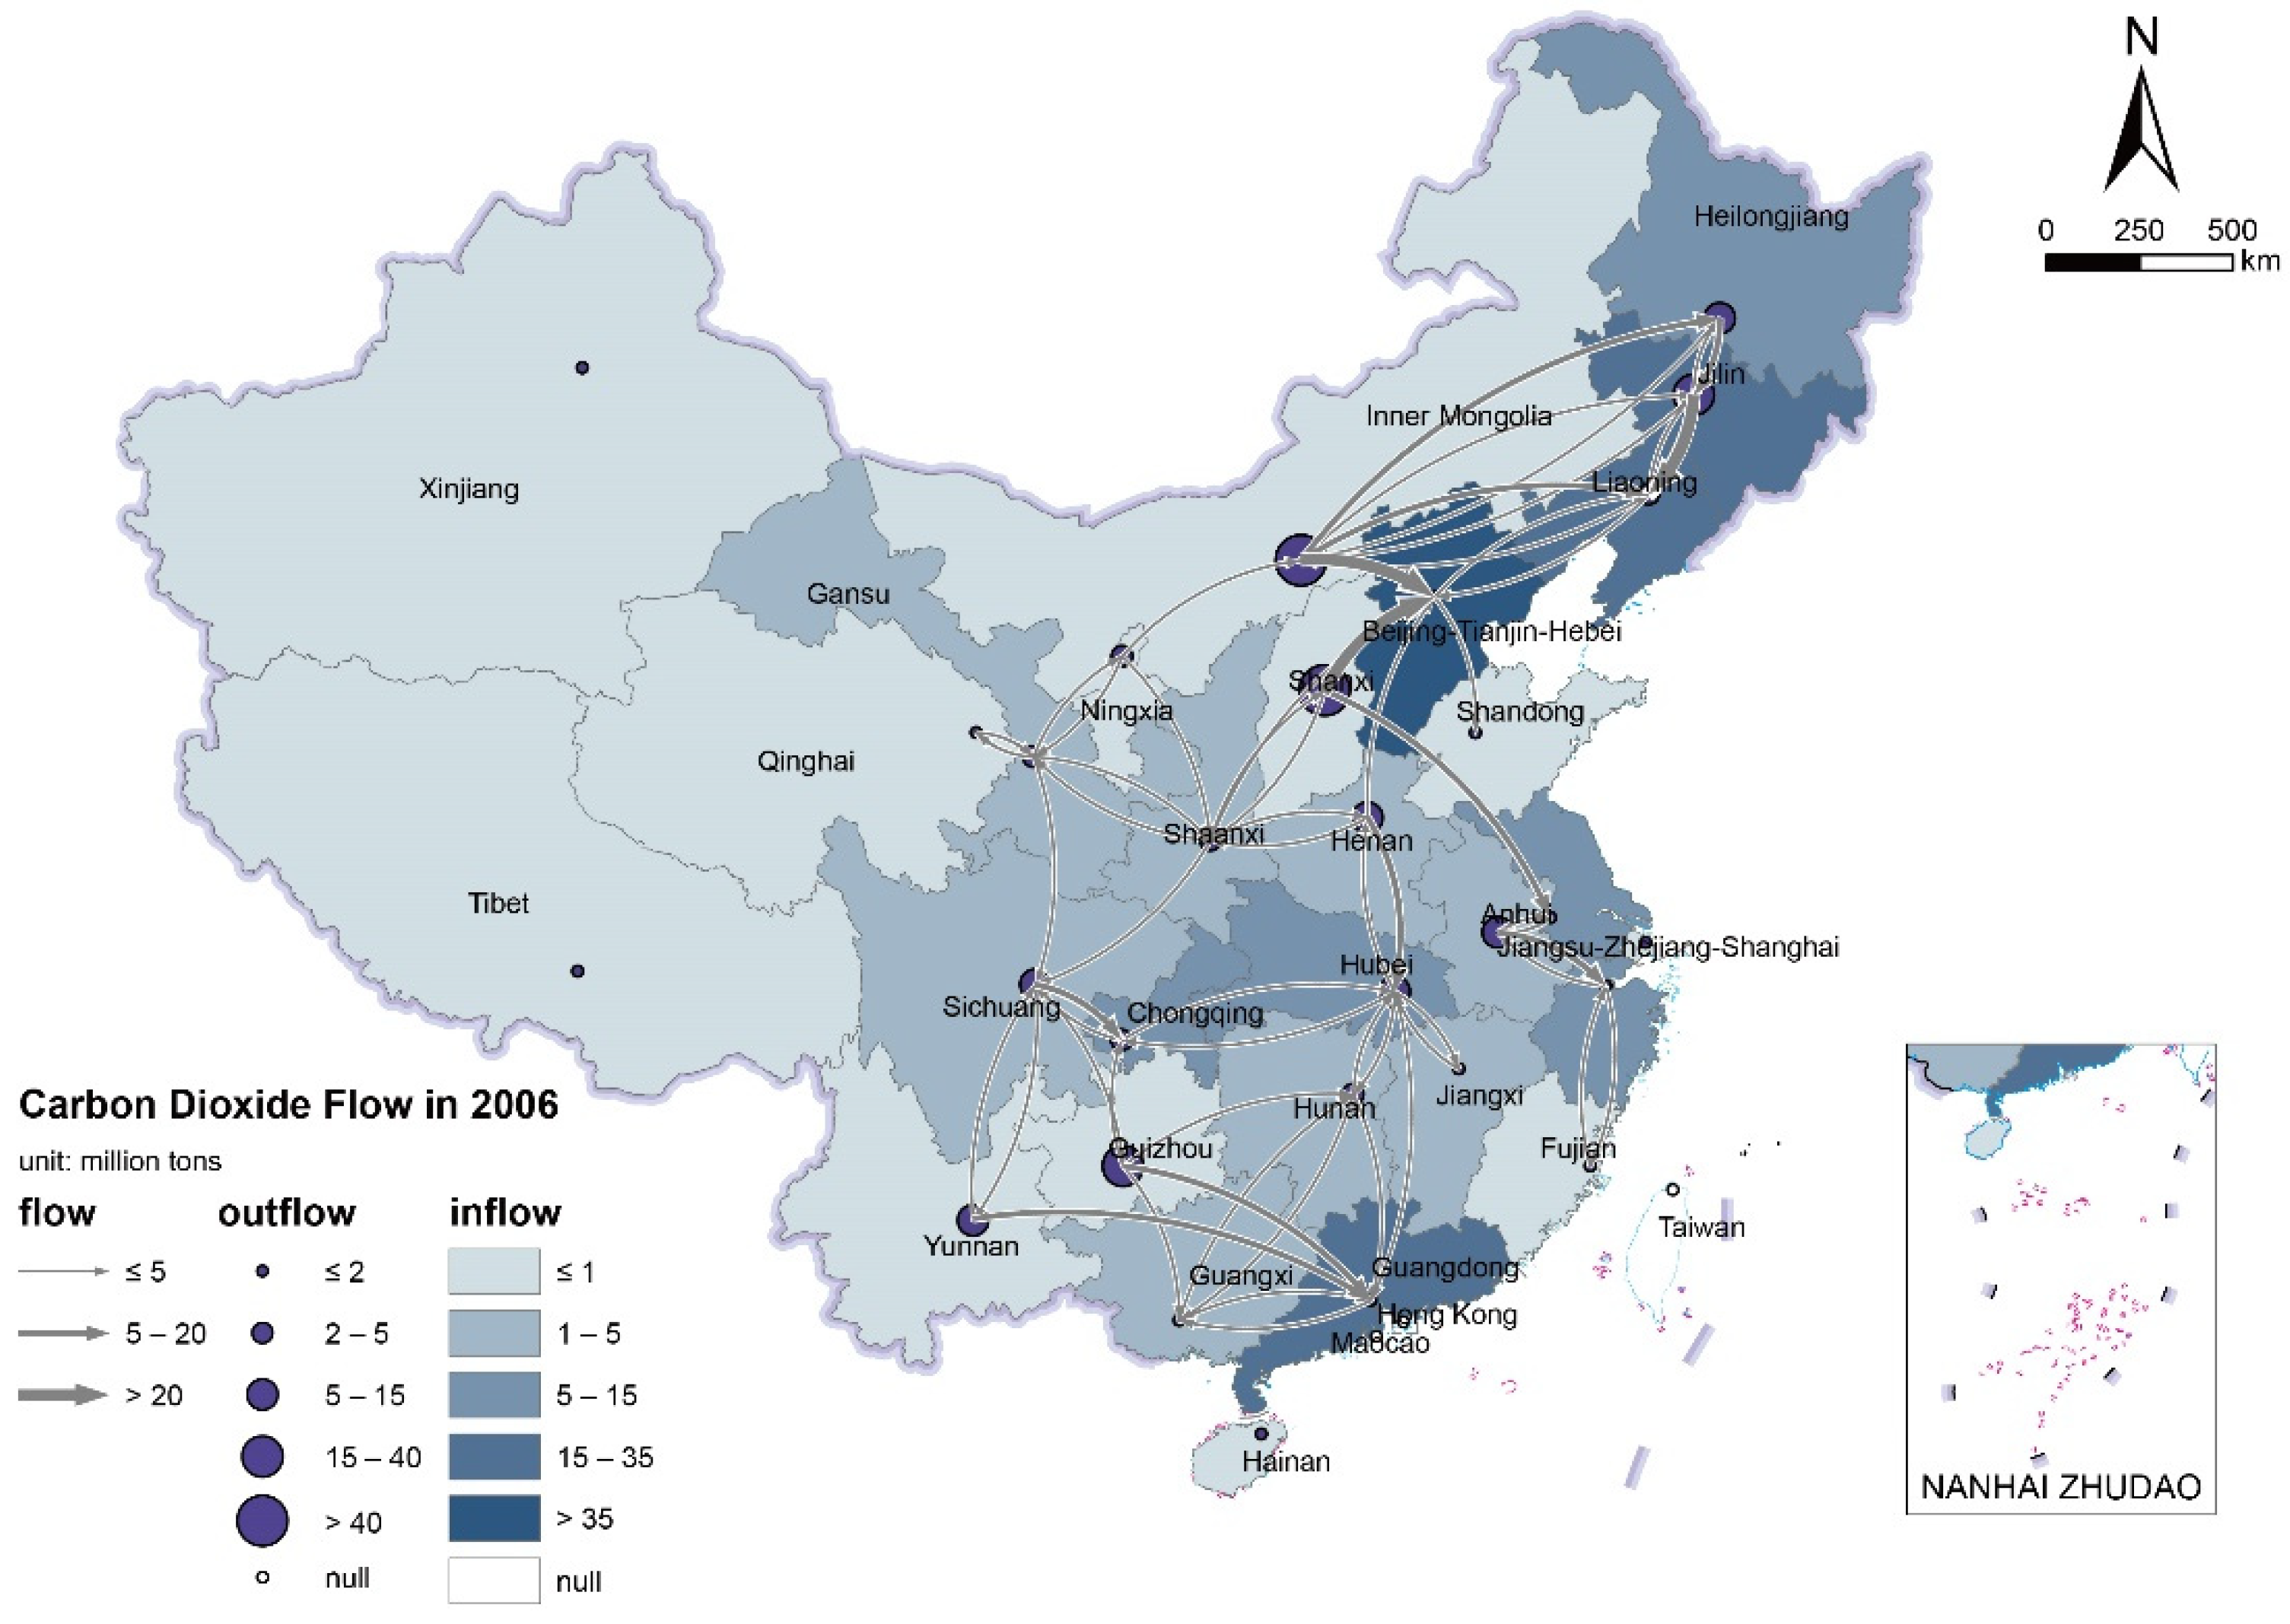
Because of the high loading of CO2 on power generation, inter-provincial power transmission also means the inter-regional flows of CO2. Using Equations (3)–(5), this study calculated the inter-provincial CO2 emission embodied in the inter-provincial electricity flow in 2006 (Figure 5) and 2019 (Figure 6).
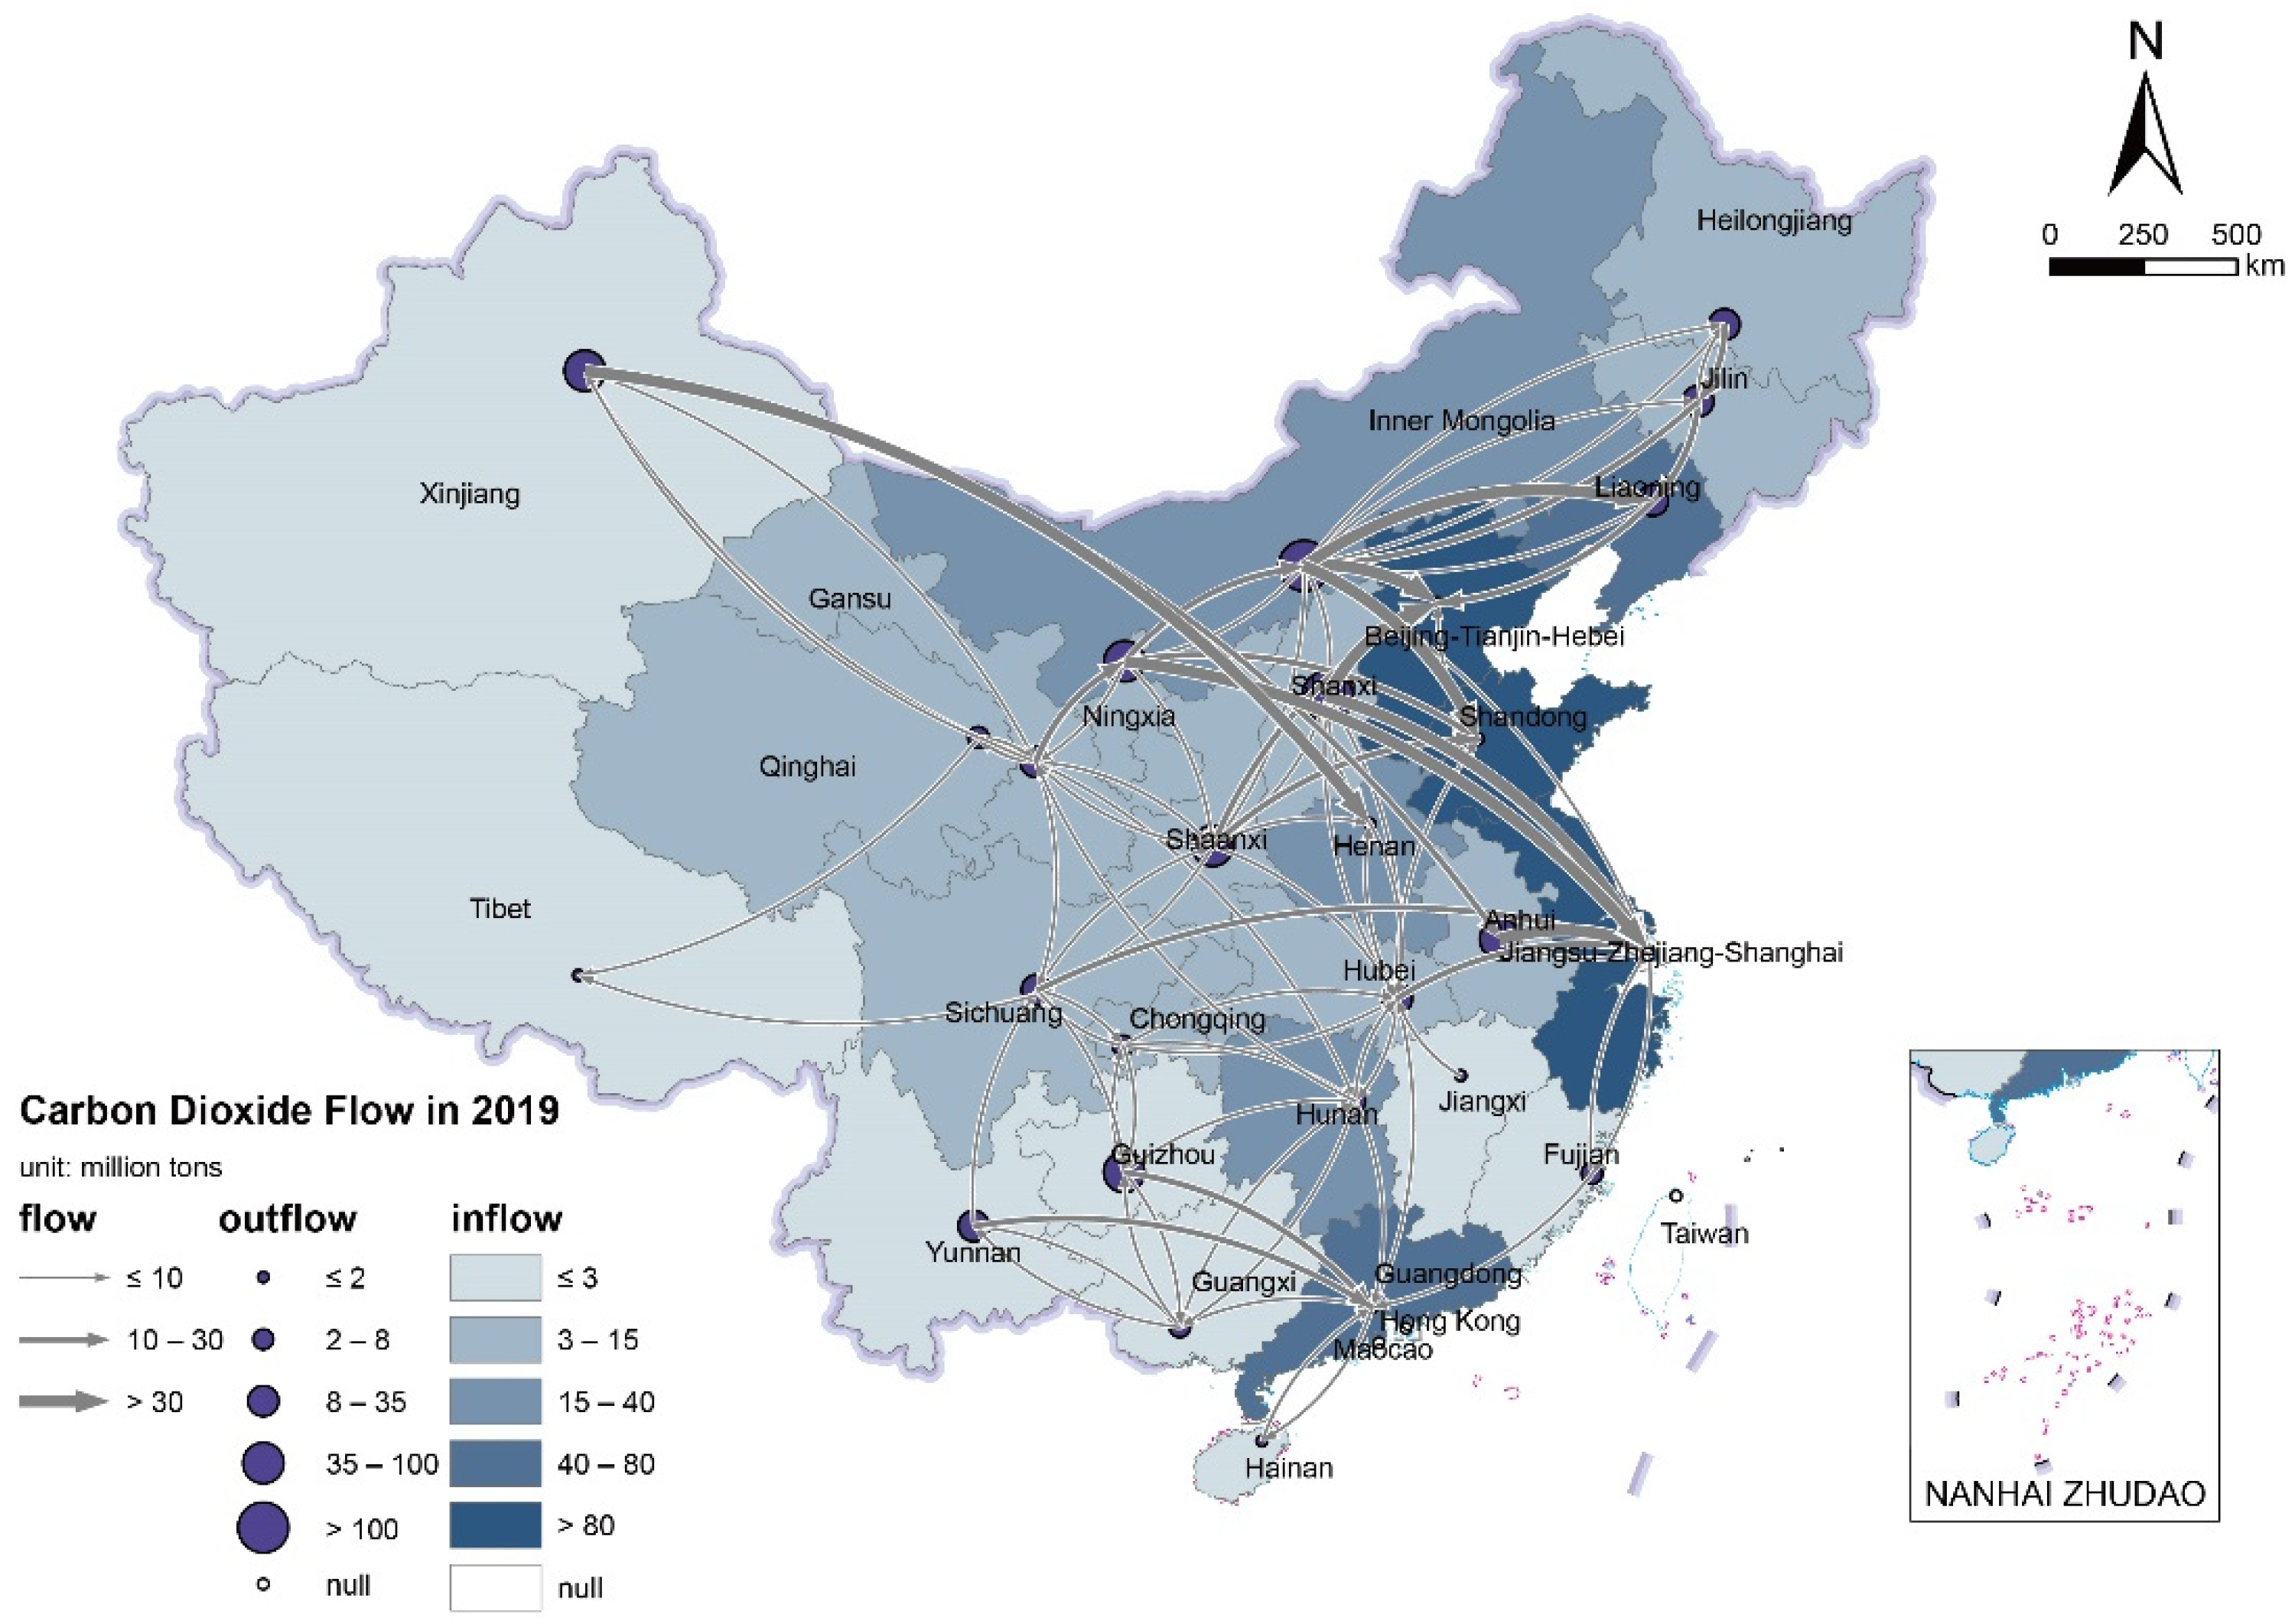
Because the CO2 emission embodied in power transmission is based on the inter-provincial power transmission network, their spatial morphology characteristics are similar and shown the pattern of ‘three corridors of WEPT’ [30]. In northern China, Inner Mongolia and Shanxi were the main sources of power transmission and CO2 outward, and Beijing-Tianjin-Hebei, Liaoning, Shandong were main sunk points of power transmission and CO2 inward. In central China, CO2 is mainly transferred from Sichuan and Hubei to Shanghai-Jiangsu-Zhejiang area. As for southern China, CO2 is transferred from Guizhou, Yunnan, Guangxi to Guangdong. However, compared with 2006, with the strengthening of the inter-provincial power grid connection and the expansion of the scale of inter-provincial power transmission, the networking degree and size of inter-provincial CO2 transfer in 2019 has strengthened, especially in Northwest China and Southwest China. Xinjiang and Tibet all had CO2 transferring outward with nearby provinces embodied in power transmission. Also, the size of CO2 embodied in main inter-provincial power transmission lines increased.
In terms of the CO2 embodied in every inter-provincial power transmission line, the power line transmitted from provinces with higher ACIP reflected more embodied CO2. Because the power production structure in the provinces in South China is dominated by hydropower development, the CO2 embodied in power transmission lines here is relatively lower than that in North China where the power production structure is dominated by thermal power stations. The most CO2 that was embodied in lines in southern China was no more than 10 million tons in 2019, except for the lines from Guizhou to Guangdong and from Anhui to Shanghai-Jiangsu–Zhejiang area, because the power generation in Guizhou and Anhui were dominated by coal-fired generation. Specifically, the power flows from Yunnan to Guangdong and from Sichuan to Shanghai-Jiangsu–Zhejiang area were 124.2 and 110 billion kWh, respectively, in 2019. At the same time, their embodied CO2 embodied was very small due to the direct delivery transmission from hydropower stations to consumer provinces, such as the line from Xiluodu hydro-station, located at the boundary of Sichuan and Yunan Provinces, to Jinhua convert station of Zhejiang province, and the line from Xiangjiaba hydro-station in Sichuan Province to Fengxian convert station in Shanghai. By contrast, the lines in North China were embodied with high CO2 because the local power is mainly generated by thermal power stations. In 2019, the highest CO2 embodied transmission lines were from Inner Mongolia to Beijing-Tianjin-Hebei area, equating to 89.03 million tons and accounting for 11.40% of the total CO2 embodied in inter-provincial power transmission that year. Generally, the reason is that most of the power was transmitted from thermal power stations in Inner Mongolia to the Beijing-Tianjin-Hebei power grid directly through 500 kv lines. Following that, the lines from Shanxi to Beijing-Tianjin-Hebei area, Inner Mongolia to Liaoning, and Anhui to Jiangsu-Zhejiang-Shanghai all carried more than 40 million tons of CO2. Further, the CO2 embodied in the lines of Ningxia to Shandong, Guizhou to Guangdong, and Inner Mongolia to Liaoning were all more than 20 million tons in 2019.
Compared with 2006, the CO2 embodied in the power transmission in 2019 increased significantly as the scale of inter-provincial electricity flows increased. In 2006, the total CO2 embodied in inter-provincial power transmission was 241 million tons, and by 2019 it had increased to 780 million tons. Some lines also showed significant growth. Normally, the growth of CO2 embodied in the transmission lines in the north of the Yangtze River was higher than that in the south of the Yangtze River. For example, CO2 embodied in the line from Shaanxi to Beijing-Tianjin-Hebei increased by 22.35 times, and that of Anhui to Jiangsu–Zhejiang–Shanghai region line increased by 7.03 times. Although the CO2 embodied in the line from Inner Mongolia to Beijing-Tianjin-Hebei only increased by 1.80 times, the absolute amount increased by 39.67 million tons. In addition, some new lines have also created new CO2 flows, such as the Yindong Line, which embodied 26.09 million tons from Ningxia to Qingdao in Shandong, the Hazheng Line, which embodied 30.16 million tons of CO2 from Xinjiang to Henan, and the Lingshao Line which embodied 34.80 million tons of CO2 from Ningxia to Zhejiang in 2019.
3.4. Different CO2 Load Impacts on Power Transmission Source and Sink Provinces
As a clean type of energy spatial flow, inter-provincial power transmission led into the different CO2 load impacts to source and sink provinces. As for the source provinces, they bore more CO2 emitted by electricity production that were not part of their actual consumption, which lead to the ‘carbon overload’. On the other side, the sink provinces consumed more electricity without bearing CO2 emissions of electricity production, which lead into the ‘carbon leakage’.
In terms of total size of CO2 embodied in power transmission, it is found that Inner Mongolia and Shanxi Province were the main carbon outward provinces in 2006 according to Figure 5. The CO2 embodied in the outward electricity of these two provinces was 67.13 and 42.17 million tons, accounting for 27.82% and 17.48% of national CO2 embodied in inter-provincial electricity flow, respectively (Figure 5). In 2019, these two provinces were still the highest outward carbon provinces, and CO2 embodied in the outward electricity of Inner Mongolia and Shanxi increased to 202.97 million tons and 105.19 million tons, while the proportion to national total dropped to 26.0% and 13.47%, respectively (Figure 6). Other thermal-power generation dominated provinces, such as Ningxia, Anhui, Shaanxi, had more than 50 million tons of CO2 embodied in outward electricity. Xinjiang, Guizhou, Gansu, and Hubei also had more than 30 million tons of CO2 overload in 2019. On the other side, Beijing-Tianjin-Hebei, Shanghai-Jiangsu-Zhejiang and Guangdong are the main electricity CO2 inward areas. In particular, the Beijing-Tianjin-Hebei area, as the main electricity sink area transmitted from Inner Mongolia and Shanxi, was also the largest inward CO2 embodied in power transmission, with more than 202 million tons in 2019, which nearly accounted for one-third of the national CO2 embodied in inter-provincial electricity flow. Followed by Jiangsu-Zhejiang-Shanghai, Shandong, Liaoning, and Guangdong, the proportion was between 8–15% in 2019. In addition, with the increase in Yunnan hydropower in the Guangdong power input, the proportion of CO2 embodied in inward power transmission of Guangdong province to national total in 2019 decreased significantly, from 14.75% in 2006 to 7.73%. In the same periods, with the increase in the inward power from Anhui and Ningxia to the Jiangsu-Zhejiang-Shanghai area, the proportion of CO2 leakage from inward electricity of Jiangsu-Zhejiang-Shanghai area showed an increasing trend, from 8.61% in 2006 to 21.73% in 2019.
The comparison of material and accounted ACIC of each province could show this difference clearly. Using Equations (6) and (7), we calculated the material aggregate carbon intensity per electricity consumed (MACIC) and the accounted aggregate carbon intensity per electricity consumed (AACIC) of every province in 2006 and 2019. Figure 7 shows the result of four ACIC values of every province in order of MACIC value in 2006. It can be found that the AACIC values of 11 provinces were higher than their respective MACIC values in 2006, meaning these provinces consumed more CO2 emission electricity than was accounted for by the producer. This led to carbon leakage in provincial CO2 accounting. Therefore, we called them CO2 leakage provinces. Most of these provinces were located in eastern China, such as Guangdong, Jiangsu–Zhejiang–Shanghai, Beijing–Tianjin–Hebei, Liaoning, Shandong, and Hainan, and some provinces in central and western China with net inward power transmission, such as Hunan, Guangxi, Jiangxi, and Chongqing. On the other side, the AACIC values of the other 15 provinces were lower than their respective MACIC values, which led to carbon overload in regional CO2 accounting. Therefore, we called them CO2 overload provinces. Most of these provinces were located in central and western China, including Inner Mongolia, Shanxi, Hubei, Heilongjiang, Anhui, Yunnan, Sichuan, Gansu, Guizhou, Shaanxi, and Xinjiang. Further, with the increase in spatial agglomeration of Chinese electricity production, the gap between AACIC and MACIC of some provinces increased greatly, which means these provinces are locked in a national power production and consumption pattern, which may lead to an increase in regional development disparity.
These results were also consistent with relative studies. For example, Chen et al. found that eastern and southern China were the major net sink areas of carbon emission flows because of their enormous amount of energy import [45]. In contrast, the ‘three western regions’ (including western Inner Mongolia, Shanxi, and Shaanxi) and central China were major net sources of carbon emissions flow.
4. Discussion
Why are inter-provincial electricity flows embodied with different amounts of CO2? According to Equation (3), it can be found that the amount of embodied CO2 in inter-provincial power transmission was dependent on the ACIP value and the amount of electricity transmitted in the lines. The ACIP was controlled by the local electricity production structure, and the power transmission was limited by the physical power grid development. Therefore, the spatial character and evolution of China’s inter-provincial power transmission and embodied CO2 are not only affected by uneven energy resource distribution and energy consumption patterns, but also by China’s energy development strategy, the power grid management institution, and the progress of power transmission technics.
4.1. Local Resource Endowment
Fundamentally, uneven distribution of Chinese energy resources has led to spatial differences in electricity production size and structure, which has led to the differences in ACIP values across producers in different provinces. China’s electricity production structure, traditionally, has been dominated by coal and hydropower. China’s coal resources are located mainly in the north and northwestern areas, especially in Inner Mongolia, Shanxi, Xinjiang, Shaanxi, and Guizhou provinces. These five provinces together account for 81.4% of coal deposits and 56% of coal production in 2012 [49]. As for hydropower, currently the largest renewable energy resource in China, it is distributed mainly in the southwest, where China’s major rivers are sourced [50]. In particular, the exploitable hydro capacities in Sichuan, Tibet, and Yunnan account for over 61.3% of the national total, followed by the neighboring provinces of Hubei, Qinghai, Guizhou, and Guangxi [51]. Limited by cost and technical factors, a small amount of electricity is generated by wind, solar, nuclear, and biomass energy in China, which accounted for about 15% of the national total in 2019 [33]. Even in some western provinces with the richest wind and solar resources, such as Inner Mongolia, Xinjiang, Gansu, Qinghai, and Ningxia, and some coastal provinces with nuclear power generation stations such as Zhejiang, Fujian, and Guangdong, the proportions were no more than 15% of regional electricity production. Thus, this kind of spatial distribution and combination model of Chinese energy sources has led to a major concentration of electricity production in China’s central and western provinces. In addition, power production in the northwestern provinces is based mainly on thermal power (coal fired), supplemented by a very small amount of wind and solar power generation, and the ACIP is relatively higher; electricity production in the southwestern region is dominated mainly by hydropower, and a small amount of thermal power as supplement. Thus, the ACIP values there are relatively lower.
4.2. Location and Territoriality
Location means not only an absolute characteristic, but also a relative one, describing the relational proximity of one element in a system to another [8]. While the absolute location is fixed and unchanging, the relative location can be highly dynamic for transmitting electricity to other consumption places through the grid. Obviously, a province located near the center of the national power grid has more opportunities to connect with another province’s grid than one located on the periphery. This is similar for provinces located near others with a huge electricity shortage. For example, Inner Mongolia and Xinjiang are all rich in coal, wind, and solar resources. However, Inner Mongolia is located next to Beijing–Tianjin–Hebei and Northeast China with a high electricity shortage, while Xinjiang is located in the Chinese western border area with no electricity demand nearby. Thus, the outward power transmission and CO2 overload of Inner Mongolia are much higher than that of Xinjiang.
All infrastructure systems for energy capture, transmission, and distribution are spatially constituted, but they have been territorialized in different ways over time. Before the first UHV pilot demonstration project was built in 2005 connecting the North China power grid and the Central China power grid, Chinese inter-provincial electricity exchange was concentrated within the six regional power grids supported by 500 kv lines [50]. For example, the transmission from Shanxi and Inner Mongolia to Beijing–Tianjin–Hebei was inside the North China power grid, transmission from Yunnan and Guizhou to Guangdong was inside the South China power grid, and transmission from Anhui to Jiangsu–Shanghai–Zhejiang was inside the East China power grid. Some frontier provinces, such as Tibet or Xinjiang, were isolated from the regional grid by the absolute location. The technical progress of power transmission, especially the development of UHV power transmission, make large-capacity, long-distance power transmission more feasible, which could enable the western provinces to transmit electricity to distant coastal provinces. Now, several inter-provincial electricity transmissions occur across the regional grid backbone via UHV lines, such as Xinjiang to Henan, Sichuan to Jiangsu–Shanghai–Zhejiang and Ningxia to Shandong. Further, Tibet is now connected with Qinghai and Sichuan as well, and facilitated electricity transmission between them. As a result, the outward power transmission from these hinterland provinces increased greatly and lead into the changing spatial pattern of CO2 flow embodied in interprovincial power transmission.
Furthermore, institutional embeddedness, reflected in regional grid management and power generation station and transmission lines planning, has also affected the planning and construction of UHV lines and, thus, the spatial patterns of inter-provincial power transmission. Taking Yunnan and Sichuan as examples, although they both have abundant hydropower, due to their subordination to different regional power grids, differences in the electricity consumption of their regional grids have affected the outward electricity transmission of the two provinces. Yunnan belongs to the South China power grid, as does Guangdong, so Yunnan’s electricity generated by a hydropower station could be delivered directly to the consumer market in Guangdong through transactions within the regional grid. By contrast, Sichuan belongs to the Central China power grid under the State Grid Cooperation, which is independent from the South China power grid. Sichuan’s electricity cannot be transmitted to Guangdong even though it is located nearby. Before the construction of the UHV lines between Sichuan and Jiangsu–Shanghai–Zhejiang, hydropower development and outflow from Sichuan was limited.
4.3. Government Ambition and Industry Stakeholders’ Reaction
Identifying and understanding the dynamic mechanisms leading to the special patterns of spatial carbon transfer are vital to informing China’s low-carbon policy development and decision making among industry stakeholders. To mitigate carbon emission pressures, the Chinese government continues to replace older, less efficient generators with more efficient units and to increase the installed generation capacity of nuclear, wind, and solar power to decrease the carbon emissions from electricity generation [52]. In 2006, the Chinese government issued the Renewable Energy Law to provide a framework for legislative initiatives designed to secure the development of renewable energy. Under this umbrella legislation, various ministerial regulations and measures have been implemented to incentivize the development of renewable energy using power generation investment, grid connections, cost-sharing, and on-grid electricity tariffs [53]. Now, China has the largest wind power installation capacity in the world. However, its ratio of wind to total generation is only 5.4%, which is smaller than most European countries. In addition, the problems of wind curtailment and power rationing were serious, and the national average wind curtailment rate was 15% in 2015, and more than 30% in some far western provinces such as Xinjiang and Gansu [54]. Apart from the mismatch in the temporal lag between the power plant and transmission projects, the key reason for the higher curtailment rate has been that many grid enterprises are reluctant to build grids connecting wind power plants to the main grid network or have delayed building or expanding grids to connect renewable power plants, even though they are required to do so by the central government [55]. Although the mandatory grid-connection mechanism designed by the Renewable Energy Law requires grid companies to purchase and dispatch the entire amount of electricity generated from renewable electricity projects when entering into connection agreements, the characteristics of high investment, low line utilization rates, and a low national subsidy standard for the on-grid connection system hinder the enthusiasm of grid companies. In addition, the intermittent and random nature of wind power and photovoltaic power generation has created significant pressure on the stability and difficulty of grid peak–valley adaption. Some grid companies have had to limit the proportion of renewable energy in the grid [56].
5. Conclusions
The inter-provincial flow of electricity can not only solve the problem of China’s spatial power imbalance, but also promote the development of clean and renewable power resources in the western region. Electricity generated by hydropower in the southwest and wind and solar power in the northwest China can be transported to the eastern coastal areas through the inter-provincial power connection lines, which enables the reduction in CO2 of the electricity production and Chinese energy green transition. However, as part of the process, the coal-resource abundant provinces are also producing and exporting more thermal power, which creates CO2 overload in source provinces and leakage in sunk provinces. Compared to relative literature putting more emphasis on decarbonization of electricity from a production and consumption perspective, this study focused on the decreasing of aggregate carbon intensity of electricity production facilitated by inter-provincial power transmission, analyzed the spatial pattern of the CO2 flow embodied in it, and discussed the factors that have led to these geographical patterns in the context of China’s green energy transition. Our conclusions and suggestions are as follows.
First, the spatial characteristics of CO2 embodied in power transmission show the pattern of ‘three corridors of West-East Power Transmission’. The outward power transmission from the northwest provinces whose power production is dominated by thermal power had higher CO2 emissions than the southwest provinces dominated by hydropower. Inner Mongolia, Shanxi, Anhui, and Guizhou provinces were the main carbon overload provinces, while Beijing–Tianjin–Hebei, Jiangsu–Shanghai–Zhejiang, and Guangdong were the main carbon leakage regions. Further, Beijing–Tianjin–Hebei is the biggest carbon sink region, as much of its inward electricity comes from Shanxi and Inner Mongolia at a higher ACIP value, although the amount of inward electricity is much smaller than that of the other two regions.
Second, apart from the energy resource endowment, the location of the province and its territorial features, technical progress of UHV, and Chinese power grid framework and management system also impact the spatial connectivity in the inter-province grid. However, some conflicts and negotiation, such as institutional limits, and profit distribution between the inward and outward electricity provinces, also impact the spatial patterns of inter-provincial power transmission and embodied CO2 flow.
Third, inter-provincial power flow has different decarbonization impacts on provinces with inward and outward power transmission, which suggests the need to identify CO2 reduction targets considering spatial differences. While some northwestern provinces have built more thermal power generation and have transmitted more electricity to eastern provinces, they are also burdened with more CO2 than their electricity consumption really emitted.
Therefore, the industrial division of electricity production and consumption must also be taken into consideration in the development of the provincial CO2 target allocations or the inter-regional CO2 compensation mechanism. In addition, with the reform of the power market, Chinese power generation companies and power grid companies have been separated and their economic accounting is independent. This has led to bargaining among electricity development enterprises on timing, scale, on-grid price, and income distribution between the inward and outward provinces. The power production structure of each province, especially the proportion of wind power and photovoltaic energy in the power production structure of the northwestern region, as well as the proportion of clean energy and the scale of power transmission, will be affected by the bargaining across multi-agent strategies and the interests of the state, local governments, and enterprises, creating a strong need for national planning and inter-provincial ecological compensation for power production and transmission from the central government.
Furthermore, from the viewpoint of economic geographic and energy economy research, as the spatial shift in energy research increases, our scientific community must pay attention not only to the form and space of energy linkages but also to the social, economic, political, and environmental relations that have shaped and influenced this formation and evolution from the perspective of institutional return.
Funding
This research was funded by the Strategic Priority Research Program (A) of the Chinese Academy of Sciences (No. XDA19040403) and Major Program of the National Fund of Philosophy and Social Science of China (Grant No. 20 & ZD099).
Informed Consent Statement
Not applicable.
Acknowledgments
The author would like to thank reviewers and editor’s suggestions and edits on the manuscript of this paper.
Conflicts of Interest
The author declares no conflict of interest.
References
- Chen, W.; Li, H.; Wu, Z. Western China energy development and west to east energy transfer: Application of the Western China Sustainable Energy Development Model. Energy Policy 2010, 38, 7106–7120. [Google Scholar] [CrossRef]
- Gnansounou, E.; Dong, J. Opportunity for inter-regional integration of electricity markets: The case of Shandong and Shanghai in East China. Energy Policy 2004, 32, 1737–1751. [Google Scholar] [CrossRef]
- Wang, S.; Zhu, X.; Song, D.; Wen, Z.; Chen, B.; Feng, K. Drivers of CO2 emissions from power generation in China based on modified structural decomposition analysis. J. Clean Prod. 2019, 220, 1143–1155. [Google Scholar] [CrossRef]
- Ming, Z.; Honglin, L.; Mingjuan, M.; Na, L.; Song, X.; Liang, W.; Lilin, P. Review on transaction status and relevant policies of southern route in China’s West–East Power Transmission. Renew. Energ 2013, 60, 454–461. [Google Scholar] [CrossRef]
- Eguchi, S.; Takayabu, H.; Lin, C. Sources of inefficient power generation by coal-fired thermal power plants in China: A metafrontier DEA decomposition approach. Renew. Sustain. Energy Rev. 2021, 138, 110562. [Google Scholar] [CrossRef]
- Yue, H.; Worrell, E.; Crijns-Graus, W.; Zhang, S. The potential of industrial electricity savings to reduce air pollution from coal-fired power generation in China. J. Clean Prod. 2021, 301, 126978. [Google Scholar] [CrossRef]
- Zhu, F.; Zheng, Y.; Guo, X.; Wang, S. Environmental impacts and benefits of regional power grid interconnections for China. Energy Policy 2005, 33, 1797–1805. [Google Scholar] [CrossRef]
- Wang, L.; Patel, P.L.; Yu, S.; Liu, B.; McLeod, J.; Clarke, L.E.; Chen, W. Win–Win strategies to promote air pollutant control policies and non-fossil energy target regulation in China. Appl. Energy 2016, 163, 244–253. [Google Scholar] [CrossRef]
- Wang, Q.; Chen, X. Energy policies for managing China’s carbon emission. Renew. Sustain. Energy Rev. 2015, 50, 470–479. [Google Scholar] [CrossRef]
- Xinhua Highlights of China’s Climate Commitment Over Five Years. Available online: http://www.xinhuanet.com/english/2020-10/26/c_139468348.htm (accessed on 26 May 2021).
- Ma, L.; Xu, D. Toward Renewable Energy in China: Revisiting Driving Factors of Chinese Wind Power Generation Development and Spatial Distribution. Sustainability 2021, 13, 9117. [Google Scholar] [CrossRef]
- Zhao, X.; Ma, X.; Chen, B.; Shang, Y.; Song, M. Challenges toward carbon neutrality in China: Strategies and countermeasures. Resour. Conserv. Recycl. 2022, 176, 105959. [Google Scholar] [CrossRef]
- Li, Y.; Lukszo, Z.; Weijnen, M. The impact of inter-regional transmission grid expansion on China’s power sector decarbonization. Appl. Energy 2016, 183, 853–873. [Google Scholar] [CrossRef] [Green Version]
- Zhao, Y.; Cao, Y.; Shi, X.; Li, H.; Shi, Q.; Zhang, Z. How China’s electricity generation sector can achieve its carbon intensity reduction targets? Sci. Total Environ. 2020, 706, 135689. [Google Scholar] [CrossRef] [PubMed]
- Chen, Q.; Kang, C.; Ming, H.; Wang, Z.; Xia, Q.; Xu, G. Assessing the low-carbon effects of inter-regional energy delivery in China’s electricity sector. Renew. Sustain. Energy Rev. 2014, 32, 671–683. [Google Scholar] [CrossRef]
- Nerini, F.F.; Tomei, J.; To, L.S.; Bisaga, I.; Parikh, P.; Black, M.; Borrion, A.; Spataru, C.; Broto, V.C.; Anandarajah, G.; et al. Mapping synergies and trade-offs between energy and the Sustainable Development Goals. Nat. Energy 2018, 3, 10–15. [Google Scholar] [CrossRef] [Green Version]
- Bridge, G. The map is not the territory: A sympathetic critique of energy research’s spatial turn. Energy Res. Soc. Sci 2018, 36, 11–20. [Google Scholar] [CrossRef] [Green Version]
- Dahlmann, F.; Kolk, A.; Lindeque, J. Emerging energy geographies: Scaling and spatial divergence in EUropean electricity generation capacity. Eur. Urban Reg. Stud. 2017, 24, 381–404. [Google Scholar] [CrossRef]
- Zhou, X.; Yi, J.; Song, R.; Yang, X.; Li, Y.; Tang, H. An overview of power transmission systems in China. Energy 2010, 35, 4302–4312. [Google Scholar] [CrossRef]
- Zhang, C.; Shukla, P.R.; Victor, D.G.; Heller, T.C.; Biswas, D.; Nag, T. Baselines for carbon emissions in the Indian and Chinese power sectors: Implications for international carbon trading. Energy Policy 2006, 34, 1900–1917. [Google Scholar] [CrossRef]
- Wang, Q.; Chen, Y. Status and outlook of China’s free-carbon electricity. Renew. Sustain. Energy Rev. 2010, 14, 1014–1025. [Google Scholar] [CrossRef]
- Zhang, Y.; Ma, T.; Guo, F. A multi-regional energy transport and structure model for China’s electricity system. Energy 2018, 161, 907–919. [Google Scholar] [CrossRef] [Green Version]
- Zhang, N.; Hu, Z.; Shen, B.; Dang, S.; Zhang, J.; Zhou, Y. A source–grid–load coordinated power planning model considering the integration of wind power generation. Appl. Energy 2016, 168, 13–24. [Google Scholar] [CrossRef]
- Yi, B.; Xu, J.; Fan, Y. Inter-regional power grid planning up to 2030 in China considering renewable energy development and regional pollutant control: A multi-region bottom-up optimization model. Appl. Energy 2016, 184, 641–658. [Google Scholar] [CrossRef]
- Zheng, Y.; Hu, Z.; Wang, J.; Wen, Q. IRSP (integrated resource strategic planning) with interconnected smart grids in integrating renewable energy and implementing DSM (demand side management) in China. Energy 2014, 76, 863–874. [Google Scholar] [CrossRef]
- Wang, Y.; Yan, Q.; Li, Z.; Baležentis, T.; Zhang, Y.; Gang, L.; Streimikiene, D. Aggregate carbon intensity of China’s thermal electricity generation: The inequality analysis and nested spatial decomposition. J. Clean Prod. 2020, 247, 119139. [Google Scholar] [CrossRef]
- Castán Broto, V.; Baker, L. Spatial adventures in energy studies: An introduction to the special issue. Energy Res. Soc. Sci. 2018, 36, 1–10. [Google Scholar] [CrossRef] [Green Version]
- Bridge, G.; Bouzarovski, S.; Bradshaw, M.; Eyre, N. Geographies of energy transition: Space, place and the low-carbon economy. Energy Policy 2013, 53, 331–340. [Google Scholar] [CrossRef]
- Bulkeley, H. Reconfiguring environmental governance: Towards a politics of scales and networks. Polit. Geogr. 2005, 24, 875–902. [Google Scholar] [CrossRef] [Green Version]
- Zhao, X.; Luo, D. Driving force of rising renewable energy in China: Environment, regulation and employment. Renew. Sust. Energy Rev. 2017, 68, 48–56. [Google Scholar] [CrossRef]
- Wang, X.; Du, L. Carbon Emission Performance of China’s Power Industry: Regional Disparity and Spatial Analysis. J. Ind. Ecol. 2017, 21, 1323–1332. [Google Scholar] [CrossRef]
- Peng, X.; Tao, X.; Zhang, H.; Chen, J.; Feng, K. CO2 emissions from the electricity sector during China’s economic transition: From the production to the consumption perspective. Sustain. Prod. Consum. 2021, 27, 1010–1020. [Google Scholar] [CrossRef]
- Department of Energy Statistics, National Bureau of Statistics, P.R.O.C. China Energy Statistical Yearbook 2020; China Statistic Press: Beijing, China, 2020. [Google Scholar]
- Wang, F.; Dou, N.; Yu, D. Measurement of Provincial CO2 Emission from Fossil Energy Consumption Based on Carbon Emission Flow in Power Systems. Autom. Electr. Power Syst. 2014, 38, 105–112. [Google Scholar]
- Ang, B.W.; Su, B. Carbon emission intensity in electricity production: A global analysis. Energy Policy 2016, 94, 56–63. [Google Scholar] [CrossRef]
- Fan, J.; Wang, J.; Hu, J.; Wang, Y.; Zhang, X. Optimization of China’s provincial renewable energy installation plan for the 13th five-year plan based on renewable portfolio standards. Appl. Energy 2019, 254, 113757. [Google Scholar] [CrossRef]
- Zhang, S.; Huang, C.; Li, Y.; Yan, Z.; Wei, L.; Chi, F. Suggestions on Electric Power Industry Reform under Regional Integration of Yangtze River Delta. In Proceedings of the 3rd International Electrical and Energy Conference (CIEEC), Beijing, China, 7–9 September 2019; IEEE: Piscataway, NJ, USA, 2019; pp. 1007–1011. [Google Scholar]
- State Grid Corporation of China. Compilation of Statistics 2006; Department of Development and Planning of State Grid Corporation of China: Beijing, China, 2007. [Google Scholar]
- State Grid Corporation of China. Compilation of Statistics 2019; Department of Development and Planning of State Grid Corporation of China: Beijing, China, 2020. [Google Scholar]
- Editorial committee of China Southern Power Grid Corporation Yearbook. China Southern Power Grid Corporation Yearbook 2007; Guangdong Science and Technology Press: Guangzhou, China, 2007. [Google Scholar]
- Editorial committee of China Southern Power Grid Corporation Yearbook. China Southern Power Grid Corporation Yearbook 2020; Guangdong Science and Technology Press: Guangzhou, China, 2020. [Google Scholar]
- Department of Energy Statistics, National Bureau of Statistics, P.R.O.C. China Energy Statistical Yearbook 2007; China Statistic Press: Beijing, China, 2008. [Google Scholar]
- Zhu, Y.; Ke, J.; Wang, J.; Liu, H.; Jiang, S.; Blum, H.; Zhao, Y.; He, G.; Meng, Y.; Su, J. Water transfer and losses embodied in the West–East electricity transmission project in China. Appl. Energy 2020, 275, 115152. [Google Scholar] [CrossRef]
- China Electricity Council. Annual Report on China’s Power Industry Development 2020; China Construction Industry Press: Beijing, China, 2020. [Google Scholar]
- Chen, G.; Chen, B.; Zhou, H.; Dai, P. Life cycle carbon emission flow analysis for electricity supply system: A case study of China. Energy Policy 2013, 61, 1276–1284. [Google Scholar] [CrossRef]
- Zeng, B.; Zeng, M.; Xue, S.; Cheng, M.; Wang, Y.; Feng, J. Overall review of wind power development in Inner Mongolia: Status quo, barriers and solutions. Renew. Sustain. Energy Rev. 2014, 29, 614–624. [Google Scholar] [CrossRef]
- Statistical Bureau of Sichuan; NBS Survey Office in Sichuan. Sichuan Statistical Yearbook-2007; China Statistic Press: Beijing, China, 2006. [Google Scholar]
- China Electricity Council. Annual Report on China’s Power Industry Development 2007; China Construction Industry Press: Beijing, China, 2007. [Google Scholar]
- Mou, D.; Li, Z. A spatial analysis of China’s coal flow. Energy Policy 2012, 48, 358–368. [Google Scholar] [CrossRef]
- Cheng, C.; Shen, J.; Wu, X.; Chau, K. Operation challenges for fast-growing China’s hydropower systems and respondence to energy saving and emission reduction. Renew. Sustain. Energy Rev. 2012, 16, 2386–2393. [Google Scholar] [CrossRef] [Green Version]
- Bao, C.; Fang, C. Geographical and environmental perspectives for the sustainable development of renewable energy in urbanizing China. Renew. Sustain. Energy Rev. 2013, 27, 464–474. [Google Scholar] [CrossRef]
- Wei, W.; Wu, X.; Wu, X.; Xi, Q.; Ji, X.; Li, G. Regional study on investment for transmission infrastructure in China based on the State Grid data. Front. Earth Sci.-Prc. 2017, 11, 162–183. [Google Scholar] [CrossRef]
- Ma, J. On-grid electricity tariffs in China: Development, reform and prospects. Energy Policy 2011, 39, 2633–2645. [Google Scholar] [CrossRef]
- National Energy Agency (NEA). Development of Wind Power Industry in 2015. Available online: http://www.nea.gov.cn/2016–02/02/c_135066586.htm (accessed on 20 June 2017).
- Wang, F.; Yin, H.; Li, S. China’s renewable energy policy: Commitments and challenges. Energy Policy 2010, 38, 1872–1878. [Google Scholar] [CrossRef]
- State Electricity Regulatory Commission (SERC). Audit Reports on Wind Power and Photovoltaic Power Generation. Available online: http://www.cec.org.cn/d/file/yaowenkuaidi/2011–02–12/dca82e0cf3f1aa57e7d8872f286d6f0f.pdf (accessed on 20 June 2018).
Figure 1.
Analysis scheme of this paper.

Figure 2.
Chinese mainland regional power grid.

Figure 3.
Size of Chinese inter-provincial electricity flow from 2006 to 2019 [44].
Figure 3.
Size of Chinese inter-provincial electricity flow from 2006 to 2019 [44].

Figure 4.
ACIP and proportion of renewable energy of Chinese mainland provinces, 2006 and 2019 (No data for Tibet).
Figure 4.
ACIP and proportion of renewable energy of Chinese mainland provinces, 2006 and 2019 (No data for Tibet).

Figure 5.
Spatial pattern of inter-provincial CO2 flow from electricity, 2006.

Figure 6.
Spatial pattern of inter-provincial CO2 flow from electricity, 2019.

Figure 7.
Comparison of ACIC values of consumption considering power transmission in 2006 and 2019 (No data for Tibet).
Figure 7.
Comparison of ACIC values of consumption considering power transmission in 2006 and 2019 (No data for Tibet).


| Fuel Type | CC (g C/MJ) | OR (%) | LHV (MJ/t or MJ/104 m3) | Fuel Type | CC (g C/MJ) | OR (%) | LHV (MJ/t or MJ/104 m3) |
|---|---|---|---|---|---|---|---|
| Raw Coal | 26.37 | 98 | 20,908 | Natural Gas | 15.32 | 99 | 50,179 |
| Cleaned Coal | 25.41 | 98 | 26,344 | Refinery Gas | 18.2 | 99 | 45,998 |
| Other Washed Coal | 25.41 | 98 | 10,454 | Liquefied Petroleum Gas | 17.2 | 99 | 389,310 |
| Briquette | 33.56 | 98 | 17,584 | Other Petroleum Products | 20 | 98 | 35,168 |
| Coke | 29.42 | 93 | 28,435 | Other Coking Products | 29.42 | 93 | 38,099 |
| Coke Oven Gas | 13.58 | 99 | 173,535 | Gangue | 25.8 | 98 | 8363 |
| Other Gas | 12.2 | 99 | 202,218 | Blast Furnace Gas | 70.8 | 99 | 37,630 |
| Crude Oil | 20.08 | 98 | 41,816 | Converter Gas | 46.9 | 99 | 79,450 |
| Gasoline | 18.9 | 98 | 43,070 | Petroleum Coke | 27.5 | 98 | 31,947 |
| Diesel | 20.2 | 98 | 42,652 | LNG | 15.32 | 99 | 51,434 |
| Fuel Oil | 21.1 | 98 | 41,816 | Other Energy | 0 | 0 | 0 |
Publisher’s Note: MDPI stays neutral with regard to jurisdictional claims in published maps and institutional affiliations. |
© 2021 by the author. Licensee MDPI, Basel, Switzerland. This article is an open access article distributed under the terms and conditions of the Creative Commons Attribution (CC BY) license (https://creativecommons.org/licenses/by/4.0/).
Share and Cite
MDPI and ACS Style
Ma, L. Inter-Provincial Power Transmission and Its Embodied Carbon Flow in China: Uneven Green Energy Transition Road to East and West. Energies 2022, 15, 176. https://0-doi-org.brum.beds.ac.uk/10.3390/en15010176
AMA Style
Ma L. Inter-Provincial Power Transmission and Its Embodied Carbon Flow in China: Uneven Green Energy Transition Road to East and West. Energies. 2022; 15(1):176. https://0-doi-org.brum.beds.ac.uk/10.3390/en15010176
Chicago/Turabian StyleMa, Li. 2022. "Inter-Provincial Power Transmission and Its Embodied Carbon Flow in China: Uneven Green Energy Transition Road to East and West" Energies 15, no. 1: 176. https://0-doi-org.brum.beds.ac.uk/10.3390/en15010176
Note that from the first issue of 2016, this journal uses article numbers instead of page numbers. See further details here.