
Equivalent Model of Photovoltaic Power Station Considering Different Generation Units’ Fault Current Contributions

1
School of Technology, Beijing Forestry University, Beijing 100083, China
2
State Key Laboratory of Power Grid Safety and Energy Conservation, China Electric Power Research Institute, Beijing 100192, China
3
State Key Laboratory of Alternate Electrical Power System with Renewable Energy Sources, North China Electric Power University, Beijing 102206, China
*
Author to whom correspondence should be addressed.
Energies 2022, 15(1), 229; https://0-doi-org.brum.beds.ac.uk/10.3390/en15010229
Submission received: 5 November 2021
/
Revised: 19 December 2021
/
Accepted: 21 December 2021
/
Published: 30 December 2021
(This article belongs to the Special Issue Optimization and Control of New Energy Systems)
Abstract
:The fault current calculation model of photovoltaic (PV) power stations is usually treated as a capacity weighted equivalent model of a single PV generation unit (PVGU). However, in the same PV power station, different PVGUs have various fault current characteristics. As a result, there are significant differences in fault current characteristics between a PVGU and a PV power station. It means that the existing capacity weighted equivalent model cannot be used for accurately describing the fault current contributions from a practical PV power station. In this paper, the fault behaviors of the PVGUs located at different access points of a PV power station are firstly analyzed. The difference in PVGUs’ fault current contributions is identified and reflected with the activation states of current limiters that are employed for PV inverters. The activation states are represented by a theoretical expression so as to distinguish the PVGUs’ fault contributions. Further, based on the proposed theoretical expression, a novel algorithm is developed for sorting all PVGUs included in a PV power station. The multi-machine calculation model is deduced in order to exactly express the fault current contribution from a PV station. Finally, some simulation tests are conducted. The tested results verify the effectiveness of the proposed calculation model. It can provide support for calculating the protection setting of power grid connected with large-scale PV stations.

1. Introduction
With the increasing capacity of grid-connected photovoltaic (PV) power stations, the fault current characteristics of a power grid are greatly altered. Traditional theory cannot be used for explaining the fault current characteristics of a PV power station [1,2]. Although the fault current contribution of a PV power station is described by the detailed model composed of each PV generation unit (PVGU) and its collection system [3,4], the model is too complicated to derive a theoretical expression for calculating the fault current contributions [5].
In order to express theoretically the fault current contributions of a PV power station, more attention has been paid to establishing the equivalent models of a PV power station. In the literature [6], considering the fault responses of inverters’ control strategies, the equivalent models were built based on mirroring the sequence models of synchronous generators. Different from the aforementioned work, the PVGUs were treated with a current source taken the effect of the current limiter in current loop control in the literature [7]. Indeed, the equivalent models were influenced by the fault response of the inverters’ control strategies [8]. However, in these studies, the impact of solar irradiation was not taken into account. In fact, the fault current contribution was related with solar irradiation. Aimed at this problem, the fault current contributions of a PV-dominated feeder were analyzed under various irradiations in the literature [9]. Further, the equivalent models were developed only for calculating distance relay setting at the PV side [10]. The above-mentioned models were developed only based on a single PVGU’s fault behaviors.
Nevertheless, a PV power station usually contains hundreds or even thousands of PVGUs [11,12]. These PVGUs’ fault characteristics are various due to spatial irradiation distribution, changeable faulty voltages at different access points, numerous possible fault-ride-through strategies, and so on [13,14,15,16]. The fault current contribution from a PV power station is not represented by a PVGU’s fault behaviors, but by all PVGUs’ fault characteristics. It is essential for establishing the equivalent model of a PV power station to characterize the difference in fault current contributions from all PVGUs.
However, the study on the dissimilarity between fault current contributions from all PVGUs is relatively less. The existing literatures mainly focus on the fault behaviors of a single PVGU during grid faults [17,18]. Further the influencing factors of fault behaviors are revealed [19,20]. These research results can mainly reflect fault current characteristics of a single PVGU, but they were not concerned with the difference in PVGUs’ fault contributions. It is well known that the PVGUs’ fault current contributions are closely related with their fault transient response of a control and protection system [21]. However, the distinction between PV inverters’ fault responses is generally unknown. As a result, it becomes challenging to reveal the fault current contribution from different PVGUs.
In the previous studies, the impact of different fault current contributions from the PVGUs on the equivalent calculation of a PV power station has not been taken into account. Whereas the fault current characteristics of a PV power station are decided by the integrated fault behaviors of the included PVGUs. Thus, the objective of this paper is to propose a new calculation model of a PV power station with consideration of different PVGUs’ fault current contributions. Firstly, the different fault responses and their influencing factors are analyzed for the PVGUs that are included in a PV power station. Based on this, the difference in fault current contributions from the PVGUs is characterized by the activation state of the current limiters employed for the PV inverters. The activation states are described by the mathematical expression that is mainly related with spatial irradiation distribution and different access points’ faulty voltages. A novel sorting method is further proposed for distinguishing the fault current contributions from the PVGUs. The multiple PVGUs in a PV station are divided into two groups. Finally, the integrated fault current calculation model is derived for the PV power stations. At the same time, both simulation tests and theoretical analysis are conducted to demonstrate the correctness of the proposed calculation model.
In this paper, the equivalent model of a PV power station is developed with consideration of different PVGUs’ fault current contributions. The main contributions of the paper are as follows: (1) to characterize the difference in PVGUs’ fault current contributions, the activation states of current limiters for PV inverters are used and expressed; and (2) to build the fault current calculation model of a PV power station, a novel shorting algorithm is proposed according to both spatial irradiation distribution and different access points’ faulty voltages, which are closely related with the activation states.
The paper is organized as follows. In Section 2, the various fault response characteristics of different PV inverters are analyzed. The practical two-machine clustering algorithm is presented in detail in Section 3. In Section 4, the equivalent model is derived for calculating the fault current contribution of a PV power station. The proposed clustering algorithm and the calculation model are verified under different fault scenarios in Section 5. Conclusions are drawn in Section 6.
2. Various Fault Response Characteristics of Different PVGUs
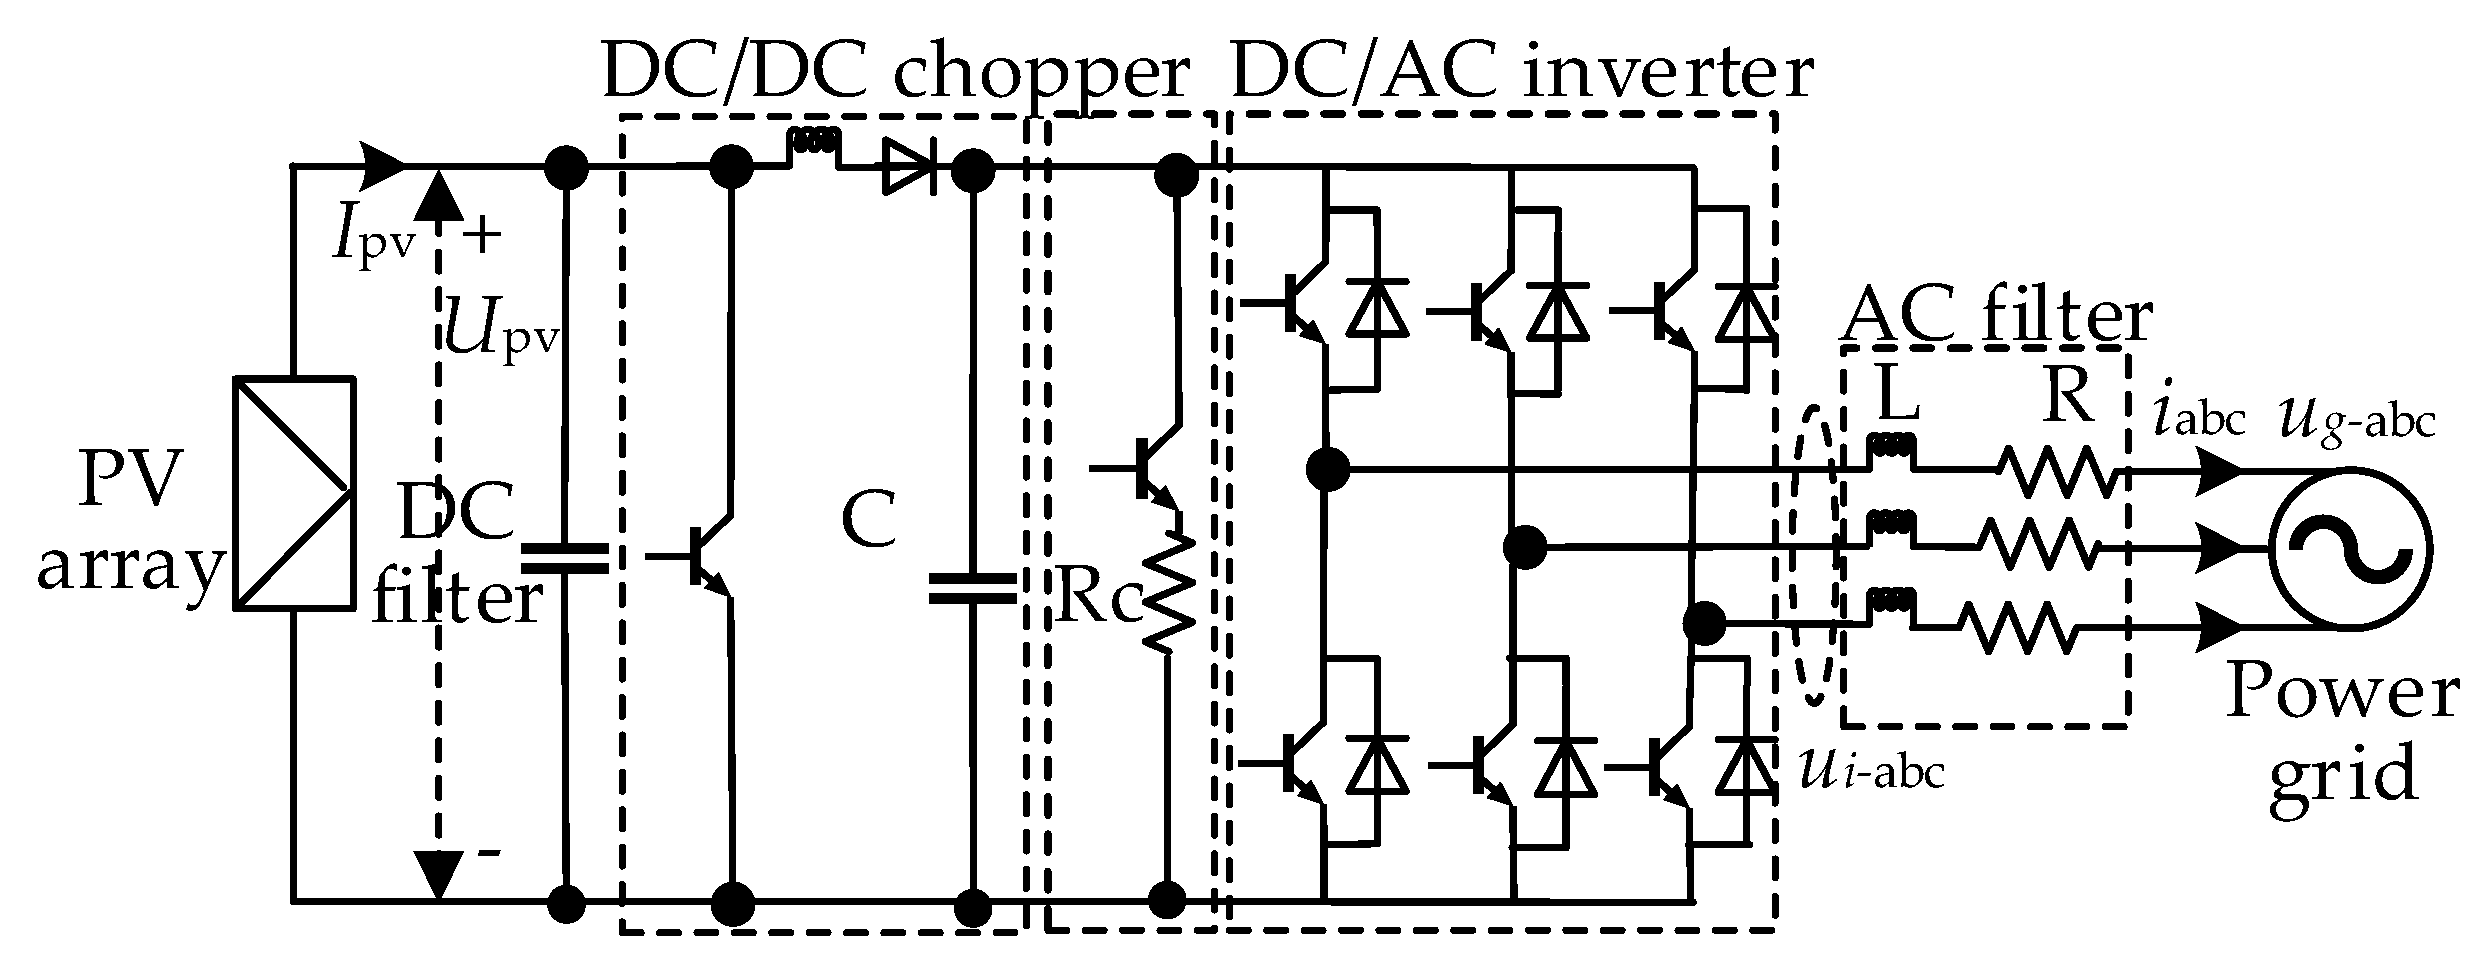
In order to distinguish the current contributions from different PVGUs installed in a PV power station, the PVGUs’ fault behaviors are studied in the section. The typical topology of each PVGU connected with a PV station is shown as Figure 1. PV arrays are integrated with a boost DC/DC chopper, and then the chopper is linked to the power grid through a DC/AC inverter.
As shown in Figure 1, the inverter can isolate the PV arrays from the grid faults. Therefore, the PVGU’s fault current contribution is mainly determined by the inverter’s fault behaviors. Ignoring active power losses, the electrical variables at the inverter’s AC- and DC-side can be expressed as:
where and denote the positive- and negative-sequence voltage vector at the point of common coupling (PCC), respectively. and are the inverter’s AC-side positive- and negative-sequence voltage vectors, respectively. Ip and In represent the positive- and negative-sequence current vector flowing through inverter into the grids, respectively. R represents the equivalent resistance considering the inverter’s and AC filter’s power losses. L is the AC filter’s equivalent inductance. ω1 is the grid frequency. Ppv represents the inverter’s DC-side input power provided by PV arrays, and it is mainly decided by the solar irradiation. Pg is the active power fed into the grid through the inverter. Udc is the DC-link voltage, and C is the DC-link capacitor.
In Equation (1), and are decided directly by the inverter’s control loops. The control loops are composed of inner current controller and outer voltage controller. The corresponding mathematical equation is written as [22,23]:
where Ip and In are the positive- and negative-sequence actual currents, respectively. Ip* and In* denote their current reference values. To make sure that only a positive-sequence current is provided by PVGUs during the fault, In* is always set as . represents the DC voltage reference. kip, kii, kvp, and kvi are the proportional and integral gains of inner current controller as well as outer voltage controller, respectively. In order to achieve the decoupling control of the d- and q-axis current component, both jω1LIp and jω1LIn denote the decoupling feed-forward terms of inner current control loop.
Based on the reactive power requirement of grid code [24], the q-axis component of the positive-sequence current through the inverter is set as follows:
In Equation (1), the voltage at the PCC can be altered quickly once the grid faults occur. Nevertheless, the voltage Ui at the inverter’s AC-side cannot make a fast response to grid faults. It leads to the rapid increasing of the current flowing through the inverter. The current may exceed easily the inverters’ allowable maximum current, especially under the asymmetric faults. To solve the over-current problem, the current limiter is used for the inverters’ current control loop. As a result, the fault currents through inverter can be restricted, and set equal to the inverters’ maximum allowable current.
If the current flowing through PV inverters is limited, the active powers become obviously imbalanced at the inverters’ AC- and DC-side. Consequently, the DC-link voltage rises quickly. To avoid the over-voltage problem, the DC-chopper circuit is employed for depleting the imbalanced power. Consequently, it makes the DC-link voltage stable.
As mentioned, the PVGU’s fault behaviors vary under different fault scenarios. The fault behaviors can be seen as the following: (1) Fault response modes, which are determined by the activation series of PV inverters’ control and protection system. There are usually two modes. The one is the deactivation of current limiter and DC chopper circuit throughout grid faults (called as mode I). The other is the activation of current limiter and DC chopper circuit after grid faults (named as mode II); (2) Fault transient processes under a fixed mode, which are influenced by the parameters of PV inverters’ control and protection system. For instance, under mode I, the PVGUs’ fault characteristics are dominated mainly by the corresponding parameters of outer DC-link voltage controller and inner current controller. The fault response of DC-link voltage control loops is usually slower than the one of current control loop. For different PVGUs with different controller parameters, their fault transient processes are various even if the fault scenarios are the same.
In this manuscript, the study on the PVGUs’ fault behaviors is oriented to reveal the fault current contributions. The short-circuit currents are analyzed for calculating the setting of backup protection. The protection only depends on the fault current characteristics after 15 cycles of grid fault. In this period of time the PVGUs’ fault responses become stable. The fault current contributions from the PVGUs are independent of the mentioned fault transient processes, but they are closely related with the mentioned fault response modes. Therefore, the fault response modes can be used for distinguishing the current contributions from different PVGU.
It is noted that the fault response modes are related with the activation states of the current limiter and DC chopper circuit after grid faults. Once the current limiter is triggered, the DC chopper circuit is also activated. Thus, the activation states of current limiters can be used for reflecting the dissimilarity of PVGUs’ fault response modes. In the following section, a novel algorithm is discussed for categorizing the PVGUs included in PV station based on the activation states of current limiters.
3. A Novel Algorithm for Classifying Fault Current Contributions from Different PVGUs
A practical PV station is composed of multiple PVGUs. These PVGUs are irregularly installed in different access points. For different PVGUs, both faulty voltages and solar irradiations are various. As a result, the activation of the PVGUs’ current limiter is changeable. Here, a novel algorithm is developed based on the activation states of current limiters. In the following discussion, we discuss how to differentiate the current limiter activation or inactivation.
In a PV power station, each PVGU’s inverter is usually controlled to restrain the negative current through inverter. Consequently, the average active and reactive power provided by the i-th PVGU can be expressed as:
where and represent the average active and reactive power, respectively. is the d-axis component of positive-sequence voltage at the PCC. and denote the d- and q-axis of the positive-sequence current flowing through inverter into the grid, respectively. According to Equation (4), the fault current contribution from the i-th PVGU is:
where UgN-i is the rated voltage at the PCC of the i-th PVGU. γi is the corresponding positive-sequence voltage sag depth. () represents the apparent power provided by the i-th PVGU. Ignoring the power losses of both the inverter and AC filter, when the current limiter and DC-chopper circuit are not activated, and can also be represented as:
where Ppv-i is the inverter’s DC-side input power provided by the i-th PV arrays. IN-i is the rated current flowing through the i-th inverter into the grid. According to Equations (5) and (6), the activation state of the current limiter is expressed as:
where αi = 1 indicates the activation of current limiter, and αi = 0 denotes the deactivation. Ilim-i is the i-th inverters’ allowable maximum current. SgN-i is the rated apparent power provided by the i-th PVGU. Ilim-i, SgN-i, and UgN-i are constant, but Ppv-i and γi are altered under different fault scenarios.
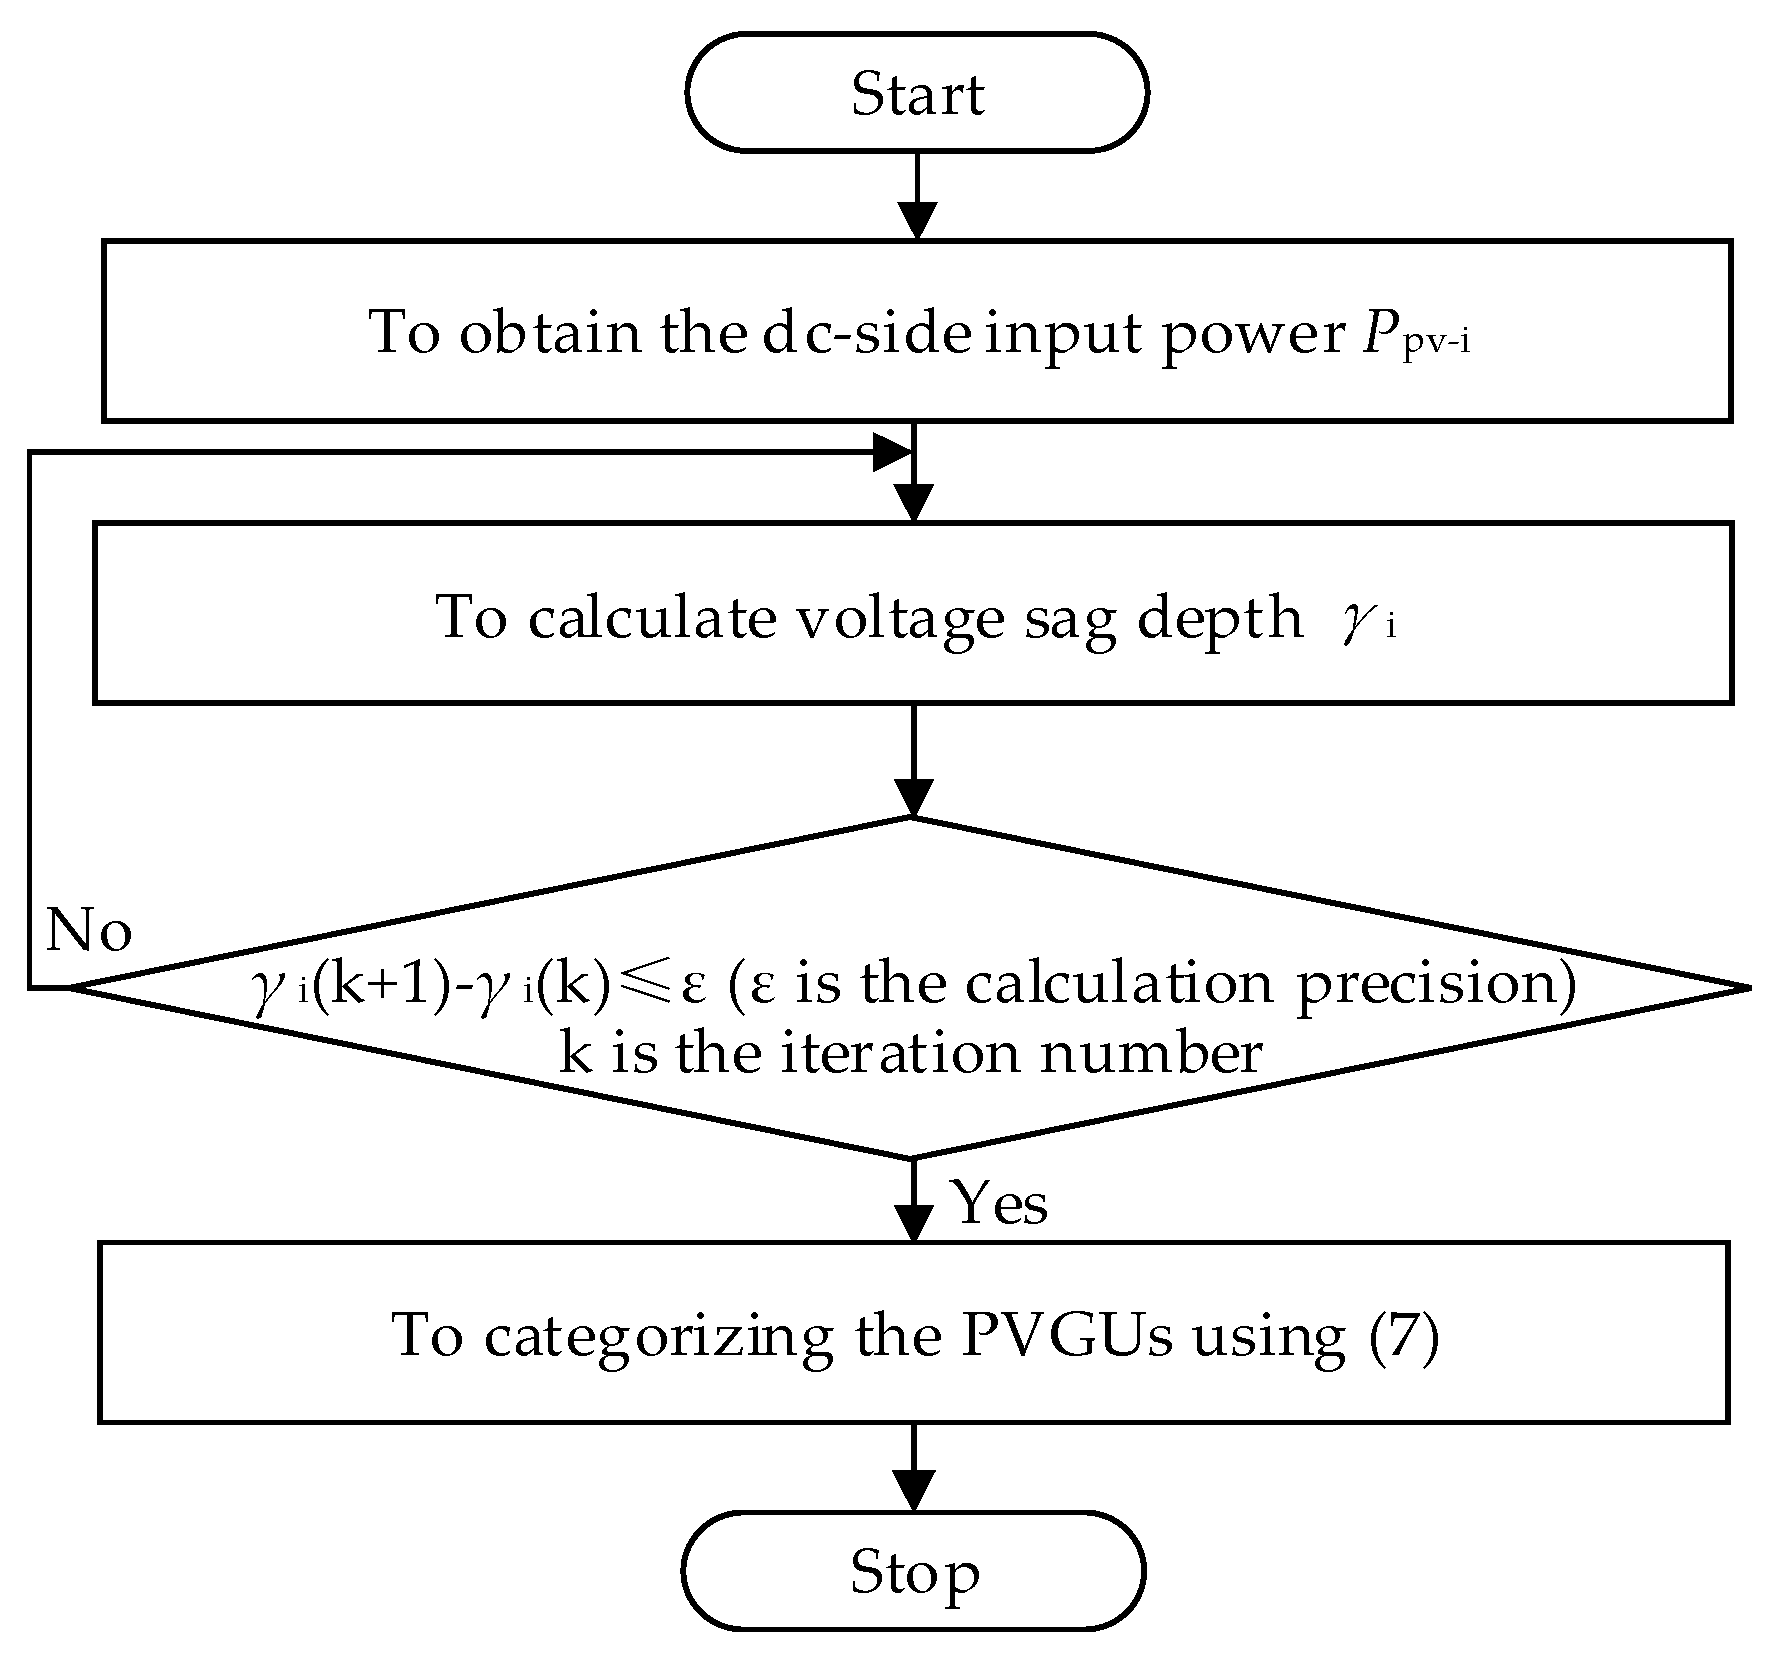
Therefore, the variables Ppv-i and γi are crucial to distinguish the activation state of the current limiters. Ppv-i can be usually obtained from the typical summer or winter solar irradiation. γi is equal to the positive-sequence faulty voltage at different access points, and it can be obtained by combining the fault analysis model of the power grid with the PV generators. How to calculate the variable γi is discussed in Section 5. In order to categorize the PVGUs installed in a PV power station, the procedure is shown as Figure 2.
Here, the activation states of the current limiters are characterized by the variables Ppv-i and γi. The proposed sorting algorithm is related with the variables Ppv-i and γi. The two variables are independent with the complicated fault responses of PVGUs’ control and protection system. Thus, the proposed algorithm is available for distinguishing the fault current contribution from different PVGUs. At the same time, the algorithm is easy because all PVGUs included in a PV power station are only divided into two groups.
4. The Equivalent Model for Calculating Fault Current from a PV Station
According to the proposed sorting algorithm, all PVGUs can be divided into two groups based on the current limiter activation or deactivation. When the current limiter is activated, the fault current amplitude from a PVGU is equal to the employed inverters’ allowable maximum current Ilim-i. With the current limiter deactivation, combing Equations (4), (6), and (7) the d- and q-axis current components provided by a PVGU can expressed as:
Here it is assumed that the number of all PVGUs included in a PV power station is n. If one group includes n1 PVGUs with the activation of current limiter, the other group is n − n1 PVGUs with the deactivation of current limiter. One basis of this, the integrated short-circuit current calculation model of PV station is deduced as:
where If-PV is the fault current contribution from a PV power station. In Equation (9), the j-th inverters’ maximum allowable current Ilim-j, the rated apparent power SgN-i, and the rated voltage UgN-i can be obtained from the detailed product information of PVGU. Thus, the proposed fault current calculation model is related mainly with Ppv-i and γi. The DC-side input power Ppv-i is connected directly with solar irradiation. When the cloud shadow is not taken into account, the solar irradiation is usually identical in the flat PV station regions. It implies that Ppv-i is unique for all PVGUs. γi can be obtained by the mentioned method in Section 5.
Compared with the conventional models, the proposed equivalent model can reflect different fault current contributions from all PVGUs included in a PV power station. In the existing studies, the PV stations are generally modeled as the constant current sources or the controlled current sources. The constant current sources and controlled current sources are mainly based on the fault current characteristics of a single PVGU. By contrast, the main concern of the proposed model is to characterize different fault response modes of all PVGUs included in a PV power station and to derive the integrated fault current contributions from a station.
5. Verification for the Proposed Clustering Algorithm and Equivalent Model
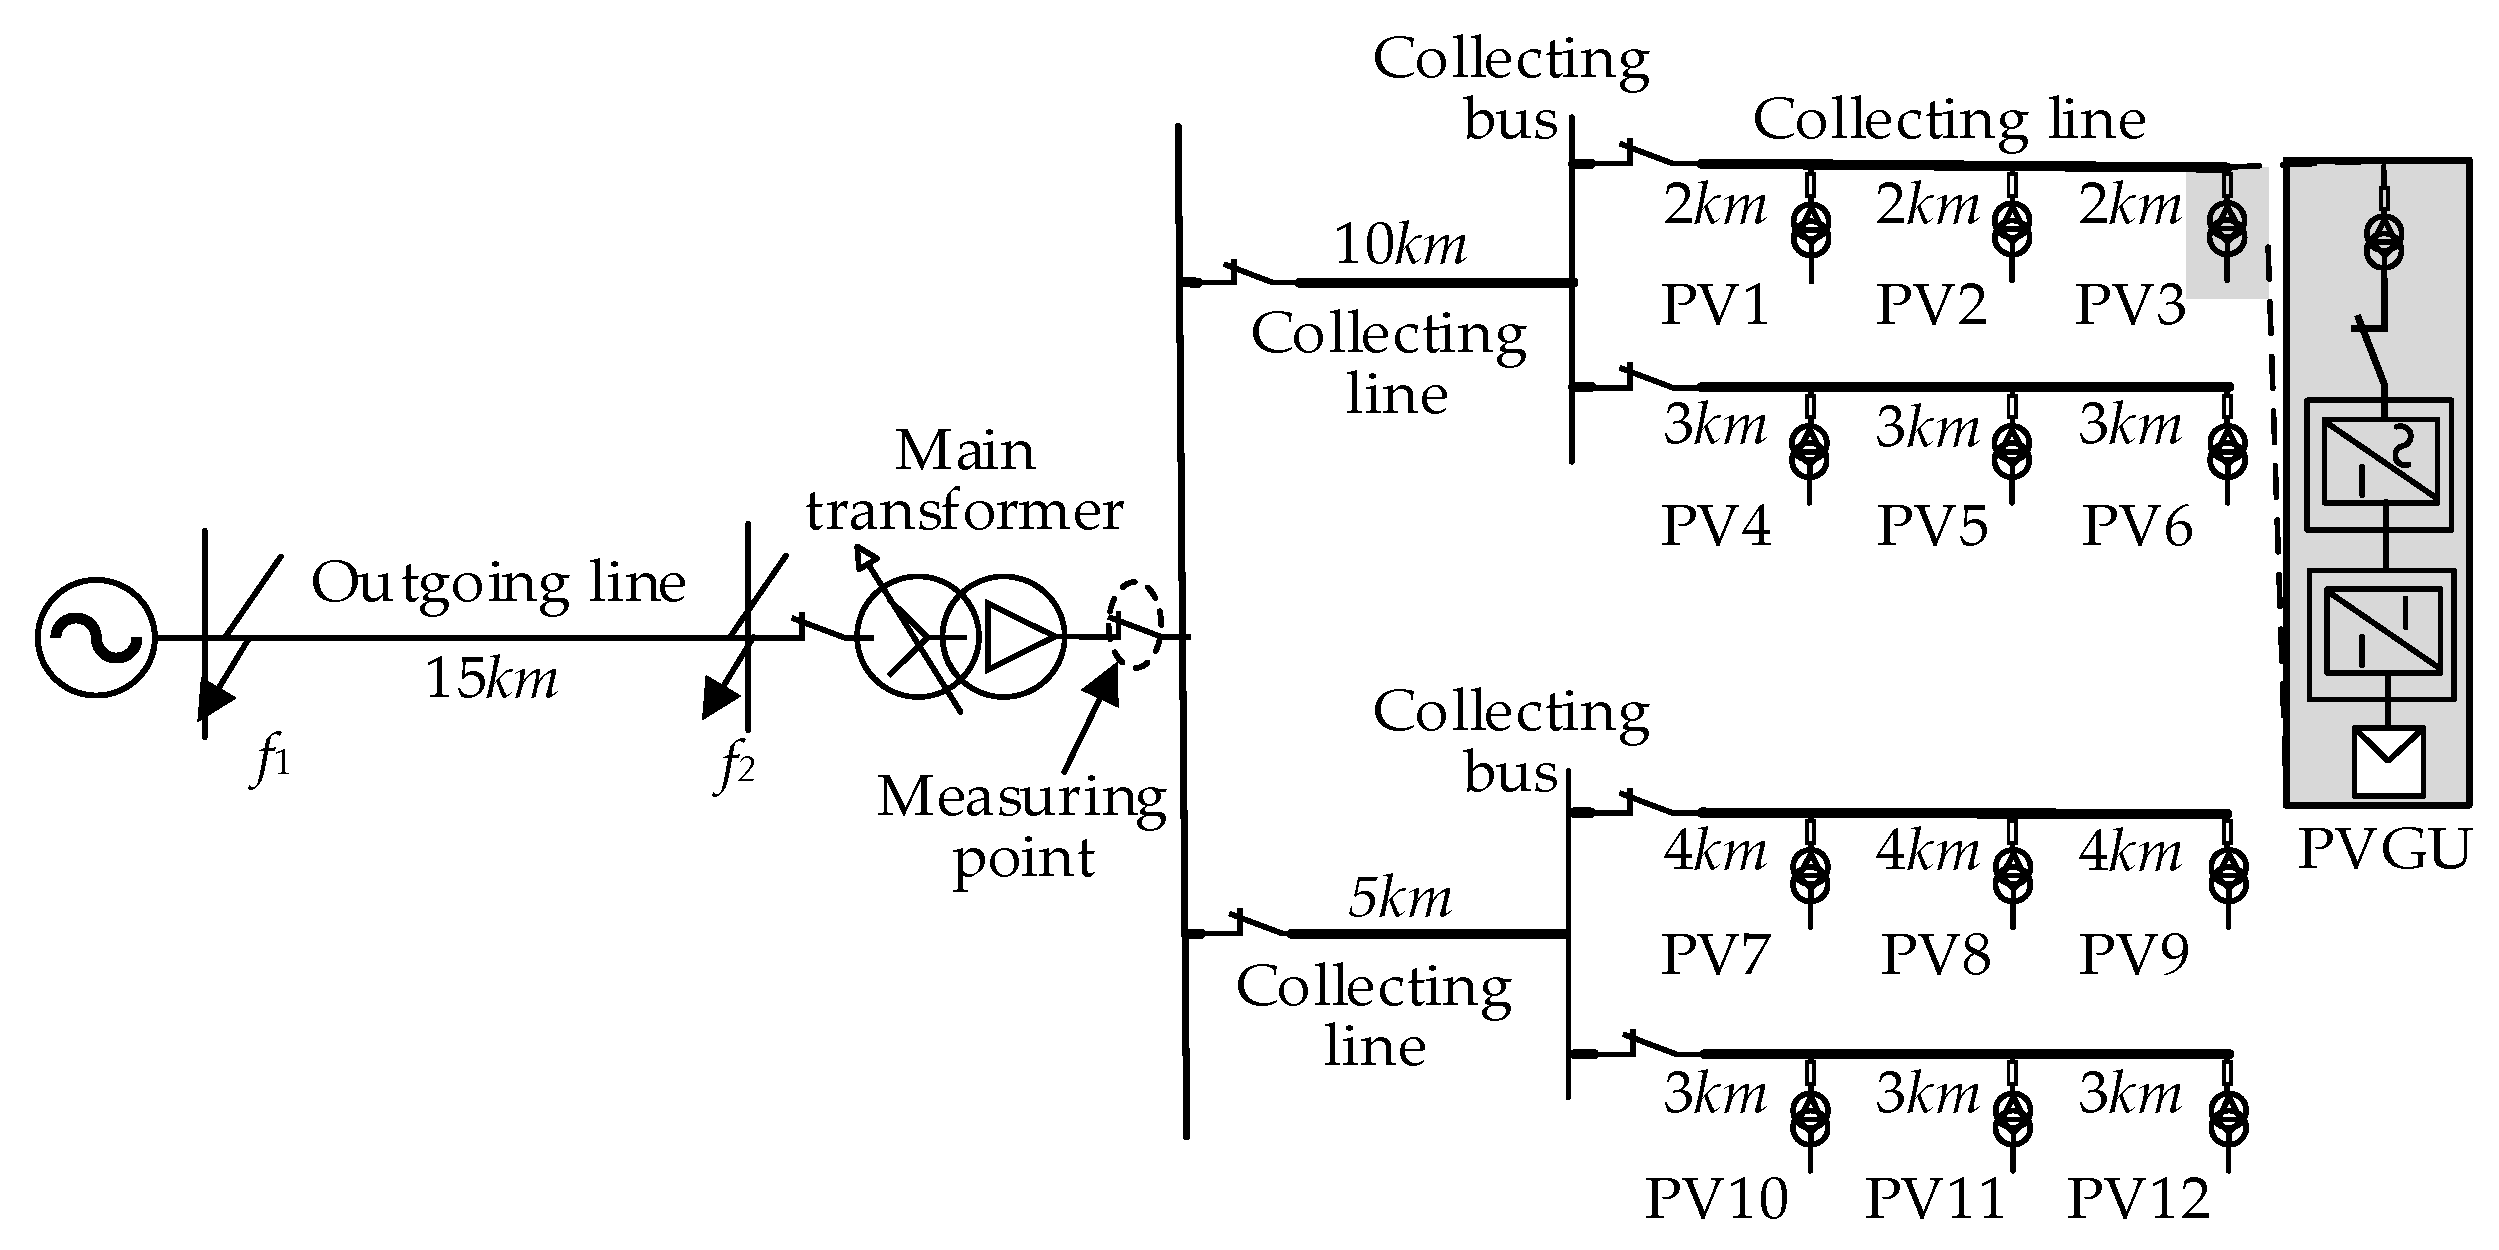
To verify the correctness of the proposed clustering algorithm and equivalent model, some simulation tests and their corresponding theoretical calculation were conducted. The electromagnetic transient simulation model of the power grid with PV station was built based on PSCAD/EMTDC. The topology of the tested power grid with PV station is shown in Figure 3.
The tested power grid’s parameters are listed below. The impedance of equivalent power grid connected with the PV station is j0.287 Ω and j0.351 Ω under the maximum and minimum operation mode, respectively. The outgoing line (positive-sequence impedance: 0.14 Ω/km + j0.407 Ω/km; zero-sequence impedance: 0.42 Ω/km + j1.21 Ω/km) length is 15 km. Two collecting buses (10 kV) are included in the tested PV station. These buses are linked with the main transformer (SZ11-40000/110, Uk% = 17.5) through two overhead lines. Each collecting bus is connected with four collecting lines. Each collecting line is connected with three PVGUs. The electrical distance between the adjacent PVGUs is different as shown in Figure 3. The positive-sequence impedance of collecting lines is 0.3104Ω/km + j0.43894 Ω/km; their zero-sequence impedance is 0.42 Ω/km + j1.21 Ω/km. The PVGUs’ capacity is 1 MW and its rated current is 1.52 kA. The rated DC-link voltage is 0.85 kV. The DC-link capacitor C is equal to 5000 μF. For the AC filter, L is equal to 0.075 mH and R is 0.1 mΩ. The same control strategy is adopted for each PVGU. The strategy is mentioned in the literature [20]. Considering the limitation of space, the strategy is not described in detailed. The inner positive or negative current controller parameters include proportional gain kiP (kiP = 9 p.u.) and integral gain kii (kii = 1/Tii, Tii = 0.25 p.u.). The outer voltage controller including proportional gain kvP (kvP = 1 p.u.) and integral gain kvi (kvi = 1/Tvi, Tvi = 0.025 p.u.).
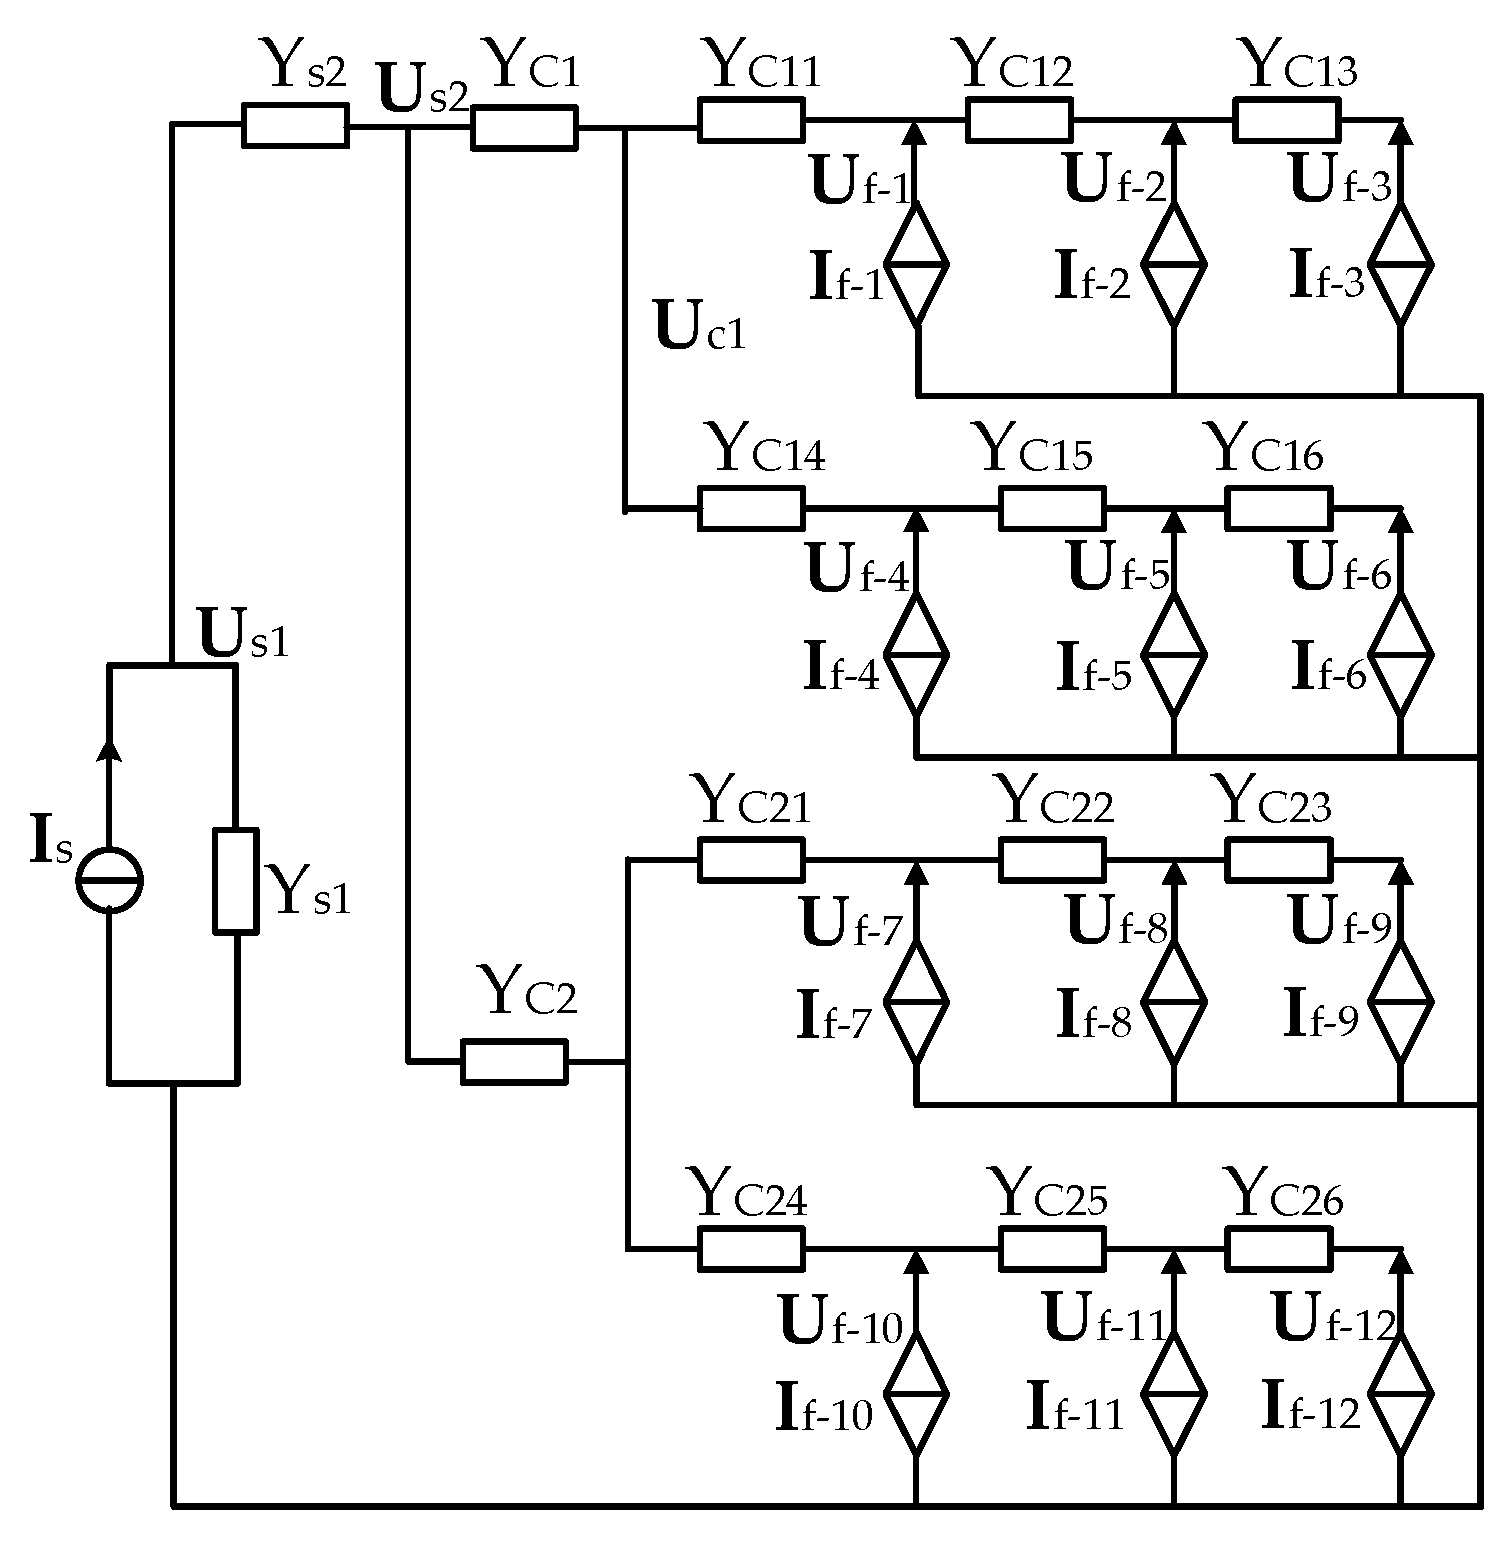
At the same time, in order to obtain the theoretical fault current calculation results, the equivalent fault analysis model of the tested power grid (as shown in Figure 3) is built in Figure 4. At the fault occurrence location, the left power grid shown in Figure 4 is modeled by the current source IS and the paralleled admittance YS1. Moreover, the admittance YS2 represents the equivalent admittance of outgoing line and main transformer when a fault f1 occurs. Once a fault f2 occurs, the admittance YS2 describes the main transformer. In Figure 4, the remaining circuit model represents the PV station including 12 PVGUs.
According to the fault analysis model as shown in Figure 4, different nodal voltages and currents can be deduced as:
The matrix representation of Equation (10) can be written as:
Compared with the equivalent current source IS of the power grid, If-i (i = 1, 2, ⋯, 12) is usually very small. Therefore, for all PVGUs in the identical collecting line, their corresponding positive-sequence voltage sag depth is almost the same. Ignoring the irradiation shadow effect, the DC-side input power Ppv-i of each PVGU in the same collecting line is identical. As a result, Equation (11) can be simplified as:
For obtaining the fault current contribution from a PV station the i-th PVGU’s positive-sequence voltage sag depth γi (γi = |Uf-i|/UgN-i) should be calculated first. According to Equations (10)–(12), Uf-i can gotten from repeated iteration calculation as:
where, , , can be expressed as:
Utilizing Equations (13)–(16), Uf-i can be obtained with the definite calculation precision. γi can also be acquired. At the same time, Ppv-i is gotten from the mentioned illumination intensity regularity. On this basis, the PVGUs can be divided into two groups in the PV stations according to Equation (7). After clustering the PVGUs, the fault current contribution from the PV stations can be calculated using Equation (9).
5.1. The Proposed Clustering Algorithm
It is supposed that all PVGUs are identical in the tested PV station. The output powers of these PVGUs are 0.8 p.u. before grid faults. At t = 0.5 s, the A- and B-phase ground fault f2 occurs. Table 1 shows the clustering simulation result and theoretical calculation result.
From Table 1, the clustering results based on the proposed method and the simulation test results are approximately identical. It means that the proposed method is effective. Although there are some differences among the calculated and tested clustering results, the rests have small impact on the fault current calculation. It is because these PVGUs run in the boundary region of the current limiter activation or deactivation. Whereas, the judgment of the current limiter state is inevitably affected by the approximate calculation based on MATLAB.
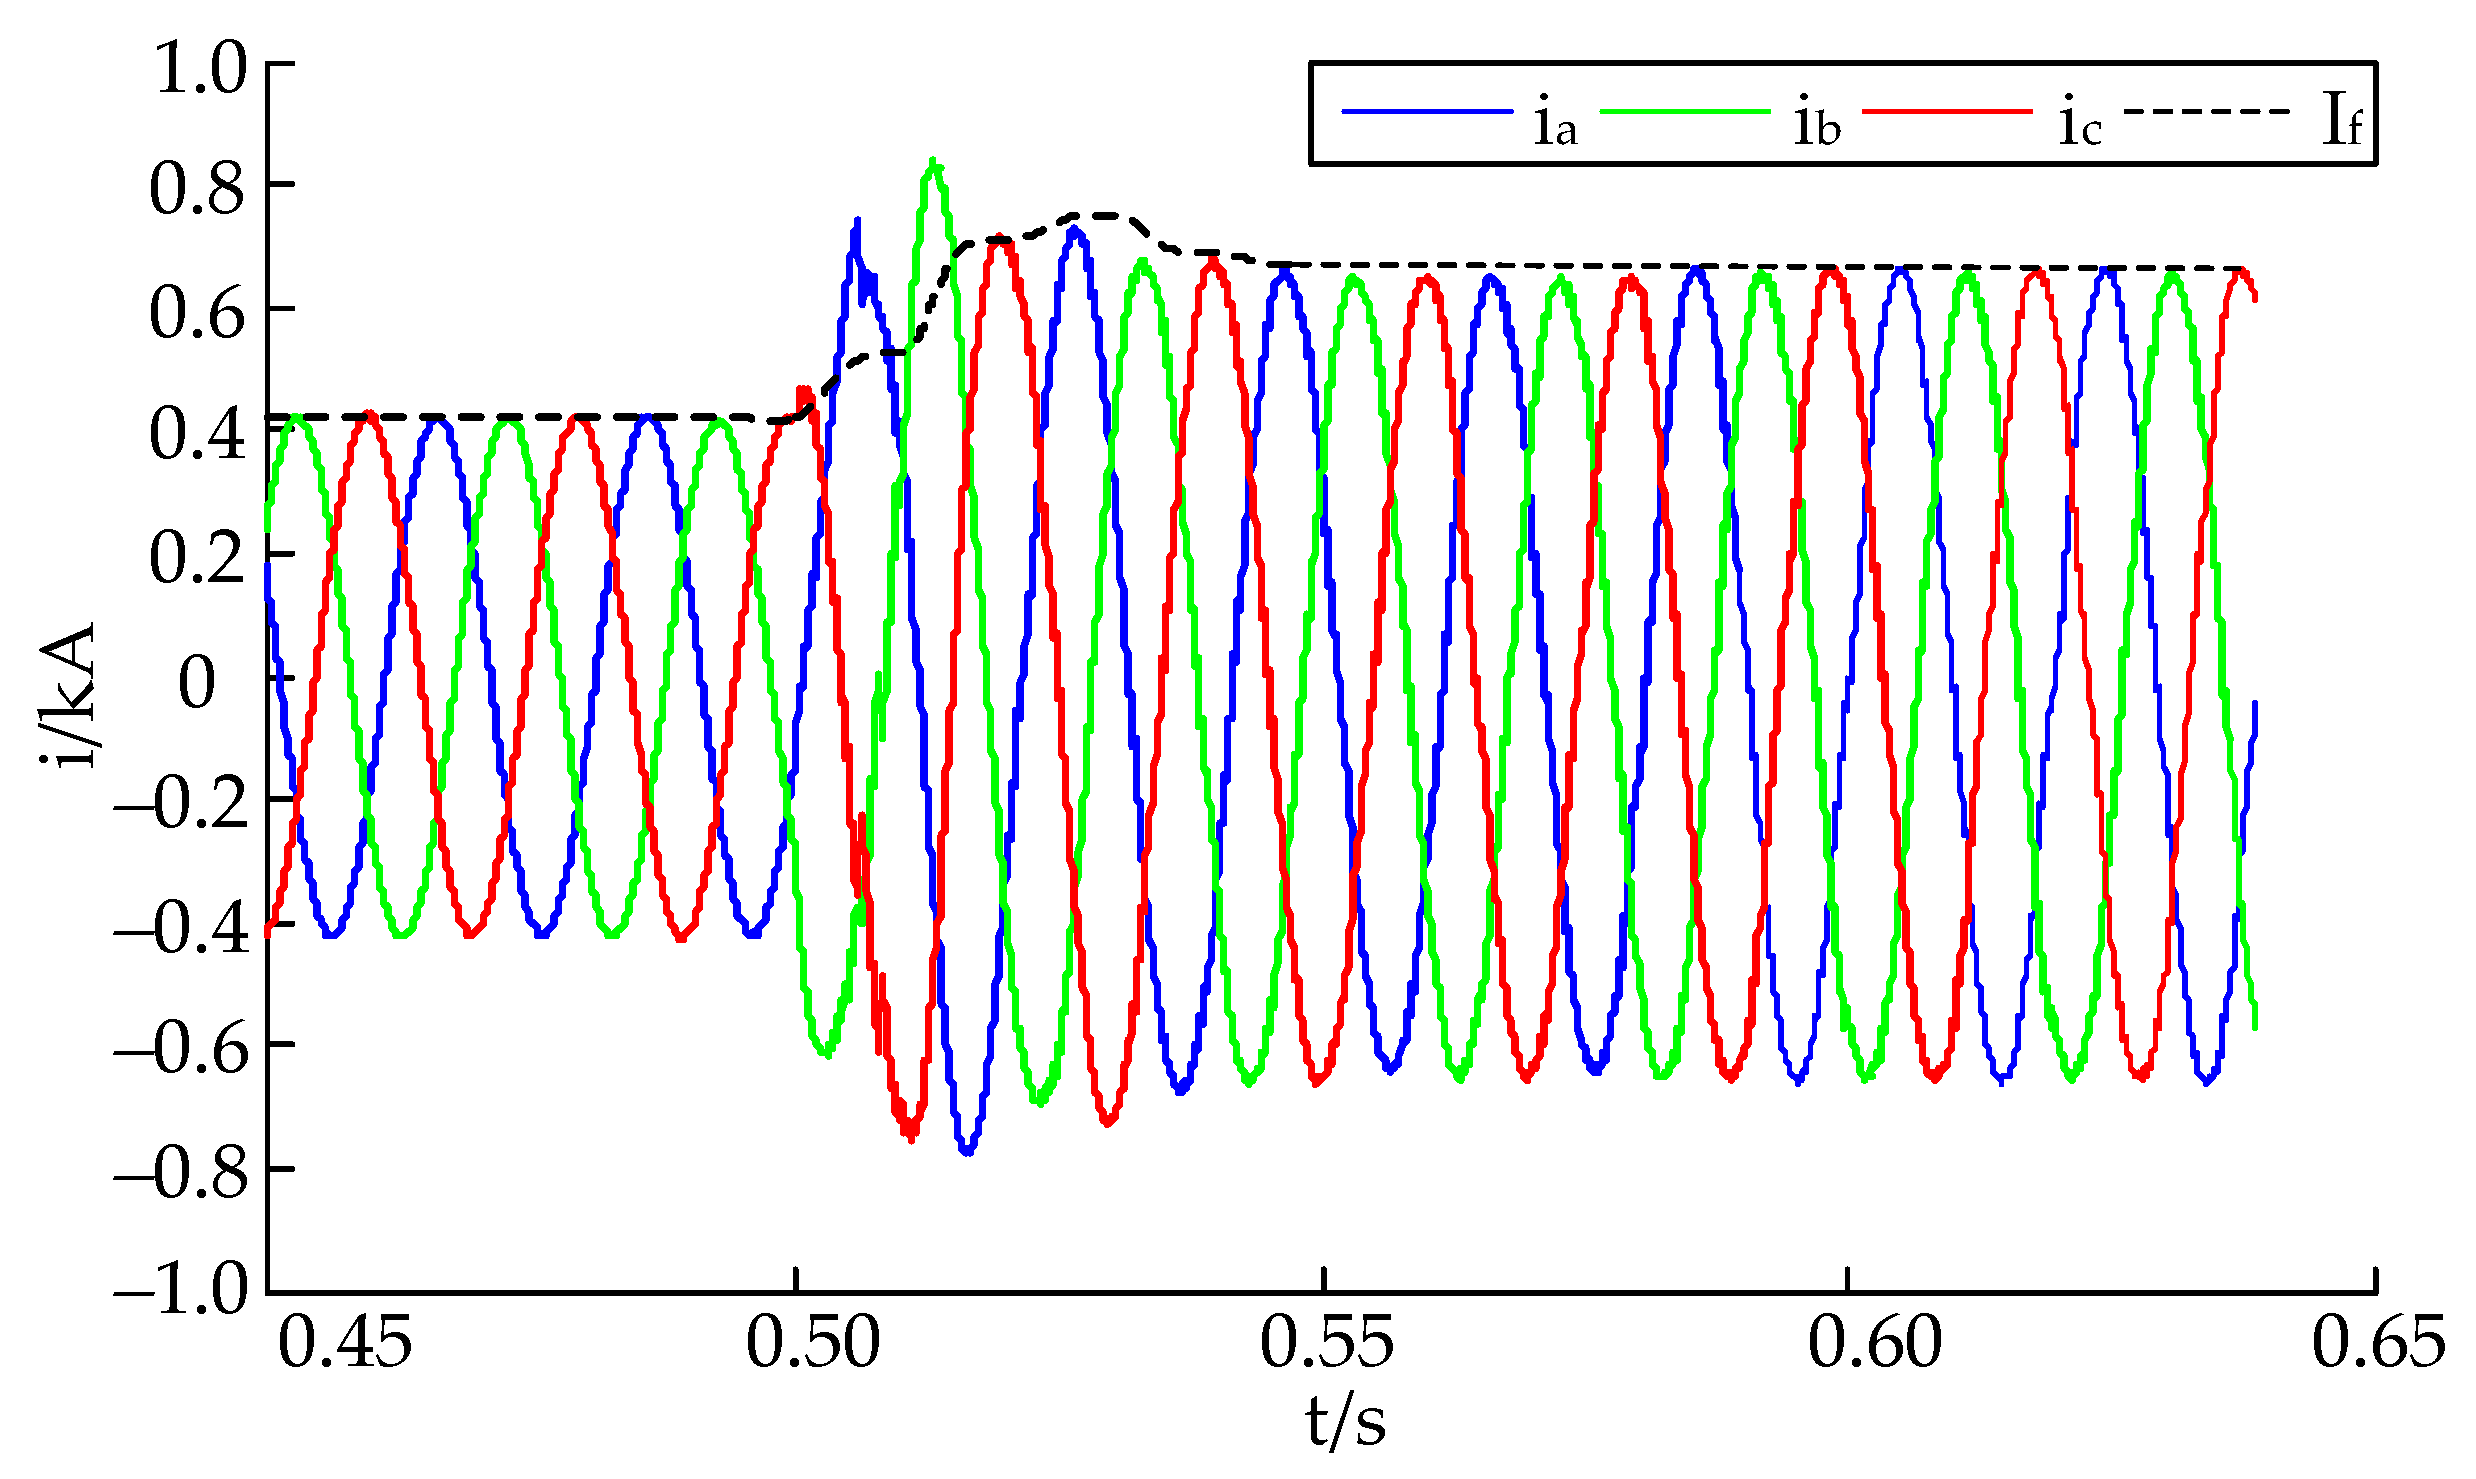
Figure 5 shows the fault current curves of PV power station at the measuring point (as described in Figure 3). The curves include the tested instantaneous currents based on the PSCAD/EMTDC simulation model and the calculated current amplitude based on the proposed equivalent model.
As shown in Figure 5, it is found that the calculated current amplitude Ip is 0.65 kA during the fault. By contrast, the amplitude of the tested instantaneous currents is approximately 0.66 kA during the steady-state fault periods. The error between theoretical calculation and simulation tested results is about −1.5%. It means that theoretical calculation results of steady-state fault currents provided by the PV station are approximately equal to the simulation tested results.
5.2. The Proposed Equivalent Model
The fault f1 and f2 occur in an outgoing line (as shown in Figure 3) when t = 0.5 s. Assuming that the faults f1 and f2 are the three-phase ground fault and A- and B-phase ground fault, respectively. The fault impedance is 1.5 Ω. Table 2 shows both the theoretical calculation and simulation tested results under different output powers of the PVGUs when the faults f1 and f2 occur. Here the constant current source model is the widely used equivalent model for a PV station [5].
As described in Table 2, the relative errors based on the proposed equivalent model are small. The maximum relative error is only 5.61%. By comparison, the maximum relative error based on the constant current source model is 73.85%. When all PVGUs’ DC-side input powers reaches 0.9 p.u., the relative error based on the constant current source model is equal to the relative error based on the proposed equivalent model. That was because the current limiters of all PVGUs are activated in the PV station. In the other DC-side input powers cases, the current limiters of several PVGUs are deactivated in the PV power station.
Table 3 shows both theoretical calculation and simulation tested results under the different fault impedance conditions. In this case, the DC-side input powers of PV1–PV12 are identical and equal to 0.6 p.u. With the increasing of the fault impedance, the relative errors based on the constant current source model become higher. That was because the number of the deactivated current limiters becomes larger. By contrast, the relative errors based on the proposed equivalent model are small under various conditions. The maximum relative error is also only 5.61%. It means that the proposed equivalent model can exactly characterize the fault current contribution from a PV station.
6. Conclusions
In this paper, the fault current contributions from different PVGUs included in a PV power station are differentiated by the activation states of the current limiters. Then, the current limiters’ states are characterized by a mathematical expression. A novel sorting method is further proposed for dividing multiple PVGUs into two groups. The equivalent model is finally deduced in order to calculate the fault current contribution from a PV station. Compared with the simulation tests and theoretical analysis based on the existing constant current source model, the relative errors of proposed calculation model are less under various fault scenarios. The maximum relative error is approximately −6%~+6%. Hence, the proposed model can accurately describe the practical fault current contribution from a PV power station under various grid faults. In future work, it is important to calculate the protection setting of power grid with the large-scale PV stations based on the proposed model. In addition, it is also interesting to apply the equivalent model for optimal scheduling of integrated energy systems with renewables [25,26,27].
Author Contributions
Conceptualization, S.L. and Z.W.; methodology, S.L. and Z.W.; software, Z.W.; validation, Z.W.; resources, H.Z.; data curation, Z.L.; writing—original draft preparation, Z.W.; writing—review and editing, S.L.; supervision, P.Z.; project administration, Z.L. All authors have read and agreed to the published version of the manuscript.
Funding
This research was funded by the State Key Laboratory of Alternate Electrical Power System with Renewable Energy Sources (No. LAPS19009), and the Open Fund of the State Key Laboratory of Power Grid Safety and Energy Conservation (China Electric Power Research Institute) (No. JBB51202001892).
Institutional Review Board Statement
Not applicable.
Informed Consent Statement
Not applicable.
Data Availability Statement
Not applicable.
Conflicts of Interest
The authors declare no conflict of interest.
References
- Kou, G.; Chen, L.; VanSant, P.; Velez-Cedenoe, F.; Liu, Y. Fault characteristics of distributed solar generation. IEEE Trans. Power Deliv. 2020, 35, 1062–1064. [Google Scholar] [CrossRef]
- Hooshyar, H.; Baran, M. Fault analysis on distribution feeders with high penetration of PV systems. IEEE Trans. Power Syst. 2013, 28, 2890–2896. [Google Scholar] [CrossRef]
- Bayoumi, A.S.; El-Sehiemy, R.A.; Mahmoud, K.; Lehtonen, M.; Darwish, M.M.F. Assessment of an improved three-diode against modified two-diode patterns of MCS solar cells associated with soft parameter estimation paradigms. Appl. Sci. 2021, 11, 1055. [Google Scholar] [CrossRef]
- Said, M.; Shaheen, A.M.; Ginidi, A.R.; El-Sehiemy, R.A.; Mahmoud, K.; Lehtonen, M.; Darwish, M.M.F. Estimating parameters of photovoltaic models using accurate turbulent flow of water optimizer. Processes 2021, 9, 627. [Google Scholar] [CrossRef]
- Alzahrani, S.; Shah, R.; Mithulananthan, N.; Alshareef, A. Comparison of steady state performances of practical large-scale PV configurations. CSEE J. Power Energy Syst. 2020, 6, 353–361. [Google Scholar]
- Mahamedi, B.; Fletcher, J. The equivalent models of grid-forming inverters in the sequence domain for the steady-state analysis of power systems. IEEE Trans. Power Syst. 2020, 35, 2876–2887. [Google Scholar] [CrossRef]
- Insu, K. A calculation method for the short-circuit current contribution of current-control inverter-based distributed generation sources at balanced conditions. Electr. Power Syst. Res. 2021, 190, 106839. [Google Scholar]
- Oon, K.; Tan, C.; Bakar, A.; Che, H.; Mokhlis, H.; Illias, H. Establishment of fault current characteristics for solar photovoltaic generator considering low voltage ride through and reactive current injection requirement. Renew. Sust. Energ. Rev. 2018, 92, 478–488. [Google Scholar] [CrossRef]
- Tekpeti, B.; Kang, X.; Kheshti, M.; Jiao, Z. Modeling and fault analysis of solar photovoltaic grid-connected systems under solar radiation fluctuation consideration. Int. Trans. Electr. Energy Syst. 2018, 28, 2576–2592. [Google Scholar] [CrossRef]
- Mishra, P.; Pradhan, A.; Bajpai, P. Adaptive distance relaying for distribution lines connecting inverter-interfaced solar PV plant. IEEE Trans. Ind. Electron. 2021, 68, 2300–2309. [Google Scholar] [CrossRef]
- Luis, H.; Sara, G.; Victor, A. A review of photovoltaic systems: Design, operation and maintenance. Sol Energy 2019, 188, 426–440. [Google Scholar]
- Bendary, A.F.; Abdelaziz, A.Y.; Ismail, M.M.; Mahmoud, K.; Lehtonen, M.; Darwish, M.M.F. Proposed ANFIS based approach for fault tracking, detection, clearing and rearrangement for photovoltaic system. Sensors 2021, 21, 2269. [Google Scholar] [CrossRef] [PubMed]
- Bahador, F.; Mohammad, D.; Alireza, K. Adaptive protection coordination scheme against the staircase fault current waveforms in PV-dominated distribution systems. IET Gener. Transm. Dis. 2018, 12, 2065–2071. [Google Scholar]
- Moura, A.; Lopes, J.; de Moura, A.; Sumaili, J.; Moreira, C. IMICV fault analysis method with multiple PV grid-connected inverters for distribution systems. Electr Power Syst Res. 2015, 119, 119–125. [Google Scholar] [CrossRef] [Green Version]
- Wang, Q.; Zhou, N.; Ye, L. Fault analysis for distribution networks with current-controlled three-phase inverter-interfaced distributed generators. IEEE Trans. Power Deliv. 2015, 30, 1532–1542. [Google Scholar] [CrossRef]
- Hassaine, L.; Olias, E.; Quintero, J.; Salas, V. Overview of power inverter topologies and control structures for grid connected photovoltaic systems. Renew. Sust. Energ. Rev. 2014, 30, 796–807. [Google Scholar] [CrossRef]
- Strezoski, L.; Dumnic, B.; Popadic, B.; Prica, M.; Loparo, K. Novel fault models for electronically coupled distributed energy resources and their laboratory validation. IEEE Trans. Power Syst. 2020, 35, 1209–1217. [Google Scholar] [CrossRef]
- Shi, X.; Zhang, H.; Wei, C.; Li, Z.; Chen, S. Fault modeling of IIDG considering inverter’s detailed characteristics. IEEE Access 2020, 8, 183401–183410. [Google Scholar] [CrossRef]
- Plet, C.; Green, T. Fault response of inverter interfaced distributed generators in grid-connected applications. Electr. Power Syst Res. 2014, 106, 21–28. [Google Scholar] [CrossRef]
- Guo, W.; Mu, L.; Zhang, X. Fault models of Inverter-Interfaced Distributed Generators Within a Low-Voltage Microgrid. IEEE Trans. Power Deliv. 2017, 32, 453–461. [Google Scholar] [CrossRef]
- Jones, K.; Pourbeik, P.; Kobet, G.; Berner, A.; Osman, M. Impact of Inverter Based Generation on Bulk Power System Dynamics and Short-Circuit Performance; Technical Report for IEEE Power & Energy Society (PES) Industry Technical Support Task Force; IEEE PES: Piscataway, NJ, USA, September 2018. [Google Scholar]
- Liu, S.; Bi, T.; Xue, A.; Liu, J. Equivalent model for calculating fault current from inverter-interfaced renewable energy generators. J. Environ. Inform. 2018, 32, 36–44. [Google Scholar] [CrossRef] [Green Version]
- Nian, H.; Shen, Y.; Yang, H.; Quan, Y. Flexible grid connection technique of voltage-source inverter under unbalanced grid conditions based on direct power control. IEEE Trans. Ind. Appl. 2015, 51, 4041–4050. [Google Scholar] [CrossRef]
- Shah, P.; Singh, B. Low-voltage ride-through operation of grid interfaced solar PV system enabling harmonic compensation capabilities. IET Renew. Power Gener. 2020, 14, 2100–2113. [Google Scholar] [CrossRef]
- Li, Y.; Li, K.; Yang, Z.; Yu, Y.; Xu, R.; Yang, M. Stochastic optimal scheduling of demand response-enabled microgrids with renewable generations: An analytical-heuristic approach. J. Clean. Prod. 2022, 330, 129840. [Google Scholar] [CrossRef]
- Li, Y.; Han, M.; Yang, Z.; Li, G. Coordinating flexible demand response and renewable uncertainties for scheduling of community integrated energy systems with an electric vehicle charging station: A bi-level approach. IEEE Trans. Sustain. Energy 2021, 12, 2321–2331. [Google Scholar] [CrossRef]
- Li, Y.; Wang, C.; Li, G.; Chen, C. Optimal scheduling of integrated demand response-enabled integrated energy systems with uncertain renewable generations: A Stackelberg game approach. Energy Convers. Manag. 2021, 235, 113996. [Google Scholar] [CrossRef]
Figure 1.
Grid-connected topology of PVGU.

Figure 2.
Procedure for dividing multiple PVGUs into two groups.

Figure 3.
Topology of power grid with PV station.

Figure 4.
Equivalent fault analysis model of the tested power grid connected with PV generators.

Figure 5.
Tested instantaneous values and theoretical amplitude values of short-circuit current provided by PV station.
Figure 5.
Tested instantaneous values and theoretical amplitude values of short-circuit current provided by PV station.


Table 1.
The clustering results based on both simulation tests and theoretical calculation.
| Clustering Results | Group 1 (Activation Mode) | Group 2 (Deactivation Mode) |
|---|---|---|
| Simulation results | PV1–PV3, PV4–P6 | PV7–PV9, PV10–PV12 |
| Calculation results | PV1–PV3, PV4–P6 | PV7–PV9, PV10–PV12 |
Table 2.
Tested simulation and calculated theoretical results of the fault current provided by the PV station after the fault f1.
Table 2.
Tested simulation and calculated theoretical results of the fault current provided by the PV station after the fault f1.
| Fault Current Results | DC-Side Input Powers of PV1–PV12 Are 0.9 p.u. | DC-Side Input Powers of PV1–PV6 Are 0.5 p.u. and PV7–PV12 Are 0.6 p.u. | DC-Side Input Powers of PV1–PV6 Are 0.9 p.u. and PV7–PV12 Are 0.7 p.u. | |||
|---|---|---|---|---|---|---|
| If(3) | If(2) | If(3) | If(2) | If(3) | If(2) | |
| Tested results | 1.08 kA | 1.07 kA | 0.72 kA | 0.65 kA | 0.98 kA | 0.96 kA |
| Calculation results from the proposed equivalent model | 1.13 kA | 1.13 kA | 0.76 kA | 0.68 kA | 0.93 kA | 0.91 kA |
| Corresponding relative error | 4.63% | 5.61% | 5.56% | 4.62% | −5.10% | −3.12% |
| Calculation results from constant current source model | 1.13 kA | 1.13 kA | 1.13 kA | 1.13 kA | 1.13 kA | 1.13 kA |
| Corresponding relative error | 4.63% | 5.61% | 56.96% | 73.85% | 15.31% | 17.71% |
Table 3.
Tested simulation and calculated theoretical results of fault current provided by PV station after the fault f2.
Table 3.
Tested simulation and calculated theoretical results of fault current provided by PV station after the fault f2.
| Fault Current Results | Fault Impedance 1 Ω | Fault Impedance 2 Ω | Fault Impedance 3 Ω | |||
|---|---|---|---|---|---|---|
| If(3) | If(2) | If(3) | If(2) | If(3) | If(2) | |
| Tested results | 1.08 kA | 1.07 kA | 0.61 kA | 0.59 kA | 0.52 kA | 0.51 kA |
| Calculation results from the proposed equivalent model | 1.13 kA | 1.13 kA | 0.58 kA | 0.56 kA | 0.50 kA | 0.49 kA |
| Corresponding relative error | 4.63% | 5.61% | −4.92% | −5.08% | −3.85% | −3.92% |
| Calculation results from constant current source model | 1.13 kA | 1.13 kA | 1.13 kA | 1.13 kA | 1.13 kA | 1.13 kA |
| Corresponding relative error | 4.63% | 5.61% | 85.25% | 91.53% | 117.31% | 123.33% |
Publisher’s Note: MDPI stays neutral with regard to jurisdictional claims in published maps and institutional affiliations. |
© 2021 by the authors. Licensee MDPI, Basel, Switzerland. This article is an open access article distributed under the terms and conditions of the Creative Commons Attribution (CC BY) license (https://creativecommons.org/licenses/by/4.0/).
Share and Cite
MDPI and ACS Style
Liu, S.; Zhang, H.; Zhang, P.; Li, Z.; Wang, Z. Equivalent Model of Photovoltaic Power Station Considering Different Generation Units’ Fault Current Contributions. Energies 2022, 15, 229. https://0-doi-org.brum.beds.ac.uk/10.3390/en15010229
AMA Style
Liu S, Zhang H, Zhang P, Li Z, Wang Z. Equivalent Model of Photovoltaic Power Station Considering Different Generation Units’ Fault Current Contributions. Energies. 2022; 15(1):229. https://0-doi-org.brum.beds.ac.uk/10.3390/en15010229
Chicago/Turabian StyleLiu, Sumei, Hao Zhang, Peng Zhang, Zhongqing Li, and Zepeng Wang. 2022. "Equivalent Model of Photovoltaic Power Station Considering Different Generation Units’ Fault Current Contributions" Energies 15, no. 1: 229. https://0-doi-org.brum.beds.ac.uk/10.3390/en15010229
Note that from the first issue of 2016, this journal uses article numbers instead of page numbers. See further details here.