
Effect of Pyrolysis Atmosphere on the Gasification of Waste Tire Char


Faculty of Energy and Fuels, AGH University of Science and Technology, al. Mickiewicza 30, 30-059 Krakow, Poland
*
Author to whom correspondence should be addressed.
Energies 2022, 15(1), 34; https://0-doi-org.brum.beds.ac.uk/10.3390/en15010034
Submission received: 22 November 2021
/
Revised: 13 December 2021
/
Accepted: 17 December 2021
/
Published: 21 December 2021
(This article belongs to the Special Issue Pyrolysis and Gasification of Biomass and Waste)
Abstract
:The aim of the study is to assess the influence of the atmosphere during pyrolysis on the course of CO2 gasification of a tire waste char. Two approaches were used: the pyrolysis step was carried out in an inert atmosphere of argon (I) or in an atmosphere of carbon dioxide (II). The examinations were carried out in non-isothermal conditions using a Rubotherm DynTherm thermobalance in the temperature range of 20–1100 °C and three heating rates: 5, 10 and 15 K/min. Based on the results of the gasification examinations, the TG (Thermogravimetry) and DTG (Derivative Thermogravimetry) curves were developed and the kinetic parameters were calculated using the KAS (Kissinger-Akahira-Sunose) and FWO (Flynn-Wall-Ozawa) methods. Additionally, the CO2 gasification of tire chars reaction order (n), was evaluated, and the kinetic parameters were calculated with the use of Coats and Redfern method. Tire waste char obtained in an argon atmosphere was characterized by lower reactivity, which was reflected in shift of conversion and DTG curves to higher temperatures and higher mean values of activation energy. A variability of activation energy values with the progress of the reaction was observed. For char obtained in an argon atmosphere, the activation energy varied in the range of 191.1–277.2 kJ/mol and, for a char obtained in an atmosphere of CO2, in the range of 148.0–284.8 kJ/mol. The highest activation energy values were observed at the beginning of the gasification process and the lowest for the conversion degree 0.5–0.7.
1. Introduction
A significant increase in the population has resulted in the rapid development of the automotive industry, resulting in the increasing use of car tires [1]. It is estimated that about 17 million tons of tires are discarded annually [2]. Waste from car tires (without metal and fabric cord) consists mainly of rubber (60–65%), i.e., vulcanized synthetic and/or natural rubber, as well as additives and fillers (responsible for the strength and mechanical resistance of the tire), such as carbon black (about 30%), plasticizers (7.5%), sulfur (about 1–2%) and zinc oxide (2–3%), used for vulcanization of rubber [3].
Tire dumps pose a large risk due to their high propensity to self-ignite, and gaseous products of combustion pose a great threat to human and animal health, for instance, compounds, such as phenols, polycyclic aromatic hydrocarbons, dioxins, furans, hydrochloric acid, HCN, HBr and toxic elements, and heavy metals, such as arsenic, cadmium, nickel, zinc, chromium, mercury and vanadium, as well as typical impurities such as CO2, CO, NOx, SO2, etc. [4,5]. Their intrusion into groundwater, rivers and lakes can cause hazardous consequences, and the huge amounts of carbon dioxide emitted in a fire contribute to the increase of the greenhouse effect [6]. Moreover, the landfills have favorable conditions for the development and reproduction of various pests, rodents and mosquitoes, which have a negative impact on the environment and human health [7,8].
In response to the above problems, various methods of used tires management have been introduced for many years. This waste is subject to material recycling, where it is shredded and then used in civil engineering as a substrate for roads, for strengthening roadsides or for the protection of riverbanks and water reservoirs, and subjected to retreading. Another way of managing this waste (according to the hierarchy of less desirable waste management) is energy recycling, mainly in combustion processes as fuel in cement plants and heating plants, and in pyrolysis and gasification. The advantages of conversion by pyrolysis and gasification of wastes over traditional incineration are mainly related to the increased energy efficiency, generation of valuable products and improved pollution control. The intermediate products from thermochemical conversion may be suitable for a wide range of applications, from high-quality fuels to fine chemicals. Lower operating temperatures compared to those in incineration can also potentially reduce the risk of alkali volatilization, fouling, slagging and bed agglomeration. Furthermore, systems for gasification and pyrolysis are commonly equipped with product-cooling collection units, which may enable improved control of emissions of organic and inorganic pollutants [9] Gaseous products and oil from pyrolysis can be used as a fuel or chemical feedstock [10,11], but the char is not fully used and can be an interesting energy source. One of the ways to utilize the tire char can be the gasification process, which may have great potential to produce products with a wide range of applications. Gasification is a low-emission method of converting solid fuels to gas that allows production of chemicals or liquid/gaseous fuels, as well as high-efficiency electricity production.
This char is composed primarily from carbon black, which is a component of the tire, because the rubber subjected to high temperature turns mainly into liquid and gaseous fractions, which translates into a low char yield. Nevertheless, the produced char is characterized by a very high content of elemental carbon (up to about 90%), low content of heteroatoms and a high amount in ash aluminum and silica oxides and a developed microporous specific surface (45–90 m2/g) [12,13]. Tire char seems to be a good raw material for the gasification process, which is a well-established and flexible technology that provides a multitude of possible products. In the case of tire char waste, gasification should be conducted in fluidized bed gasifiers that enable partial binding of ecotoxic substances. In this type of gasifier, high reactivity is required. One of the factors influencing this parameter is the conditions of pyrolysis. For the design of the process, it is important to precisely know the properties of the raw material used.
It is known that, for other carbon-bearing materials, one of the factors determining the gasification process is the conditions in which pyrolysis takes place and in which the char is formed. Pyrolysis conditions have a substantial impact on the properties of the resulting char and, consequently, on the kinetics of the gasification process [14,15]. Char reactivity largely depends on its properties, particularly on porosity, which is affected by the porosity of parent material, as well as the conditions of the pyrolysis process [16]. During pyrolysis, the porosity and the specific surface area significantly increase [17]. The conditions under which the char is formed, including pressure and temperature, heating rate, atmosphere and the manner of cooling, affect the properties of the char [18,19,20].
In the authors’ previous work [21], a greater reactivity of the char from coal obtained in an atmosphere of carbon dioxide than in an atmosphere of argon was observed, but the heating rate during pyrolysis in the range between 3–20 K/min did not affect the course of gasification. In turn, the paper [22] shows that, during direct gasification of coals, they are more reactive than chars prepared from the parent coal and, thus, the gasification of coals progresses much faster and, consequently, with a higher formation rate of gaseous products. Due to the different structure of coal and tire waste, differences in the gasification of these materials can be expected, mainly in the share and duration of individual stages, i.e., pyrolysis and gasification of the formed char. Hence, the influence of the conditions of pyrolysis on the gasification process obtained for coal and tire waste cannot be directly compared. To the best of the authors’ knowledge, the effect of pyrolysis atmosphere on tire char gasification has not been the subject of published studies so far, and the presented paper fills this gap.
The main purpose of this work is to determine whether similar relationships occur in the case of gasification of tires, which, despite their elemental composition being similar to coal, differ in structure. In order to determine the influence of the atmosphere in which the pyrolysis stage takes place on the subsequent gasification of the resulting char, two approaches were used: pyrolysis under carbon dioxide and argon atmosphere.
2. Materials and Methods
2.1. Material Characteristic
Waste from an industrial plant producing tires was used to study the effect of pyrolysis atmosphere on the kinetics of the gasification process. Scraps of rubber tires cut off as excess material during production were comminuted to a particle size below 0.2 mm in order to minimize the influence of diffusion effects on the gasification process. In order to characterize the tested material proximate, ultimate analyses were performed, and the ash composition was determined. Ultimate analysis was performed using an ELTRA CHS580 analyzer and proximate analysis using a TGA (Thermogravimetric Analyzer) Thermostep by ELTRA, Hann, Germany, and the ash composition was determined using an AAS Z-2000 spectrophotometer by Hitachi, Tokio, Japan. Table 1 presents the results of the analyses.
The tested material had a very high content of carbon (almost 90% dry and ash-free) and hydrogen (almost 8% dry and ash-free). Due to the high content of volatile matter (about 75% in a dry and ash-free state), the FC value was very low (23%), which resulted in a low share of the char left after the pyrolysis process. Moreover, the tested material was characterized by a relatively low ballast content: the ash content was about 6%, and the moisture content was below 1%, while the sulfur content was quite high, reaching 2%. The main ash components were silicon and zinc oxides, which constituted over 80% of the ash mass. The composition of the ash, containing mainly inhibitors of the gasification process, had a negative impact on the course of this process [23]. Comparing the ash content and the sulfur content in the ash, it can be concluded that about 10% of the sulfur is ash sulfur, while the rest goes to gaseous products.
2.2. Methodology of Measurements
Measurements of the gasification process were performed using a TGA Instruments DynTherm thermobalance by Rubotherm, Bochum, Germany equipped with a magnetic coupling which isolates the weighing system from the reactor. A single analytical sample of rubber tire waste with a particle size below 0.2 mm and a mass of approximately 10 mg was placed in a crucible which was then hung on a hook in the center of the thermobalance reactor. The non-isothermal measurements were made for three heating rates: 3, 10 and 15 K/min. Each measurement consisted of three successive stages.
Stage I involved stabilization of the initial conditions of the process. In this stage, lasting about 30 min, the flow of carbon dioxide or argon (>99.99% purity) in the reactor was started and stabilized at 100 mL/min. The gas pressure was set at 0.1 MPa.
Stage II was the main stage, at which the sample was heated to 1100 °C at a constant heating rate of 3, 10 or 15 K/min in order to ensure a complete degree of conversion. During the measurement, the flow and pressure were constant and set at 100 mL/min and at 0.1 MPa, respectively. The time of this stage was dependent upon the sample heating rate.
Stage III involved ending the measurement, the heating was turned off and the reactor was flushed with argon in order to remove the remaining gasification reaction products.
Stage II was conducted in two ways. In the first approach, the entire measurement, i.e., from ambient temperature to 1100 °C, was carried out in a CO2 atmosphere. In the second approach, the CO2 gasification step was preceded by pyrolysis in an inert gas (argon) atmosphere. The char produced during pyrolysis was then gasified under a CO2 atmosphere in the same reaction space without removing the sample after the pyrolysis step. The methodology of these measurements was carried out in an analogous manner under the same temperature conditions, gas flow and pressure. In the second approach, when the temperature in the reactor reached approximately 600 °C, the argon flow was cut off, and the CO2 flow was turned on so that the formed char could be gasified. The flow of carbon dioxide in the reactor was turned on at a temperature lower than the gasification start temperature (approximately 750 °C) to purge argon and residual pyrolysis gas from the reaction area. The temperature at which the CO2 flow was switched on was selected based on the previously made measurements of the waste tire pyrolysis and a literature analysis [24].
Before each measurement, blank tests were performed with an empty crucible under conditions identical to those for each actual measurement with a sample. The repeatability for the tested samples was assessed during the preliminary evaluation, and the obtained results confirmed good convergence of the obtained measurement curves and kinetic parameters.
2.3. Methodology of Calculation of Kinetic Parameters
Based on the sample weight loss due to increasing temperature, the gasification reaction progress α (-) was determined:
where m stands for current sample mass (mg) and m0 stands for sample mass at the beginning of the gasification stage (mg).
The kinetic parameters of the CO2 gasification process were calculated using isoconversion methods, which assume that the same degree of conversion (α) is achieved for a given activation energy value regardless of the heating rate and that the activation energy changes as the reaction progresses. Each chemical reaction is progressive, which reflects the variability of the mechanism along the entire reaction path [17,21]. To perform kinetic analysis with these methods, several TG measurements are required for different sample heating rates. The kinetic parameters are determined from data from several kinetic curves and not, as in the case of only one fitting method, at different heating rates for a specific constant conversion rate. Thanks to this, (Ea) and (A) are obtained for any progress of the reaction, which allows for a detailed analysis of the course of kinetics and the reaction mechanism, as well as its complexity as it progresses [25,26,27]. Isoconversion analysis of kinetics allows for obtaining precise, near actual values of activation energy and the pre-exponential factor (A), limiting problems resulting from the effects of energy and mass transfer for different heating rates. This analysis also allows, to some extent, for the avoidance of problems resulting from the ambiguous assessment of the reaction model. For the isoconversion determination of kinetic parameters, the following methods were used: Kissinger–Akahira–Sunose (KAS) and Flynn–Wall–Ozawa (FWO), which do not completely reject the reaction model as they are used in conjunction with model-dependent methods. The KAS method is used in conjunction with the Murray–White approximation, while the FWO method uses the Doyle B approximation [23,25]. The linear form of the KAS method is represented by Equation (2), while the linear form of FWO method is represented by the Equation (3). The calculations were performed for the α range (0.1–0.9) and for the three heating rate constants (β = 3, 10, 15 K/min). In both equations, R stands for the universal gas constant equal to 8.314 J/mol∙K.
Activation energy was determined from the slope of the linear regression function ln(β/T2) from 1/T and determined for three points with the same degree of conversion α (g (α) = const.) for different heating rates, while the pre-exponential factor was obtained from the abscissa of this function.
The reaction order (n) of CO2 gasification of tire char gasification was evaluated and the kinetic parameters (pre-exponential factor and activation energy) were calculated with the use of Coats and Redfern method [28]. For n ≠ 1 is expressed as:
and, for n = 1, the equation becomes:
In most cases, Ea >> RT, thus the term may be taken as a constant. As a result, Equations (4) and (5) may be put in a linear form, thus allowing the determination of Ea and A. Reaction order n equals 0, 1/3, 1/2, 2/3, 1 and 2 were used, since it has been stated that these values have a chemical basis to be considered a reaction order [28].
3. Results and Discussion
When discussing the results, the following terms are used to simplify the nomenclature of the two measurement conditions during the pyrolysis stage: approach I (A1)—the entire measurement in CO2 atmosphere and approach II (A2)—the pyrolysis stage in an argon atmosphere and gasification in a CO2 atmosphere.
3.1. Analysis of TGA Results
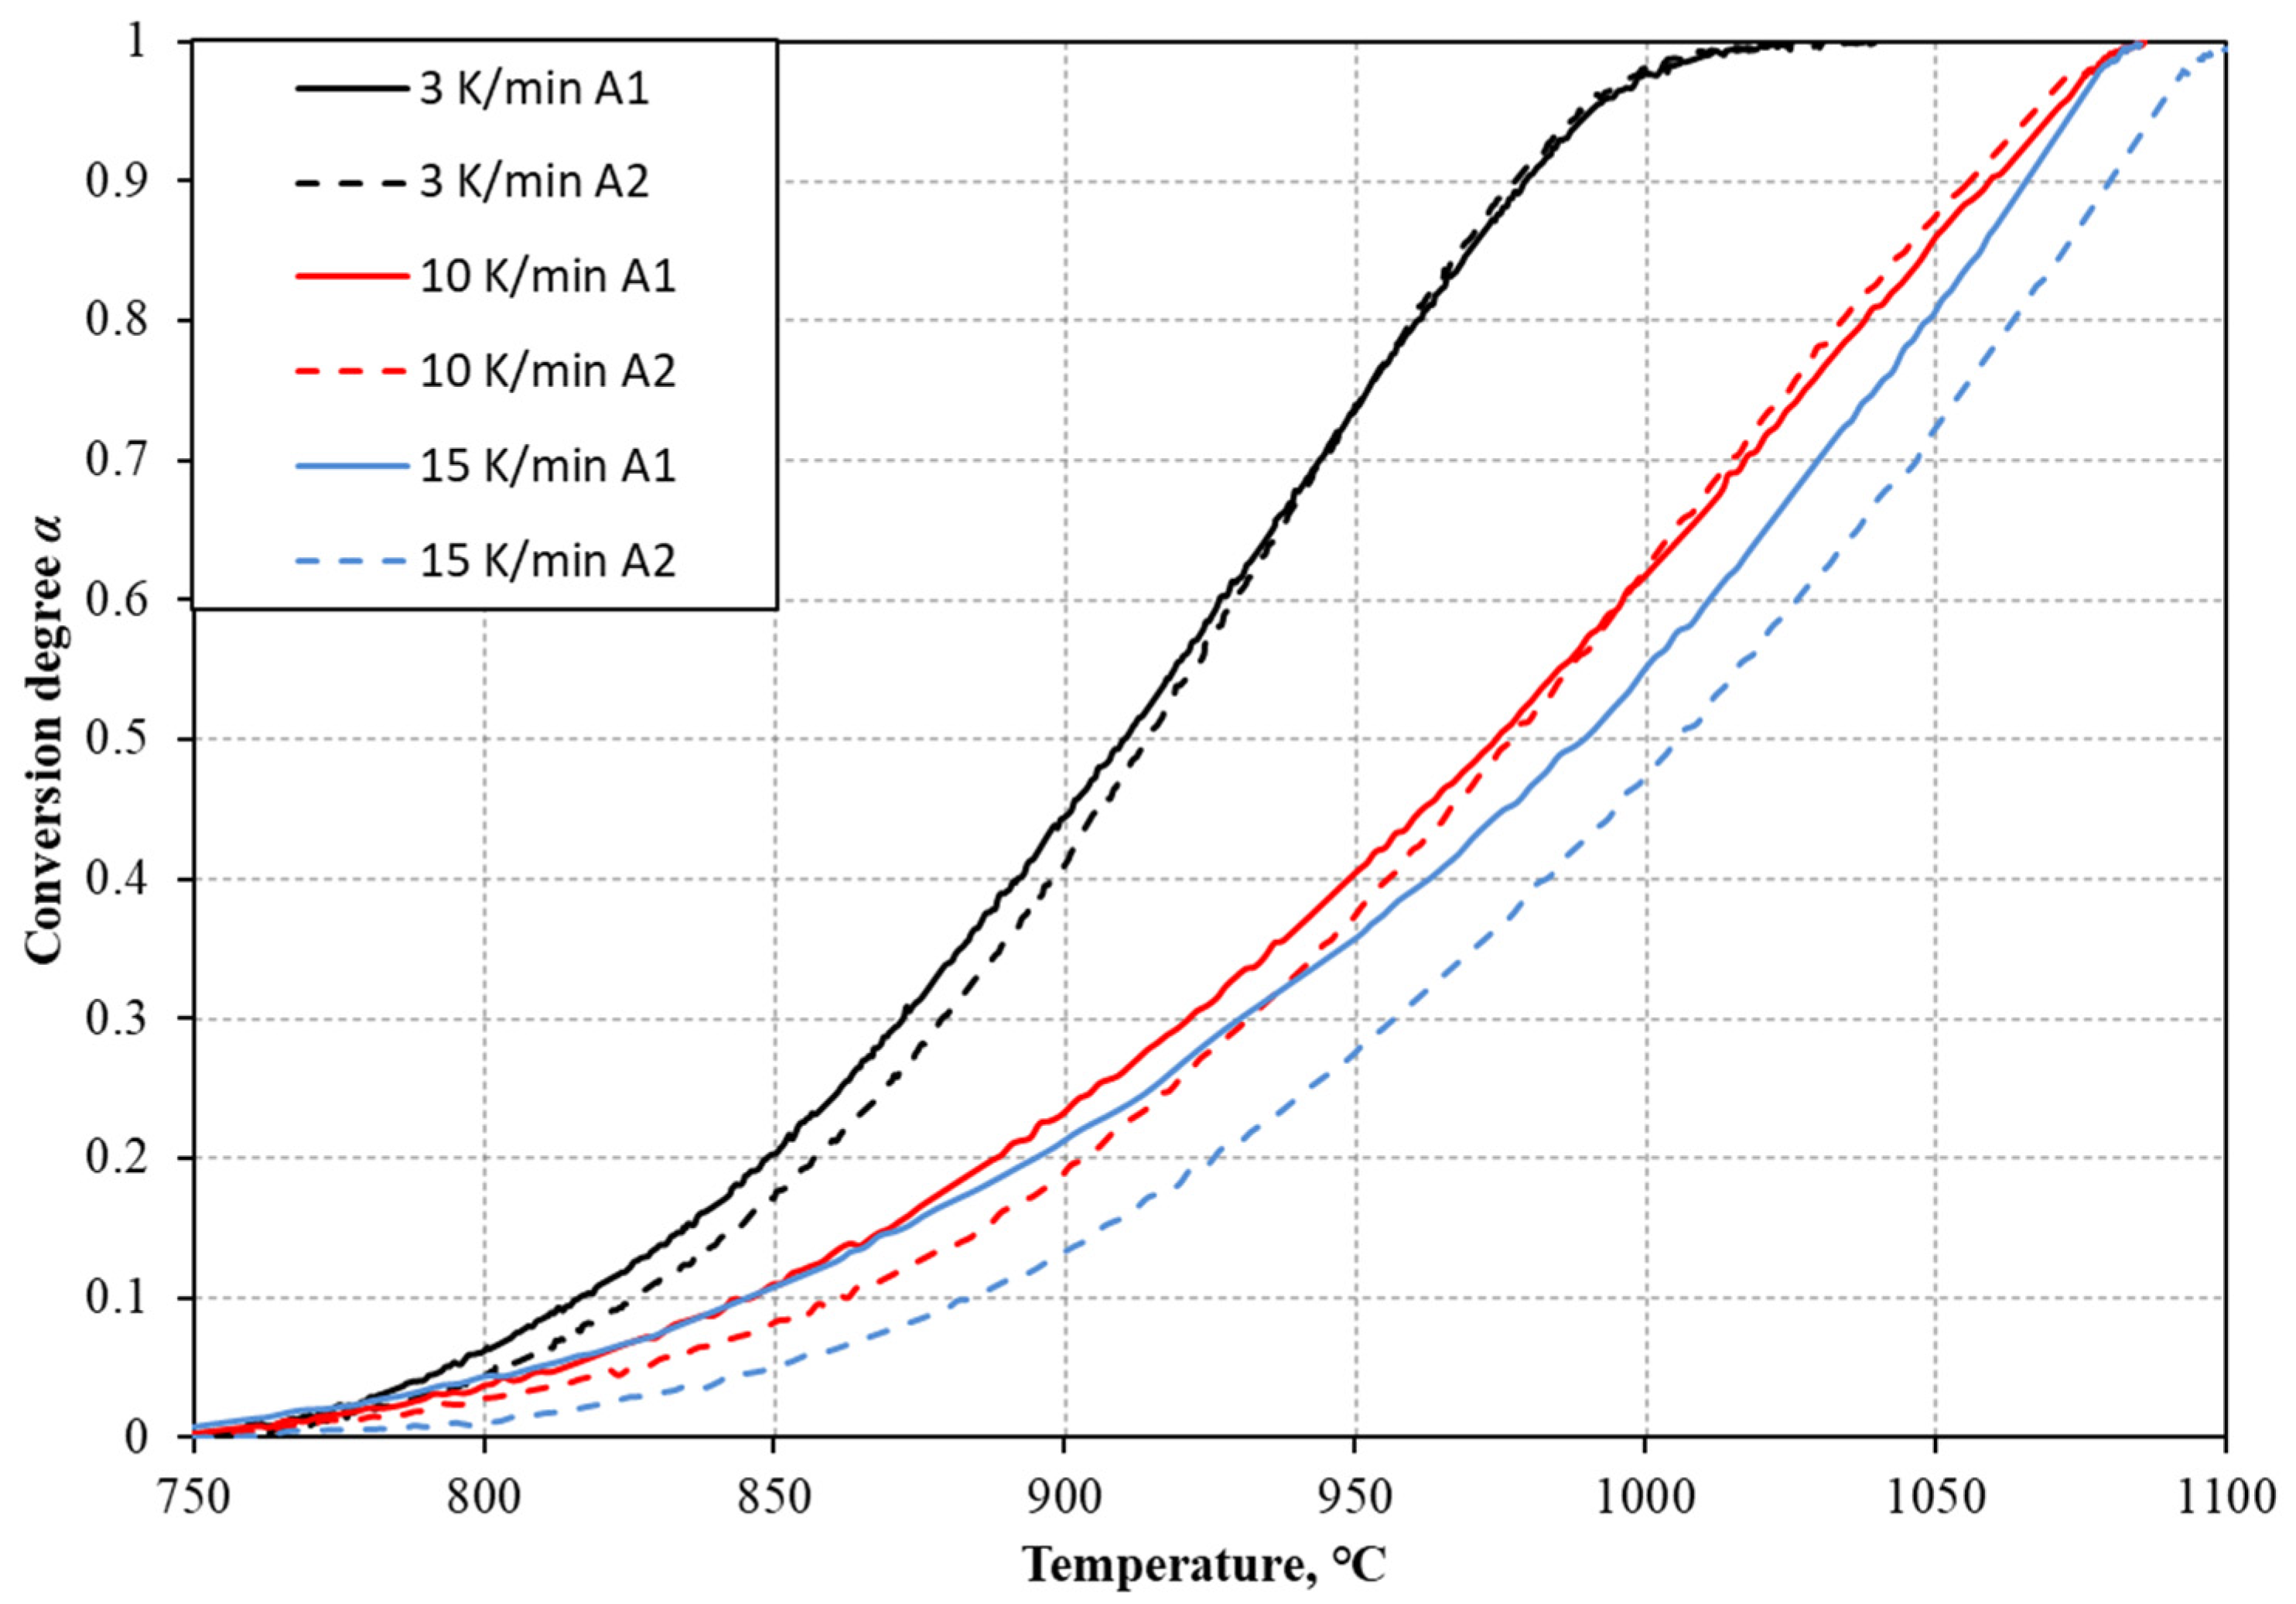
On the basis of the TG measurements, curves of the degree of char conversion during CO2 gasification were developed for all assumed heating rates and for both approaches, as shown in Figure 1. One can observe that a higher heating rate shifted the conversion curves towards higher temperatures, and gasification for the heating rate of 3 K/min occurred earlier than for the heating rate of 10 and 15 K/min. The maximum degree of conversion of the char for a heating rate of 3 K/min was achieved at a temperature of approximately 1040 °C, while, for heating rates of 10 and 15 K/min, it was above 1090 °C. When comparing the curves for approaches I and II, it can be seen that there are some slight differences between the curves for the heating rates of 3 and 10 K/min. The curves for approach II are slightly steeper, which proves that these reactions ran faster compared to the reactions in approach I. In the case of the heating rate of 15 K/min for approaches I and II, the differences in the values of conversion rates at a given temperature are much more visible, and, it can be seen, that the curves do not overlap (the curve for approach II is definitely under the curve for approach I). It can be summarized that the higher the heating rate, the greater the influence of the atmosphere in which the char was formed on its gasification rate.
In addition, it can also be seen that, at the end of the gasification reaction, for a heating rate of 3 K/min, the conversion rate slowed down gently from a value of approximately 93–94%, while, for a heating rate of 10 and 15 K/min, the reaction ended abruptly at 97–98%. Moreover, these curves start to converge at the end of the process. These observations can be explained by diffusion phenomena, which take on significance from the temperature of approximately 1000 °C, where the kinetics of the “pure” chemical gasification reaction are no longer relevant in favor of the kinetics of diffusion phenomena (in this case internal diffusion), which become the limiting stage of the process. In the case of the gasification process at a heating rate of 3 K/min, there were no diffusion phenomena, as almost the entire conversion of the char took place below 1000 °C.
Figure 2 shows the changes in the rate of the char’s gasification reaction progress for the three heating rates and for both approaches used. The DTG curves confirm the previously observed shift in the course of the reaction towards higher temperatures with an increase of the heating rate. It can be noticed that the maximum rate of gasification reaction decreased with an increasing heating rate. Moreover, comparing the results for approach I and approach II at a given heating rate, it can be concluded that the A1 curves were slightly shifted to higher temperatures and the maximum rate of the gasification reaction was higher for A2. The courses of conversion and DTG curves confirm that chars formed in a CO2 atmosphere are more reactive during gasification. Higher reactive chars are characterized by larger porosity and surface area and have a higher quantity of active sites [29]. The number of active sites is strongly dependent upon porosity or surface area as they are associated with edges or defects on the surface [30,31]. The higher reactivity of chars obtained during pyrolysis in CO2 atmosphere can by caused by the inclusion of oxygen and elevated total surface area, leading to the formation of new pores or the closing of pores opened by CO2 [32,33]. Hence, the atmosphere in which the pyrolysis of tire waste was carried out affected the above-mentioned properties and, consequently, the reactivity of the received tire char. It can be concluded that, at the stage of pyrolysis in an atmosphere of carbon dioxide, there is an initial activation of the char consisting of the development of a porous structure [33], which translates into its greater reactivity. In the work [15], it was found that the differences of pore volumes of chars obtained under N2 and CO2 flows were most likely caused by a difference in the diffusivity of volatiles in the two different atmospheres. A lower diffusivity of volatiles under CO2 pyrolysis can result in higher internal pressure and cause the pore structure to rupture: that is, form more mesopores and macropores.
3.2. Analysis of Kinetics of Char Gasification Process
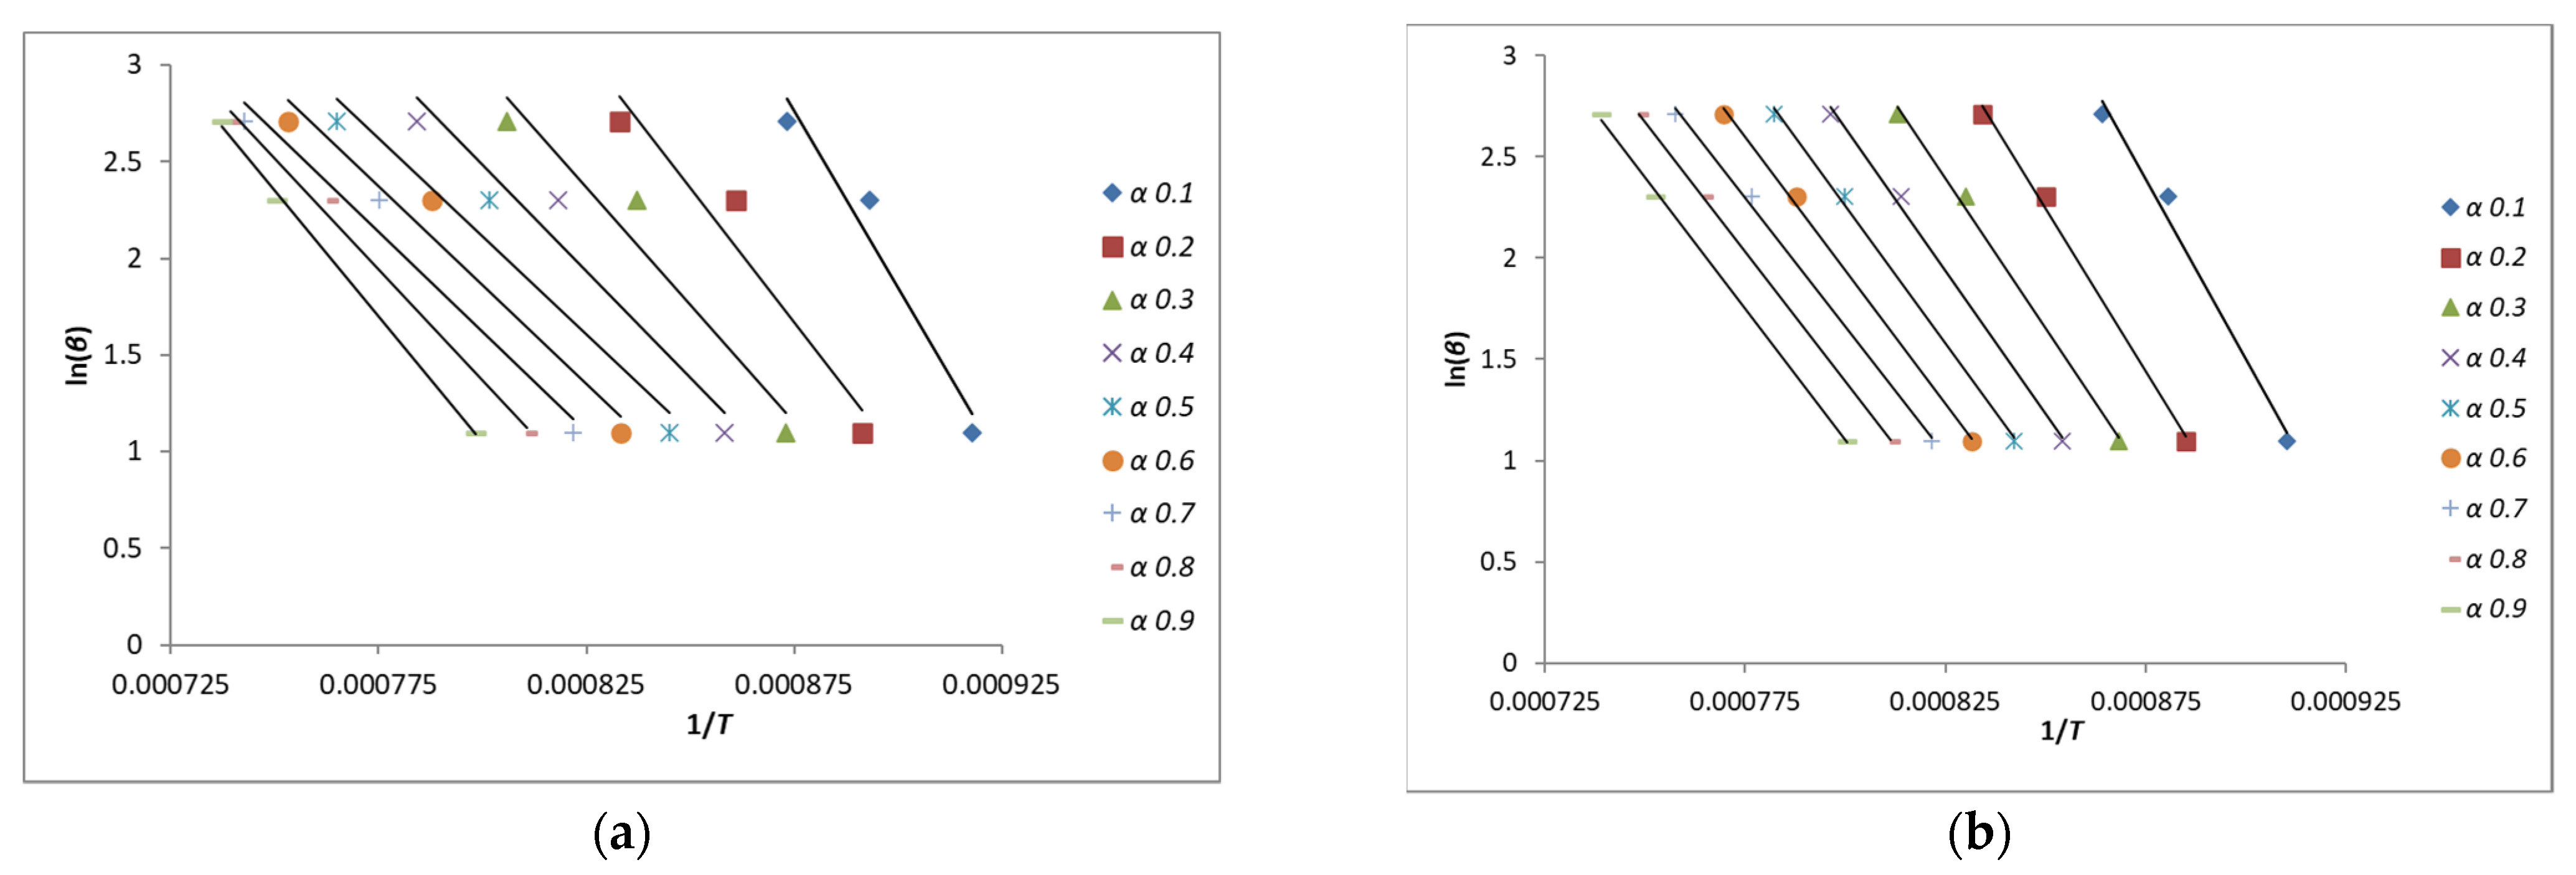
The kinetic parameters obtained by the KAS and FWO isoconversion methods were determined for the conversion degree range α = 0.1–0.9 in order to eliminate the uncertain initial and final values and obtain the most reliable results from a relatively constant and unchanging course of the reaction, i.e., a constant slope of the conversion rate curves (Figure 1). First, graphs of the linear equations of both methods were drawn for the three heating rates and for both approaches (Figure 3 and Figure 4).
Based on the slope and the abscissa of the linear regression function drawn from the points for each heating rate shown in Figure 3 and Figure 4, the values of the activation energy and the pre-exponential factor were determined. The obtained kinetic parameters and the values of the coefficient of determination, which are a measure of how the data fit the model, are summarized in Table 2 for the KAS method and in Table 3 for the FWO method.
The obtained values of the R2 determination coefficient were high, which indicate a good fit of the measurement data to the models used. The mean values of kinetic parameters for the CO2 tire char gasification (Ea: 182–225 kJ/mol and A: 1.3 × 10⁸–5.8 × 10⁸ 1/min) are similar to some presented in the literature [34,35,36]).
Based on the results presented in Table 2 and Table 3, diagrams of changes in the activation energy (Ea) depending on the reaction progress (α) were drawn for the presented isoconversion methods and for two measurement approaches. These curves are shown in Figure 5.
The data collected in Table 2 and Table 3 show that the activation energy values were always higher in the FWO method—these differences were in the range of 4–20 kJ/mol depending on the degree of conversion, and the difference between the average activation energy between the FWO and KAS methods for the whole process was 11.5 kJ/mol. Pre-exponential factors calculated by the KAS and FWO methods were higher for approach I. The differences between the activation energy values in both methods are clearly visible in Figure 4. The curves of the KAS and FWO methods in both approaches have an almost identical shape. When comparing the activation energy values between approaches I and II, clear differences can be seen, especially for the alpha range of 0.4–0.6. The activation energy values were higher for approach II, i.e., gasification of the char that was formed in an argon atmosphere. In the case of the averaged activation energy values for the entire process, the difference between approaches I and II in the KAS method was 31.7 kJ/mol, while in the FWO method, the difference was slightly less, amounting to 30.9 kJ/mol. The differences between the values of activation energies determined for the reaction under measurement conditions during approach I and II can be explained by the influence of CO2 at the pyrolysis stage, which probably activated the resulting char. Despite the large differences in activation energies at each stage of the reaction progress between measurement conditions during approach I and II, a similar nature of the course of the reaction can be seen; the activation energy decreased to a certain point and then increased again. This can be seen very clearly for the curves of approach I, where the activation energy from the beginning of the reaction progress (α = 0.1) dropped sharply until half of the progress, where the lowest activation energy value was obtained—148.0 kJ/mol for KAS and 160.8 kJ/mol for FWO. The activation energy then increased until the end of the reaction (α = 0.9), where the value of this energy was 195.2 kJ/mol for KAS and 206.1 kJ/mol for FWO. In the case of carrying out the reaction under conditions for approach II, such a reaction course mechanism could also be observed, but it was not so visible anymore. The activation energy value decreased (not so sharply) as the reaction proceeded, this time reaching the lowest value for the conversion degree of 0.7–191.1 kJ/mol for KAS and 201.6 kJ/mol for FWO. The activation energy value then increased slightly by 2.5 kJ/mol for KAS and 2.9 kJ/mol for FWO. This reaction mechanism, in both cases, was due to the fact that, as the reaction proceeded, the amount of carbon was reduced and, in turn, the amount of ash formed. The loss of the char caused a reduction of its active specific surface, which was additionally limited by the ash, reducing the contact surfaces of the rest of the char with the gasifying agent, which directly contributed to increasing the energy of the active reaction.
The reaction order (n) of tire char CO2 gasification was evaluated with the use of the Coats and Redfern method. The analysis of possible reaction orders covered only those values which were chemically justified, i.e., 0, 0.33, 0.5, 0.66, 1, 2 [26]. On the basis of the R2 determination coefficient, the best-fitting reaction order was determined, and the results are summarized in Table 4. The highest values of R2 were noted for n = 1, and it can be concluded that the CO2 gasification of tire char was the first order reaction. Hence, further calculations of pre-exponential factor (A) and activation energy (Ea) were made by first order Coats and Redfern method and the results are summarized in Table 5. One can observe that the increase in the heating rate during the measurement resulted in a decrease in the values of the activation energy and the pre-exponential factor. It can also be observed, in the case of approach I (pyrolysis in a CO2 atmosphere), that lower values of both activation energies and a pre-exponential factor were noted compared to approach II (pyrolysis in an argon atmosphere). The results confirm the previous observations and relationships that were obtained using the KAS and FWO methods (presented in Table 2 and Table 3).
4. Conclusions
The research on the gasification of waste from rubber tires presented in the paper showed an influence of temperature, heating rate, diffusion phenomena and the pyrolysis stage on the kinetics of the gasification process of tire waste. For chars formed in an inert argon atmosphere, carbon conversion and DTG curves were shifted to higher temperatures. The influence of the heating rate on the differences in the reactivity between chars formed in argon and CO2 atmospheres were also observed. The use of isoconversion methods allowed for determination of the value of the activation energy depending on its progress. Both for the KAS and FWO methods and for both approaches, higher activation energy values were observed at the beginning of the process. As the reaction progressed, the activation energy values decreased to a certain point and then increased, which resulted from the increase in ash share and limitation of the contact surface of the reactants. The results of the conducted research show increased activation energy values in the case where gasification was preceded by pyrolysis in argon (average value of activation energy was 33.7 and 30.9 kJ/mol higher for KAS and FWO methods, respectively), which proves the lower reactivity of the char obtained in an inert atmosphere. The use of the Coats and Redfern method allowed CO2 gasification of tire char to be defined as the first order reaction. The kinetic parameters calculated using this method (the difference in activation energy between individual approaches was 18–60.6 kJ/mol) confirm the previous observations and relationships that were obtained using the KAS and FWO method.
Author Contributions
Conceptualization, P.G.; methodology, P.G. and G.C.; formal analysis, P.G. and G.C.; investigation, P.G. and W.G.; resources, P.G. and G.C.; data curation, P.G. and W.G.; writing—original draft preparation, P.G. and G.C.; writing—review and editing, P.G. and G.C.; visualization, P.G.; supervision, G.C. All authors have read and agreed to the published version of the manuscript.
Funding
This research was funded by Research Subsidy of the AGH University of Science and Technology for the Faculty of Energy and Fuels (No. 16.16.210.476).
Institutional Review Board Statement
Not applicable.
Informed Consent Statement
Not applicable.
Data Availability Statement
The data that support the findings of this study are available from the corresponding author upon reasonable request.
Conflicts of Interest
The authors declare no conflict of interest.
References
- Nisar, J.; Ali, G.; Ullah, N.; Iftikhar, A.A.; Iqbal, M.; Shah, A.; Sirajuddin Sayed, M.; Mahmood, T.; Khan, M.S. Pyrolysis of waste tire rubber: Influence of temperature on pyrolysates yield. J. Environ. Chem. Eng. 2018, 6, 3469–3473. [Google Scholar] [CrossRef]
- Rowhani, A.; Rainey, J. Scrap Tyre Management Pathways and Their Use as a Fuel—A Review. Energies 2016, 9, 888. [Google Scholar] [CrossRef]
- Labaki, M.; Jeguirim, M. Thermochemical conversion of waste tyres—A review. Environ. Sci. Pollut. Res. 2017, 24, 9962–9992. [Google Scholar] [CrossRef]
- Krawiec, P.; Warguła, Ł.; Małozięć, D.; Kaczmarzyk, P.; Dziechciarz, A.; Czarnecka-Komorowska, D. The Toxicological Testing and Thermal Decomposition of Drive and Transport Belts Made of Thermoplastic Multilayer Polymer Materials. Polymers 2020, 12, 2232. [Google Scholar] [CrossRef]
- Krawiec, P.; Warguła, Ł.; Czarnecka-Komorowska, D.; Janik, P.; Dziechciarz, A.; Kaczmarczyk, P. Chemical compounds released by combustion of polymer composites flat belts. Sci. Rep. 2021, 11, 8269. [Google Scholar] [CrossRef]
- Šourková, M.; Adamcová, D.; Winkler, J.; Vaverková, M.D. Phytotoxicity of Tires Evaluated in Simulated Conditions. Environments 2021, 8, 49. [Google Scholar] [CrossRef]
- Adhikari, B.; De, D.; Maiti, S. Reclamation and recycling of waste rubber. Prog. Polym. Sci. 2000, 25, 909–948. [Google Scholar] [CrossRef]
- Asaro, L.; Gratton, M.; Seghar, S.; Hocine, N.A. Recycling of rubber wastes by devulcanization. Resour. Conserv. Recycl. 2018, 133, 250–262. [Google Scholar] [CrossRef]
- Matsakas, L.; Gao, Q.; Jansson, S.; Rova, U.; Christakopolus, P. Green conversion of municipal solid wastes into fuels and chemicals. Electron. J. Biotechnol. 2017, 26, 69–83. [Google Scholar]
- Yaqoob, H.; Teoh, Y.H.; Sher, F.; Jamil, M.A.; Murtaza, D.; Qubeissi, M.; UI Hassan, M.; Mujtaba, M.A. Current Status and Potential of Tire Pyrolysis Oil Production as an Alternative Fuel in Developing Countries. Sustainability 2021, 13, 3214. [Google Scholar] [CrossRef]
- Guohao, Z.; Feng, C.; Yuhao, Z.; Liang, Z.; Jingye, C.; Liyuan, C.; Jinsen, G.; Chunming, X. Properties and utilization of waste tire pyrolysis oil: A mini review. Fuel Process. Technol. 2021, 211, 106582. [Google Scholar]
- Gurai, C. Gasification Kinetics of Blends of Waste Tire and Typical South African Coals. Ph.D. Thesis, North-West University, Potchefstroom, South Africa, 2015. [Google Scholar]
- Zabaniotou, A.A.; Stavropoulos, G. Pyrolysis of used automobile tires and residual char utilisation. J. Anal. Appl. Pyrolysis 2003, 70, 711–722. [Google Scholar] [CrossRef]
- Babinszki, B.; Sebestyén, Z.; Jakab, E.; Kőhalmi, L.; Bozi, J.; Várhegyi, G.; Wang, L.; Skreiberg, Ø.; Czégény, Z. Effect of slow pyrolysis conditions on biocarbon yield and properties: Characterization of the volatiles. Bioresour. Technol. 2021, 338, 125567. [Google Scholar] [CrossRef]
- Phounglamcheik, A.; Wang, L.; Romar, H.; Kienzl, N.; Broström, M.; Ramser, K.; Skreiberg, Ø.; Umeki, K. Effects of Pyrolysis Conditions and Feedstocks on the Properties and Gasification Reactivity of Charcoal from Woodchips. Energy Fuels 2020, 34, 8353–8365. [Google Scholar] [CrossRef]
- Kim, R.G.; Hwang, C.W.; Jeon, C.H. Kinetics of coal char gasification with CO2: Impact of internal/external diffusion at high temperature and elevated pressure. Appl. Energy 2014, 129, 299–307. [Google Scholar] [CrossRef]
- Jayaraman, K.; Gokalp, I. Effect of char generation method on steam, CO2 and blended mixture gasification of high ash turkish coals. Fuel 2015, 153, 320–327. [Google Scholar] [CrossRef] [Green Version]
- Xu, X.-Q.; Wang, Y.-G.; Chen, Z.-D.; Chen, X.-J.; Zhang, H.-Y.; Bai, L.; Zhang, S. Variations in char structure and reactivity due to the pyrolysis and in-situ gasification using Shengli brown coal. J. Anal. Appl. Pyrolysis 2015, 115, 233–241. [Google Scholar] [CrossRef]
- Alonso, M.J.G.; Borrego, A.G.; Alvarez, D.; Parra, J.B.; Menendez, R. Influence of pyrolysis temperature on char optical texture and reactivity. J. Anal. Appl. Pyrolysis 2001, 58, 887–909. [Google Scholar] [CrossRef]
- Li, T.; Zhang, L.; Dong, L.; Li, C.-Z. Effects of gasification atmosphere and temperature on char structural evolution during the gasification of Collie sub-bituminous coal. Fuel 2014, 117, 1190–1195. [Google Scholar] [CrossRef]
- Czerski, G.; Zubek, K.; Grzywacz, P.; Porada, S. Effect of char preparation conditions on gasification in a carbon dioxide atmosphere. Energy Fuels 2017, 31, 815–823. [Google Scholar] [CrossRef]
- Porada, S.; Czerski, G.; Grzywacz, P.; Makowska, D.; Dziok, T. Comparison of gasification of coals and their chars with CO2 based on the formation kinetics of gaseous products. Thermochim. Acta 2017, 653, 97–110. [Google Scholar] [CrossRef]
- Czerski, G.; Grzywacz, P. Evaluation of gasification of coal density fractions. Przemysl Chemiczny 2018, 97, 1392–1397. [Google Scholar]
- Čepić, Z.; Mihajlović, V.; Đurić, S.; Milotić, M.; Stošić, M.; Stepanov, B.; Ilić Mićunović, M. Experimental Analysis of Temperature Influence on Waste Tire Pyrolysis. Energies 2021, 14, 5403. [Google Scholar] [CrossRef]
- Vyazovkin, S.; Wight, C.A. Isothermal and non-isothermal kinetics of thermally stimulated reactions of solids. Int. Rev. Phys. Chem. 1998, 17, 407–433. [Google Scholar] [CrossRef]
- Simon, P. Isoconversional methods—Fundamentals, meaning and application. J. Therm. Anal. Calorim. 2004, 76, 123–132. [Google Scholar] [CrossRef]
- Kongkaew, N.; Pruksakit, W.; Patumsawad, S. Thermogravimetric Kinetic Analysis of the Pyrolysis of Rice Straw. Energy Procedia 2015, 79, 663–670. [Google Scholar] [CrossRef] [Green Version]
- House, J.E. Principles of Chemical Kinetics, 2nd ed.; Academic Press: Cambridge, MA, USA, 2007; pp. 271–275. [Google Scholar]
- Lizzio, A.A.; Jiang, H.; Radovic, L.R. On the kinetics of carbon (char) gasification: Reconciling models with experiments. Carbon 1990, 28, 7–19. [Google Scholar] [CrossRef]
- Huttinger, K.J.; Fritz, O.W. The carbon-carbon dioxide reaction: An extended treatment of the active-site concept. Carbon 1991, 29, 1113–1118. [Google Scholar] [CrossRef]
- Guo, W.; Wang, Y.; Lin, X.; Wang, G.; Zheng, P.; Yang, Y.; Mochida, I. Structure and CO2 Gasification Reactivity of Char Derived through Pressured Hydropyrolysis from Low-Rank Coal. Energy Fuels 2019, 33, 8032–8039. [Google Scholar] [CrossRef]
- Zhong, M.; Gao, S.; Zhou, Q.; Yue, J.; Ma, F.; Xu, G. Characterization of char from high temperature fluidized bed coal pyrolysis in complex atmospheres. Particuology 2016, 25, 59–67. [Google Scholar] [CrossRef]
- Lee, S.-M.; Lee, S.-H.; Roh, J.-S. Analysis of Activation Process of Carbon Black Based on Structural Parameters Obtained by XRD Analysis. Crystals 2021, 11, 153. [Google Scholar] [CrossRef]
- Betancur, M.; Arenas, C.N.; Martínez, J.D.; Navarro, M.V.; Murillo, R. CO2 gasification of char derived from waste tire pyrolysis: Kinetic models comparison. Fuel 2020, 273, 117745. [Google Scholar] [CrossRef]
- Lee, J.S.; Kim, S.D. Gasification kinetics of waste tire-char with CO2 in a thermobalance reactor. Energy 1996, 21, 343–352. [Google Scholar] [CrossRef]
- Czerski, G.; Śpiewak, K.; Grzywacz, P.; Wierońska-Wiśniewska, F. Assessment of the catalytic effect of various biomass ashes on CO2 gasification of tire char. J. Energy Inst. 2021, 99, 170–177. [Google Scholar] [CrossRef]
Figure 1.
Curves of the degree of conversion of the chars.

Figure 2.
DTG curves of the tire char’s gasification process.

Figure 3.
KAS equation curves for heating rates of 3, 10 and 15 K/min and a conversion degrees range of 0.1–0.9 (a) approach I; (b) approach II.
Figure 3.
KAS equation curves for heating rates of 3, 10 and 15 K/min and a conversion degrees range of 0.1–0.9 (a) approach I; (b) approach II.

Figure 4.
FWO equation curves for heating rates of 3, 10 and 15 K/min and a conversion degrees range of 0.1–0.9 (a) approach I; (b) approach II.
Figure 4.
FWO equation curves for heating rates of 3, 10 and 15 K/min and a conversion degrees range of 0.1–0.9 (a) approach I; (b) approach II.

Figure 5.
Activation energy changes depending on the progress of the gasification reaction of waste from rubber tires for the analyzed approaches.
Figure 5.
Activation energy changes depending on the progress of the gasification reaction of waste from rubber tires for the analyzed approaches.


Table 1.
Characteristics of the tested tire waste.
| Group of Analysis | Parameter | Value, % |
|---|---|---|
| Ultimate analysis | C daf | 89.9 |
| H daf | 7.48 | |
| S dt | 1.78 | |
| Proximate analysis | W ad | 0.90 |
| A ad | 6.1 | |
| V daf | 75.28 | |
| FC ad | 23.0 | |
| Ash composition | SiO2 | 59.9 |
| Al2O3 | 0.68 | |
| Fe2O3 | 5.73 | |
| CaO | 3.54 | |
| MgO | 0.74 | |
| SO3 | 3.08 | |
| ZnO | 22.97 | |
| K2O | 1.27 | |
| P2O5 | 1.06 | |
| TiO2 | 0.11 | |
| Co3O4 | 0.44 | |
| CuO | 0.14 |
ad—air-dried state, daf—dry and ash-free state, d—dry state.
Table 2.
Kinetic parameter values based on the KAS method.
| Conversion Degree (-) | Approach | |||||
|---|---|---|---|---|---|---|
| I | II | |||||
| Ea (kJ/mol) | A (1/min) | R2 | Ea (kJ/mol) | A (1/min) | R2 | |
| 0.1 | 284.8 | 4.553 × 10¹¹ | 0.9460 | 277.2 | 1.369 × 10¹¹ | 0.9857 |
| 0.2 | 205.0 | 5.204 × 10⁷ | 0.9680 | 247.7 | 4.480 × 10⁹ | 0.9955 |
| 0.3 | 177.7 | 2.470 × 10⁶ | 0.9700 | 226.7 | 4.257 × 10⁸ | 0.9957 |
| 0.4 | 162.1 | 4.508 × 10⁵ | 0.9722 | 214.2 | 1.052 × 10⁸ | 0.9964 |
| 0.5 | 148.0 | 9.980 × 10⁴ | 0.9690 | 205.5 | 4.057 × 10⁷ | 0.9971 |
| 0.6 | 149.0 | 1.132 × 10⁵ | 0.9811 | 198.2 | 1.864 × 10⁷ | 0.9977 |
| 0.7 | 151.4 | 1.495 × 10⁵ | 0.9895 | 191.1 | 8.995 × 10⁶ | 0.9971 |
| 0.8 | 169.2 | 9.700 × 10⁵ | 0.9971 | 191.8 | 9.878 × 10⁶ | 0.9999 |
| 0.9 | 195.2 | 1.410 × 10⁷ | 0.9984 | 193.6 | 1.272 × 10⁷ | 0.9984 |
| Mean value | 182.5 | 5.059 × 10¹⁰ | 0.9768 | 216.2 | 1.578 × 10¹⁰ | 0.9960 |
Table 3.
Kinetic parameter values based on the FWO method.
| Conversion Degree (-) | Approach | |||||
|---|---|---|---|---|---|---|
| I | II | |||||
| Ea (kJ/mol) | A (1/min) | R2 | Ea (kJ/mol) | A (1/min) | R2 | |
| 0.1 | 288.4 | 3.530 × 10⁹ | 0.9523 | 281.3 | 1.138 × 10⁹ | 0.9875 |
| 0.2 | 218.7 | 1.487 × 10⁶ | 0.9823 | 253.8 | 4.918 × 10⁷ | 0.9962 |
| 0.3 | 191.4 | 7.902 × 10⁴ | 0.9833 | 234.2 | 5.783 × 10⁶ | 0.9964 |
| 0.4 | 173.3 | 1.218 × 10⁴ | 0.9810 | 222.7 | 1.651 × 10⁶ | 0.9971 |
| 0.5 | 160.8 | 3.476 × 10³ | 0.9801 | 214.8 | 7.101 × 10⁵ | 0.9977 |
| 0.6 | 161.5 | 3.824 × 10³ | 0.9882 | 208.1 | 3.593 × 10⁵ | 0.9982 |
| 0.7 | 164.1 | 5.026 × 10³ | 0.9941 | 201.6 | 1.909 × 10⁵ | 0.9977 |
| 0.8 | 181.2 | 2.687 × 10⁴ | 0.9982 | 202.6 | 2.130 × 10⁵ | 1.0000 |
| 0.9 | 206.1 | 3.030 × 10⁵ | 0.9986 | 204.5 | 2.763 × 10⁵ | 0.9987 |
| Mean value | 194.0 | 3.924 × 10⁸ | 0.9842 | 224.9 | 1.329 × 10⁸ | 0.9966 |
Table 4.
Evaluation of reaction order of tire char CO2 gasification with the use of the Coats and Redfern method.
Table 4.
Evaluation of reaction order of tire char CO2 gasification with the use of the Coats and Redfern method.
| Approach | Heating Rate (K/min) | R2 | |||||
|---|---|---|---|---|---|---|---|
| Reaction Order | |||||||
| 0 | 0.33 | 0.5 | 0.67 | 1 | 2 | ||
| A1 | 3 | 0.9739 | 0.9864 | 0.9867 | 0.9961 | 0.9986 | 0.9867 |
| 10 | 0.9821 | 0.9924 | 0.9768 | 0.9977 | 0.9979 | 0.9768 | |
| 15 | 0.9658 | 0.9789 | 0.9665 | 0.9675 | 0.9829 | 0.9675 | |
| A2 | 3 | 0.9796 | 0.9906 | 0.9946 | 0.9974 | 0.9995 | 0.9852 |
| 10 | 0.9822 | 0.9927 | 0.9962 | 0.9984 | 0.9992 | 0.9804 | |
| 15 | 0.9889 | 0.9950 | 0.9849 | 0.9982 | 0.9984 | 0.9849 | |
Table 5.
Kinetic parameter values based on first order Coats and Redfern method.
| Approach | Heating Rate (K/min) | A (1/min) | Ea (kJ/mol) |
|---|---|---|---|
| A1 | 3 | 6.04 × 10⁶ | 187.0 |
| 10 | 1.37 × 10⁵ | 148.5 | |
| 15 | 2.43 × 10³ | 106.7 | |
| A2 | 3 | 3.90 × 10⁷ | 205.1 |
| 10 | 1.64 × 10⁶ | 173.1 | |
| 15 | 9.04 × 10⁵ | 167.3 |
Publisher’s Note: MDPI stays neutral with regard to jurisdictional claims in published maps and institutional affiliations. |
© 2021 by the authors. Licensee MDPI, Basel, Switzerland. This article is an open access article distributed under the terms and conditions of the Creative Commons Attribution (CC BY) license (https://creativecommons.org/licenses/by/4.0/).
Share and Cite
MDPI and ACS Style
Grzywacz, P.; Czerski, G.; Gańczarczyk, W. Effect of Pyrolysis Atmosphere on the Gasification of Waste Tire Char. Energies 2022, 15, 34. https://0-doi-org.brum.beds.ac.uk/10.3390/en15010034
AMA Style
Grzywacz P, Czerski G, Gańczarczyk W. Effect of Pyrolysis Atmosphere on the Gasification of Waste Tire Char. Energies. 2022; 15(1):34. https://0-doi-org.brum.beds.ac.uk/10.3390/en15010034
Chicago/Turabian StyleGrzywacz, Przemysław, Grzegorz Czerski, and Wojciech Gańczarczyk. 2022. "Effect of Pyrolysis Atmosphere on the Gasification of Waste Tire Char" Energies 15, no. 1: 34. https://0-doi-org.brum.beds.ac.uk/10.3390/en15010034
Note that from the first issue of 2016, this journal uses article numbers instead of page numbers. See further details here.