
Improvement of Properties of an Insulated Wall for Refrigerated Trailer-Numerical and Experimental Study


Faculty of Mechanical Engineering and Robotics, University of Science and Technology AGH, 30-059 Krakow, Poland
*
Author to whom correspondence should be addressed.
Energies 2022, 15(1), 51; https://0-doi-org.brum.beds.ac.uk/10.3390/en15010051
Submission received: 14 October 2021
/
Revised: 15 December 2021
/
Accepted: 16 December 2021
/
Published: 22 December 2021
(This article belongs to the Topic Sustainable Energy Technology)
Abstract
:In the paper, we report our research on the improvement of thermal efficiency of refrigerated trailers by modification of their wall structure by placing a layer of phase change material inside them. The research was carried out in the field of transport, meeting the requirements of all classes provided for in the ATP agreement for refrigerated trailers. As part of the research, we formulated a numerical model of the proposed design of the refrigerator walls, which was subsequently validated by comparing the modeling results with the results of experimental tests carried out on a test bench designed specifically for this purpose. Based on the validated simulation conditions, we formulated the numerical model of a full-scale refrigerated semi-trailer, which was numerically tested under the conditions specified in the ATP Agreement. The results proved that adding a 6 mm layer of the SP-24 phase change material in each of the walls of the cold store allows the temperature inside the trailer to be kept below −20 °C for a period of 24 h without the need to supply cold from the outside during operation. The passive refrigerated semi-trailer system implemented in this manner with 6 mm PCM layer allows for a reduction in primary energy consumption by up to 86% in a period of 22 h. The mentioned percentage did not take into account the efficiency of the cooling system of the phase change material.
1. Introduction
Low-temperature cargo transports is an important link of the cold supply chain. The rapid development of mankind requires the transport of more and more products, especially food and medicines, which are subject to strictly defined temperature conditions. This, on a growing scale, is carried out with the use of refrigerated trailers, each of which have an individual refrigeration unit driven by low-efficiency diesel engines. It is estimated that worldwide transport of goods in low temperatures is responsible for some 14% of the total amount of CO2 emitted [1], and diesel-driven refrigeration systems are responsible for up to 40% of these emissions [2].
The scale of the issue of emissions connected to the cold chain is so substantial that it has attracted the attention of numerous groups of researchers, who have taken steps to reduce the environmental footprint of this industry [3,4,5,6,7,8]. The replacing of diesel units by the use of central, highly efficient refrigeration units in cooperation with cold thermal energy storage in semi-trailers is particularly promising and is currently enjoying great interest among technologies that seem promising in this respect [3,5,6]. This technology is in line with the general trend of searching for solutions reducing greenhouse gas emissions from industry and energy plants with the use of thermal energy storage [9].
The aforementioned cold thermal energy storage can be implemented in cold storage in two ways [10]: (a) they can be integrated with the walls to improve their insulation [4] or (b) in the form of the cooling source for the cooling system [3]. It is also possible to combine both solutions, where the cold storage is implemented as a layer in the cold store wall [5,6]. The solution proposed by the authors of the present research provides for the use of a combination of both solutions.
What is particularly interesting among the available cold thermal energy storage (CTES) technologies is the energy storage using latent heat in phase change materials (PCMs) [11]. Phase change materials are characterized by their ability to accumulate significant amounts of thermal energy in the process of phase change, i.e., during an isothermal thermodynamic process caused by a change in temperature or pressure. The phase transformation most often consists of a change of the aggregate state or a polymorphic transformation. Currently, many research teams around the world are working on the use of phase change materials to reduce primary energy consumption and reduce CO2 emissions to the atmosphere [12,13]. Owing to the use of latent heat, it is possible to obtain high energy storage density, both per unit of mass and volume [14]. This aspect is particularly significant when applied in refrigerated vehicles because one of the key aspects of transport is reducing the weight of the trailer—the increased weight would negatively affect the amount of fuel consumed and the overall energy efficiency of the solution, as well as reduce the load capacity of the vehicle [15]. What is also a crucial feature of phase change materials is also the fact that the phase transition takes place at a specific temperature, thanks to which such material enables the transfer or absorption of thermal energy under constant temperature conditions, thus allowing passive cooling [14].
When we consider the applicability of phase change materials to improve the efficiency of refrigerated transport, it should be stressed that for most materials, phase change can be considered at two different points, related to different phenomena: their phase transformation from solid to liquid and from liquid to gas. Despite a much larger change in enthalpy during the liquid–gas transformation, from the practical point of view of the use of PCM for storing cold in the walls of refrigerated trailers, the particularly interesting type of phase transformation, in the context of thermal energy storage, is the solid–liquid transformation, which is not connected with significant volume changes, and thus an increase in pressure, which is characteristic for the liquid–gas transformations [14].
The research carried out so far on the effectiveness of the use of phase change materials to improve the energy efficiency of refrigerated transport was characterized by different approaches to implement cold thermal energy storage and usage to ensure the climatic conditions required during transport.
One of the first research works carried out in this area was the work of the team of Liu et al. [3]. They developed a cooling system based on a central tank with a PCM bed, from which the cold was distributed by means of forced internal air circulation inside the trailer. This solution allowed for the elimination of the requirement to use a refrigeration unit installed on the semi-trailer, but it cannot be considered a fully passive system due to the forced air circulation. Research demonstrated that this method is justified, as it allows maintenance of the required temperature inside the trailer for the required time, and the weight of the PCM tank was comparable to that of a refrigeration unit. The application of the described solution reduced the energy expenditure to maintain the temperature by 50%.
Similar work was carried out by the team of Mousazade et al. [16], who placed the tanks filled with the phase change material in 6 tons refrigerated trailer without additional, forced, internal air circulation. The tests were carried out by them during the actual transport (vehicle movement). The cooling panels used by them allowed to maintain the required temperature inside the trailer for up to 4 h 46 min while the vehicle is in motion and up to 5 h 7 min for the stationary truck. Such approach can also be applied to containers intended for rail transport, as demonstrated by Tong et al. [17].
Another way to implement the phase change material in the construction of a refrigerated semi-trailer is to locate it in walls. The walls of typically designed refrigerated semi-trailers or refrigerated containers are made of a sandwich-structure panels, filled with polyurethane foam, which is characterized by a very low thermal conductivity of the range of 0.023 to 0.026 Wm−1K−1 [18], allowing, depending on the thickness of this partition, to achieve the value of the insulation parameter K, in the range of 0.22 to 0.27 Wm−2K−1.
The phase change material can be placed in the walls of refrigerated trailers in several different manners. The first is to place PCM in the wall by using a composite made of polyurethane foam and PCM itself. Research in this area was carried out by Michel et al. [4], who created two composites dedicated for the application of insulating the walls of refrigerated vehicles, differing in their content of the phase change material. The walls manufactured on the basis of these composites were tested for their thermal conductivity. The results obtained by the team proved the potential for doubling the thermal insulation of the walls that are currently used in refrigerated trailers.
A different approach to integrating PCM into the walls of refrigerated trailers was presented by Fioretti et al. [5], who located the phase change material in the wall in the form of a layer of encapsulated material. This solution was dedicated to refrigerated containers, however, in this case, the method of storing the cold thermal energy can be analogically used in refrigerated trailers. It was based on placing a layer of phase change material enclosed in a specially prepared structure on the outer side of the container. This was aimed at having the thermal energy penetrating inside the container through the material layer absorbed. To ensure that the internal temperature was maintained, the team used a phase change material with a phase transition temperature of 35 °C. The advantage of this solution is in its versatility—it can be used to maintain any temperature inside a trailer or container, albeit it has one major disadvantage, which is the lack of effectiveness during these days when the temperature does not exceed 35 °C and there is no direct insolation.
Huang and Piontek [6], who, similarly to Fioretti [5], applied layers of encapsulated phase change material, but placed it inside of the container, present a very similar approach. In order to maintain the temperature at an appropriate level, they used a phase change material with a phase transition temperature of 5 °C. The team was able to demonstrate that by placing a layer of frozen phase change material on the internal side of the wall of a trailer or a container, it is possible to maintain the required temperature for up to 80 h, which allows for the goods to be transported at low temperatures without the need to install refrigeration units on the trailer.
The research carried out for the purposes of this paper uses the concept of building a cold storage wall, similar to presented by Huang and Piontek [6], but its objective is to verify the effectiveness of using this form of improving the energy efficiency of refrigerated transport, in the case of temperatures below 0 °C. The ATP agreement [19], which defines the conditions to be met by vehicles with regulated internal temperature, depending on the method of implementing temperature and transport temperature regulation, was what motivated us to conduct the present research. According to the ATP agreement adopted in 1970, and ratified by most countries of the world, four types of temperature-controlled means of transport are distinguished:
- Thermally insulated means of transport, for which there are minimum requirements for the wall heat transfer coefficient of K = 0.7 Wm−2K−1 for measures with ordinary thermal insulation and K = 0.4 Wm−2K−1for measures with reinforced thermal insulation;
- Means of transport with a non-mechanical refrigeration system (ice room) that can be cooled by means of ice, eutectic plates, or dry ice. In this category, the agreement distinguishes four temperature classes, depending on the maximum permissible temperature inside the trailer: Class A—up to +7 °C, class B—up to −10 °C, class C—up to −20 °C, and class D—up to 0 °C. The agreement does not specify the minimum time for which the required temperature is to be maintained for this type of means of transport, but it can be assumed that it is meant to be maintained throughout the duration of the transport;
- Means of transport with a mechanical refrigeration device (cold store)—A thermally insulated means of transport, equipped with a refrigeration device that allows for lowering and maintaining the temperature inside such means of transport. The ATP agreement distinguishes three classes of this type of transport, depending on the temperature range that can be maintained in a given means of transport: Class A—temperature range of +12 °C to 0 °C, Class B—temperature range of +12 °C to −10 °C, Class C—temperature range of +12 °C to −20 °C, and three classes depending on the ability to keep the maximum temperature below a certain level: class D—up to 0 °C, class E—up to −10 °C, and class F—up to −20 °C;
- Heated means of transport—means of transport equipped with a heating device that allows the temperature inside such means of transport to be maintained at a minimum level of 12 °C for a minimum of 12 h. This transport was also divided into classes, depending on the outside temperature. There are 4 classes in total: class A—heating at an outside temperature of −10 °C, class B—heating at an outside temperature of −20 °C, class C—heating at an outside temperature of −30 °C, and class D—heating at an outside temperature of −40 °C.
The objective of the project is to build a refrigerator wall, using cold thermal energy storage in the form of a phase change material layer that is charged with cold thermal energy from a central cold production unit, dedicated to a vehicle that meets the requirements of all four classes for refrigerated means of transport with a non-mechanical system, as specified in the ATP agreement. This action will allow for the verification of the possibility of using cold storage based on phase change materials also in the transport of deep-frozen goods, which has not been subjected to scientific research so far.
The authors of the research, striving to create a solution adequate for use in the case of transporting materials in all classes defined in the ATP agreement for non-mechanically cooled means of transport, i.e., for transporting goods at a maximum temperature of −20 °C, propose to combine the traditional wall of a refrigerated semi-trailer made of polyurethane foam with a layer of phase change material with a phase transition temperature equal to −24 °C.
The paper contains five chapters and a list of the quoted bibliography. The first chapter presents a review of the subject literature, including typical solutions for cold store walls and the possibility of applying phase change materials, storing cold for the construction of a cold store wall. The second chapter contains the elaborated numerical models to simulate the properties of walls containing cold thermal energy storage phase change materials. The third chapter presents the results of laboratory tests carried out to validate the developed models, while the fourth chapter presents the concept of a refrigerated container with walls filled with phase change materials along with the prediction of its properties. The fifth chapter contains conclusions and final remarks on the feasibility of designing a cold store without a refrigerating unit.
2. Modeling and Simulation of Wall Properties
2.1. Refrigerated Trailer Wall Concept
The proposed structure is based on a fragment of a conventional refrigerated trailer wall, made in the form of a sandwich panel made of two steel sheets, with 86 mm thick filling, made of polyurethane foam, with a thermal conductivity coefficient of λ = 0.025 Wm−1K−1. The macro-encapsulated phase change material was added to the inside of the wall. A structure made of cellular polycarbonate was used to contain the phase change material. The developed structure of the tested walls is presented in Figure 1a. Figure 1b shows the theoretical heat transfer through the proposed wall in the state when the phase change material remains frozen.
The walls were made in two variants of the layer thickness of the phase change material. The first variant utilizes a 6 mm thick PCM layer, while the second one—a 10 mm. Both tested walls were sized 1000 mm × 1000 mm and had a thickness of 92 mm to 96 mm, depending on the variant of a wall design.
The use of cellular polycarbonate for encapsulation purposes a reduced volume of phase change material accumulated in the layers. In Variant I, 153 chambers with a capacity of 32 mL each were available, resulting in a total PCM volume of 4896 mL, weighing 6.36 kg. In Variant II, 93 chambers were filled with 93 mL each. The total volume and weight of PCM in this variant was 8649 mL and 11.24 kg.
2.2. Phase Change Material
The selection of the phase change material for the tests was a significant aspect of the wall structure. The main assumption in the material selection was its ability to maintain the required temperature inside the chamber and/or the trailer at the maximum level of −20 °C, so the phase change material had to have a phase change temperature below this point. From the practical point of view, this temperature must also not be too low, due to the need to cool it down to very low temperatures, which could occur more expensive and more energy-consuming.
After the analysis of the phase change materials available on the market, the SP-24 phase change material [20] was used for the construction of the walls. This material is an inorganic material, characterized by its latent heat of fusion equal to 220 kJ/kg. The enthalpy distribution in the phase change of this material demonstrates its greatest distribution at −24 °C at its solidification point and −23 °C and −22 °C at its melting point, respectively. The distribution of enthalpy is presented in Figure 2. The remaining material data are summarized in Table 1.
2.3. Cold Room Wall Model
In order to demonstrate the benefits of using the proposed wall structure in refrigerated semi-trailers, a computer model was developed on which a numerical simulation was carried out under conditions consistent with the conditions of the conducted experimental tests. Simulation covered both: proposed, novel wall and test stand. Numerical tests were carried out with the use of COMSOL 5.3 software [21]. Similar to the experimental tests, the modeling was executed in three variants—without the PCM layer, with a 6 mm layer, and a 10 mm layer. The results obtained in numerical tests were validated based on the results of the experiment.
The model mapped the geometry of the test stand, which consisted of a test chamber with dimensions of 1.8 m × 1.8 m × 1.6 m, containing five walls of mineral wool 40 cm thick each and one wall, the structure of which was consistent with the proposed innovative wall (polyurethane and PCM layer). There was an unventilated volume of air in the center of the test chamber. Table 2 presents the thermophysical properties of the materials used in the simulation.
The geometry was discretized using the built-in meshing tool. Tetrahedral mesh was used in all domains and the mesh in the PCM domain was additionally densified. In addition, in the air and PCM domains, the boundary layer was densified with 8 layers and a growth rate of 1.2. The thickness of the first layer was adjusted automatically. The Figure 3 below shows the mesh view, and the mesh statistic values, with a skewness quality measure with minimum skewness of 0.038.
The heat transfer in the fluids module was used in the simulation. The simulation was performed in two steps: the first, in stationary conditions, with the objective of bringing the system to the initial conditions, i.e., full PCM freezing and stabilization of the temperature gradient in the polyurethane foam. In this simulation step, we established the temperature conditions both inside (−27 °C) and outside (22 °C) the refrigerating chamber. The second step was a time-dependent simulation with time step 900 s in which a constant temperature was set at the outer walls of the chamber (22 °C) and the tested wall.
The following boundary conditions, presented in Table 3, were used in the stationary step:
The following boundary conditions, presented in Table 4, were used in the time-dependent step:
The boundary condition used in the time-dependent step related to the temperature of the PU layer side walls was set at 7 °C on the basis of the measured temperature on the aluminum part of the chamber, in order to take into account, the presence of thermal bridges.
2.4. Analysis of the Thermal Capacity of the Proposed Wall Structure
As part of the theoretical analysis, we can calculate the theoretical heat capacity of the wall of the refrigerated semi-trailer, which can then be compared with the results of experimental tests. In the case of a wall made in the proposed structure, its total heat capacity consists of the heat capacity of the PCM layer, taking into account the latent heat and specific heat in the entire temperature range in which the measurements were carried out, and the heat capacity of the polyurethane foam layer related to its specific heat [23]. In the case of the heat capacity of polyurethane foam, it was necessary to take the temperature gradient from −24 °C to ambient temperature in its volume into account. For calculation purposes, we adopted a linear temperature change, which is related to the homogeneous structure of the foam (the temperature gradient is presented in Figure 1b). The heat capacity values are given by the following formulas [24]. Results of theoretical calculations are presented in Table 5:
where:
- Δh—latent heat of fusion—Δh = 220 kJkg−1;
- mPCM—mass of PCM;
- cPCM—specific heat of PCM—cPCM = 2 kJkg−1K−1;
- ΔT—temperature difference between phase change temperature and temperature of material at the end of experiment (15 °C)—ΔT = 39 K;
- cPU—specific heat of polyurethane foam—cPU = 1.45 kJkg−1K−1;
- mPU—wall weight—mPU = approximately 10 kg.
The above results clearly show that the use of a PCM layer significantly increases the thermal capacity of the wall, which determines the length of time the trailer will be able to maintain the internal temperature at the required level. The performed theoretical calculations, after verification with numerical tests, allow to determine the optimal layer thickness of the phase change material that should be used in a full-scale solution.
3. Experimental Tests of Designed Wall Structure
3.1. Climatic Test Chamber
The tests of potential wall structures were carried out with the use of a specially designed climatic test chamber, which is presented in Figure 4. It consists of five adiabatic sandwich walls, each 40 cm thick, filled with mineral wool with a density of about 40 kg/m3 and thermal conductivity of λ = 0.035 Wm−1K−1. The thick layer of mineral wool is intended to ensure isothermal properties of the climatic test chamber’s interior. Inside the climatic test chamber, there is a space with a volume of about 1 m3, which can be cooled to −30 °C with the use of the integrated 0.8 kW refrigeration unit controlled by a thermostat. The climatic test chamber has no front wall, and the function of the front wall is performed by the tested wall. The climatic test chamber is placed on supports that distance it from the ground by 68 mm.
The climatic test chamber was equipped with sensors. The temperature was measured at eight measuring points and the heat flux at three measuring points throughout the experiment. Data were collected at five-second intervals. The measurements were performed by using the following measuring equipment:
- 8 K type thermocouples:
- ○
- T1—center of external wall;
- ○
- T2—center of internal wall;
- ○
- T3—center of internal sidewall;
- ○
- T4—center of external sidewall;
- ○
- T5—top-center of internal wall;
- ○
- T6—top-corner of internal wall;
- ○
- T7—air temperature outside climatic test chamber;
- ○
- T8—air temperature at the center of climatic test chamber;
- 3 heat flux sensors–Hukseflux HFP01-05;
- 3 data loggers–TandD MCR-4V.
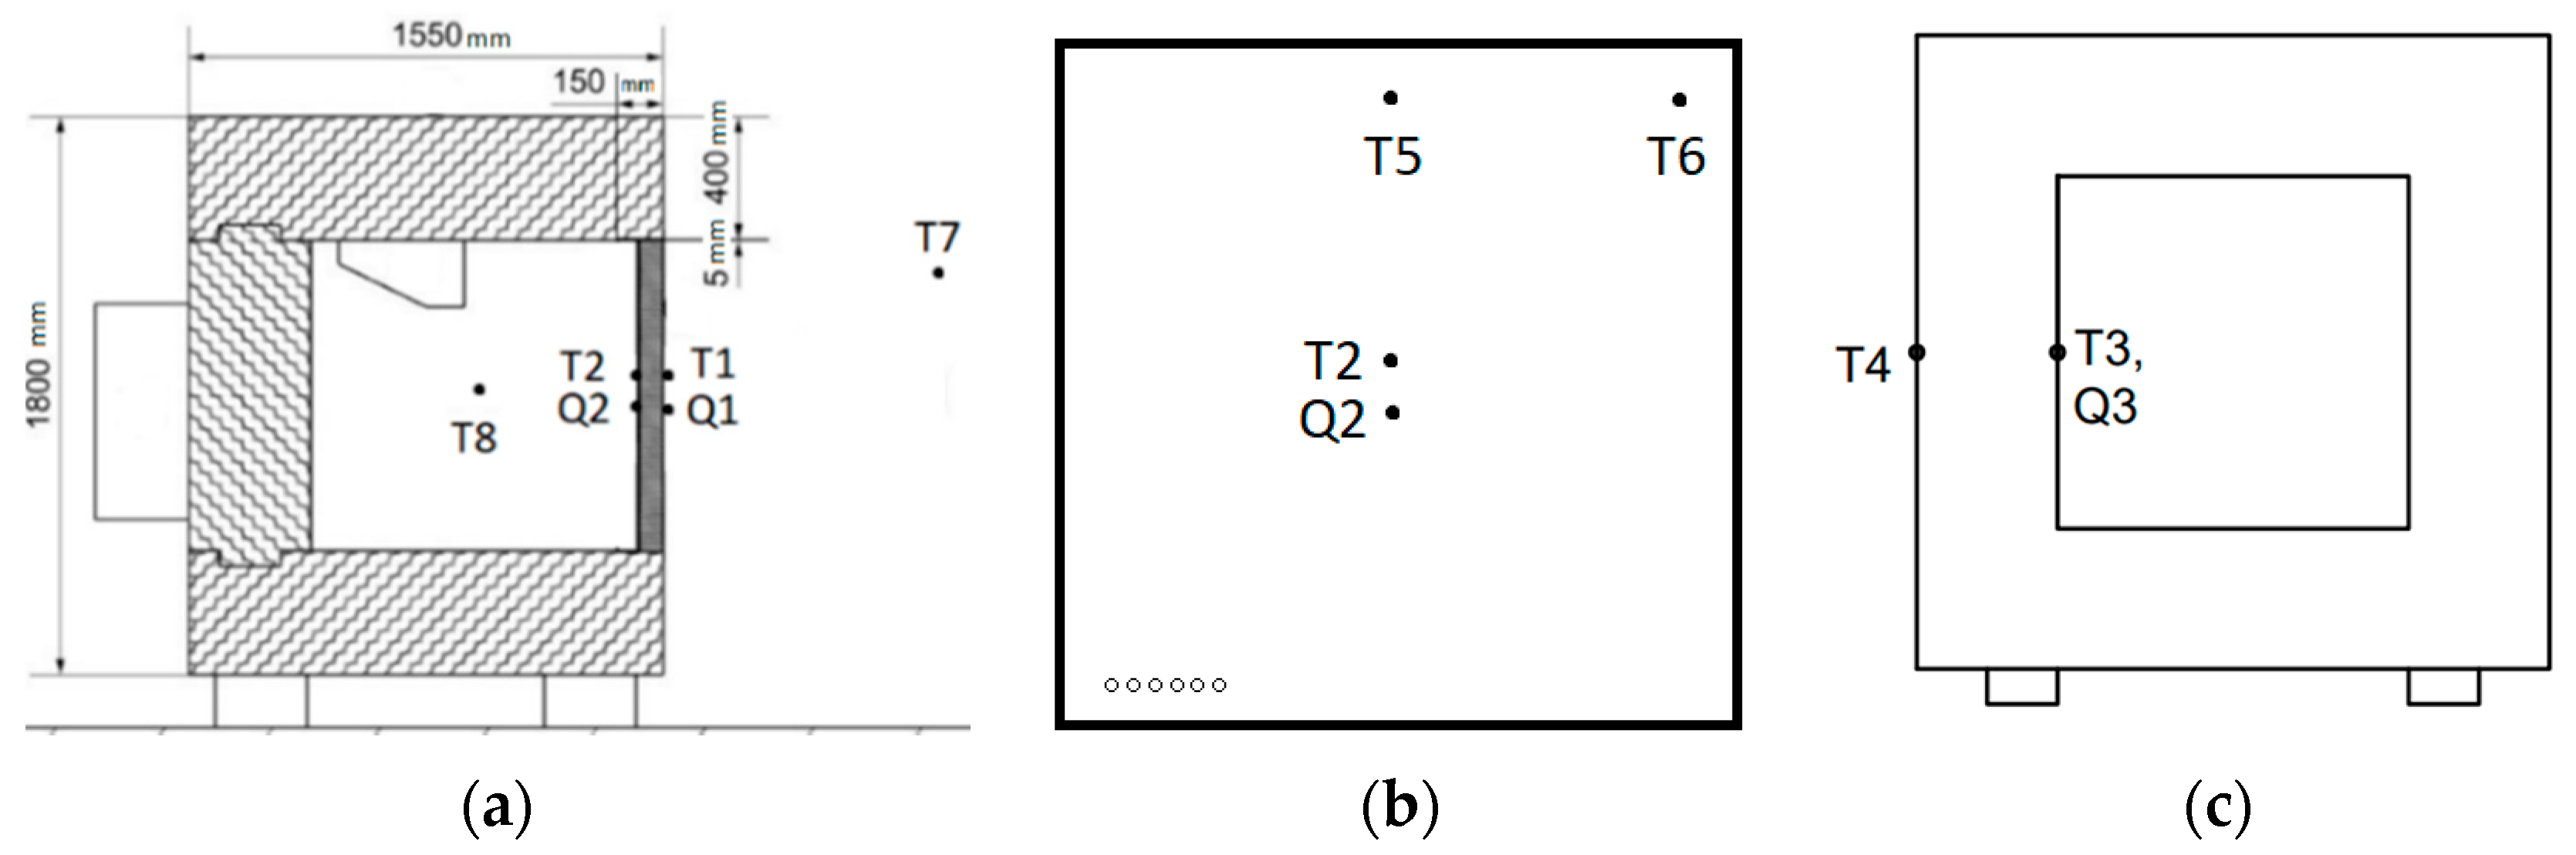
The T3, T4, and Q3 sensors were installed in the center of sidewall of the climatic test chamber (the adiabatic wall). T3 and Q3 sensors on its inside, and T4 sensor on its outside. The arrangement of the sensors in the entire test chamber was selected on the basis of the [25], discussing the measurements of wall insulation.
The locations of the sensors are presented in Figure 5.
3.2. The Experimental Procedure
The experiments for the purposes of this paper were carried out in three variants—for two variants of the cold store walls (with a layer of the phase change material with a thickness of 6 mm and 10 mm) and for the reference wall—without the phase change material. For each variant there have been two experiments held. At the beginning of each of the experiments, the tested wall was placed in the cavity of the climatic test chamber, and the spaces between the tested wall mounted in the cavity and the climatic test chamber walls were additionally sealed with polyurethane foam in order to limit the penetration of heat into the climatic test chamber in a way other than through the tested wall.
Each of the conducted experiments was carried out in an identical manner and was divided into two phases. The first, during which the interior of the test chamber was cooled to a temperature of −27 °C, and the temperature was kept at this level for a time sufficient for the layer of the phase change material to freeze. During the first phase of each test, the automatic control of the refrigeration union caused it to switch off after reaching the preset temperature. At that time, the space inside the climatic test chamber was heated—due to the heat transfer through the side walls absorption of energy from the PCM. After the temperature rises to approximately −24 °C, the unit started again. This mode of operation of the refrigerating unit resulted in fluctuations in the heat flux recorded by sensors placed inside the climatic test chamber, but it did not affect the main objective of this phase, i.e., bringing it to the initial state, which would take place in the case of the refrigerated transport, when the interior of the semi-trailer is cooled to the required temperature, and the phase change material layer is frozen in its entire volume.
After a sufficient period of time, 24 h for the 6 mm layer and 40 h for the 10 mm layer, the refrigerating unit was turned off and the second test phase began, i.e., free heating of the climatic test chamber’s interior. The tests were terminated after the inside of the climatic test chamber reached the temperature of 15 °C—measured on T8.
3.3. Experimental Test Results
From the point of view of the purpose of the present research, the second phase of each of the experiments was more important, because the modernization of the wall structure was to keep the temperature inside the chamber low, and this was the focus of the analysis of the research results. Figure 6a–c present the temperature change curves at all eight measurement points, successively for the reference walls, the wall with a 6 mm PCM layer and the wall with a 10 mm PCM layer. The t0 time for the presented curves is the moment of switching off the refrigeration unit inside the chamber.
The presented graphs indicate that all the tests were conducted under similar ambient temperature conditions—T7 in each case was in the range of 21 to 22 °C. The temperature measurements at the T1 and T4 measurement points located on the outer walls of the tested wall and climatic test chamber were similar.
The differences were observed in the plots for the remaining thermocouples. In the reference case, there is an immediate increase in temperature at each measurement point. In the case of a wall with a 6 mm and 10 mm PCM layer, there is a noticeable period in which the T2 and T5 indicated a constant temperature around −22 °C, which was the result of the phase change in the PCM layer. In the temperature plots, there is also noticeable the constant temperature area around 0 °C. This phenomenon may result from the properties of the phase change material SP-24, which is an aqueous salt solution, which also shows an increased heat capacity at 0 °C (phase transition temperature of water).
From the point of view of the applicability of the proposed wall structure in refrigerated transport, important is its ability to maintain the required temperature inside the chamber. The conducted experiments indicate that in each of the cases, the indications of the T8 thermocouple, located at the central point of the climatic test chamber, increased immediately after the refrigerating unit was turned off, which would indicate a result of their application that was inconsistent with the initial assumptions. It should be noted, however, that the wall with a PCM layer was used on only one of the six walls of the climatic test chamber, so that, despite the very good insulation properties of the remaining five walls, the heat penetrated through them into the climatic test chamber, heating up the air, which was characterized by low heat capacity, and consequently heating them to temperatures close to the temperature outside the climatic test chamber.
In the entire process of heat penetration inside the climatic test chamber, the influence of thermal bridges resulting from the proposed method of wall mounting in the climatic test chamber, as well as the chamber structure itself, were also significant. Despite the use of polyurethane foam for sealing and thermal insulation of the contact between the tested wall and the climatic test chamber, this connection cannot be considered isothermal. The impact of this aspect was also increased by the fact that this part of the climatic test chamber was made of aluminum, which is a good thermal conductor, enabling the heat to penetrate the chamber much faster, and contacting the PCM layer caused it to melt at the edges of the wall.
For the reasons described above, the effect of the layer of the phase change material was significantly reduced, but when looking at the temperature changes at the T8 point in the three cases, one can clearly see the extension of the time needed to reach the ambient temperature in each of them. The temperature curves at T8 and T2 measurement points, summarized for the three variants, are presented in Figure 7a,b.
It is also worth noting that in the case of walls with a PCM layer in the first phase of heating, the temperature increases inside the chamber occurred at the same rate, regardless of the thickness of the layer. The effect of the amount of thermal energy stored in the material was noticeable only after the inside of the chamber reached a temperature of about 0 °C, when the inside of the climatic test chamber remained cooler in the case of a 10 mm PCM layer wall. This phenomenon proves that at this temperature inside the chamber, the share of the heat flux associated with heat absorption by the phase change material began to be significant compared to the heat flux penetrating through the sidewalls of the chamber and through thermal bridges.
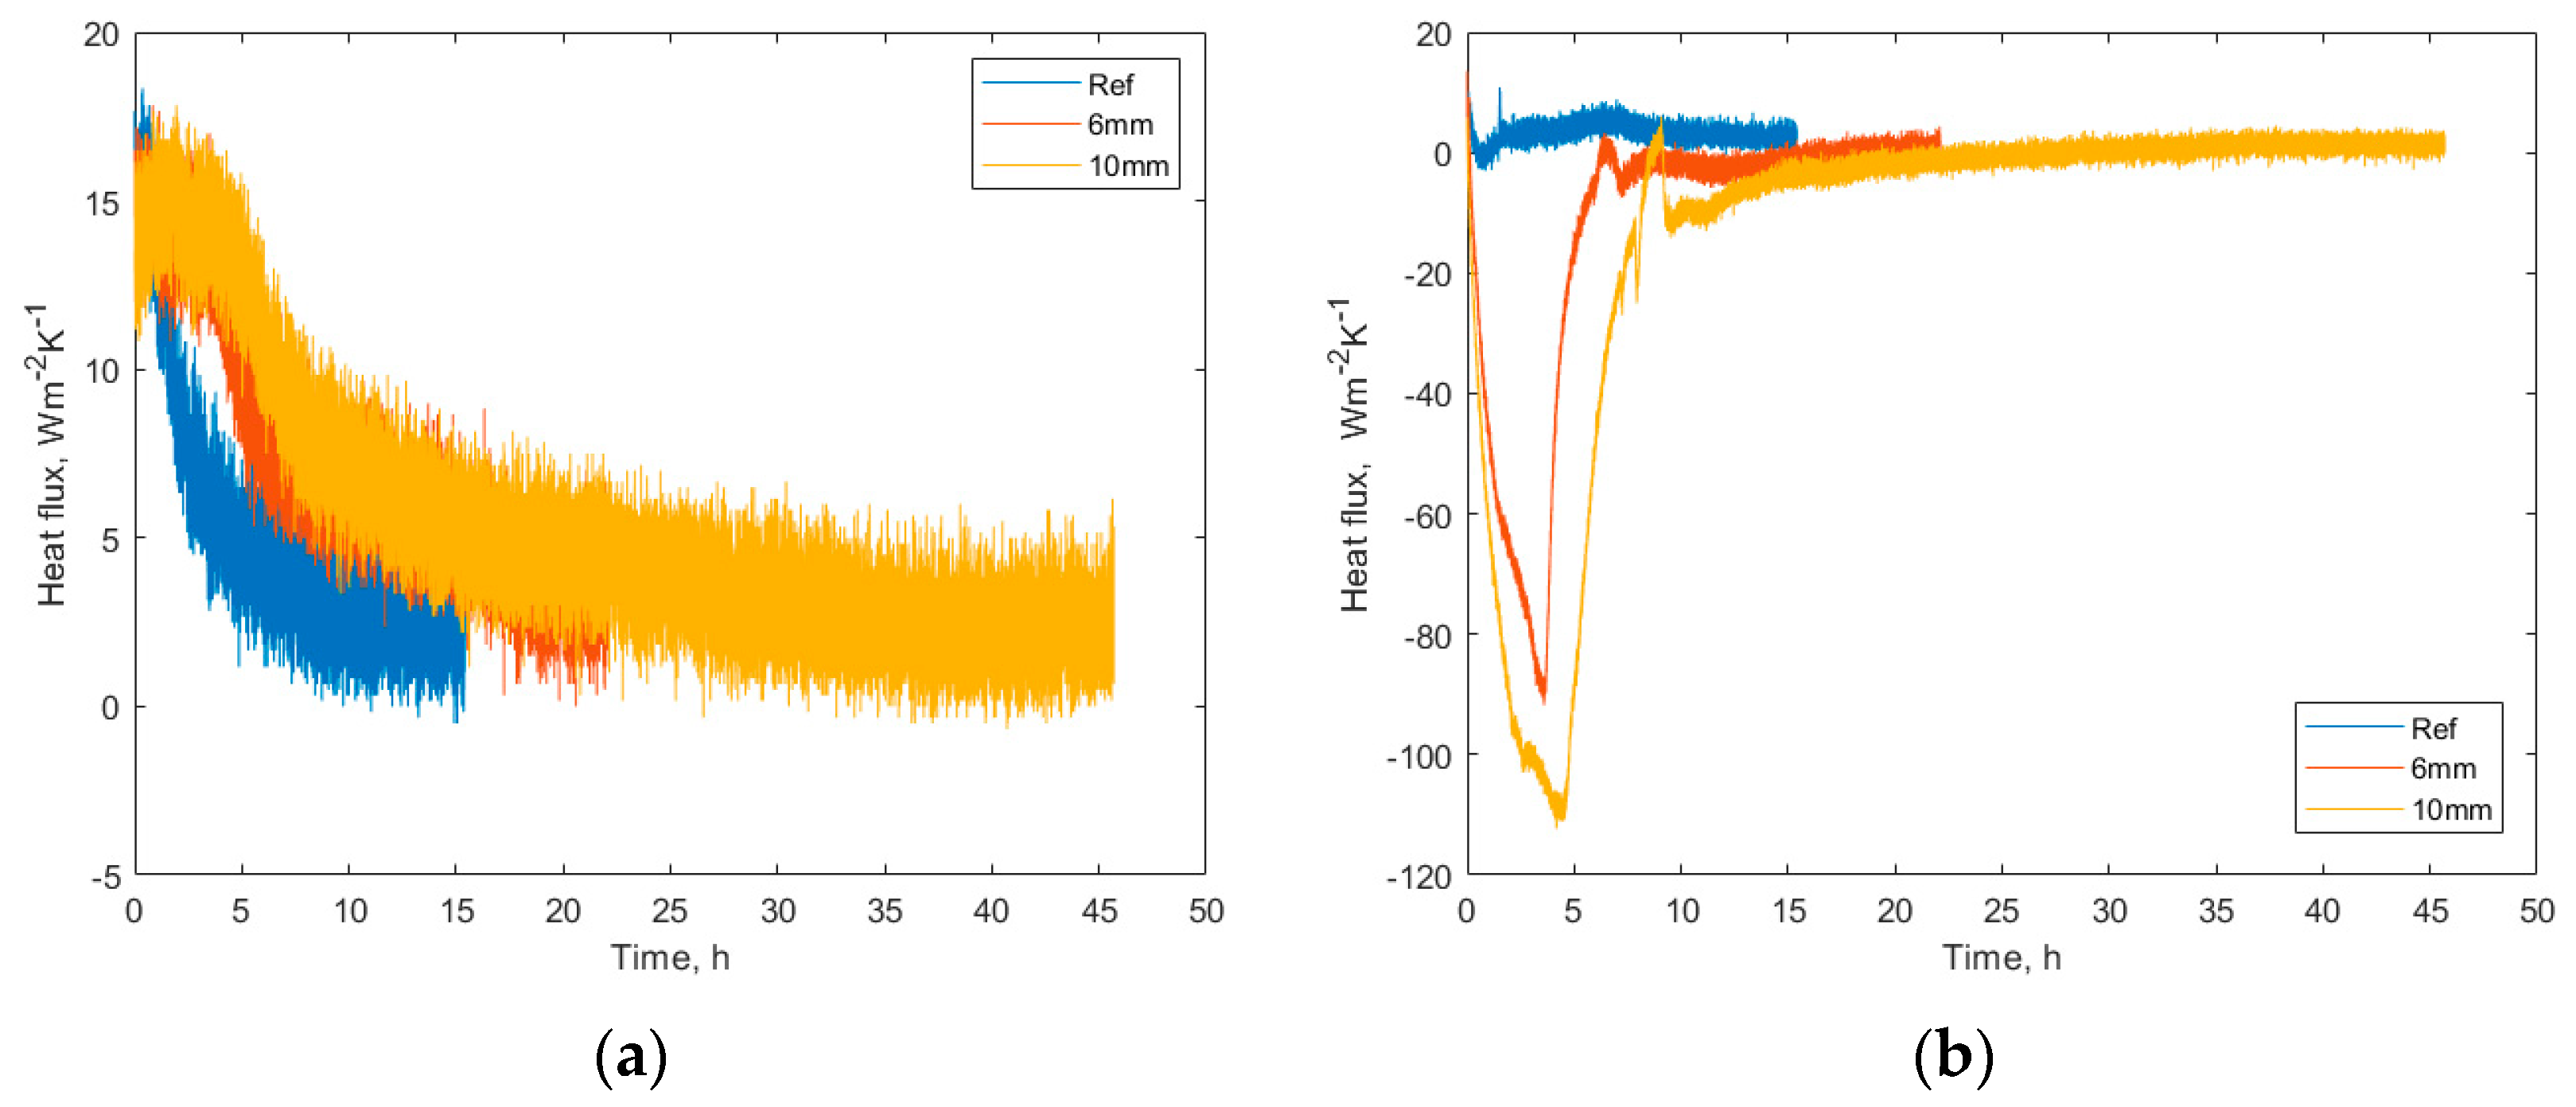
What is of particular interest in the case of heat flux measurements, at least when we consider the purpose of our research, are the readings of the Q2 sensor located on the inner surface of the tested walls. They show the direction and intensity of thermal energy emitted or absorbed by the layer of the phase change material. In an ideal case, i.e., when the temperature inside the chamber would remain below the phase transition temperature (there would be no heat penetration through other partitions), the Q2 sensor readings would oscillate around 0 Wm−2K−1, and the PCM would be heated only through heat penetrating from the outside, through the layer of polyurethane, the amount of which would be indicated by the Q1 sensor. The graphs of changes in the value of the heat flux at the Q1 and Q2 measurement points obtained during the experimental tests are presented as Figure 8a,b.
The plots of changes in the value of the heat flux at the measurement point Q1 (the outer surface of the tested wall) is as predicted, i.e., the measured values are in the constant range of 12 to 17 Wm−2K−1, with an average of about 14 Wm−2K−1 until the phase change material melts. At the moment of melting, the value of the heat flux gradually decreases as the temperature of the PCM layer increases to values close to 0 Wm−2K−1.
In the case of the heat flux values recorded at the Q2 measurement point, in the tests of the walls containing the phase change material layer, clearly negative values of this flow are visible, which means that the heat flux occurred in a direction opposite to that expected. This situation was caused by an increase in temperature inside the climatic test chamber. The point at which the graphs reach a minimum corresponds to the moment when the entire volume of the PCM has melted and it begins to heat up, which resulted in a decrease in ΔT between the PCM and the air inside the chamber and a decrease in the heat flux.
Heat flux data enable us to determine the amount of thermal energy that was consumed by the phase change material in each case and compare it with the theoretically calculated values. This allows us to verify the fact of the phase change occurring in the entire volume of the layer of the phase change material.
The obtained experimental results indicate that the application of a layer of phase change material in the wall of the refrigerated semi-trailer allows to maintain the temperature inside the semi-trailer at the required level, but the material must be placed on all walls, and it is particularly important to eliminate thermal bridges from the structure, the presence of which strongly affects for the time during which the phase transition takes place. In addition, the obtained results show that the differences in the heating time of the phase change material is proportional to its volume (layer thickness), therefore the selection of the layer thickness depends primarily on the temperature purpose of the semi-trailer and the required time for which the temperature inside the semi-trailer is to be maintained.
3.4. Validation of the Numerical Model
In this section, the results of experiments were compared with the results of numerical tests acquired by means of computer modeling in order to verify the correctness of these simulations. In particular, the data on the temperature inside the chamber at T2 and T8 measurement points and the heat flux at Q1 and Q2 measurement points were analyzed. The results of numerical modeling are presented in Figure 9a–d. The graphs of each of the measured parameters were compared with the plots of the corresponding values from the experiments.
In both cases—i.e., that of the 6 mm and of the 10 mm PCM layer—the temperature change and heat flux graphs from numerical modeling coincide with the experimental graphs. Achieving compliance required us to account for the influence of aluminum elements of the chamber, which in turn indicates that their presence had a significant impact on the course of experiments and distorted the heat capacity measurements of the PCM layer.
4. Numerical Model of a Full-Scale Semi-Trailer
In order to verify the applicability of the proposed wall structure to a semi-trailer, as an alternative for diesel-driven refrigerator units, we performed numerical tests for a trailer with typical sizes of 13.2 m × 2.42 m × 2.45 m (inside measurements). As part of the numerical simulation, a geometric model of the semi-trailer was created, made of polyurethane foam plates, with a 6 mm layer of phase change material on the inside, and an unventilated air volume inside the semi-trailer. The geometry was discretized using the built-in meshing tool. Parameters and visualization of the created mesh are shown in Figure 10.
The simulation used the parameters specified in the numerical model of the climatic test chamber, but due to the inclusion of the phase change material layer in all six walls of the trailer, we were able to eliminate the influence of thermal bridges related to the aluminum elements of the test chamber. As required by the ATP [19] we assumed the external temperature of +30 °C.
In the case of a real-sized refrigerated trailer, the solution proposed was based on the use of walls with a 6 mm thick PCM layer, due to the weight of the entire solution. The total area of the internal surface of the semi-trailer that must be lined with the phase change material is 140.426 m2. When using the 6 mm layer of Rubitherm SP-24 phase change material in the design proposed in the present publication, the weight of the phase change material would be approximately 900 kg, which is equivalent to the weight of diesel-driven refrigeration units. Would a 10 mm layer be used instead, the mass of PCM would be close to 1600 kg, which would increase the fuel consumption of the vehicle and lower its load capacity.
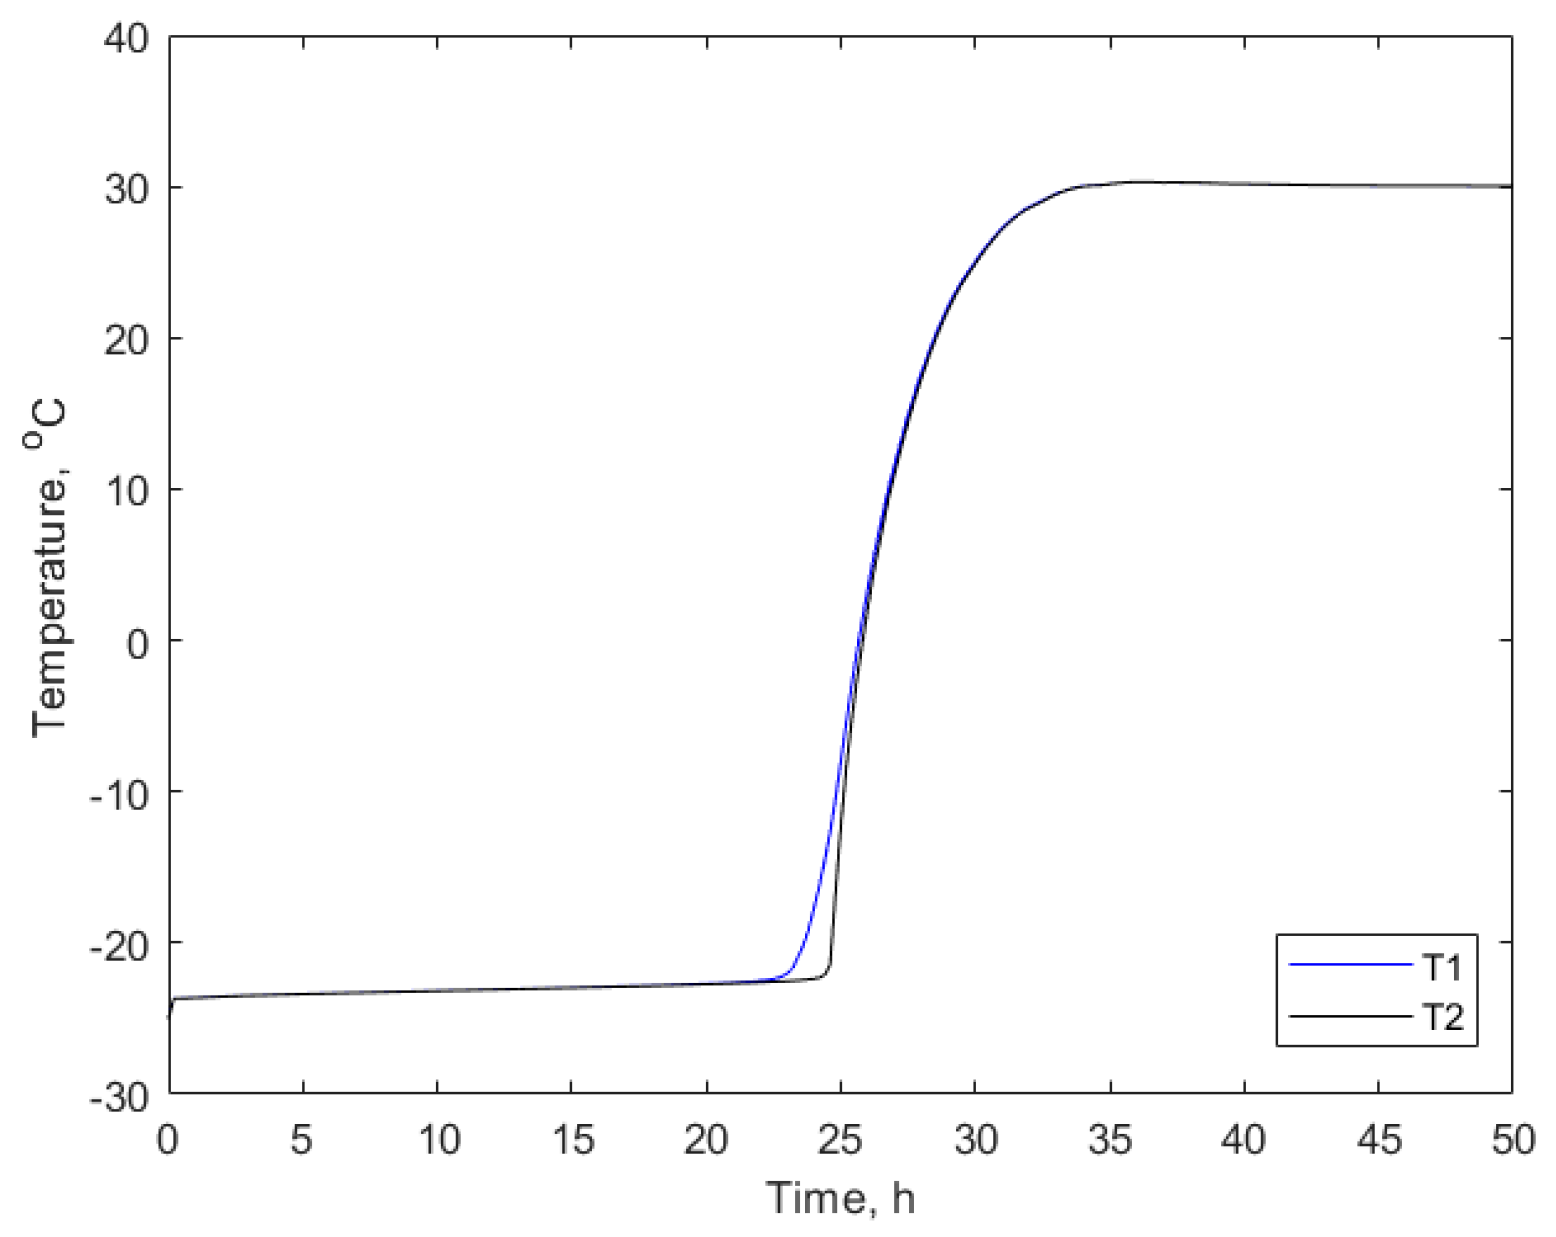
At the stage of numerical testing, we tested the time of maintaining the required temperature inside the trailer. The measurement was made at two measurement points—T1 located 1 m from the front wall of the trailer and T2 located in the center of the trailer. Figure 11 presents the semi-trailer model with marked measurement points.
Numerical simulations, similar to the tests of the research chamber with a wall, were performed in two steps: stationary, which allowed us to reach the initial state, and time-dependent, which indicated a plot of temperature changes inside the trailer. Figure 12a–d presents the temperature distribution in the longitudinal symmetry plan of the semi-trailer in successive time steps, while Figure 13 presents a plot of temperature changes at T1 and T2 measurement points.
The results of numerical tests indicate that the application of the proposed wall structure of a refrigerated semi-trailer with a 6 mm layer of the phase change material allowed for maintaining the internal temperature at the level of −20 °C, as required by the ATP agreement for over 20 h. At this point, it should be stressed that the simulation was carried out for stationary mode, which does not take trailer movement and solar radiation into account, both of which could reduce this time.
Potential Energy Savings
Using the method presented by Liu et al. [3] and the data on the operating parameters of diesel-powered refrigerating units [26], and energy-efficient electrically-powered refrigerators [27], it was possible to calculate the potential energy savings resulting from the use of the wall structure proposed by the authors.
Energy savings were calculated for one transport lasting about 24 h, i.e., one that ensures full use of the capacity of the proposed wall structure. Based on the Formulas (1)–(3), the total heat capacity of the refrigerated container walls (phase change material and polyurethane foam) was calculated, which came to 305.85 MJ. Then, we went on to calculate the amount of energy required to produce that amount of cold. The calculations assume the efficiency of cooling production from diesel fuel at the level of 0.2 [26], while the COP value for electrically powered chillers is typically 1.5, with the required output temperature at the level of about −30 °C [27]. The results of the calculations are presented in Table 6.
In Table 6, the results of calculations indicate that the energy savings in the case of using the proposed wall structure can amount to 86.66%. When analyzing these results, however, we should note that the calculations did not take into account the method of electricity production, which determines the result of primary energy savings and the reduction in CO2 emissions. In addition, the calculations did not take into account the efficiency of the cooling system of the phase change material, which is the subject of further research.
5. Conclusions and Directions for Future Research
As part of this study, research has been carried out to verify the feasibility of replacing refrigeration units powered by a diesel engine in deep-frozen transport over short distances by a passive cooling system based on a layer of phase change material with a phase change temperature of about −24 °C located on the inner side of the trailer wall. The obtained test results indicate that the application of such a solution with a 6 mm layer of PCM would allow the maintenance of the inside temperature of the trailer at the level of −20 °C for up to 24 h, at an external temperature of +30 °C, and the energy savings related with carrying out such transport can be as high as 86% if RES used. According to the ATP agreement, these types of vehicles, with passive cooling, do not have a specific minimum time for which the desired temperature inside the vehicle is to be maintained, so its maximum extension is most desirable, as it would allow for the use of a semi-trailer on increasingly longer routes. The use of a 6 mm layer of PCM, in addition to ensuring nearly 24 h of transport time under the required conditions, does not increase the weight of the semi-trailer, because its weight is comparable to the refrigeration units it is intended to replace.
There should be two areas considered for further research of the subject matter discussed therein. The first should focus on the analysis of additional phenomena occurring during transport and their impact on the ability to maintain the required temperature. These phenomena include: movement of the vehicle, affecting the intensity of heat transfer at the outer surface of the trailer walls, the impact of opening the trailer door during stops along the transport route, and the solar radiation, which at selected latitudes and on certain days can significantly raise the temperature of the outer surface of the semi-trailer walls.
The second direction of research should address the design of an effective system for cooling the phase change material during the loading of goods, which, in turn, could make the proposed solution commercially implementable. Such a system must ensure fast complete freezing of the phase change material with a lower energy input than with the use of diesel refrigeration units currently fitted on semi-trailers.
Author Contributions
Conceptualization, T.U.; methodology, T.U.; software, K.Z.; validation, K.Z.; formal analysis, K.Z.; resources, T.U.; data curation, K.Z.; writing—original draft preparation, K.Z.; writing—review and editing, T.U.; visualization, K.Z.; supervision, T.U.; project administration, T.U.; funding acquisition, T.U. All authors have read and agreed to the published version of the manuscript.
Funding
This research was funded by National Centre of Research and Development grant number POIR.01.02.00-00-0216/16-00 titled; Development of design and manufacturing technology for refrigerated box semi-trailer for transport of goods in refrigerated conditions.
Institutional Review Board Statement
Not applicable.
Informed Consent Statement
Not applicable.
Acknowledgments
Thanks to National Centre of Research and Development for financial support of presented research under grant no. POIR.01.02.00-00-0216/16-00 titled; Development of design and manufacturing technology for refrigerated box semi-trailer for transport of goods in refrigerated conditions. Thanks to Wielton SA, for supporting of building of experimental setup.
Conflicts of Interest
The authors declare no conflict of interest.
Nomenclature
| PCM | Phase change material |
| CTES | Cold thermal energy storage |
| CO2 | Carbon dioxide |
| K | Wall heat transfer coefficient (W·m−2K−1) |
| Cp | Specific heat (J·kg−1K−1) |
| Δh | Latent heat (J·kg−1) |
| T | Temperature (°C) |
| m | Mass (kg) |
| λ | Thermal conductivity (W·m−1K−1) |
| COP | Coefficient of performance |
| RES | Renewable energy source |
References
- Dekker, R.; Bloemhof, J.; Mallidis, I. Operations Research for green logistics—An overview of aspects, issues, contributions and challenges. Eur. J. Oper. Res. 2012, 219, 671–679. [Google Scholar] [CrossRef] [Green Version]
- Tassou, S.A.; De-Lille, G.; Ge, Y.T. Food transport refrigeration—Approaches to reduce energy consumption and environmental impacts of road transport. Appl. Therm. Eng. 2009, 29, 1467–1477. [Google Scholar] [CrossRef] [Green Version]
- Liu, M.; Saman, W.; Bruno, F. Development of a novel refrigeration system for refrigerated trucks. Appl. Energy 2012, 92, 336–342. [Google Scholar] [CrossRef]
- Michel, B.; Glouannec, P.; Fuentes, A.; Chauvelon, P. Experimental and numerical study of insulation walls containing a composite layer of PU-PCM and dedicated to refrigerated vehicle. Appl. Therm. Eng. 2017, 116, 382–391. [Google Scholar] [CrossRef] [Green Version]
- Fioretti, R.; Principi, P.; Copertaro, B. A refrigerated container envelope with a PCM (Phase Change Material). Energy Convers. Manag. 2016, 122, 131–141. [Google Scholar] [CrossRef]
- Huang, L.; Piontek, U. Improving Performance of Cold-Chain Insulated. Appl. Sci. 2017, 7, 1288. [Google Scholar] [CrossRef] [Green Version]
- Stellingwerf, H.M.; Kanellopoulos, A.; van der Vorst, J.G.; Bloemhof, J.M. Reducing CO2 emissions in temperature-controlled road. Transp. Res. Part D 2018, 58, 80–93. [Google Scholar] [CrossRef]
- James, S.J.; James, C.J.F.R.I. The food cold-chain and climate change. Food Res. Int. 2010, 43, 1944–1956. [Google Scholar] [CrossRef]
- Zou, R.; Huang, X. Mitigating Global Warming by Thermal Energy Storage. In Energy Soultions to Combat Global Warming; Springer International Publishing: Cham, Switzerland, 2017; pp. 573–594. [Google Scholar]
- Selvnes, H.; Allouche, Y.; Manescu, R.I.; Hafner, A. Review on cold thermal energy storage applied to refrigeration systems. Therm. Sci. Eng. Prog. 2021, 22, 100807. [Google Scholar] [CrossRef]
- Zarajabad, O.G.; Ahmadi, R. Numerical investigation of different PCM volume on cold thermal energy. J. Energy Storage 2018, 17, 515–524. [Google Scholar] [CrossRef]
- Oró, E.; Miró, L.; Farid, M.M.; Martin, V.; Cabeza, L.F. Energy management and CO2 mitigation using phase change materials (PCM) for thermal energy storage (TES) in cold storage and transport. Int. J. Refrig. 2014, 42, 26–35. [Google Scholar] [CrossRef]
- Du, K.; Calautit, J.; Wang, Z.; Wu, Y.; Liu, H. A review of the applications of phase change materials in cooling, heating and power generation in different temperature ranges. Appl. Energy 2018, 220, 242–273. [Google Scholar] [CrossRef]
- Pielichowska, K.; Pielichowski, K. Phase change materials for thermal energy storage. Prog. Mater. Sci. 2014, 65, 67–123. [Google Scholar] [CrossRef]
- Cecchel, S.; Chindamo, D.; Turrini, E.; Carnevale, C.; Cornacchia, G.; Gadola, M.; Panvini, A.; Volta, M.; Ferrario, D.; Golimbioschi, R. Impact of reduced mass of light commercial vehicles on fuel. Sci. Total. Environ. 2018, 613, 409–417. [Google Scholar] [CrossRef] [PubMed]
- Mousazade, A.; Rafee, R.; Valipour, M.S. Thermal performance of cold panels with phase change materials in a refrigerated truck. Int. J. Refrig. 2020, 120, 119–126. [Google Scholar] [CrossRef]
- Tong, S.; Nie, B.; Li, Z.; Li, C.; Zou, B.; Jiang, L.; Jin, Y.; Ding, Y. A phase change material (PCM) based passively cooled container for integrated road-rail cold chain transportation—An experimental study. Appl. Therm. Eng. 2021, 195, 117204. [Google Scholar] [CrossRef]
- Glicksman, L.R. Heat transfer in Foams. In Low Density Cellular Plastics: Physical Basis of Behaviour; Springer: Berlin/Heidelberg, Germany, 1994; Chapter 5. [Google Scholar]
- Agreement, A. Agreement on the International Carriage of Perishable Foodstuffs and on the Special Equipment to be Used for Such Carriage (ATP). 1970. Available online: https://unece.org/DAM/trans/main/wp11/ATP_publication/2020/ECE_TRANS_290_En_web_protected.pdf (accessed on 20 December 2021).
- Rubitherm, Sp-24 Data Sheet. Available online: www.rubitherm.eu (accessed on 2 May 2021).
- COMSOL Inc. COMSOL Multiphysics Reference Manual; COMSOL, Inc.: Burlington, VT, USA, 2017. [Google Scholar]
- Zestawienie Parametrów Fizycznych Materiałów/Wyrobów Budowlanych wg PN-EN ISO 12524:2003, PN-EN ISO 6946:1999 i PN-91/B-0202. Available online: http://kurtz.zut.edu.pl/fileadmin/BE/Tablice_materialowe.pdf (accessed on 11 June 2021).
- Stephan, P. Fundamentals of Heat Transfer. In VDI Heat Atlas; Springer: Berlin/Heidelberg, Germany, 2010; pp. 17–33. [Google Scholar]
- Mehling, H.; Cabeza, L.F. Heat and Cold Storage; Springer: Berlin/Heidelberg, Germany, 2008. [Google Scholar]
- Rasooli, A.; Itard, L. In-situ characterization of walls’ thermal resistance: An extension to the ISO 9869 standard method. Energy Build. 2018, 179, 374–383. [Google Scholar] [CrossRef]
- Chatzidakis, S.K.; Chatzidakis, K.S. Refrigerated transport and environment. Int. J. Energy Res. 2004, 28, 887–897. [Google Scholar] [CrossRef]
- Ellis, M. Regulatory Impact Statement: Minimum Energy Performance Standards and Alternative Strategies for Commercial Refrigeration Cabinets in Australia and New Zealand; Mark Ellis & Associates: Wagstaffe, Australia, 2004. [Google Scholar]
Figure 1.
(a) The tested wall with a layer of phase change material; (b) Heat flow through the proposed wall structure.
Figure 1.
(a) The tested wall with a layer of phase change material; (b) Heat flow through the proposed wall structure.

Figure 2.
Distribution of the partial enthalpy of the SP-24 phase change material applied. Adapted from [20].
Figure 2.
Distribution of the partial enthalpy of the SP-24 phase change material applied. Adapted from [20].

Figure 3.
(a) Mesh during numerical calculations; (b) Mesh statistics.

Figure 4.
The climatic test chamber used to conduct experimental research.

Figure 5.
Location of the sensors during the tests: (a) cross-section view; (b) view from the inside of the tested wall; (c) front view.
Figure 5.
Location of the sensors during the tests: (a) cross-section view; (b) view from the inside of the tested wall; (c) front view.

Figure 6.
The plot of temperature changes at all measurement points during the test of: (a) the reference wall without the layer of phase change material; (b) the wall with a 6 mm layer of phase change material; (c) the wall with a 10 mm layer of phase change material.
Figure 6.
The plot of temperature changes at all measurement points during the test of: (a) the reference wall without the layer of phase change material; (b) the wall with a 6 mm layer of phase change material; (c) the wall with a 10 mm layer of phase change material.

Figure 7.
(a) The plots of temperature changes at the measurement point T8 (air temperature at the center of climatic room) for the three tested variants of the wall of the refrigerated trailer; (b) The plots of temperature changes at the T2 (internal wall) measurement point for the three tested variants of the wall of the refrigerated trailer.

Figure 8.
(a) The plots of changes in the heat flux at the Q1 measurement point for the three tested variants of the wall of the refrigerated trailer; (b) The plots of changes in the heat flux at the Q2 measurement point for the three tested variants of the wall of the refrigerated trailer.
Figure 8.
(a) The plots of changes in the heat flux at the Q1 measurement point for the three tested variants of the wall of the refrigerated trailer; (b) The plots of changes in the heat flux at the Q2 measurement point for the three tested variants of the wall of the refrigerated trailer.

Figure 9.
(a) Comparison of the temperature changes at the T2 and T8 measurement points in the numerical modeling with the results of experiments for a wall with a 6 mm PCM layer; (b) Comparison of the heat flow flux changes at Q1 and Q2 measurement points in the numerical modeling with the results of experiments for a wall with a 6 mm PCM layer; (c) Comparison of the temperature changes at the T2 and T8 measurement points in the numerical modeling with the results of experiments for a wall with a 10 mm PCM layer; (d) Comparison of the heat flow flux changes at Q1 and Q2 measurement points in the numerical modeling with the results of experiments for a wall with a 10 mm PCM layer.

Figure 10.
(a) Mesh during numerical calculations; (b) Mesh statistics.

Figure 11.
The model of a full-scale refrigerated semi-trailer with marked measurement points for plotting the graphs of internal temperature.
Figure 11.
The model of a full-scale refrigerated semi-trailer with marked measurement points for plotting the graphs of internal temperature.

Figure 12.
Distribution of temperature inside the refrigerated trailer over time (a) 0 h, (b) 24 h, (c) 25 h, and (d) 26 h.
Figure 12.
Distribution of temperature inside the refrigerated trailer over time (a) 0 h, (b) 24 h, (c) 25 h, and (d) 26 h.

Figure 13.
Graph of numerical results of temperature changes inside the refrigerated trailer at T1 and T2.
Figure 13.
Graph of numerical results of temperature changes inside the refrigerated trailer at T1 and T2.


Table 1.
Physical properties of the applied Rubiterm SP-24 phase change material. Adapted from [20].
Table 1.
Physical properties of the applied Rubiterm SP-24 phase change material. Adapted from [20].
| Parameter | Value |
|---|---|
| Melting point [°C] | −23 to −24 |
| Latent heat of fusion [J/kg] | 220 |
| Specific heat J/(kgK) | 2 |
| Thermal conductivity [Wm−1K−1] | 0.6 |
| Density [kg/m3] | 1200 (solid)/1300 (liq) |
Table 2.
Thermophysical properties of materials used in the simulation.
| Material | Melting Point [°C] | Thermal Conductivity [Wm−1K−1] | Specific Heat [J/kgK] | Latent Heat of Fusion [J/kg] | Density [kg/m3] |
|---|---|---|---|---|---|
| Steel [22] | - | 50 | 475 | - | 2700 |
| Mineral wool [22] | - | 0.035 | 1300 | - | 40 |
| Polyurethane foam [22] | - | 0.025 | 1460 | - | 40 |
| Polycarbonate [22] | - | 0.20 | 1200 | - | 1200 |
| PCM–SP-24 [20] | −24 | 0.6 | 2000 | 2200 | 1200 (solid)/1300 (liq) |
Table 3.
Boundary conditions employed during calculation in stationary step.
| Domain/Material | Location | Boundary | Unit | Value |
|---|---|---|---|---|
| Climatic test chamber walls/mineral wool | External wall | Wall-temperature | °C | 22 |
| Internal wall | Interface | - | Coupled wall | |
| PCM layer/SP-24 | External wall | Thin layer | Wm−1K−1 | 0.035 |
| m | 0.0005 | |||
| Internal wall | Thin layer | Wm−1K−1 | 0.035 | |
| m | 0.0005 | |||
| Air/air | All walls | Interface | - | Coupled wall |
| PU layer/PU | Internal wall | Wall-temperature | °C | −27 |
| Side walls | Interface | - | Coupled wall | |
| External wall | Wall-temperature | °C | 22 |
Table 4.
Boundary conditions employed during calculation in time-dependent step.
| Domain/Material | Location | Boundary | Unit | Value |
|---|---|---|---|---|
| Climatic test chamber walls/mineral wool | External wall | Wall-temperature | °C | 22 |
| Internal wall | Wall-temperature | °C | −27 | |
| PCM layer/SP-24 | External wall | Thin layer | Wm−1K−1 | 0.035 |
| m | 0.0005 | |||
| Internal wall | Thin layer | Wm−1K−1 | 0.035 | |
| m | 0.0005 | |||
| Air/air | All walls | Interface | - | Coupled wall |
| PU layer/PU | Internal wall | Interface | - | Coupled wall |
| Side walls | Wall-temperature | °C | 7 | |
| External wall | Wall-temperature | °C | 22 |
Table 5.
Results of theoretical calculations of the amount of heat energy consumed.
| Thermal Capacity [kJ] | ||
|---|---|---|
| Reference Wall | 6 mm PCM Layer | 10 mm PCM Layer |
| 282.75 | 2178.03 | 3632.27 |
Table 6.
The results of calculations of potential energy savings resulting from application of the proposed wall structure with 6 mm PCM layer in a refrigerated trailer.
Table 6.
The results of calculations of potential energy savings resulting from application of the proposed wall structure with 6 mm PCM layer in a refrigerated trailer.
| Parameter | Refrigerator Unit Driven by a Diesel Engine | Electrically Driven Stationary Refrigeration Unit |
|---|---|---|
| The amount of cold produced [MJ] | 305.85 | 305.85 |
| Cold generation efficiency (COP) | 0.2 | 1.5 |
| The amount of energy consumed to produce cold [MJ] | 1529.10 | 203.88 |
| Energy consumption reduction level | 0% | 86.66% |
Publisher’s Note: MDPI stays neutral with regard to jurisdictional claims in published maps and institutional affiliations. |
© 2021 by the authors. Licensee MDPI, Basel, Switzerland. This article is an open access article distributed under the terms and conditions of the Creative Commons Attribution (CC BY) license (https://creativecommons.org/licenses/by/4.0/).
Share and Cite
MDPI and ACS Style
Zdun, K.; Uhl, T. Improvement of Properties of an Insulated Wall for Refrigerated Trailer-Numerical and Experimental Study. Energies 2022, 15, 51. https://0-doi-org.brum.beds.ac.uk/10.3390/en15010051
AMA Style
Zdun K, Uhl T. Improvement of Properties of an Insulated Wall for Refrigerated Trailer-Numerical and Experimental Study. Energies. 2022; 15(1):51. https://0-doi-org.brum.beds.ac.uk/10.3390/en15010051
Chicago/Turabian StyleZdun, Konrad, and Tadeusz Uhl. 2022. "Improvement of Properties of an Insulated Wall for Refrigerated Trailer-Numerical and Experimental Study" Energies 15, no. 1: 51. https://0-doi-org.brum.beds.ac.uk/10.3390/en15010051
Note that from the first issue of 2016, this journal uses article numbers instead of page numbers. See further details here.